
Abstract
The unpredictable nature of renewable energy sources, such as solar and wind, raises concerns about consistent power supply based on a single type. Green hydrogen presents a promising solution to mitigate the environmental effects of fossil fuels and control the unpredictability of renewable energy sources. Yet, developing green hydrogen systems mandates immense financial commitments, vitally stressing the importance of determining the most appropriate locations before constructing them. As such, the primary purpose of this paper was to propose an initial spatial analysis and prioritize the most suitable locations for installing solar-based green hydrogen systems in Tunisia. For this reason, an exhaustive literature survey was conducted to develop a GIS-based MCDM approach, taking into account technical, topography, environmental, and accessibility criteria. Then, EDAS, ARAS, MOORA, and COPRAS techniques were used to rank the most promising sites resulting from the previous stage. The study revealed that sites of high suitability, primarily in the southeastern and southwestern parts of Tunisia, spanned a total area of 1591 km2 (0.78%). Among such regions, Sfax, Monastir, and Sousse appeared to hold the top ranking as the most suitable locations for solar-based hydrogen. The “most suitable” sites had a hydrogen potential capacity of 9910 Mt per year, with Sfax, Monastir, and Sousse accounting for 14.5% of that capacity. By tapping into this immense potential and embracing the green hydrogen industry, Tunisia has the opportunity to lead in renewable energy adoption. This move could help ensure energy security, reduce dependence on imports, stimulate economic growth, and steer the nation toward a more sustainable and prosperous future.
Introduction
In the energy landscape, renewable energy sources are increasingly becoming instrumental as an alternative solution to traditional fossil fuels that exacerbate environmental degradation (Gul et al., 2023; Kim and Park, 2023; Saqib et al., 2023). Nonetheless, these renewable sources, such as solar and wind, exhibit variability due to their sporadic nature, which poses a challenge in guaranteeing a reliable source of energy with only one type (Borgschulte, 2016; Mishra et al., 2023). Therefore, an effective solution lies in integrating multiple technologies that complement each other’s limitations (Kumar, 2020; Thi Mai et al., 2024). In this regard, green hydrogen, produced from renewable energy sources like solar and wind, has emerged as a potentially viable option for mitigating the detrimental environmental effects associated with conventional fuels and tackling the variability of renewables like solar and wind (Almutairi et al., 2021; Henry et al., 2023; Nadaleti et al., 2021; Rampai et al., 2024; Sarmah et al., 2023). As a versatile energy carrier, green hydrogen can be used for various purposes, including generating electricity, providing heat, and serving as fuel for vehicles, aircraft, and ships (Ali et al., 2022; Khasawneh et al., 2019; Le et al., 2023; Rampai et al., 2024). It also has applications in different industrial sectors, such as steel production and refineries (Ali et al., 2022). This wide spectrum of green hydrogen possibilities has triggered nations around the globe not only to consider establishing their dedicated industries but also to visualize this alternative form of energy as lucrative export merchandise (Li et al., 2020; Menezes et al., 2020; Qian et al., 2023).
Tunisia, a state with very limited hydrocarbon sources and heavily reliant on energy imports, finds itself in a very critical position. With consistently increasing demand, dwindling local reserves, and a persistent deficit, the country has been grappling with serious challenges in its power system.
In Tunisia, natural gas makes up 97% of the energy mix, with the remaining 3% coming from renewable sources like solar, wind, and hydro (STEG, 2022). Due to its heavy reliance on fuel imports, particularly natural gas, significant subsidies, and STEG’s monopoly, Tunisia’s power sector faces challenges (Dhakouani et al., 2017; Sghari and Hammami, 2016). However, despite these difficulties, Tunisia has substantial potential for renewable energy sources thanks to favorable meteorological and geological conditions. The estimated technical potential for solar PV, CSP, offshore, and onshore winds is reported at 400, 65, 250, and 10 GW, respectively (Ersoy and Terrapon-Pfaf, 2021; IRENA, 2021). Recognizing this substantial potential in the country, the government has established ambitious targets to install 4.7 GW by 2030 (Gardumi et al., 2021). By making use of these abundant resources, Tunisia aims to improve its energy security, diversify its energy mix, reduce its reliance on costly imports, and rationalize energy subsidies.
In this regard, embracing solar-powered green hydrogen generation is incredibly significant for Tunisia’s long-term sustainability. It not only provides a chance to utilize the country’s renewable resources but also presents a way to move towards an environmentally cleaner and more robust energy infrastructure. Nevertheless, a thorough evaluation of the most suitable locations for such projects is essential before their construction to successfully execute this strategic plan (Al-Garni and Awasthi, 2017; Sindhu et al., 2017).
In the development of the green hydrogen industry, the accurate evaluation of the most promising sites is of utmost importance for several reasons. Firstly, determining areas with high solar resources ensures maximum power, resulting in higher hydrogen production (Asare-Addo, 2023). Secondly, accessibility to adequate transport and grid infrastructure significantly reduces construction costs and facilitates the integration of the plant into the energy grid (Ali et al., 2022; Messaoudi et al., 2019a). Furthermore, the availability of water resources for electrolysis is essential for sustainable operation (Ali et al., 2022; Taoufik and Fekri, 2023). As such, to conduct a spatial analysis to install green hydrogen systems at a given site, it is imperative to have a comprehensive understanding of those factors beforehand (Ali et al., 2022; Asare-Addo, 2023; Messaoudi et al., 2019a; Taoufik and Fekri, 2023).
The present paper integrates the GIS with AHP to determine the most suitable sites for deploying solar-powered green hydrogen plants in Tunisia. By leveraging solar power for hydrogen production, Tunisia can reduce its carbon footprint while simultaneously creating new opportunities for economic growth and job creation.
Literature review
Assessing renewable energy sources’ potential requires an intricate understanding of a myriad of factors. Geographical, infrastructural, and financial considerations can significantly influence power generation (Saraswat et al., 2021; Sindhu et al., 2017). Weather patterns also introduce substantial variance due to regional differences and seasonal fluctuations. As such, comprehensive data collection followed by rigorous analysis is critical to precisely determining a location's suitability for renewable energy projects. However, navigating all these complications is far from straightforward (Al-Garni and Awasthi, 2017; Elkadeem et al., 2021; Sindhu et al., 2017). These multifaceted criteria often intersect among themselves in complex ways during decision-making processes, which makes such assessments challenging (Al-Garni and Awasthi, 2017; Elkadeem et al., 2021). The integration of geographical information systems with multi-criteria decision-making, on the other hand, has manifested itself as an effective resolution to counter these complexities (Al-Garni and Awasthi, 2017, Badi et al., 2021; Ilbahar et al., 2019; Shao et al., 2020). A wide array of MCDM techniques, like AHP, fuzzy AHP, COPRAS, EDAS, DEMATEL, ELECTRE, Shannon Entropy, TOPSIS, etc., have been successfully applied in a variety of fields, including renewable energy site selection. For instance, in very recent papers, Benti et al. (2023), Demir et al. (2024) and Yaman (2024) applied a GIS-AHP approach to determine the optimal locations for onshore wind and solar PV systems in southern Ethiopia and in the Turkish provinces of Kaysari and Adana, respectively. Sakti et al. (2023) employed the same approach, developing a spatial analysis to optimize solar, wind, and hydropower sources in Southeast Asia. In Turkey, Karipoğlu et al. (2024) developed a GIS-FAHP model to investigate the possibility of installing floating solar PV power plants across the whole country. Likewise, Placide and Lollchund (2024) performed a land suitability analysis for onshore wind systems in Burundi using GIS-based fuzzy AHP. In the same vein, Şahin et al. (2024) identified the most suitable sites for solar-wind power projects in the Netherlands based on the GIS-Fuzzy logic methodology.
Concerning promising hydrogen sites, Rezaei et al. (2021) conducted a comprehensive analysis to determine the precise location for a hydrogen refueling station powered by wind energy using Fuzzy VIKOR approach in Iran. In Northern Turkey, Seker and Aydin (2020) applied the Entropy along with Interval Valued Pythagorean Fuzzy TOPSIS to identify the optimal location for constructing a hydrogen-sulphide (H2S) decomposition. The SWARA method was used by Almutairi et al. (2021) to select the optimal wind turbine fitting in the best location to generate green hydrogen in Afghanistan. In Algeria, Rahmouni et al. (2016) used GIS to estimate the green hydrogen generation potential from solar and wind, while Messaoudi et al. (2019a) developed a GIS-based AHP model to conduct a spatial analysis to prioritize sites for hosting solar-powered hydrogen plants.
Ali et al. (2022) utilized a similar approach in their spatial analysis to identify optimal locations for solar-powered hydrogen plants in southern Thailand. In another recent study, Taoufik and Fekri (2023) developed a GIS-AHP model to carefully select sites for solar hydrogen facilities in the Souss-Massa region, Morocco. Likewise, Yum and Adhikari (2023), in their research conducted in southern Korea, incorporated big data into the same model to thoroughly assess and choose the most promising sites for a smart hydrogen energy plant.
In contrast to fuzzy models which are considered better suited for tackling ambiguities in decision-making problems (Shojaeimehr and Rahmani, 2022), we chose to use the AHP for several reasons. Primarily, its widespread usage and flexibility for integration with other MCDM models set it apart as a leading technique (Ilbahar et al., 2019; Manirambona et al., 2022; Shao et al., 2020). Furthermore, AHP can handle both quantitative and qualitative data effectively, making it versatile in addressing various factors during evaluations. Additionally, sensitivity analyses on criteria can be conducted using AHP, ensuring a comprehensive assessment of alternatives (Al-Garni and Awasthi, 2017; Sindhu et al., 2017). Another advantage of using AHP is that it allows for sensitivity analyses on criteria while considering alternative consistencies, providing a comprehensive evaluation of different factors and enhancing the decision-making process (Moradi et al., 2020; Shaaban et al., 2018). Additionally, Mosadeghi et al. (2015) stated that the results obtained using AHP for determining optimal locations are not significantly different from those obtained using more complex techniques, like FAHP and FDEMATEL.
There has been extensive research conducted in Tunisia on the options for utilizing renewable energy sources, as evidenced by (Abdelrazik et al., 2022; Attig-Bahar et al., 2021; Balghouthi et al., 2016; Benitez et al., 2023; Maatallah et al., 2013; Rekik and El Alimi, 2023a, 2023b, 2023c, 2024a, 2024b; Trabelsi et al., 2017). Nevertheless, there is a notable absence of research delving into the development of solar-based green hydrogen systems in the country. This study aims to address this deficiency by employing a GIS-based AHP model as a tool that facilitates rigorous scrutiny of land suitability and delivers clear evidence regarding optimal locations for hosting such facilities, which would enrich sustainable energy planning methods within the country. This highlights the importance of exploring and investing in the development of solar-powered green hydrogen as a clean and sustainable energy source. It is believed that a comprehensive approach like this provides a valuable framework for decision-makers to navigate the complex landscape of sustainable energy planning and promote the effective development of solar-based green hydrogen projects, which is regarded as a feasible solution for catering to the increasing electricity demand, spurring economic growth, and mitigating carbon footprint.
Methodology and data
Academic sources have increasingly found MCDM models to be instrumental in investigating various alternative solutions (Ilbahar et al., 2019; Shao et al., 2020). The aim is to determine the optimal solution that best satisfies an array of often conflicting criteria while efficiently managing vast sets of data. In recent years, MCDM tools have been extensively deployed for evaluating the potential exploitation of resources and determining suitable locations for renewable energy systems (Sindhu et al., 2017). Owing to the intricacies involved in multifaceted energy infrastructures, merging Geographic Information Systems with MCDM mechanisms originates as a significant tool (Badi et al., 2021). This integration permits experts to assess and visualize various aspects like environmental impact, cost-effectiveness, accessibility constraints, technological feasibility, etc., paving the way for comprehensive evaluations of potential sites and thereby assisting in choosing the most advantageous locations for renewable energy projects (Al-Garni and Awasthi, 2017; Badi et al., 2021; Messaoudi et al., 2024; Sindhu et al., 2017).
In order to fulfill the objective, a GIS-based AHP approach was utilized. To support this, a comprehensive review of pertinent academic literature and collaboration with an expert panel resulted in the identification of seven key decision-making parameters. Further, these factors were categorized into four distinct categories: technical, topographical, accessibility, and environmental. The parameters considered include the potential for solar hydrogen production, slope, water reserve availability, land use types, proximity to residential areas, transportation, and grid infrastructure. To rank the resultant most viable sites, ARAS, COPRAS EDAS, and MOORA techniques were employed. Figure 1 illustrates a visual representation of the methodological process adopted for recognizing and prioritizing optimal sites for the installation of solar-powered green hydrogen facilities.
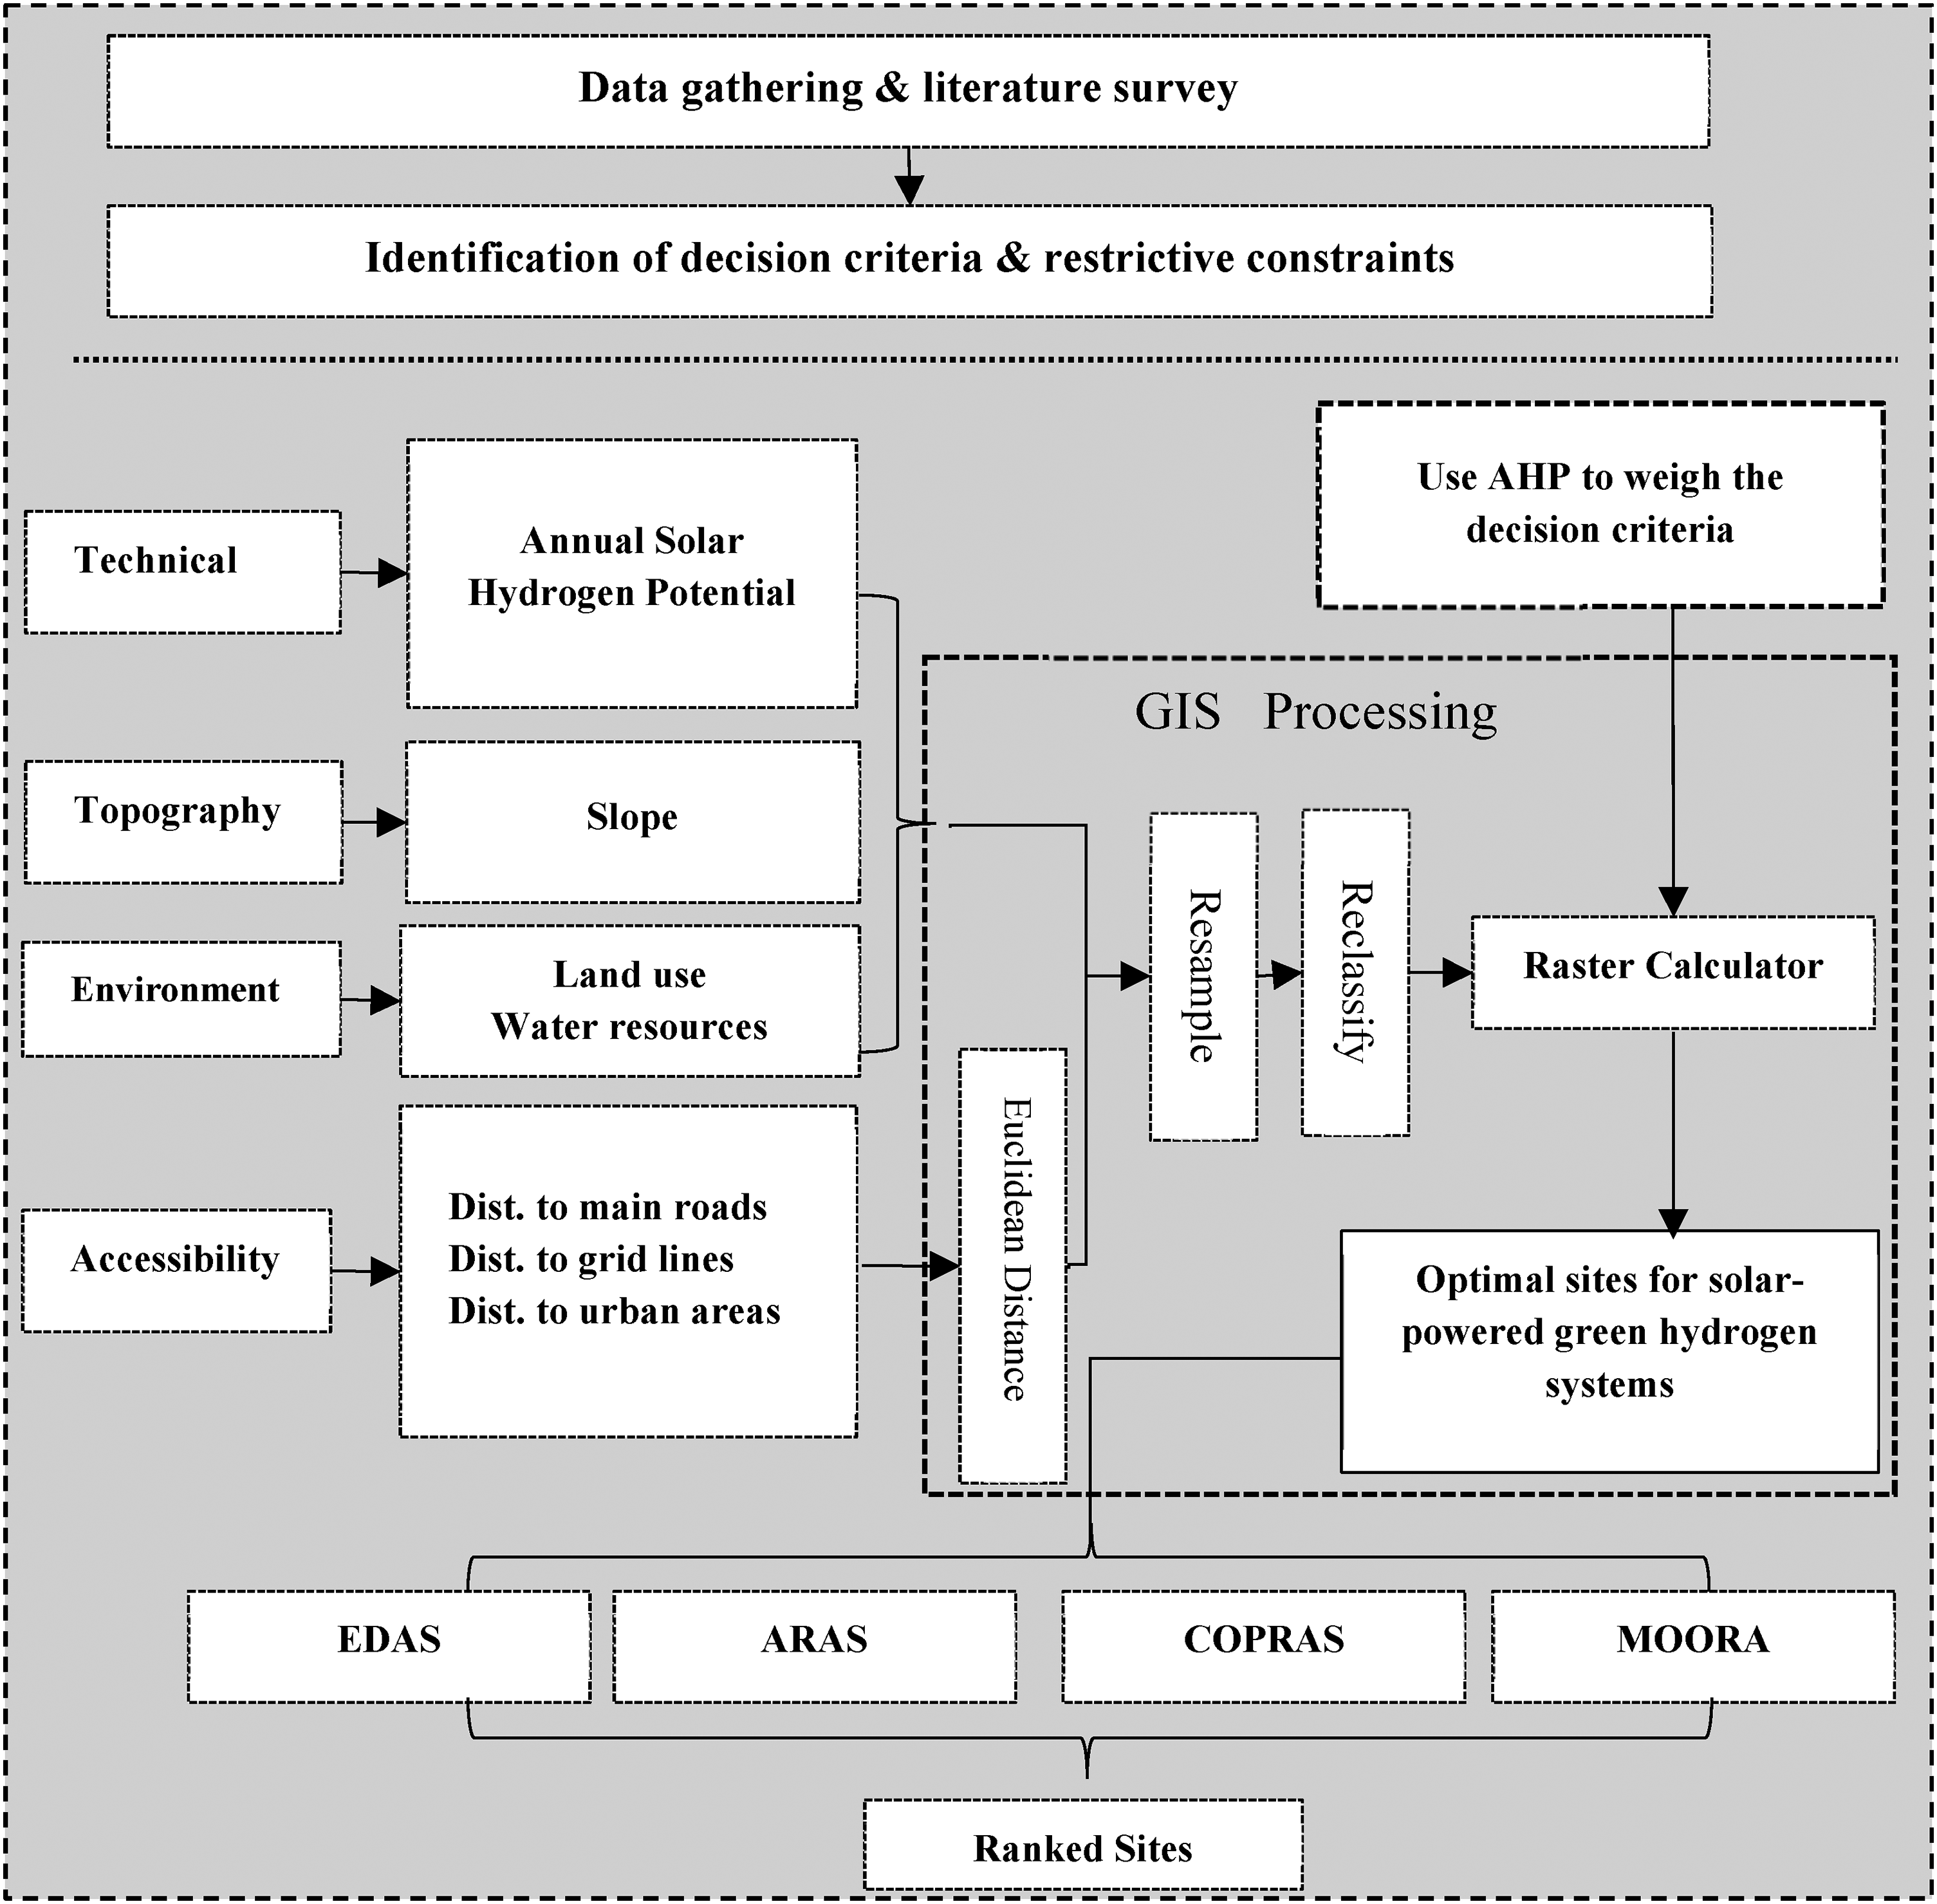
Main steps in determining optimal locations for solar-powered green hydrogen systems.
Study area
Tunisia is located in North Africa and is classified as a low-middle-income country. It spans over 163,610 square kilometers and has a population of around 12 million people, according to the INS. The geographic coordinates span from 32° to 38° north latitude and 7° to 12° east longitude. The nation shares territorial boundaries with Algeria on the western side, Libya on the southeastern side, and the Mediterranean Sea on the eastern and northern sides (refer to Figure 2). Its climate is typical Mediterranean, with scorching and arid summers, moderate and wet winters in the north, and semi-arid and desert conditions in the center and south. Tunisia exhibits stark regional disparities, with the majority of its population (70%) residing in the northern and coastal parts of the country. Tourism, agriculture, and phosphate are the major pillars of the economy in Tunisia (AFDB, 2019).
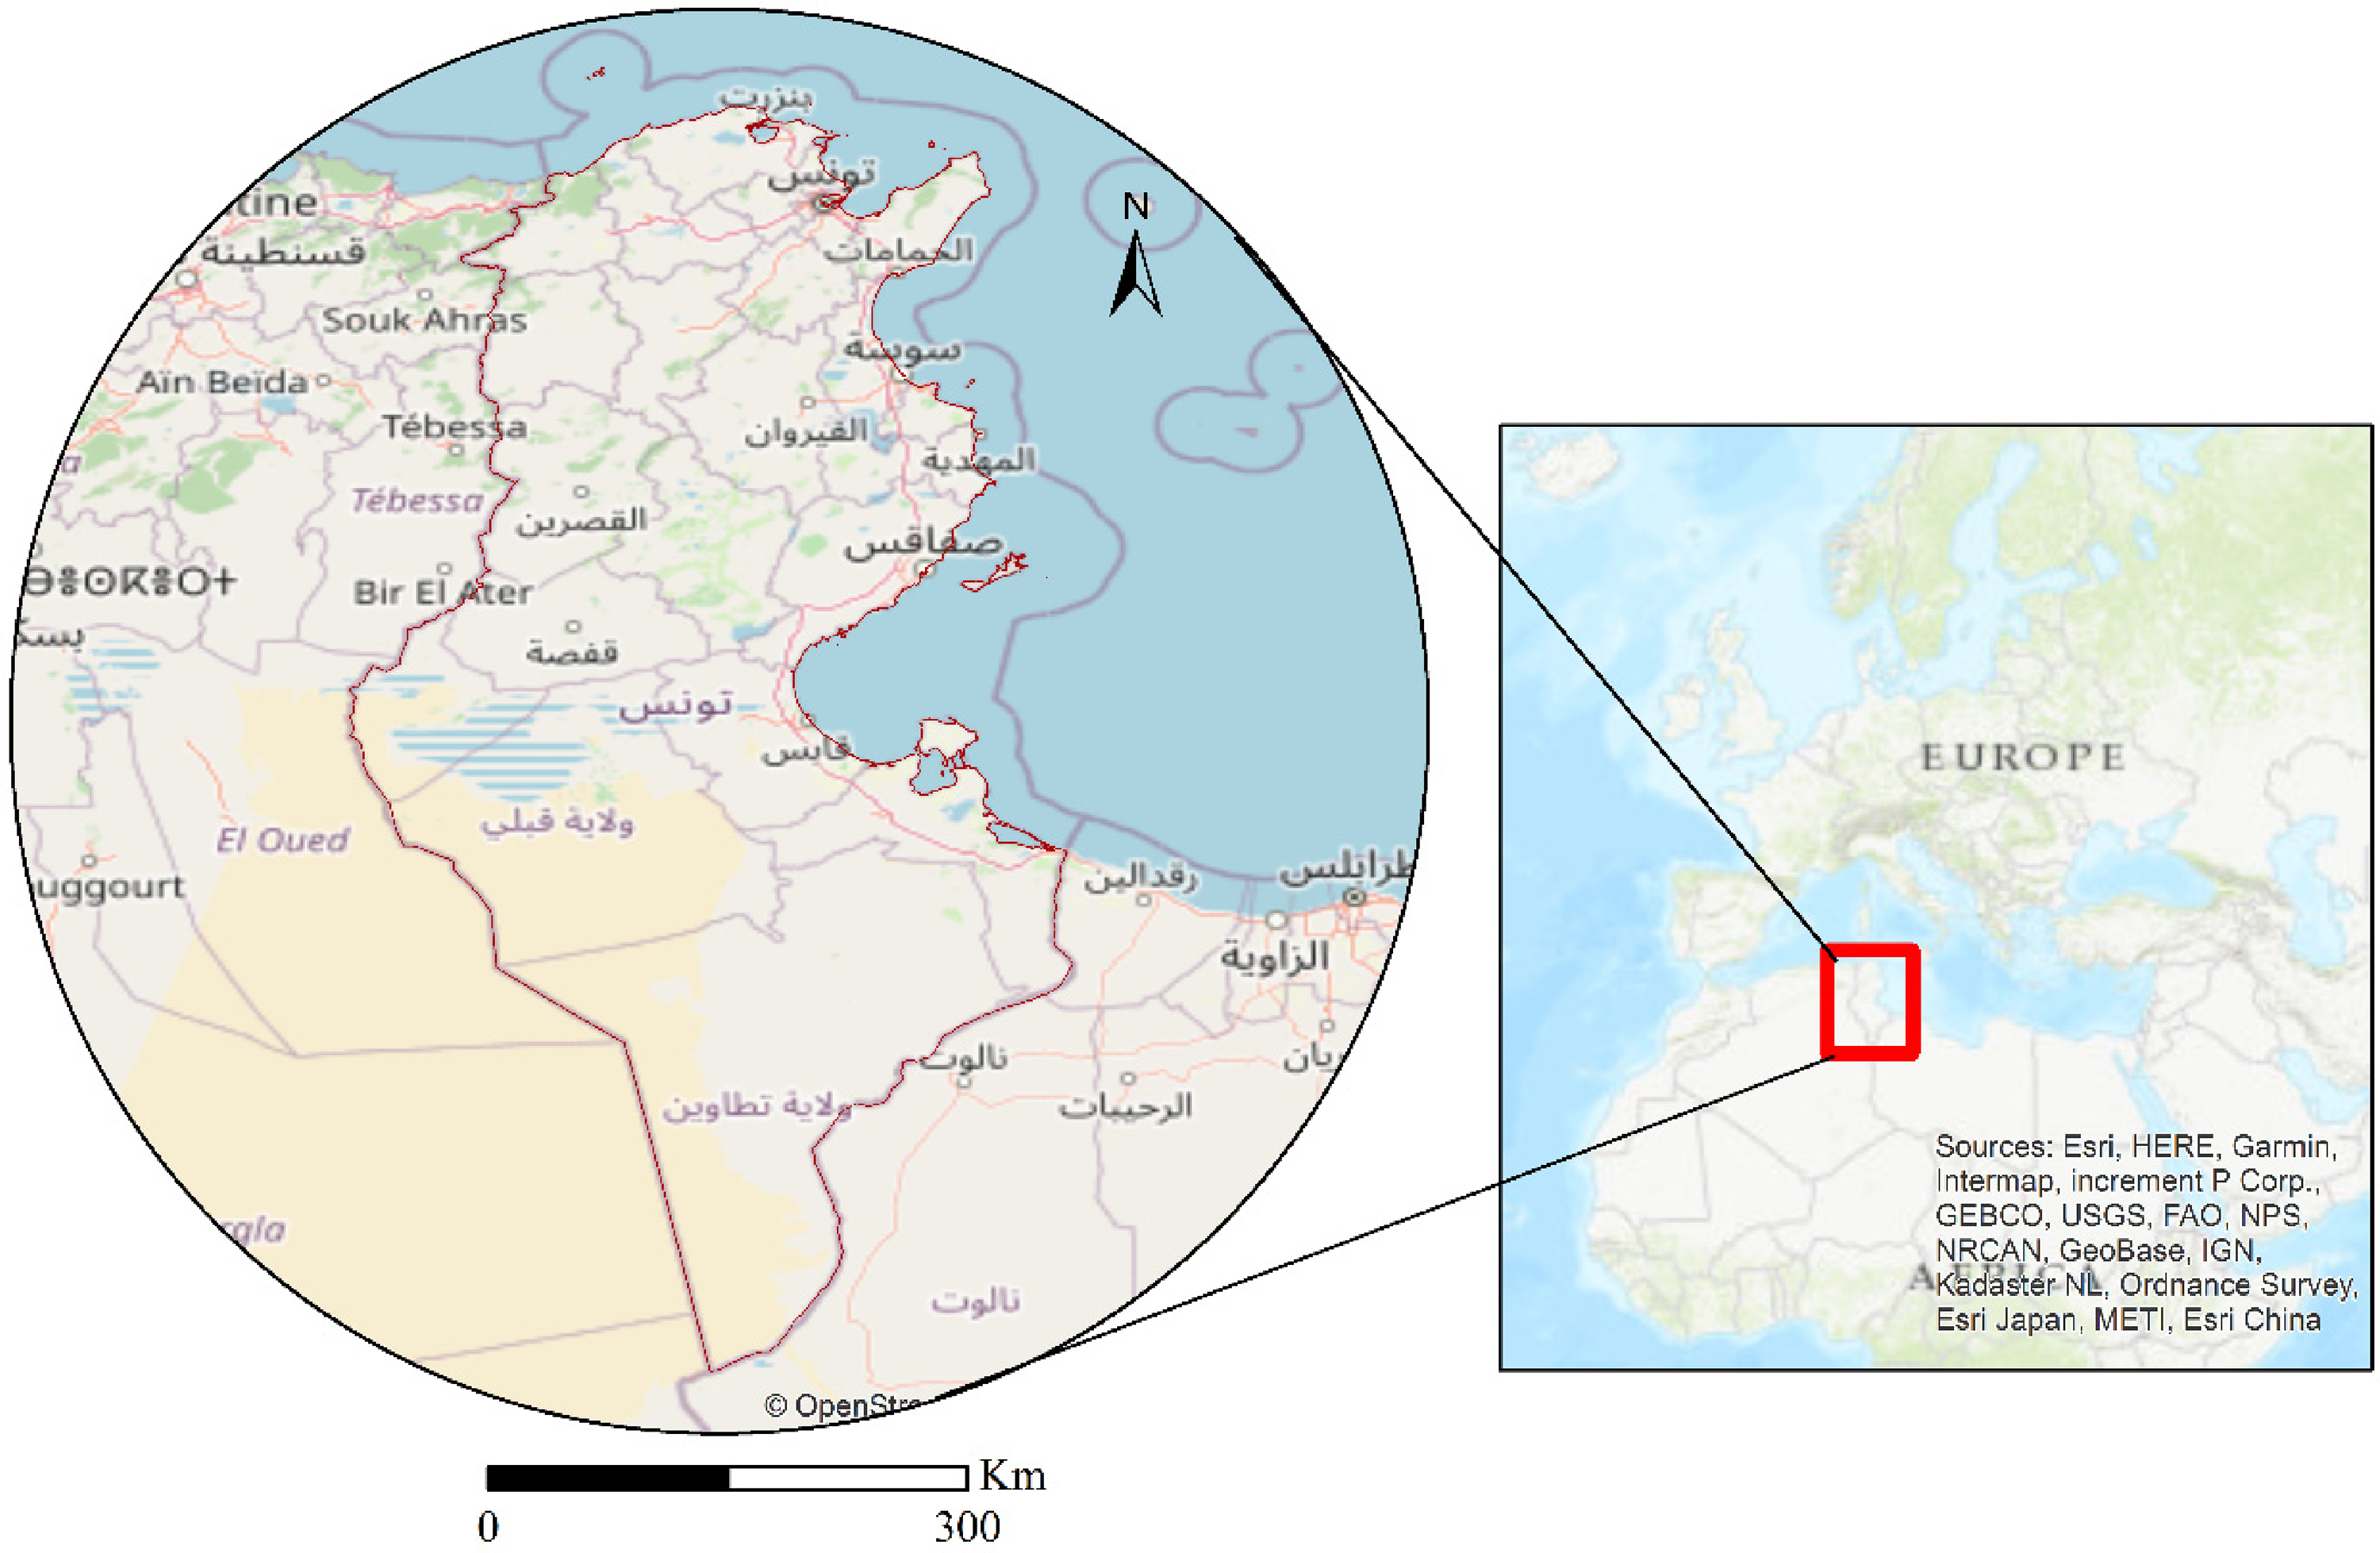
Study area.
Analytic hierarchy process (AHP)
Based on the existing literature, AHP is a widely applied MCDM approach in numerous disciplines, including renewable energy planning.
In order to reach an optimal solution, Saaty introduced the method of ranking different alternatives based on a variety of attributes while taking conflicting objectives into consideration (Saaty and Vargas, 2012). AHP’s widespread use explains its ability to simplify decision-making problems by decomposing them into more manageable parts. Besides, this technique handles quantitative and qualitative data types while validating the decision through a consistency check (Al-Garni et al., 2016; Ouchani et al., 2020). The key steps involved in the AHP approach are summarized below:
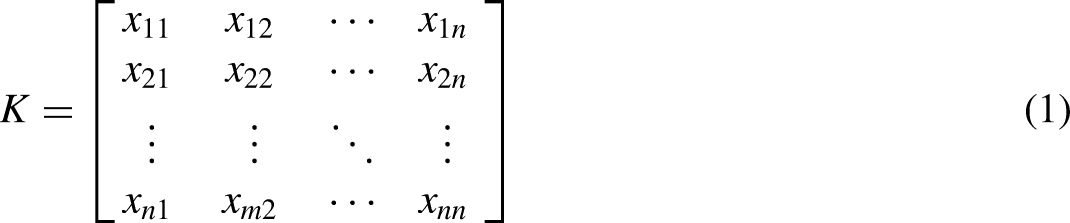
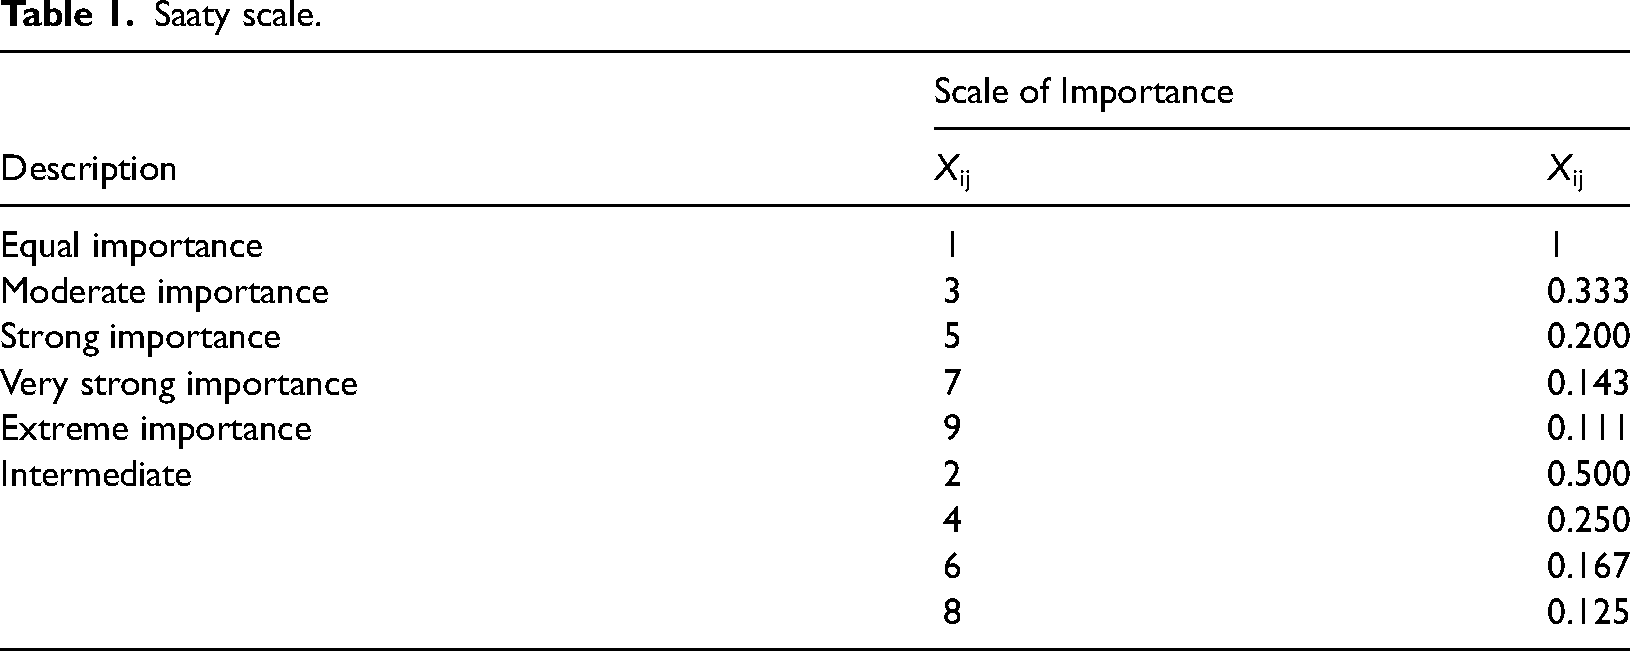
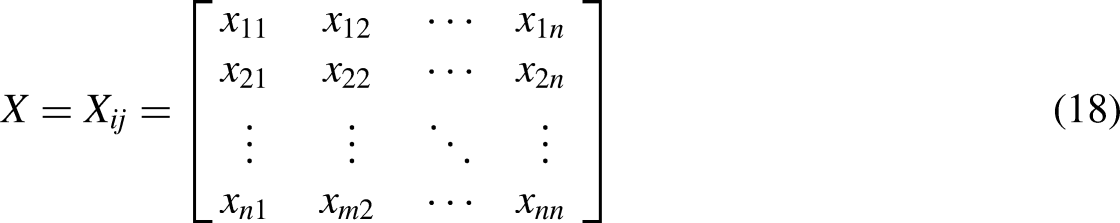
1. Create the initial pairwise comparison matrix. Based on Saaty’s scale, element xij represents the significance of the ith criterion over the jth criterion (Saaty and Vargas, 2012), as depicted in Table 1.
Saaty scale.
Where 2. Compute the normalized matrix K 3. Calculate λmax and CI (Consistency Index) using the following equation: 4. Finally, check for the experts’ judgments consistency by calculating CR (consistency ratio).
Where λmax is the maximum eigenvalue and n is the number of criteria.

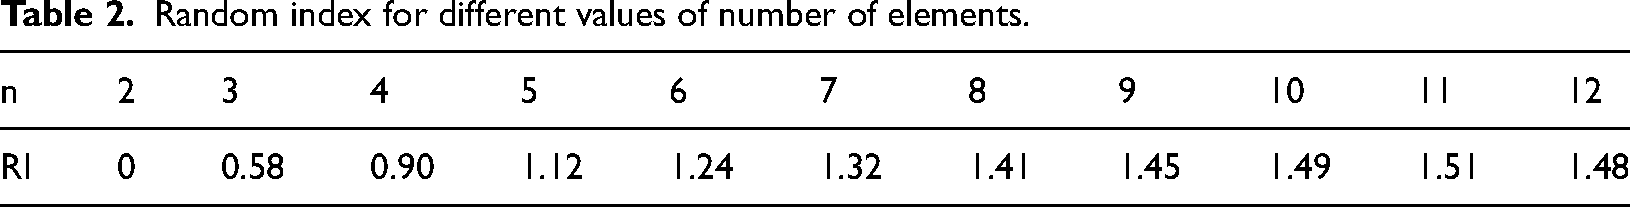
Where RI is the random index (see Table 2).
Random index for different values of number of elements.
If
EDAS method
Evaluation based on the Distance from Average Solution method (EDAS) was first introduced in 2015 by Keshavarz Ghorabaee et al. (2015). Unlike similar methods such as VIKOR and TOPSIS, EDAS offers a unique approach by focusing solely on the distance from the average solution, rather than calculating distances from positive and negative ideals (Torkayesh et al., 2023; Yazdani et al., 2020). It evaluates alternatives using two key criteria: positive distance from average and negative distance from average. The higher the PDA and the lower the NDA, the more desirable an alternative is considered to be within this framework (Rekik and El Alimi, 2024b; Torkayesh et al., 2023). This approach eliminates the need for calculating ideal or anti-ideal solutions, making it particularly useful in cases where conflicting criteria are present (Babatunde et al., 2022). The key steps involved in this approach are outlined below:
Step 1: Construct the decision matrix.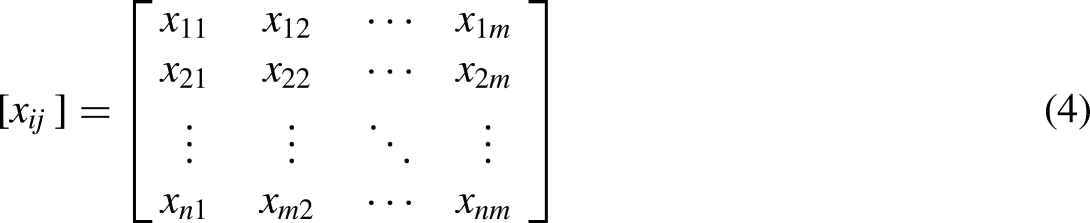
Step 2. Compute the average solution of each criterion according to:


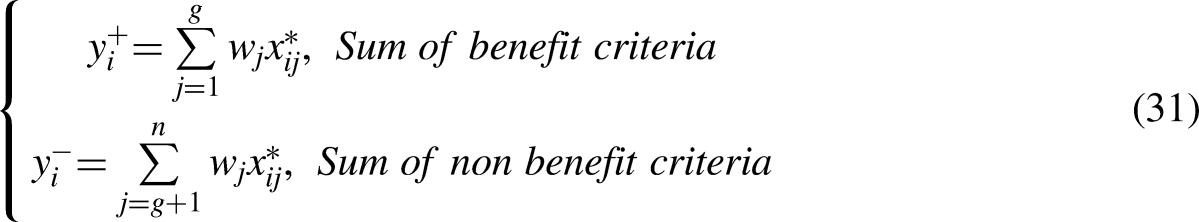
Step 4. We calculate the weighted sum of PDA and NDA for all alternatives.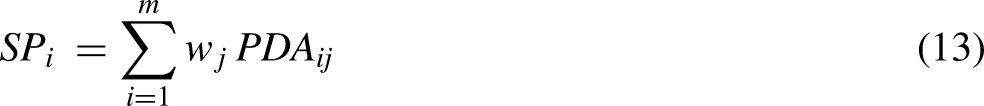
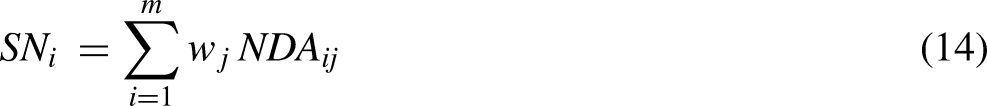
Step 5: Normalize the alternatives’ SP and SN values using the following Eqs.


COPRAS approach
The COPRAS method was developed by Zavadskas and Kaklauskas (1996) as a technique to assess the superiority of one alternative over another, enabling the comparison of several alternatives. This approach can be utilized to optimize or eliminate criteria in an evaluation where multiple criteria need to be taken into account (Hezer et al., 2021; Manivasagam et al., 2023). The COPRAS technique systematically ranks and assesses options based on their relevance, importance, and utility degree with respect to each criterion while considering interdependencies among them (Chatterjee et al., 2011; Hezer et al., 2021). Thus, it provides a comprehensive analysis that aids decision-makers in selecting the most suitable option for their needs. COPRAS steps are summarized as follows:
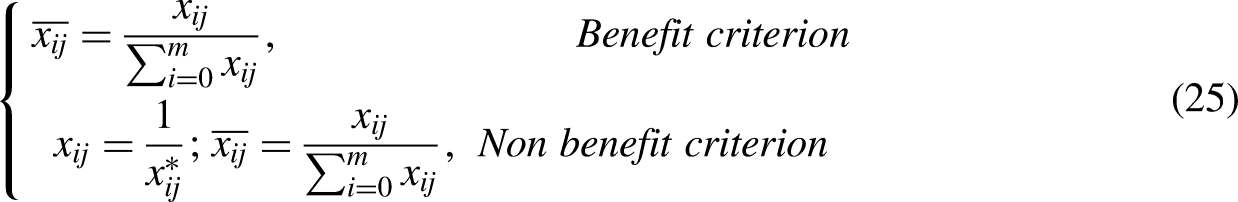
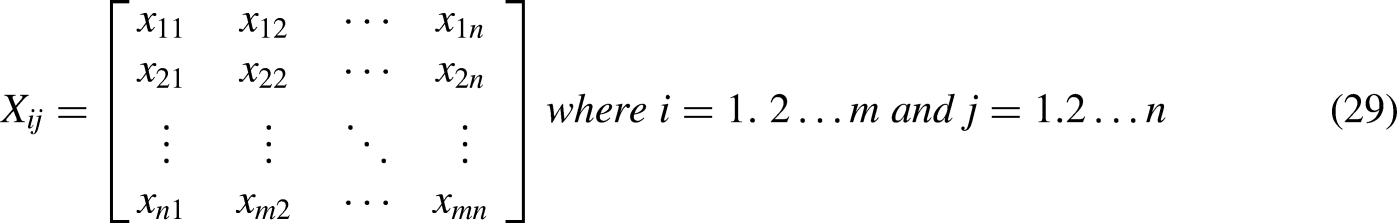
1. Develop the initial matrix 2. Compute the normalized matrix according to: 3. Calculate the weighted normalized matrix: 4. Sum of weighted normalized matrix 5. Determine the relative significance of alternatives 6. Calculate the quantitative utility
Where m is the number of alternatives and n is the number of criteria


ARAS technique
The Additive Ratio Assessment (ARAS) method was first applied by Zavadskas and Turskis (2010) as a comprehensive approach to ranking and prioritization. This innovative technique has proven to be effective in handling complex decision-making processes that involve multiple factors, ultimately guiding toward optimal choices (Ramezanali et al., 2020; Soltani and Aliabadi, 2023). The core principle of the ARAS technique lies in maximizing the distance from negative factors while simultaneously reducing the distance from positive factors, making it a particularly robust and versatile tool for decision analysis. The implementation of this method is explained in five general steps as follows:
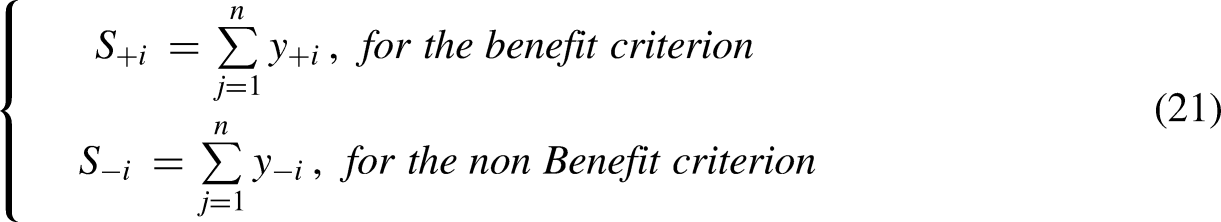
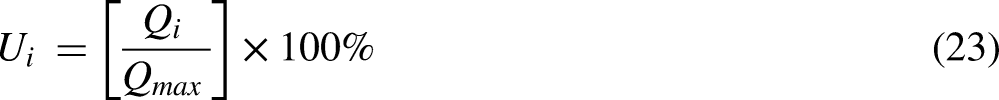
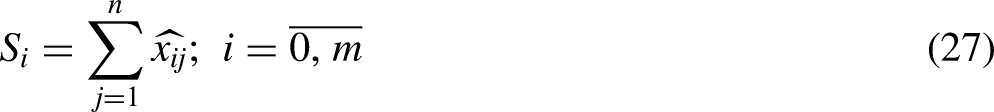
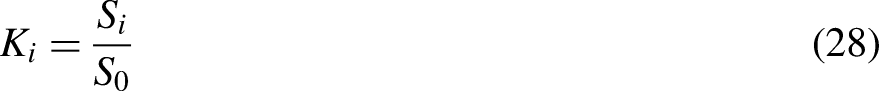
1. Create the initial matrix 2. Normalize the decision matrix 3. Calculate the weighted normalized matrix 4. Determine the optimality function Si 5. Determine the degree of utility Ki for each of the alternatives
With m and n are the number of alternatives and criteria, respectively.

MOORA methodology
The MOORA method, developed by Brauers and Zavadskas (2006), provides a simple yet comprehensive framework for operationalizing diverse attributes with varying units of measurement and objectives. It offers a coherent approach to decision-making by considering multiple quantitative and qualitative selection attributes simultaneously (Başaran and Tarhan, 2022; Singh et al., 2024). This computationally straightforward and robust method is easily understandable while accommodating any number of criteria (De Paula et al., 2022). To implement this technique, the following steps are used:
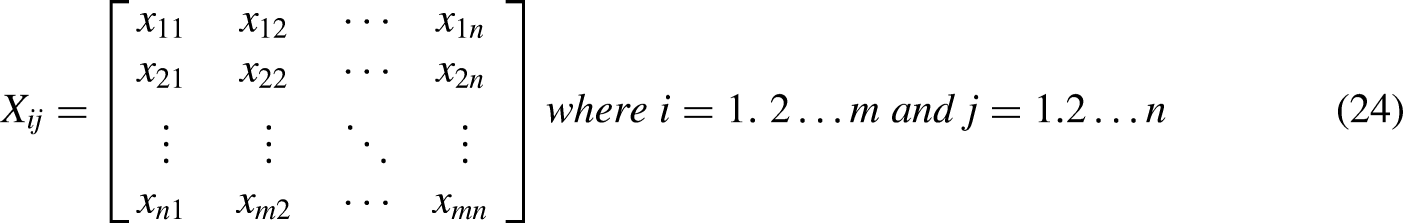
Create the decision matrix with m alternatives and n criteria Normalize the initial matrix Estimation of assessment values
Entropy weighting method
The entropy weight method is a significant information weight model that has undergone extensive research and applications across various disciplines (Yazdani et al., 2020; Zhu et al., 2020). The EWM’s distinct advantage over subjective weighting models lies in its ability to eliminate the influence of human variables on indicator weights, thereby enhancing the objectivity of comprehensive evaluation results (Ding et al., 2017; Liu et al., 2010; Yazdani et al., 2020). Drawing from established literature, it is evident that outcomes produced by employing EWM are consistently dependable and efficient (Zhu et al., 2020). The key steps involved in this methodology are depicted as follows:
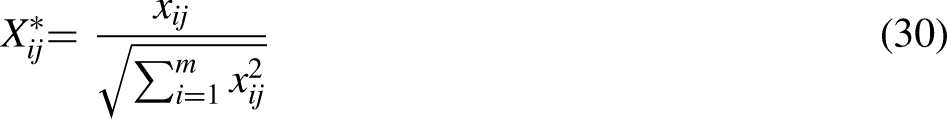
Normalize the initial matrix as follows: Calculate the entropy of each criterion Where K = 1/log
m
Calculate the objective weight according to:


Constraints and decision criteria
The process of determining optimal locations for renewable energy projects, including solar-powered green hydrogen, is a very complex task. It is not just the availability of ample solar or wind resources within a region that must be investigated thoroughly (Asadi et al., 2023; Badi et al., 2021). In fact, a myriad of elements have to be factored in, such as technical, topography, cost analysis, and infrastructure abilities since they significantly affect power output levels. To accurately determine the hydrogen generation capacity at any given site, comprehensive data collection followed by rigorous analysis is essential.
Constraints
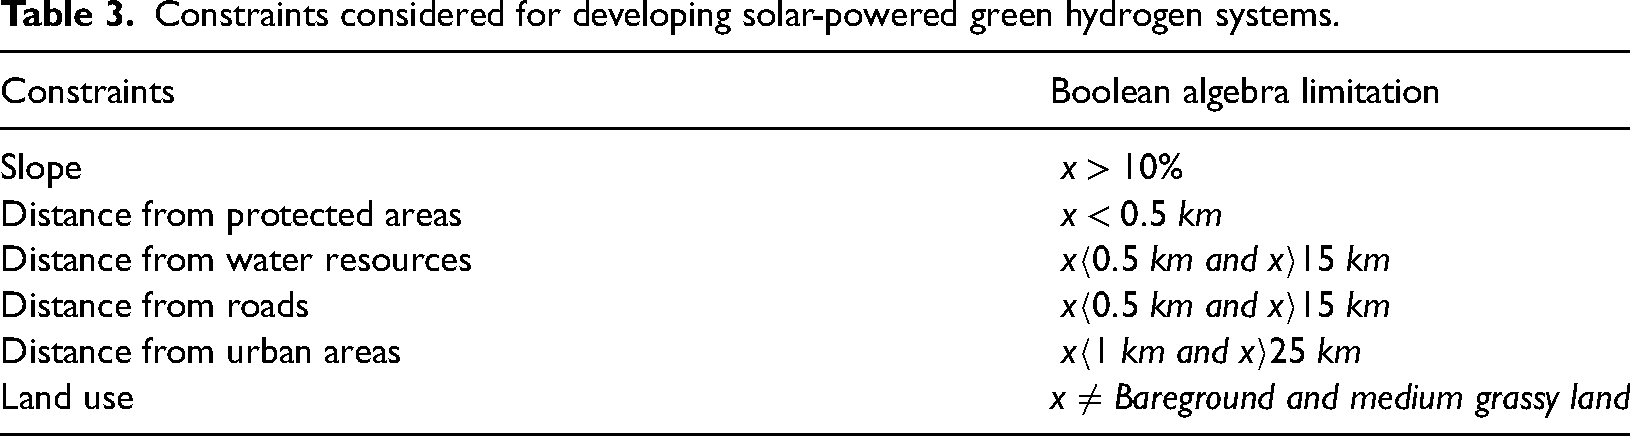
Evaluation of potential locations for green solar-powered hydrogen plants requires a comprehensive review, considering numerous limiting factors. In this analysis, the restrictive constraints were determined via an extensive literature survey (see Table 3). These elements were aggregated using Boolean algebra (1 or 0) in ArcGIS 10.8 (see Figure 3). Cells holding values of “1” indicate no obstructions, which enables the establishment of solar hydrogen systems, contrasting with values marked as “0” symbolizing a prohibition, making such facilities unfeasible.
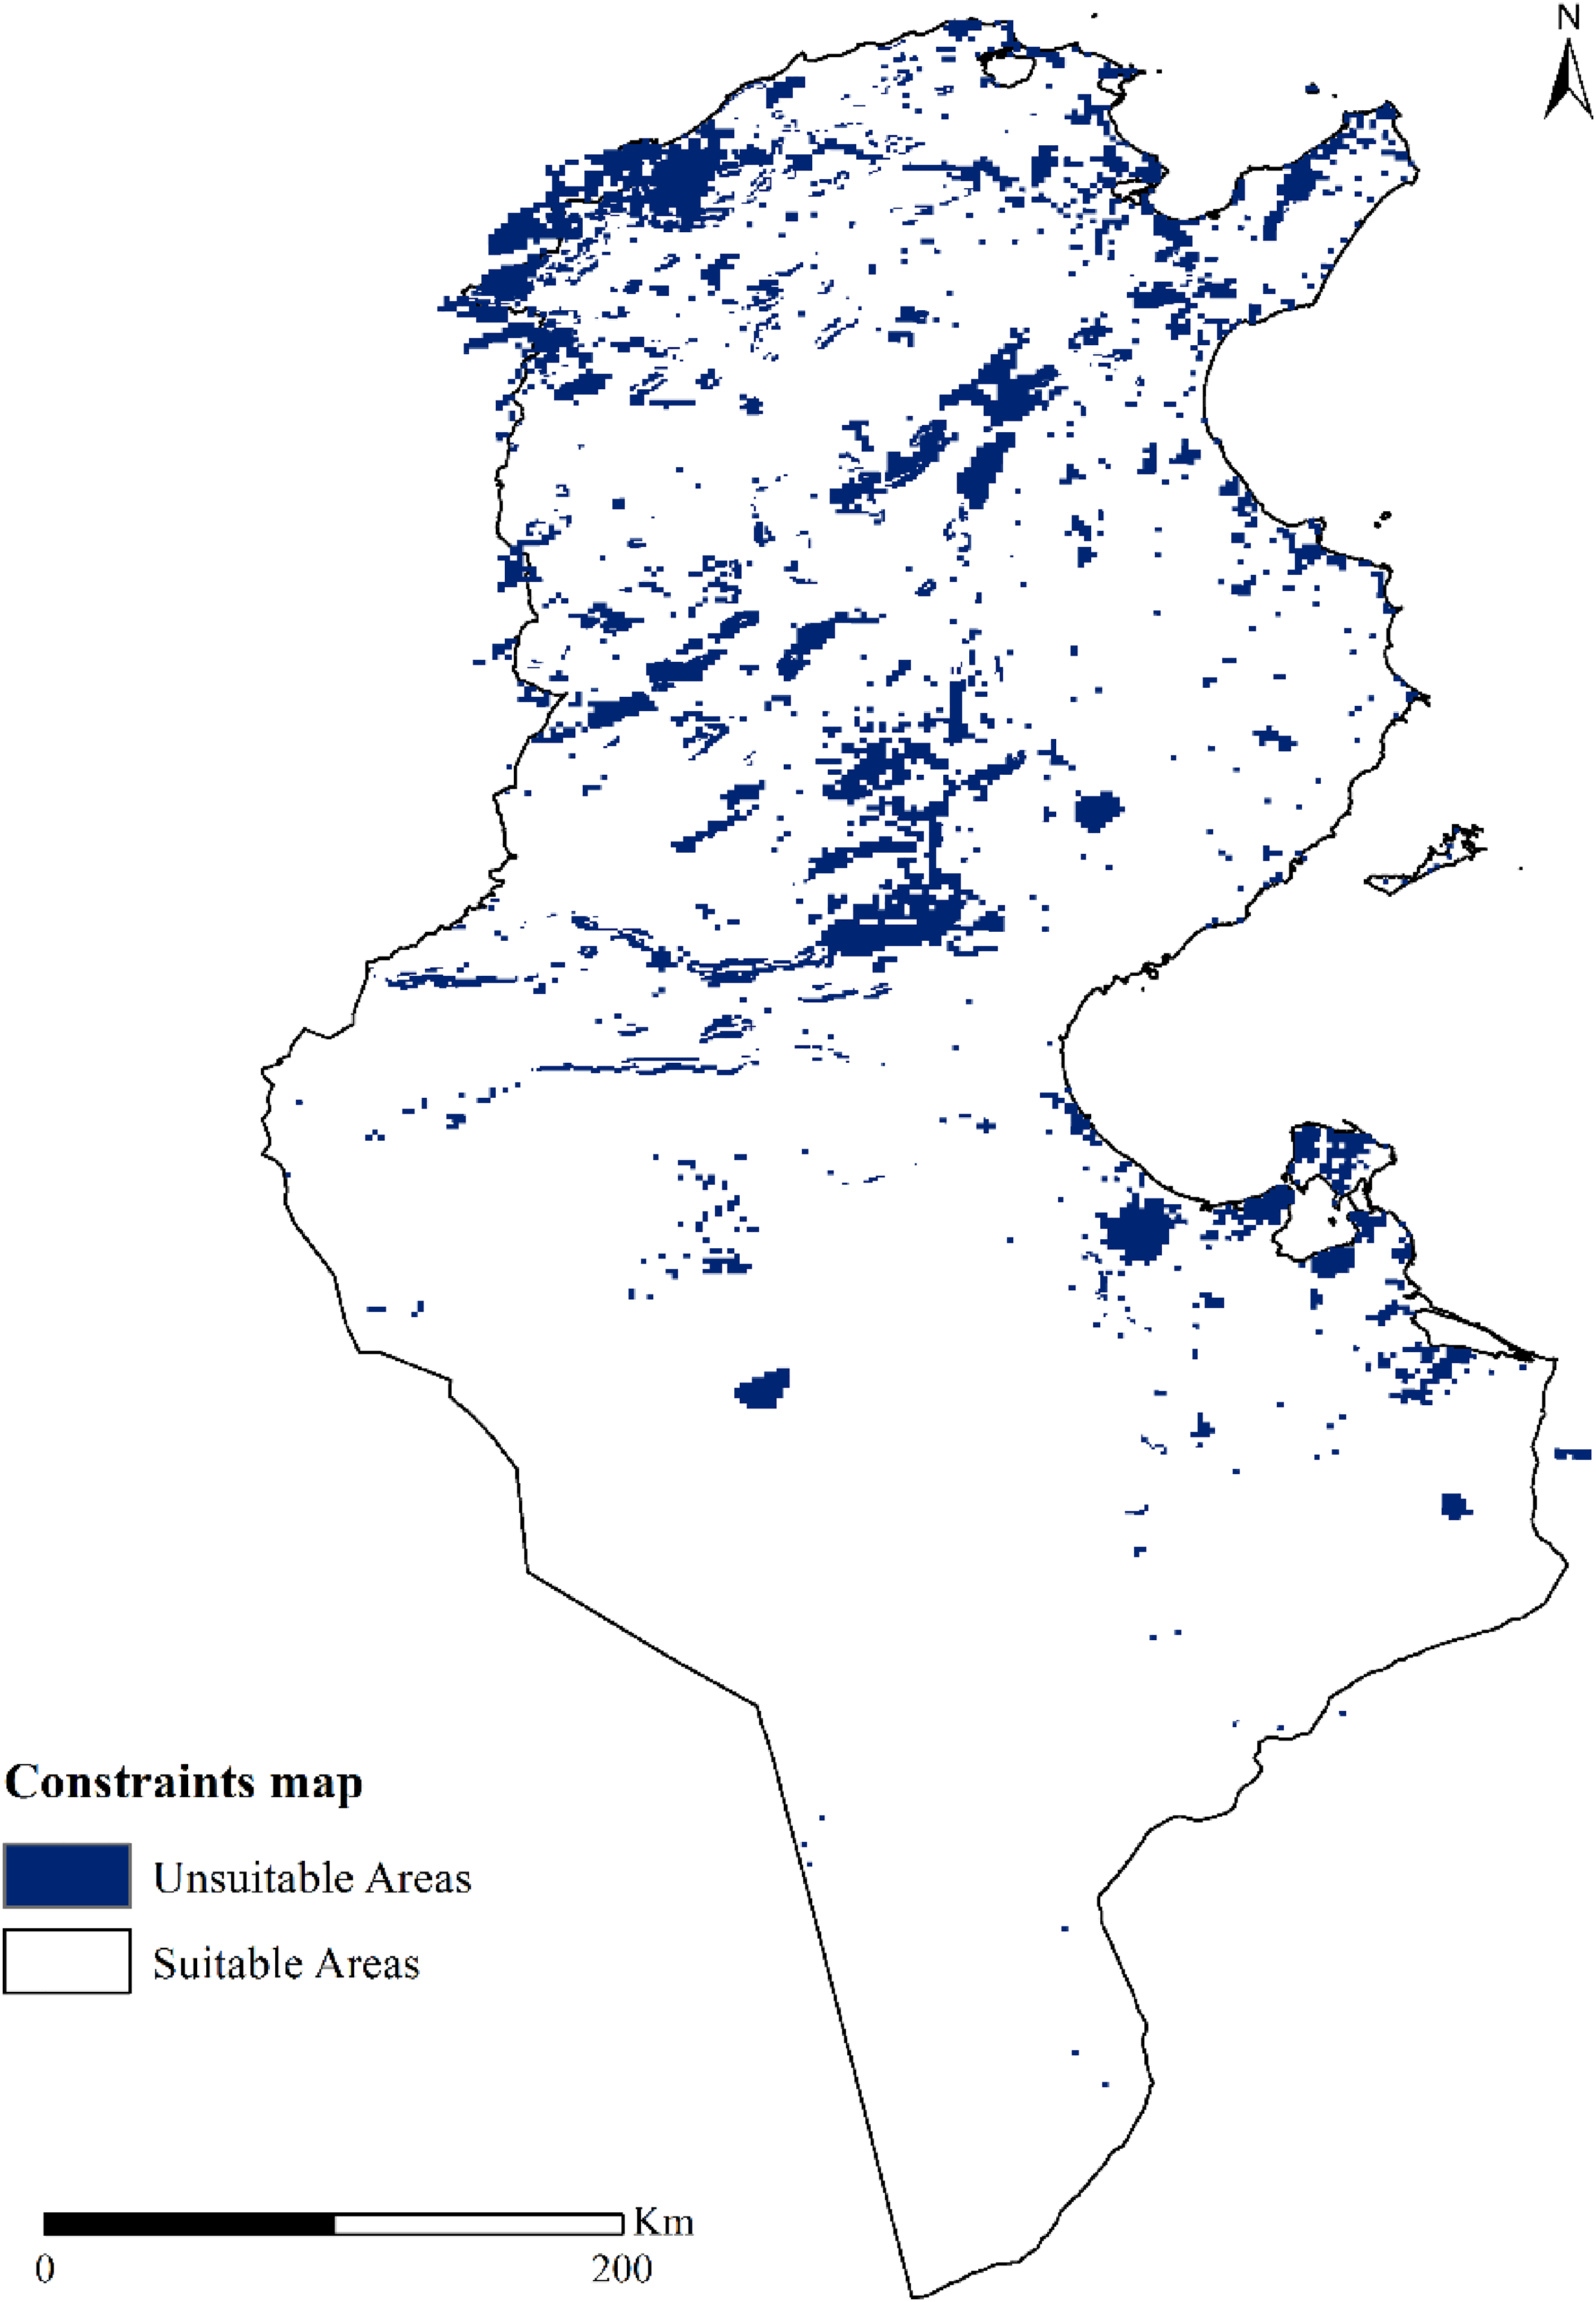
Constraints map.
Constraints considered for developing solar-powered green hydrogen systems.
Decision criteria
When addressing the issue of renewable hydrogen production, it is essential to estimate the amount of hydrogen that can potentially be generated using renewable energy resources, such as solar and wind power sources. The capacity and availability of these energy sources at a certain location must also be evaluated in order to harness this potential effectively through electrolysis or other mechanisms (Asare-Addo, 2023; Messaoudi et al., 2019a). Assessing the potential for renewable hydrogen production simplifies identifying regions rich in available, efficient green energy resources that contribute substantially toward a clean, sustainable fuel supply (Ali et al., 2022). The focus of this paper is to conduct a spatial analysis to identify the optimal locations for solar-based green hydrogen installations in Tunisia. To determine the green hydrogen production potential, the solar radiation map of Tunisia has been utilized. The average solar radiation in Tunisia ranges between 5 and 7.12 kWh/m2/day. To compute the annual solar energy production, a monocrystalline photovoltaic solar panel with a module efficiency of 20% and a peak power output of 530 watts has been employed. Equation (35) has been used to estimate the yearly energy generated by the solar panel (Ali et al., 2022; Messaoudi et al., 2019a).
A Polymer Electrolyte Membrane (PEM) electrolyzer with 75% efficiency and a 52.5 kWh/kg electrolytic rate of hydrogen has been considered for the production of green hydrogen (Messaoudi et al., 2019a). Equation (36) illustrates the utilization of solar energy by the electrolyzer in the production of green hydrogen.
Then, the annual mean of solar-powered hydrogen potential is computed as follows (Ali et al., 2022; Messaoudi et al., 2019a):
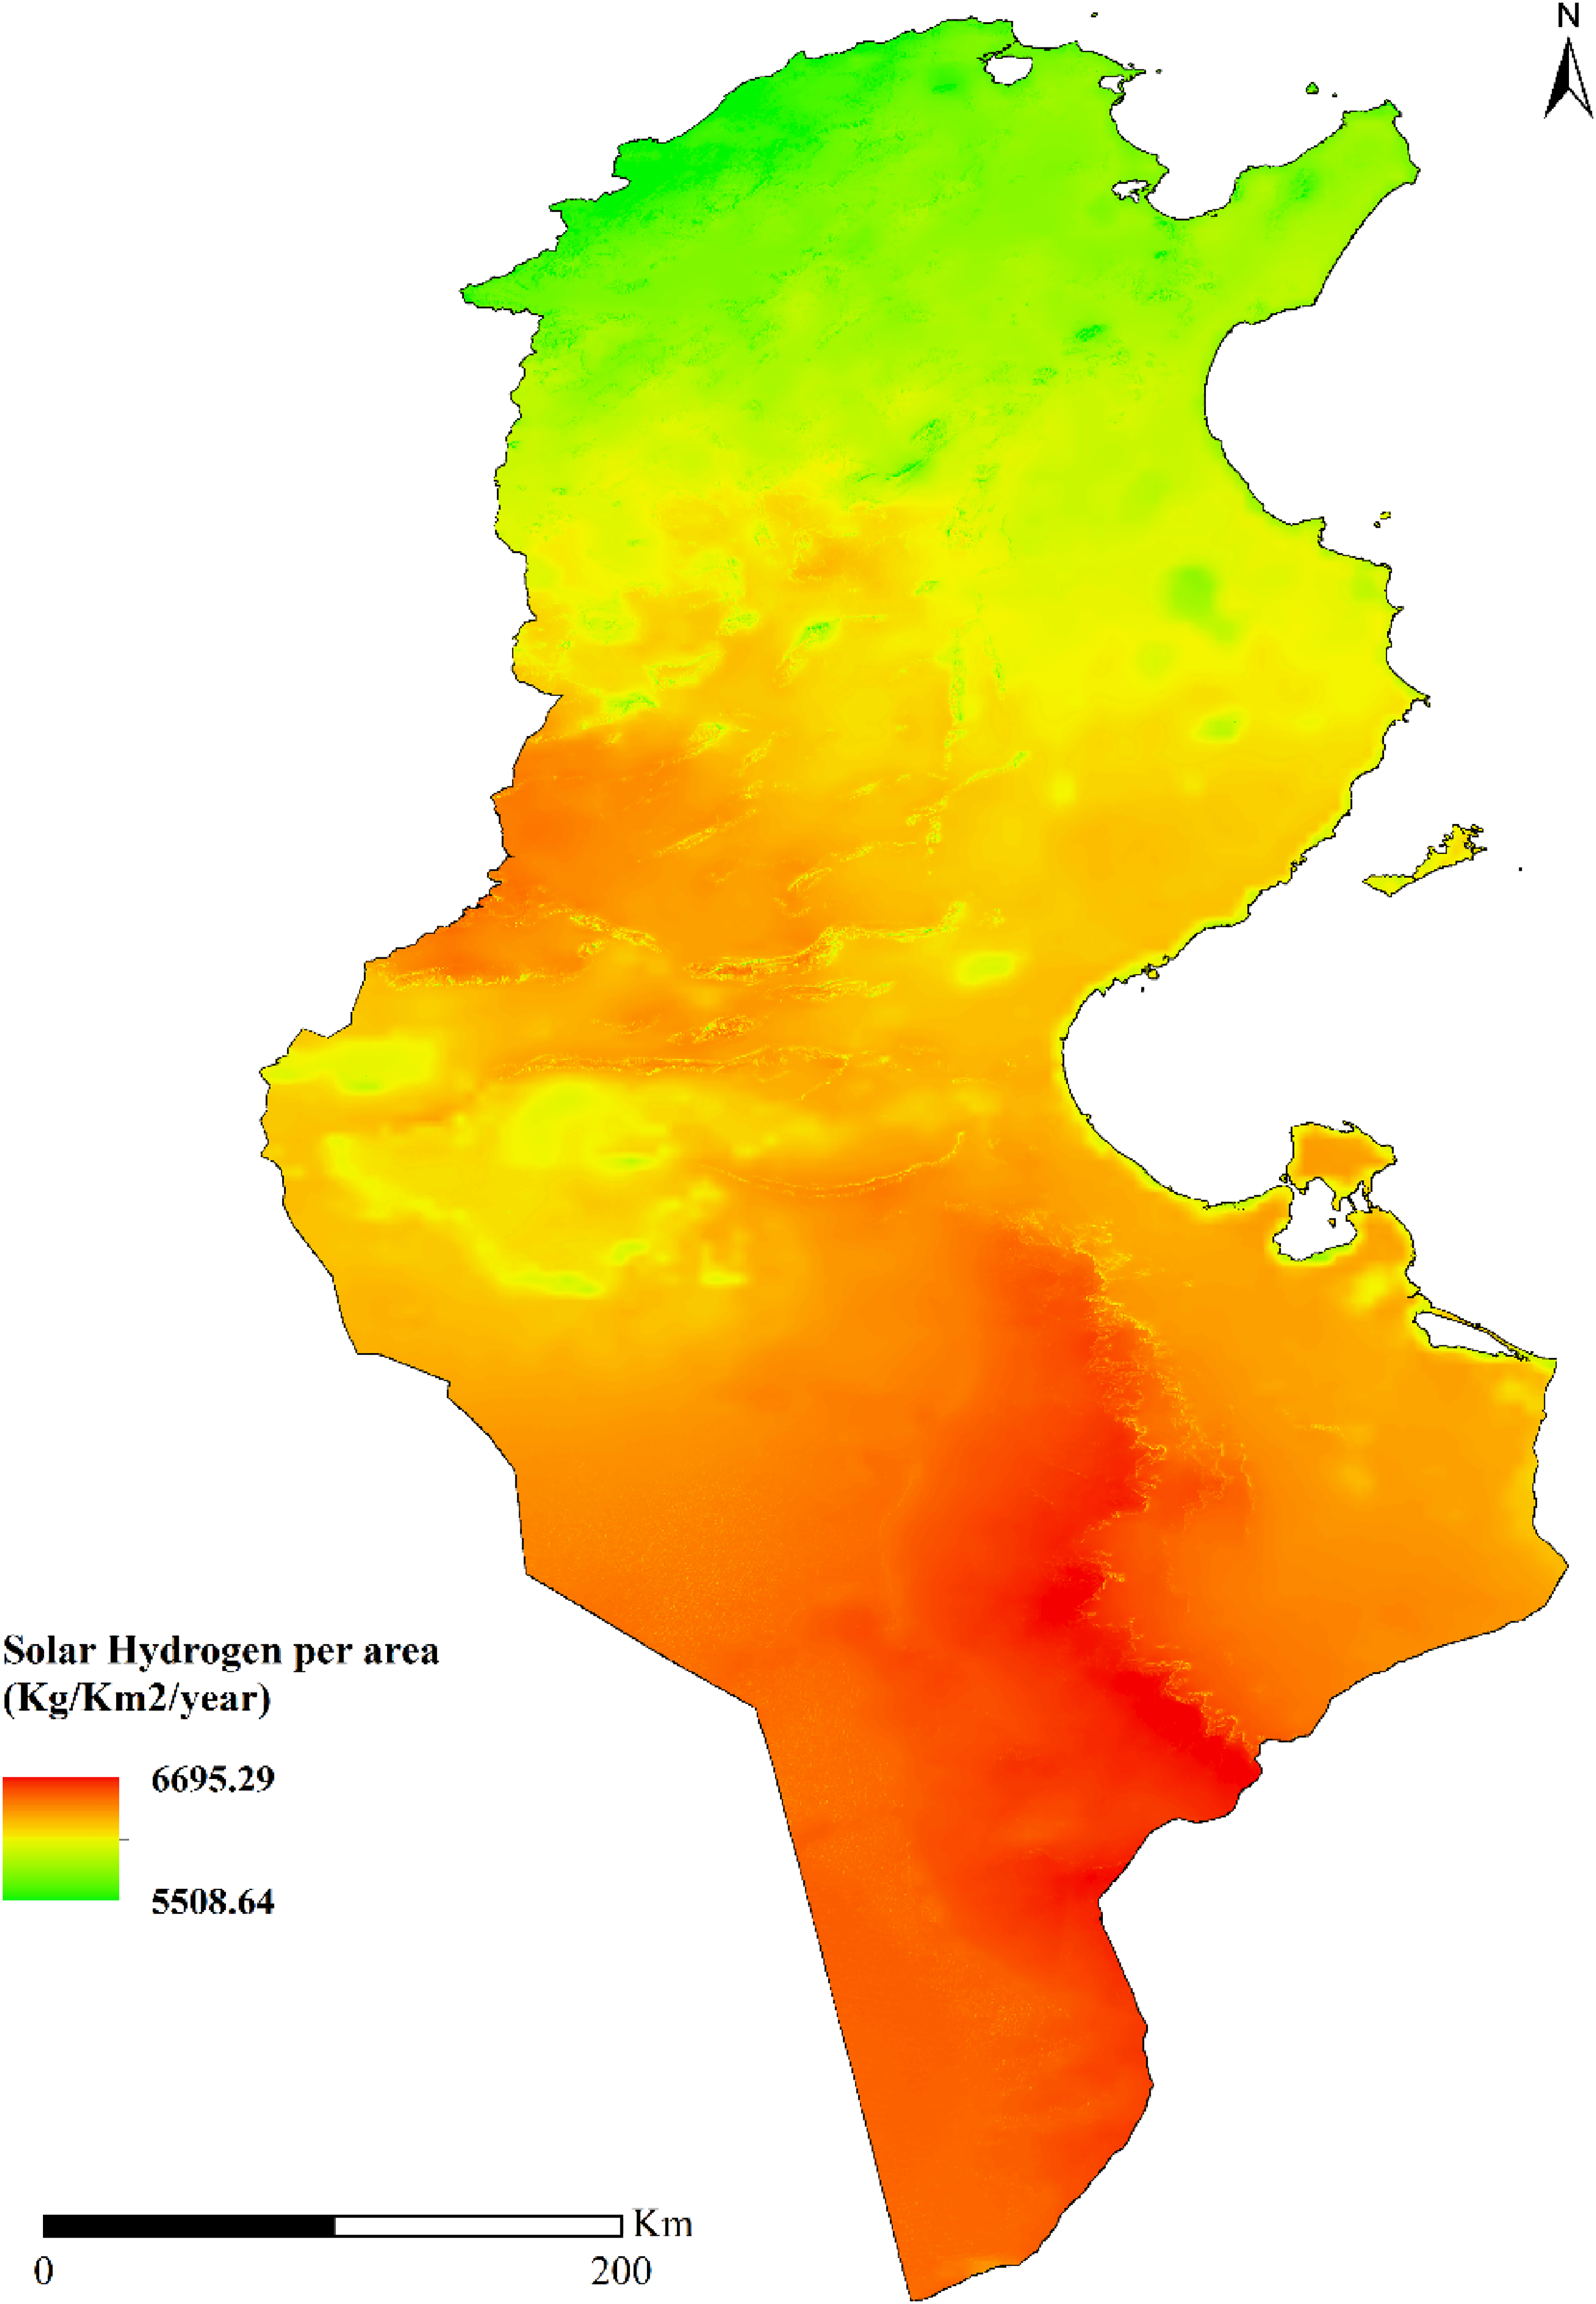
Green hydrogen potential from solar technology.
From an economic perspective, the topographic features of potential sites are critical. It is vital to choose flat or gently sloping areas for green hydrogen facilities because steep terrain can increase construction and maintenance costs (Ali et al., 2022; Messaoudi et al., 2019a; Messaoudi et al., 2024; Taoufik and Fekri, 2023). Moreover, areas prone to shadow effects due to higher inclinations compromise the performance of PV systems. Hence, locations with gentle slopes are more favorable for such projects. Figure 5 depicts this criterion.
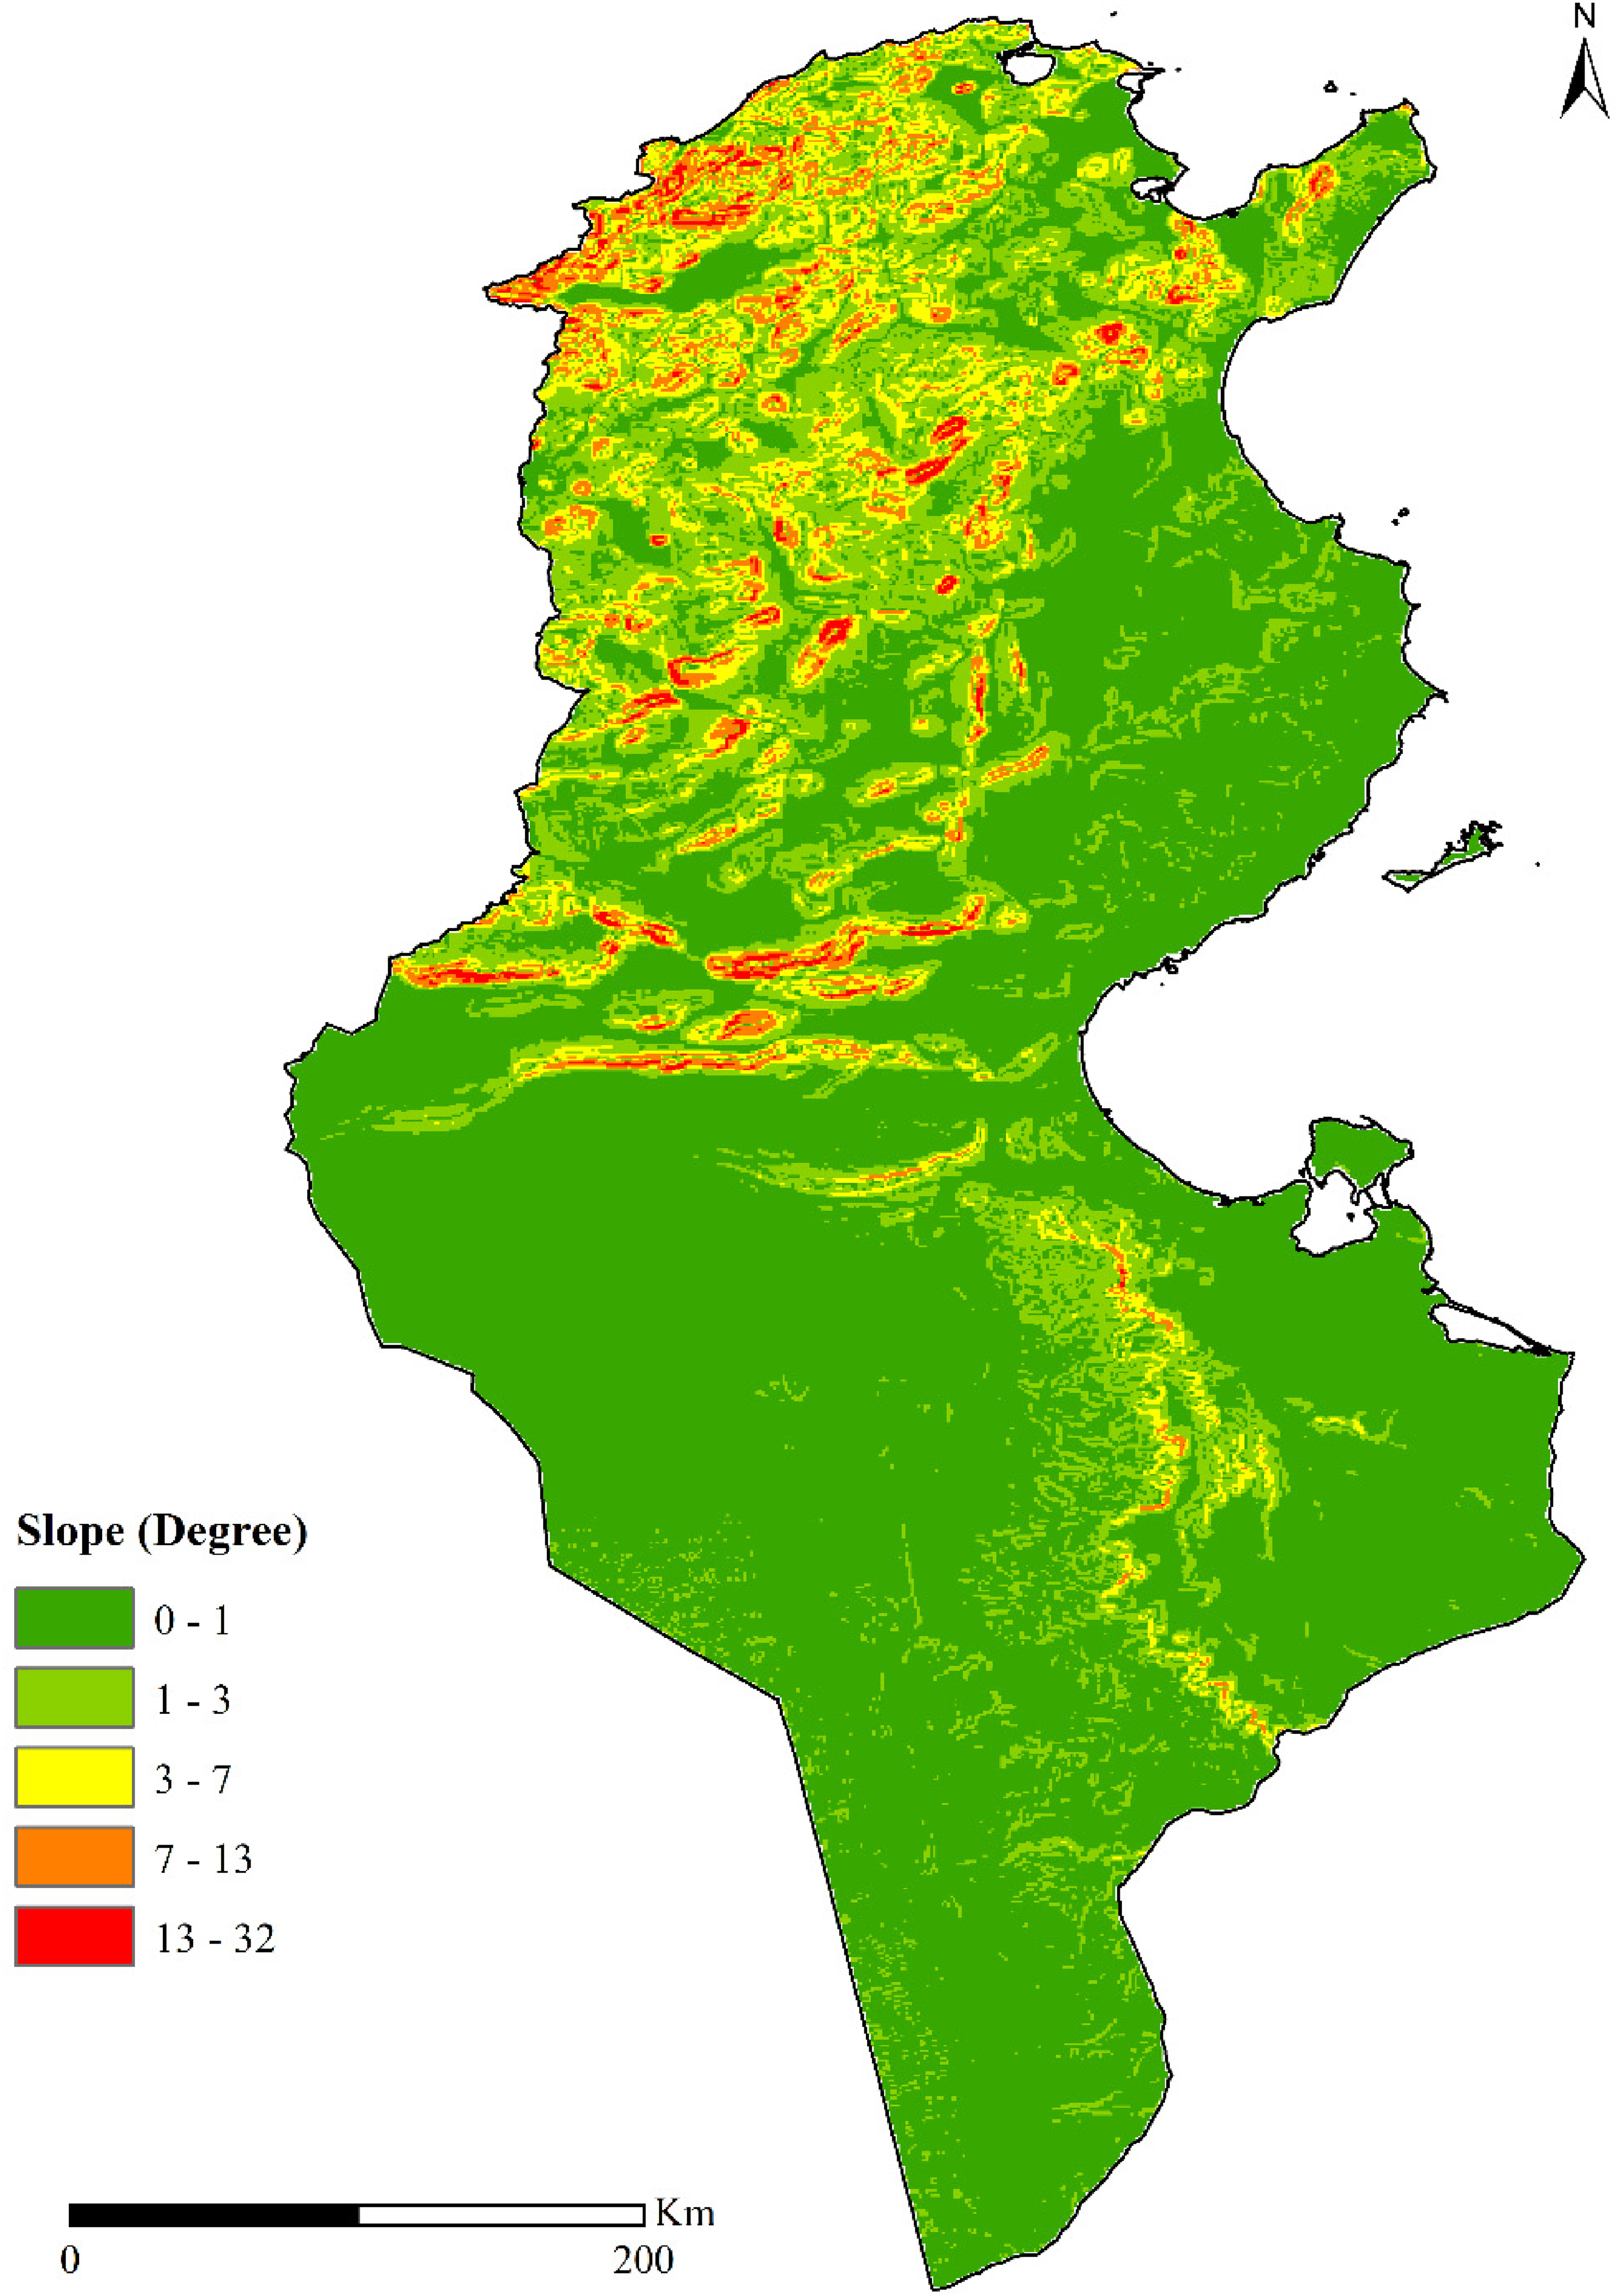
Slope.
The strategic placement of solar-based green hydrogen power systems in proximity to the grid network and populated areas is a decisive factor in guaranteeing their long-term operational sustainability. Spatial distance from end-users directly impacts power waste and distribution costs, highlighting the importance of minimizing line spacing between these facilities, grid networks, and residential areas (Badi et al., 2021; Taoufik and Fekri, 2023). Additionally, suitable transportation infrastructure crucially affects site selection because it significantly influences overall project costs (Albraheem and AlAwlaqi, 2023; Asadi et al., 2023; Messaoudi et al., 2019a; Taoufik and Fekri, 2023). Hence, allocating hydrogen facilities within areas of favorable accessibility is of paramount importance in decision-making processes (Albraheem and AlAwlaqi, 2023; Badi et al., 2021; Elkadeem et al., 2021). These criteria are illustrated in Figure 6.
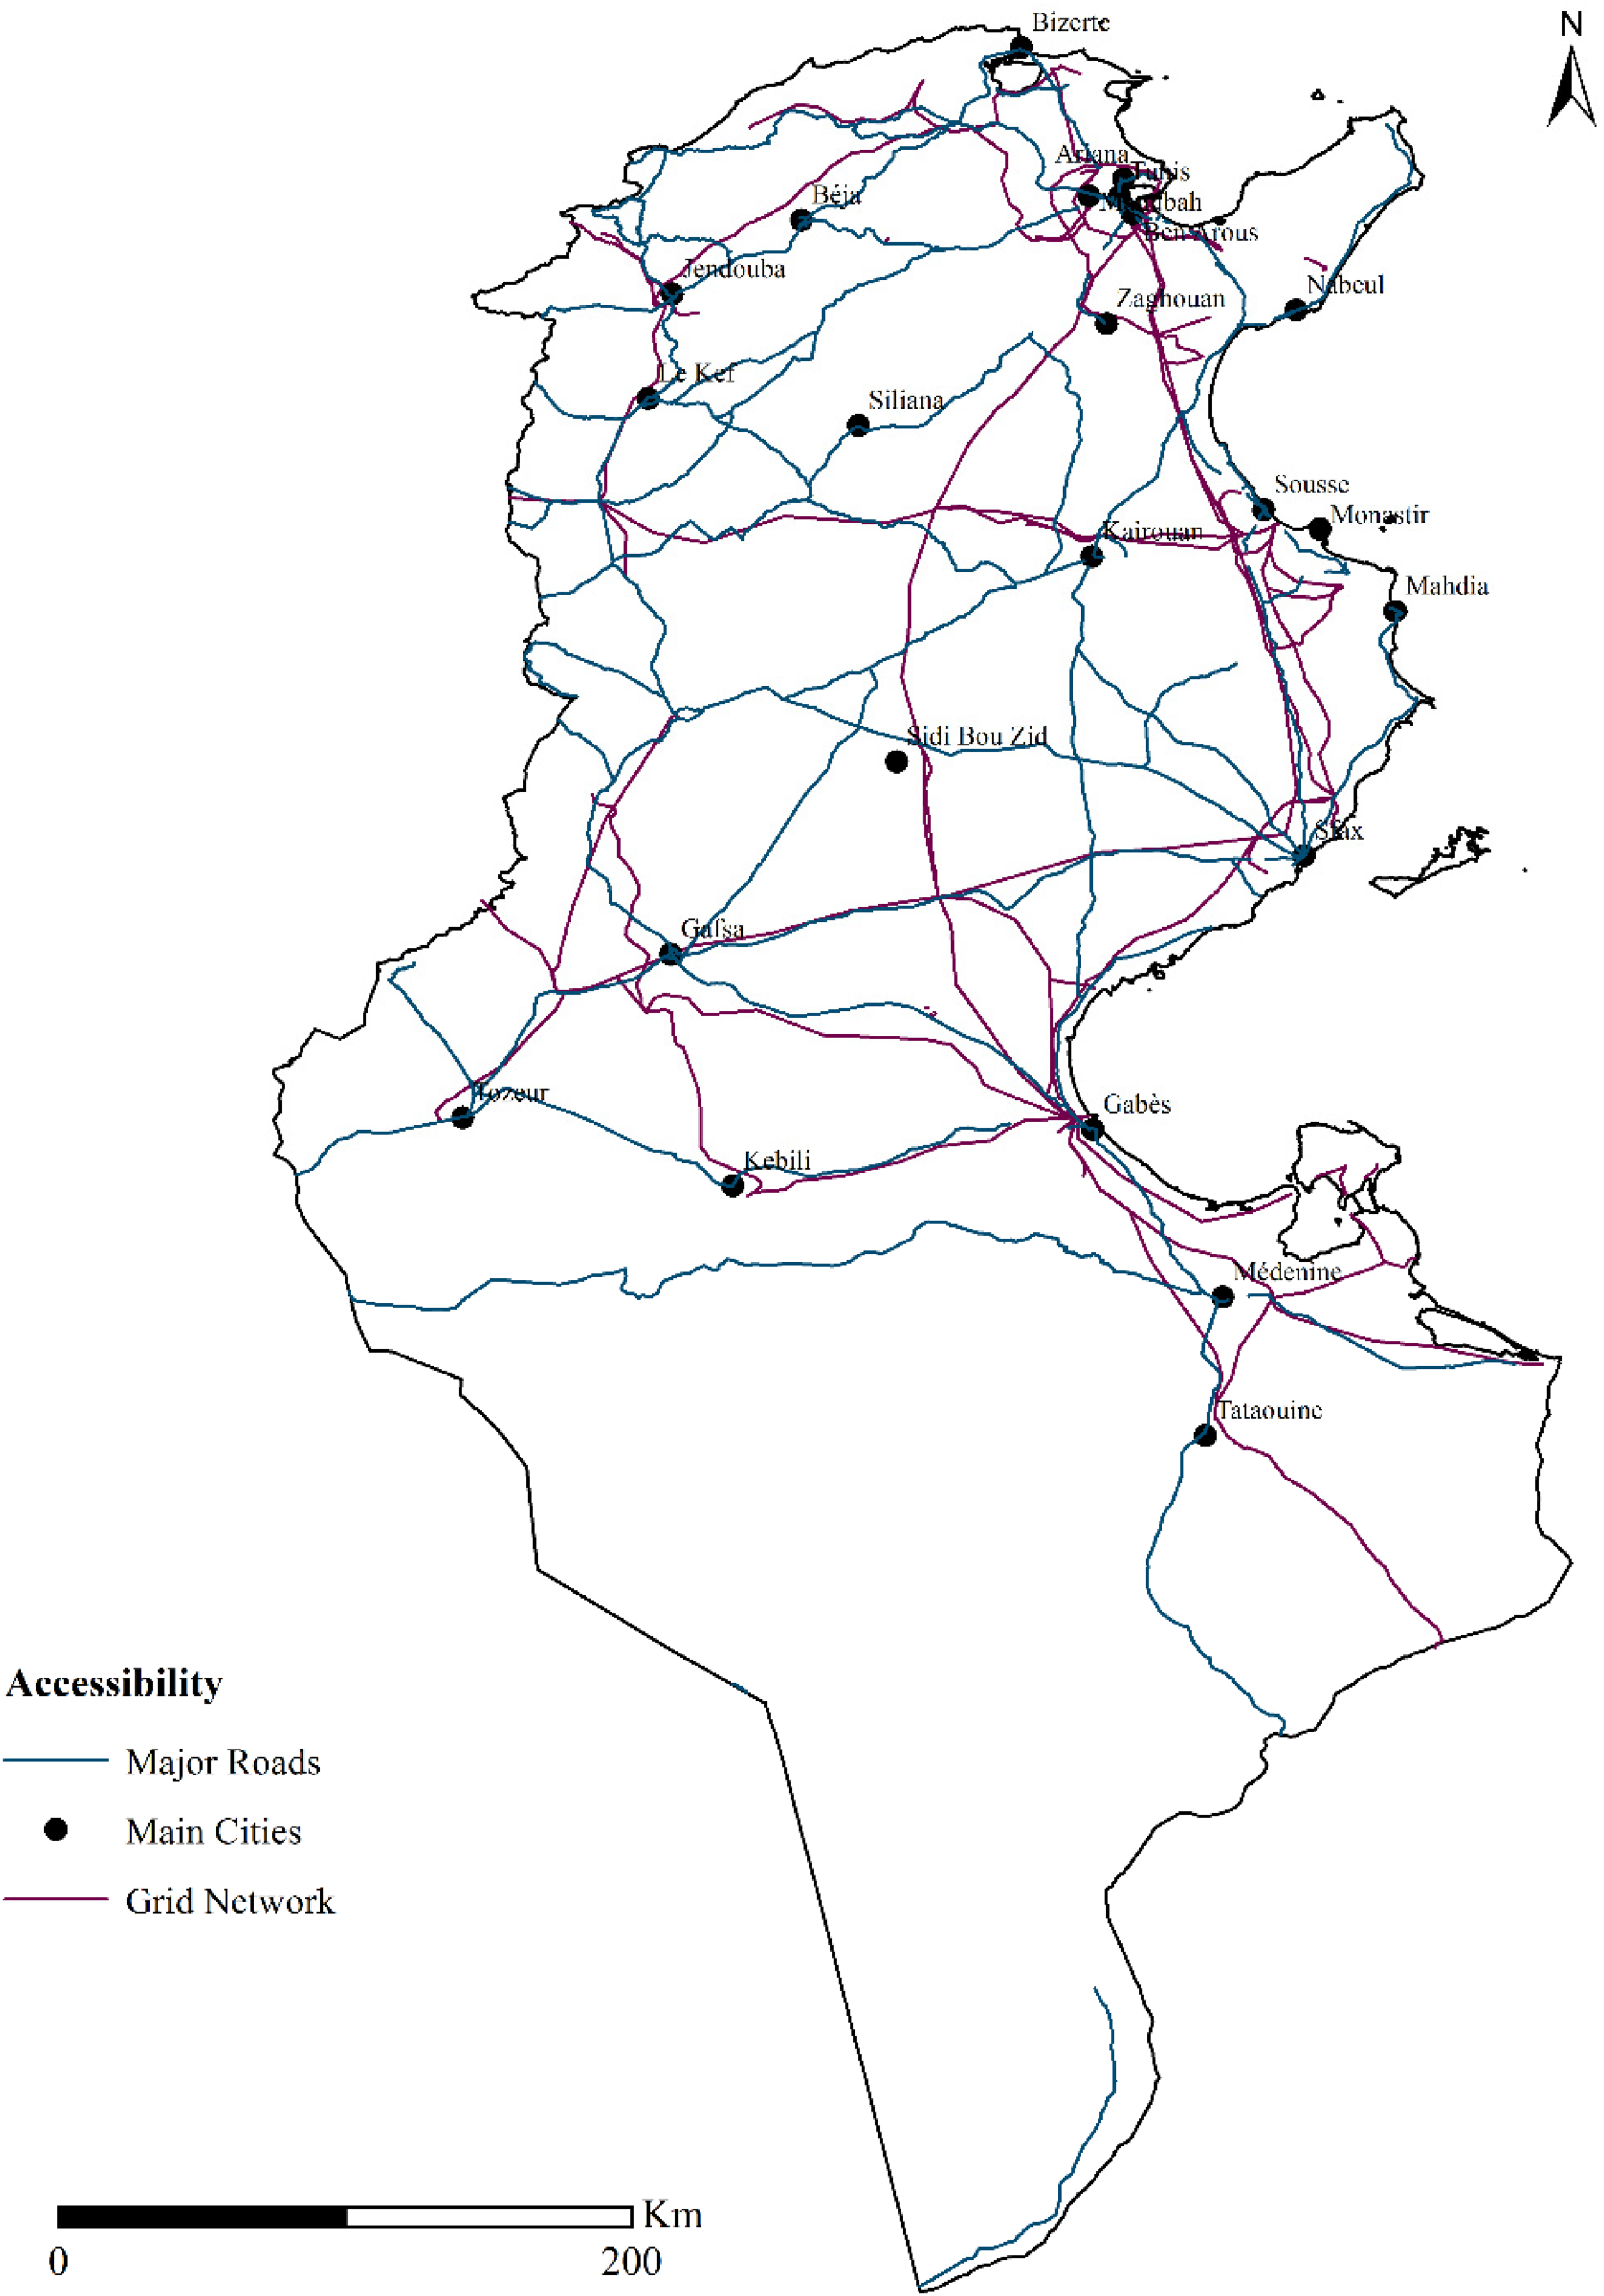
Accessibility factors.
The process of water electrolysis demonstrates exceptional efficiency in the production of high-grade hydrogen, boasting a purity level exceeding 99.99% (Ali et al., 2022). Prominently powered by sustainable energy resources and bearing non-existent operation costs, it emerges as one of the most competitive techniques for generating hydrogen. However, access to water might represent a potential hindrance within this method particularly with scarce water supplies. As solar-powered water electrolysis requires considerable quantities of purified water – roughly around 10–11 L/Kg H2 (Ali et al., 2022; Kumar et al., 2017; Messaoudi et al., 2019b; Taoufik and Fekri, 2023; Tleubergenova et al., 2023). The distribution of water resources in Tunisia is geographically disparate, as 60% of such resources are located in the northern region, while 18% and 22% are in the central and southern parts of the country (Gaaloul et al., 2018). Estimates place the total water resources of the country at around 4.8 billion cubic meters, with 2.7 billion coming from surface water sources and 2.1 billion from groundwater sources (Gaaloul et al., 2018; Mellah, 2018). Additionally, a significant proportion, around 66%, of Tunisia’s potential water resources are derived from large dams, hillside dams, open shallow wells, deep tube wells, and natural springs (Gaaloul et al., 2018). Although these sources are permanent, they are no longer sufficient, as the whole country experiences significant water scarcity (Chouchane et al., 2015). As a result, it is critical to have adequate water resources for solar-powered hydrogen facilities to ensure efficient operation, since these systems rely heavily on water, as stated by Messaoudi et al. (2024). The thematic map of water resources is shown in Figure 7.
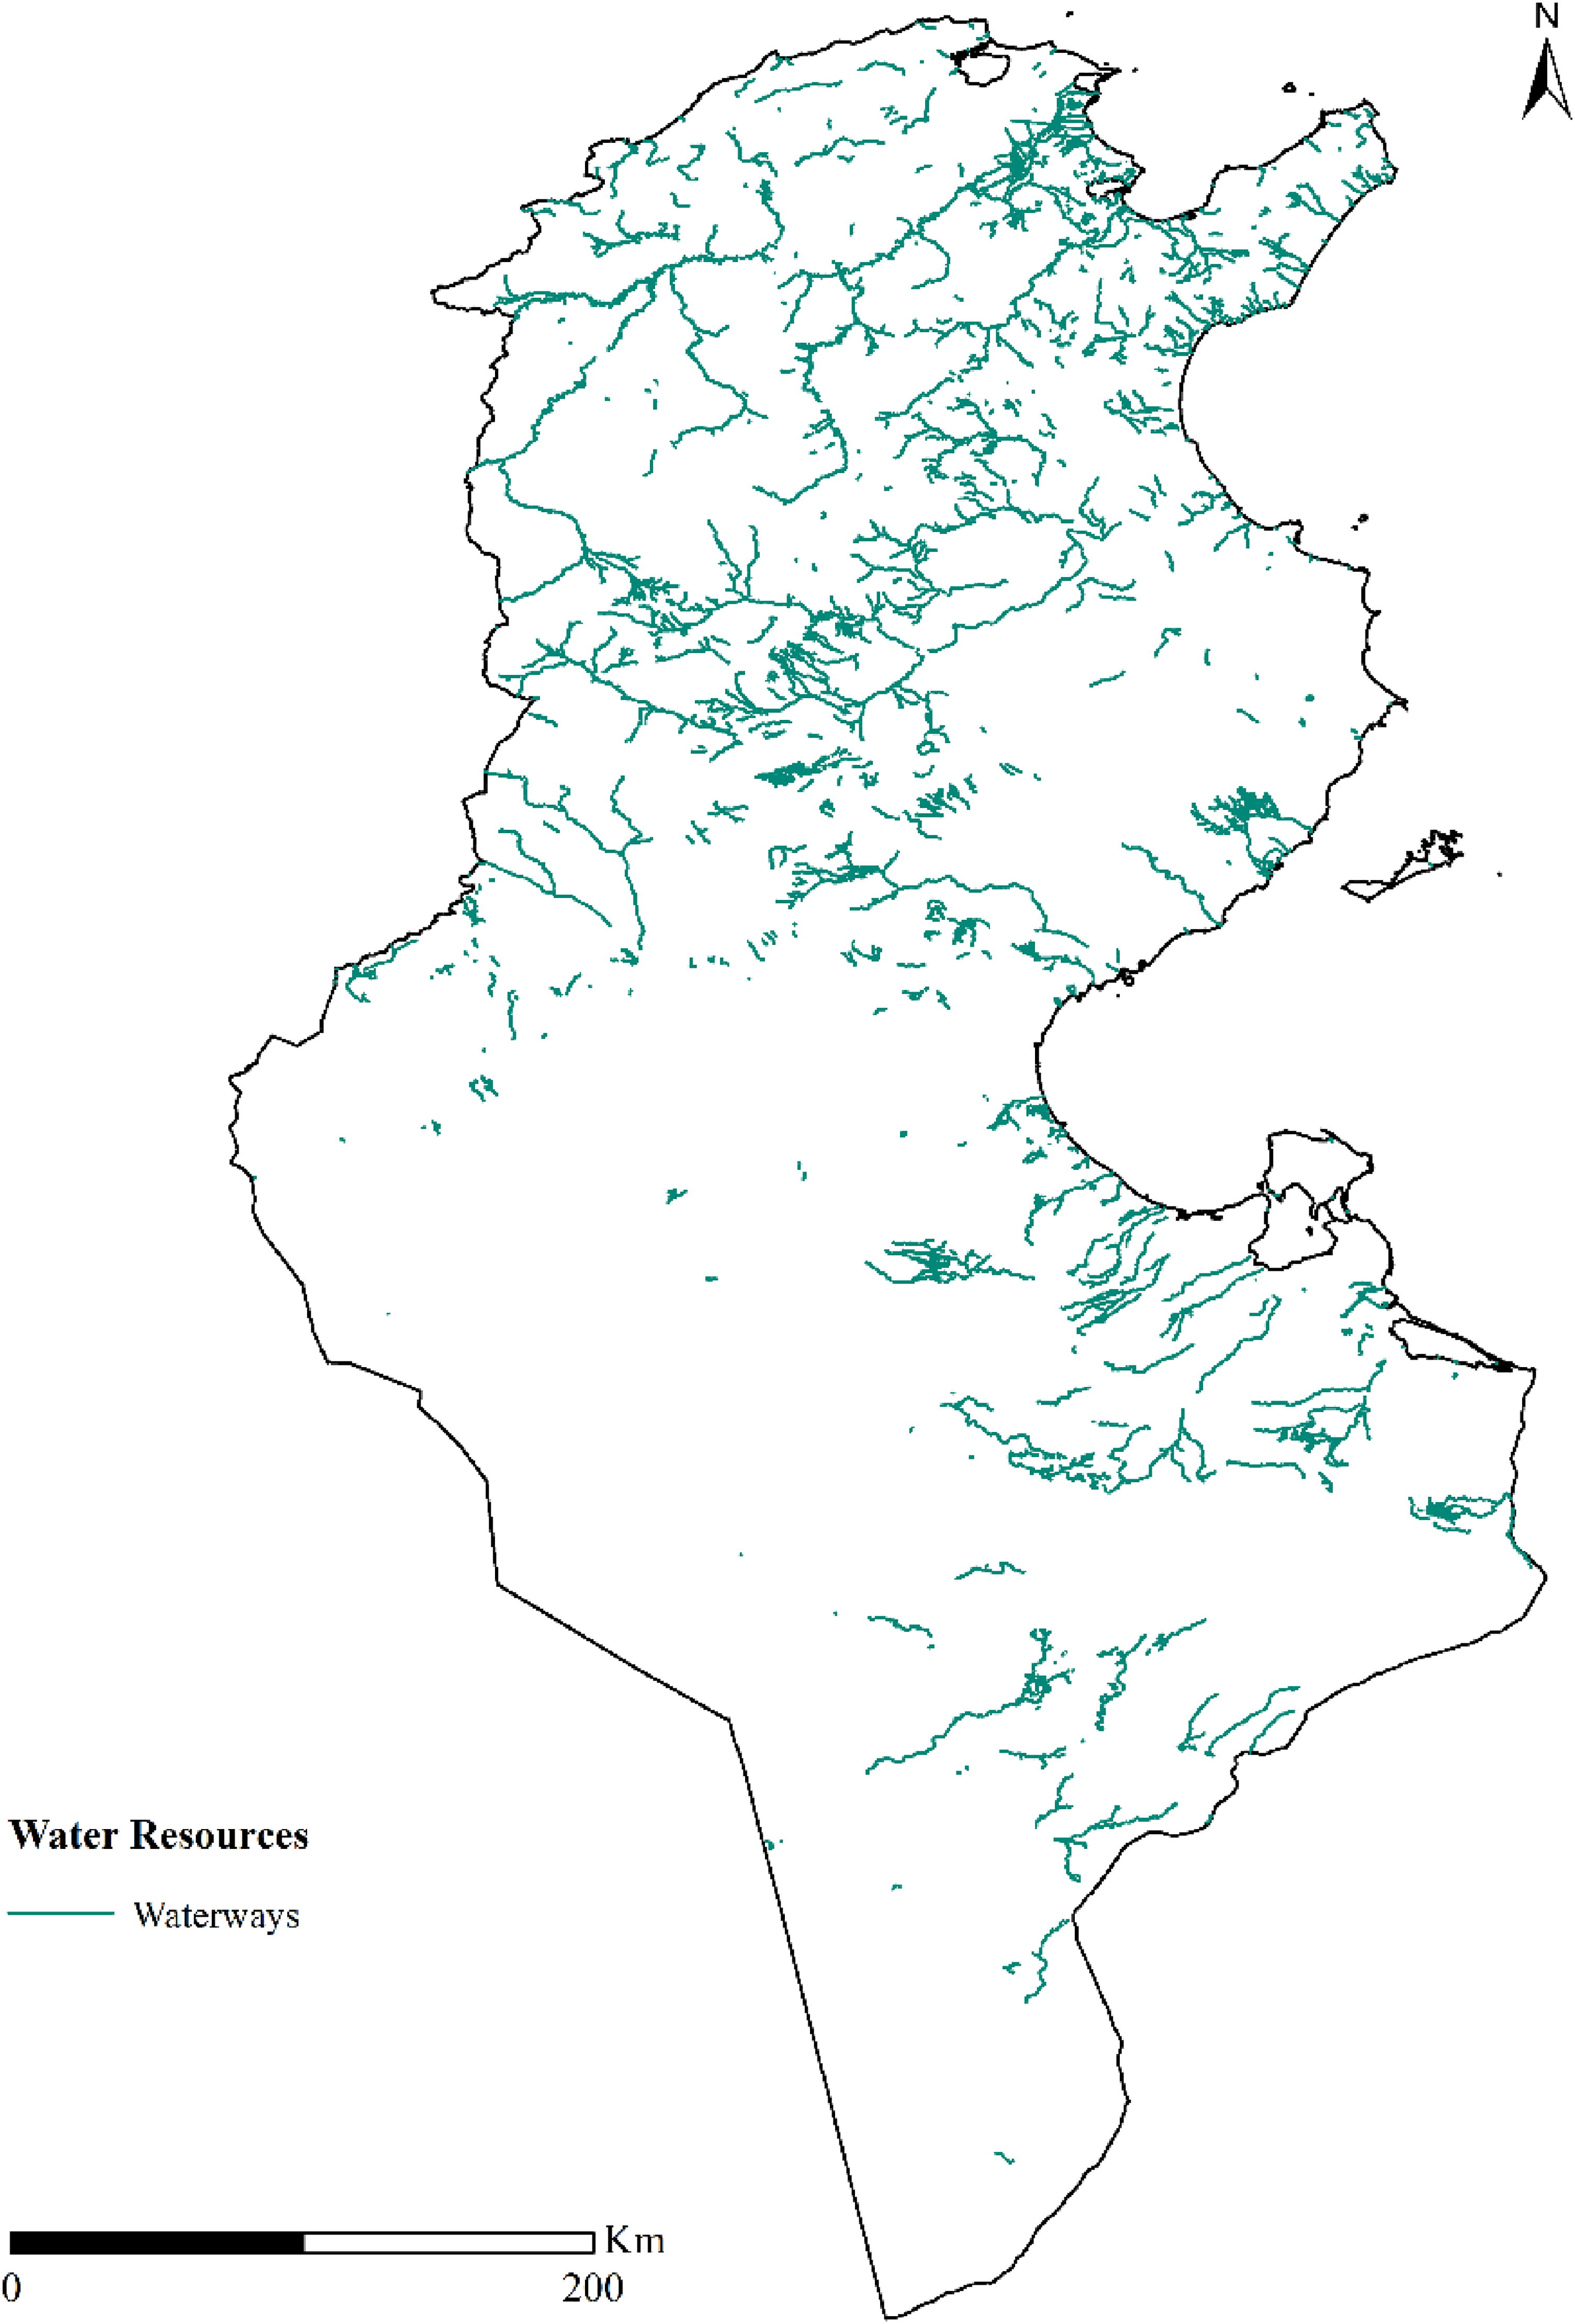
Water resources.
Furthermore, selecting a promising location for a hydrogen hotspot is subject to a variety of limitations associated with land use, which plays a critical role in the suitability analysis. This constraint is prevalent in all site selection processes across different contexts. However, due to land use restrictions, such as sand dunes, forests, mountains, water bodies, archaeological sites, or military zones, the construction of hydrogen projects may not be feasible despite favorable solar and wind resources (Ali et al., 2022; Messaoudi et al., 2019a; Taoufik and Fekri, 2023). Research suggests barren terrains and rangelands with sparse vegetation prove to be exceptional grounds for establishing renewable energy projects. Figure 8 represents the land use thematic map.
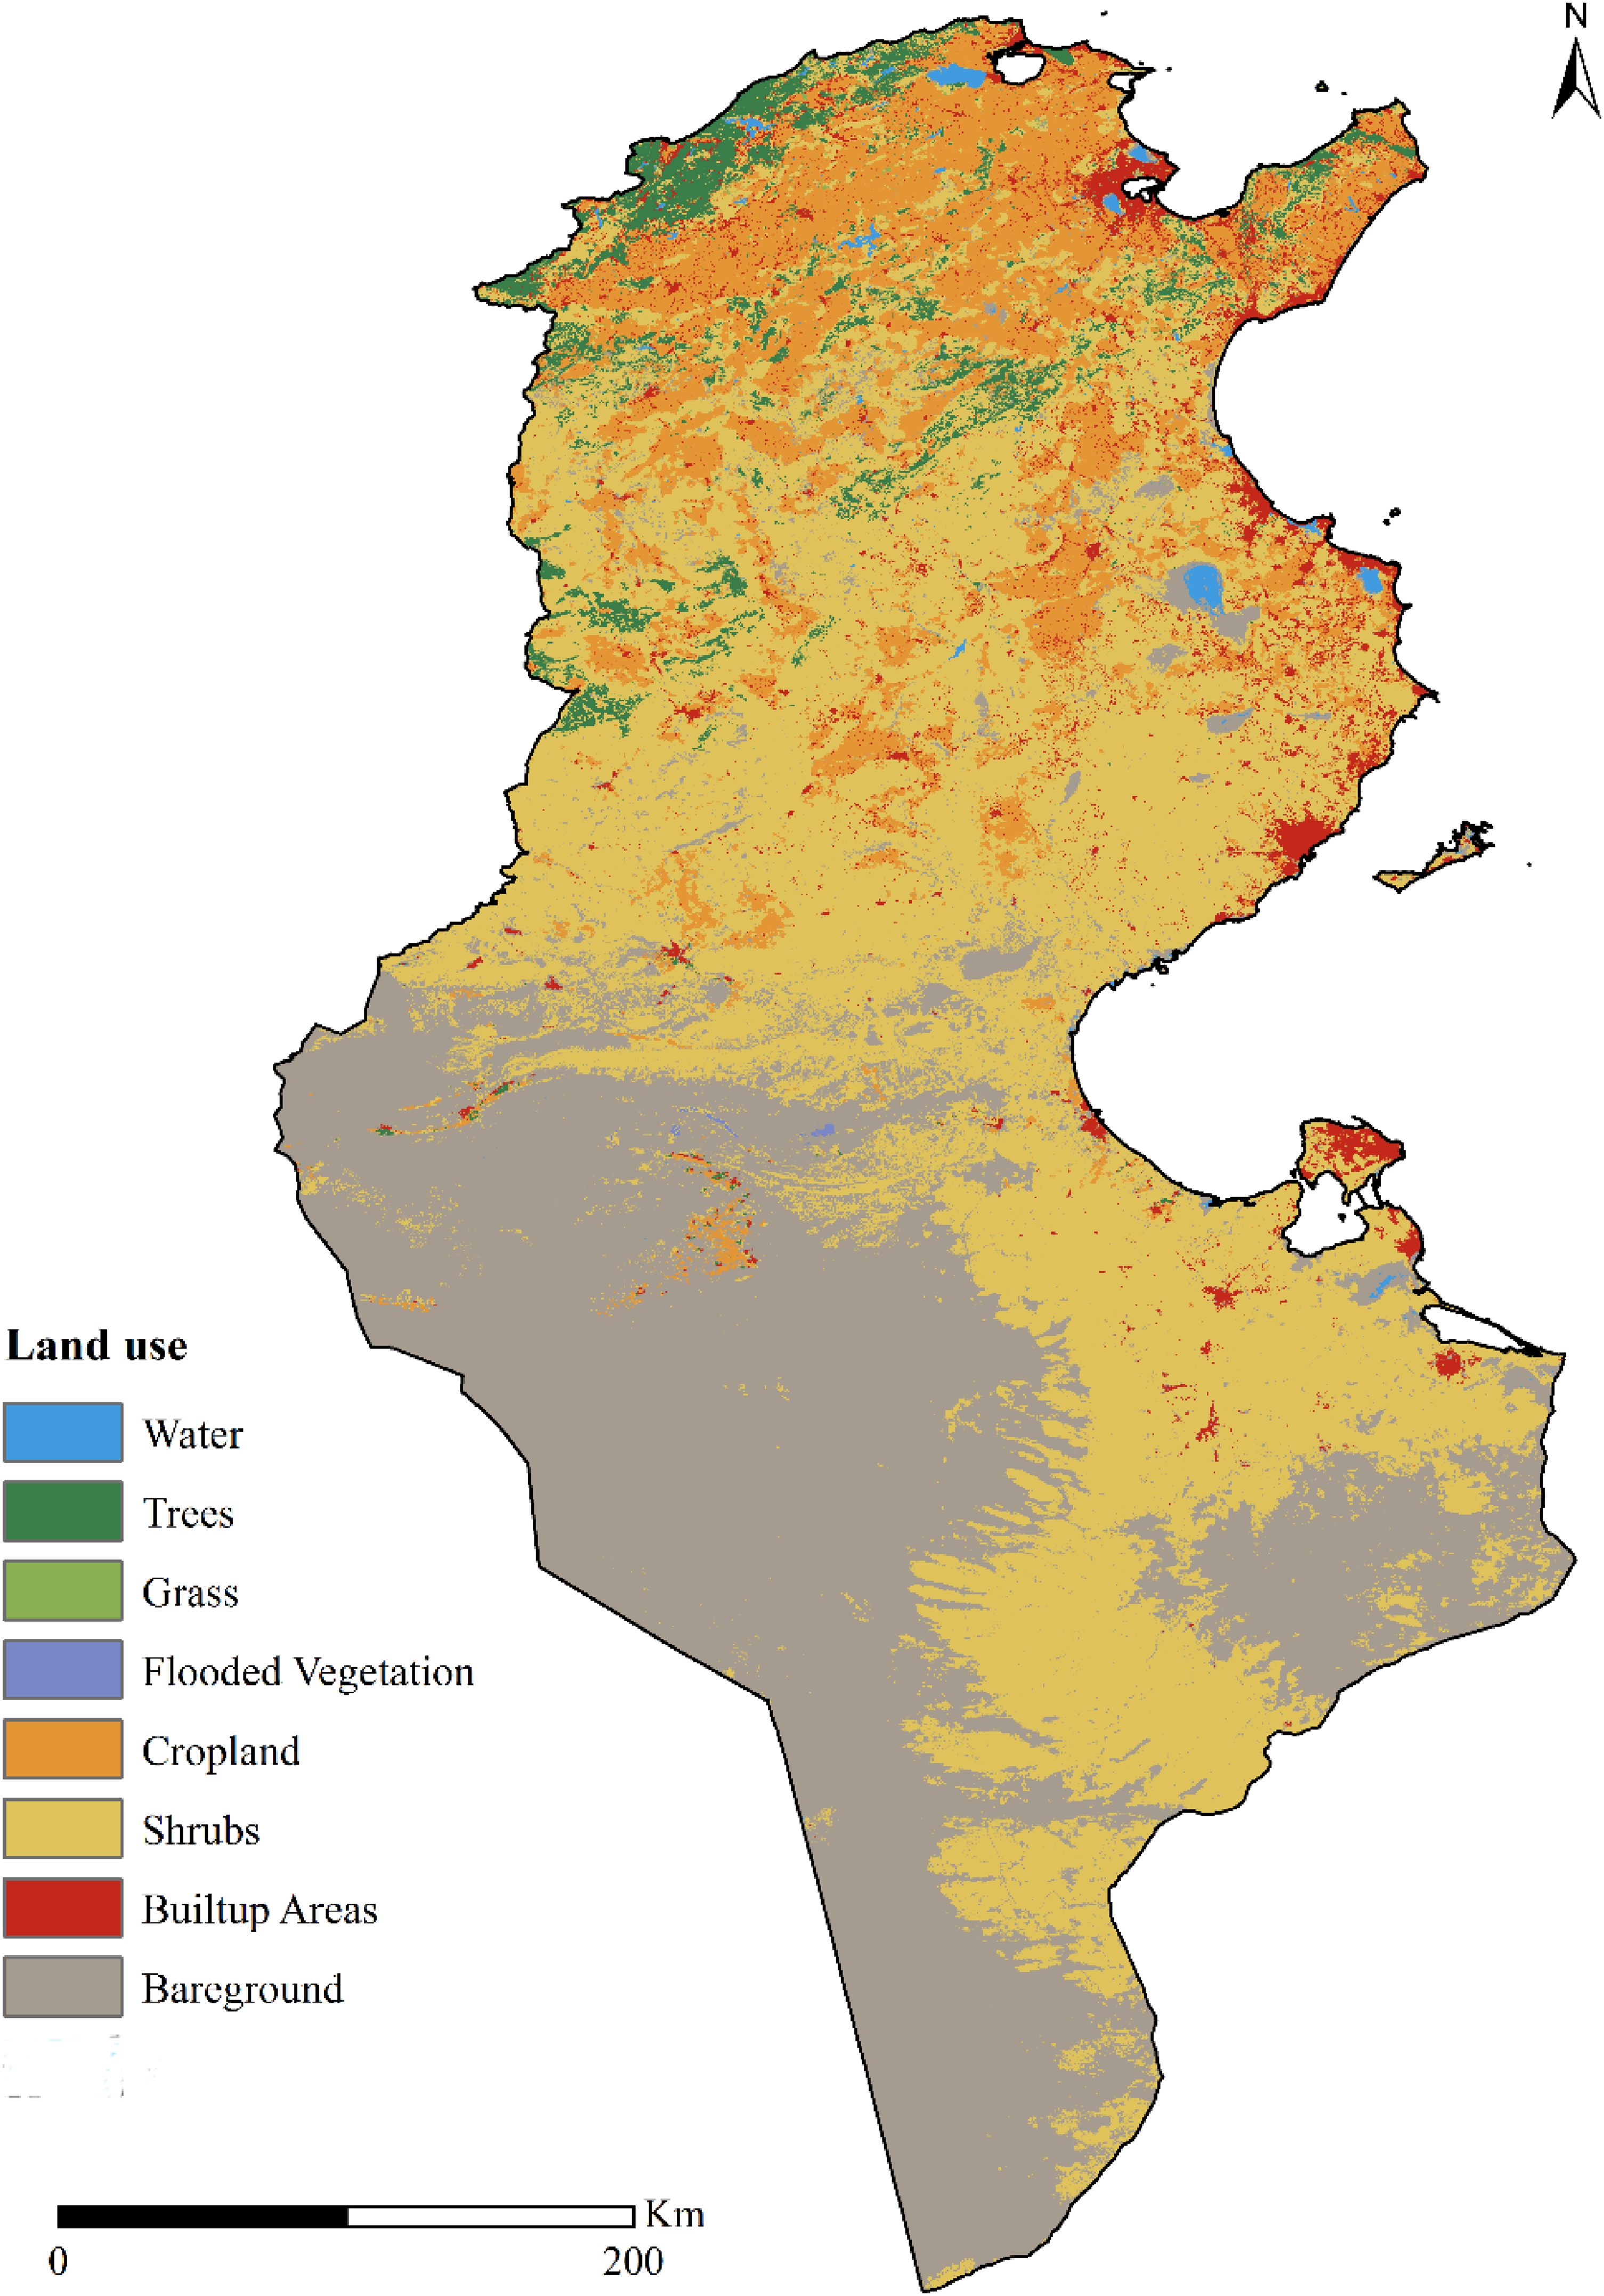
Land use types.
Results and discussion
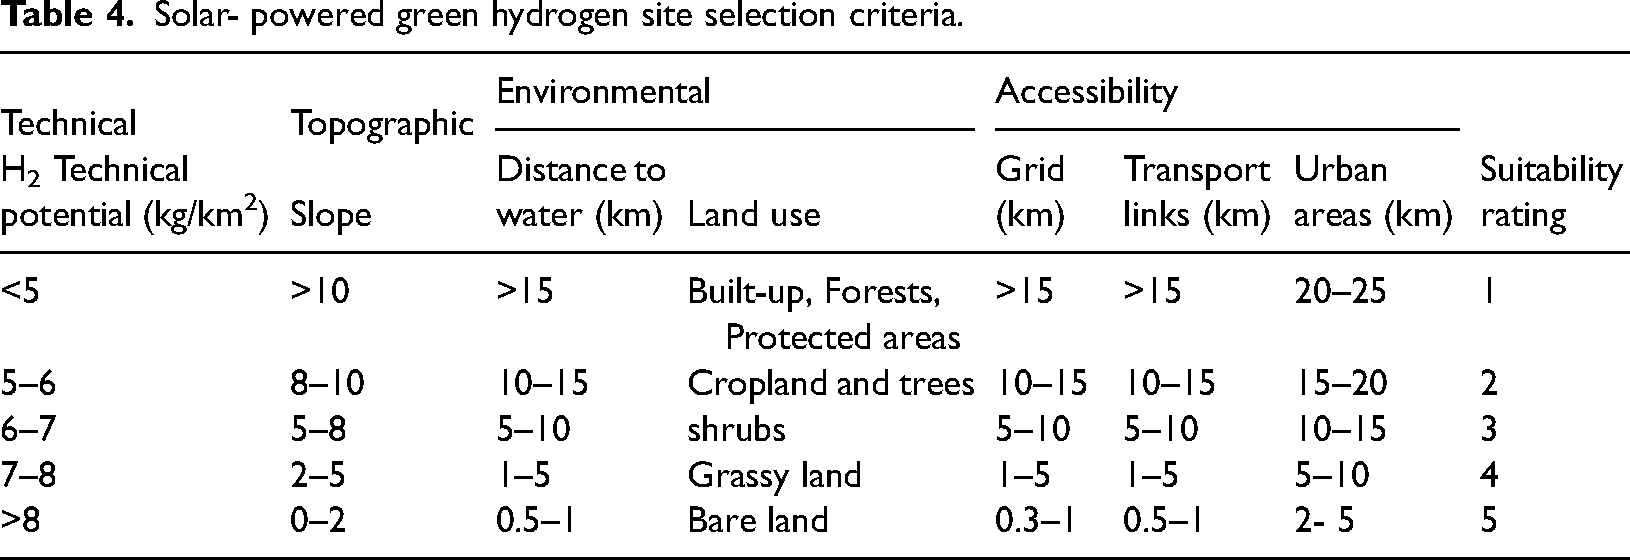
After discarding the restrictive constraints, we performed a spatial analysis to screen out the most promising sites for installing solar-powered green hydrogen systems in Tunisia. In order to execute this analysis, Spatial Analyst tools within ArcGis 10.8 were employed due to their proven effectiveness in addressing intricate site selection challenges. The various input layers were resampled, reclassified, and brought onto a common scale (see Table 4). Then, each layer was multiplied by its relative weight, which resulted in the AHP model. Lastly, the raster calculator tool was used to extract the final suitability map, as seen in Figure 9. This map was clustered into five distinct classes according to the pixel values, where class 5 denotes the most acceptable locations and class 1 represents the unsuitable ones.
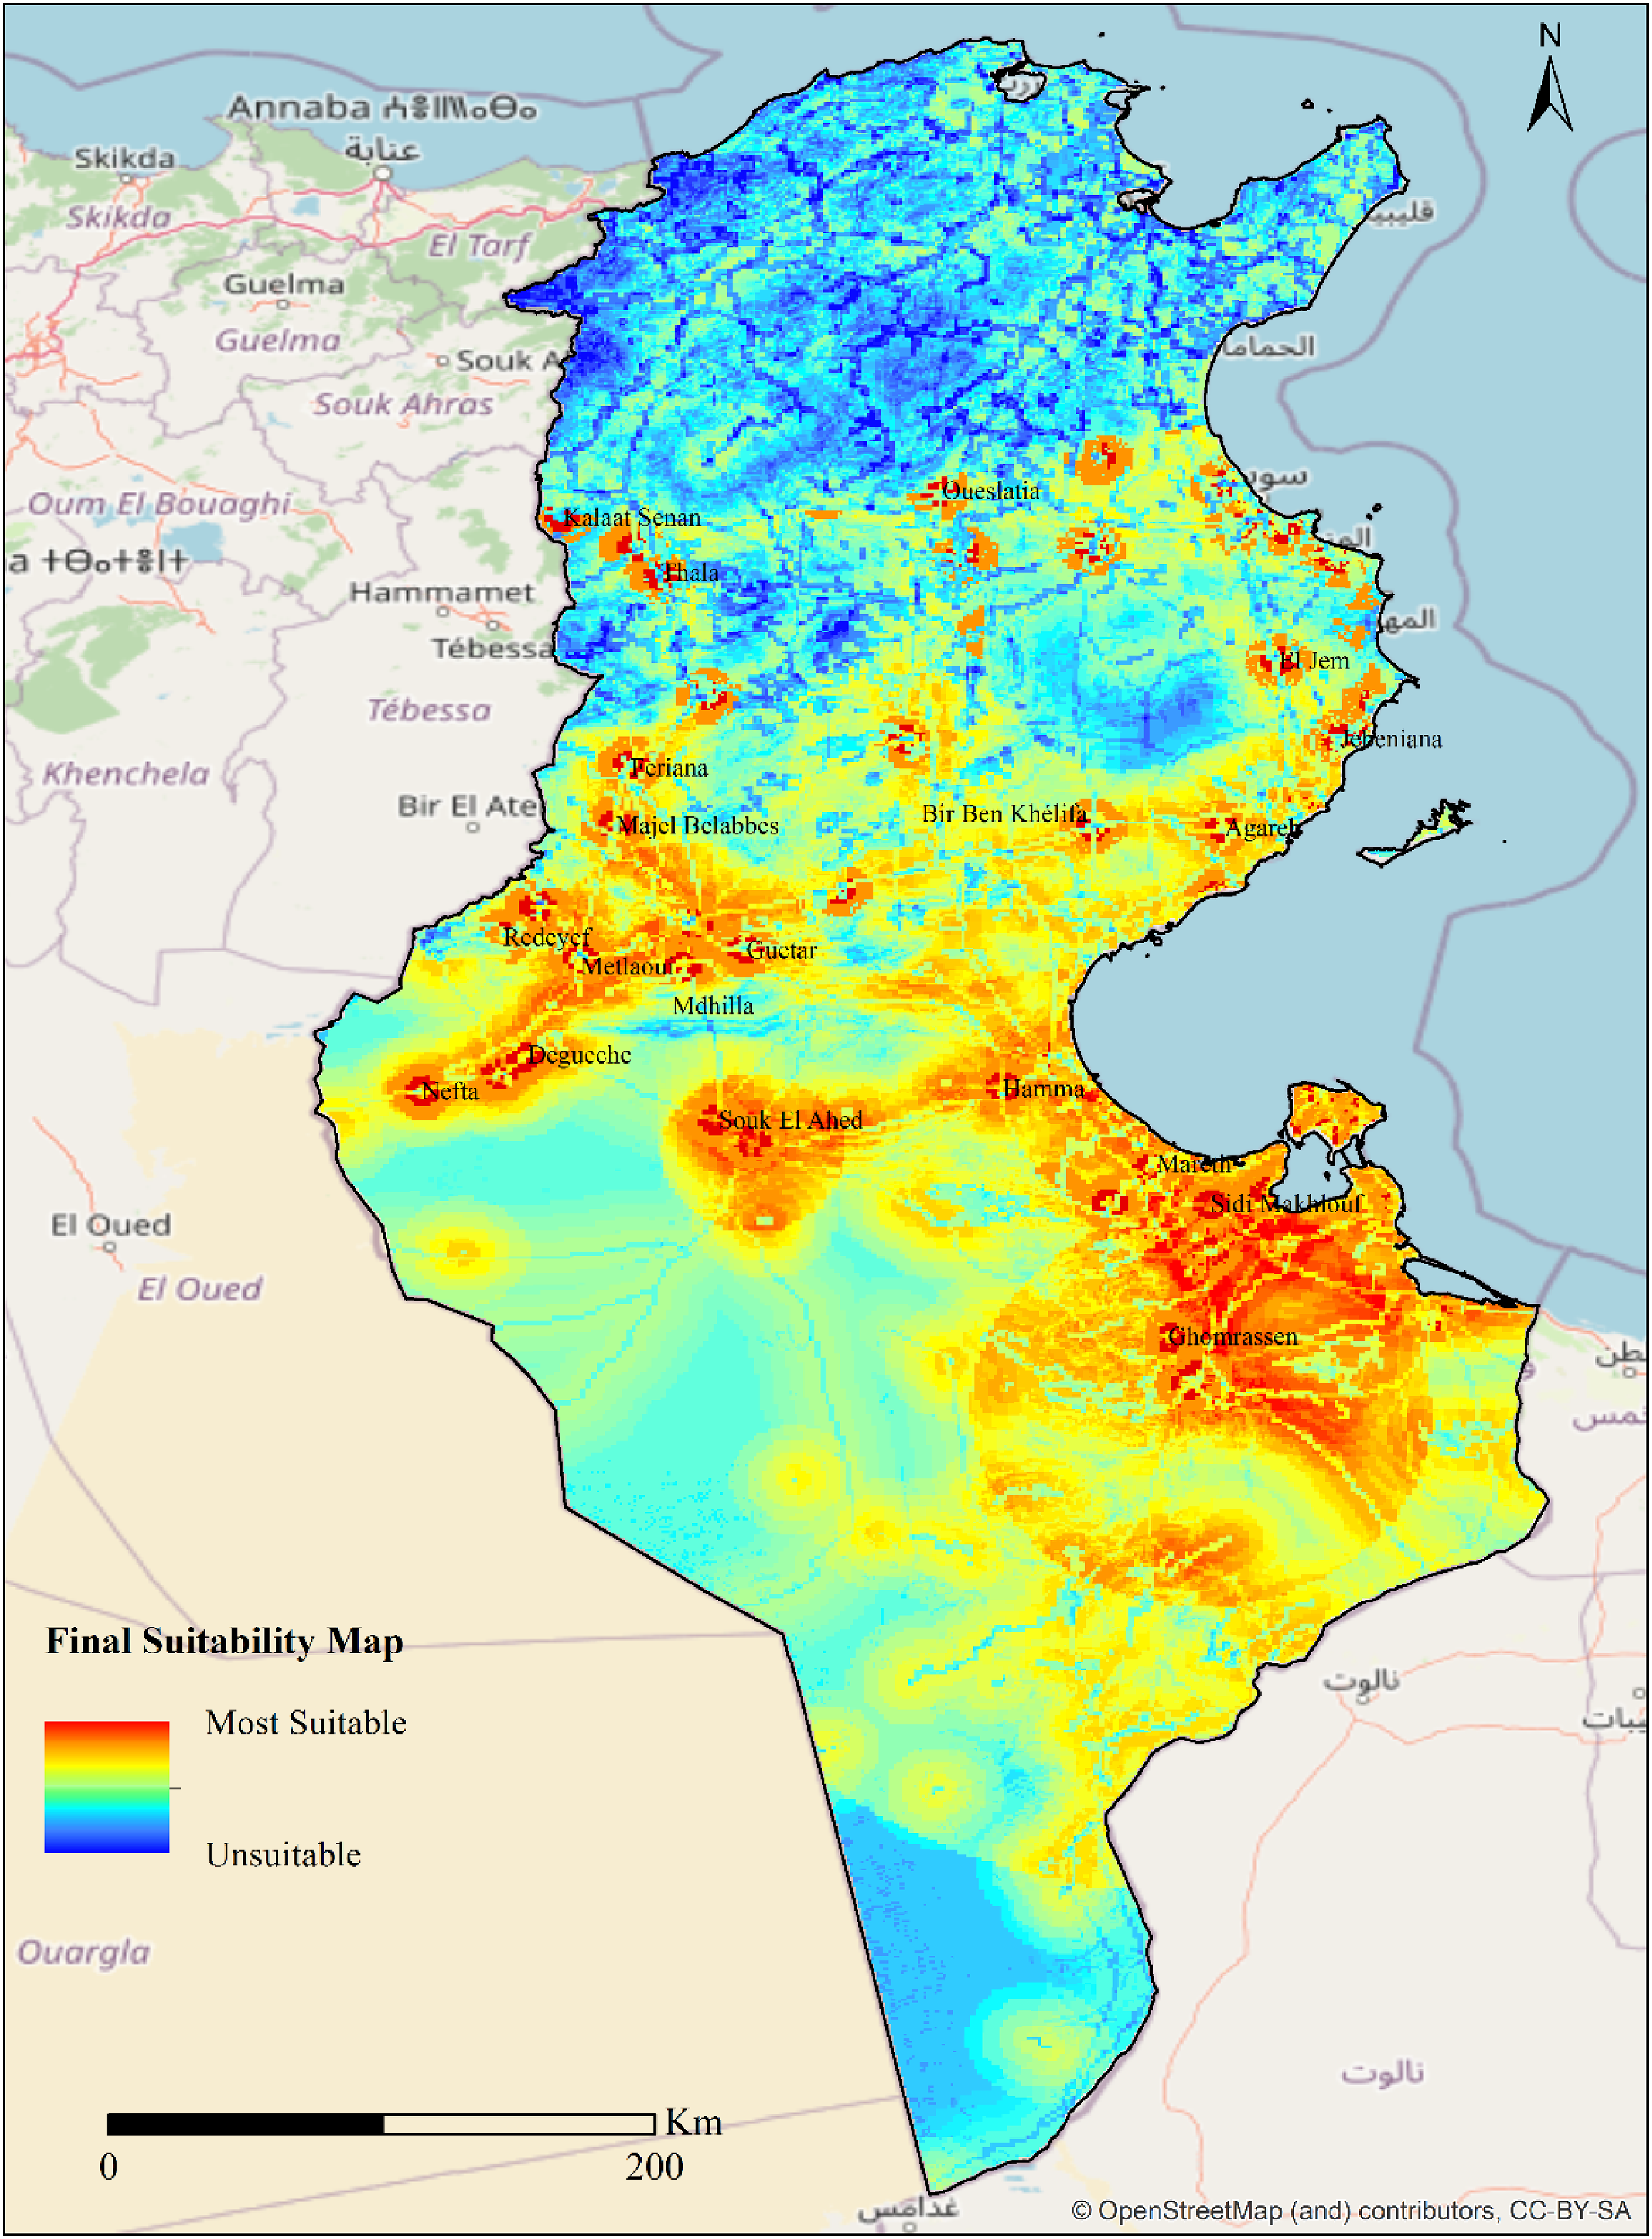
Solar-powered green hydrogen suitability map.
Solar- powered green hydrogen site selection criteria.
Pairwise comparisons
The AHP model highlighted the significant role of technical, topographic, and environmental factors in determining the most promising sites for solar-powered hydrogen systems, as illustrated in Table 5. Factors such as hydrogen generation potential, slope, and water resources were found to have a major impact on decision-making. With a relative weight of 34.4%, hydrogen production potential appeared to be the most significant criterion. This showed a direct correlation between increased resource availability and electricity generation capacity. Slope and water resource availability followed closely behind with relative weights of 18.4% and 16.7%, respectively, securing the second and third positions on the importance scale. The grid network was identified as another key factor, with a score of nearly 12%. Transport links and land use were yet significant factors, scoring similarly at approximately 7%. On the other hand, proximity to urban areas was considered least important, according to the experts’ view. For this reason, to avoid additional costs, it is imperative that these facilities be located in a flat or mild sloping area with ample water resources and the least proximity to transport networks and electricity grids.
Solar-powered hydrogen normalized pairwise comparison matrix and criteria weights.
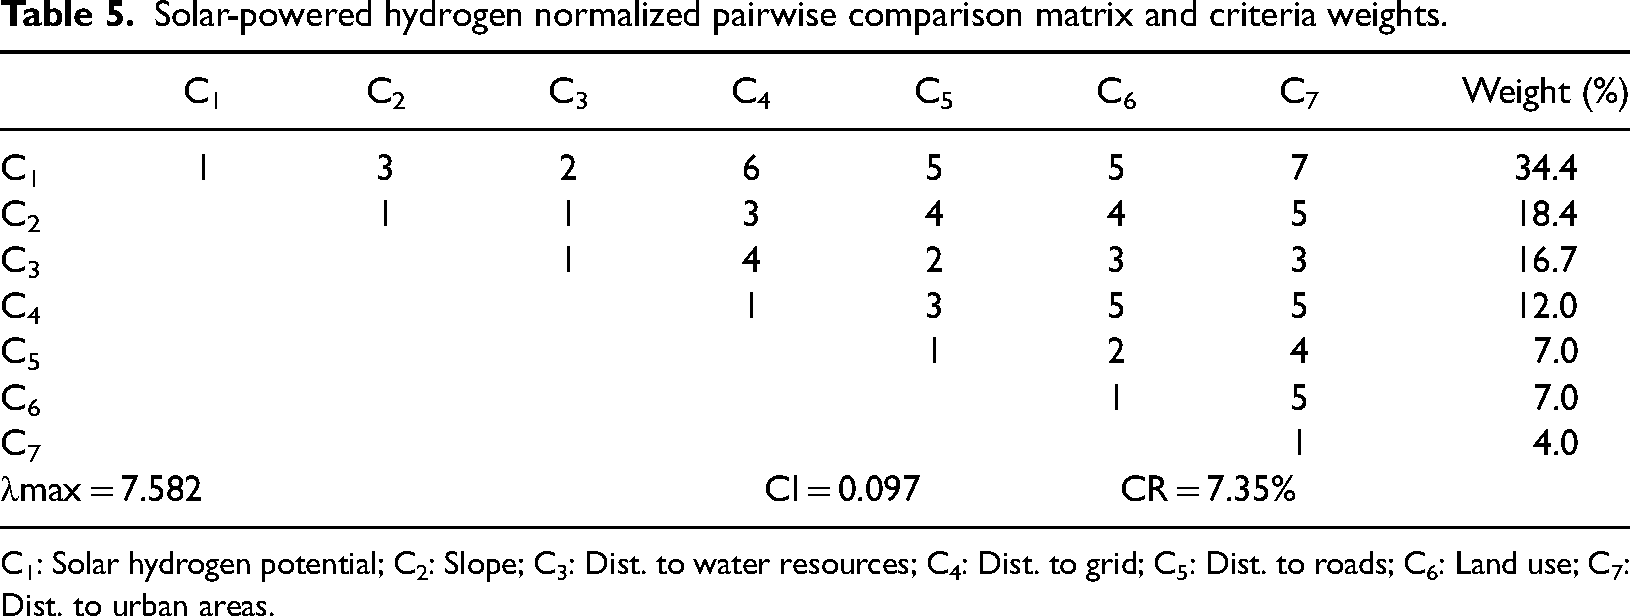
C1: Solar hydrogen potential; C2: Slope; C3: Dist. to water resources; C4: Dist. to grid; C5: Dist. to roads; C6: Land use; C7: Dist. to urban areas.
Spatial analysis
Potential sites
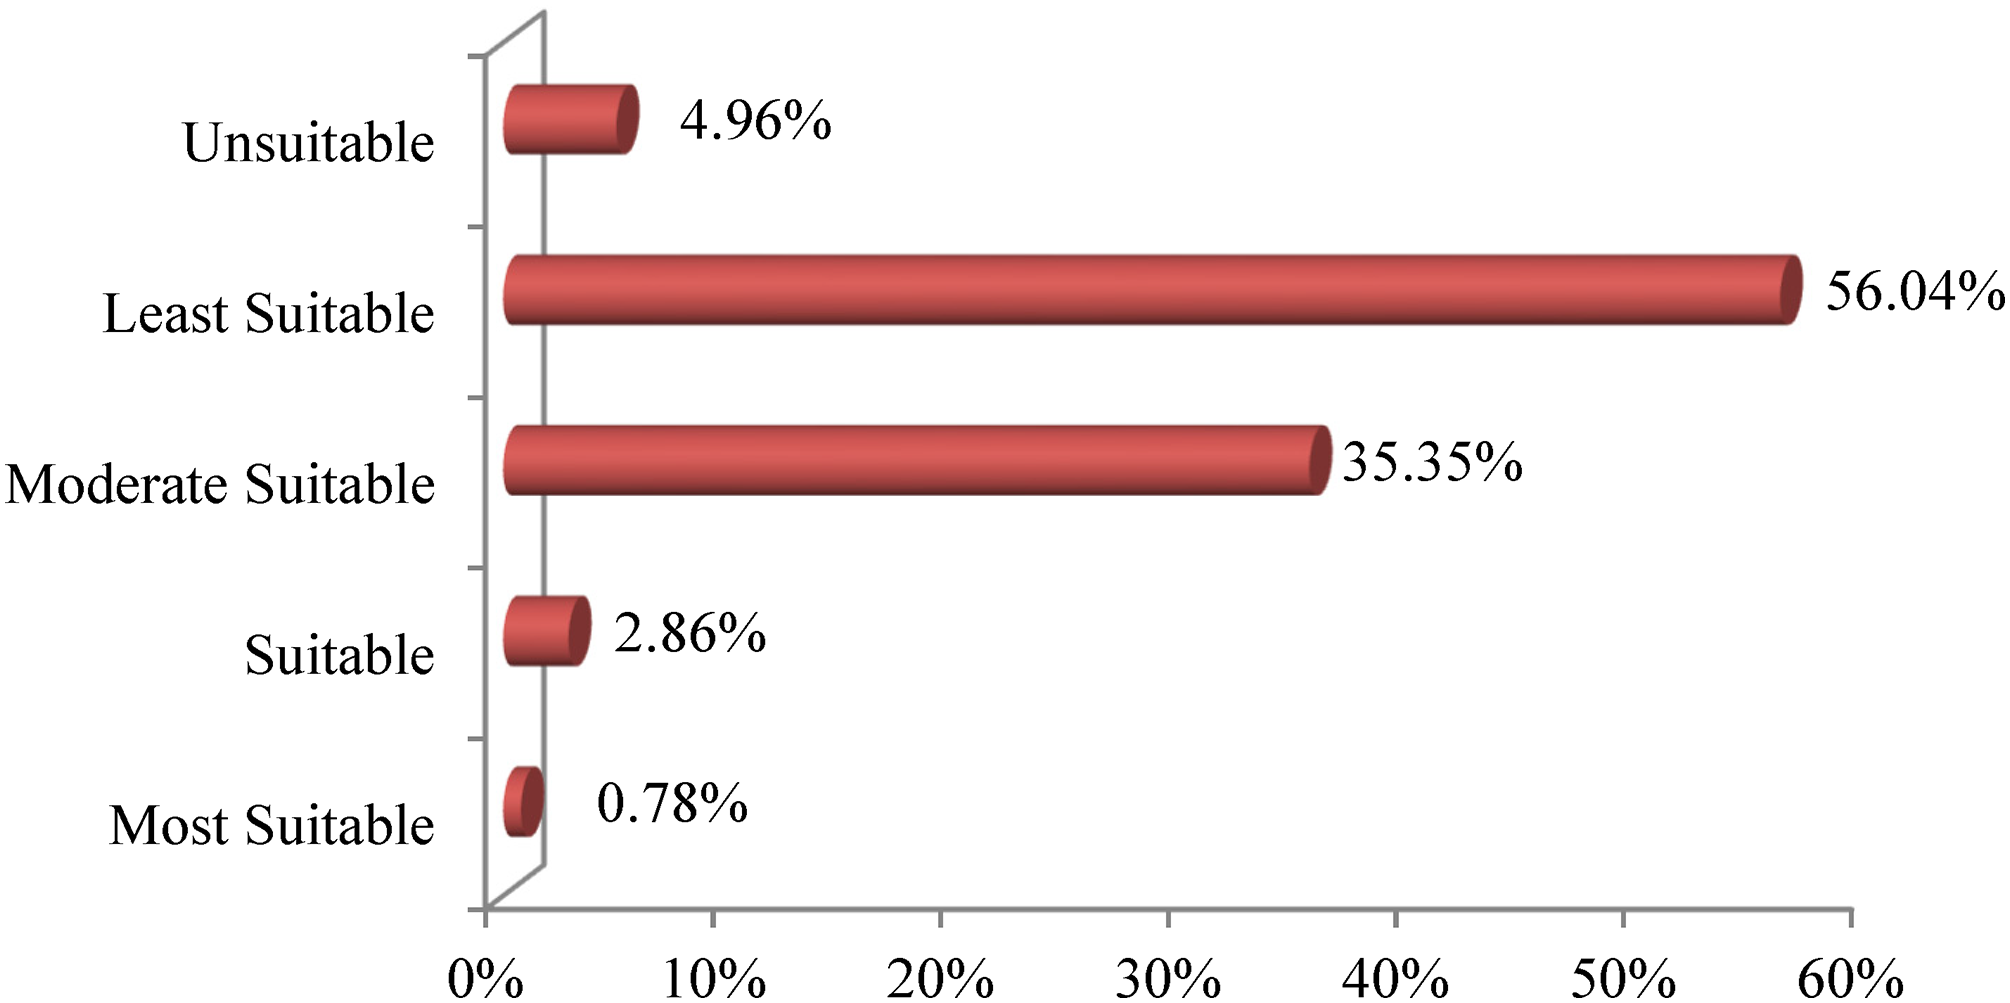
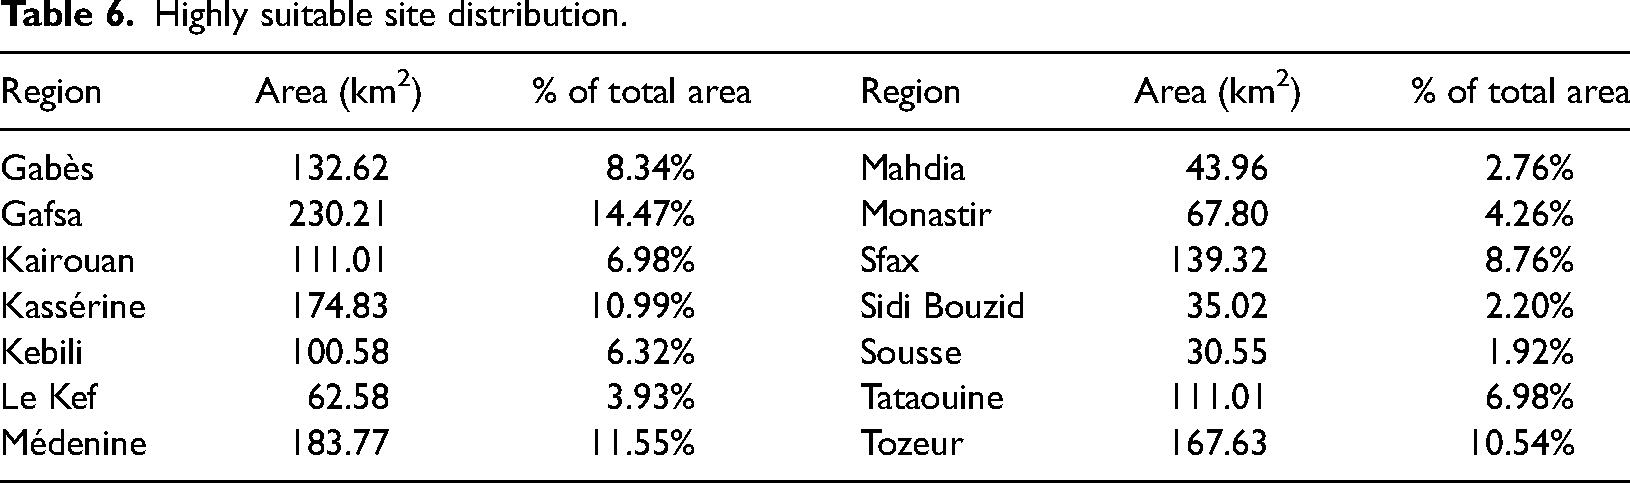
The ultimate suitability map (see Figure 9) indicates that the “highly suitable” category covered an area of 1591 km2 (0.78% of the entire surface area). The remaining areas are classified as “suitable,” “moderately suitable,” “least suitable,” and “unsuitable,” accounting for 2.86%, 35.35%, 56.04%, and 4.96%, respectively (see Figure 10). From this suitability map, it is evident that areas of high suitability are ubiquitous throughout fourteen regions of the country as shown in Table 6. This is owing to their favorable solar resources, mild slopes, and adequate transport and grid network infrastructure. Additionally, it has also been found that fewer spots were scattered across the northwest and eastern coasts of the study area. Hence, locations close to densely populated urban areas with well-developed grid and transport infrastructure, along with ample solar resources, have the potential to provide optimal performance for solar-powered hydrogen systems. Moreover, by improving the efficiency of grid networks and transport infrastructure, it would be possible to take advantage of the “suitable” locations, which cover an area of 5834 km2.
Land distribution for solar-powered green hydrogen.
Highly suitable site distribution.
Ranking of the most suitable sites
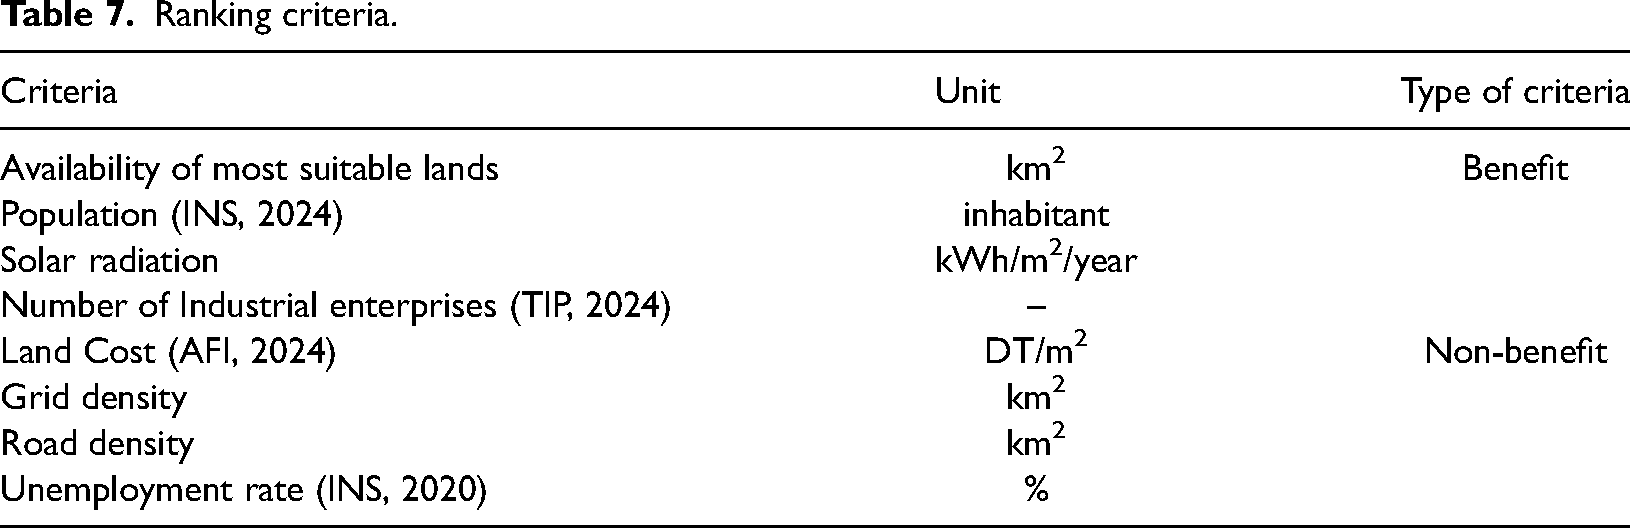
To rank the most suitable locations for solar-powered hydrogen systems identified in the GIS-AHP phase, ARAS, COPRAS, EDAS, and MOORA were employed, taking into account eight factors: availability of highly suitable land, population density, number of industrial enterprises, solar radiation, land cost, unemployment rate, and road and grid densities (see Table 7). To overcome the issue of decision-makers’ bias, which may influence the robustness of decisions, the Entropy weighting method was applied to assign weights to the ranking criteria. This technique was chosen because it effectively addresses complex decision-making problems, irrespective of the subjectivity of decision-makers (Yazdani et al., 2020; Zhu et al., 2020).
Ranking criteria.
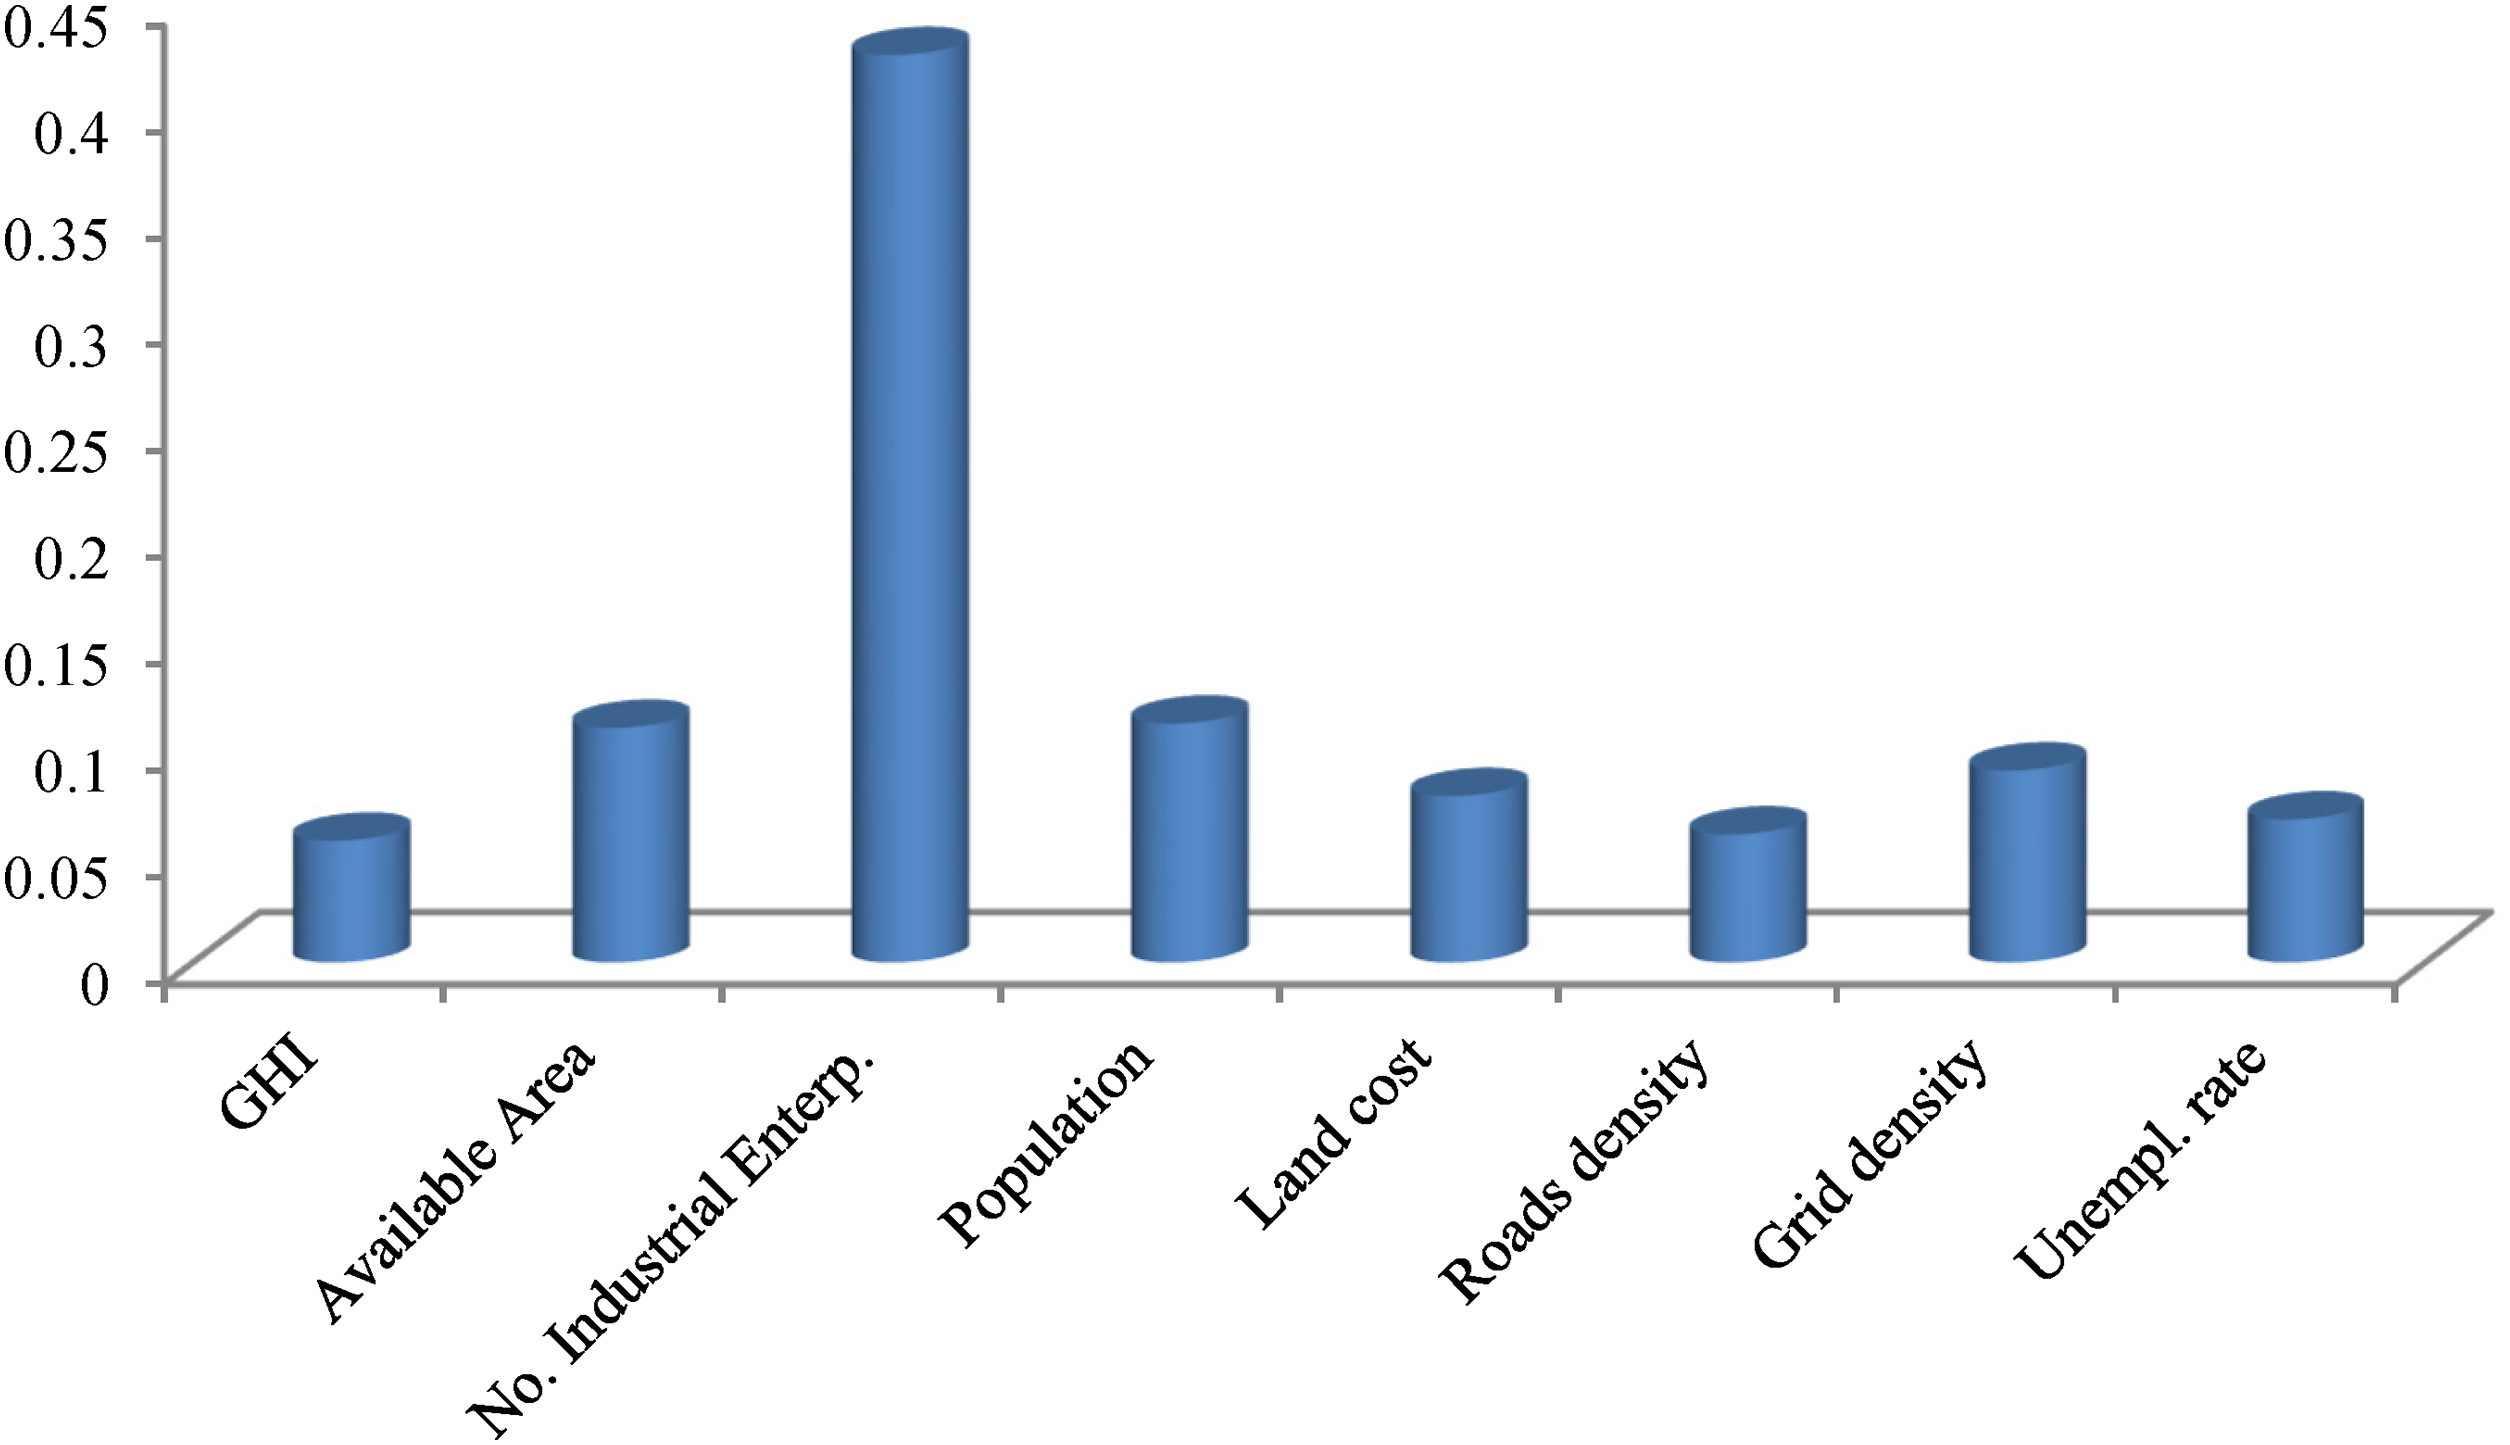
In Figure 11, the weights of the criteria are compared in a chart. These results reveal that “the number of industrial enterprises,” “population density,” and “availability of highly suitable land,” with respective weights of 0.426, 0.112, and 0.110, significantly influence the ranking of the most viable locations (see Table 8). By interpreting the weighting results in Figure 11, it can be deduced that these criteria play a crucial role in hydrogen site selection.
Ranking criteria weights using entropy.
Ranking criteria weights using the entropy method.
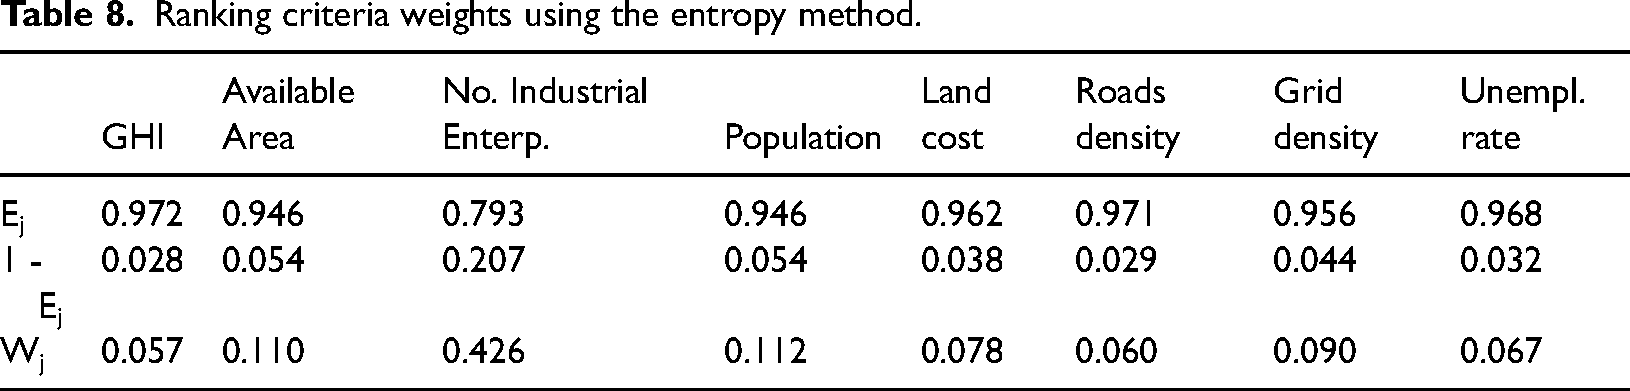
The presence of more industries signifies higher energy demand; therefore, renewable sources such as solar power emerge as an intelligent choice for sustainable energy supply to meet this need. Areas with high population density present a substantial consumer base for clean energy solutions like hydrogen. Moreover, having ample suitable land ensures enough space for setting up solar panels and hydrogen production facilities. Thus, it is evident from these findings that such criteria carry significant importance in determining optimal locations for hydrogen sites.
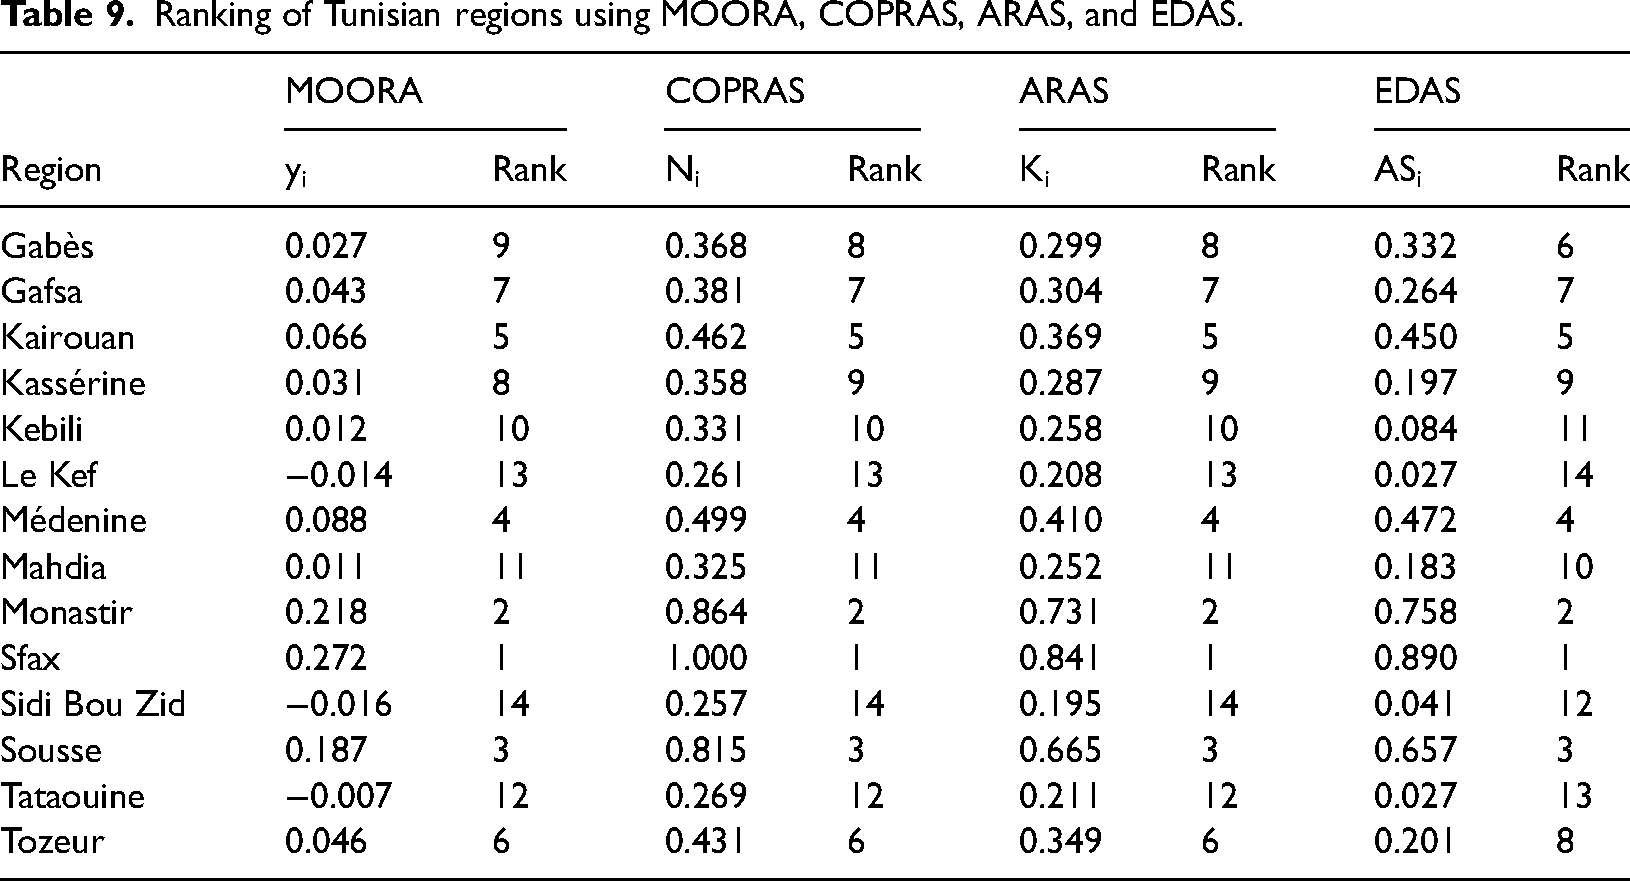
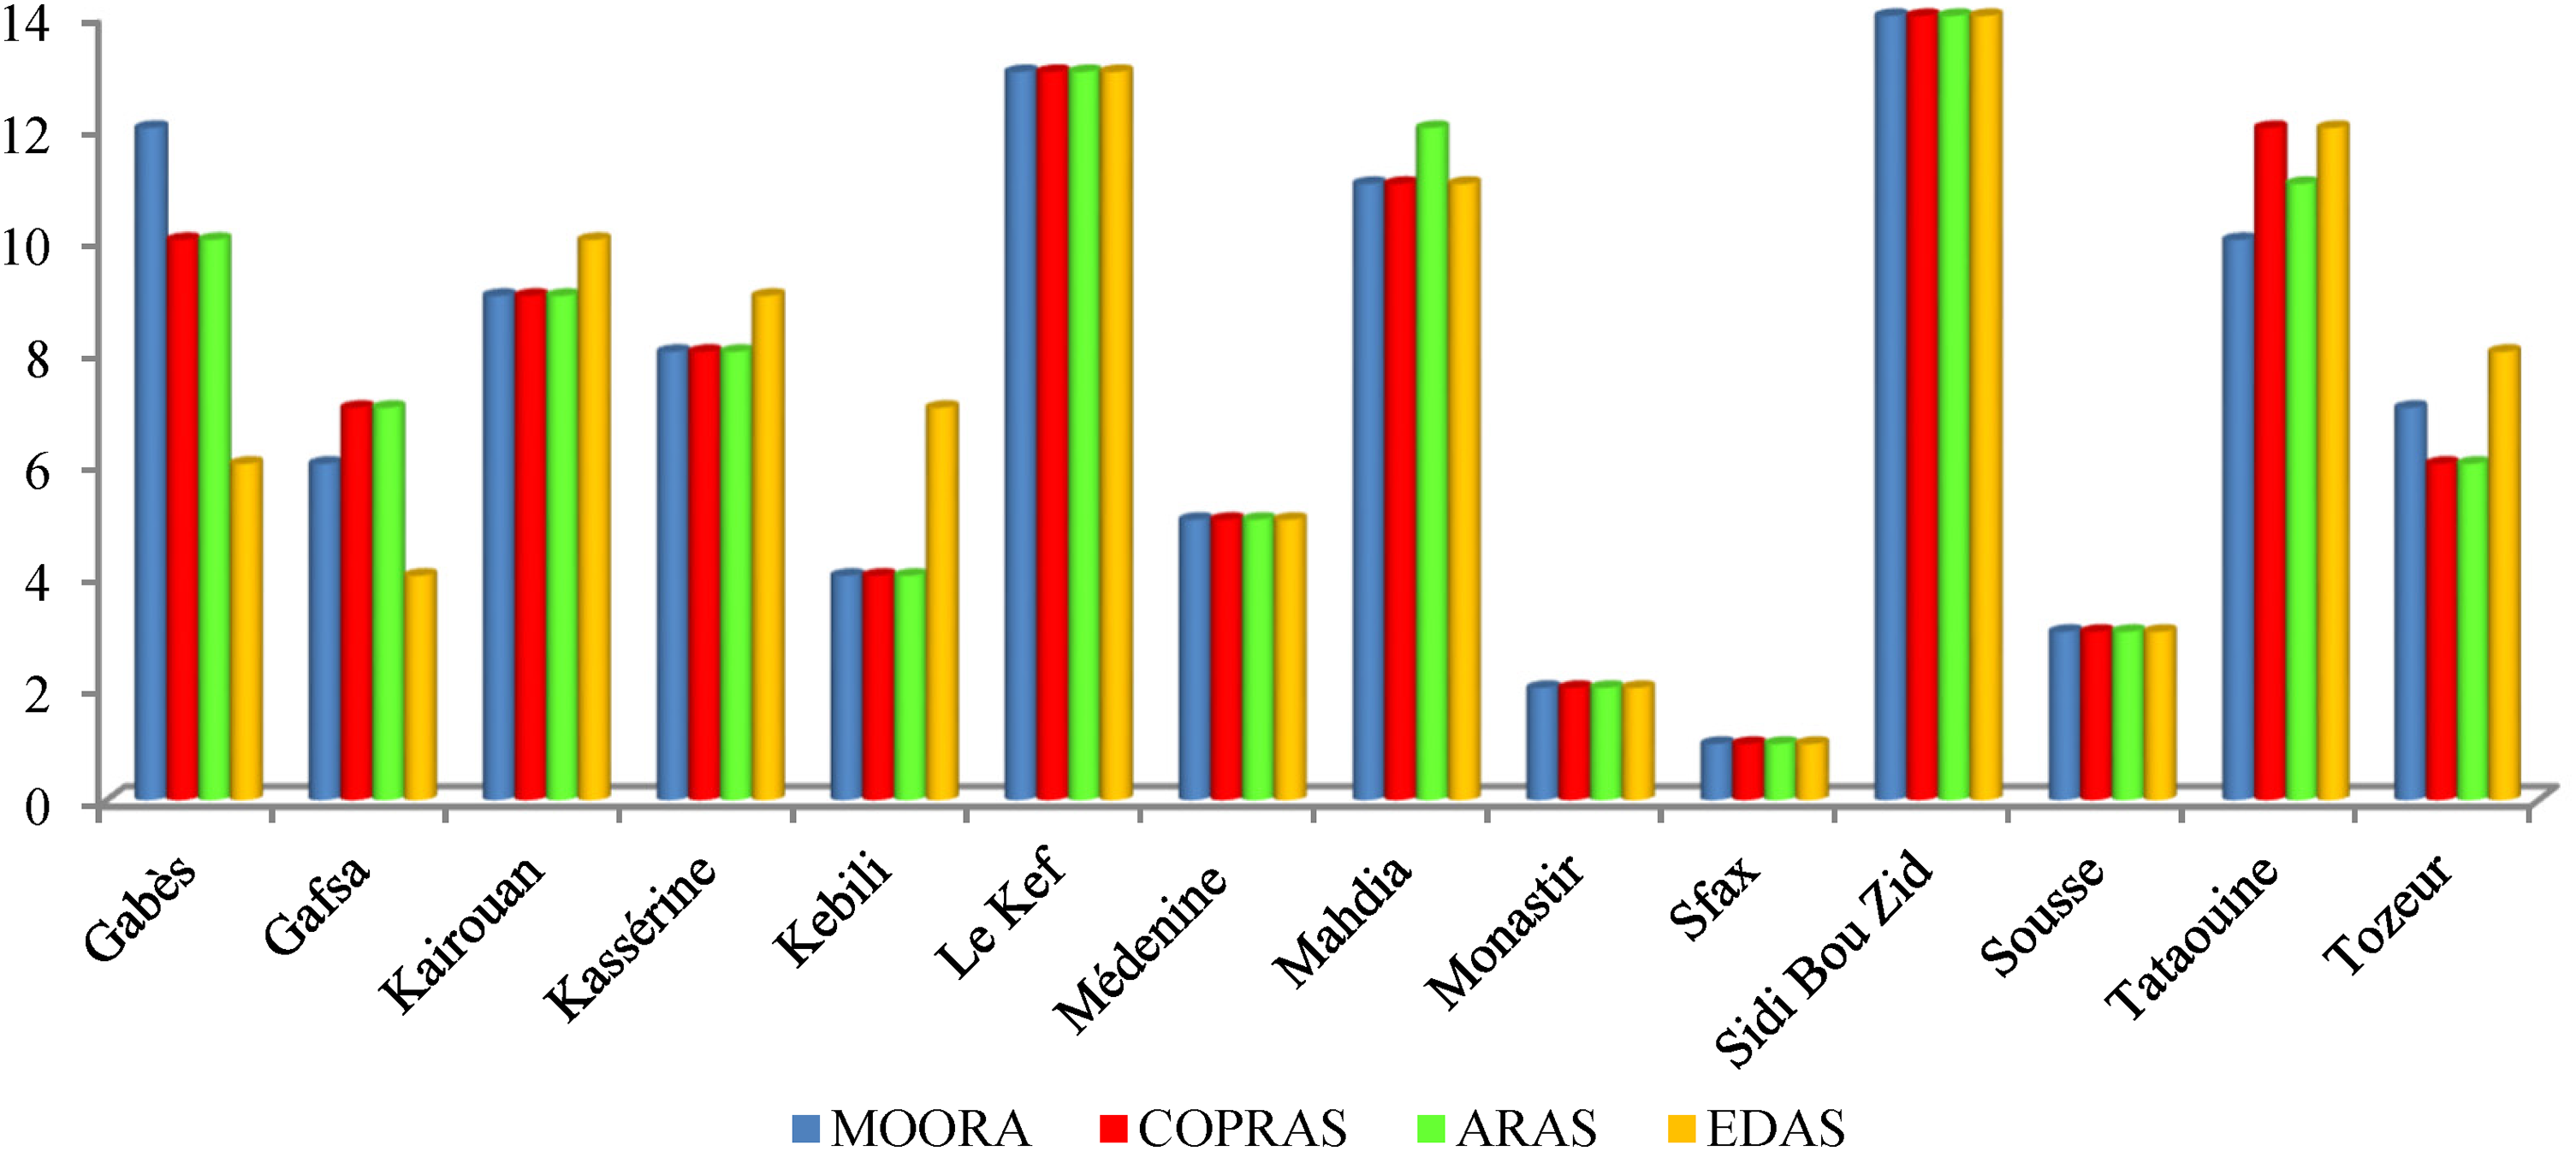
Table 9 presents a comparison of the ranking of Tunisian regions in terms of suitability for solar-based hydrogen production as assessed by ARAS, COPRAS, EDAS, and MOORA (See Tables A1–E2 in Appendices A–E). From the table, it is evident that Sfax, Monastir, and Sousse (eastern coast) are consistently identified as the most suitable regions across all the MCDM methods. Conversely, Le Kef, Sidi Bouzid, and Tataouine emerge as the least suitable regions for solar-powered hydrogen production. Figure 12 illustrates a graphical comparison of the rankings obtained for Tunisian regions under each method regarding solar-based hydrogen production. The graph demonstrates minimal divergence among the rankings produced by the four methods. For instance, Gabès holds sixth place based on rank from EDAS but occupies eighth position according to both COPRAS and ARAS methodologies. Tozeur is a region that secures the sixth spot using ARAS, COPRAS, and MOORA but lags back to eighth with EDAS assessments.
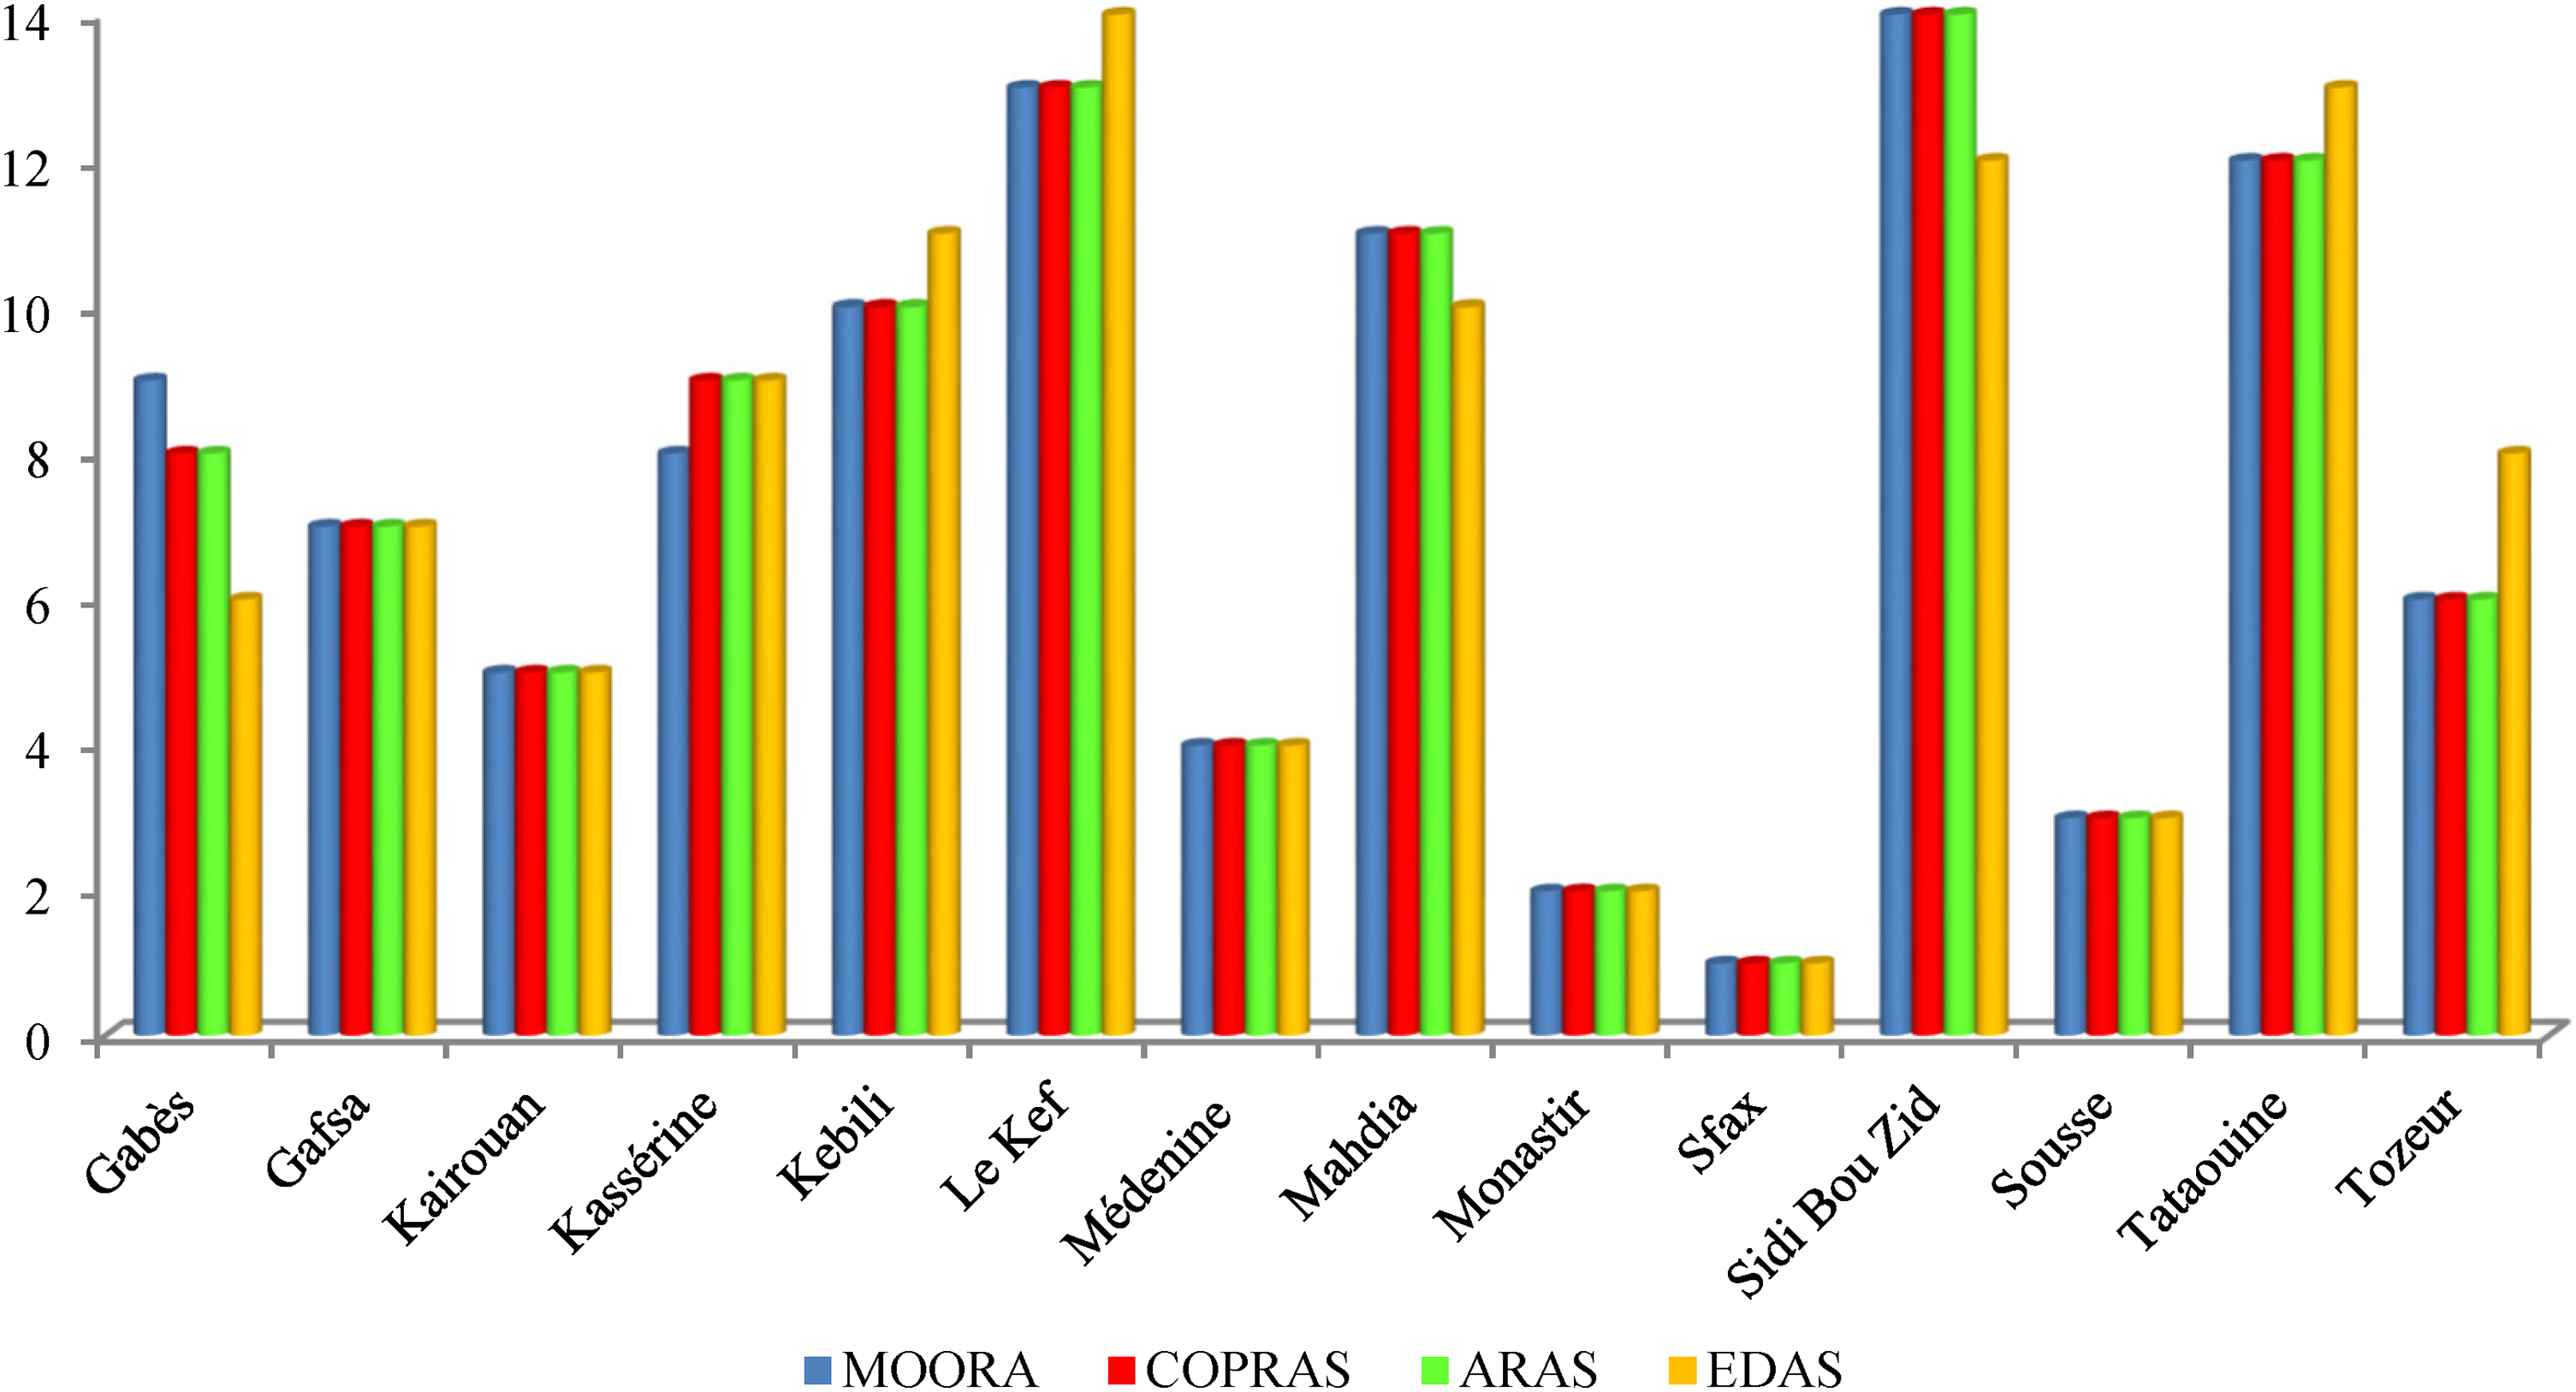
Ranking of the Tunisian regions with MOORA, COPRAS, ARAS, & EDAS.
Ranking of Tunisian regions using MOORA, COPRAS, ARAS, and EDAS.
Sensitivity analysis
To ensure the robustness and reliability of the site selection process for solar-powered green hydrogen systems in Tunisia, it is imperative to perform a sensitivity analysis of the Entropy weights assigned to the ranking criteria. Sensitivity analysis will assess how variations in the weights influence the final site rankings and help identify the criteria that most significantly affect the decision-making process (Haddad et al., 2017; Rekik and El Alimi, 2024b; Sindhu et al., 2017). By systematically altering the Entropy weights of key factors such as population density, grid and transport infrastructure, and the number of industrial hubs, it would be possible to evaluate the stability and consistency of the ranking outcomes. Accordingly, four cases are considered, as shown in Table 10.
Site ranking according to changes in the weight for different cases.
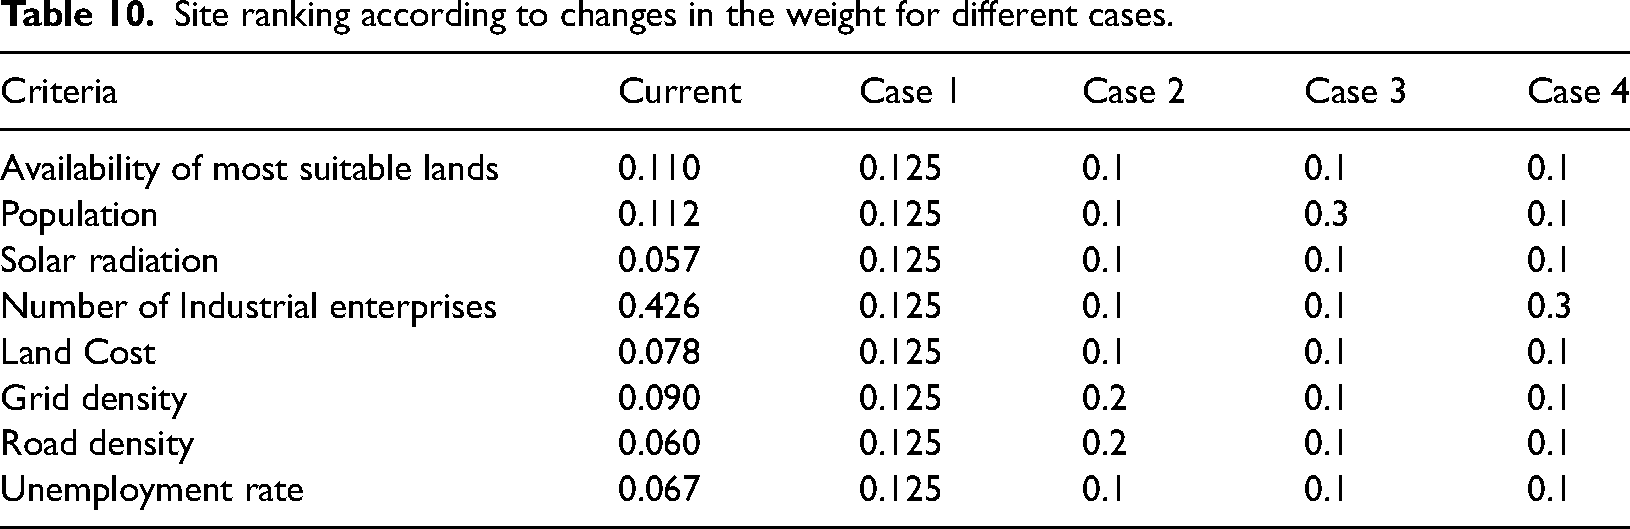
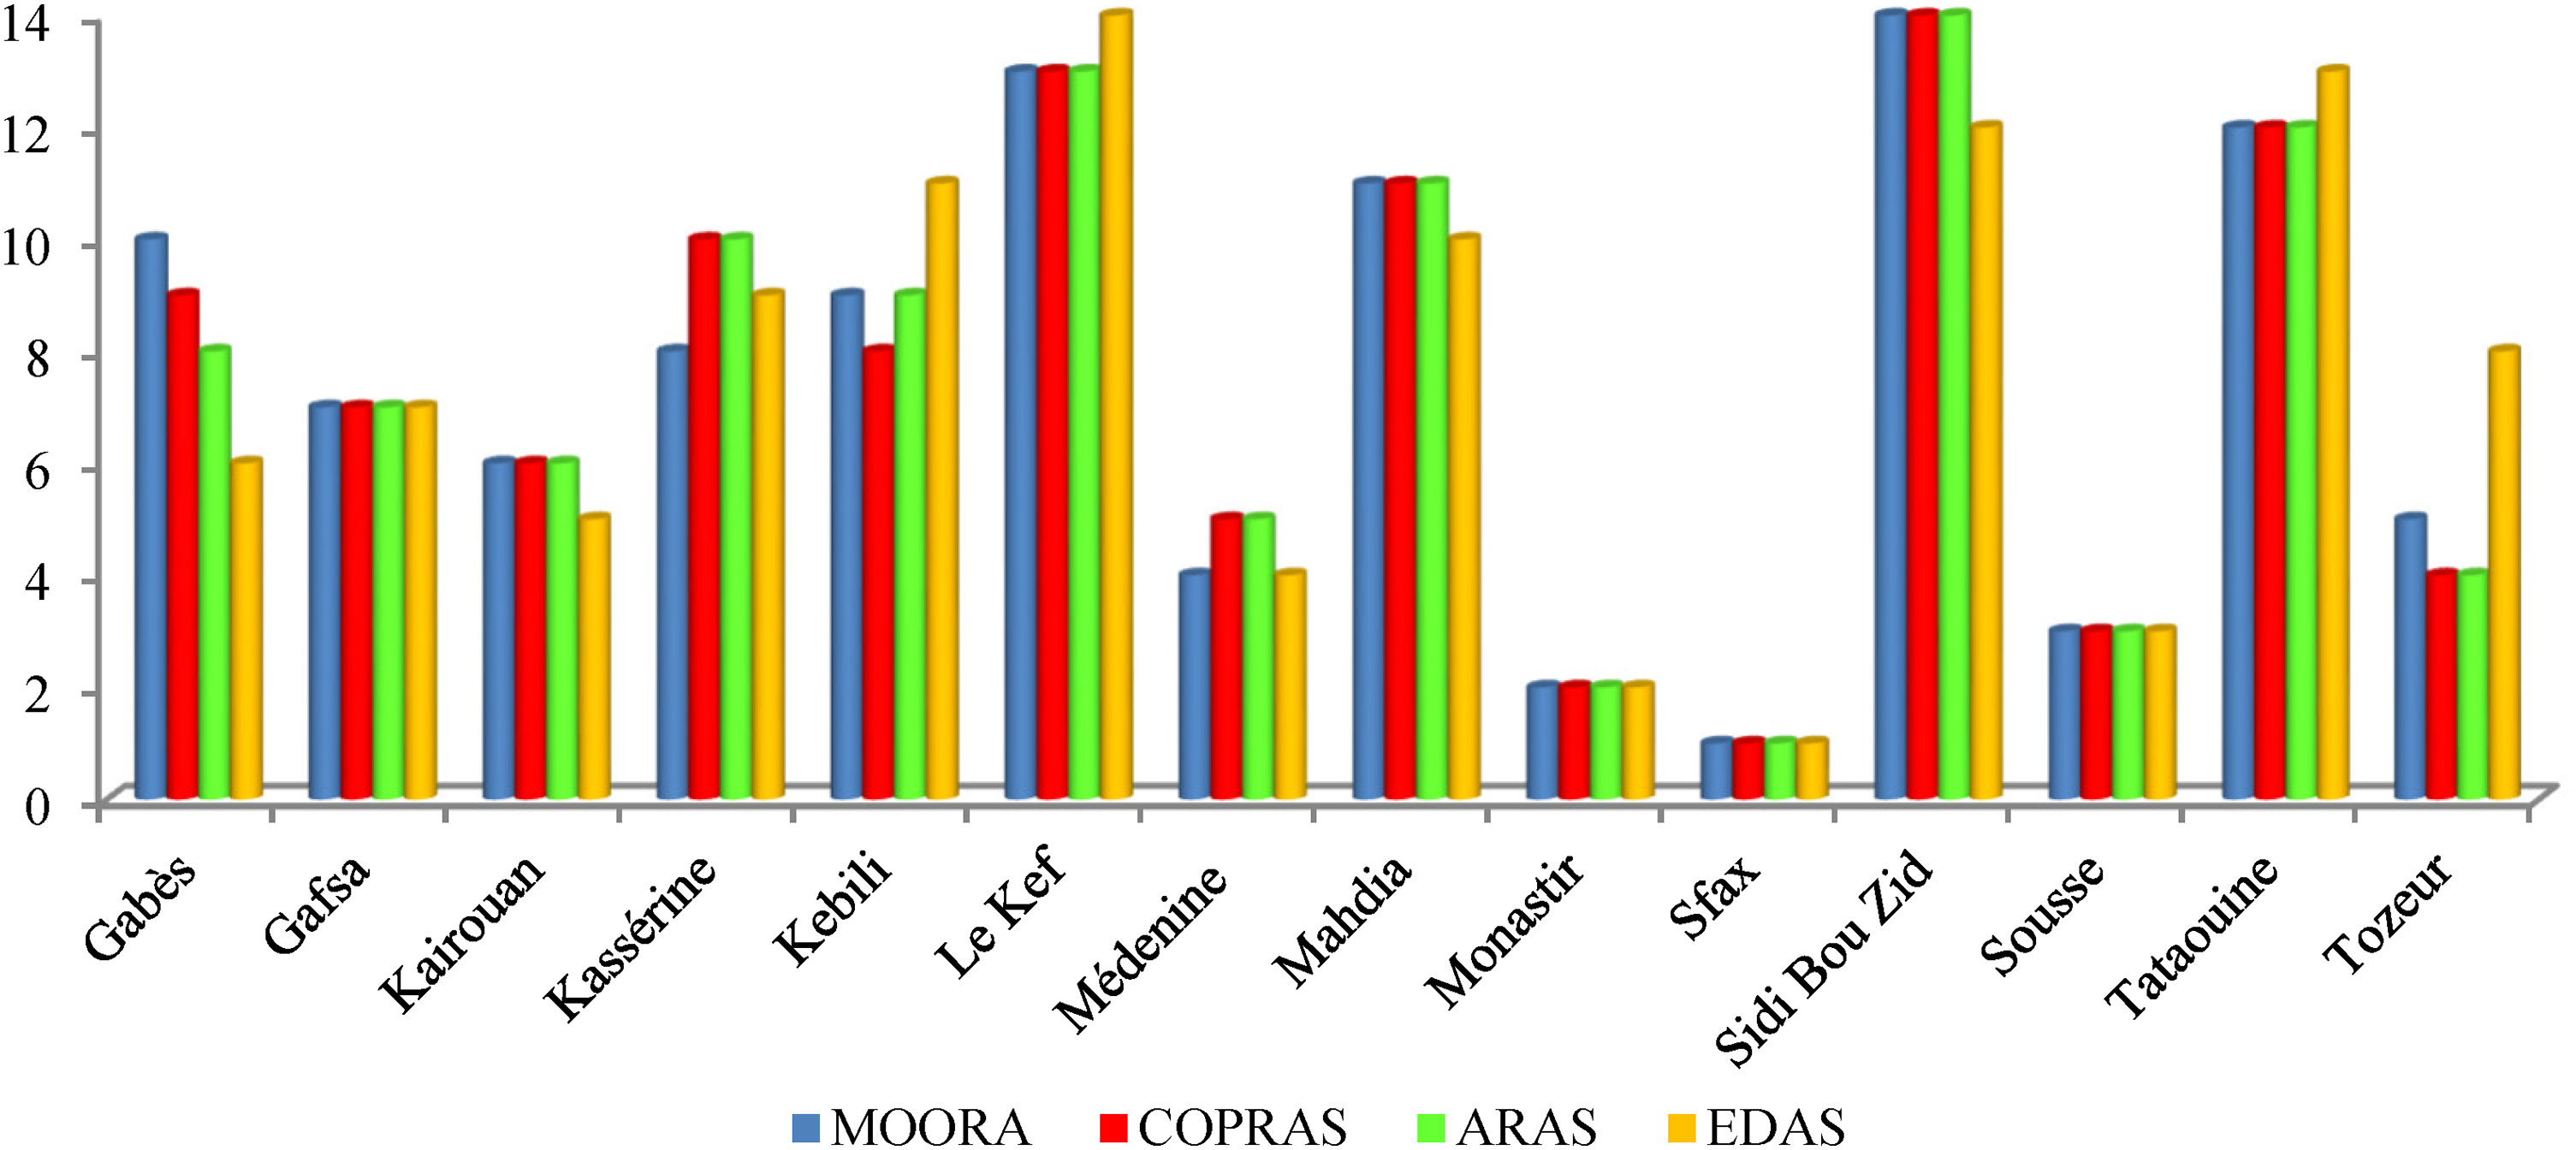
This thorough assessment highlighted the resilience of current rankings under different weighting scenarios, revealing any potential over-reliance on specific criteria. Additionally, it provided an opportunity to validate the robustness of the MCDM models used, confirming the reliability of Sfax, Monastir, and Sousse as top candidates when prioritizing grid and road infrastructure, the number of industrial hubs, and population density (Figures 13–15). Notably, though, when considering an equal-weight scenario, there was a vulnerability in the ranking methods. As illustrated in Figure 16, apart from Sfax, the impact of weights on the ranking methods ARAS, COPRAS, EDAS, and MOORA results can be observed. For instance, ARAS, EDAS, and MOORA ranked Monastir second, while the COPRAS model ranked it third. Similarly, Tozeur, was ranked second by COPRAS, third by ARAS and MOORA, and sixth by EDAS.
Site ranking considering grid & road with higher entropy weights.
Site ranking considering industrial hubs with higher entropy weights.

Site ranking considering population with higher entropy weights.
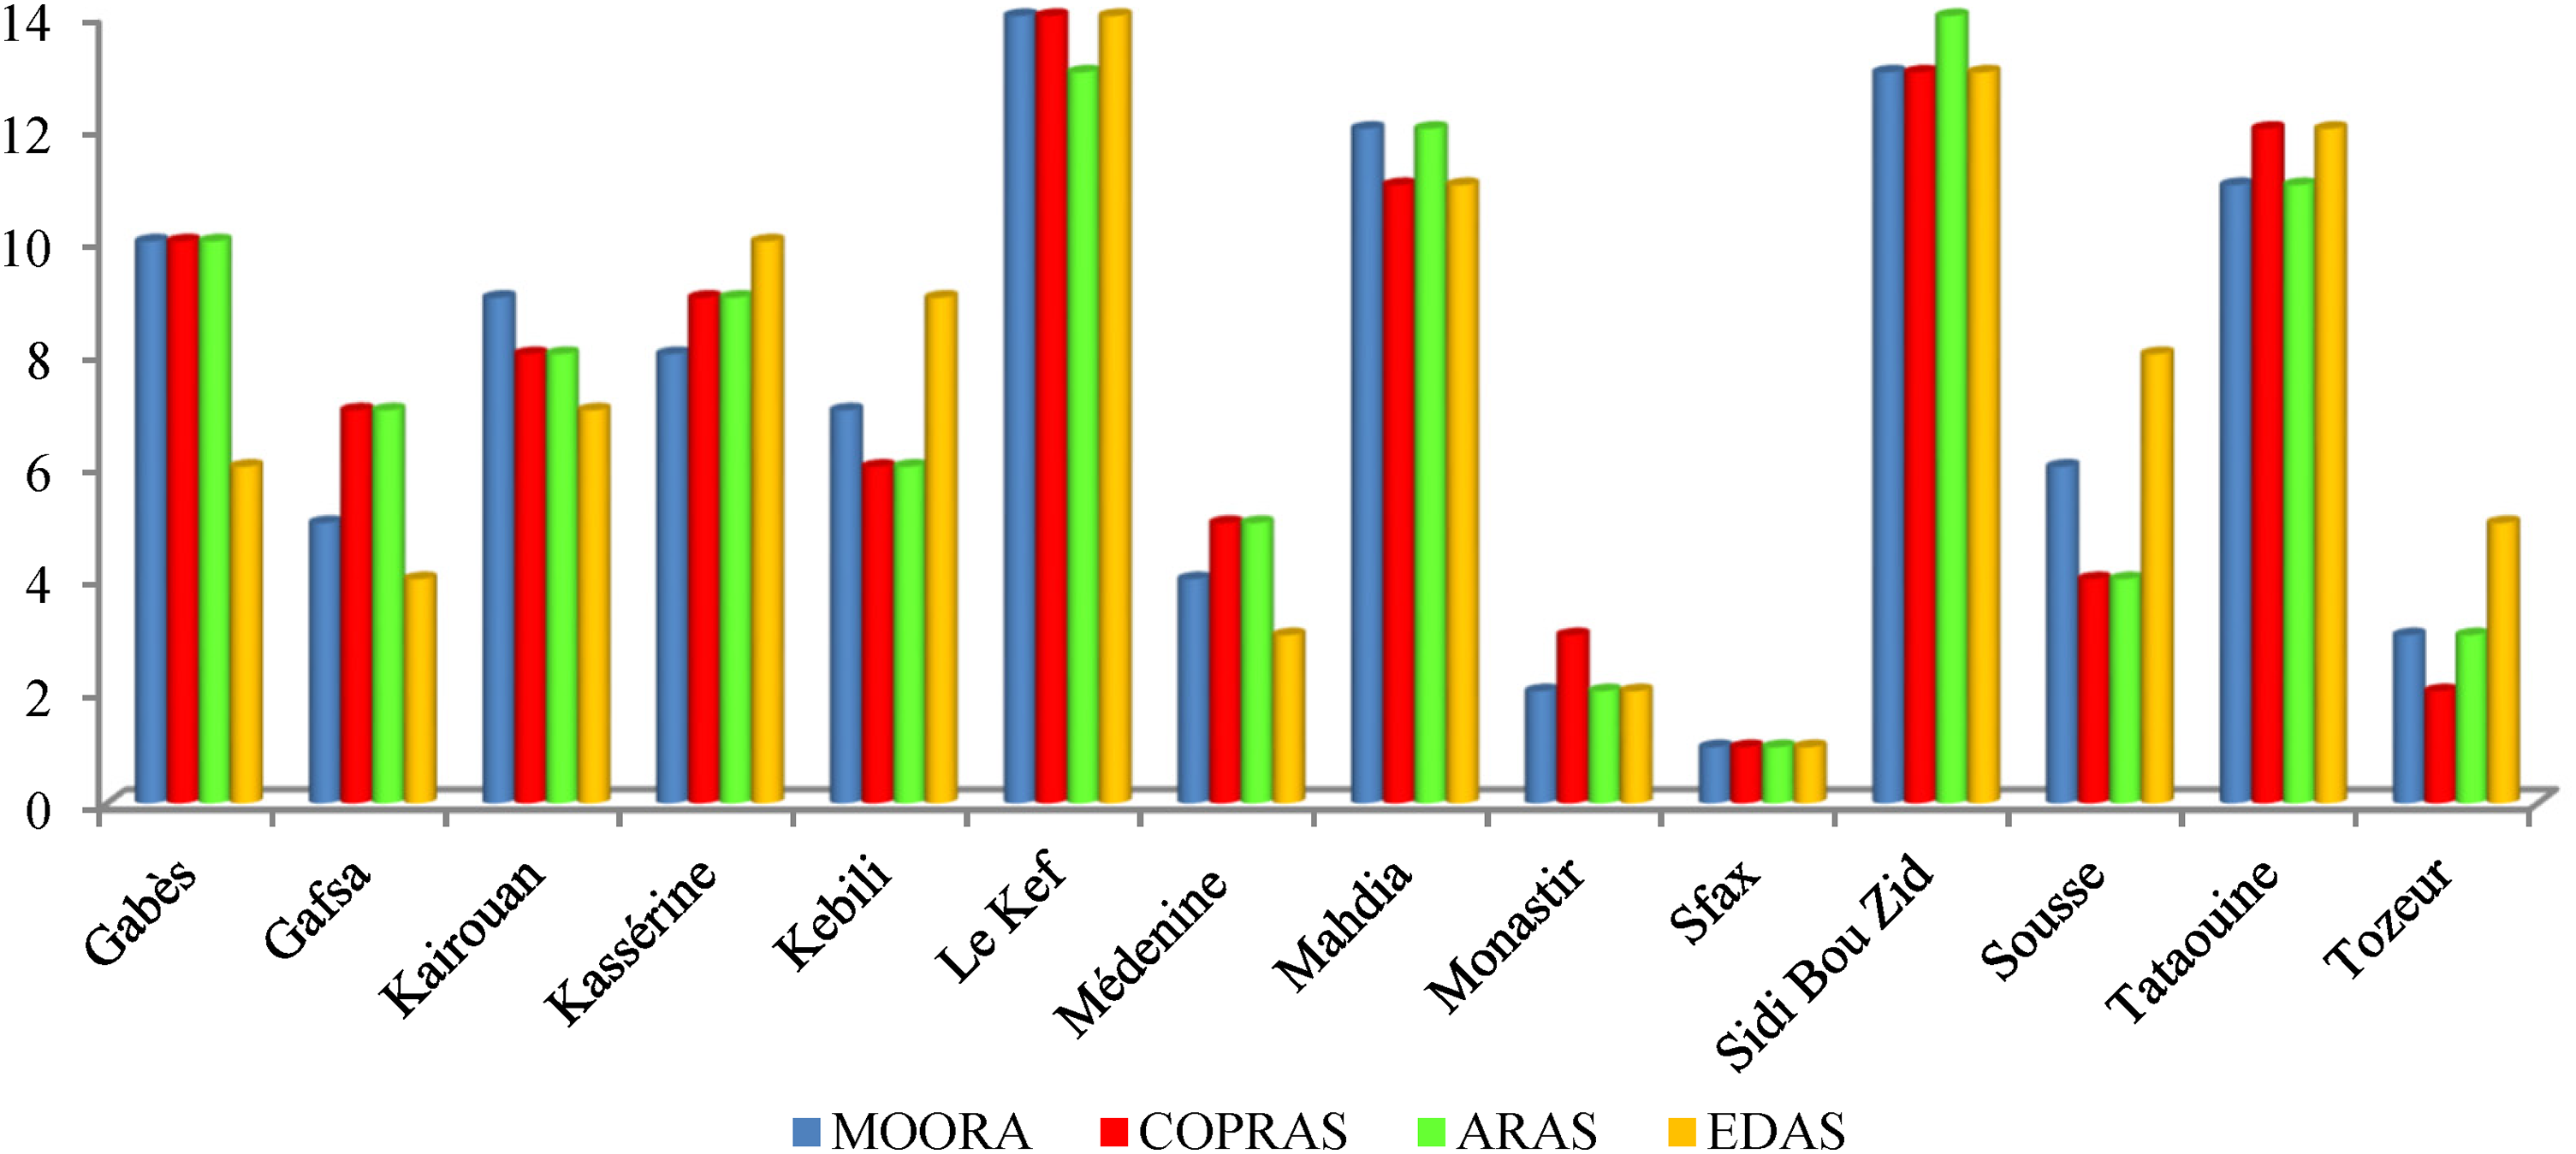
Site ranking considering equal entropy weights.
Green hydrogen potential capacity
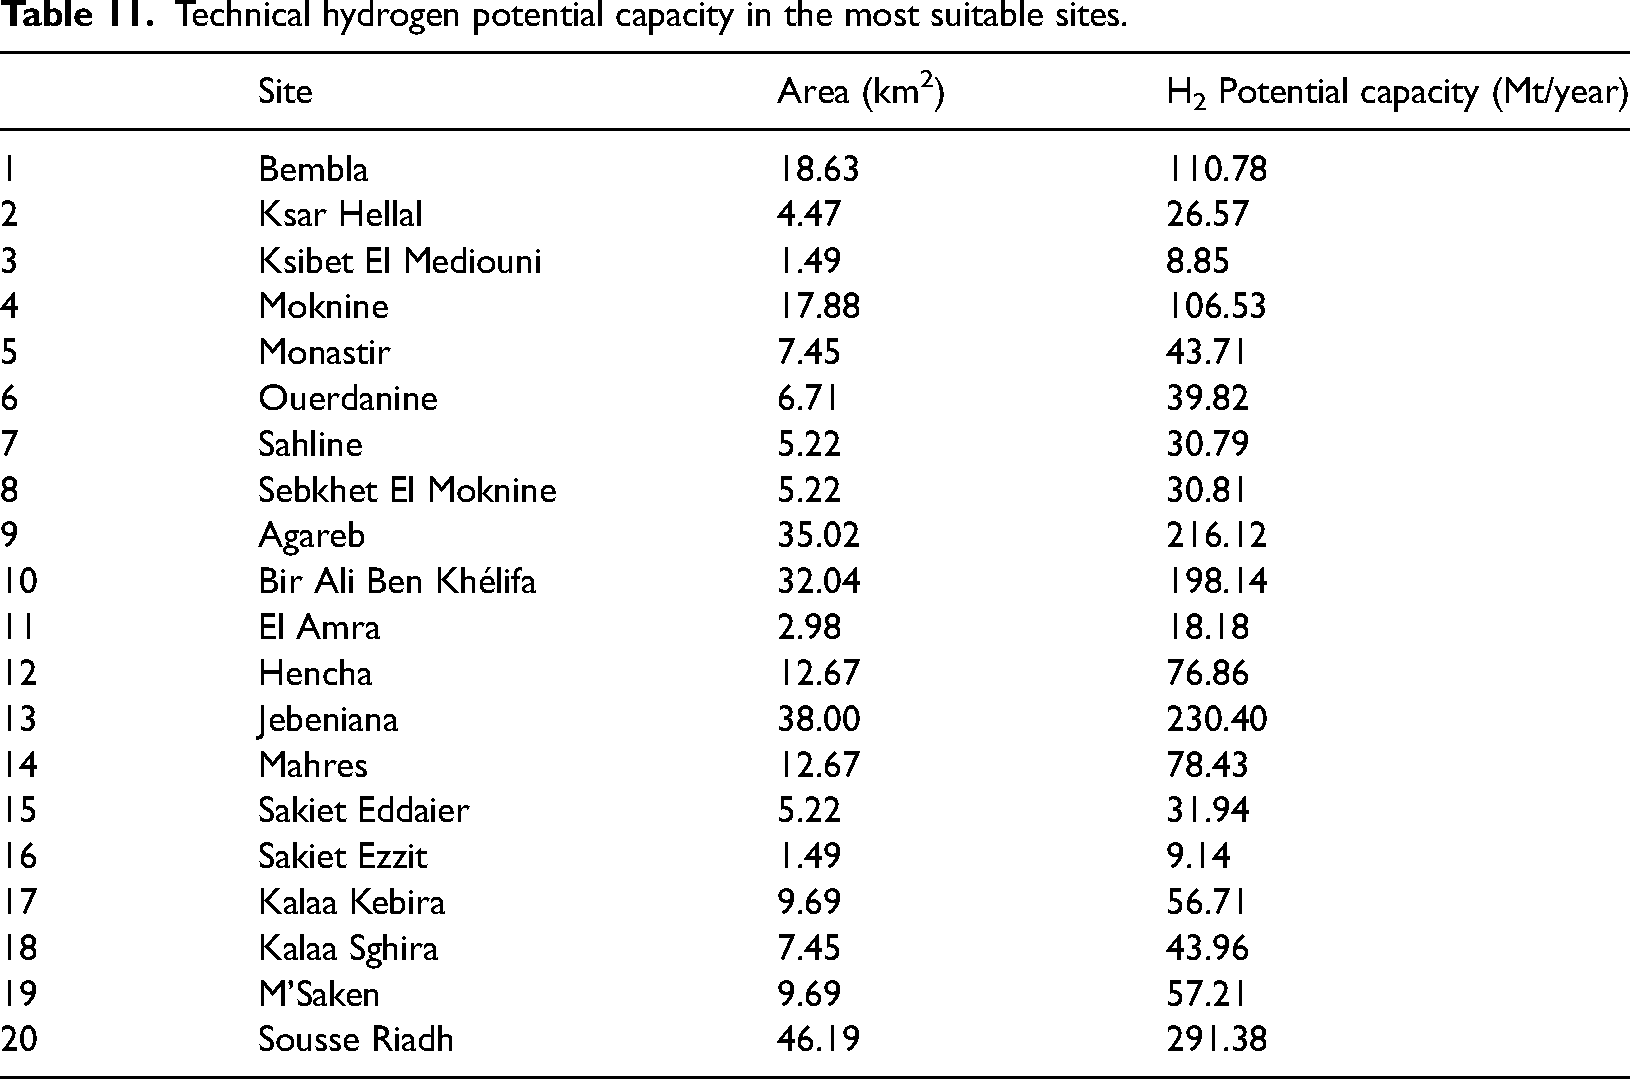
Solar-based green hydrogen production entails using solar PV energy with electrolyzer technologies through water electrolysis. As observed in Figure 17 and Table 11, each region exhibits varying potential capacities for green hydrogen production. Statistically speaking, in terms of the country’s overall potential, approximately 9910 Mt of solar-based green hydrogen could be generated annually. As top ranked regions, Sfax, Monastir, and Sousse make up nearly 14.5% of the total potential capacity with 859.21, 397.86, and 175.52 Mt per year, respectively. On the other hand, in terms of localities, it was observed that Jebeniana, Agareb, Sidi Ali Ben Khélifa, Bembla, and Moknine stood as better-suited locations for solar hydrogen, recording the highest potential capacity of roughly 862 Mt per year.
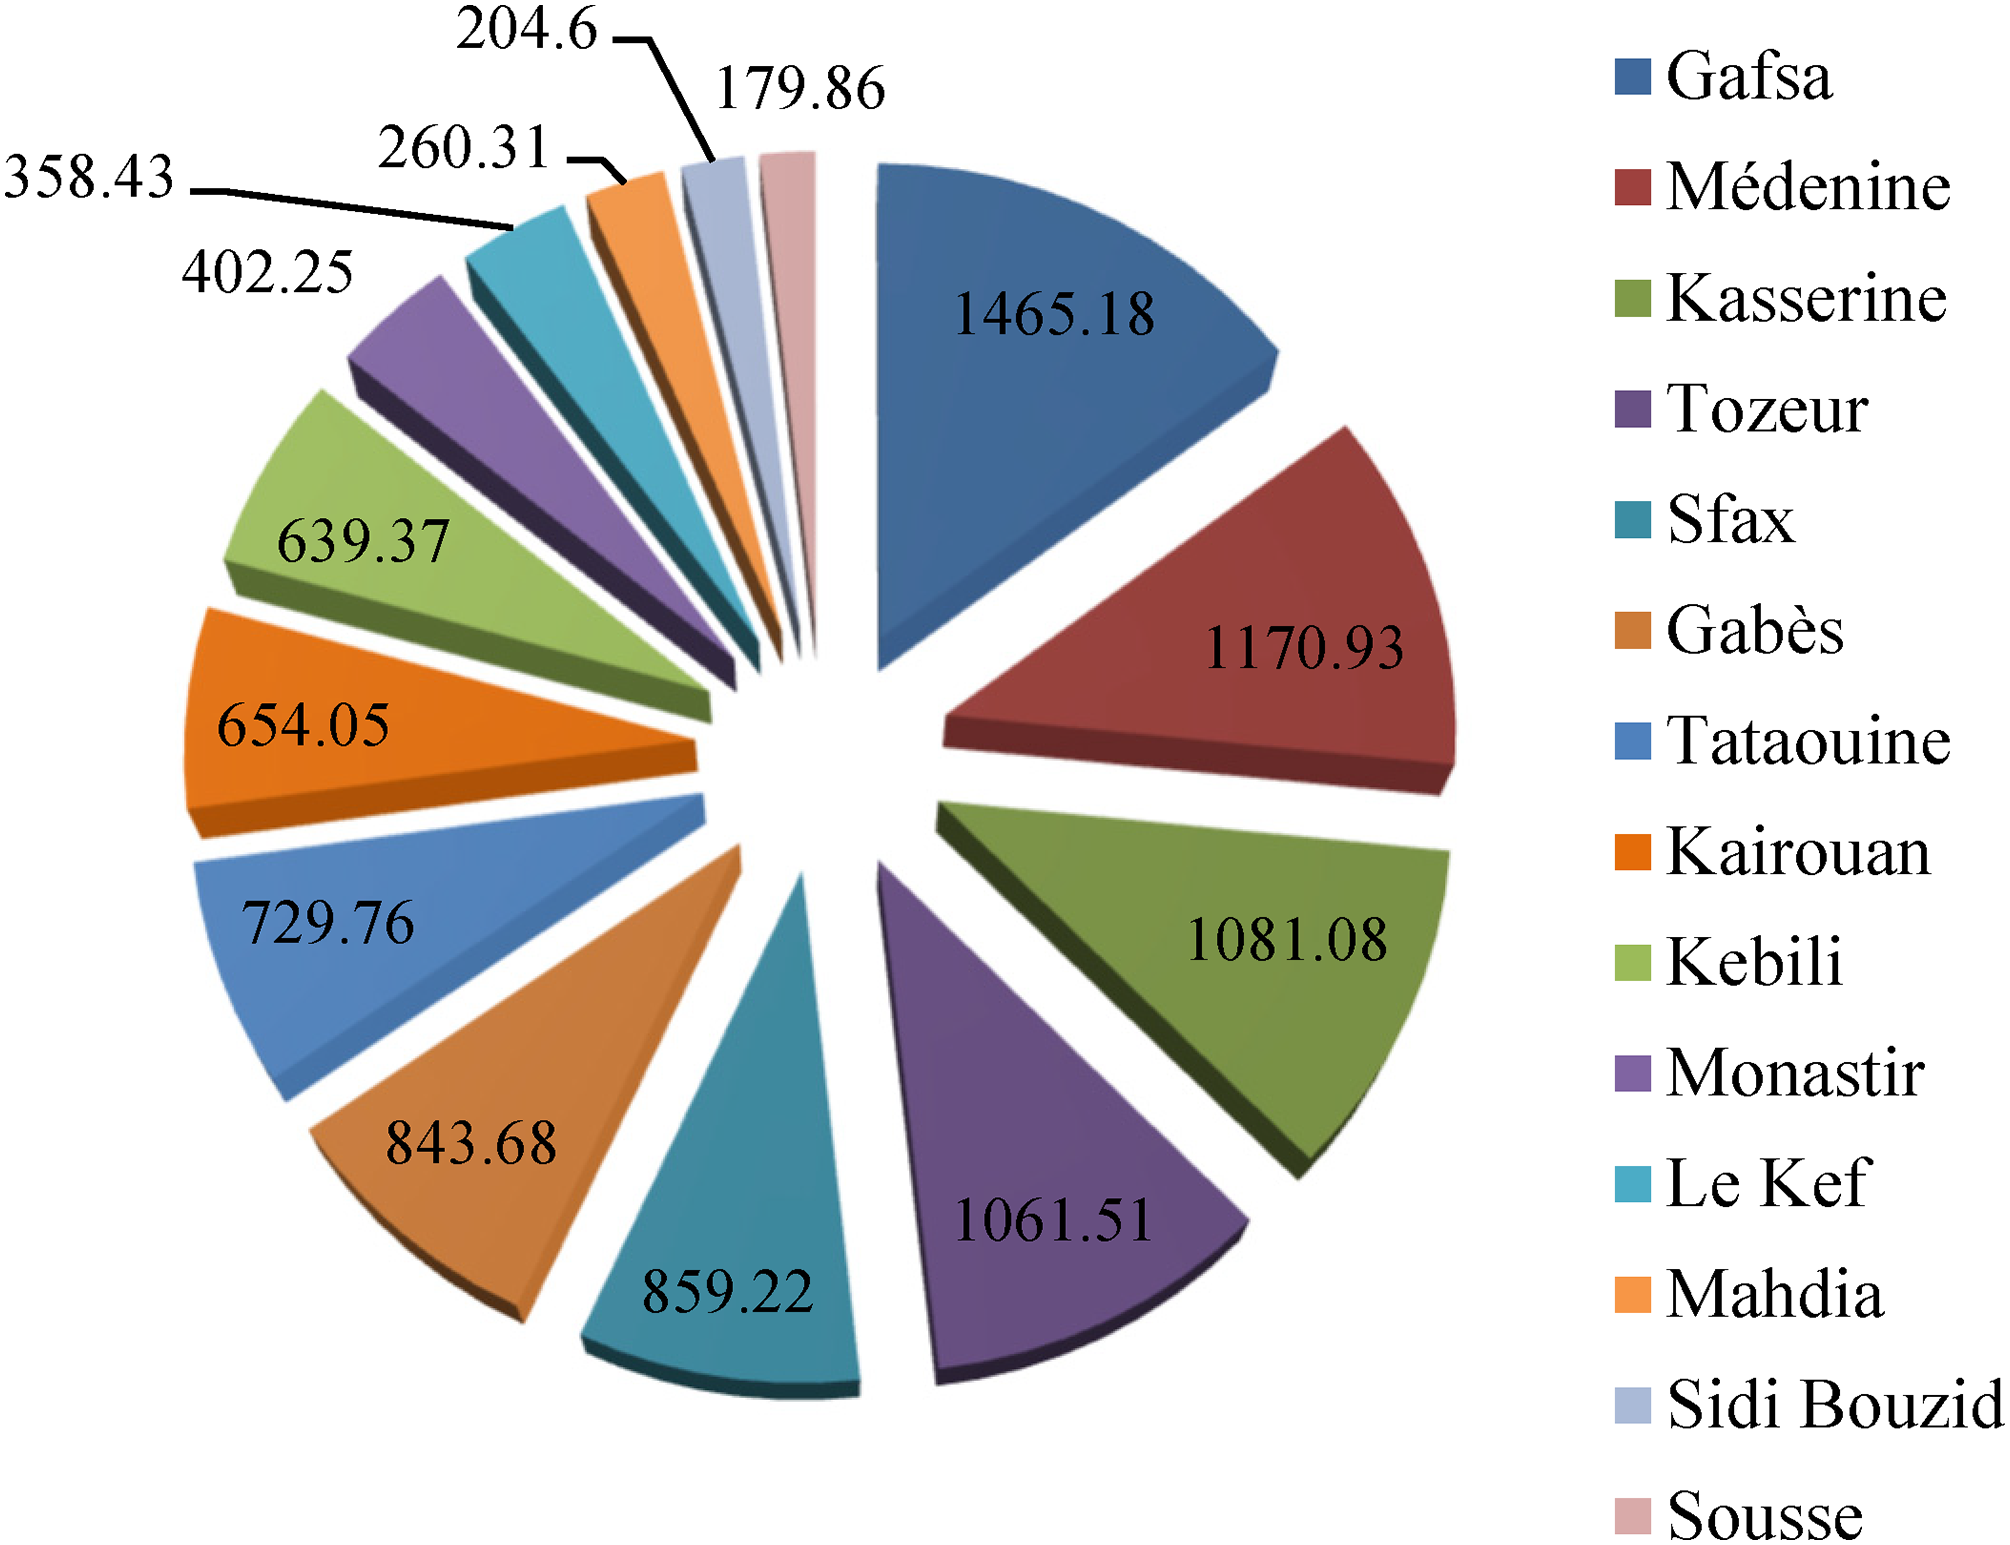
Hydrogen potential capacity at regional level.
Technical hydrogen potential capacity in the most suitable sites.
To date, Tozeur, Ghomrassen, and Al-Miknassi are home to three operating 40 MW solar photovoltaic (PV) facilities. Furthermore, the Ministry of Energy reported that the government has recently approved concession-based PV projects on five major scales, with a combined capacity of 759 MW (MEMER, 2020). Figure 18 shows that the operating solar facilities in Tozeur and Ghomrassen are situated in regions categorized as “Most suitable.” Likewise, the proposed projects at Segdoud, Metbassta, and Hecha are identified as “Most Suitable” locations. However, the two remaining projects in Remada and Khobna do not match regions of high suitability (Figure 18). Hence, selecting a site that is close to the “most suitable” or “suitable” sites is crucial to ensuring maximum performance of large-scale solar-powered hydrogen systems.
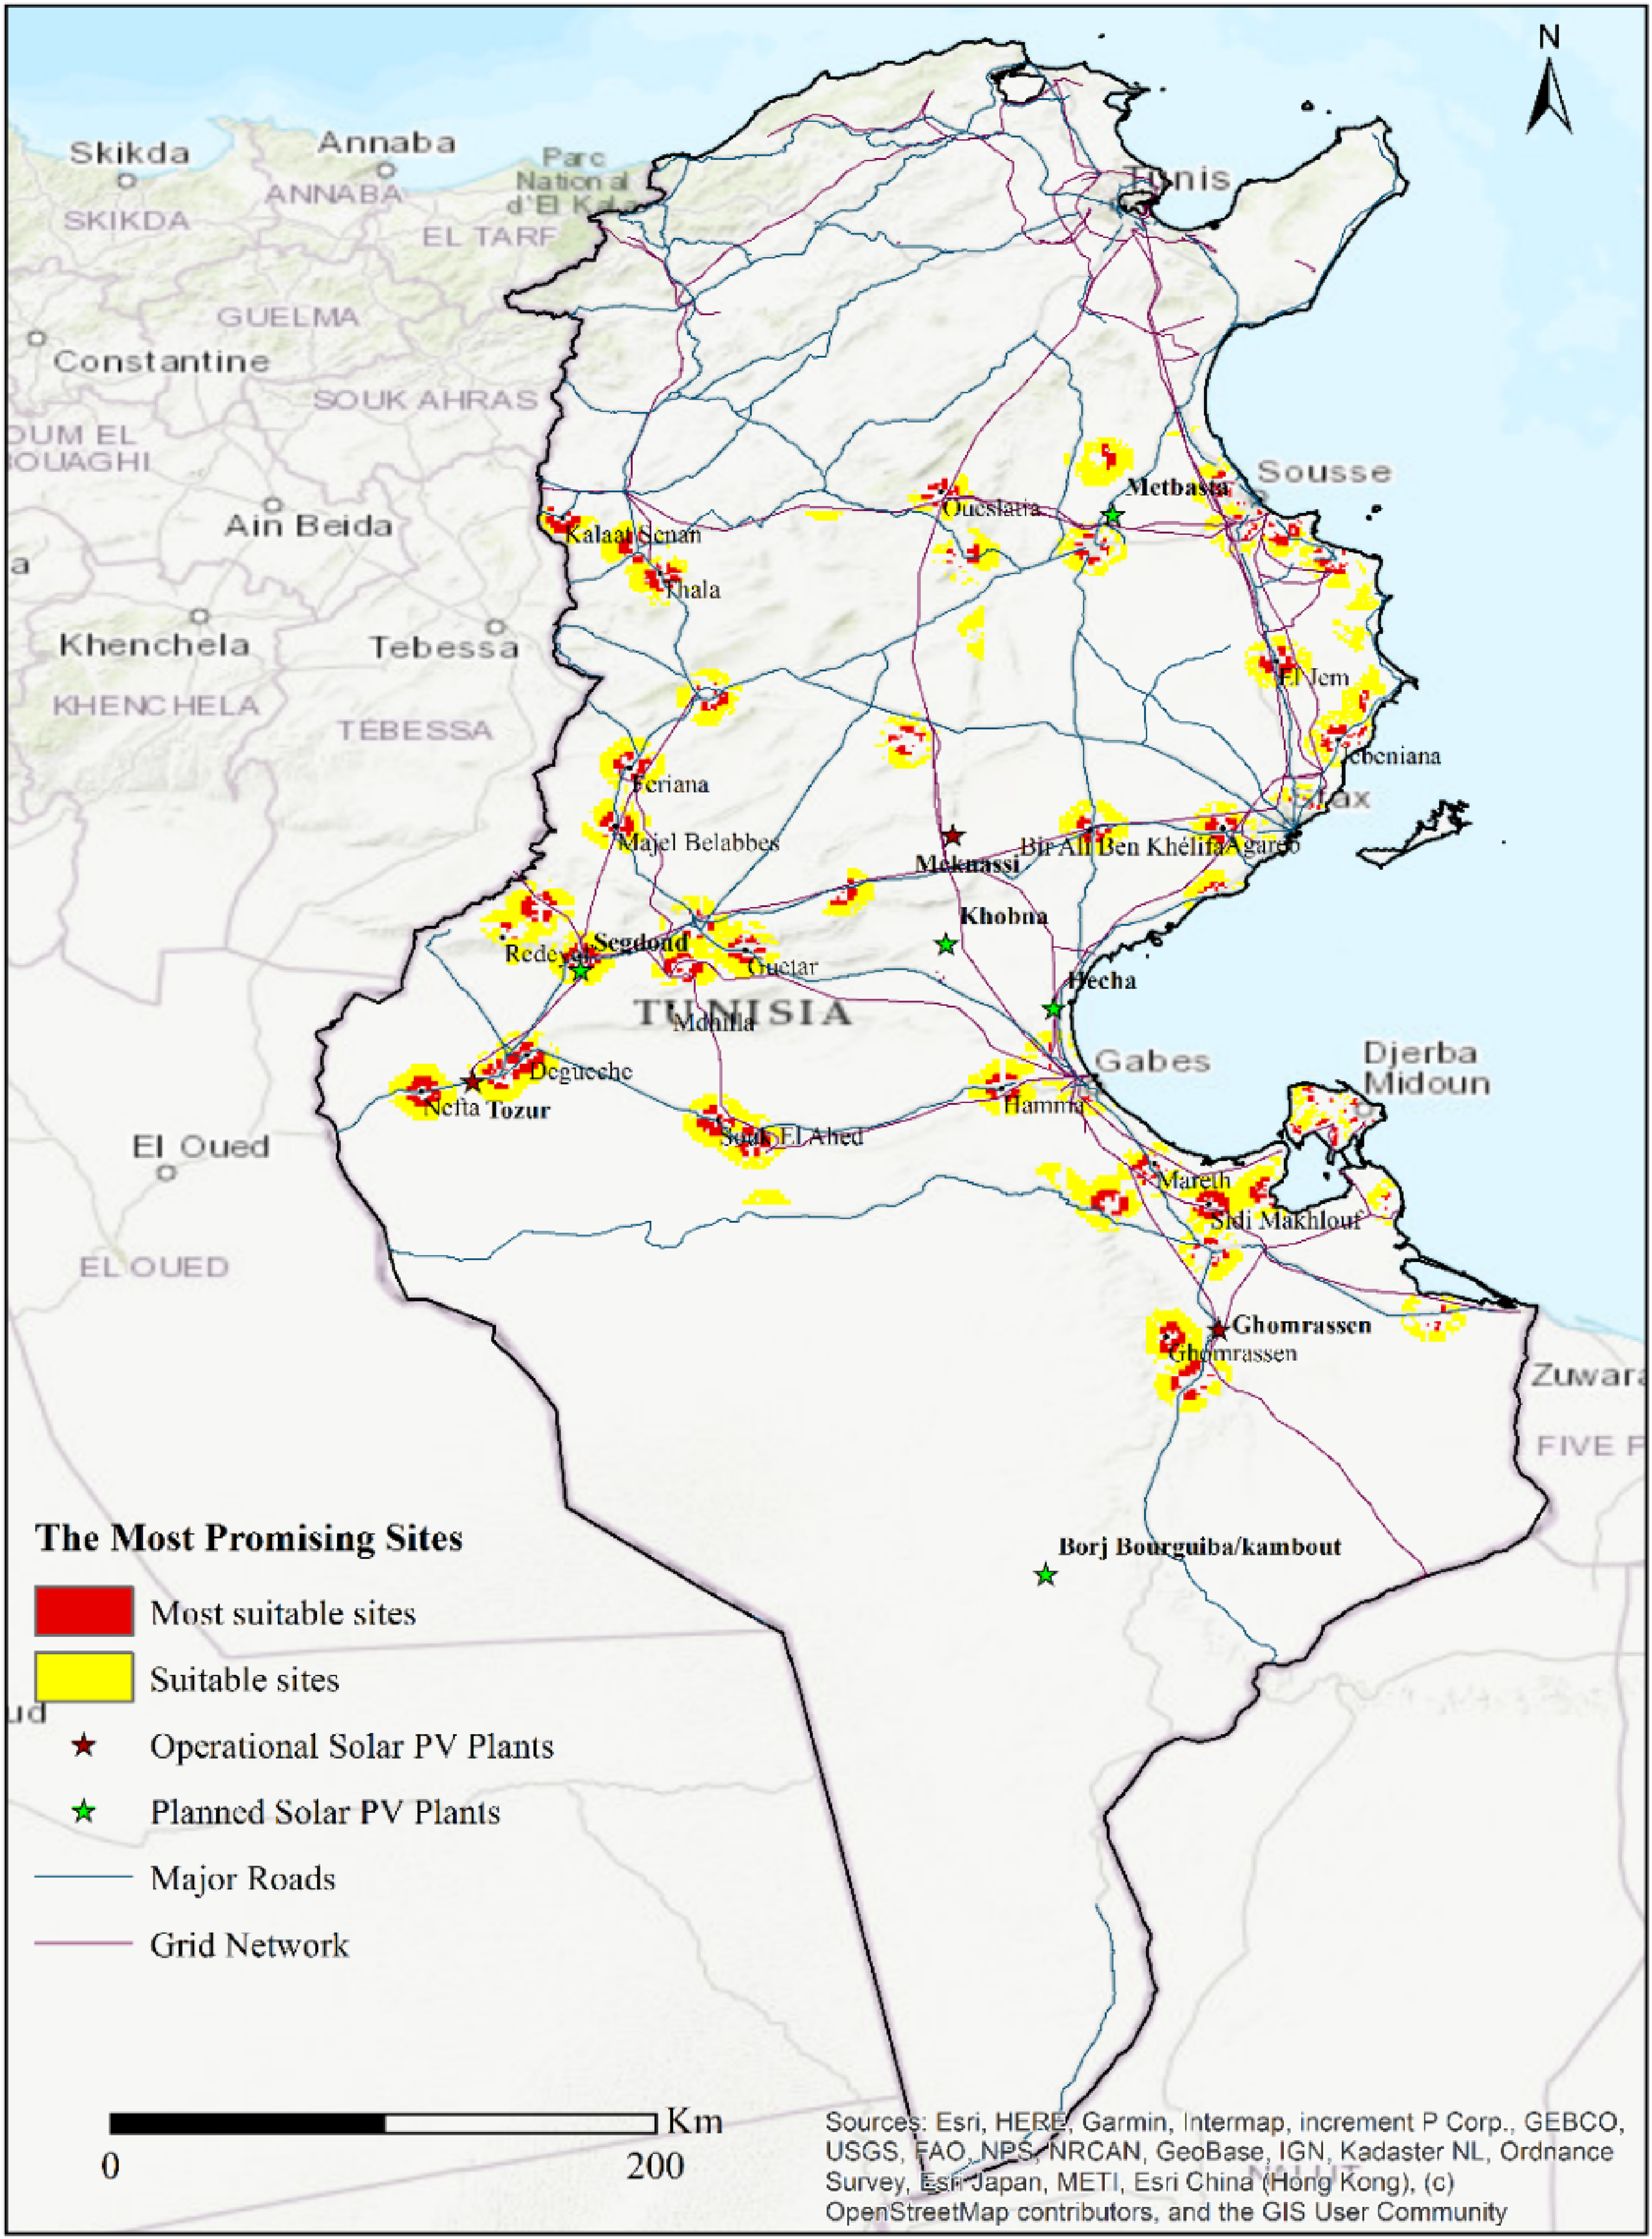
The most promising sites.
Therefore, the identification of highly suitable areas provides a starting point for further exploration and investment in solar hydrogen projects. By targeting these areas, stakeholders and decision-makers can maximize the efficiency and effectiveness of their investments in renewable energy infrastructure.
Discussion
The use of AHP as an MCDM technique has indeed influenced the outcome of this current paper. The developed model has thus exhibited a considerable degree of flexibility, which has proven effective in helping us manage both quantitative and qualitative data (Kumar et al., 2017; Sindhu et al., 2017; Taoufik and Fekri, 2023). The findings of this study align with previous research conducted in countries sharing similar geographic and climatic characteristics. For instance, studies carried out by Messaoudi et al. (2019a), Rahmouni et al. (2016), and Taoufik and Fekri (2023) in Algeria and Morocco using a comparable approach identified similar key criteria for the successful implementation of solar-powered hydrogen systems. Furthermore, when comparing the obtained results to those from Algeria, Morocco, Ghana, Iran, and Thailand, it was observed that these significant outcomes present promising prospects for the entire country (Ali et al., 2022; Asare-Addo, 2023; Messaoudi et al., 2019a, 2019b; Scorzelli et al., 2023; Taoufik and Fekri, 2023). This serves as validation for our findings and highlights the substantial contribution solar-based green hydrogen can make toward sustainable energy solutions, considering their immense potential.
To ensure energy self-sufficiency, diversify the energy mix, and reduce imports, the government has set a goal of achieving a 30% share of renewable energy in electricity generation by 2030. Yet, progress has been extremely limited thus far. Prolonged social and political unrest, inconsistent policies and regulations, limited financing options, unstable funding resources, and a risky investment climate have all substantially hampered the achievement of this goal. To fully harness solar-powered hydrogen potential, tangible measures for promoting its exploration and investment in hydrogen systems are critical. Besides, delineating the best-suited sites often requires enhancements to grid infrastructure, transportation facilities, manufacturing centers, and educational institutions. Thus, developing such systems could provide feasible solutions for meeting growing power demand while promoting economic growth and reducing reliance on traditional fuels.
Conclusion
This research paper has meticulously explored the potential of solar-driven green hydrogen production in Tunisia, employing a robust GIS-based Multi-Criteria Decision Making (MCDM) approach to identify and prioritize optimal locations. The integration of various MCDM techniques, including the Analytic Hierarchy Process (AHP), ARAS, COPRAS, EDAS, and MOORA, has provided a systematic and comprehensive framework for evaluating potential sites based on technical, topographical, environmental, and accessibility criteria.
According to the findings, Tunisia’s southeastern, southwestern, and eastern coastal regions provide optimal conditions for implementing hydrogen facilities powered by solar energy. Such regions are well endowed with favorable climatic conditions, ample solar radiation, advantageous topography, and sufficient infrastructure. Furthermore, the results have shown that Tunisia has an opportunity to implement solar-powered hydrogen systems on about 1591 km2 of suitable locations, making up approximately 0.78% of the total land area. In terms of ranking the most appropriate sites, it appeared that the regions of Sfax, Monastir, and Sousse were ideal locations for installing solar-powered hydrogen systems. The sensitivity analysis further confirms these regions’ dominance over the others due to their superior performance in terms of population density, the number of industrial hubs, and grid and road infrastructure. In terms of hydrogen generation potential, it was determined that highly suitable locations have the potential to generate 9910 Mt of hydrogen annually. Out of this, 14.5% could be produced from Sfax, Monastir, and Sousse, with corresponding capabilities of 859.21, 397.86, and 175.52 Mt per year.
One significant limitation of the current research that future studies should strive to tackle is the lack of detailed economic analysis and market dynamics, which are essential for the practical implementation of solar-powered hydrogen plants. Furthermore, while the potential capacity for hydrogen production has been estimated, the paper does not delve into the technical specifics of plant construction, operational challenges, or the compatibility of these systems with existing energy infrastructure. Another aspect worth investigating is the influence of possible geopolitical changes and policy shifts on the feasibility of establishing these plants, given Tunisia’s strategic position and its implications for regional energy markets. Therefore, integrating these multi-dimensional elements into the research would yield a more comprehensive assessment of solar-powered hydrogen plant potential in Tunisia.
Footnotes
Nomenclature
Declaration of conflicting interests
The authors declared no potential conflicts of interest with respect to the research, authorship, and/or publication of this article.
Funding
The authors received no financial support for the research, authorship, and/or publication of this article.