
Abstract
Coal bed methane is one of the clean energy sources in the world. Methane molecules are confined inside the pores of coals and when the gas drainage wells are drilled into the coal seams, due to the resulted pressure difference. Coal cleats are spread all over the coal seam as face and butt cleats and play an essential role in the methane gas drainage operation from coal mines. Calculating the coal cleats spacing makes great help in modeling the amount of emitted gas followed by calculating the spacing of gas suction wells. Furthermore, the time required for gas drainage will be determined. Computer-based image processing technique has been utilized to identify the cleats spacing. In this study, three-dimensional computed tomography scan images were prepared for coal samples from Tabas Coal Mine in Iran. Computer-based image processing technology was conducted to determine the coal cleats. Their spacing was then calculated. Based on the results obtained using image processing with computer, the average distance between face cleats was 20 to 30 mm and the distance between butt cleats was 15 to 25 mm. The results of this study are used to modeling the amount of methane gas in the coal cleats. Based on this modeling, the amount of released gas and the distance between the wells can be designed.
Introduction
Coal bed methane (CBM) is one of the natural gases that exists in the coal layers and is a suitable source of gas for extraction. In coal mines, the presence of methane gas is defined as one of the main risks, and before any extraction operation, it is removed from the ground by ventilation, Karacan et al. (2011); of course, it should be mentioned that the methane is one of the greenhouse gases. In the past few decades, CBM has been extracted as a suitable source of energy for industry and households’ consumption in the United States, Australia, China, and Canada (Hamawand et al., 2013; Moore, 2012; Mostaghimi et al., 2017). Recently, Karimpouli et al. (2017) have done research on two-dimensional (2D) and three-dimensional (3D) block model for CBM.
Lou et al. (2024) found that the development range of fractures around a borehole needs to be studied comprehensively and the initial plugging depth and the length of a borehole need to be determined based on theoretical analysis.
One of the reasons for the rapid attenuation and low concentration of extracted methane is complex geological conditions and low permeability of some coal seams (Wue et al., 2021; Pan and Connell, 2012; Lu et al., 2022) Fractures are present in almost all coals, and play an important role in coal stability, mine ability, and its permeability. For all these reasons, many investigations have been carried out in the past on coal fractures and published explanations and theories about the origins of fracture (Mammatt, 1834; Milne, 1839 cited in Kendall and Briggs, 1933; Laubach et al., 1998; Tiegang et al., 2014). Among the various available terms for systematic fractures in coal, cleat as an ancient mining term is generally used by many researchers and miners (Dron, 1925). Coal seam gas exists in the adsorbed and free state. Only free gas can flow to the working face or be extracted (Wang et al., 2015). Also, cleats play an important role in adsorption and desorption methane gas molecules (Niemann and Whiticar, 2017).
Cleats are certain types of fractures that systematically developed in coal bed and most commonly occur as two different sets which are at right angle to each other. According to Laubach et al. (1998), both sets are subvertical in orientation and perpendicular to the coal bed (Figure 1). Within a set, discrete cleats act distinctly each of which is 3D units characterized by limited length, depth extension, and width (Dron, 1925).
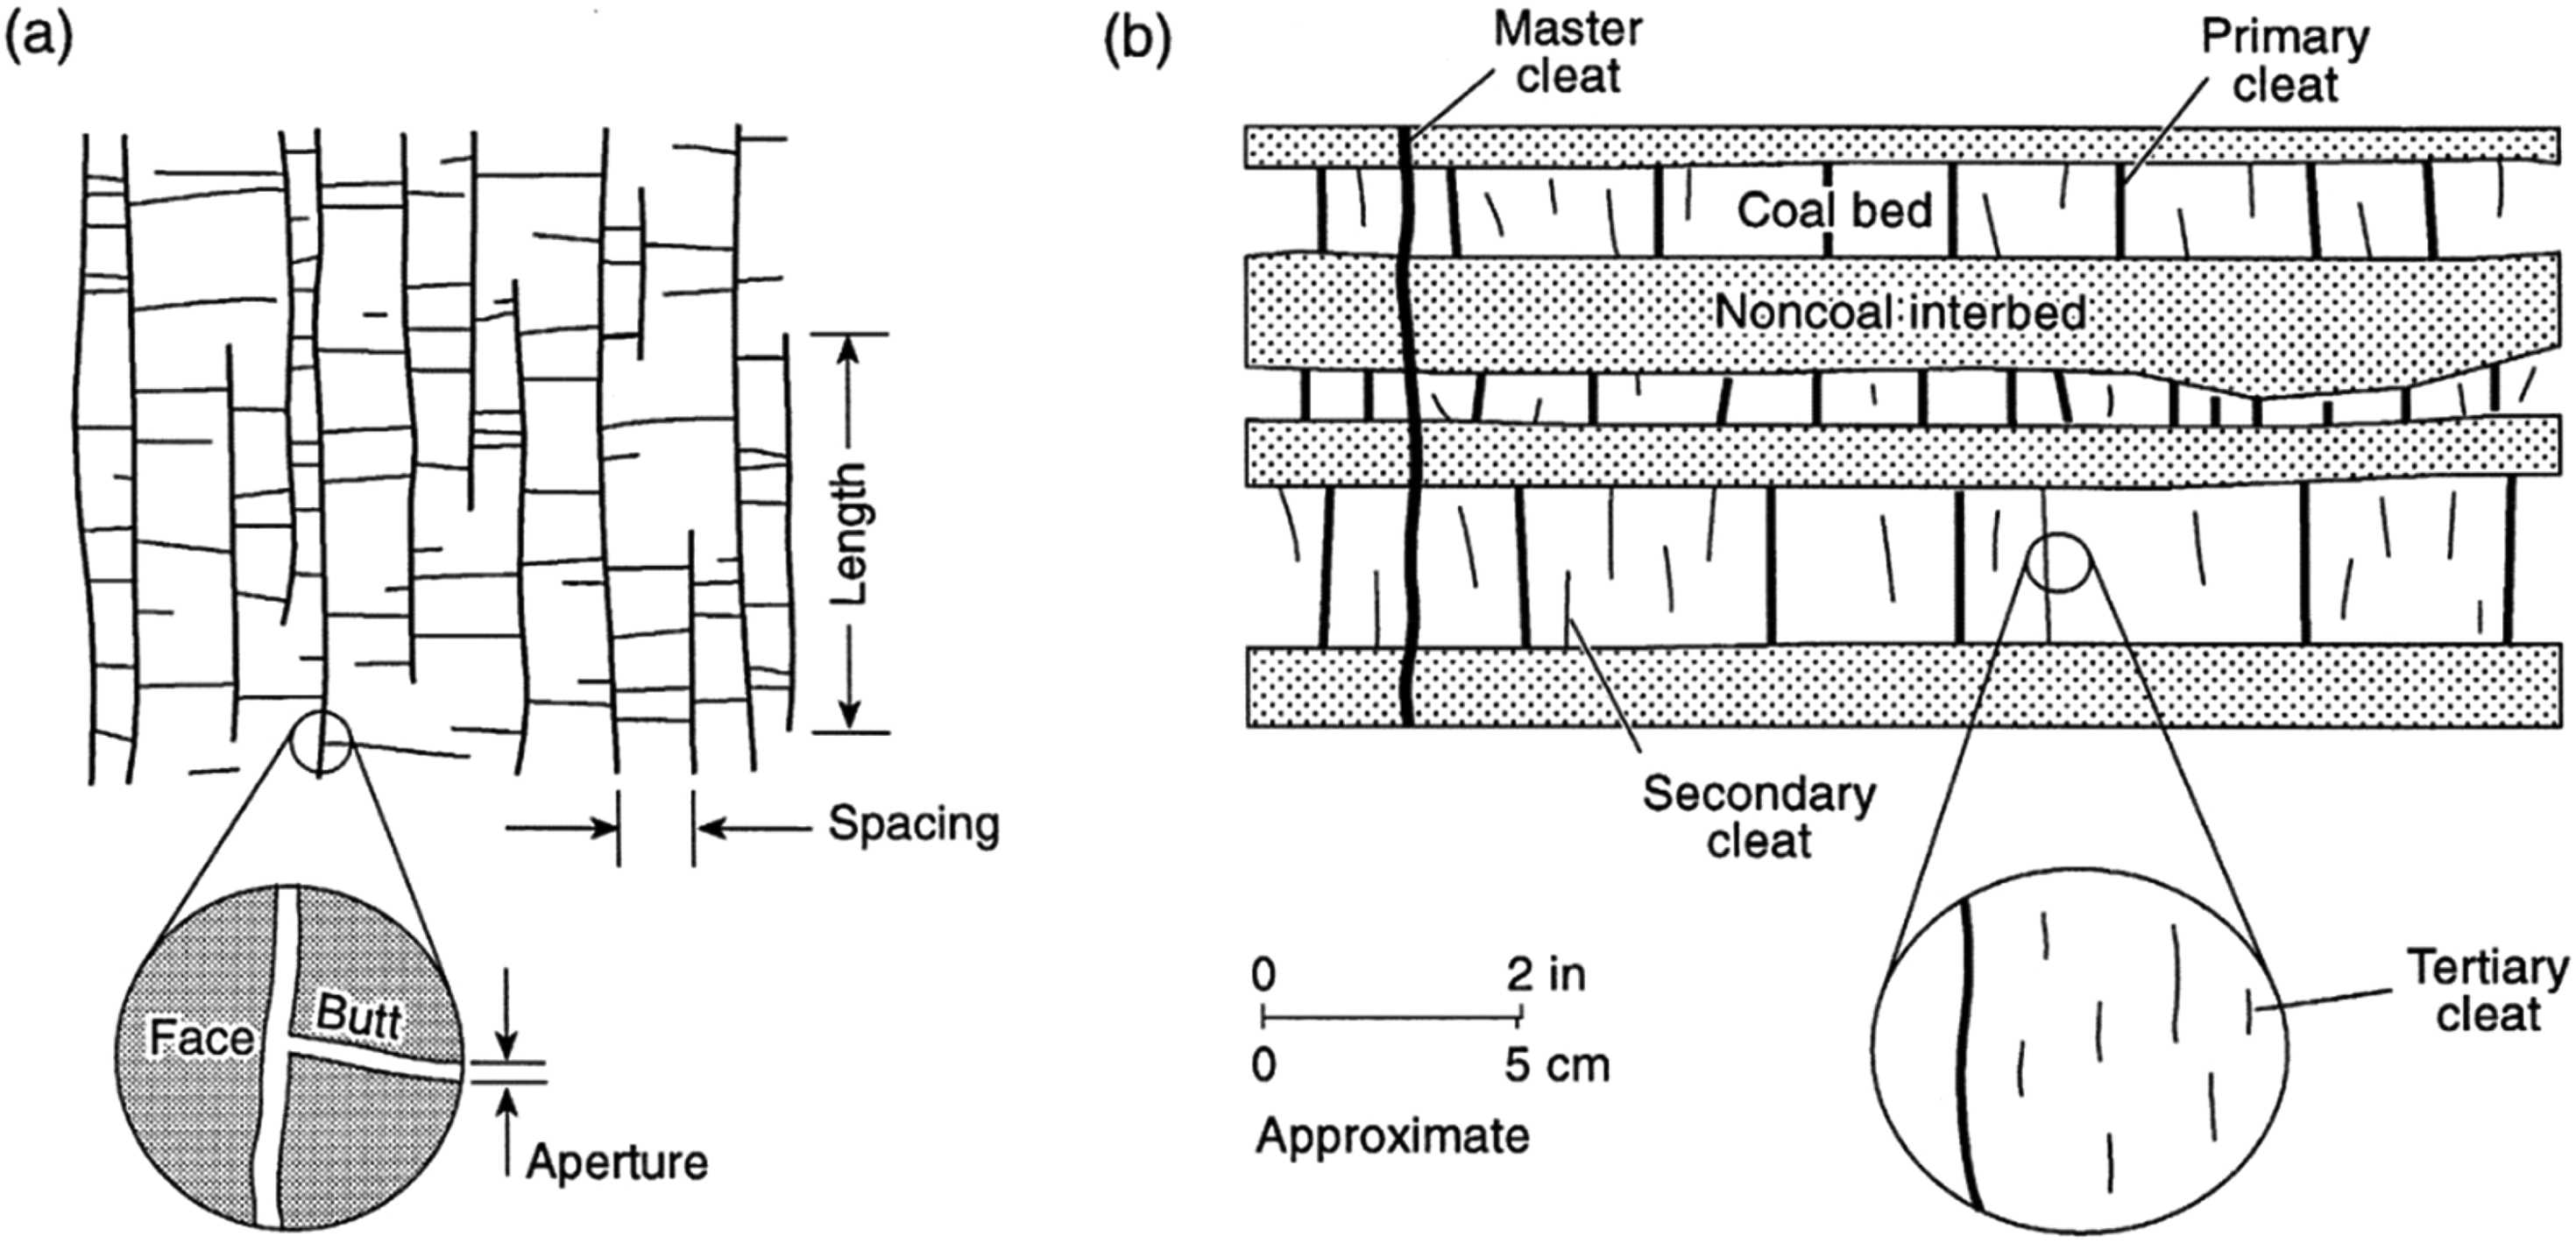
Schematic representation of coal cleat systems: (a) plan view and (b) cross-sectional view (Laubach and Tremain, 1991).
According to Figure 1, these terms are used for cleat: length is the dimension parallel to cleat surface and parallel to bedding; height is the parallel to cleat surface and at right angles to bedding; aperture is the dimension perpendicular to fracture surface. Spacing between two cleats (of same set) is a distance between them perpendicular to cleat surface (Laubach et al., 1998).
The main mechanism of permeability in coal seams is the coal cleats, also it can be fractured as conventional reservoirs (Santivanez and Cano, 2021). The coal permeability depends on several parameters including height, spacing, aperture size, length, type of mineral infilling, degree of mineral infilling, and angle of orientation of cleats (Dawson and Esterle, 2010).
Dawson and Esterle (2010) considered the relationship between cleat spacing, cleat height, and coal banding texture. The coal samples were from Queensland Permian age of different rank. The main aim of their research was to obtain more accurate information regarding cleat density and therefore coal permeability. They believe that getting insight into cleat relationships and levels which will help to predict natural fracture distributions in and between coal seams that will govern coal permeability. Their results show that cleat spacing was directly proportional to cleat height in majority of samples. Dawson and Esterle (2010) calculate the exact and perpendicular distance in the direction of the cleats, the distance from one end of the coal block cleat to the other end of the block should be measured and divided by N-1 cleats in this interval. The average distance of the cleats is obtained in this way so that the cleat on which the zero of the rulers is placed is not counted. N is the number of cleats.
Cleat spacing is adequately close to the order of centimeters (Laubach et al., 1992). Many visible fractures are existing in cores taken from coal seams. However, core observations rarely differentiate the hierarchy of fracture sizes. Hence, the existing information about the cleat spacing is difficult to compare. Spacing data measured from core may account for all visible fractures, while outcrop and mine scale studies typically select fractures of a given size to measure. Cleat heights of a given lithotype seam of coal were determined within 0.5 mm (Dawson and Esterle, 2010).
The cleat system, composed of face cleats and butt cleats, creates interconnected pathways for gas flow within coal seams, facilitating the extraction of CBM (Sharma et al., 2023). One may readily quantify the difference between cleat sets in most outcrops and core samples. Through-going cleats which are formed first are known as face cleats. The shorter cleat which normally ends at a face cleat is the prominent type of cleat formed later and is called butt cleat (Laubach and Tremain, 1991; Kulander and Dean, 1993). According to Laubach and Tremain (1991), a variety of cleat sizes characterize the population of cleats in a coal bed. These fracture sets are shown in Figure 2. It can be easily recognized the cleat heights; however, size variations are also obvious in cleat lengths, apertures, and spacing.
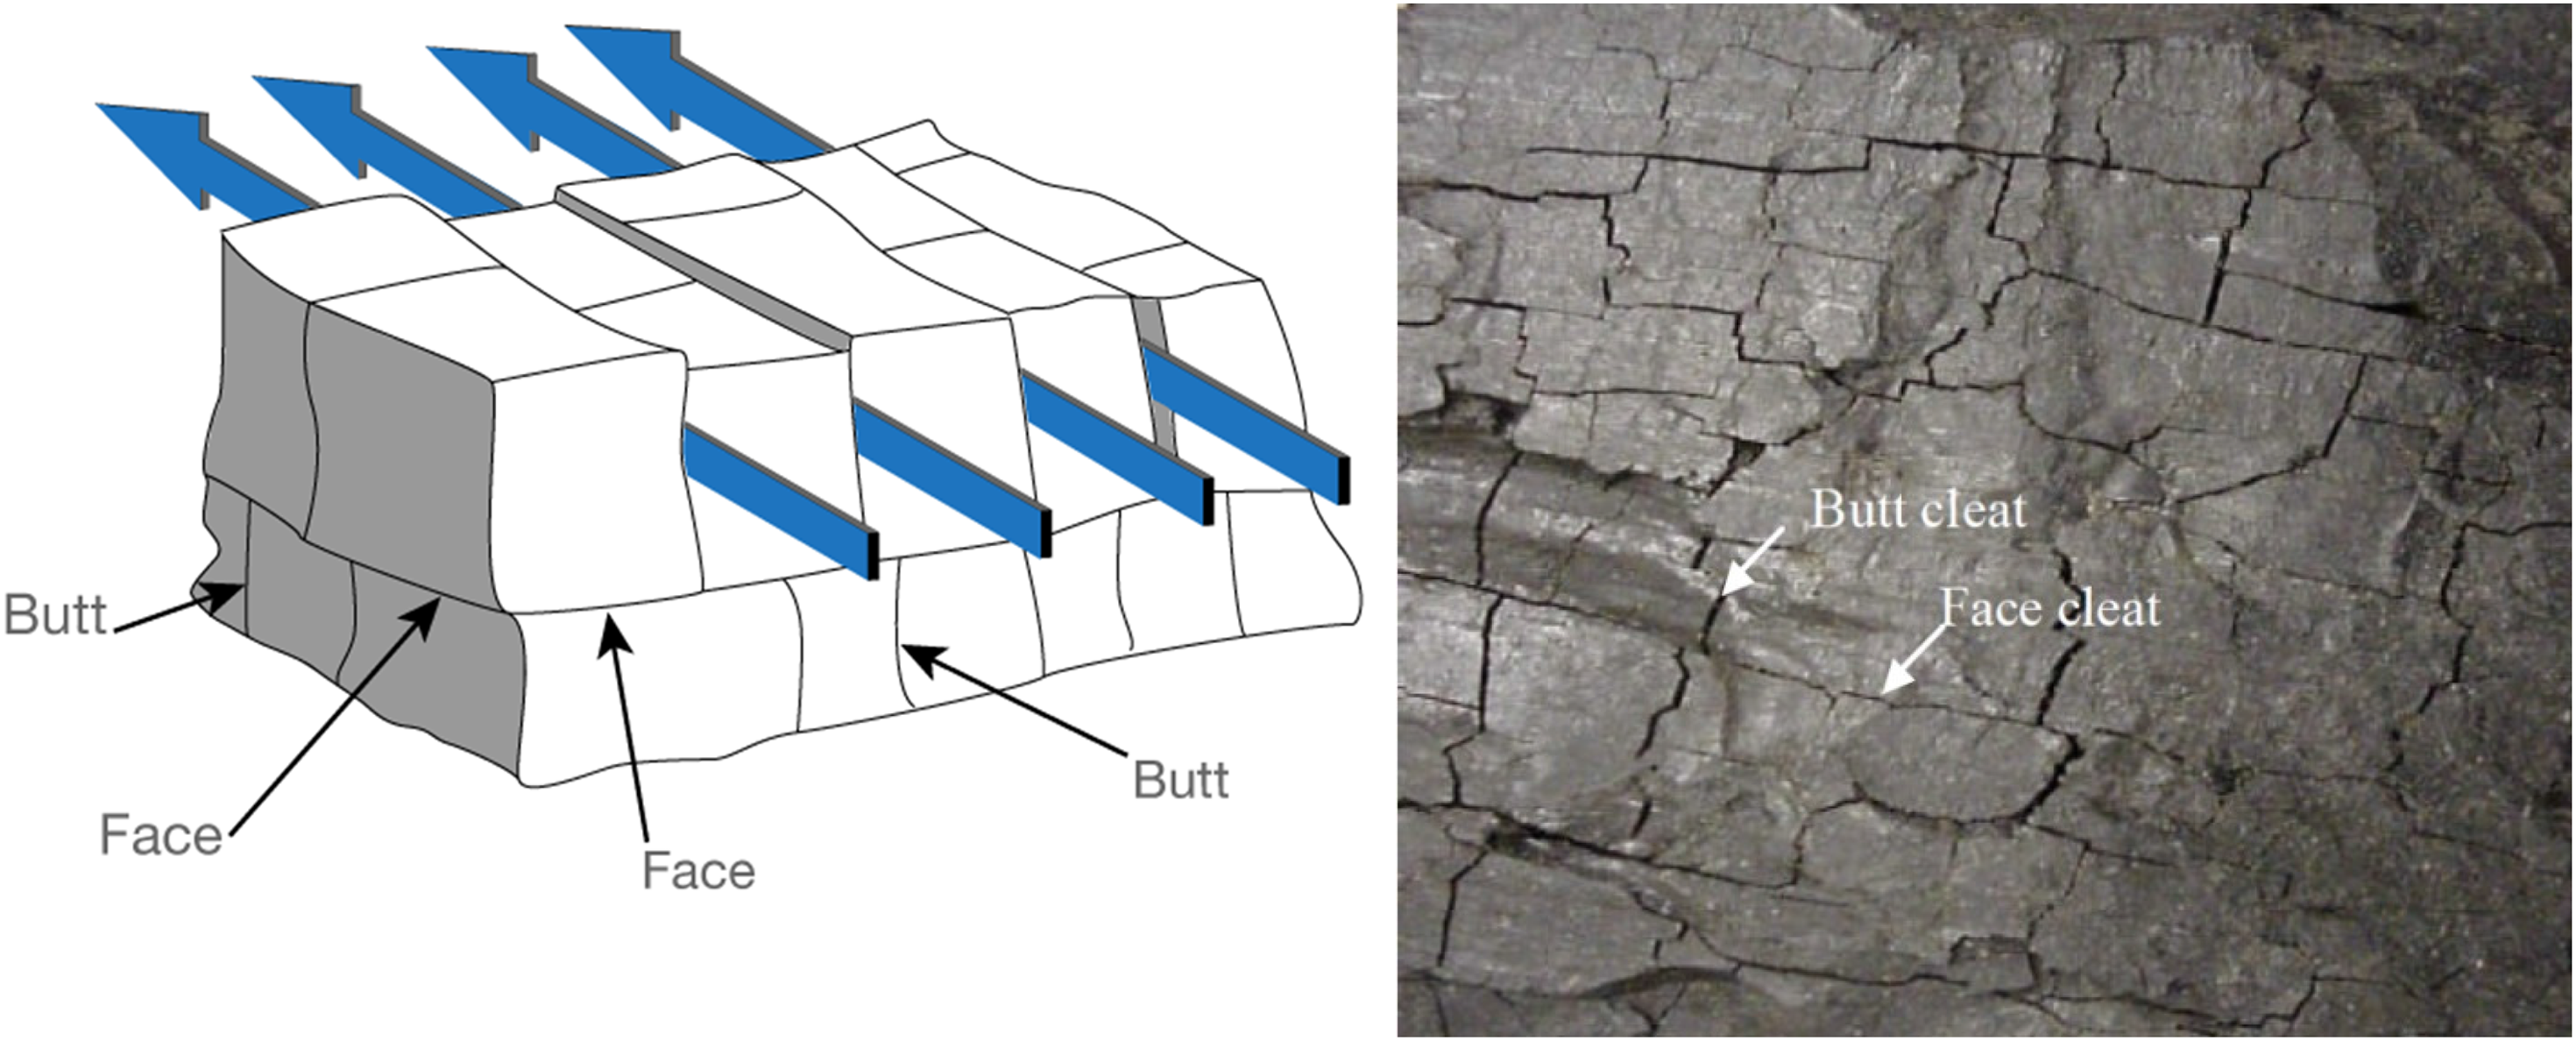
Butt cleats and face cleats in coal (right: Sereshki (2005) and left: Scott (1994)).
One notable attribute of cleat formation is the magnitude to which they are developed in many coal beds with all grades of maturity. Laubach et al. (1998) believe that cleats are normally much more deeply developed than those fractures that may develop in adjacent noncoal rocks. In comparison to typical fractures in other rock types, this feature of cleats is an important indication to identify cleat origins. Cleats most frequently occur without any visible shear offset. Hence, they are termed opening-mode fractures.
Yet such fractures preserve little evidence of the loading conditions that caused them. A variety of reasonable scenarios have been developed to identify the origins of cleats (Close, 1993). However, there are still no explicit, testable predictions to be used to identify the best analyses.
For carbon dioxide sequestration and methane recovery processes, the adsorption has played an important role (Perera et al., 2012). Also, coal maceral affects in cleats spacing (Littke et al., 1989). Due to the increasing significance of coal beds as the source of methane, the identification of cleat origins and other characteristics is a great concern for geologists and miners. One knows that understanding the properties of natural fractures is a critical point for development of a proper way to extract CBM. Furthermore, to gain knowledge on coal fractures is essential for planning exploration and development strategies due to their important role on the recovery of methane as a clean source of energy. Despite many researches on the identification of fracture systems in coal seams, there is still a need to employ a cost-effective and almost easy-to-use image processing technique to analysis cleats and identify their spacing. The results can provide insight into gas drainage modeling (Sereshki et al., 2016).
In this article, according to the experiences and researches of other researchers that were briefly mentioned, it can be concluded that methane degassing from coal has a great role in the safety of coal mines and clean energy production. Many coal mines spend money to optimize the number of methane gas suction wells, and providing better information about the state of coal mechanical parameters to the engineers of these mines creates a better understanding in the design of methane gasification. Since the coal cleats are the main way of gas molecules moving from the coal to the gas suction wells, therefore, a detailed examination of these cleats and obtaining their physical parameters will greatly help the degassing rate. Due to the fact that there are joints all around a uniform piece of coal and the methane molecules trapped in the coal begin to move after the change of pressure on this piece, so the distance between the cleats in a coal is inversely related to the gas-release rate. It contains methane and is very important in degassing operations. As a result, calculating the distance of these joints from each other has a significant contribution to the volume of gas transferred. According to this matter, a new method to obtain the required parameters in coal samples has been introduced by the computed tomography (CT) device. The existing samples have been used to calculate other physical parameters of coal such as permeability and porosity. In this research method, CT imaging technique is used to collect and observe the network of cleats in an isolated piece of coal. Then, the images obtained by image processing are studied and the distance between the cleats is obtained by statistical methods. Finally, the results are used to model the coal block.
In the modeling of methane degassing, the results of this article are used to estimate the dimensions of a coal block and the rate of gas discharge from this coal block can be calculated. In this case, we can refer to the article by Taheri et al. (2016).
Materials and methods
Image processing
Image processing is an operation in which the special image is converted into its digital form, and then operations can be performed on it to obtain a series of specifications and useful information can be extracted. In this technique, a video or photo frame is converted into distributed signals and the output of the operation can be an image or an image-related feature. Typically, image processing converts 2D images into signals that can be used in computer calculations that have been previously defined for this purpose.
This science has many applications in various sciences now and is among the technologies that are developing rapidly and its use is expanding. Image processing is also one of the important research areas in computer engineering science nowadays.
In general, image processing includes the following steps:
Optical scanning of the image or digital photography and entering it into the software. Analyzing images that include information compression, image enhancement, and recognition of required data that cannot be detected by the human eye, such as satellite images. Get the result that can be an image or a report of the images that have been analyzed. visualization—seeing images that cannot be visible; image recovery and creating a better image; higher resolution of images; measuring a pattern in the image; and recognition of images.
The goals of image processing can be divided into the following groups:
Two methods are used to process analog and digital images. Analog or optical image processing techniques can be used for photographs as well as printed images. Researchers usually use different principles of image interpretation for this technique. The analyst usually studies all the areas that can be analyzed in the image based on his knowledge. Association is another important image processing tool. Consequently, researchers use a combination of their personal knowledge and existing data to process the image.
By using different image processing techniques, these images can be manipulated on the computer. Since the raw data has deficiencies in the imaging time due to limitations in the sensors of the satellite platform, therefore, in order to fix these defects and create better information, it must go through various stages of processing. The general steps that all types of data go through when using digitalization techniques are: preprocessing, image enhancement, and extracting the required information. Image processing is used in many engineering sciences. For example, in mining and oil engineering, Klie et al. (2006) process the management of oil reservoirs and Hattangady et al. (1999) have been investigating mesh generation in finite element mesh directly from bitmap images. In drilling and blasting, Lopez et al. (1995) also used the image processing for the amount of crushing. Also, Viljoen et al. (2014) was studied by X-ray the filler and main coal cleats. Recently, a new method for simulating coal cleats has been devised that is called CCSIM (cross-correlation-based simulation; Tahmasebi, 2017; Tahmasebi et al., 2017, 2016). In this research, image processing-based computer was used to capture coal cleats and identify the cleats spacing.
Sampling and imaging
The method includes providing images of the coal samples and processing them by a computer. To identify and calculate the cleats spacing, which was the main subject of the present study, computer-based image processing method was proposed. To do so, several large and uncrushed coal samples were selected and scanned. In the current study, coal samples were taken from Tabas Coal Mine in central of Iran. This mine is the biggest coal mine in Iran and is being extracted according to the principles of long-wall mining method. The location and situation of Tabas mine along with the other coal mines of Iran are shown in Figure 3.
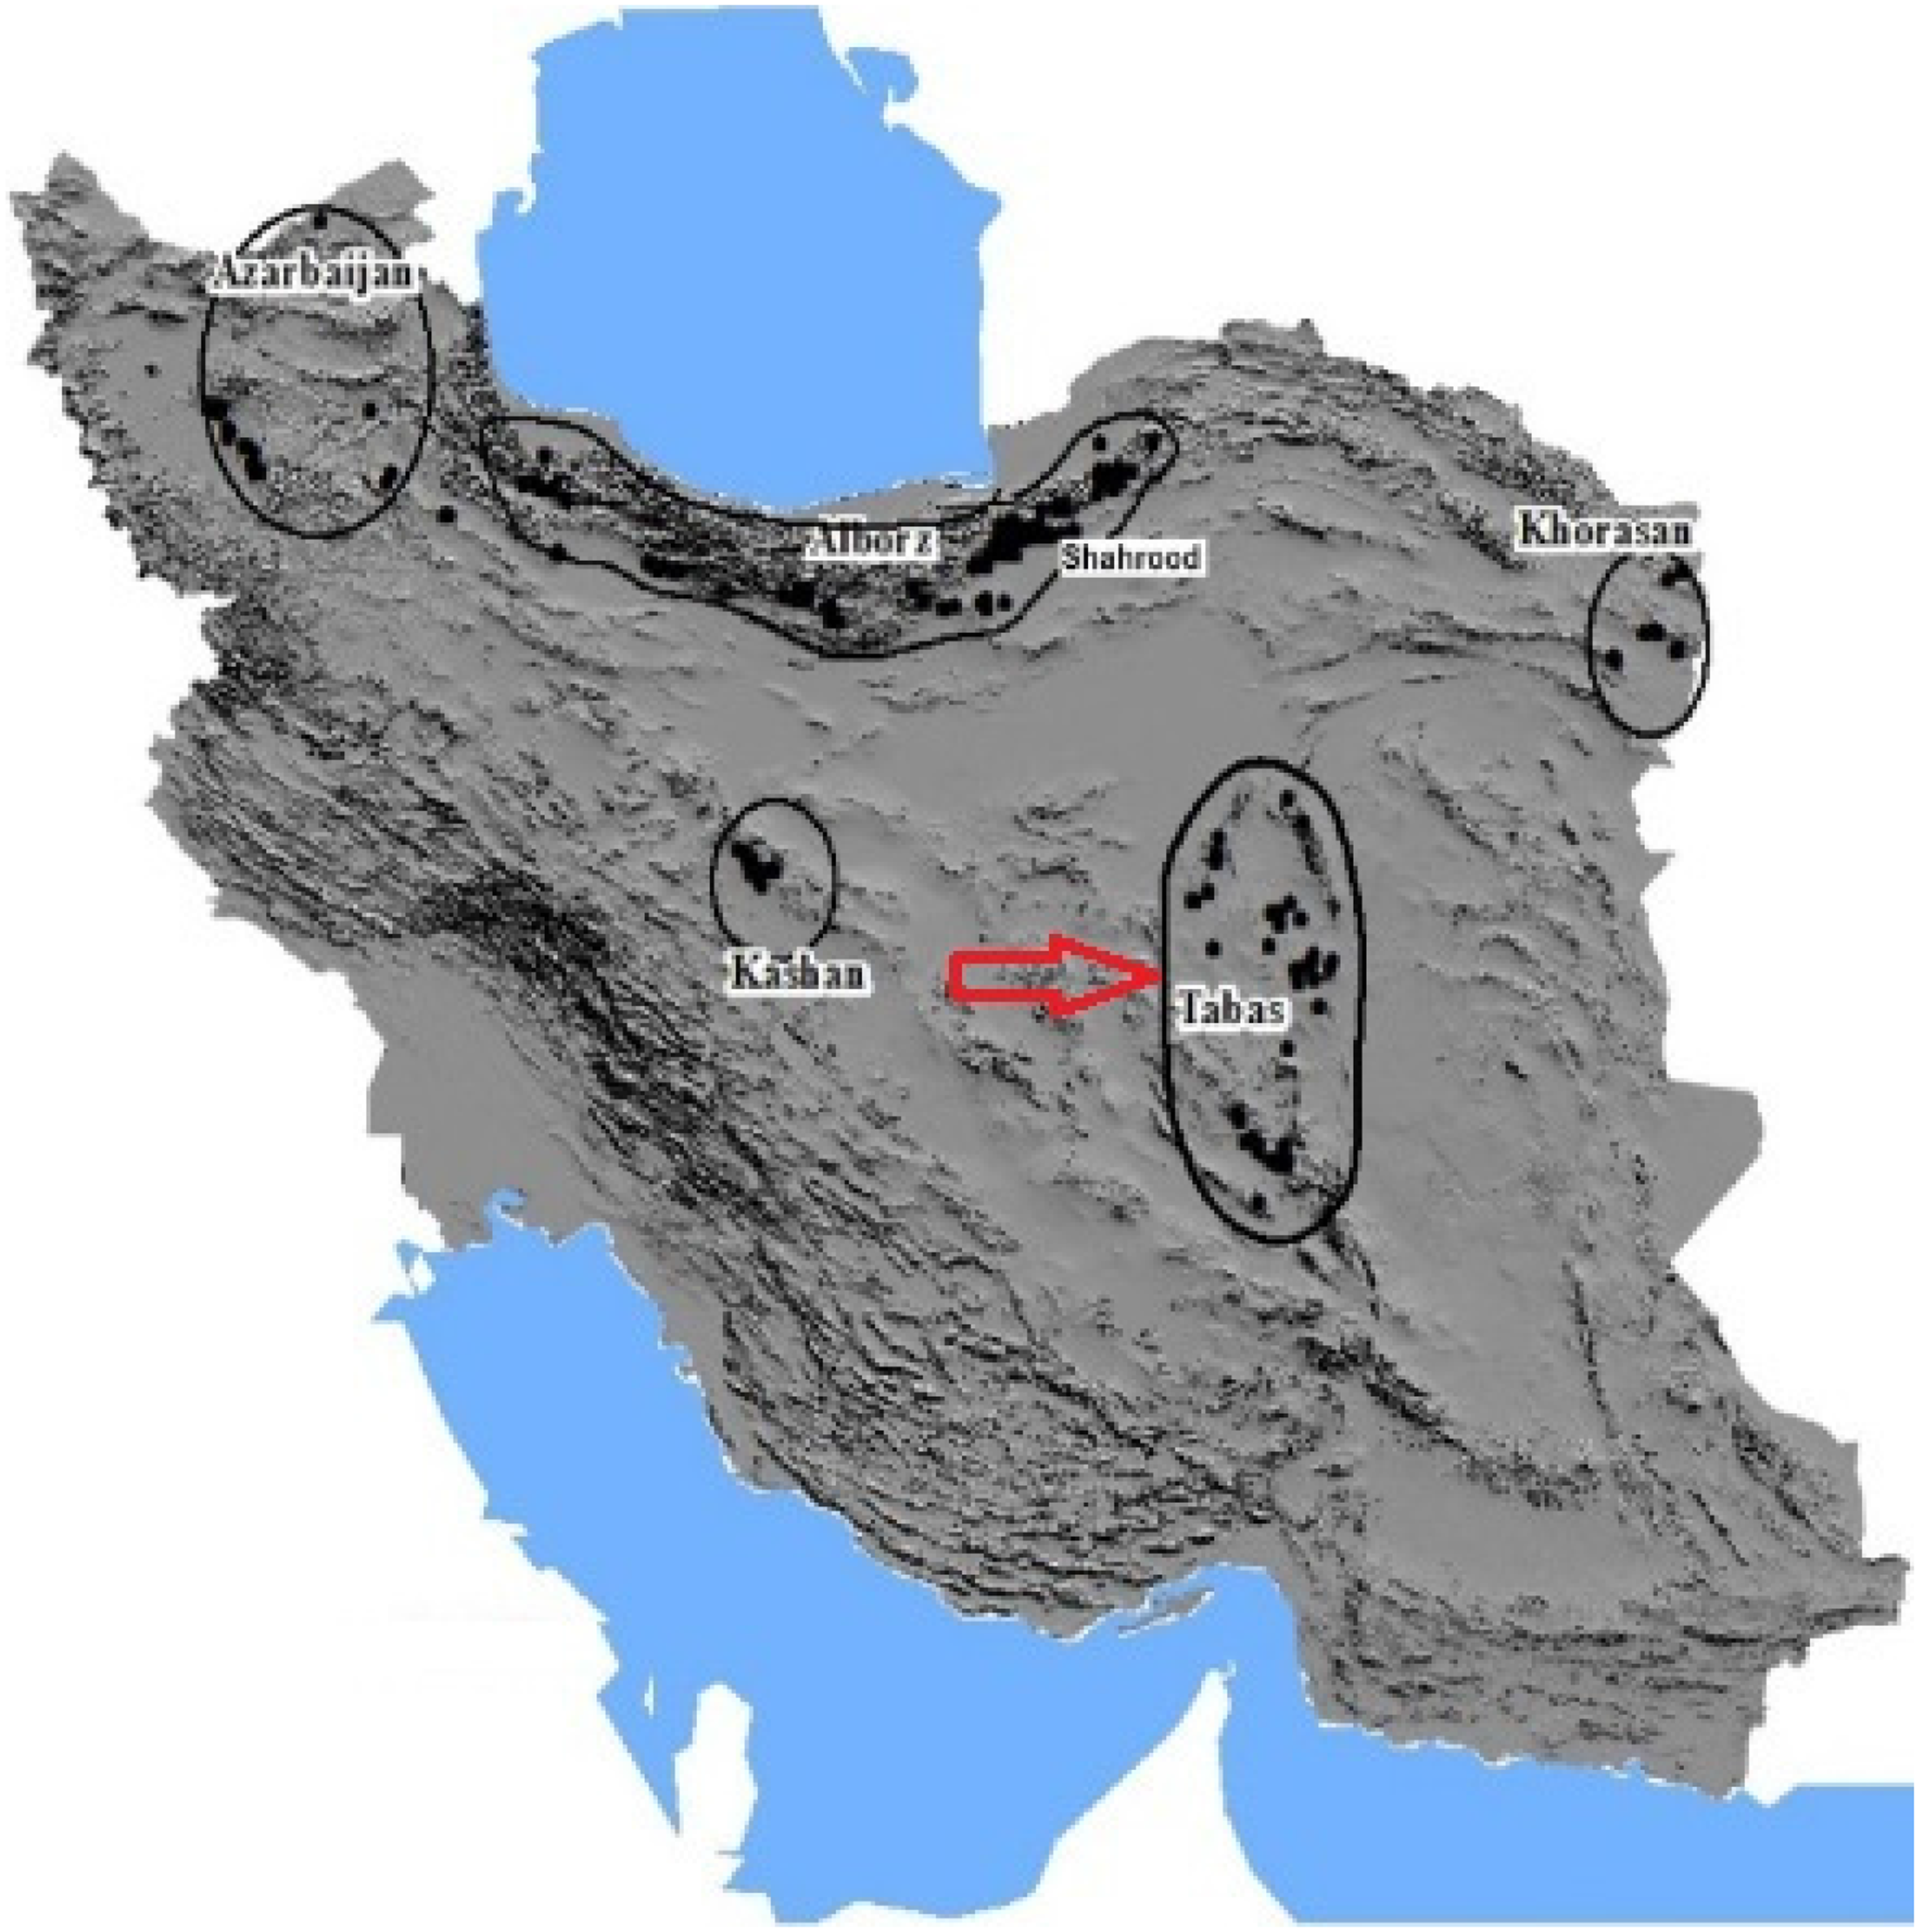
Iranian coal mines, particularly Tabas Coal Mine (Taheri et al., 2016).
The samples utilized in the study were taken from both the intact coal seam and being extracted seams of the study mine. To fulfill the objective of study, the samples were collected without any change in their structure. The large and intact coal samples were gently separated from the faces; then, they were packed to keep the coal natural moisture. This was a way to preserve the cleats spacing and avoid the samples become dry before conducting the imaging operation. The packed samples are shown in Figure 4.
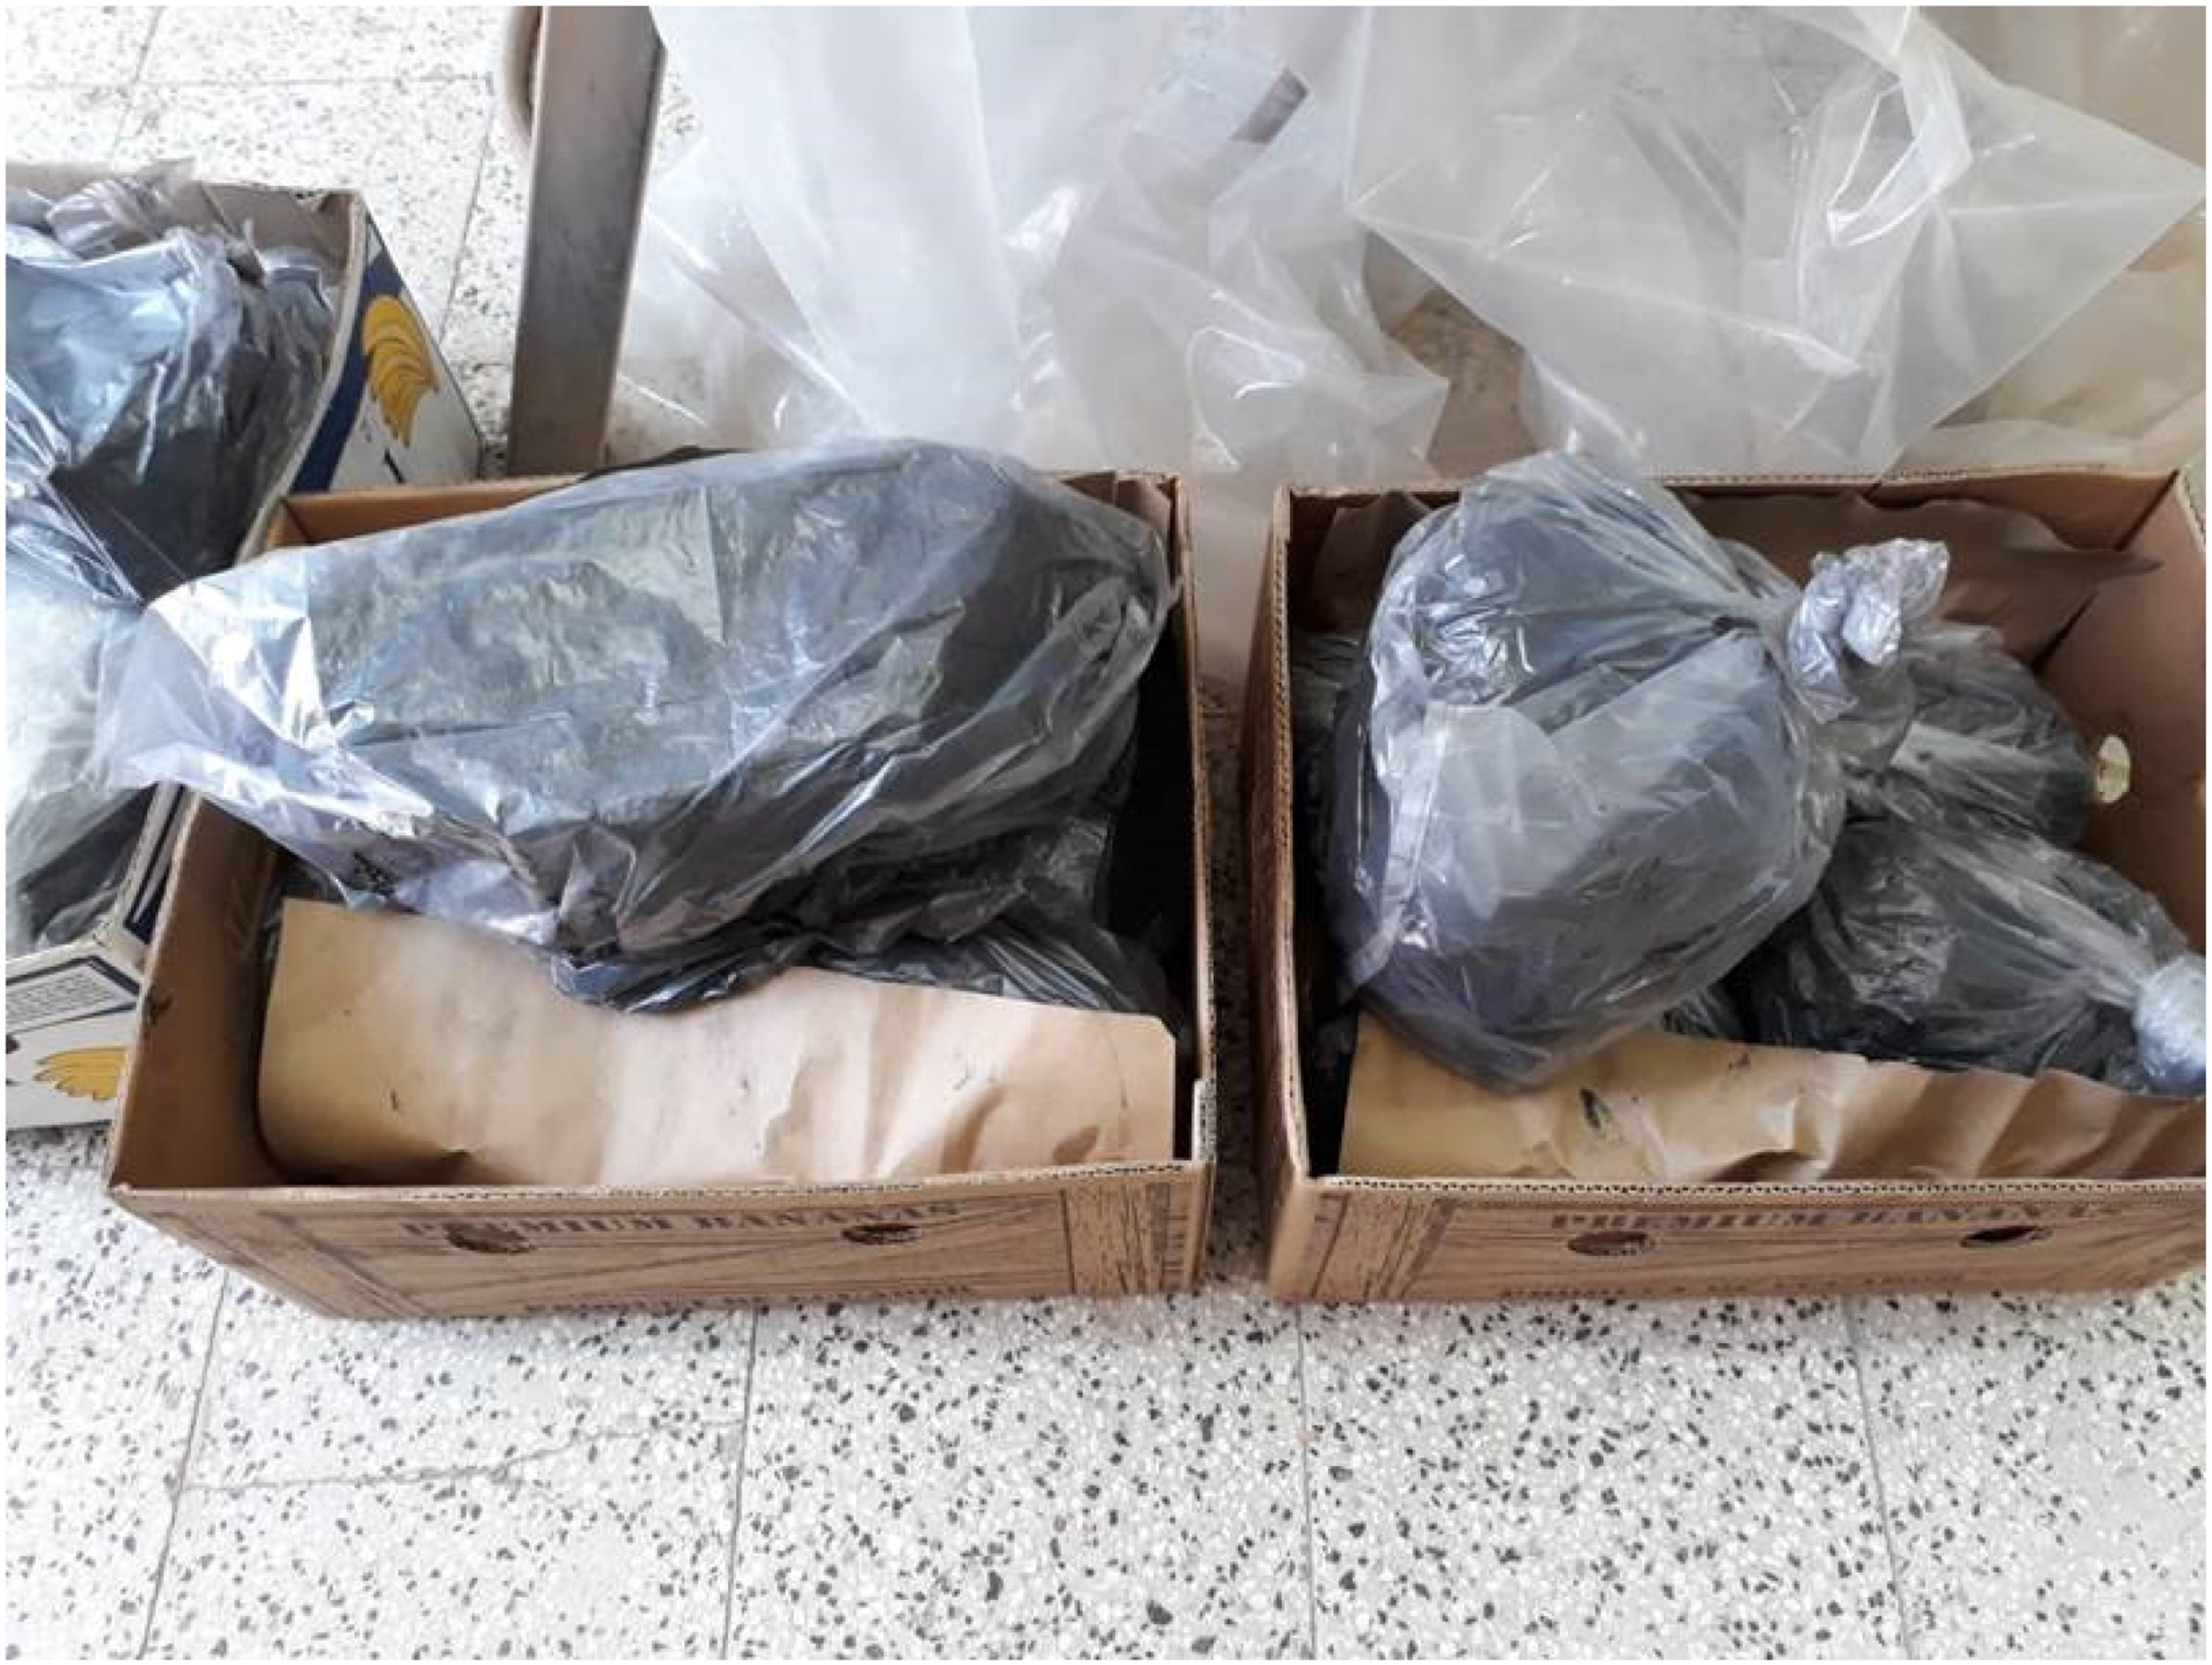
The packed samples of Tabas mine.
The samples were selected after carefully analyzing them and observing their physical conditions. The selected samples were then prepared for imaging operations. Preparation included separating the crushed pieces of coal from the samples that have been taken from the coal blocks. The crushed pieces were obtained due to the transportation or other reasons which would cause error in imaging process. The determined coal samples undergo the CT scan and the imaging operations should be prepared such a way that the images are taken, three-dimensionally. They were finally analyzed by conducting the processing operations (Figure 5).
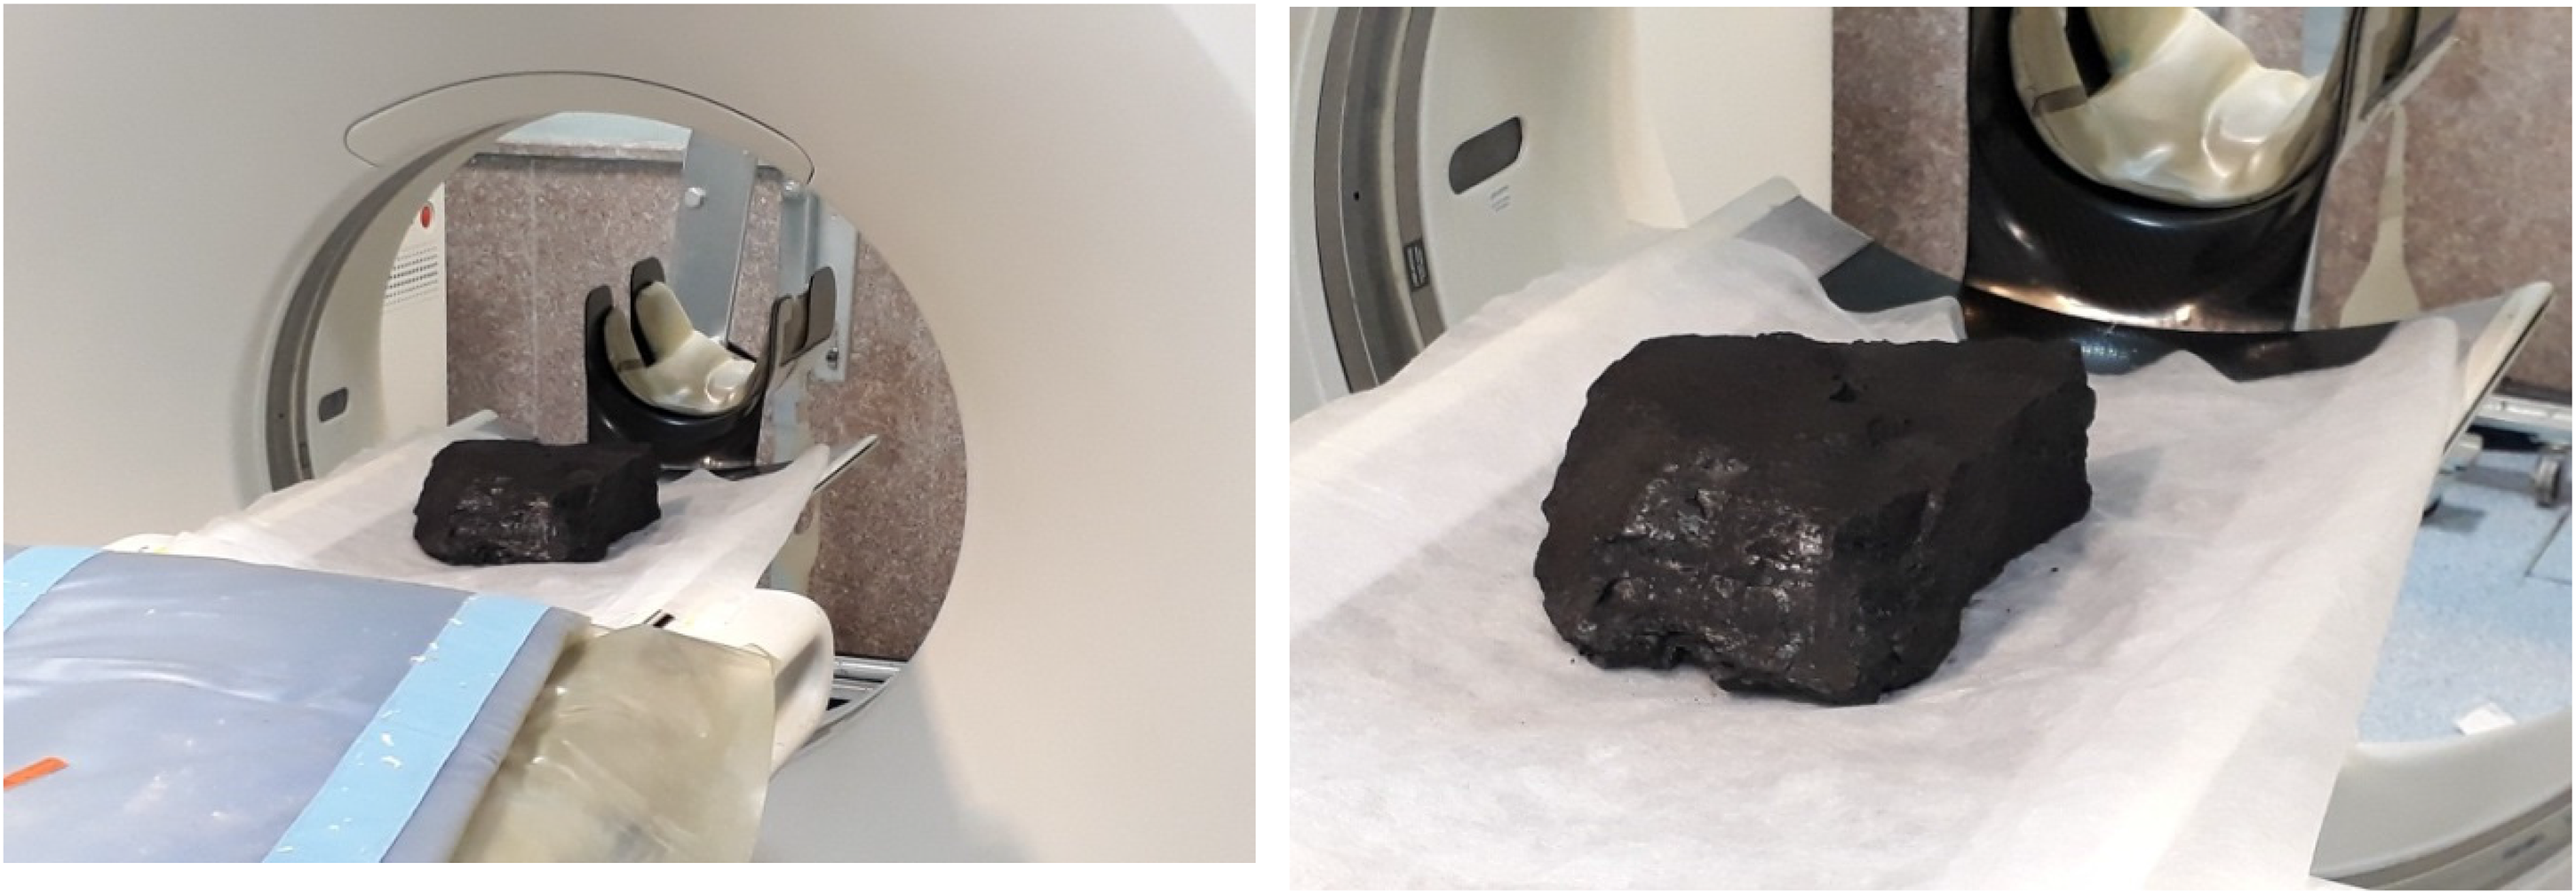
Computed tomography scan operation on the coal samples.
Image processing
After conducting the CT scan operation and taking approximately 1500 images from different sections of the coal samples, the images were analyzed. To determine the cleats spacing, computer-based image processing technique was adopted. Figure 6 illustrates some instances of coal CT scan. The CT scan device used in this research is one of the most advanced imaging devices inside a solid part, which has the ability to take different sections of an object. Since it was necessary to collect the information of seams in several faces in a piece of coal, the CT scan machine took the image in five sections of a piece of coal at the same time. Because there is a need to calculate the seams at the minimum distance of the seams, imaging was done in five sections. As can be seen in Figures 6 and 7, the seams inside the coal are seen as pale gray lines, and the integrated parts of coal are completely black. An interesting point about some of the prepared images is the filling of some coal cleats by pyrite, clay, and other coal fillers. Because one of the samples was broken and filling was observed, identification of pyrite and its analysis can help in the manner and source of coal (Liu et al., 2008).
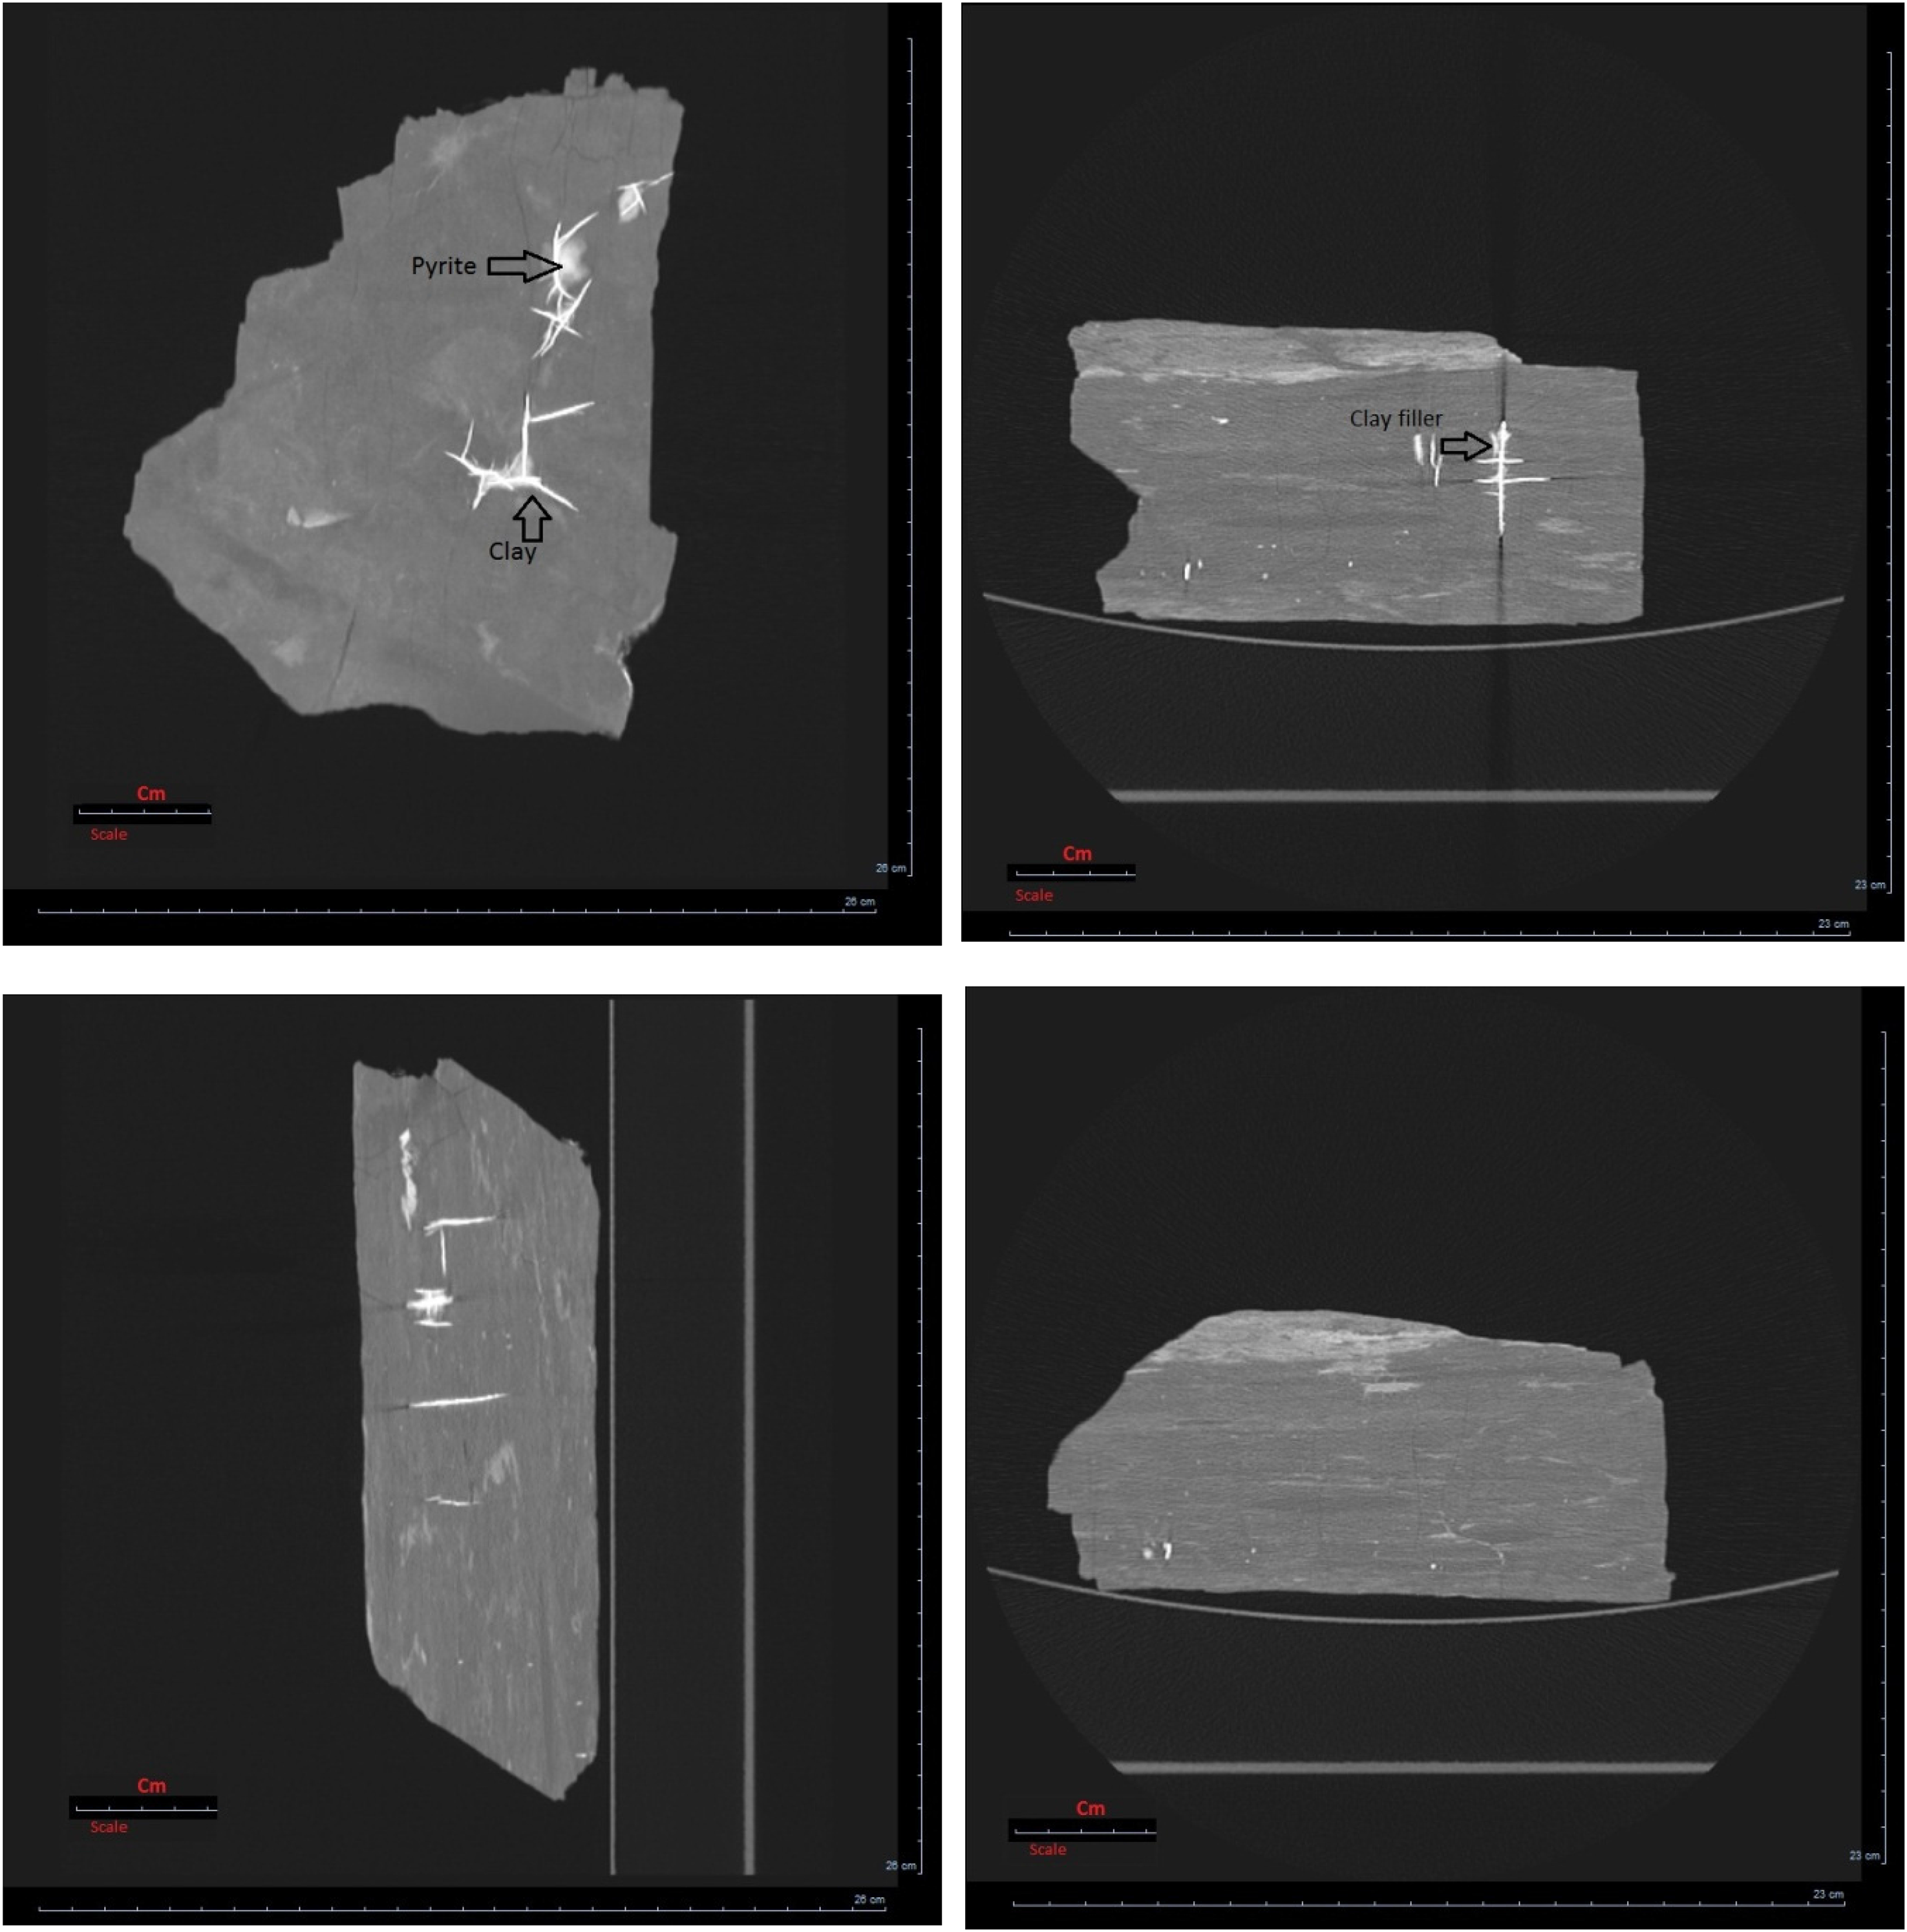
Computed tomography scan of vertical and horizontal sections of a coal sample.
Computer image processing on coal sections and cleats determined on the images.
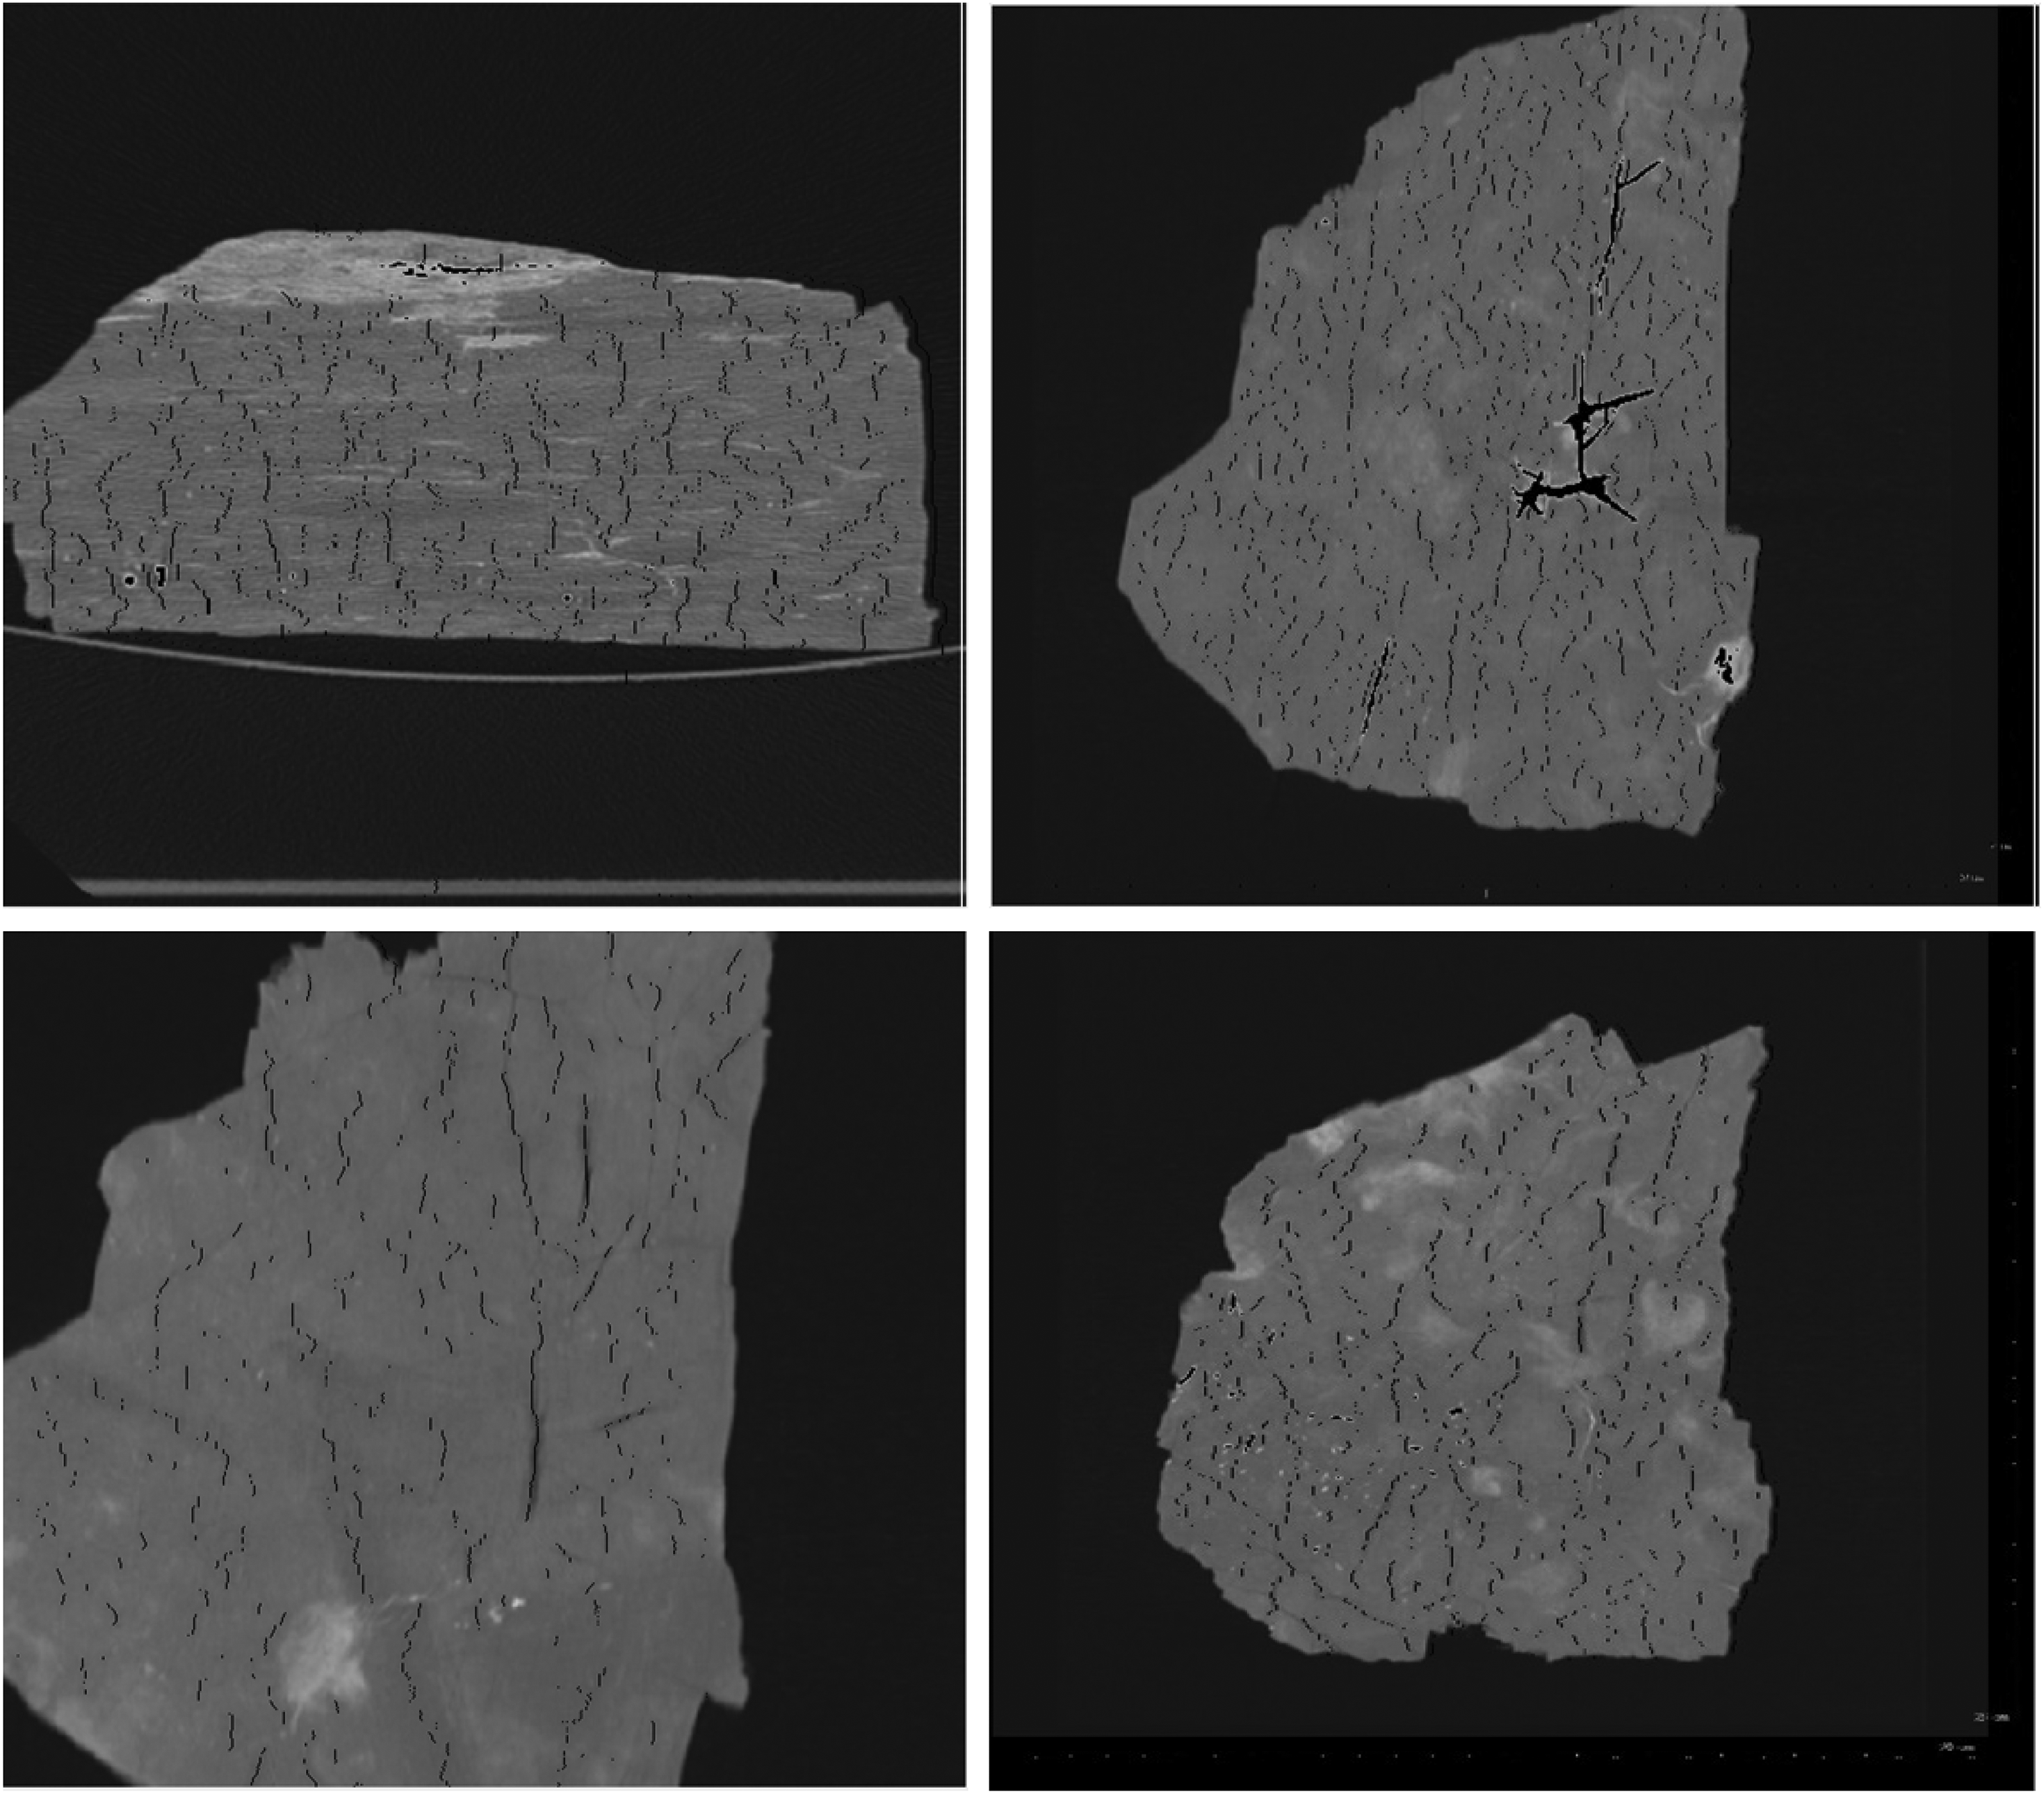
To process the images of coal sections obtained by CT scan, a program was written in MATLAB Software R2014a and the necessary codes were added in for identifying the black pixels, which are continuously stretched across the images. Among 1500 images taken from the coal sections, 50 images were randomly selected and the image processing operation was conducted over them. The results obtained from the image processing in some sections are shown in Figure 7.
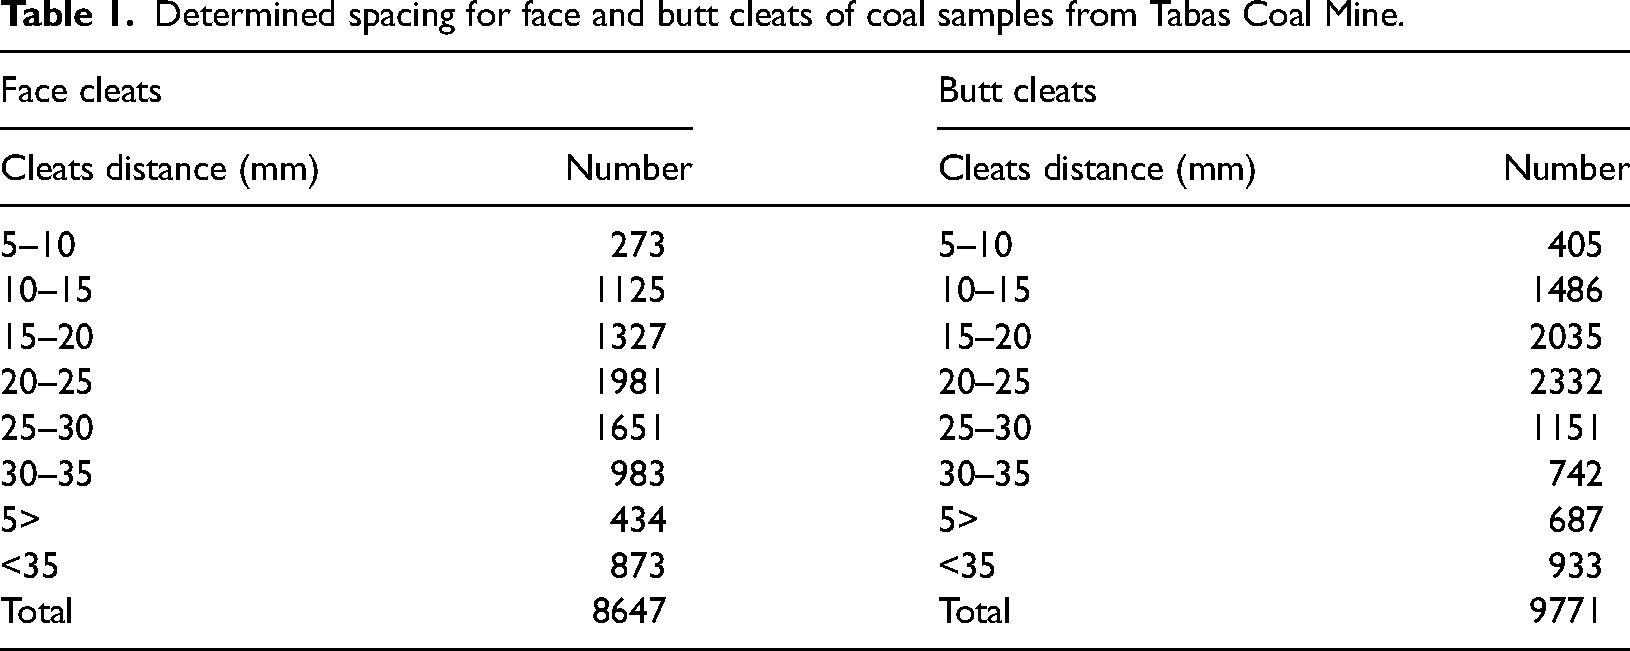
The basis written in MATLAB software is such that the image entered into the program is converted into very small pixels according to the program, and for each pixel a horizontal and vertical code is assigned to an individual. Then, according to the instructions of the written program, the image has been changed one by one on them, and the brightness or darkness of that pixel is checked and its rate is taken in pixels. Now, after image processing, the comparison between adjacent pixels is done. A specific color code belonging to the pixels is defined as the existing seam color, and the pixels containing this color code are defined as seams for the operator. Available pixels are divided into three categories based on color. Completely black pixels are coal seams or voids, gray pixels are defined as coal, and light and white pixels are coal fillers. Each of these colors has its own code in the written program and a code is issued for each pixel. Now, with the programming command, the pixel distance with this color code is decided and shown statistically. As the images had dimension attributes and their length and width were specified and the coal size was known, the average distance between the cleats was determined. The obtained results were determined as a table. The results are shown in Table 1.
Determined spacing for face and butt cleats of coal samples from Tabas Coal Mine.
Results and discussion
Analyzing the results of image processing indicated that the face cleats have the most repetition in an interval between 20 to 30 mm and the butt cleats in an interval of 15 to 25 mm (Figure 8).
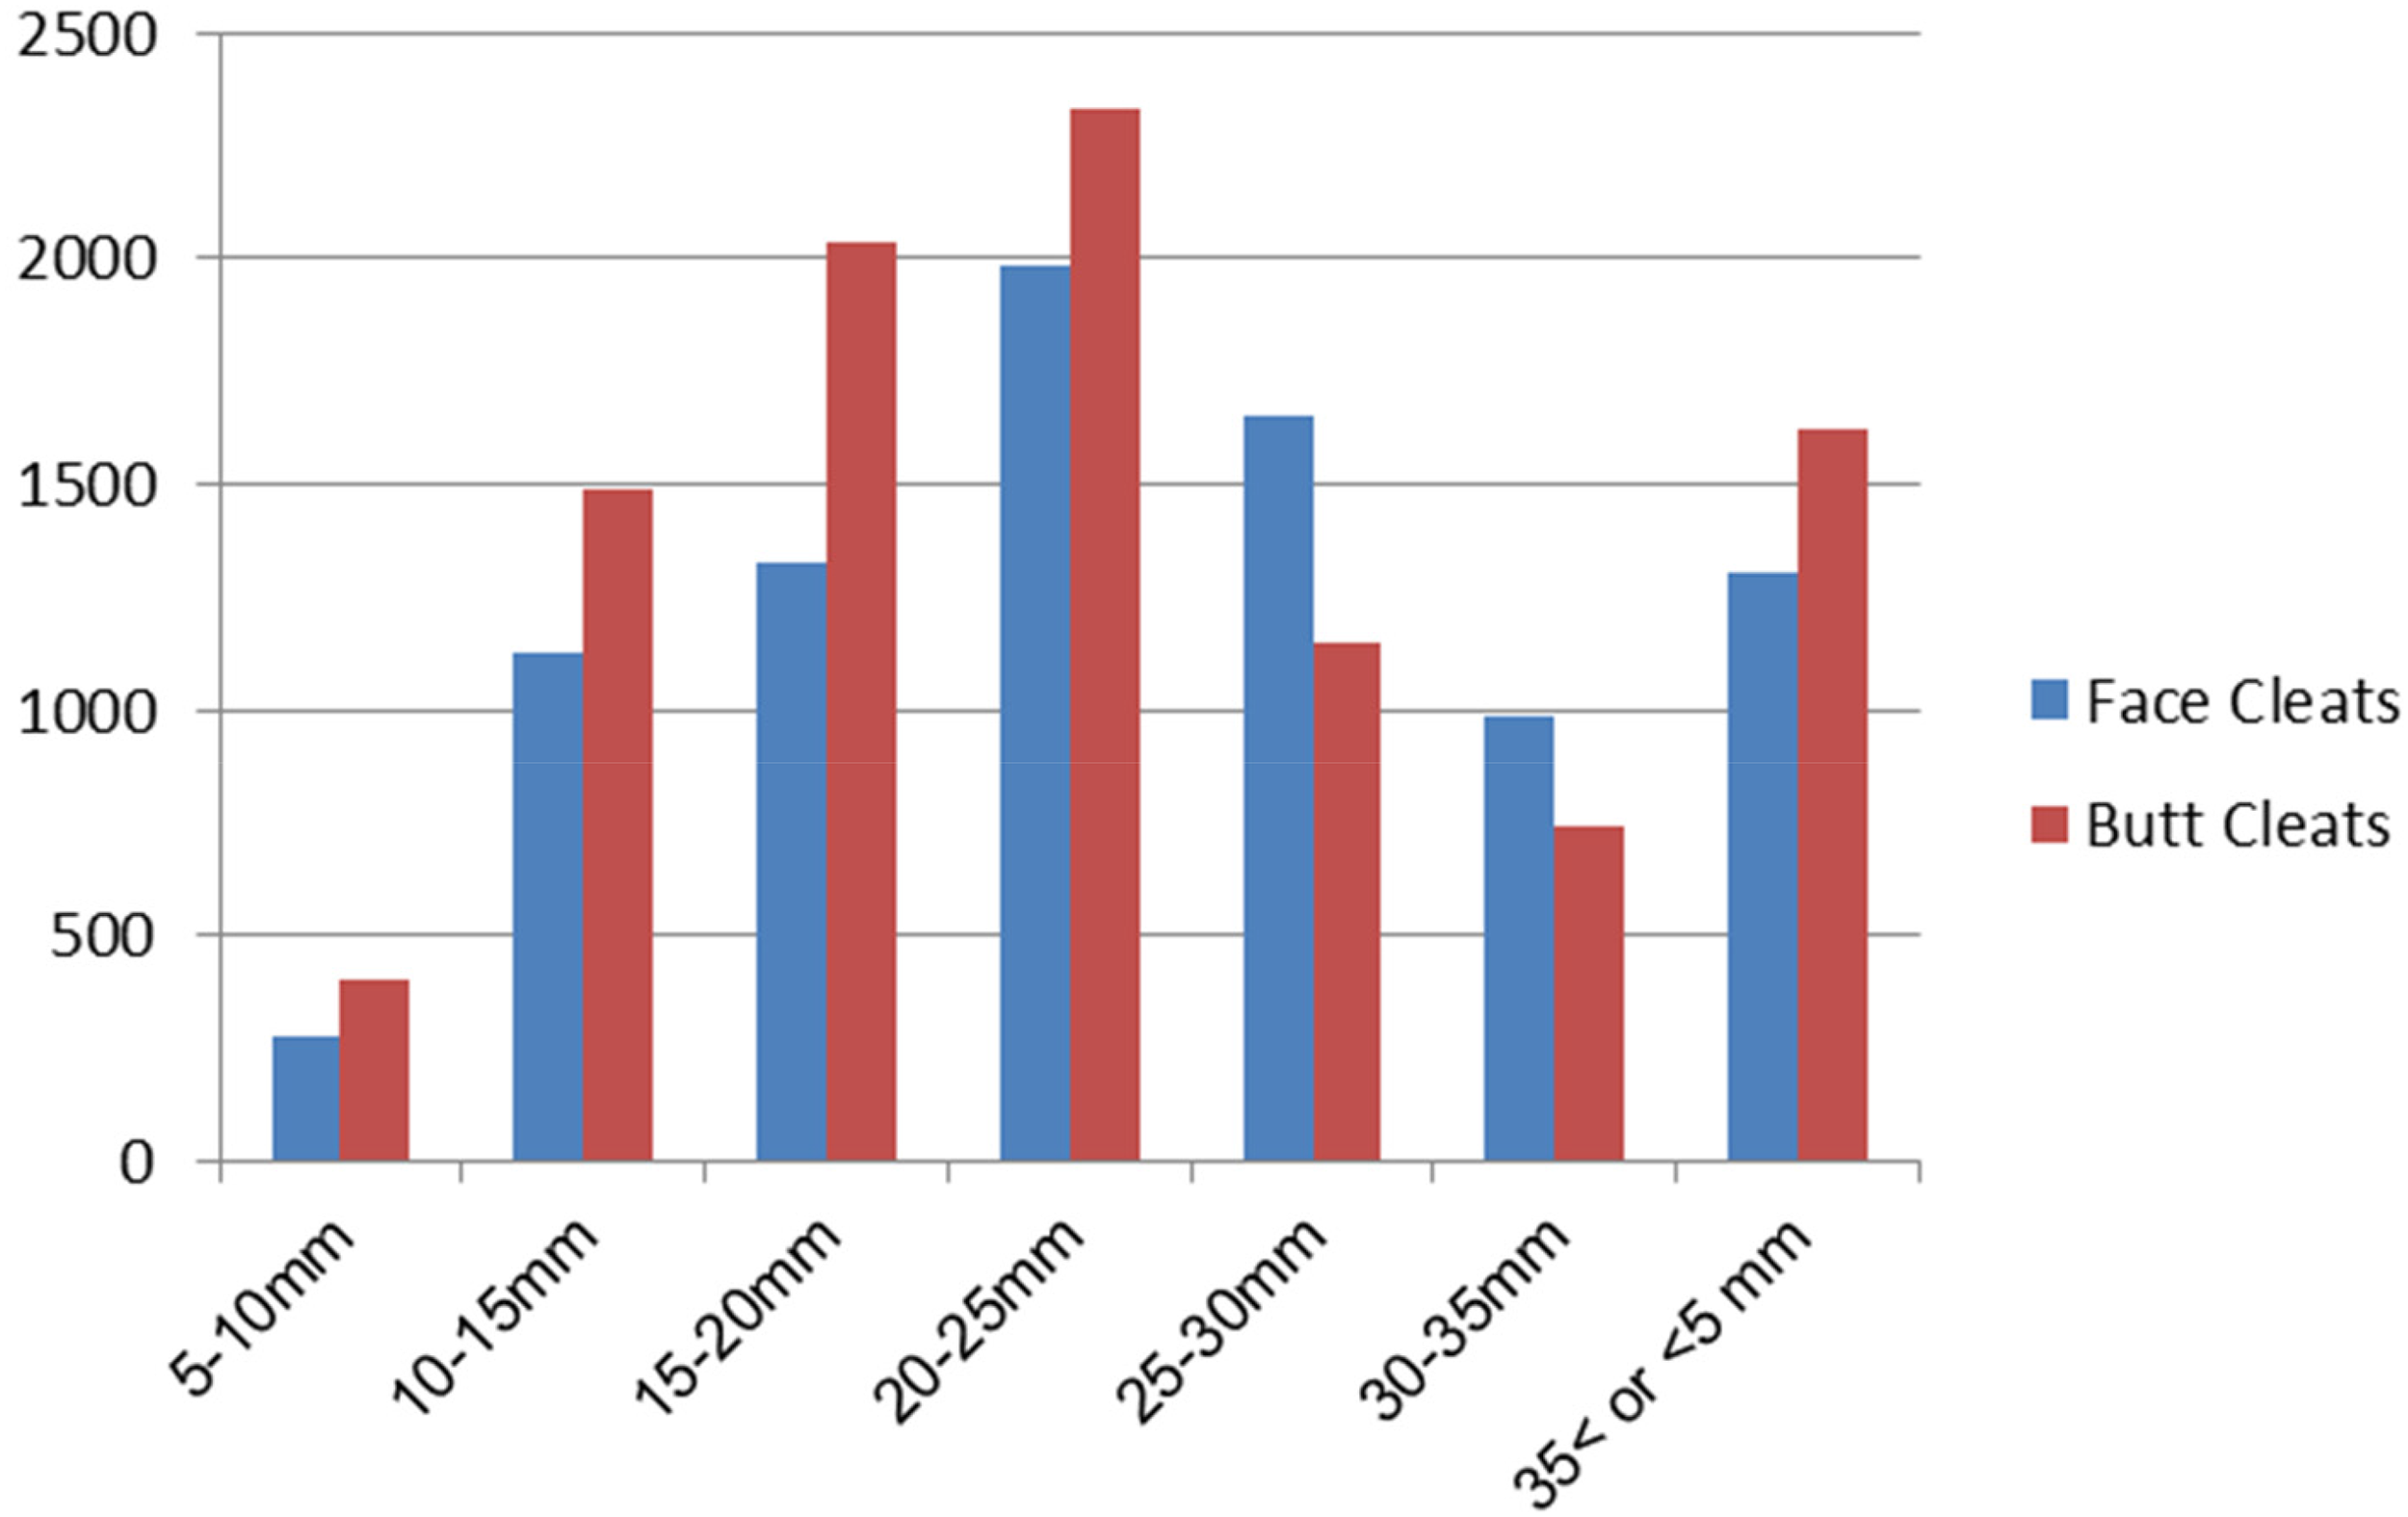
Spacing of face and butt cleats after image processing by computer.
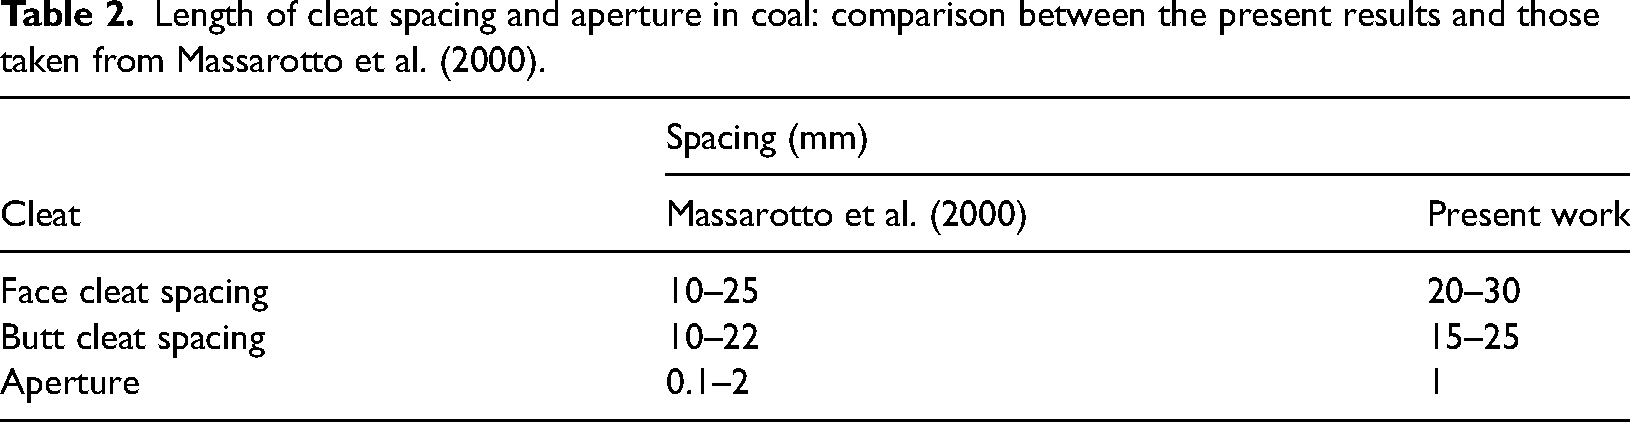
In research carried out by Massarotto et al. (2000) on some Australian coal samples, the approximate width of the aperture and the length of face and butt cleat spacing were determined (Table 2). Their findings verify the result obtained from a computer-based image processing technique presented in this article. Because different coal mines have various macerals due to their formation, so it has different cleats spacing. The spacing is due to the geological conditions. The spacing coal cleats directly affect the amount of methane gas recovery from coal.
Length of cleat spacing and aperture in coal: comparison between the present results and those taken from Massarotto et al. (2000).
Coals with bright lithotype seams, with a high percentage of vitrinite macerals, have a greater number of cleats than dull coals, Close (1993) and Ryan (1995). The mechanism of formation of coal cleats has been described by a number of researchers. These scientists have realized that the main reason for the formation of cleats are the intrinsic tensile force, fluid pressure, and tectonic stress (Laubach et al., 1998; Su et al., 2001).
Cleats play an essential role during methane degassing from coal. It can be stated that the distance between the cleats in coal cause to increases or decreases the gas emission and also the movement of gas molecules to the low-pressure area. According to the research done by Taheri et al. (2017), to model the movement of gas molecules, the spacing of coal cleats is needed that shown in Figure 9.
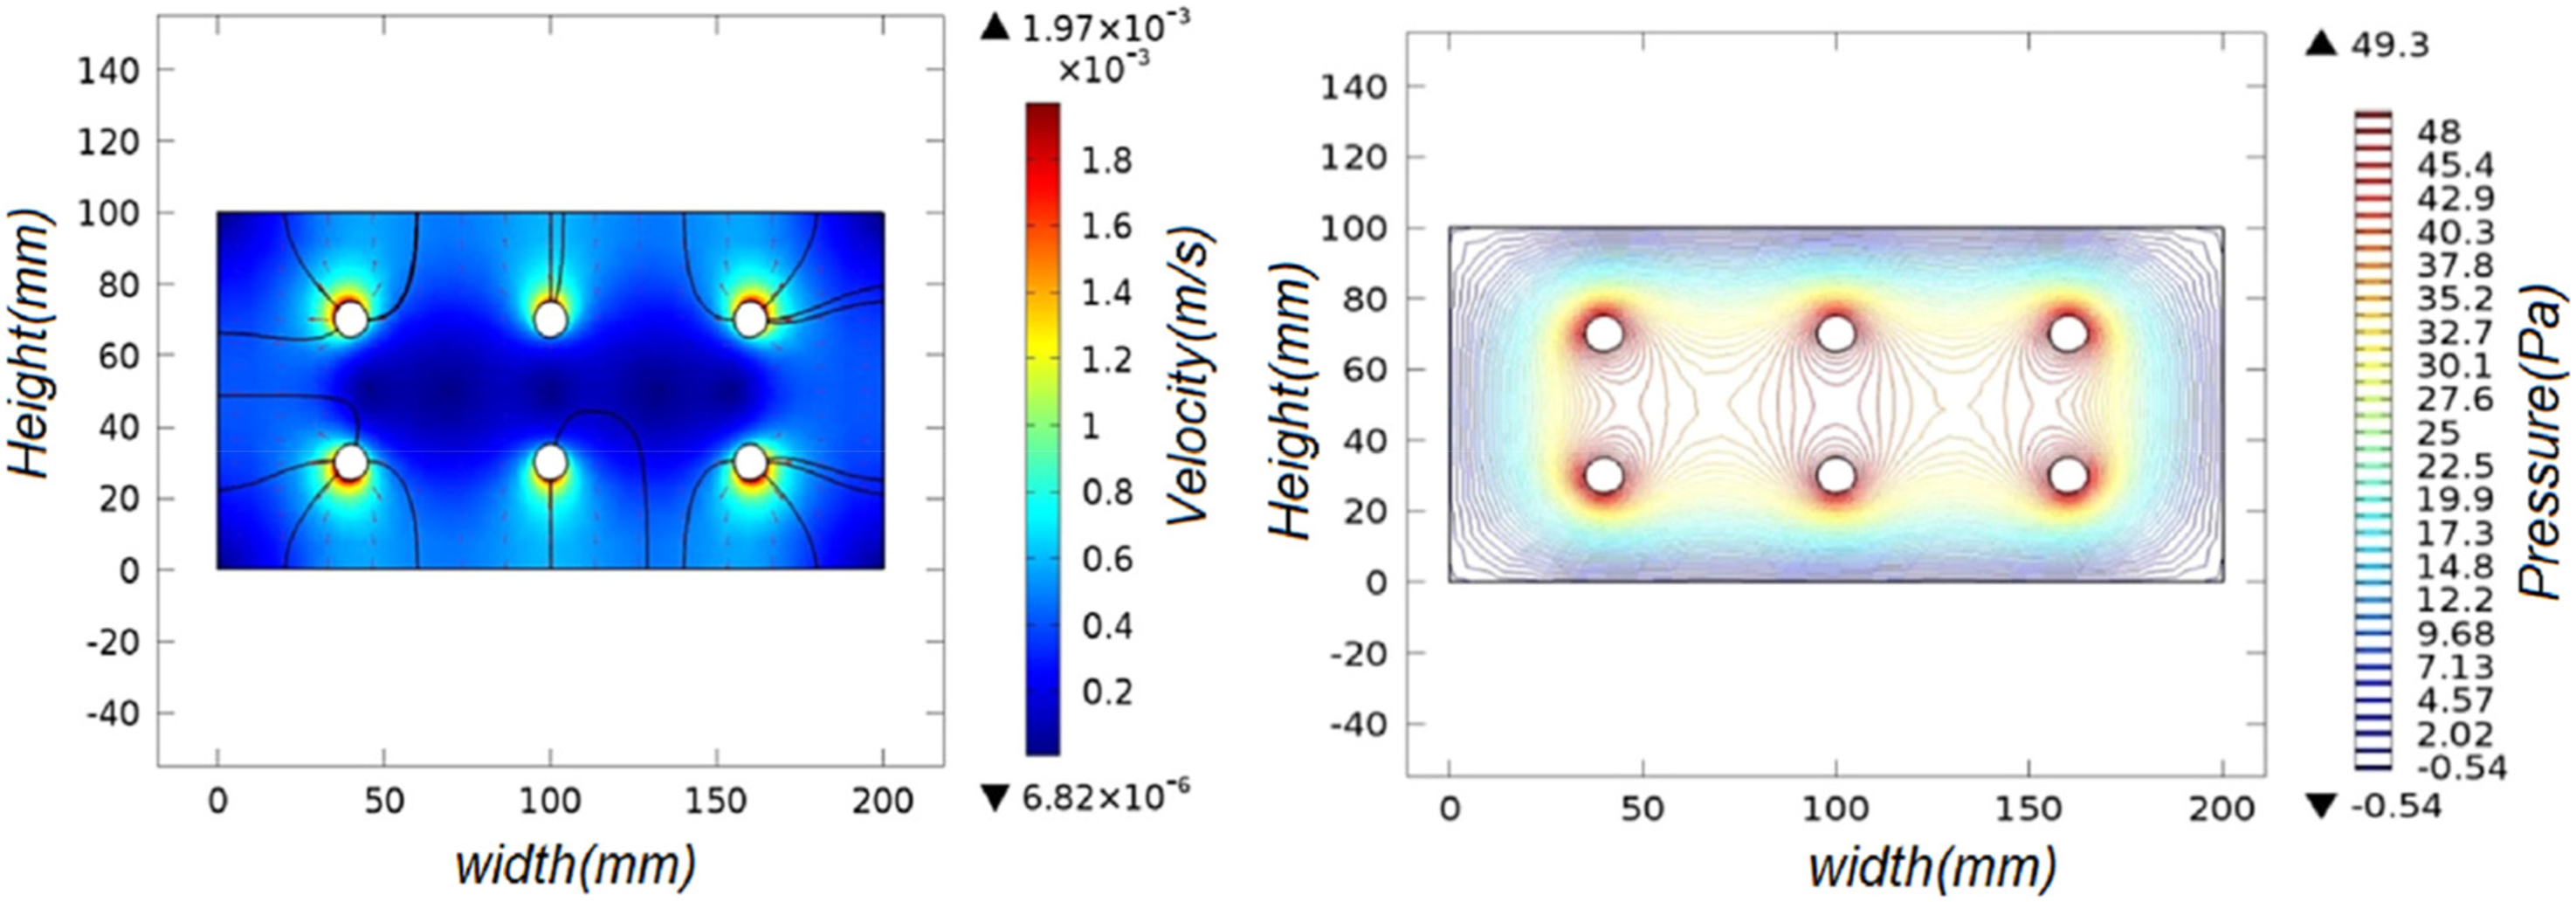
Using the distance between seams to model methane gasification (Taheri et al., 2017).
Also, Kirmani et al. (2023) have worked on the parameters affecting the rate of methane gasification from coal, and the calculation of the porosity and spacing of coal cleats has been stated as the main parameters. Mine engineers, based on all the exploration parameters that they have, design different parts of the mine. For the design of the ventilation part of the mine, it is necessary to know the amount of released methane gas. Calculation of the amount of gas emission in coal is made by understanding the geology of coal. One of the most important parameters that directly influence the amount of gas flow is the amount of coal cleats and distance between fractures. In different types of coal, this distance is different and based on the geology characteristics of the formation. From these values, the gas flow rate, the distance between the gas suction wells and the amount of ventilation required for the mine can be calculated.
Conclusions
Among the new achievements of this research, we can mention the preparation of internal sections of coal by CT scan and the calculation of the distance of cleats through the image processing system. Since the distance of coal cleats is one of the important parameters in the amount of methane degassing from coal, in this research, images of coal sections were obtained through 3D CT scan imaging of three coal samples. Using MATLAB software, a program was written for image processing, which was used to identify and highlight the cleat points in the coal. Through the calculations, the distance of these joints from each other was determined and drawn in the form of a statistical diagram. Using this technique, the average distance of the seams inside a piece of Tabas Coal Mine was obtained from each other. The results of a computer-based image processing technique conducted on the images of coal sections indicated that the spacing between the face cleats in Tabas coal sample was 20 to 30mm; while it was 15 to 25mm for the butt cleats. The calculated spacing can be utilized to model methane drainage from the coal seams. Subsequently, based on the results of the model, the spacing of gas suction wells and the time required for gas drainage can be adequately estimated. Likewise, the image processing results by computer can be further used for other divisions working on the other aspects of rocks including hydraulic fracturing mechanism in oil and gas industry. The present study indicates that computer-based image processing can be beneficial for increasing the speed and precision of modeling in earth sciences. Since image processing and computer science and artificial intelligence have recently been introduced in all engineering fields, and by means of these sciences, it is possible to prevent risks and consequences caused by human errors, and the use of these advances will reduce operating costs and increase the profits of mines and industrial factories. Based on the experiences of mining engineers, since most mining operations are based on trial and error, modeling operations before they start can identify many disadvantages and costs. Image processing is one of the main aids for preparing the parameters required for modeling.
Footnotes
Declaration of conflicting interests
The authors declared no potential conflicts of interest with respect to the research, authorship, and/or publication of this article.
Funding
The authors received no financial support for the research, authorship, and/or publication of this article.