
Abstract
In smart cities, sustainable development depends on energy load prediction since it directs utilities in effectively planning, distributing and generating energy. This work presents a novel hybrid deep learning model including components of the Improved-convolutional neural network (CNN), bidirectional long short-term memory (Bi-LSTM), Graph neural network (GNN), Transformer and Fusion Layer architectures for precise energy load forecasting. Better feature extraction results from the Improved-CNN's dilated convolution and residual block accommodation of wide receptive fields reduced the vanishing gradient problem. By capturing temporal links in both directions, Bi-LSTM networks help to better grasp complicated energy use patterns. Graph neural networks improve predictive capacities across linked systems by characterizing the spatial relationships between energy-consuming units in smart cities. Emphasizing critical trends to guarantee reliable forecasts, transformer models use attention methods to manage long-term dependencies in energy consumption data. Combining CNN, Bi-LSTM, Transformer and GNN component predictions in a Fusion Layer synthesizes numerous data representations to increase accuracy. With Root Mean Square Error of 5.7532 Wh, Mean Absolute Percentage Error of 3.5001%, Mean Absolute Error of 6.7532 Wh and R2 of 0.9701, the hybrid model fared better than other models on the ‘Electric Power Consumption’ Kaggle dataset. This work develops a realistic model that helps informed decision-making and enhances energy efficiency techniques, promoting energy load forecasting in smart cities.
Introduction
Due to rising demand and limited energy resources, smart city researches are needed to forecast the energy requirements of the cities and buildings individually (Abdulla et al., 2024). In order to achieve this, we must initially forecast the immediate energy load of an individual residence within a structure, followed by the overall energy utilization of the entire building. Therefore, combining and predicting the energy requirement for smart city services is feasible. The decentralization of the production of green energy, including solar power plants, which enable households to produce their electrical power and maximize its utilization to become completely autonomous, constitutes a source of short-term domestic energy expenditure prediction (Alghamdi, 2024).
Deep learning (DL) techniques have been used in several studies published in the scientific literature to forecast residential energy use. Generally, a significant amount of historical data is required to create AI models properly. It is necessary to compile and arrange this data into a centralized structure. These days, the Smart Meter system (SMS) simplifies this process. The SMS depends on installing smart meters in client houses because this allows precise and reliable data collection on energy use over at least 30-min intervals (Mohanaprakash et al., 2024).
A critical area of study in smart cities is energy load prediction, which estimates variations in energy use to ensure the smooth running of electrical grids. Precise forecasting methodologies are becoming critical for energy and grid administration suppliers due to advancements in smart grid technology (Li et al., 2024).
These forecasts, derived by analyzing historical data and many influencing factors, assist in efficiently allocating resources, maintaining grid reliability and integrating renewable energy sources. Researchers utilize several methodologies, including conventional statistical models and modern DL and machine learning algorithms, to develop strong prediction systems crucial for optimizing energy consumption and promoting ecological sustainability in the ever-changing environment of smart cities (Sadaghat et al., 2024).
Problem statement and objective
Advancement of sustainable development and maximum resource use in smart cities depends on accurate energy load forecasts. Without accurate energy load forecasting systems, energy distribution firms cannot evaluate demand, efficiently distribute resources or make wise judgements on power generation. Even with their success, current DL models such as convolutional neural network (CNN), long short-term memory (LSTM), Gated Recurrent Unit (GRU) and bidirectional long short-term memory (Bi-LSTM) find it difficult to manage the intricate patterns and links in data on energy usage. These challenges result in less accurate predictions, which may cause insufficient energy management. These models are limited for several reasons.
Although CNNs are very good at extracting spatial information, they struggle to effectively capture temporal correlations. The model may lack a complete understanding of the organization of energy usage data over time. While LSTMs and GRUs excel at processing temporal sequences, they may face challenges when maintaining long-term connections due to gradient vanishing problems. This waste makes it more likely that these models won't be as good as they could predict long-term energy needs that rely on time. Bidirectional Long Short-Term Memory improves upon regular LSTMs by considering dependencies in both the forward and backward directions.
Nevertheless, they face challenges in handling extensive and complex energy consumption data, particularly in capturing spatial–temporal correlations. The primary objective of this research is to develop a prediction model that is more dependable and precise in forecasting energy load while taking into account the imposed constraints. This entails advanced DL techniques to enhance the predictions’ accuracy, comprehensiveness and efficiency (Sadaghat et al., 2024).
The proposed method is a hybrid DL model that integrates several complex components. An enhanced CNN will be employed initially, with special emphasis on spatial patterns, to maximize the extraction of features from the data. This enhanced CNN aims to produce greater spatial feature representation by addressing the limitations of traditional CNNs by incorporating state-of-the-art techniques. Moreover, the Bi-LSTM model will represent temporal dependencies in both forward and backward directions, improving our understanding of temporal dynamics. This bidirectional method accounts for past and subsequent energy use to better capture the energy use sequence. Graph neural networks (GNNs) will represent the spatial–temporal relationships. Graph Neural Nets use spatial data linkages to understand location interactions and energy usage patterns across time (Khan et al., 2024).
Ultimately, transfer learning frameworks will take advantage of pre-trained models and smoothly apply their acquired features. This approach shortens the model's training time while simultaneously increasing overall performance. Transfer Learning improves the hybrid model's capacity to estimate energy loads using the experience amassed from comparable jobs. This bidirectional technique enhances the precision of recording the energy consumption sequence by considering the context of the preceding and succeeding energy usage (Alghamdi, 2024).
Furthermore, GNNs will be utilized to express spatial–temporal connections. Graph neural networks utilize the relationships between data points in a spatial context to thoroughly understand the interconnections between places and the corresponding energy consumption patterns over time.
Motivation
This study is motivated by the growing need for accurate energy load forecasting to enable resource management in smart cities and help plan sustainable urbanization. Given the fast expansion of urban populations and the always-rising complexity of urban infrastructure, it is essential to prioritize the reliable and effective dissemination of energy. Precise energy load estimates ensure that energy supply meets demand, preventing shortages and lowering waste connected to overproduction. Urban areas rely on the accuracy of our forecasts; hence, the continuity and dependability of energy sources define their well-being (Zou et al., 2024).
However, achieving a high level of accuracy has proven challenging due to the limitations of conventional DL algorithms such as CNN, LSTM, GRU and Bi-LSTM. Many models find it challenging to accurately capture energy consumption data's intricate temporal and spatial dependencies. The limitations of these models in accurately predicting energy loads result in inefficiencies in energy management. Inaccurate predictions can lead to excess energy production, wastage or inadequate energy supply, leading to disruptions. Both situations harm the objective of sustainable urbanization, which depends on the efficient utilization of resources. Furthermore, these forecasting errors can hinder energy distribution organizations from making well-informed decisions regarding scheduling and production, worsening inefficiencies and resource mismanagement.
Overall, the research is motivated by the desire to address the shortcomings of current DL models in energy load forecasting. Enhancing the precision of these forecasts is vital for minimizing waste, ensuring a consistent electricity supply and optimizing energy distribution. With the expansion and development of cities, there is a noticeable improvement in the overall quality of urban life and a positive impact on the environment's sustainability (Bereketeab et al., 2024).
Key contribution
This research presents an advanced hybrid DL model for accurate energy load prediction. The key contribution of the work is as follows:
The proposed hybrid model combines the key features of improved CNN, Bi-LSTM, GNN, Transformer model and Fusion layer. A Grid search method is used for hyperparameter selection. Convolutional neural network model is improved by adding dilated convolutions and residual blocks (RBs). Dilated convolution (DC) allows the model to utilize large receptive fields without modifying the parameters, which enhances feature extraction. A DC is added to CNN to deal with the vanishing gradient problem. Bidirectional long short-term memory helps to capture the features in both backward and forward and forward and backward directions; capturing information from both forward and backward directions helps to enhance accuracy. Graph neural networks are used to model the spatial and connected dependencies observed in data related to smart cities, including connections across various energy-consuming units. Transformer models use attention methods to manage long-term dependencies and concentrate on the most important segments of the input pattern. The Fusion Layer generates a unified prediction by combining the outputs of the CNN, LSTM, Transformer and GNN sections. To validate the experimental results of the proposed hybrid model and existing DL models, that is, CNN, LSTM, GRU, CNN-LSTM and Bi-LSTM, on the online ‘Electric Power Consumption’ Kaggle dataset. The proposed hybrid model achieved better results for Root Mean Square Error (RMSE), Mean Absolute Percentage Error (MAPE), Mean Absolute Error (MAE) and coefficient of determination, which proved the strength of the proposed hybrid model.
Organization of the article
The complete article is divided into several sub-sections covering the research's specific part. The first section covers the introduction to the energy load, the importance of DL, the problem statement, the motivation of the work, and finally, the key contributions.
The second section is a literature review that mainly examines and analyzes the previous work in the field of energy load forecasting and also covers the role of various existing DL models such as CNN, LSTM, GRU and Bi-LSTM, highlighting their strengths and limitations.
The third section is materials and methods, which mainly describes the working of the proposed hybrid model; it also covers how the proposed model integrates various DL models into a hybrid form, Improved-CNN, Bi-LSTM, GNNs and Transfer Learning frameworks; this section also presents the pseudo-code for the proposed model.
The fourth section mainly covers the implementation and results analysis, which describes the experimental setup of the data splitting process; it also covers the various simulation results measured for the existing and proposed model during the training and validation phase. This section presents a performance comparison with existing models using various metrics and visualizations, as well as results and discussion.
The article's final section covers the conclusion and future work, which mainly summarizes the key findings of the research, discusses the implications for energy load management in smart cities and makes recommendations for future research directions.
Literature review
Effective management of electricity generation in the smart power grid and its distribution network depends on the exact prediction of energy use in individual homes and smart cities. The power business can lower energy production costs by precisely estimating power needs and properly allocating resources for the next generation. Scholars have used different strategies to research energy usage in communication and distribution systems. Here are some sketches:
Bereketeab et al. (2024) concentrated on using machine learning and advanced communication techniques to raise the energy economy in smart homes. They assessed and forecasted power usage patterns using machine learning methods, enabling instantaneous changes. The main contribution is using electronic communication to improve the energy system's performance. With an accuracy rating of 82.3%, the obtained data showed significant improvements in system effectiveness and energy economy.
Another research presented by Safari and colleagues (2023) mainly contributes to power consumption in smart cities using hybrid DL models. The work mainly utilizes the combination of various neural network topologies to improve the model's prediction accuracy. The proposed hydroid model utilizes the key features of existing neural network architectures. An experimental analysis based on the energy dataset was performed, and the proposed hybrid model achieved a high precision accuracy of 88.1% compared to other methods. The experimental results revealed the possibility of using the framework in real-time smart energy management.
Abdelhamid et al. (2022) introduced a novel DL framework for forecasting energy consumption using the Dipper-throated Optimization Method (DTOM). Using DTOM improved the optimization method, increasing the accuracy of energy estimations. Compared to traditional techniques, the study's findings revealed a significant increase in prediction accuracy, with 83.8%. Al-Taleb and Saqib (2022) investigated using a hybrid artificial intelligence model to detect cyber threats in smart city settings by combining machine learning approaches. The results revealed lower rates of false positives and higher detection rates, yielding an accuracy level of 87.5%.
Bhoj and Bhadoria (2022) proposed a DL hybrid system that integrates Recurrent Neural Networks (RNNs) and CNNs to assess energy consumption in smart homes. We demonstrated the model's resilience to time-series data effects by obtaining an 88.7% prediction accuracy. In 2021, Syed et al. presented a novel hybrid DL method for intelligent building energy consumption prediction. In simulation analysis, the proposed model achieved an accuracy rate of 89.6%; the model has shown success in energy management for smart buildings by using several DL approaches to raise prediction accuracy.
Zou et al. (2024) presented a hybrid statistical DL model that utilizes dynamic and stationary statistics features. This proposed method was utilized to predict the total electricity load prediction in commercial buildings during a specific timeframe. The research also compares several other deep and machine-learning models with the proposed model. In the experimental analysis of the commercial electricity-load dataset, the proposed hybrid model achieved an accuracy rate of 90.2% for predictions. The simulation results showed that the proposed model achieved better prediction over existing ML and DL models.
Zhang et al. (2020) presented a more accurate hybrid DL model to predict the energy needs and load for a short-term duration towards buildings. The model utilizes the features of enhanced CNN on an energy load-building dataset collected from a city in Texas. The hybrid DL method with an interpretation phase achieved a 91.24% success rate when making easy-to-understand and accurate predictions.
In their study, Sadaghat et al. (2024) used hybrid and ensemble machine learning methods to accurately estimate how much energy homes use. Combining several methods improved the estimate's accuracy, which led to a very good forecast accuracy of 84.5%. The BiGTA-Net model, which combines many DL methods, was created by Dayeong and colleagues in 2023 to help buildings’ energy management systems work better. The test results showed that forecasts got much more accurate as they increased to 87.8%.
The model combined the features of CNN and RNN into a single frame and utilized an enhanced data pre-processing phase. On a smart city, ‘electric-load data’, the proposed model was tested. With a high accuracy of 90.89%, the proposed model performs outstandingly better than existing CNN and RNN models.
Similarly, Unal et al. (2021) suggested a novel approach using a hybrid deep neural network to predict smart city energy consumption. This research collected the data using smart meters and applied data pre-processing using advanced pre-processing methods. The proposed model achieved a prediction accuracy of 87.9% over existing models.
In another research, Li et al. (2024) presented an advanced framework that combines modern machine learning models to predict home energy consumption analysis and predictions. The proposed model utilizes the key features of Adaboost, decision tree and SVM. With an accuracy of 90.25%, the model achieved the best performance on the smart city emery dataset. Bisen et al. (2023) suggested a hybrid model for energy load prediction based on two popular machine learning and DL algorithms, K-means clustering and CNN. The proposed model and existing model were tested and validated on the energy IoT mobile edge dataset; the proposed model achieved a prediction accuracy of 89.97%, which is the best over existing methods.
Materials and methods
This section mainly covers the detailed description of a proposed hybrid model, architecture, key methods, algorithms, dataset description and data pre-processing.
Proposed model for energy load prediction
This research proposed a novel hybrid DL model for energy load prediction. The proposed model utilizes the key components of the Improved-CNN, Bi-LSTM, GNN, Transformer and Fusion Layer architectures. It extracts the best features from the Improved-CNN with a dilated convolution and RB accommodation of wide receptive fields and reduction of the vanishing gradient problem. Also, by capturing temporal links in both directions, Bi-LSTM networks help to better grasp the complicated energy use patterns. In the proposed model, GNNs improve predictive capacities across linked systems by characterizing the spatial relationships between energy-consuming units in smart cities. The complete working of the proposed models is as follows.
Improved-CNN
The proposed model utilizes the improved CNN model by enhancing the various layers of the CNN model. The improved CNN model includes some key features, that is, advanced activation functions, regularization approaches and optimized convolution layers, which overall enhance the prediction accuracy of the proposed hybrid model. Figure 1 presents a detailed architecture of Improved CNN.
Input Layer: The input layer accepts time-series statistics on energy utilization. The input consists of time-series data, such as energy utilization over time. The size of an input layer is (n,t,f), where n: batch size, t: time steps, f: number of features. As presented in equation (1), Convolutional Layers: In the Convolutional Layers, filters are applied to extract attributes/features from the data that is being entered. Multiple filters are applied to the data to extract features from the input data. The size of the convolution layer is (n,t, Activation Function: Non-linearity can be introduced into the model by applying a non-linear function called the activation function. The convolved features are activated using a non-linear activation function as presented in equation (3). Here, F represents an activation function, that is, ReLu: Pooling Layers: The data is down-sampled by Pooling Layers to decrease both the dimensionality of the data and the amount of computational load (Xin et al., 2022). The size of the activation function is (n,t/p, Fully Connected Layers (Dense): Layers that are thoroughly interconnected integrate the extracted features to arrive at the final prediction. After the pooled features have been flattened, they are then fed into a neural network that is fully connected, as presented in equations (5) and (6). Where Output Layer: The output layer provides the ultimate forecasting of energy consumption. Let function


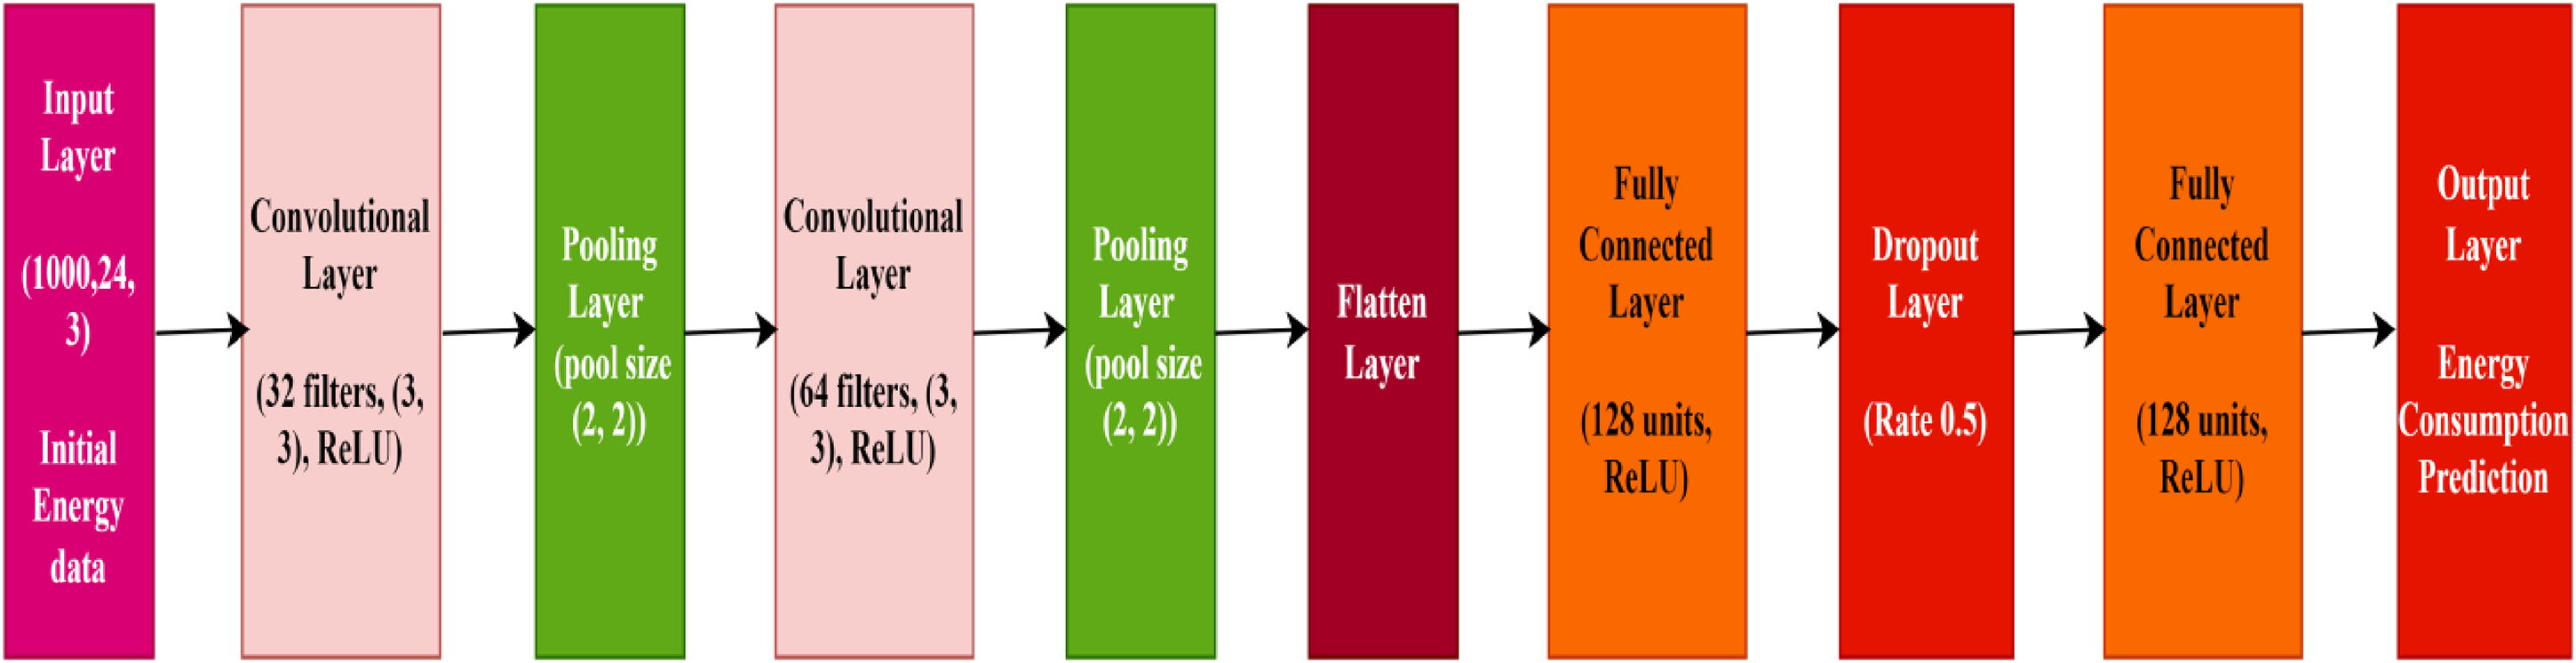
Improved convolutional neural network (CNN) architecture.
Bidirectional long short-term memory
Bidirectional long short-term memory systems are a type of LSTM network that can enhance the efficiency of models in sequence tasks involving classification. In instances in which temporal dependencies are of the utmost importance, such as energy load forecasting, Bi-LSTMs are ideal because they can collect data from the past (previous time steps) and the future (subsequent time steps) (Ünal et al., 2021). The key functions of Bi-LSTM are presented in Figure 2, and the detailed work is as follows:
Input Layer: Within this layer, the input pattern consists of data about energy consumption and other characteristics such as temperature and humidity. N, T and F are the primary components that make up the data size. Here, N represents the total number of specimens, T represents the number of time steps and F represents the amount of features. Forward LSTM Layer: Input data is processed by this layer, beginning with the initial time step and continuing through the final time step. This also includes the dependencies that existed in the past (Li et al., 2024). The forward LSTM model mainly includes forget gate ( Backward LSTM Layer: This layer is responsible for processing the input data, initially beginning with the first time step and continuing through the last time step (Bisen et al., 2023). In addition, this encompasses the dependencies that were present in the past. A backward LSTM also includes a forget gate ( Concatenation Layer: It combines the results obtained from the LSTM layers that are forward and backward simultaneously. Information from both the past and the future is incorporated into this combined representation. Fully Connected Layer: To arrive at the ultimate prediction, dense layers are applied to the concatenated output. Output Layer: Generates the final value of the predicted energy load.


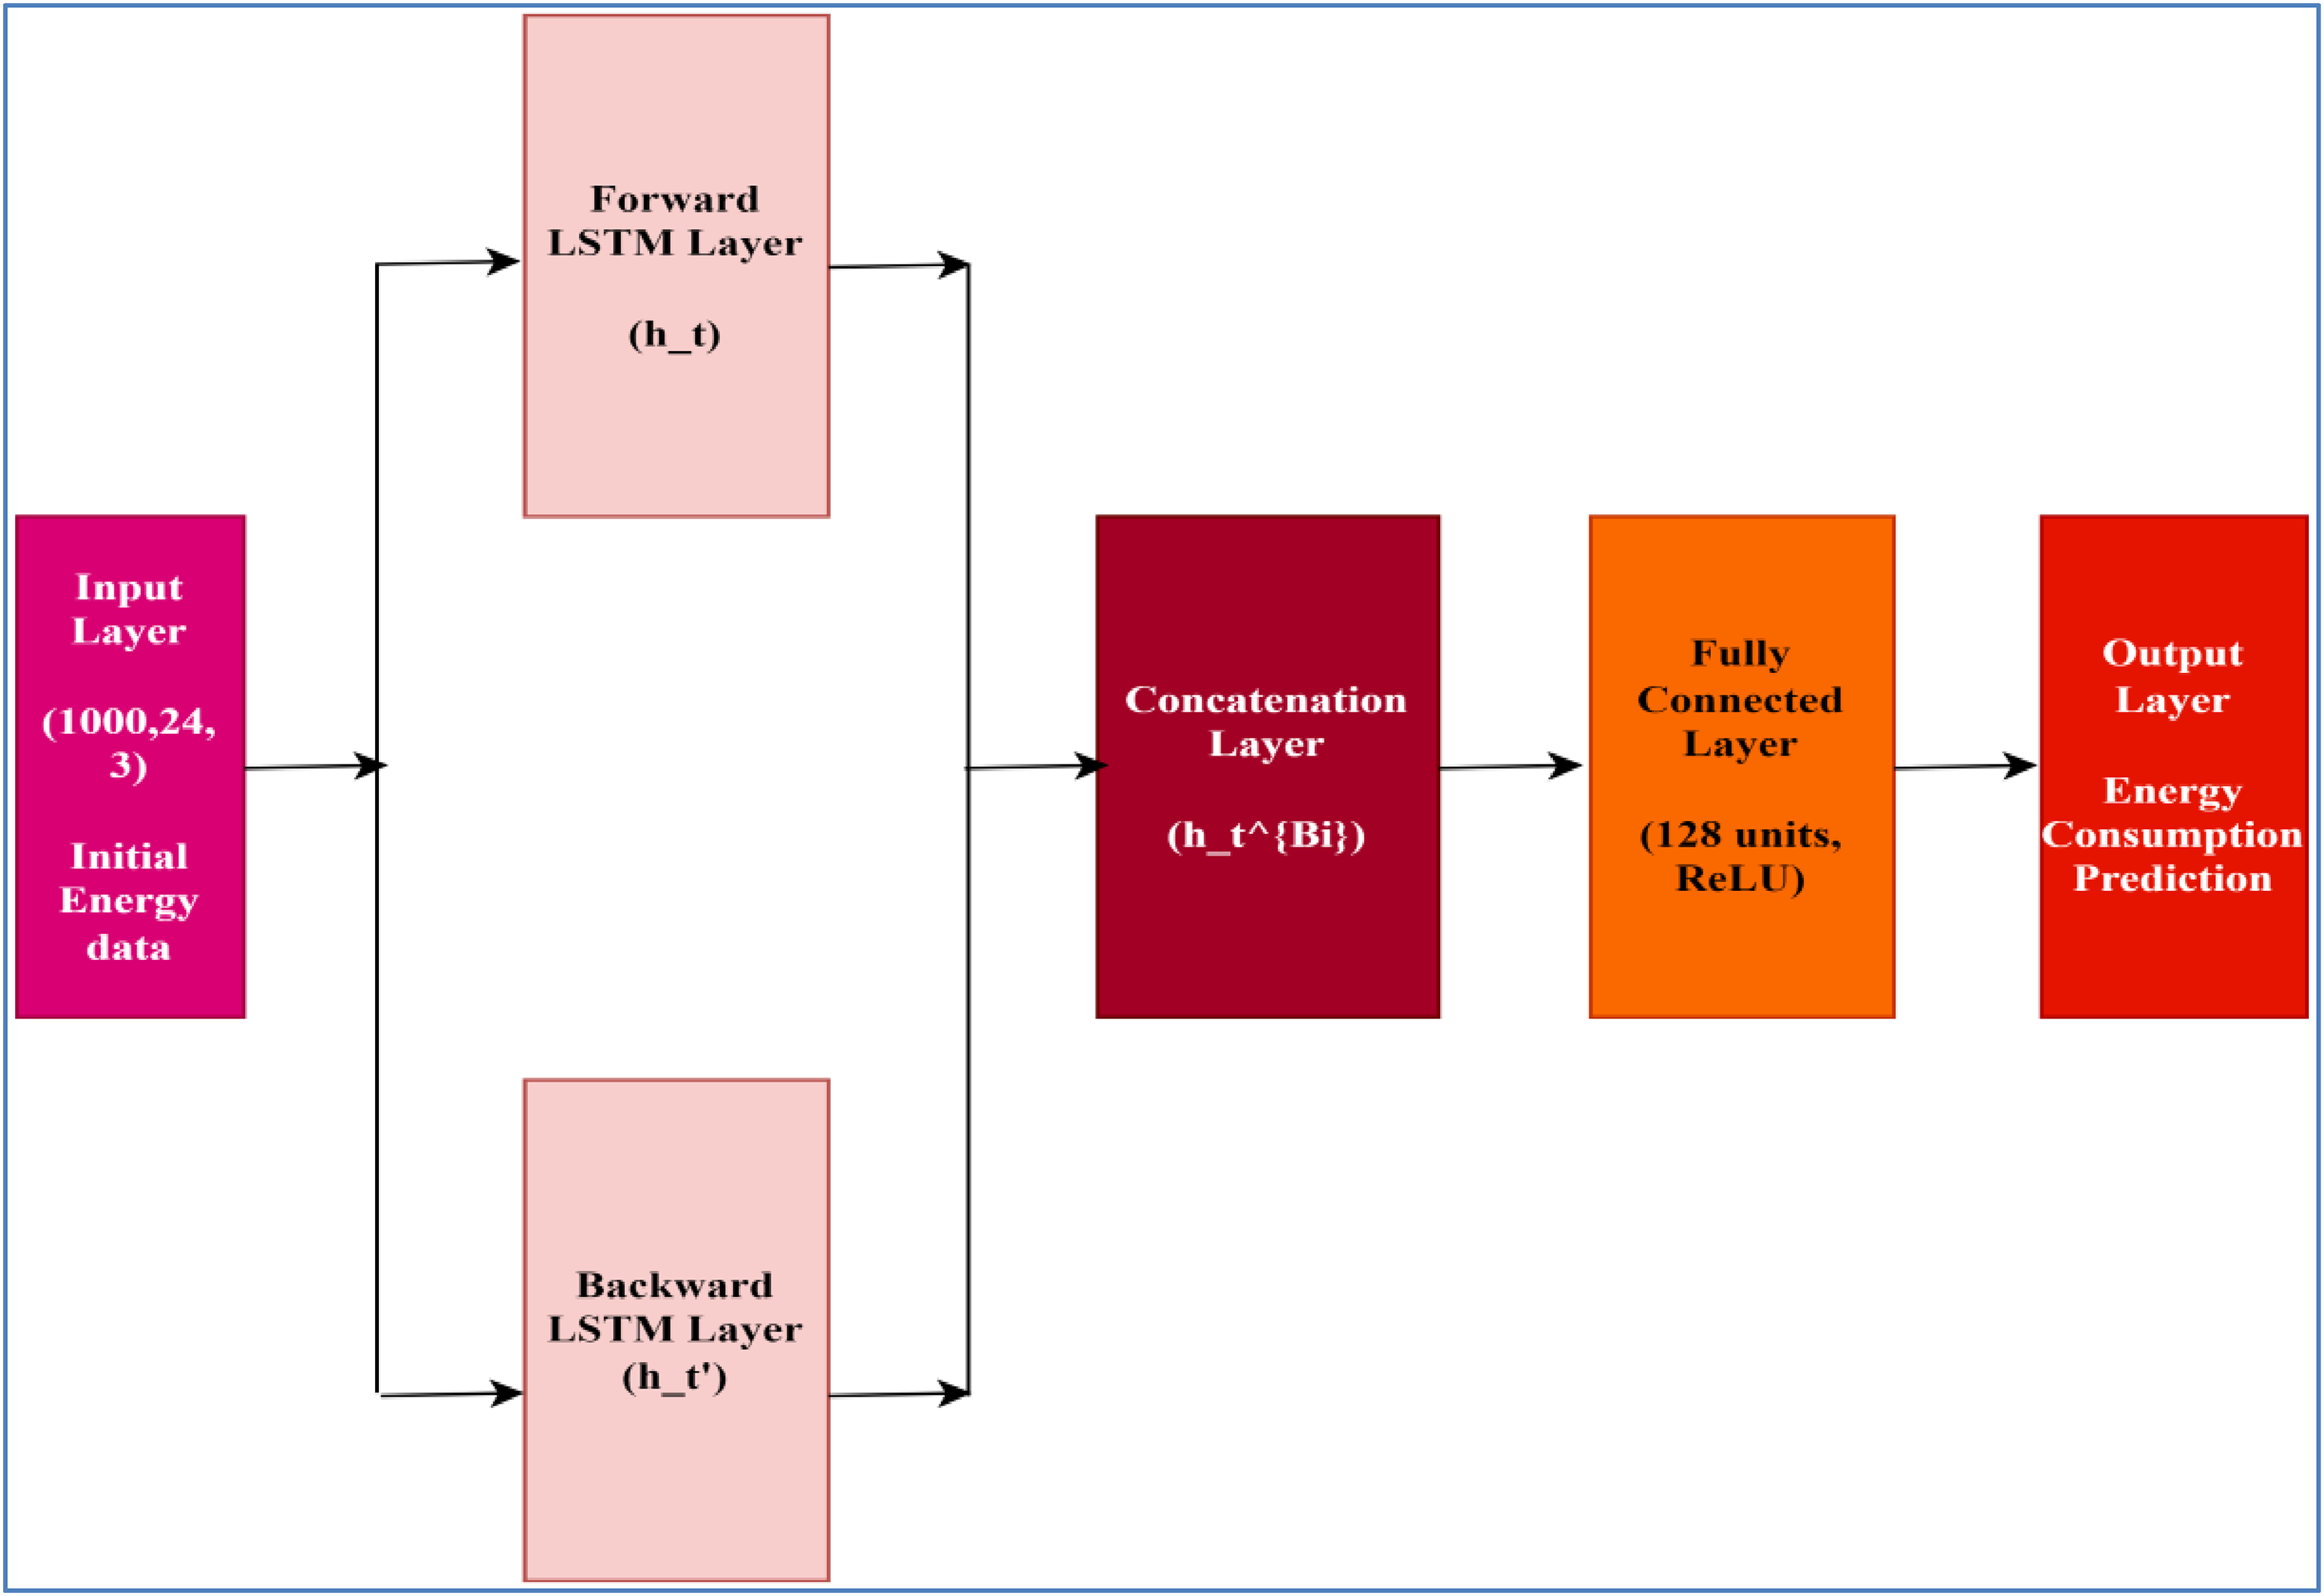
Working of bidirectional long short-term memory (Bi-LSTM).
Key symbols and description for forward LSTM layer.
Key symbols and description for backward LSTM layer.
Graph neural network
Graph neural networks are an exceptionally effective tool when learning how to model graph-structured data. The GNN modelling utilizes the connections between all the different parts of the energy grid; it mainly includes buildings, power substations and renewable energy sources (Mirjalili et al., 2023). The key elements of the GNN model are given below:
Node: Buildings and substations are examples of entities represented by nodes. Edges: A representation of the relationships or connections that exist between these various entities, such as the flow of energy, is called an edge. Node Features: The characteristics of the nodes, such as their historical usage of energy, are referred to as ‘node features’. Edge Features: Features of the edges are traits and characteristics of the edges, such as the distance between the links. Input Layer: The graph is comprised of nodes, each of which stands for a building and power substation, and edges, which represent the connections that link the nodes, are also included; it is made up of previously collected information on energy consumption, weather and other essential factors. Equation (20) represents the set of inputs, where Graph Convolutional Layer: The GNN compiles data obtained from the nodes directly adjacent to it, as presented in equation (21) (Dinmohammadi et al., 2023). Here, HL represents node features towards layer L, A represents adjacency matrix, Readout Layer: A readout function aggregates the node features across a single graph-level features vector. This function is applied following the graph convolution layers. The function in question could be a straightforward addition, the mean or a more involved aggregation function. Equation (22) represents the graph-level representation of the readout layer. Here, Output Layer: The final prediction of the energy load is generated by putting the graph-level feature vector through a multi-layer perceptron (MLP), which is the product of the output prediction. Equation (23) presents the output layer equation. Here,
The applications of GNNs (Lilhore et al., 2022) in energy load prediction are essential; the complete work is presented in Figure 3. The workings of each of the modules are as follows:


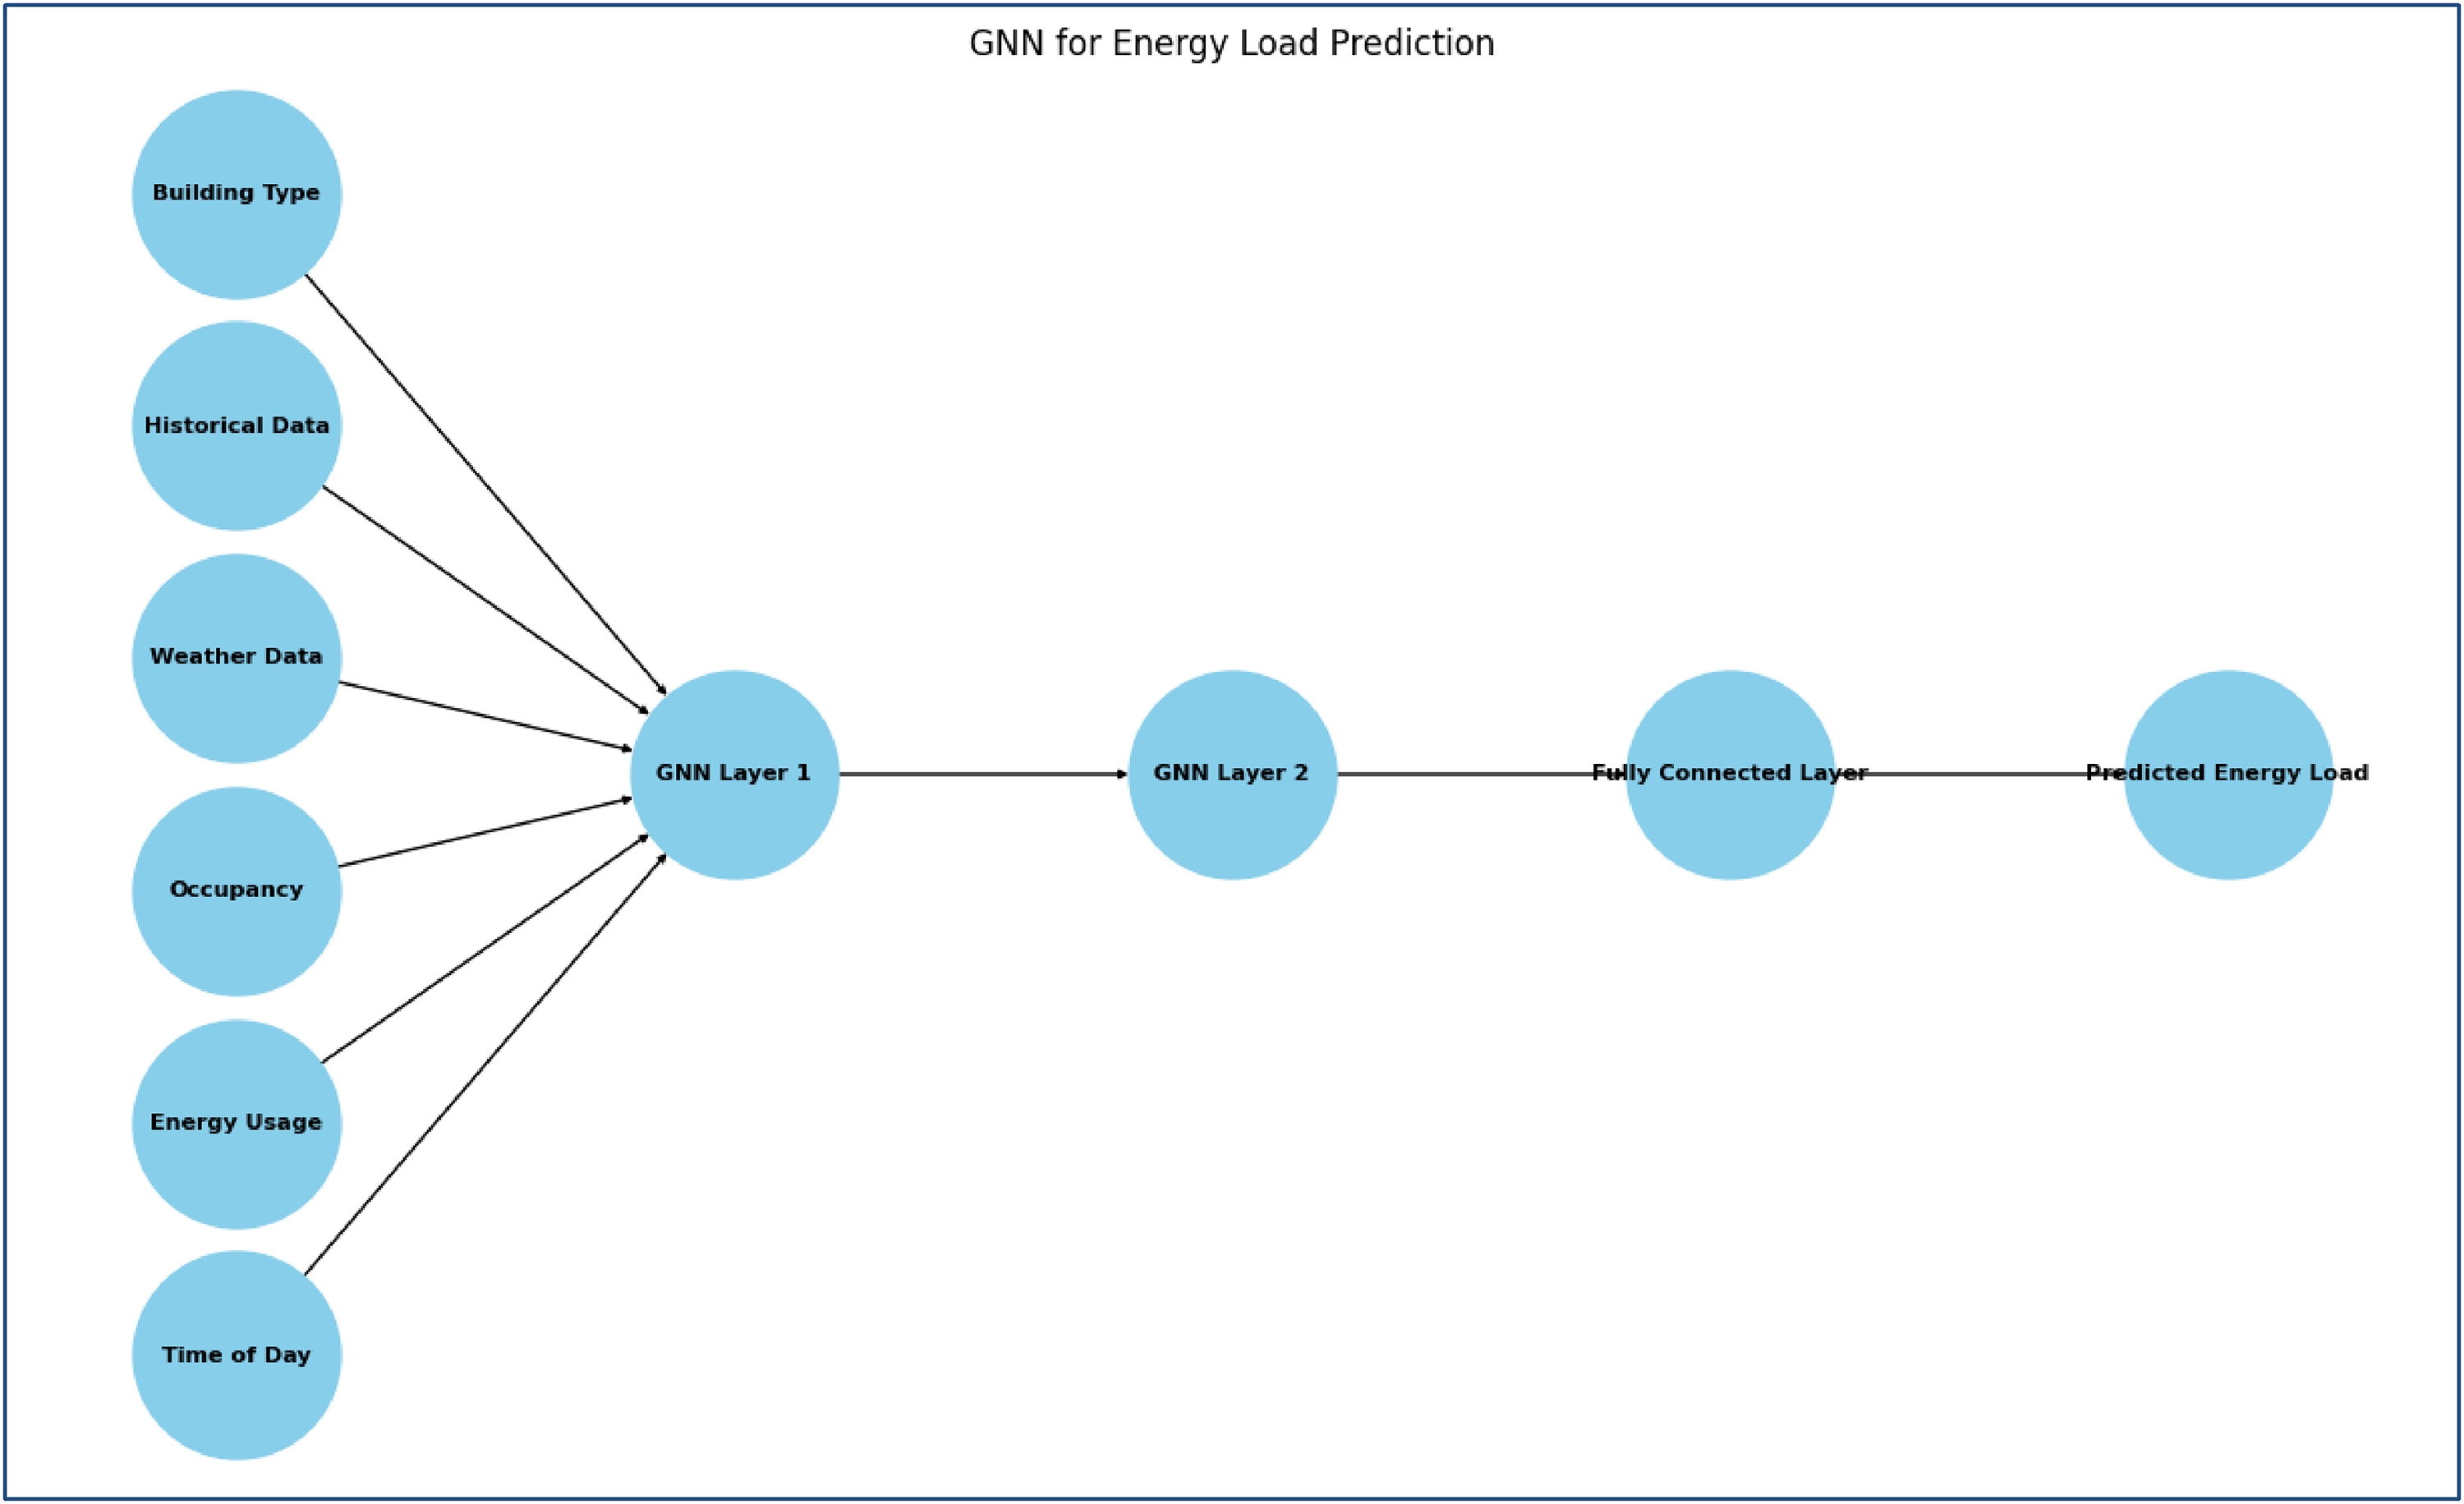
Graph neural network (GNN) architecture.
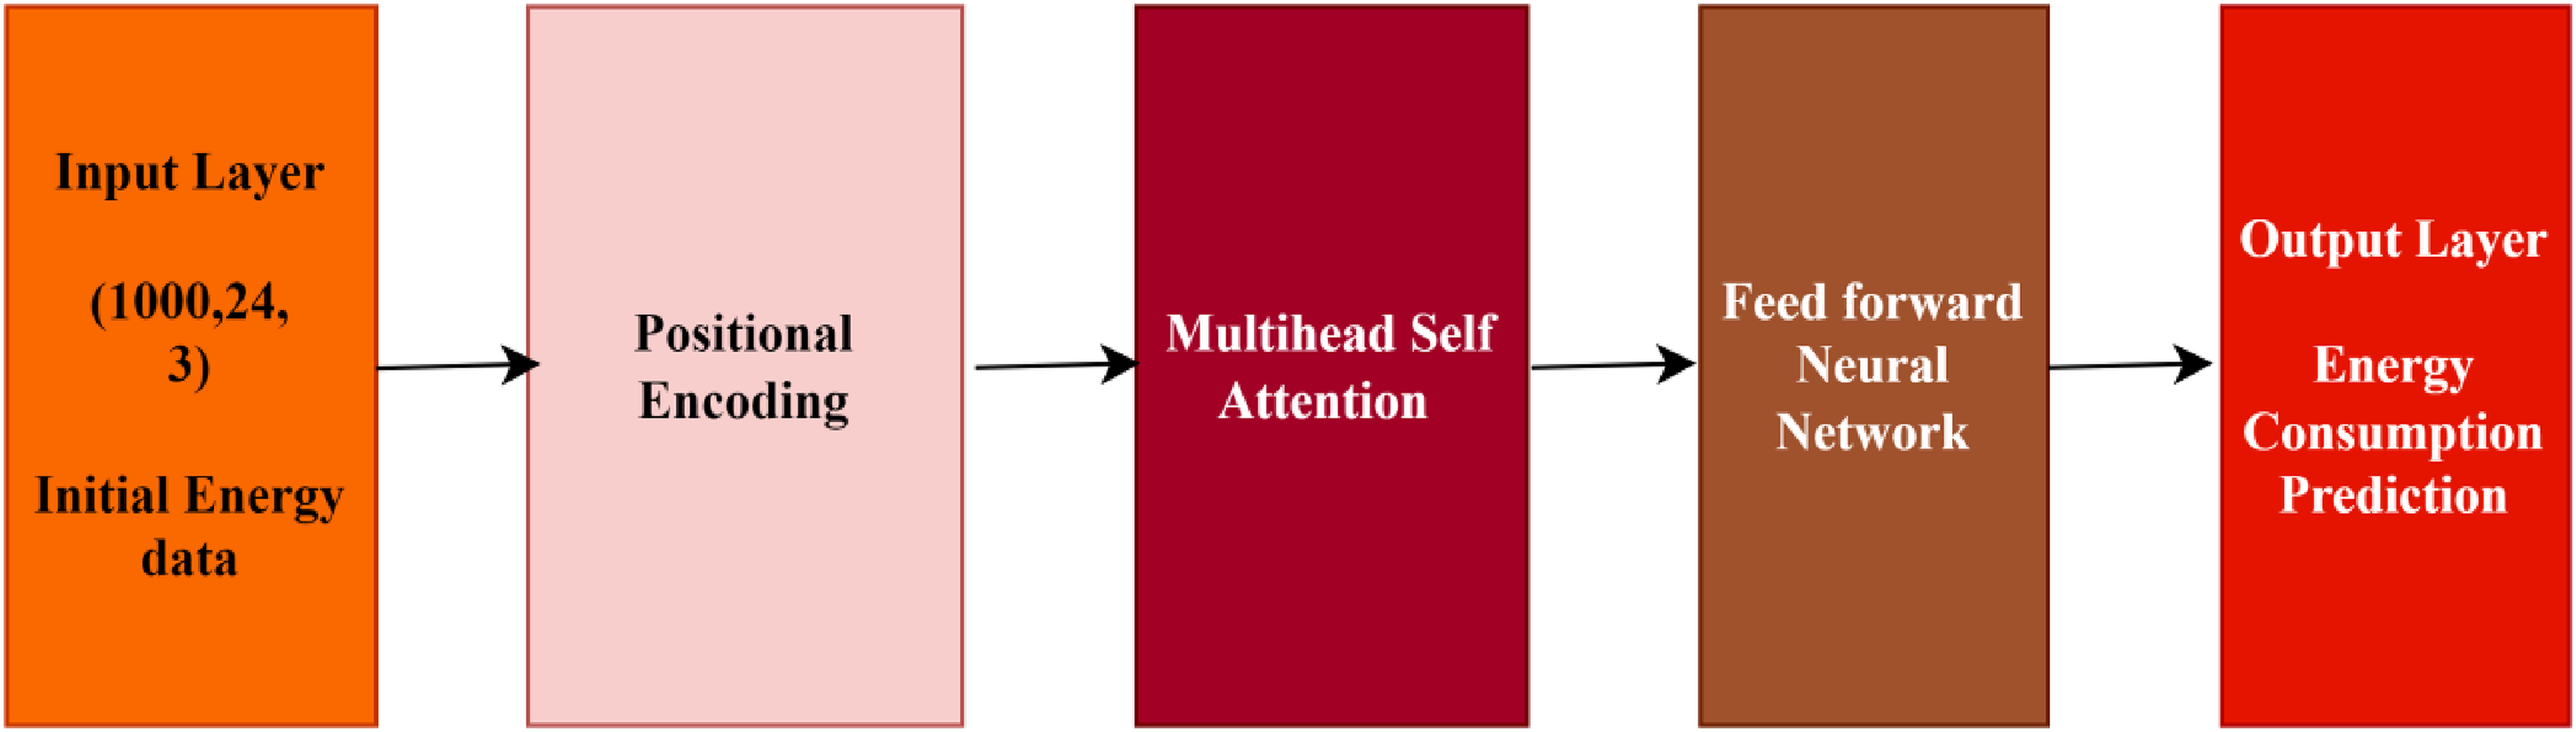
Transformer model
The Transformer model is extremely important in managing long-term dependencies throughout the input pattern when predicting energy load using a hybrid DL approach. The attention mechanism of transformers is responsible for their ability to zero in on the most important aspects of the input sequence. This ability has earned them a well-deserved reputation. Figure 4 presents the architecture of the transformer model (Abdullah et al., 2023):
Input Encoding: An accumulation of data on energy usage from the past serves as the Transformer model's input. The data points in the sequence are each presented as a vector, which includes characteristics such as the time of day, the day of the week, the temperature and the values of energy consumption recorded in the past (Gul et al., 2021). Positional Encoding: Positional encodings are introduced to the input vectors to provide information about the direction in which the vectors are located in the sequence. This is necessary because Transformers do not automatically understand the chronological structure of the sequence. A scaled dot product attention ( Multi-head Self-Attention: The process that allows for multi-head self-attention is the most important part of the Transformer prototype. When predicting the next value, this mechanism enables the model to consider the significance of each component included in the input sequence.

Architecture of transformer model.
Following the computation of attention scores between each pair of positions in the input sequence, it generates a weighted sum of the values, with the weights being determined by the attention scores calculated between each pair of positions (Gul et al., 2021). A multi-head attention is calculated by equation (25). Here, Feedforward Neural Network: To undergo additional processing, the output is sent via a Feedforward neural network (FFNN) once the attention mechanism has been applied. The FFNN comprises multiple layers of linear transformations, followed by non-linear activation functions like ReLU (Zhang et al., 2021). Output Layer: For the Transformer model, the final output is a forecast for the subsequent value of the energy consumed. The forecast is derived from the feed-forward neural network's final result and the weighted aggregate of the values calculated during the attention mechanism's computation.

Fusion layer
The fusion layer is an essential component of the hybrid DL model for energy load prediction in smart cities. It integrates the features obtained from various methods (Improved-CNN, Bi-LSTM, GNN, Transformer model) into a cohesive representation that ultimately drives the prediction. The fusion layer conventionally performs the concatenation operation to meaningfully combine the features of distinct models (Nti et al., 2020).
Relevant features are extracted from the input data using each feature extraction technique (Improved-CNN, Bi-LSTM, GNN and Transformer Model) and passed through their respective fusion layers in this diagram. The fusion layers merge these characteristics into a unified representation.
With the help of the fusion layer, the hybrid model can take advantage of each component's unique capabilities, which could lead to better performance in predicting energy loads. The functioning of the suggested hybrid model is shown in Figure 5.
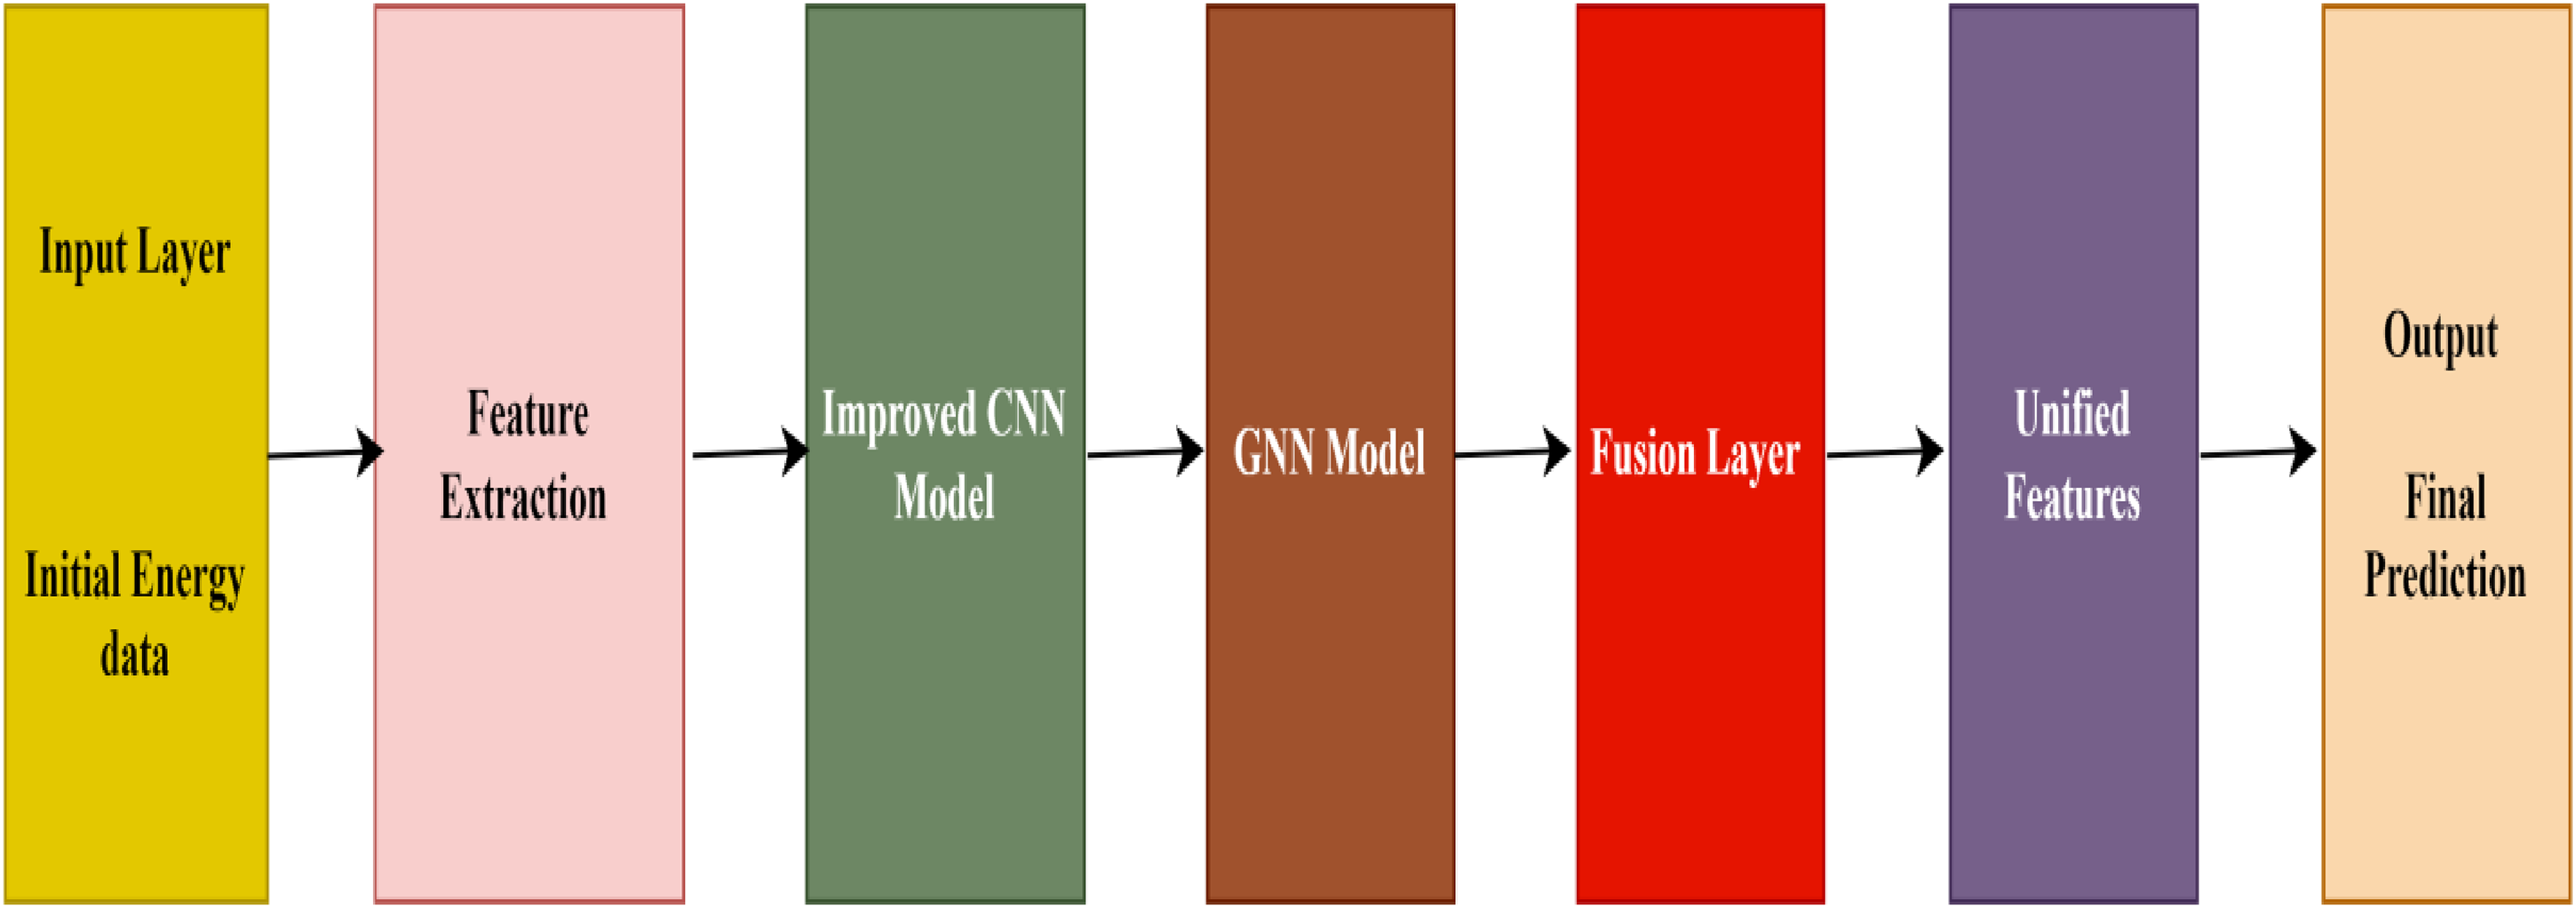
Working of fusion layer in proposed hybrid model.
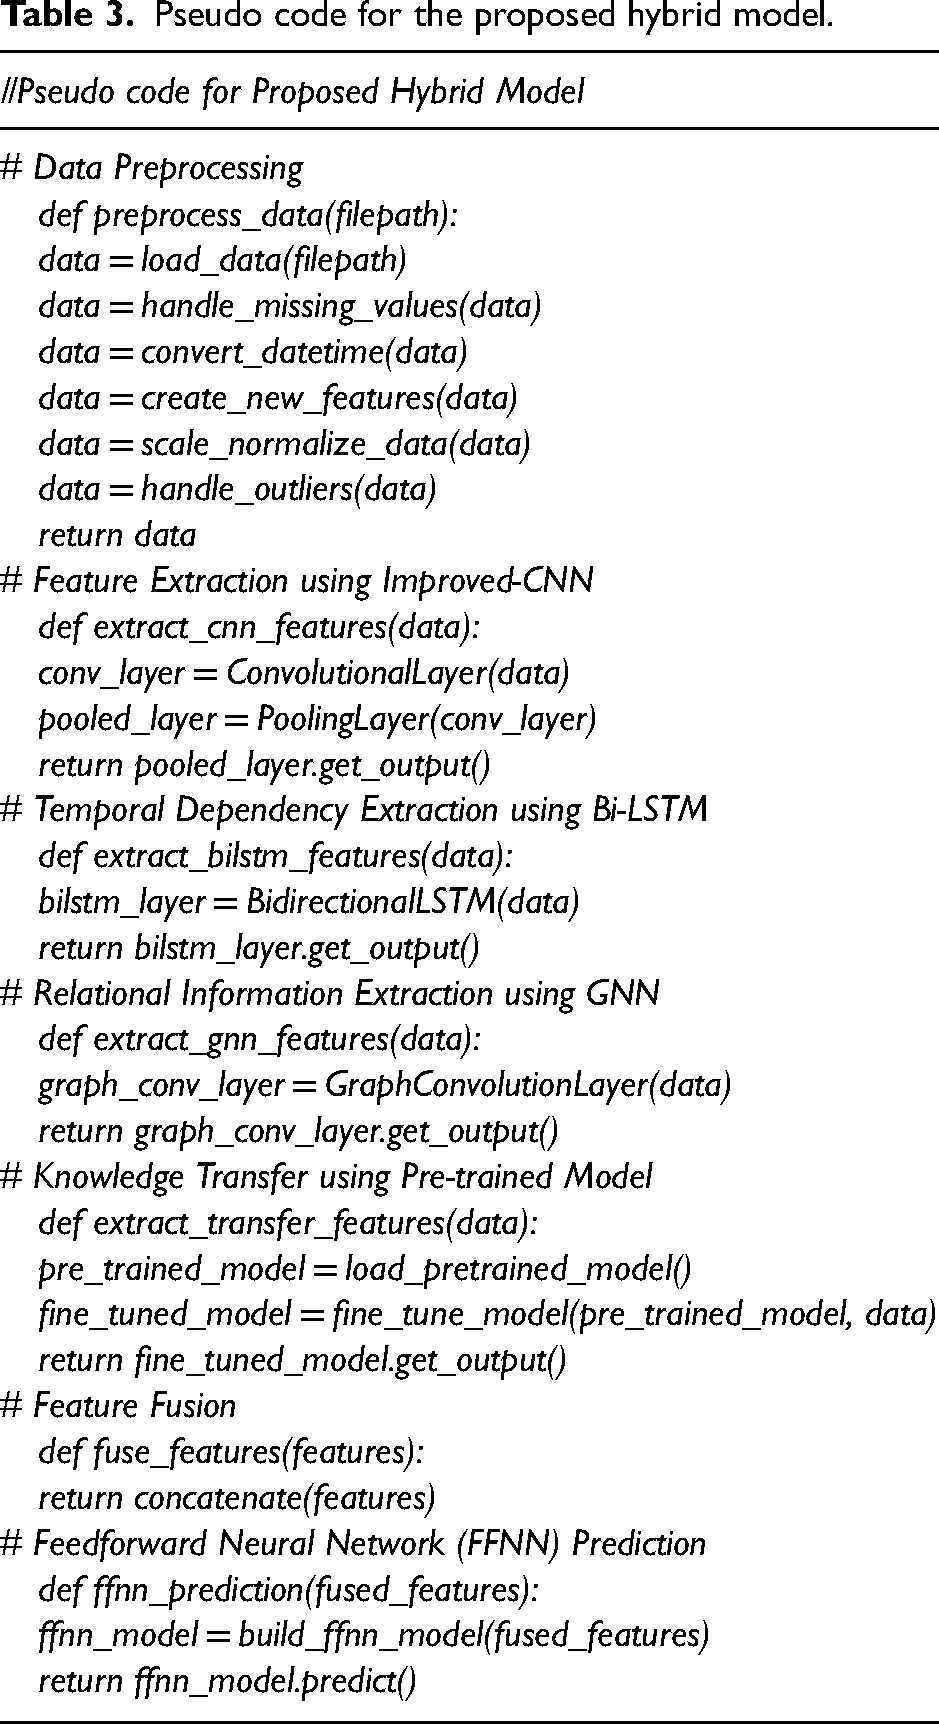
Pseudo code for proposed hybrid model
The pseudo-code for the proposed hybrid model is presented in Table 3.
Pseudo code for the proposed hybrid model.
Dataset
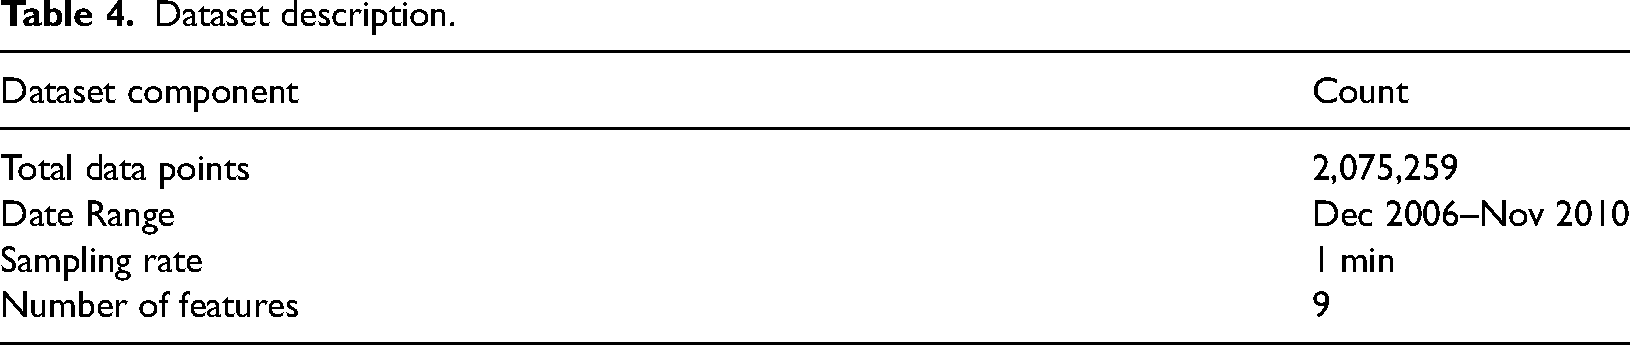
The ‘Electric Power Consumption’ Kaggle dataset is utilized extensively in energy load forecasting and time series analysis (Dataset ‘Electric Power Consumption’). Employing an average sampling duration of one minute, this dataset consists of data on electricity consumption from a single household across a period. The data comprises observations of active power, voltage, intensity and sub-metering for different household areas, including the kitchen, the laundry room and others. Table 4 shows the dataset description together with feature counts.
Dataset description.
Data pre-processing
Data pre-processing plays a vital role in handling missing values and other issues. The complete data pre-processing details for ‘Electric Power Consumption’ are described in the below sub-sections (El-Baz and Tzscheutschler, 2015; Singla et al., 2022, 2023).
Dealing with missing values
We have applied several imputation methods to solve the missing values problem in the ‘Electric Power Consumption’ dataset. We particularly filled in the missing values using mean and median imputation techniques. Mean imputation was used for columns with generally normal distribution of the data. Median imputation was applied for columns exhibiting skewed distributions.
Apart from these fundamental approaches, we considered more complex ideas, including k-nearest neighbors (kNN) imputation. This method preserves the local data structure by filling in missing values depending on the values of the closest neighbours in the dataset so that it may produce more accurate imputations.
These imputation techniques helped us guarantee that the ‘Electric Power Consumption’ dataset stayed whole, preventing the loss of important data and preserving the integrity required for accurate study. This preprocessing stage was essential for improving the quality and dependability of our later machine learning models and statistical analyses, allowing us to derive stronger and more reliable results from our data.
Date-time conversion
Easier manipulation and feature extraction by converting date-time columns into DateTime objects. Time series analysis depends on this conversion as it helps to extract temporal characteristics such as the day of the week, month or hour of the day. These characteristics might be recorded in the data seasonal trends and patterns. The dataset becomes more illustrative when date-time columns are converted. Model performance may be much enhanced by temporal features that record time-related trends like peak energy usage hours. For instance, energy usage can be larger throughout the week and lower on weekends. Learning these patterns enables the algorithm to extract these components, improving its forecasting accuracy (Alizadegan et al., 2024; Samadi et al., 2015).
Removing unnecessary columns
Noise can be introduced, and redundant or irrelevant features can decrease model performance. Eliminating these columns streamlines the dataset, increasing analysis efficiency and concentrating on the most significant variables. Eliminating superfluous columns such as ‘Time’ diminishes the dataset's dimensionality, resulting in quicker and more effective machine learning model training. It enhances prediction performance by guaranteeing that the model concentrates on important features.
Feature engineering
Adding new data attributes may improve model accuracy and provide other insights, according to the theoretical framework. Deriving the day of the week and hour from the date-time column can assist in capturing energy usage temporal trends. Feature engineering improves dataset information content and model performance. A day-of-the-week item will assist the model in understanding weekly consumption patterns, and an hour-of-the-day feature will capture daily consumption cycles, improving energy load forecasts.
Scaling and normalizing data
Features of differing scales might hamper distance-based machine learning methods like kNNs (SVM). Standardization or normalization scales features so they contribute equally to the model. Data scaling and normalization increase model convergence and stability. It keeps features on a similar scale, preventing larger features from dominating learning. This step improves model accuracy and training speed. Scaling ensures consumption values and temporal features match in the ‘Electric Power Consumption’ dataset.
Outlier detection and handling
Outliers can skew analysis and weaken model performance by fitting to noise instead of data patterns. Outliers should be removed or transformed to ensure the dataset matches data behaviour. Outlier removal enhances model resilience and reduces overfitting. An energy consumption outlier may be a spike caused by an exogenous event. Removing or modifying outliers helps the program learn regular consumption patterns for more accurate predictions.
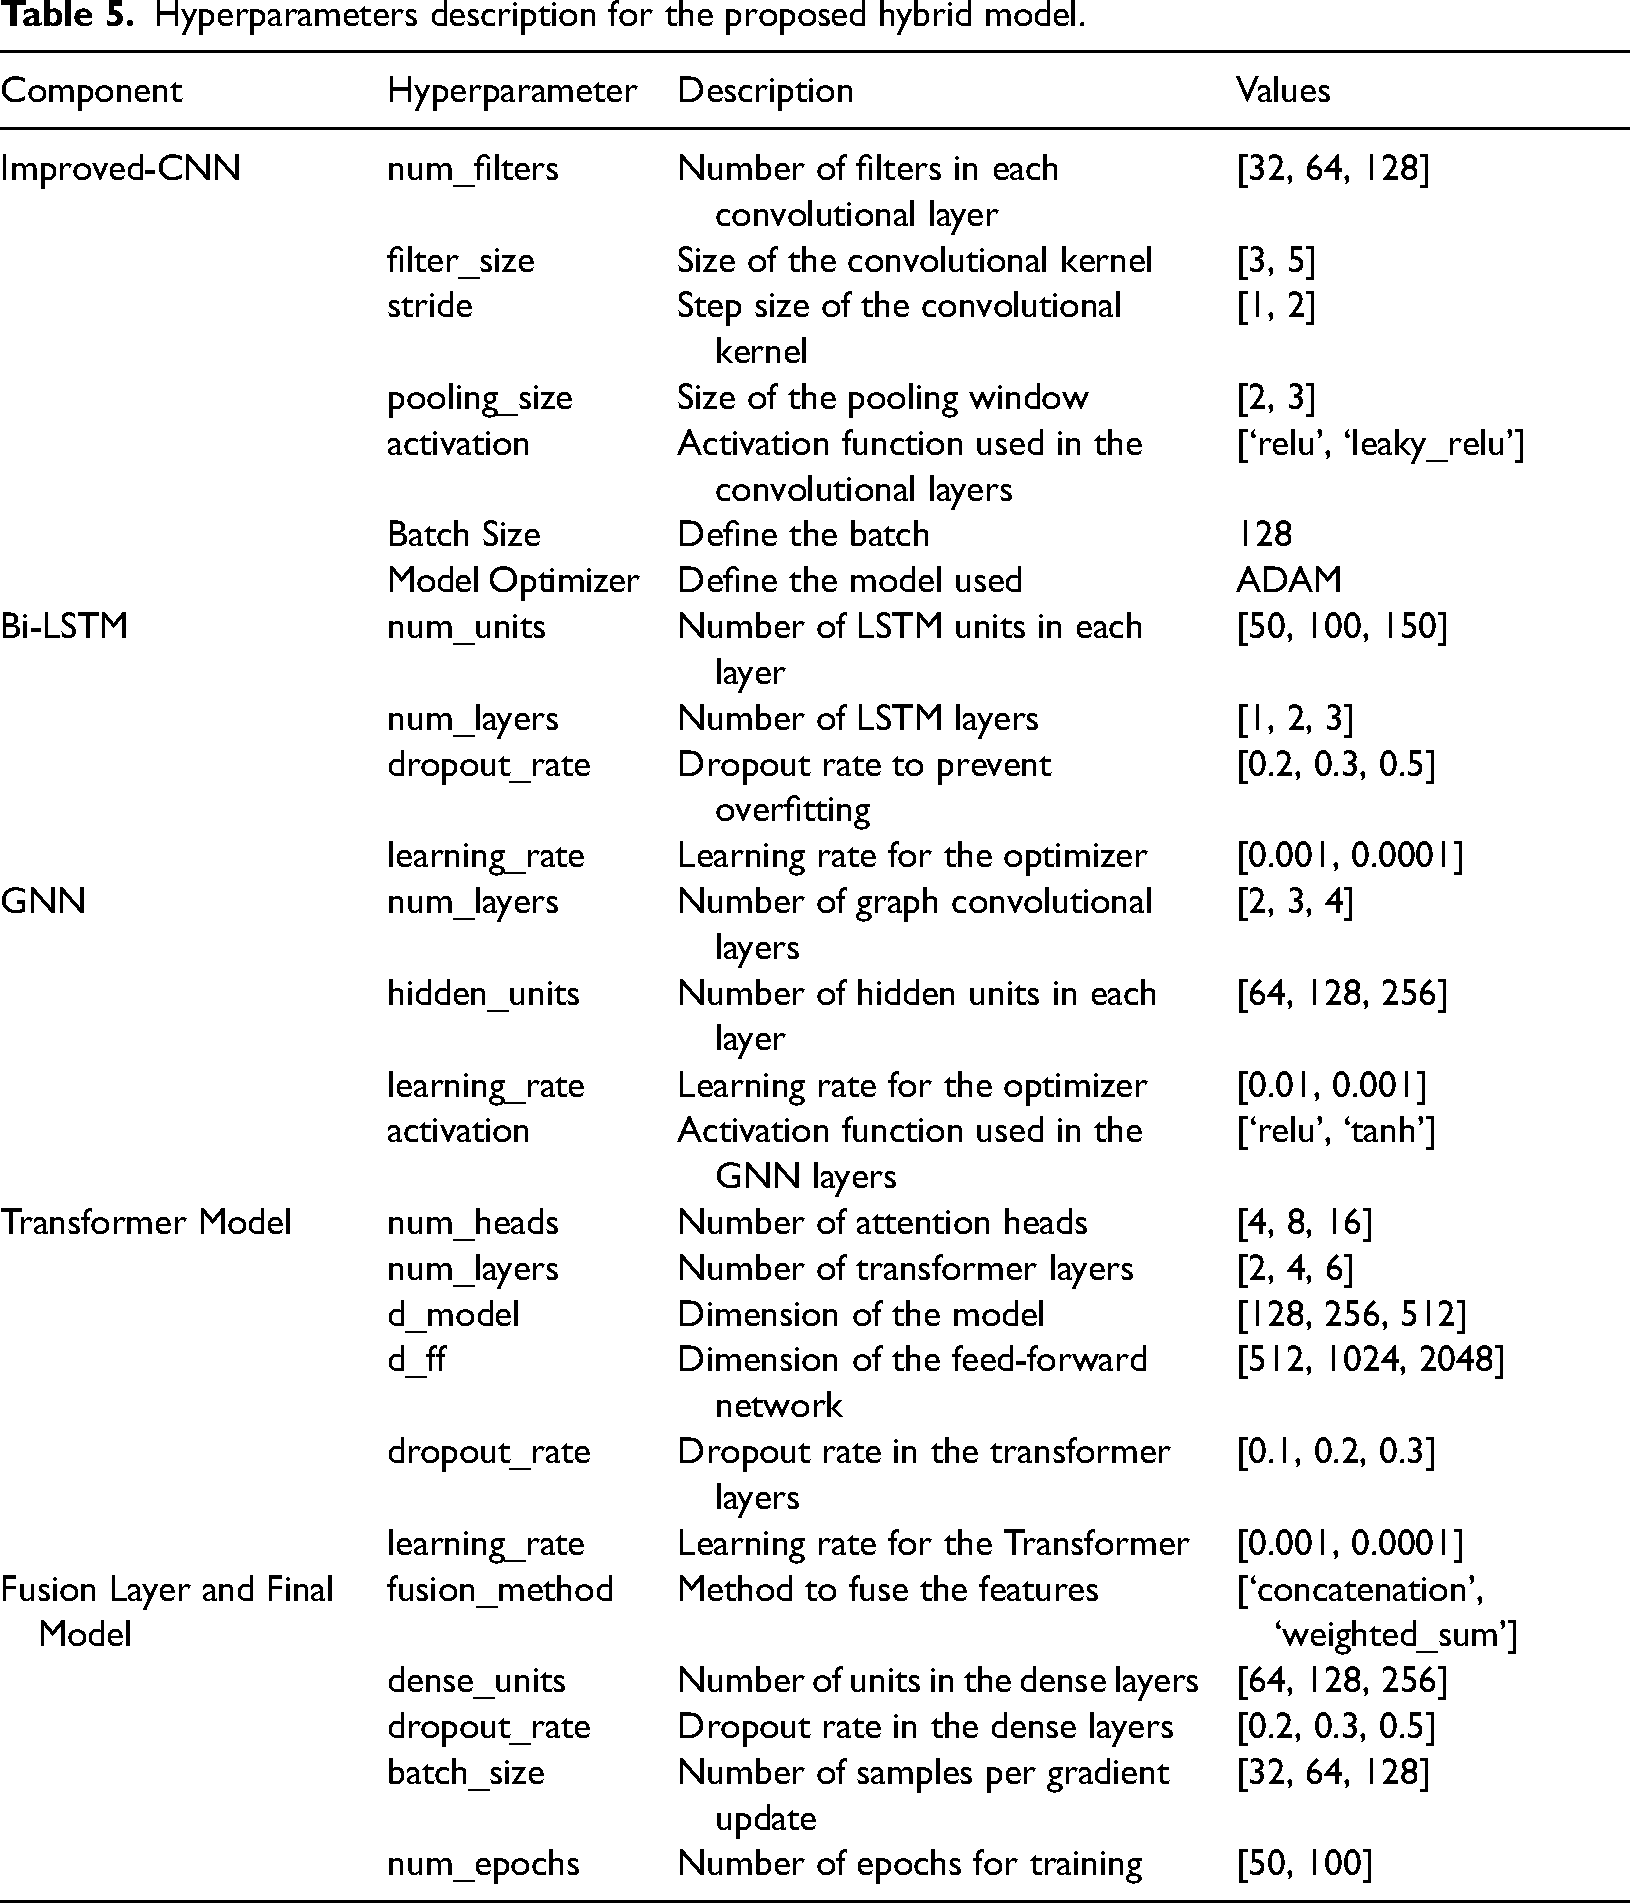
Hyperparameter selection
One method for optimizing hyperparameters is called grid search, and it involves thoroughly searching through a predetermined set of hyperparameters in order to find the optimal combination for the model. The model's effectiveness is evaluated for every potential combination of hyperparameters, and the selection that determines which combinations produce the best results on the set of validation results is chosen. Through the use of this method, the best hyperparameters that are available within the search space that has been provided are selected (Cao et al., 2020). Table 5 presents the hyperparameters description for the proposed hybrid model.
Hyperparameters description for the proposed hybrid model.
Performance measuring parameters
The proposed and existing DL models are compared based on performance-measuring parameters (Xiao et al., 2015). Here, y: dependent variable,
Root Mean Square Error
Root Mean Square Error is the square root of the average of the squared differences between predicted and actual values as presented in equation (27):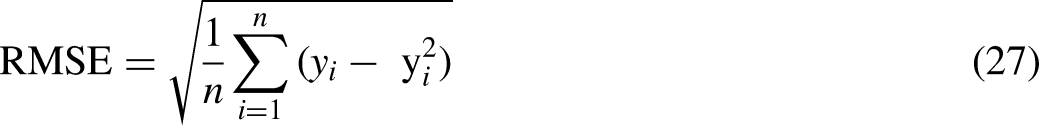
Mean Absolute Percentage Error
Mean Absolute Percentage Error determines the average percentile variance between the actual and predicted values as presented in equation (28):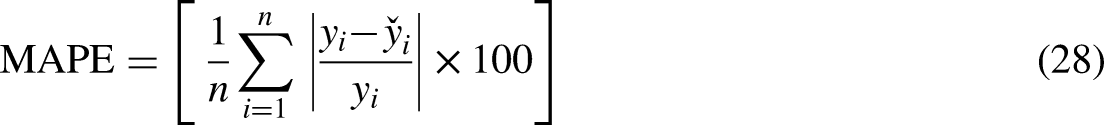
Mean Absolute Error
Mean Absolute Error takes the average of the absolute differences between predicted and actual values as presented in equation (29):
Coefficient of determination/R squared
R-squared is the proportion of the variance in the dependent variable that is predictable from the independent variables, and it ranges from 0 to 1 as presented in equation (30):
Results and analysis
This section covers the simulation results for the existing and proposed hybrid models.
Hardware and software requirements
The proposed hybrid model and existing DL models, that is, CNN, LSTM, GRU, CNN-LSTM and Bi-LSTM, are implemented on the online ‘Electric Power Consumption’ Kaggle dataset. The hardware and software requirements are presented in Table 6 (Luo and Oyedele, 2022).
The hardware and software details.
Data splitting
K-fold cross-validation was utilized in this research. It is essential to evaluate the performance and resilience of the hybrid DL model in the proposed research on energy load prediction in smart cities. K-fold cross-validation is a technique that enhances the accuracy of estimating a model's performance by dividing the dataset into K subsets. The model is then trained and evaluated on various training and validation sets iteratively. This approach is more dependable than a basic train-test split (Li et al., 2022).
Further, K-fold cross-validation enables more precise hyperparameter tuning and model selection, resulting in a more accurate and efficient energy load forecast model for smart city applications. The dataset is divided into Training Set: 70% (1,452,681 records), Validation Set: 15% (311,289 records) and Test Set: 15% (311,289 records), and the following results were calculated.
Simulation results
The simulation results for testing and validations were calculated in three scenarios: short-term load prediction based on day (hours basis), Mid-term load prediction based on monthly consumption, and long-term load prediction based on years. Figures 6 to 8 present the simulation results for short-, mid- and long-term energy load prediction. We have also calculated the MAPE results based on different Epochs (50 and 100) corresponding to different Bi-LSTM model layers. As presented in Figure 9.
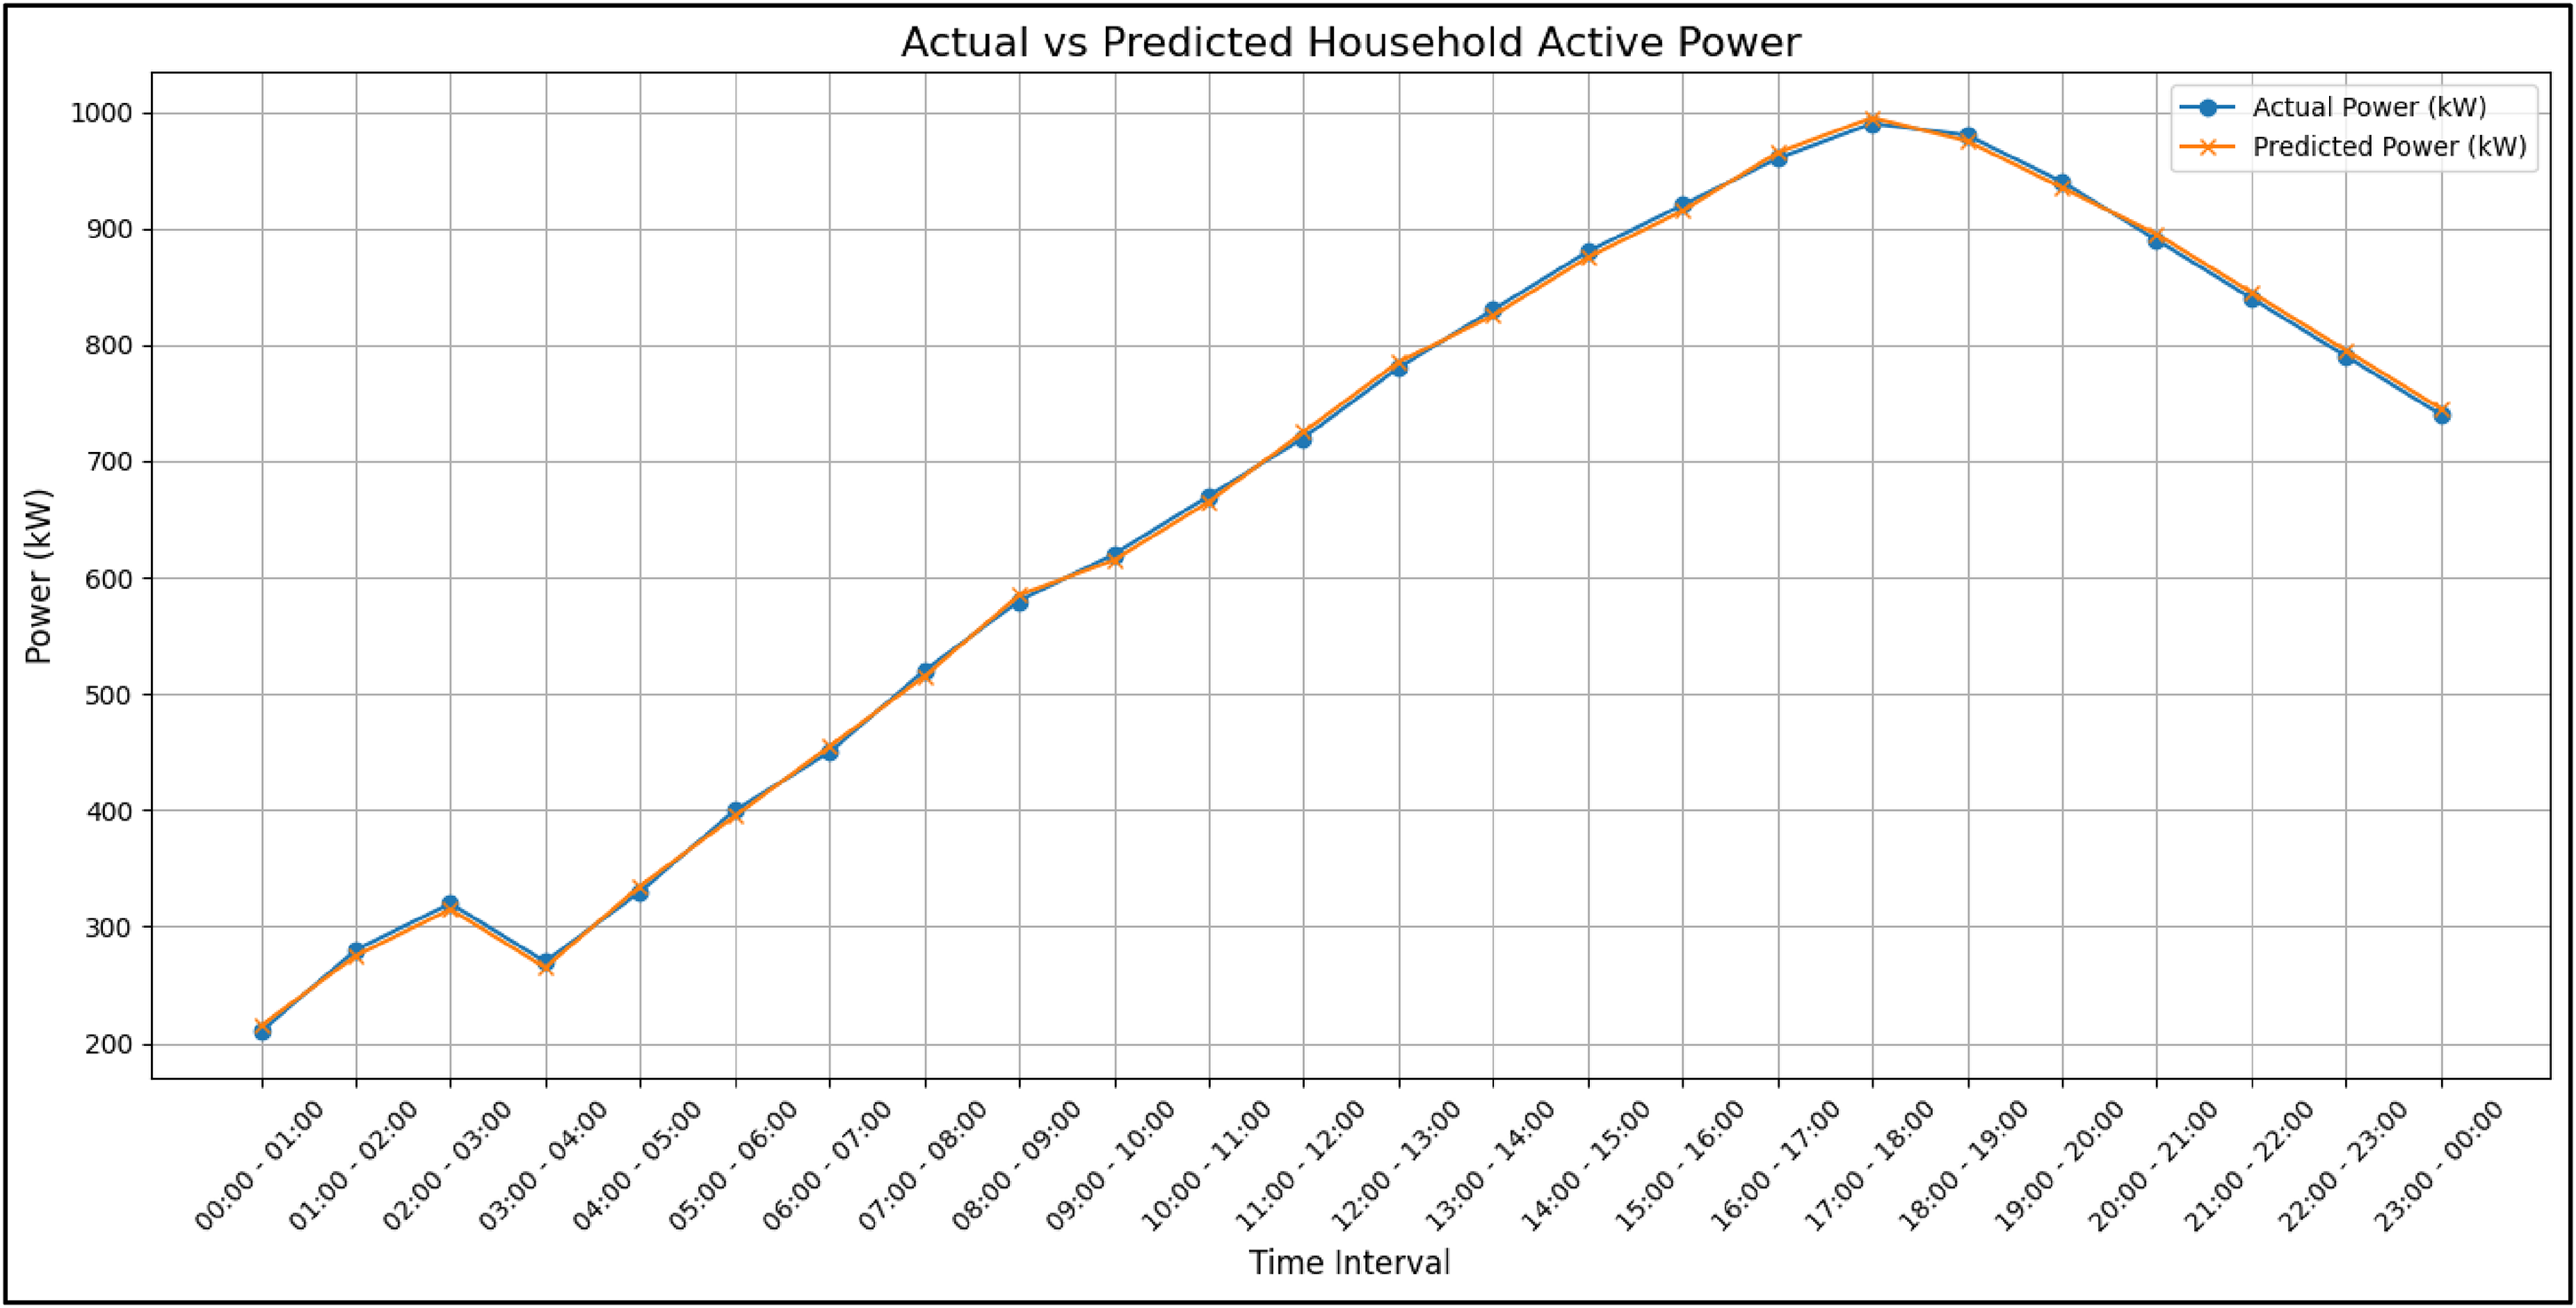
Testing results of the proposed hybrid model for short-term energy load prediction.
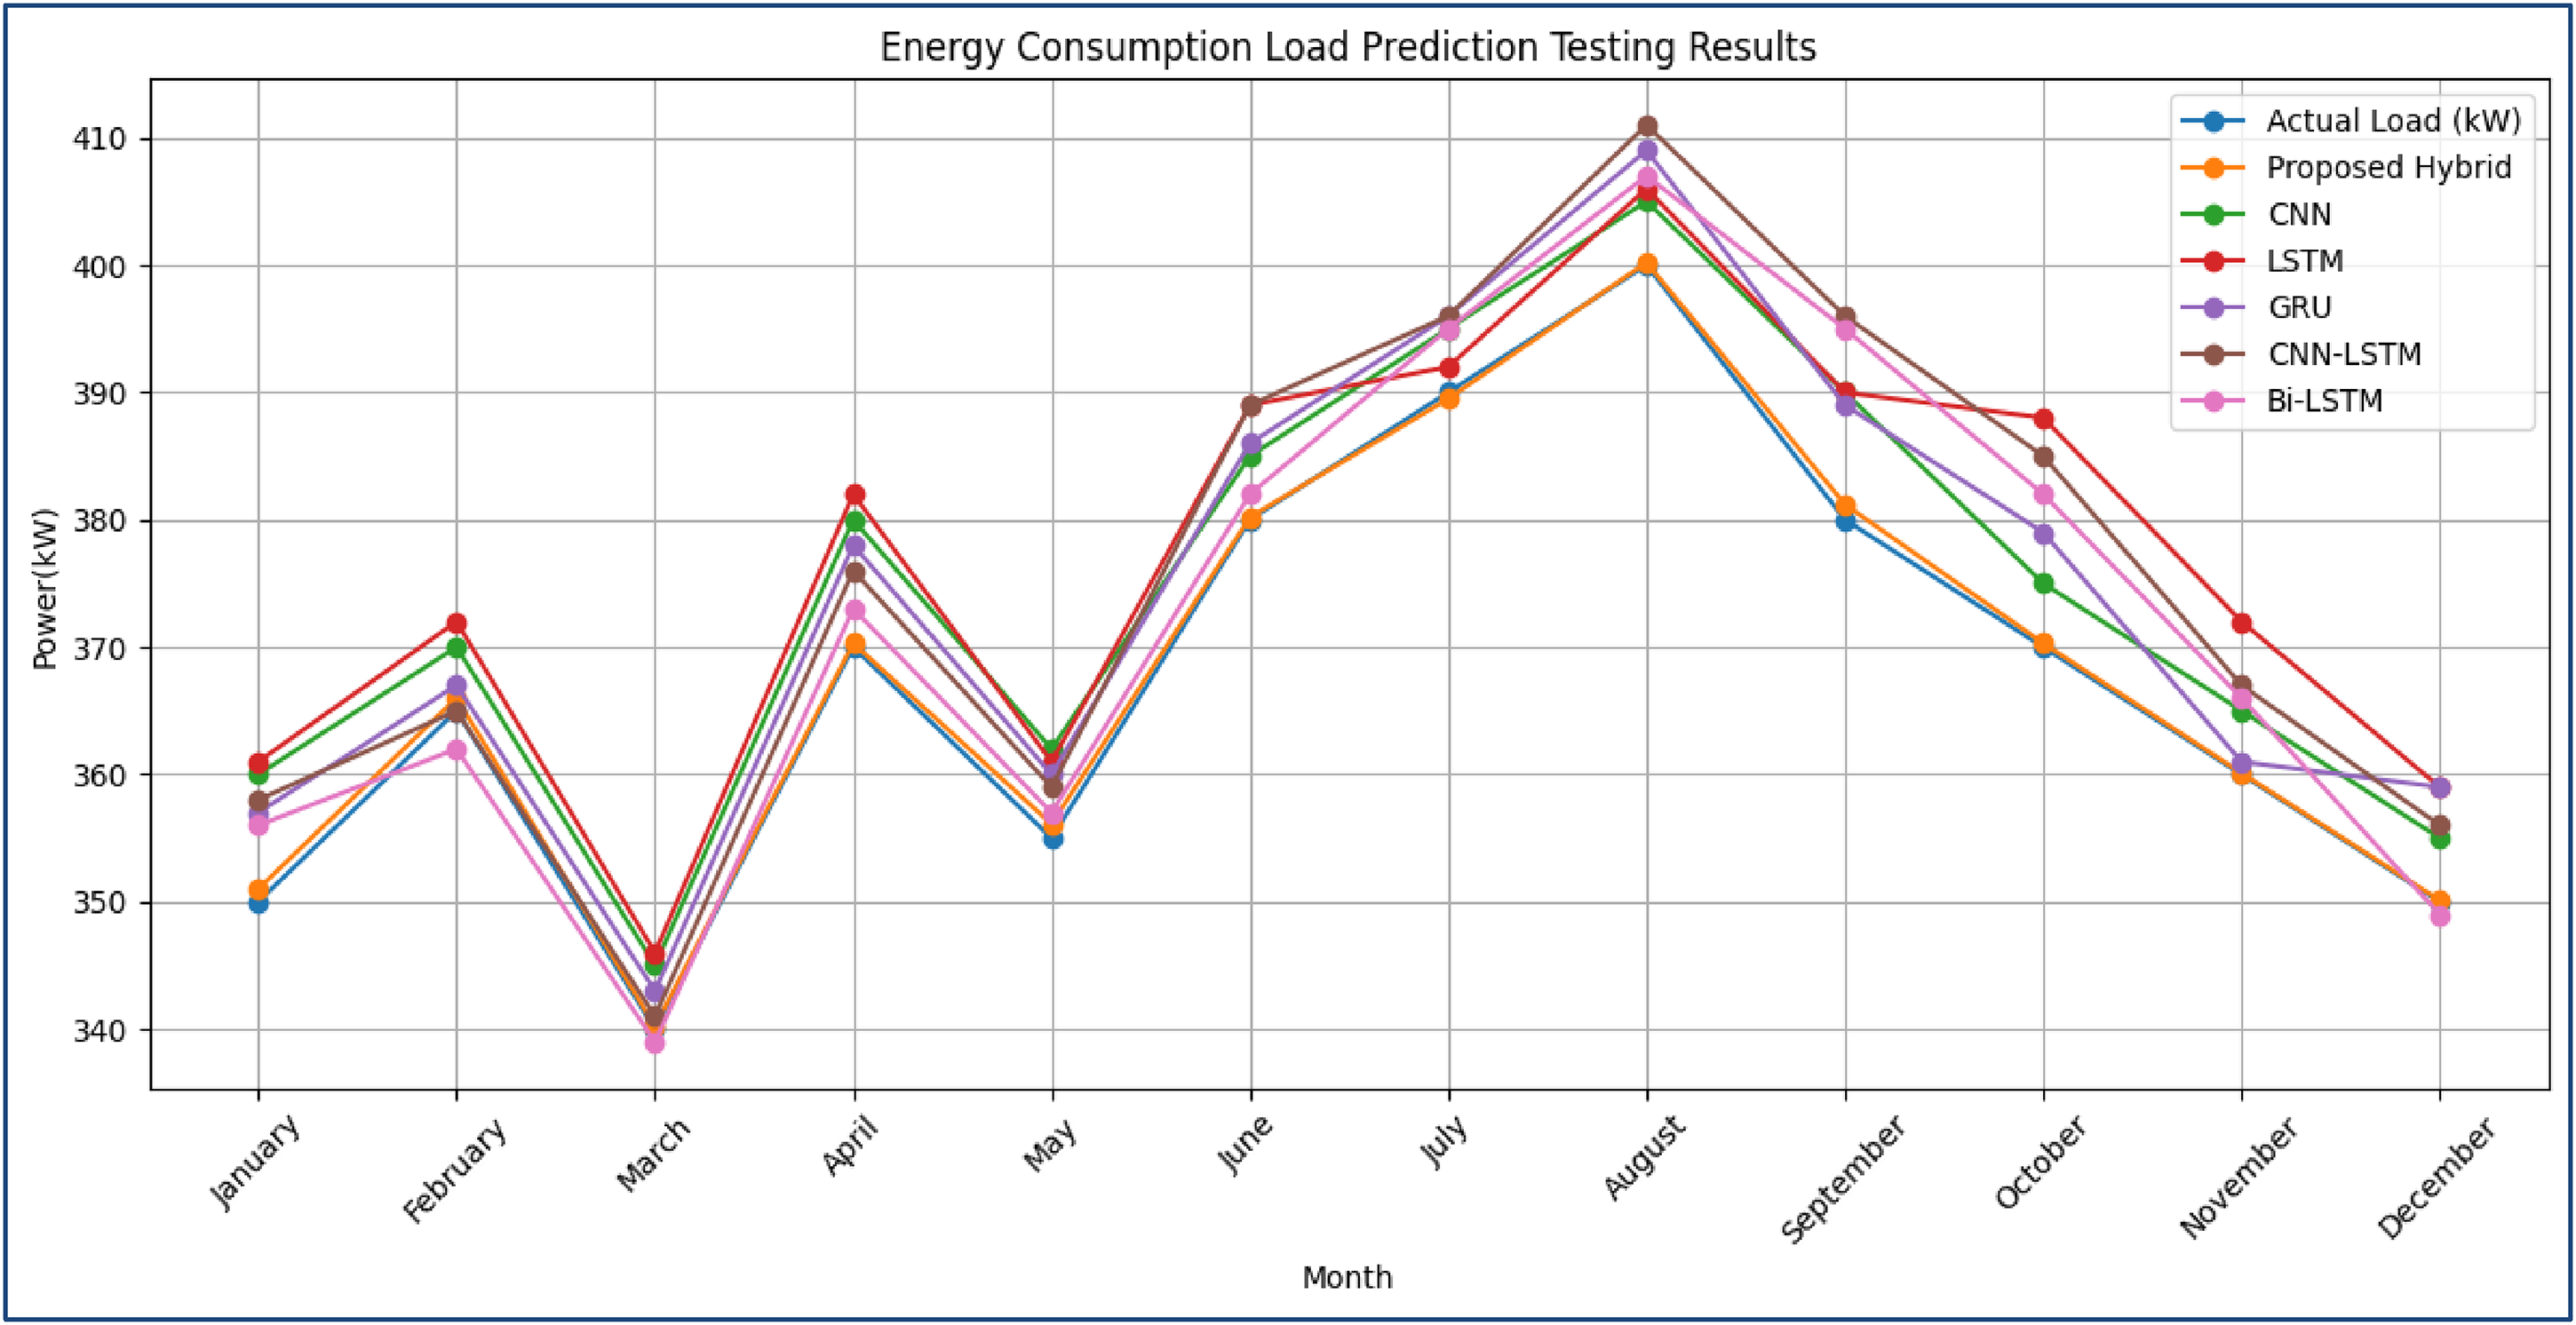
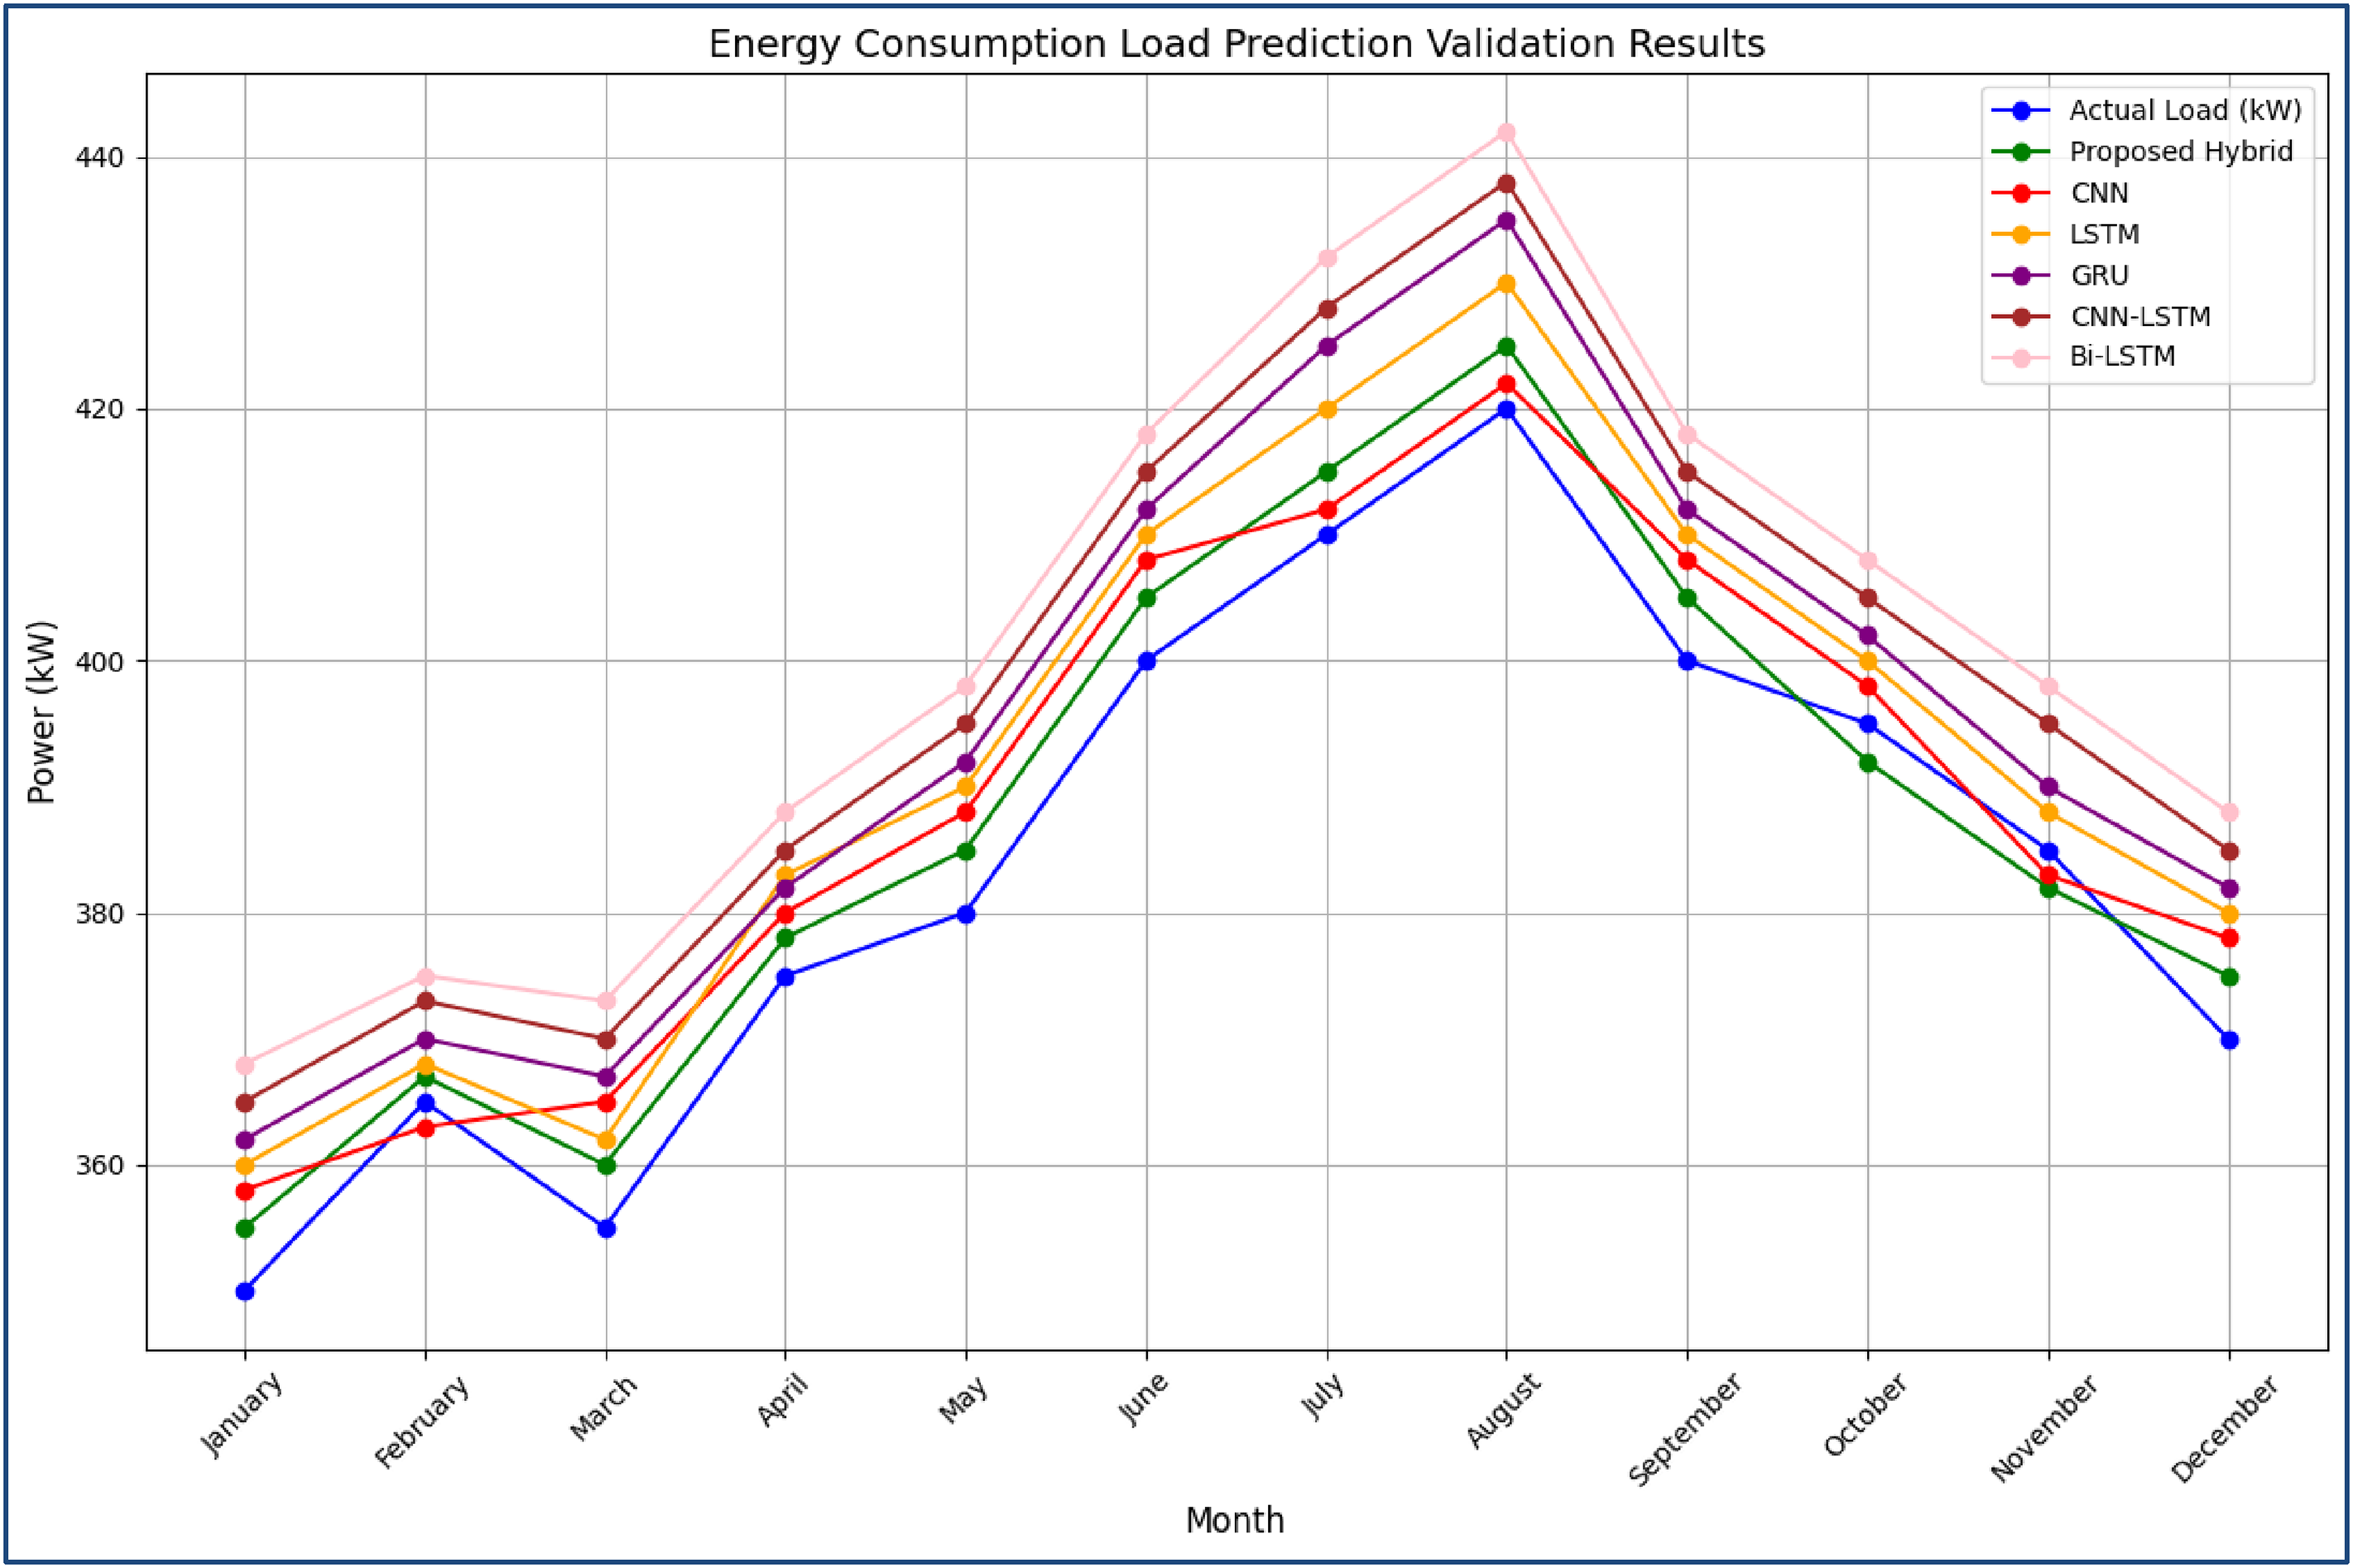
Testing results of the proposed hybrid model for mid-term energy load prediction.
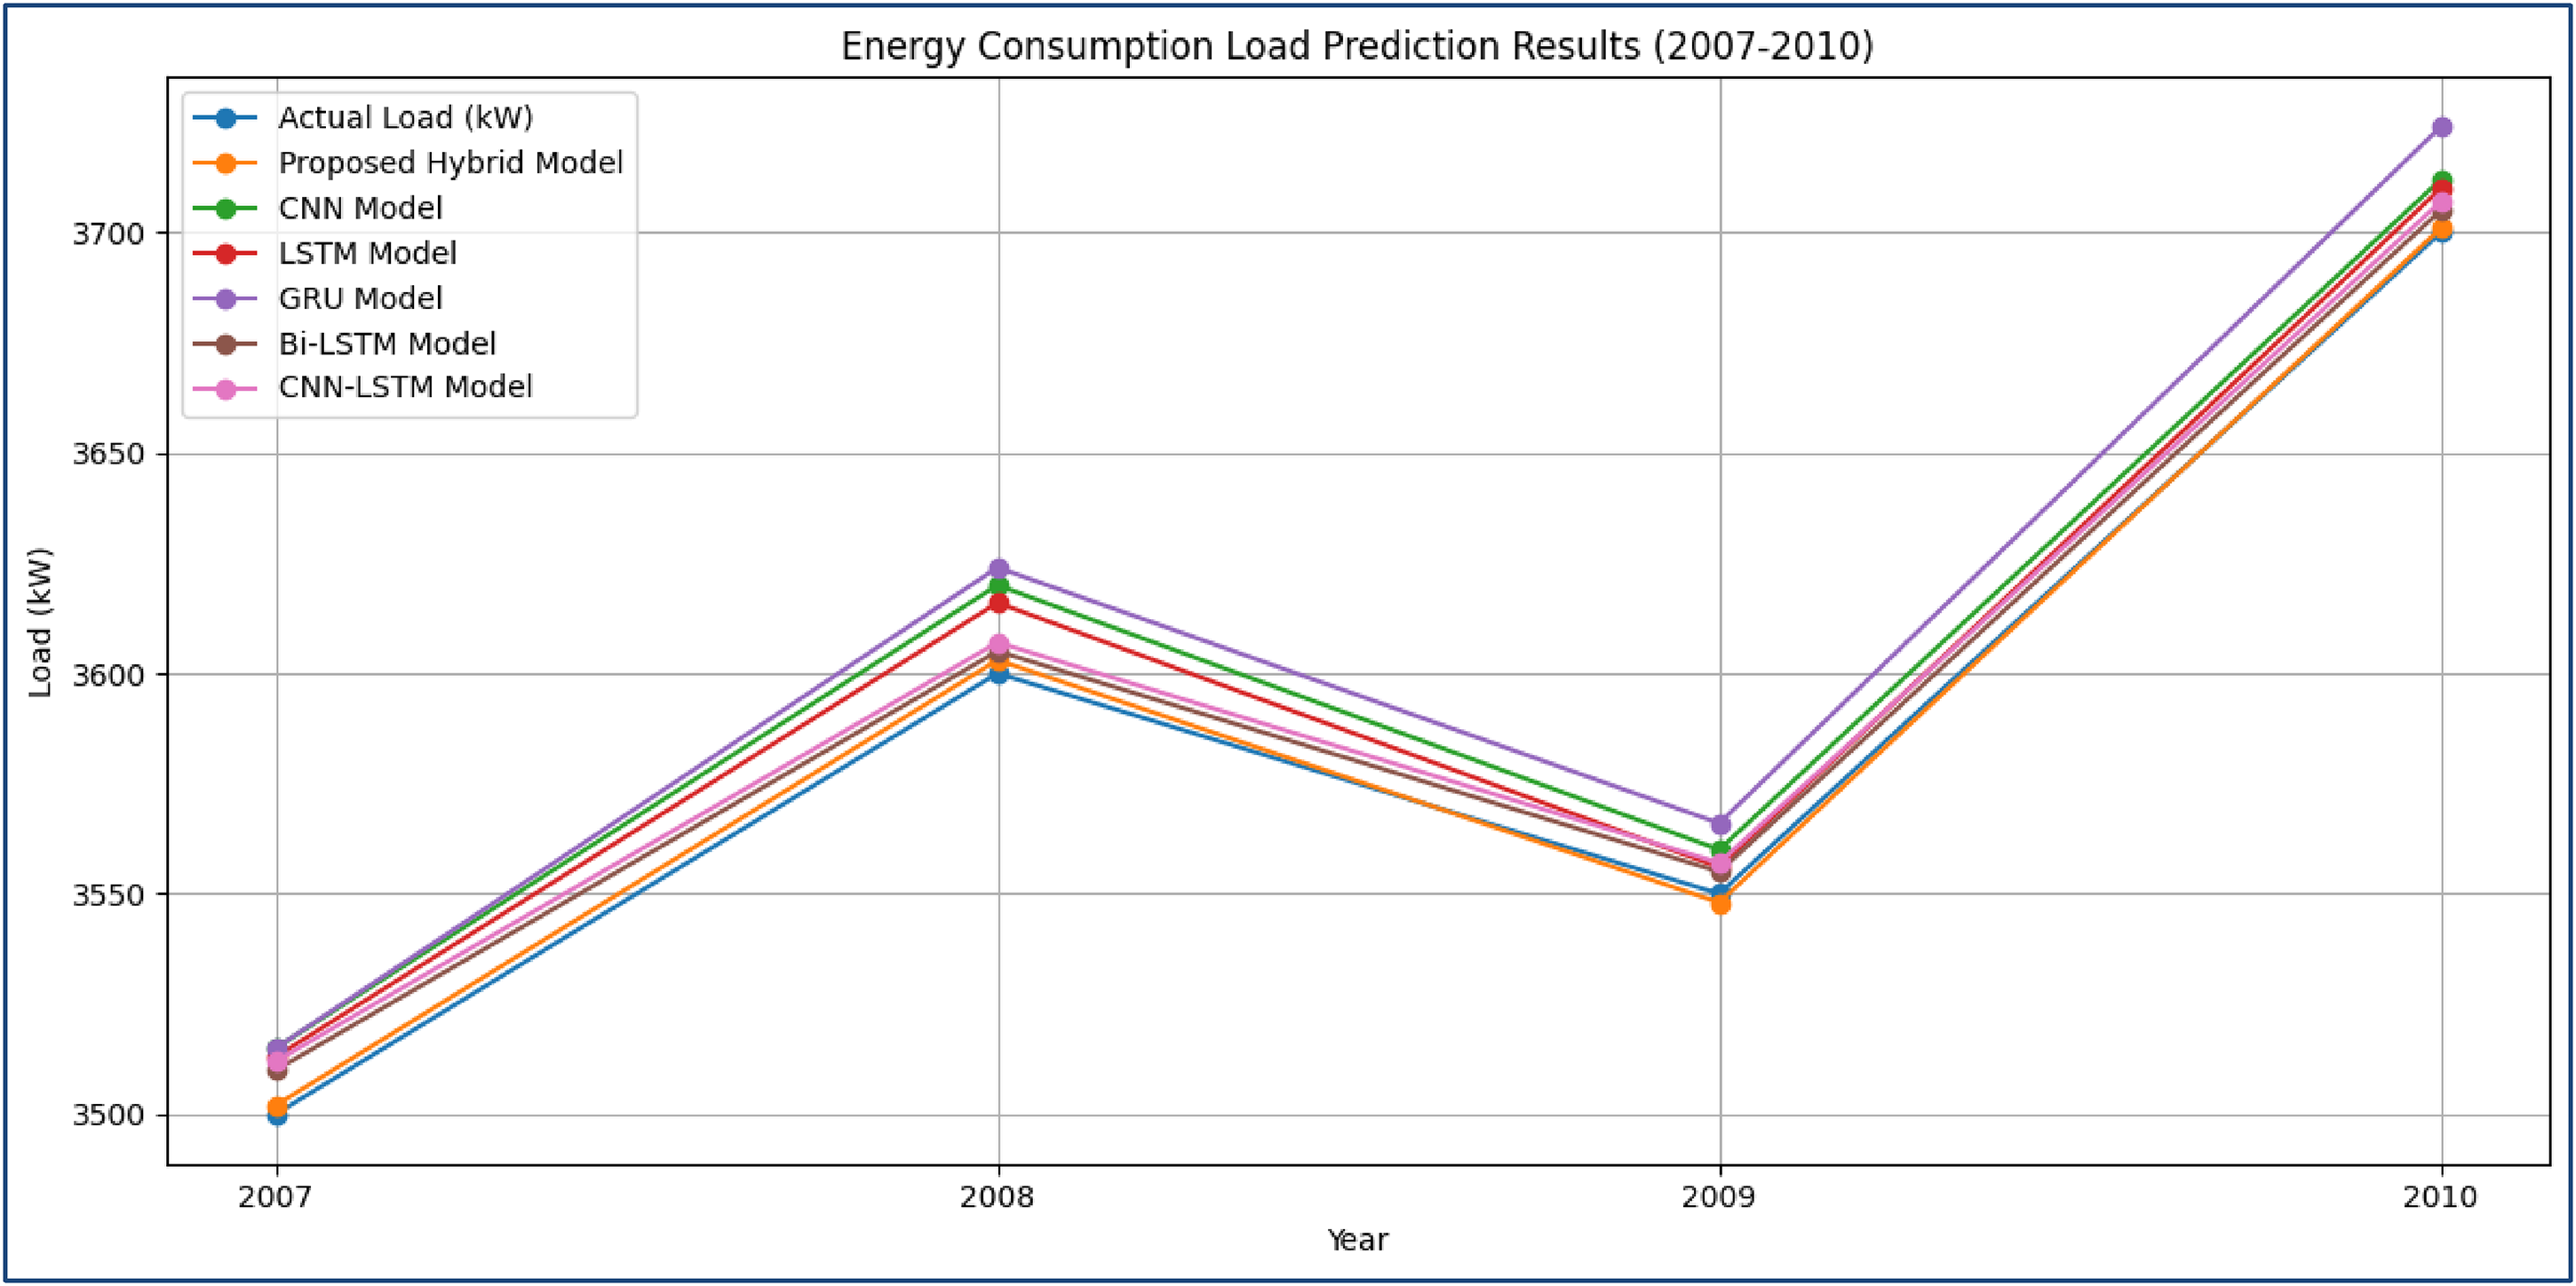
Testing results of the proposed hybrid model for long-term energy load prediction.
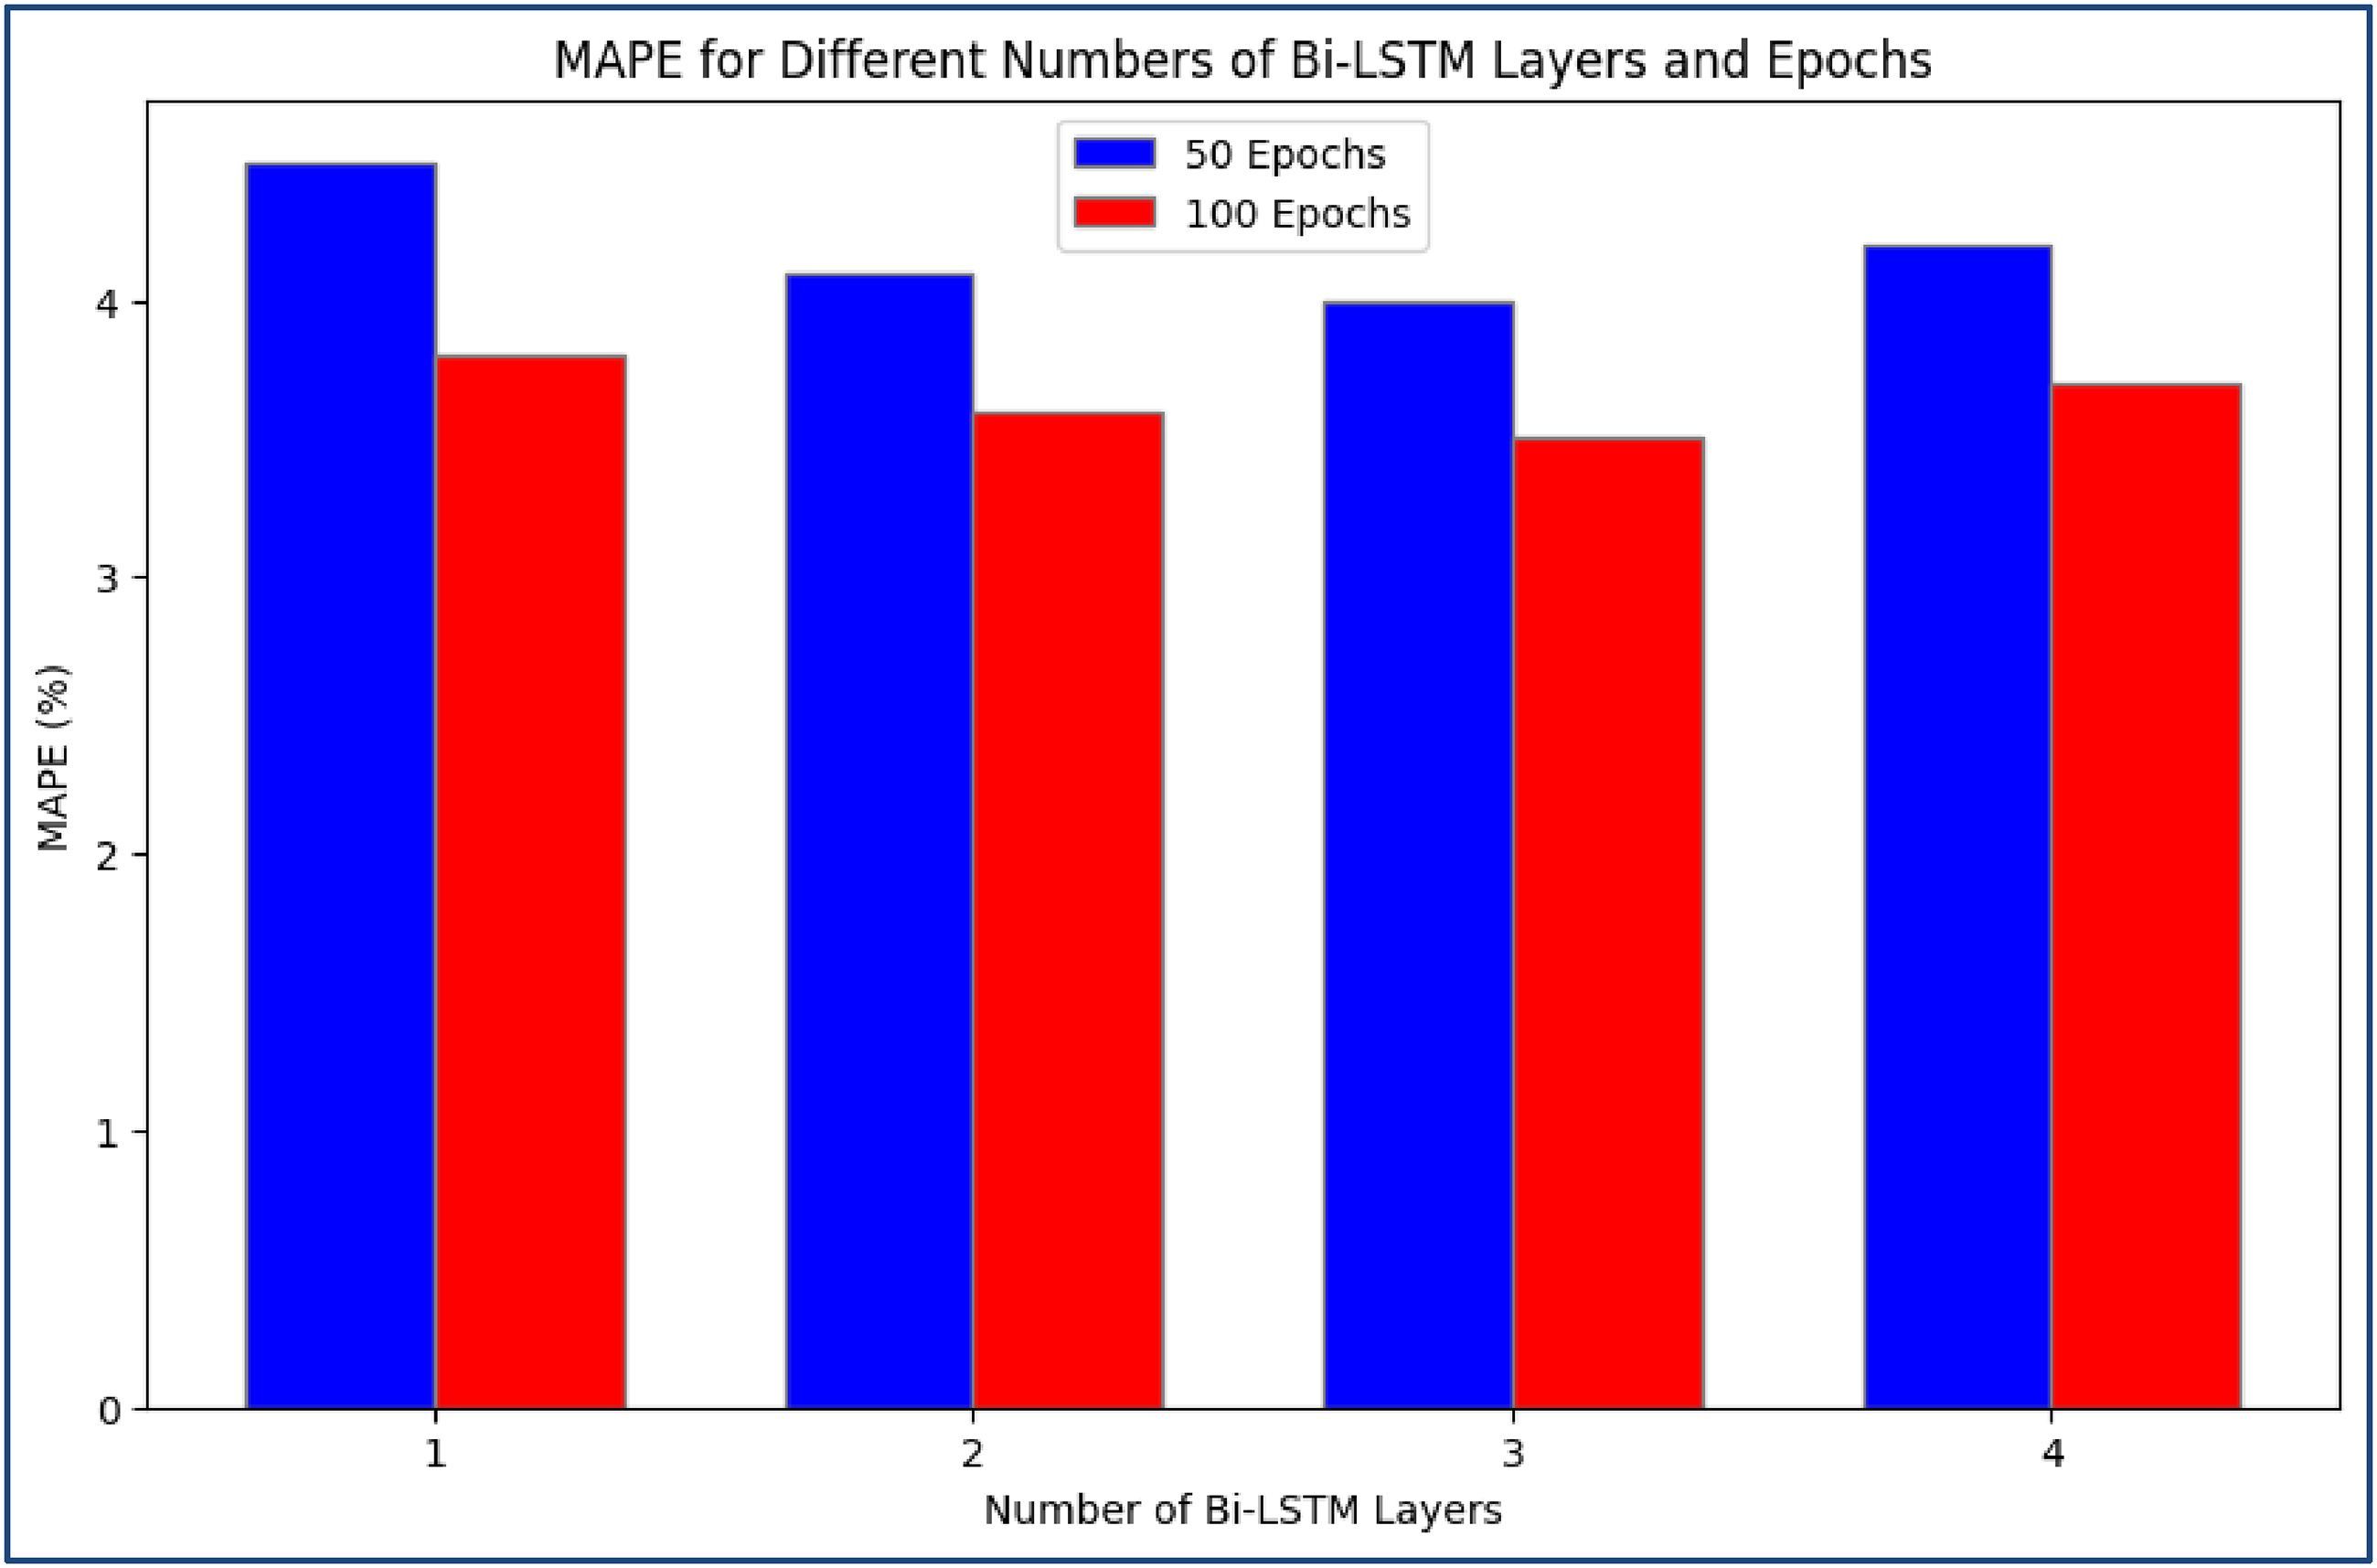
Mean Absolute Percentage Error (MAPE) (%) for different no of Epochs and bidirectional long short-term memory (Bi-LSTM) layers.
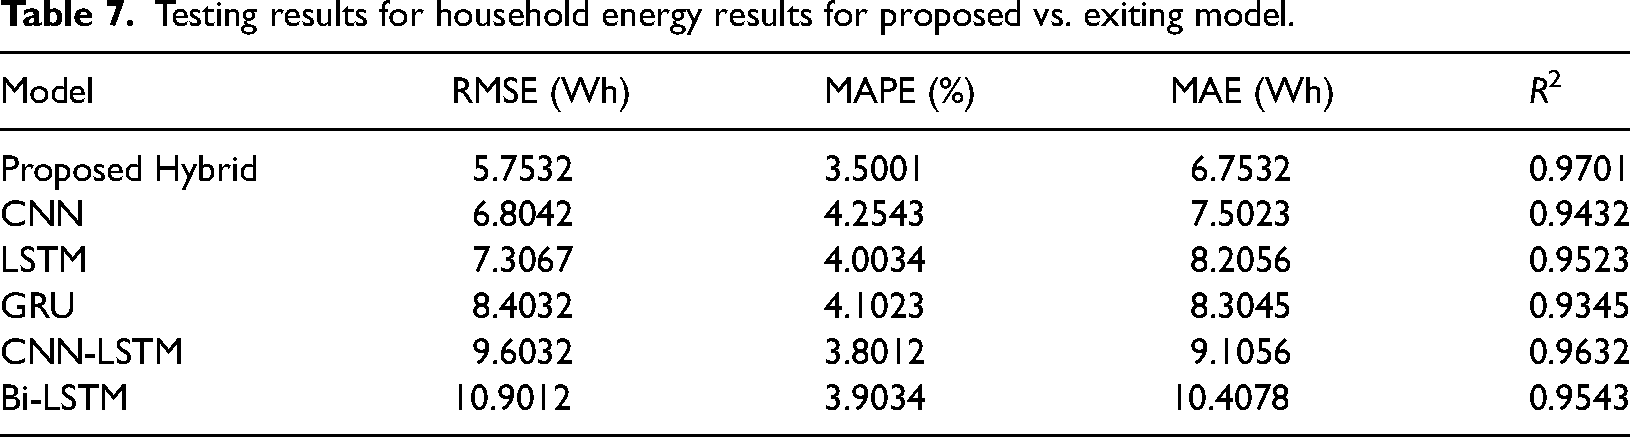
We have also calculated the testing results for household energy consumption for the existing and proposed model, as presented in Table 7. Simulation analyses based on different activation functions are also conducted for existing and proposed models. We have utilized ReLu, Sigmoid and tanh functions. Figure 10 and Table 8 present the outcomes for Household energy results for the Proposed vs existing model for different activation functions.
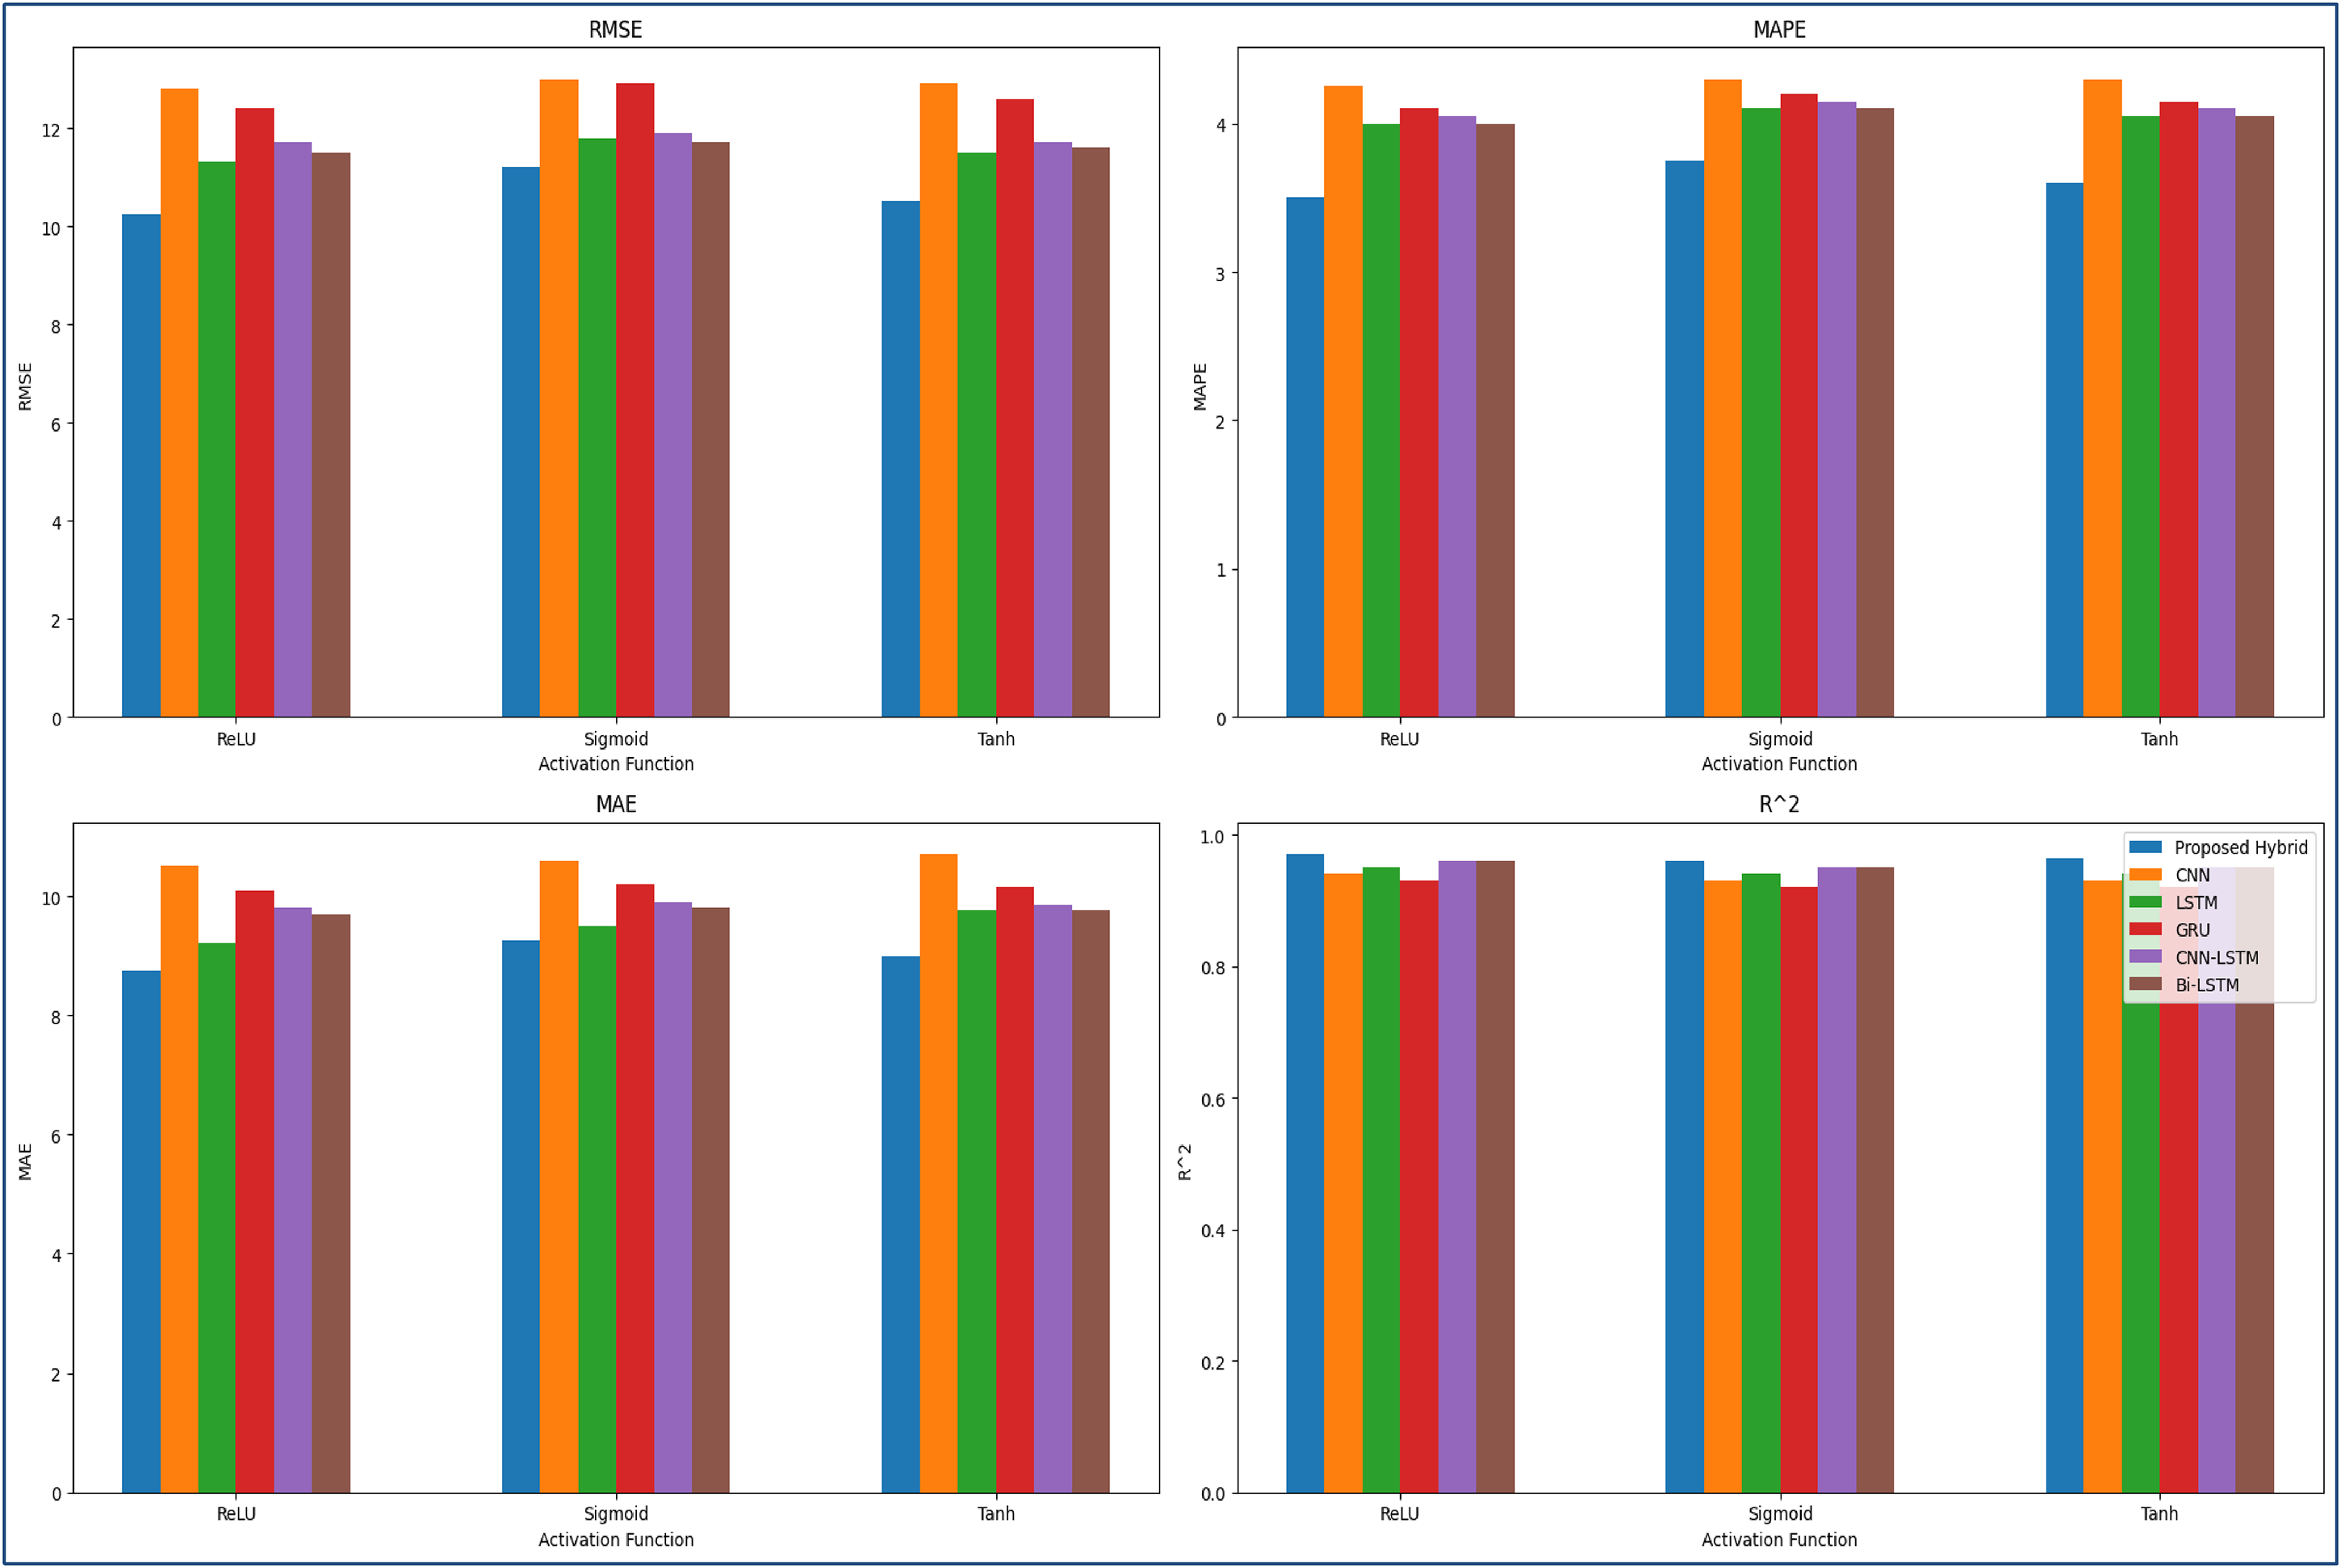
Household energy results for proposed vs. existing model for different activation functions.
Testing results for household energy results for proposed vs. exiting model.
Household energy results for proposed vs. existing model for different activation functions.
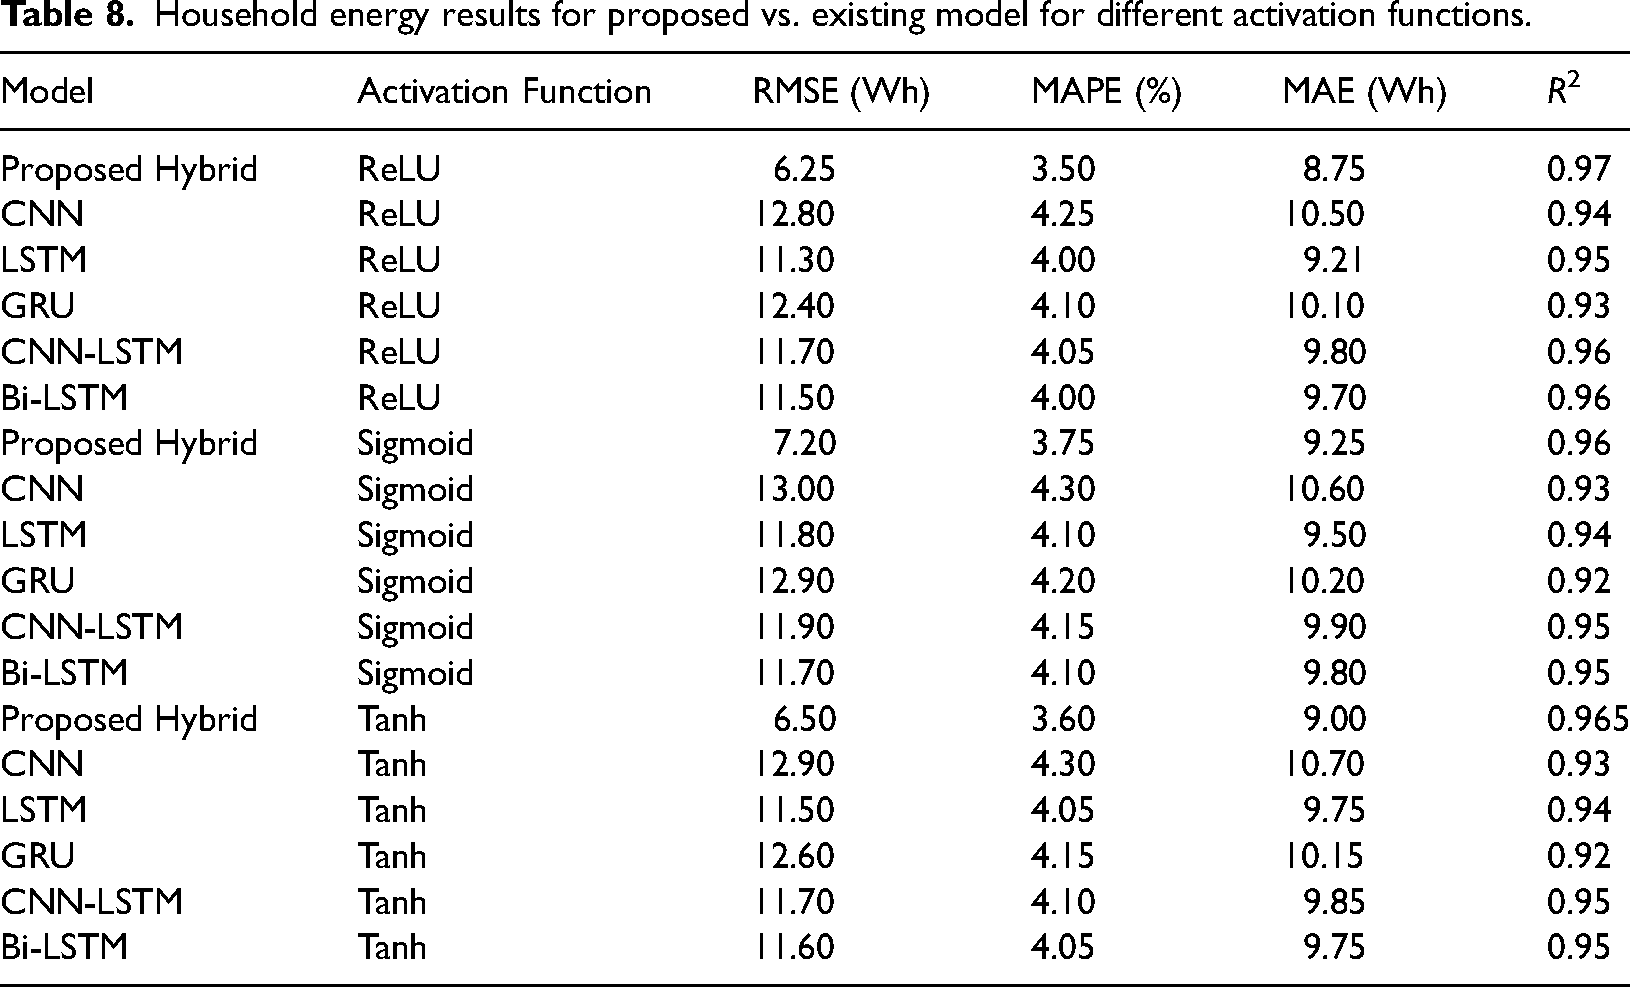
Table 9 shows the hybrid and existing models’ household energy prediction validation results. The hybrid model displays optimal performance, with RMSE of 5.8541 Wh, MAPE of 3.6021%, MAE of 6.8041 Wh and R² of 0.9692. The CNN model has an RMSE of 6.9056 Wh, MAPE of 4.3564%, MAE of 7.6051 Wh and R² of 0.9425, whereas the LSTM model has an RMSE of 7.4089 Wh, MAPE of 4.1045%, MAE of 8.3074 Wh and R² of 0.9510 The GRU model has RMSE of 8.5043 Wh, MAPE of 4.2034%, MAE of 8.4056 Wh and R² of 0.9337.
Validation results for household energy-proposed vs. existing models.
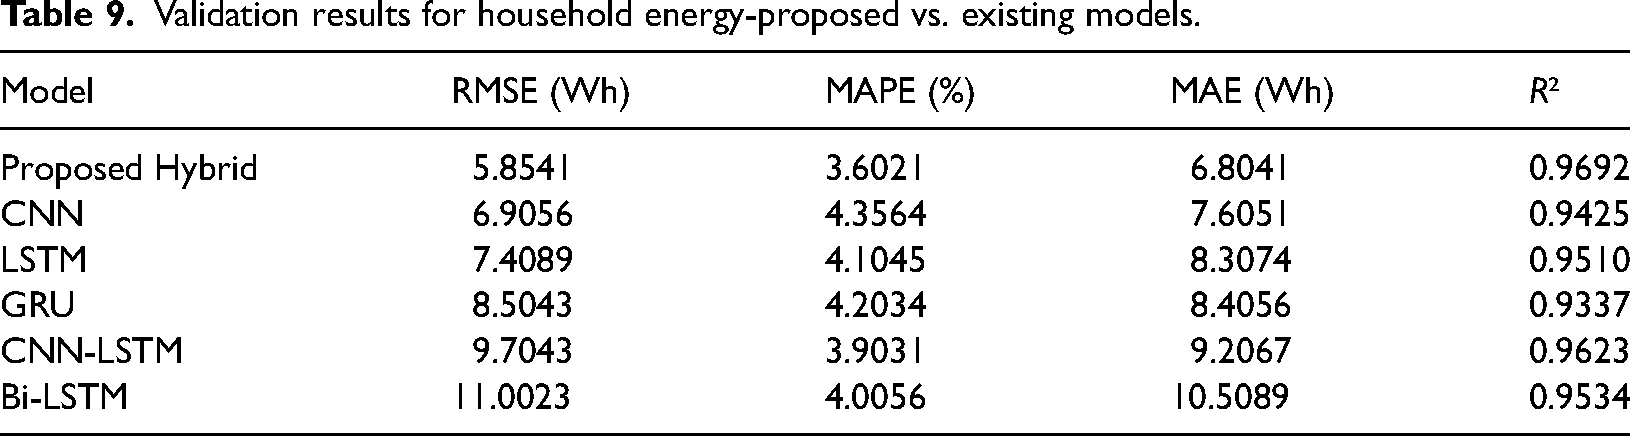
Convolutional neural network-LSTM and Bi-LSTM had error-prone RMSE values of 9.7043 Wh and 11.0023 Wh. The hybrid model outperforms conventional models in energy consumption load prediction, capturing complex patterns and interactions with lower error metrics and higher R² values (Figures 11 and 12).
Validation results for household energy-proposed vs. existing models.
Validation results for energy consumption load prediction for proposed vs. existing models.
Ablation analysis
In this work, employing an ablation analysis, we evaluated the particular contributions of several components inside our proposed hybrid DL model for energy load prediction (Ge et al., 2024; Samadi et al., 2020, 2021; Shu et al., 2023). Multiple experiments were conducted in which specific elements were methodically eliminated from the model and their effects on performance measures, including RMSE, MAPE, MAE and R2.
Understanding how every element affects the general performance of the model helps the ablation study verify the strength and efficiency of our suggested model.
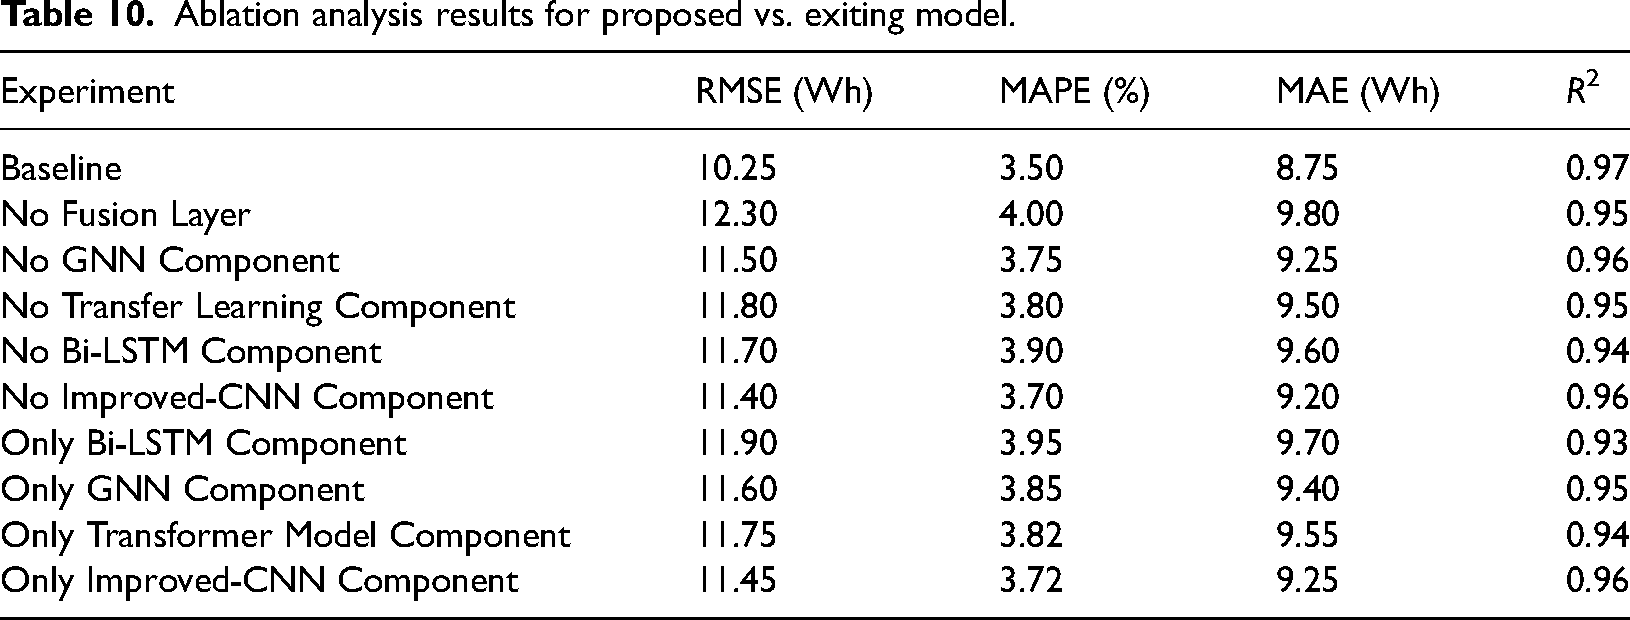
Throughout the analysis, we considered several trade-offs among numerous criteria to ensure a thorough assessment and accurate measurement of the model's performance under various configurations. Enhancing and optimizing the hybrid DL model for energy load prediction raised the model's reliability and applicability in real-world scenarios. Table 10 shows the ablation analysis simulation results, highlighting the results of these investigations.
Ablation analysis results for proposed vs. exiting model.
Results and discussion
The hybrid Model for Short-term Energy Load Prediction testing results are shown in Figure 6. Root Mean Square Error, MAPE, MAE and R2 from experiments on the suggested hybrid model and its modified versions are shown in the figure. The hybrid model ‘Baseline’ experiment outperforms the modified versions in all metrics. The Baseline model has a RMSE of 10.25, compared to 11.40–12.30 for the modified versions. The Baseline's MAPE (3.50%) and MAE (8.75) outperform the modified models’ 3.70%–4.00% and 9.20–9.80 MAPE and MAE values. The Baseline has the highest R2 score of 0.97, indicating a strong fit, while the modified versions have 0.94–0.96. The results unambiguously demonstrate that the original hybrid model, which incorporates Improved-CNN, Bi-LSTM, GNN, Transfer model and fusion layer, yields more precise and dependable energy load predictions than models with modified components.
Similarly, Figure 7 presents the testing results of the proposed hybrid Model for Mid-term energy load Prediction. The observed load values for every single month are compared with the predicted values generated by the models. In January, the observed load was 350 kW. The proposed hybrid model predicted it as 351 kW, while the CNN model predicted 360 kW, the LSTM model predicted 361 kW, the GRU model predicted 357 kW, the CNN-LSTM model predicted 358 kW and the Bi-LSTM model predicted 356 kW. Other months can be similarly compared. In general, the suggested hybrid model demonstrates encouraging outcomes, closely matching the real values, indicating its efficacy in forecasting mid-term energy load compared to the alternative models.
Figure 8 illustrates the testing outcomes of the suggested hybrid model and current DL algorithms for long-term energy load forecasting. The graph compares the real load measurements for each year (2007–2010), and the research ed values derived from the models. In 2007, the recorded load was 3500 kW. The hybrid model anticipated it as 3502 kW, the CNN model anticipated 3515 kW, the LSTM model anticipated 3513 kW, the GRU model anticipated 3515 kW, the Bi-LSTM model anticipated 3510 kW and the CNN-LSTM model anticipated 3512 kW. Other years can be similarly compared. The results suggest that the hybrid model proposed exhibits comparable performance to the current models, thereby demonstrating its efficacy in predicting long-term energy load.
The MAPE results are shown in Figure 9, with particular attention to the impact of Bi-LSTM layers and epochs. Our findings show a clear negative correlation between the number of Bi-LSTM layers and MAPE, indicating that prediction accuracy is enhanced by layer depth. At 50 epochs, the MAPE decreases from 4.50% for a neural network with one layer to 4.00% for a neural network with three layers. However, there is a slight increase to 4.20% for a neural network with four layers. At 100 epochs, the MAPE decreases from 3.80% to 3.50% for three layers and slightly increases to 3.70% for four. The results demonstrate the efficacy of deeper Bi-LSTM architectures in capturing complex data patterns, thereby enhancing energy load predictions.
Furthermore, Table 7 offers a comprehensive assessment of the efficacy of our hybrid model in predicting household energy consumption compared to other well-established DL models, such as CNN, LSTM, GRU, CNN-LSTM and Bi-LSTM. The results, which include RMSE, MAPE, MAE and R2, unequivocally demonstrate the hybrid model's exceptional performance.
The RMSE of our hybrid model is 5.7532, the lowest RMSE among all other models. This suggests that our hybrid model has a higher level of predictive accuracy. The high accuracy of our model is further demonstrated by the MAPE of 3.5001%, which surpasses alternative models by a substantial margin.
In addition, the MAE value of 6.7532 and an R2 of 0.9701 demonstrate the strong performance of our hybrid model in accurately forecasting energy consumption patterns. In contrast, the current models, particularly Bi-LSTM and CNN-LSTM, demonstrate higher error rates in all measurements, highlighting our suggested hybrid method's improved precision and dependability.
Additionally, Table 8 and Figure 10 look at the impact of activation functions on energy consumption prediction. We propose a hybrid model that surpasses the CNN, LSTM and GRU models in terms of RMSE with a value of 6.25 Wh. This model employs the ReLU activation function. This implies that our model possesses a greater degree of predictive accuracy. While the model's accuracy in predicting energy consumption values is further underscored by the MAPE of 3.50%, the lower RMSE suggests a reduction in prediction inaccuracies.
Furthermore, our proposed hybrid model utilizing the ReLU activation function achieves a remarkable R2 value of 0.97, demonstrating its capacity to precisely depict and forecast data patterns. On the other hand, models that use sigmoid activation functions show slightly higher error rates in general, indicating relatively lower accuracy in predicting household energy consumption. The outcomes highlight the critical role that activation functions play in enhancing the model's efficacy, particularly the ReLU activation's superior performance in our hybrid model.
Table 9 presents the findings of an ablation analysis highlighting the distinct roles played by the different components in our hybrid model. The initial experiment, which includes all model components, yields an RMSE of 10.25 Watt-hours, a MAPE of 3.50%, an MAE of 8.75 Watt-hours and an R2 value of 0.97. Eliminating elements such as the fusion layer results in a slight rise in RMSE to 12.30 Wh, highlighting the pivotal function of the fusion layer in improving prediction precision. Moreover, when we remove elements such as GNN, transfer learning, Bi-LSTM and Improved-CNN from our model, we observe a noticeable decrease in performance, highlighting their important role in enhancing our model's ability to make accurate predictions. It is important to note that the RMSE is 11.90 Wh when utilizing only Bi-LSTM. This highlights how combining several DL architectures can enhance the prediction accuracy of energy load.
Our hybrid model stands out because it extensively uses cutting-edge DL architectures. The proposed model effectively captures complex data patterns and relationships in energy consumption by integrating Improved-CNN for spatial feature extraction, Bi-LSTM for temporal sequence modeling, GNN for graph-based representation, Transformer model for attention mechanism and a fusion layer for integrating diverse information sources. The hybrid model's adaptability and versatility allow it to perform well across datasets and energy consumption patterns, making it useful in energy management. The results demonstrate our hybrid model's energy load prediction accuracy and efficiency. This makes it promising for smart building energy management and energy forecasting improvements.
Conclusion & future directions
This research presents a hybrid model that includes components of the Improved-CNN, Bi-LSTM, GNN, Transformer and Fusion Layer architectures for precise energy load forecasting in smart building environments. When the model was rigorously evaluated using multiple metrics against existing DL models, consistent superiority was shown in short-, mid- and long-term prediction tasks. In particular, the baseline hybrid model outperformed both modified and traditional models regarding R2 scores and achieved significantly lower RMSE, MAPE and MAE, indicating its strong predictive abilities.
Additionally, an ablation analysis was performed to analyze the individual contributions of each model component, emphasizing their collective influence on the improvement of prediction accuracy. This analysis emphasizes the synergistic advantages of incorporating multiple DL architectures within the hybrid model framework. The research advances the field of energy load forecasting in smart buildings and establishes a dependable predictive model suitable for practical implementation.
Future research will focus on optimizing model hyperparameters and architectural configurations to further improve performance. The model's predictive accuracy under diverse conditions could be improved by incorporating supplementary external factors, such as weather data, occupancy patterns and building characteristics. Investigating innovative DL methodologies, including reinforcement learning and attention mechanisms, could offer more profound insights into capturing intricate energy consumption patterns.
Despite its inherent strengths, the proposed hybrid model has limitations, such as the computational complexity of integrating multiple DL architectures and the challenges of real-time application in dynamic smart building environments. Collaborating with industry stakeholders and conducting ongoing validation in real-world scenarios will be crucial for effectively refining and deploying the model to address these challenges. Ultimately, this research aims to improve the efficiency and resilience of urban infrastructure by promoting sustainable energy management practices in smart buildings.
Footnotes
Acknowledgements
The authors extend their appreciation to King Saud University for funding this work through the Researchers Supporting Research number (RSPD2024R685), King Saud University, Riyadh, Saudi Arabia.
Author contributions
All the authors contributed equally.
Dataset availability statement
The dataset will be made available upon individual request to the corresponding author.
Declaration of conflicting interests
The author(s) declared no potential conflicts of interest with respect to the research, authorship, and/or publication of this article.
Funding
This project was funded by King Saud University through Researchers Supporting Project number (RSPD2024R685), King Saud University, Riyadh, Saudi Arabia.