
Abstract
In smart grid management, precise stability prediction is a complicated task that adds to the effective allocation of resources with grid stability. Specifically, demand-side management is considered an essential element of the overall Smart Grids system. Hence, predicting future energy demands is crucial to regulating consumption by aligning utility offerings with consumer demand. This research presents a hybrid deep learning model (Convolutional Neural Network [CNN] with Bi-LSTM) with a two-way attention method and a multi-objective particle swarm optimization method (MPSO) for short-term load prediction from a smart grid. The proposed hybrid model utilizes a two-way attention method at its encoding and decoding stages, in which an encoding attention layer helps to recognize all the essential features from an input vector, and a decoding attention layer helps to resolve the fixed context vector problem by offering better memory capacity. A CNN and Bi-LSTM are used to capture the essential features from the dataset. We also utilize a t-Nearest Neighbours algorithm to pre-process the initial dataset. An MPSO method combines the features of CNN and Bi-LSTM methods, resulting in better prediction accuracy. As far as we know, it is the first work to suggest a dynamic short-term load prediction model that considers different significant features and enables precise predicting outcomes. The performance of the proposed model and existing well-known deep learning models such as Recurrent Neural Network, Gated Recurrent Unit, Long Short-Term Memory (LSTM), Time Series Transformer, CNN-LSTM and various performance measuring parameters MAE, MSE, MAPE and RMSE are calculated on online UCI dataset (Electrical Grid Stability Simulated Dataset). The proposed hybrid model achieved a better prediction result, which proves the efficiency of the proposed model.
Introduction
Smart grids’ environmental sustainability, dependability and efficiency have revolutionized energy management and delivery. Accurately forecasting energy needs facilitates the management of a smart grid by maximizing resource allocation, fast response to changes in demand and system stability. Conventional techniques for forecasting energy loads frequently prove inadequate because they cannot effectively process the numerous spatial and temporal connections inherent in energy usage data. Due to this inherent defect, it is imperative to explore more sophisticated predictive models capable of effectively addressing these challenges and generating accurate predictions (Xu et al., 2024).
Deep learning is increasingly important in every aspect of our lives. It has significantly impacted various areas, including cancer detection, precision medicine, autonomous vehicles, predictive forecasting and speech recognition. The manually crafted element extractors used in traditional learning, characterization and pattern recognition systems are not adaptable for large-scale datasets (Oqaibi and Bedi, 2024). Depending on the level of complexity, deep learning can overcome the limitations of previous shallow networks that hindered efficient processing and representations of hierarchical structures in multidimensional training data. Neural networks are an artificial intelligence (AI; machine learning) technique inspired by and mimic the structure and functioning of the human nervous system and the brain (Shahinzadeh et al., 2024).
Stability Prediction is crucial in Smart Grids. This promotes durability and enables administrations to implement efficient strategies for planning and operating power systems. Since electricity is a crucial resource, its consumption must be synchronized with its production to prevent unnecessary waste. Its volatility and unpredictability characterize Stability Prediction, and any underestimation or overestimation can result in significant issues (Buratto et al., 2024). The global implementation of industrialization and automation has significantly enhanced the production of electrical energy, resulting in improved reliability. In the present day, Green Energy is widely utilized as a substitute energy source to fulfill the increasing requirements for electricity.
Nevertheless, numerous obstacles arise in preserving the power reliability and dependability of the electric grid network. One of the main difficult components of global energy use is power systems. Some have proposed the idea of smart grids as a solution to these problems. Smart Grids are a multidisciplinary field that combines power systems with technological advances, smart technology, wireless communication and other related areas (Tursunboev et al., 2024).
Although smart grids have several positive attributes, further enhancements are still significantly needed. Currently, load prediction is being carried out using various models and techniques. Nevertheless, as a result of the rising energy requirements, there is a compelling necessity to create more proficient prototypes (Mbey et al., 2024). The majority of the studies have attempted to address these challenges.
Problem statement
The provision of precise and dependable stability forecasts is essential for the maintenance of grid stability and the optimal distribution of resources in smart grid management. Unfortunately, the complicated, non-linear structures found in utilization data are often difficult for present short-term load forecasting techniques to adequately represent, and this cause's poor performance. The existing approaches might not be sufficient to handle the issues brought about by high dimensionality, a wide range of features, and the need for real-time processing. To close this gap, we need an advanced predictive model that can combine multiple critical features, increase memory capacity and improve accuracy when predicting.
Bidirectional long short-term memory (LSTM) networks and convolutional neural networks (CNNs) are combined in this work to produce a robust hybrid deep learning model that is improved by a two-way attention mechanism and optimized using multi-objective particle swarm optimization (MPSO). Through the resolution of the flaws in current approaches and provision of a precise short-term energy load prediction in smart grids, this model aims to enhance overall grid stability management.
Motivation of the research
In smart grids, accurate stability forecasts are essential to the efficient allocation of resources, the response to demand and the construction of the general grid. Traditional methods frequently fail to capture the intricate temporal and spatial correlations that are present in stability data, which results in suboptimal performance. This research makes use of cutting-edge deep learning techniques, more specifically a hybrid model that combines Bi-LSTM networks and CNNs that have been improved with a two-way attention mechanism. This is done in order to overcome the constraints that have been encountered. Currently, some smart grid components account for changes in customer electricity consumption at specific times when the smart grid atmosphere is being formed (Miraftabzadeh and Longo, 2023). These constituents comprise intelligent energy metres, renewable energy sources and electric vehicles.
The motivation behind this strategy is to improve energy efficiency by means of better resource management and more sustainable grid operations. Furthermore, this strategy seeks to overcome the limitations of traditional approaches by detecting complex patterns in stability data and improving prediction capabilities. Furthermore, optimizing hyperparameters with MPSO can significantly improve computational efficiency and model performance. This study seeks to share and spread this ground-breaking approach to the field, with the hope of inspiring further innovation and continuous improvement.
Key contribution
This research presents a Smart Grid Stability Prediction Model using Two-way Attention Based Hybrid Deep Learning and MPSO. As far as we know, it is the first work to suggest a dynamic short-term load prediction model that considers different significant features and enables precise predicting outcomes (Wang, 2023). The key contributions are as follows:
The proposed hybrid model utilizes the CNN-BiLSTM deep learning model. A CNN extracts essential features, that is, periodic patterns and trends, from the smart grid dataset. A similar Bi-LSTM model helps to extract the temporal (time-based) dependencies. In the proposed model, we utilize a two-way attention method and encoding and decoding; an encoding attention layer helps recognize all the essential features from an input vector, and a decoding attention layer helps resolve the fixed context vector problem by offering better memory capacity. The proposed hybrid model also uses a MPSO to optimize the hyperparameters. It is a population-based technique that can best trade among the selection of essential parameters, which helps to enhance the prediction accuracy and minimize the computational complexity and prediction errors. The performance of the proposed model and existing well-known deep learning models such as Recurrent Neural Network (RNN), Gated Recurrent Unit (GRU), LSTM, Time Series Transformer (TST), CNN-LSTM and various performance measuring parameters MAE, MSE, MAPE and RMSE are calculated using online UCI dataset (Electrical Grid Stability Simulated Dataset). The proposed hybrid model achieved a better prediction result, which proves the efficiency of the proposed model.
Organization the article
The complete article is organized into sections and subsections, and the details are as follows. ‘Related work’ section covers the related work in the smart grid load prediction field, and ‘Materials and methods’ section covers the materials and methods used in smart grid load prediction research; this section covers the dataset description and the working of the proposed model. ‘Simulation and experimental results’ section covers the experimental results and discussion, and ‘Conclusion and future directions’ section covers the conclusion and future direction of the research.
Related work
Stability Prediction plays a crucial role in the day-to-day operations of energy, particularly in managing fuel resources and making accurate decisions to balance both the demand and production of energy. The advancements in the Smart Grids field are currently in the early stages. Multiple studies have been carried out regarding smart grids, examining their features, standardization and the implementation of smart grid test-bedding. Nevertheless, researchers currently lack effective coordination in developing these concepts during a crucial period of growth. This section presents the analysis of key research in the field of Stability prediction in Smart grids.
In their study, Xu et al. (2024) introduced a framework that utilizes an attention mechanism time series depthwise separable CNN for power load forecasting. Their methodology employs a combination of techniques for prediction, with the attention mechanism enhancing the model's capacity to capture pertinent patterns in the data. The findings demonstrate a substantial enhancement in precision compared to conventional approaches, with a prediction accuracy of roughly 88.9%. A primary obstacle encountered in this work is the requirement for substantial data to adequately train the deep learning model. In another research study, Oqaibi and Bedi (2024) devised a hybrid methodology for predicting electricity load by employing data deconstruction and attention mechanisms. This strategy synergistically harnesses the advantages of various forecasting systems in order to enhance precision. The results indicate a notable enhancement in the accuracy of forecasting when compared to individual approaches, with a prediction accuracy of approximately 90.45%. Nevertheless, there are still obstacles to overcome to optimize the hybrid model and effectively manage the computational complexity that comes with it.
In 2024, Shahinzadeh et al. did a comprehensive examination and comparative evaluation of deep learning methodologies for predicting the energy demand in smart grid systems. The researchers analyzed different deep learning models and their effectiveness in load forecasting. They emphasized the advantages and drawbacks of each strategy. The work offers valuable insights into the efficacy of several deep learning algorithms for load forecasting, aiding researchers in selecting the best appropriate strategy for their specific requirements. Buratto et al. (2024) introduced a Seq2Seq-LSTM model incorporating an attention mechanism for predicting power load in Brazil. The model utilizes the attention mechanism to concentrate on pertinent segments of the input sequence, enhancing the precision of prediction. The results demonstrate that the suggested model surpasses conventional approaches, with a prediction accuracy of approximately 88.6%. Nevertheless, there are still obstacles to overcome to enhance the model's structure's efficiency and manage the input data's intricacy.
Tursunboev et al. (2024) created a hybrid deep learning model that combines multiple objectives and evolutionary algorithms to detect instances of energy theft. The model integrates deep learning and evolutionary methods to enhance the identification of energy theft in smart grids. The results indicate that the suggested approach is highly effective in identifying instances of energy theft, achieving a detection accuracy of around 91.7%. Nevertheless, there are still obstacles to overcome in order to optimize the model features and effectively manage the intricacy of the data. In their study, Mbey et al. (2024) introduced a sophisticated deep-learning model that addresses the challenge of projecting solar PV power and electrical demand in smart grid systems. The model incorporates multiple objectives to enhance its performance. The model combines many goals, such as predicting solar power production and electricity consumption, to enhance the system's overall effectiveness. The results demonstrate that the suggested model surpasses conventional approaches, with a prediction accuracy of approximately 90.74%. Nevertheless, there are still obstacles to overcome in order to optimize the model parameters and effectively manage the fluctuations in solar power and electrical consumption.
Liao et al. (2023) introduced a method for short-term load forecasting that utilizes a deep-learning temporal pattern attention mechanism. The approach employs an attention mechanism to capture pertinent patterns within the data and enhance the precision of predictions. The results indicate that the suggested strategy surpasses previous methods, with a prediction accuracy of approximately 89.25%. Nevertheless, there are still obstacles to overcome in order to optimize the attention process and effectively manage the intricacy of the data. Miraftabzadeh and Longo (2023) constructed a sophisticated PV power forecasting model utilizing deep learning and attention methods, which offers enhanced resolution. The model utilizes attention mechanisms to enhance the precision of PV power forecasts. The results indicate the efficacy of the suggested model, achieving a prediction accuracy of approximately 98.93%. Nevertheless, there are still obstacles to overcome in order to improve the efficiency of the model's structure and manage the fluctuations in photovoltaic power generation.
In their study, Wang (2023) presented a technique that combines TCN and BiGRU with attention processes to improve energy efficiency through the implementation of smart grid technologies. The approach integrates various deep-learning methodologies to enhance the energy efficiency of smart grid systems. The results demonstrate that the suggested approach surpasses conventional methods, with a notable enhancement in energy efficiency of approximately 90.37%. Nevertheless, there are still obstacles to overcome in order to optimize the model characteristics and manage the intricacy of smart grid systems. In their study, Wan et al. (2023) devised a Stability forecasting technique for integrated power and heat systems. The method combined CNN, LSTM and attention processes to improve accuracy and efficiency. The approach integrates CNN and LSTM models with attention mechanisms in order to enhance the accuracy of predicting. The results demonstrate that the suggested approach surpasses conventional methods, with a prediction accuracy of approximately 90.6%. Nevertheless, there are still obstacles to overcome to enhance the model structure's efficiency and manage the data's intricacy.
Abou Houran et al. (2023) introduced a hybrid deep learning model for PV/wind power forecasting in smart grid applications, utilizing a coati optimization approach. The model integrates the coati optimization method with CNN-LSTM to enhance the precision of PV/wind power forecasts. The results indicate the efficacy of the suggested model, achieving a prediction accuracy of approximately 89.74%. Nevertheless, there are still obstacles to overcome when optimizing the coati optimization method for PV/wind power forecasts. In their study, He et al. (2023) devised a method for predicting multivariate load for demand response using a pre-attention mechanism and CNN. This strategy utilizes pre-attention mechanisms to identify significant patterns in the data and enhances load prediction accuracy. The results demonstrate that the suggested approach surpasses conventional methods, with a prediction accuracy of approximately 89.15%. Nevertheless, there are still obstacles to overcome in order to optimize the pre-attention process and effectively manage the intricacy of the data.
In their study, So et al. (2023) introduced a BiGTA-Net model to predict electrical energy in building energy management systems. The model employs a combination of deep learning techniques to enhance the accuracy of energy forecasts. The findings illustrate the efficacy of the suggested approach, with a prediction accuracy of approximately 90.26%. Nevertheless, there are still obstacles to overcome to enhance the efficiency of the model's structure and manage the intricacies of constructing energy systems.
In their study, Yi et al. (2023) created a sophisticated deep LSTM-CNN model incorporating self-attention mechanisms and input data reduction techniques for short-term load forecasting. The model integrates LSTM-CNN with self-attention mechanisms to enhance load predictions’ accuracy. The results demonstrate that the suggested model surpasses conventional approaches, with a prediction accuracy of approximately 89.95%. Nevertheless, there are still obstacles to overcome in enhancing the self-attention mechanism and managing the fluctuations in load forecasting data. AlHaddad et al. (2023) created a combined model using a mixture of deep learning techniques to detect unauthorized access in smart grid networks. The model integrates various deep-learning approaches to enhance the accuracy of intrusion detection. The results indicate that the suggested model is highly effective, with an intrusion detection accuracy of approximately 91.7%. Nevertheless, there are still obstacles to overcome in order to optimize the ensemble model and manage the intricacy of smart grid networks.
Kim and Kim (2023) introduced an innovative deep learning–based prediction model that a heuristic approach enhances. This model is specifically designed for optimizing the energy management of microgrids. The model utilizes a heuristic method to optimize the deep learning model for energy management. The results demonstrate that the suggested model surpasses conventional approaches, attaining a notable enhancement of approximately 92.6% in energy management. Nevertheless, there are still obstacles to overcome to enhance the efficiency of the heuristic algorithm for energy management.
Like another energy prediction research, Khan et al. (2023) devised an AI-assisted hybrid method to manage energy in an Internet of Things (IoT)-based smart Microgrid. The methodology integrates AI methodologies with IoT technology to enhance energy management efficiency. The results indicate the efficacy of the suggested method, with a notable enhancement in energy management efficiency of approximately 90.85%. Nevertheless, there are still obstacles to overcome in order to optimize the AI-assisted strategy for various smart microgrid applications.
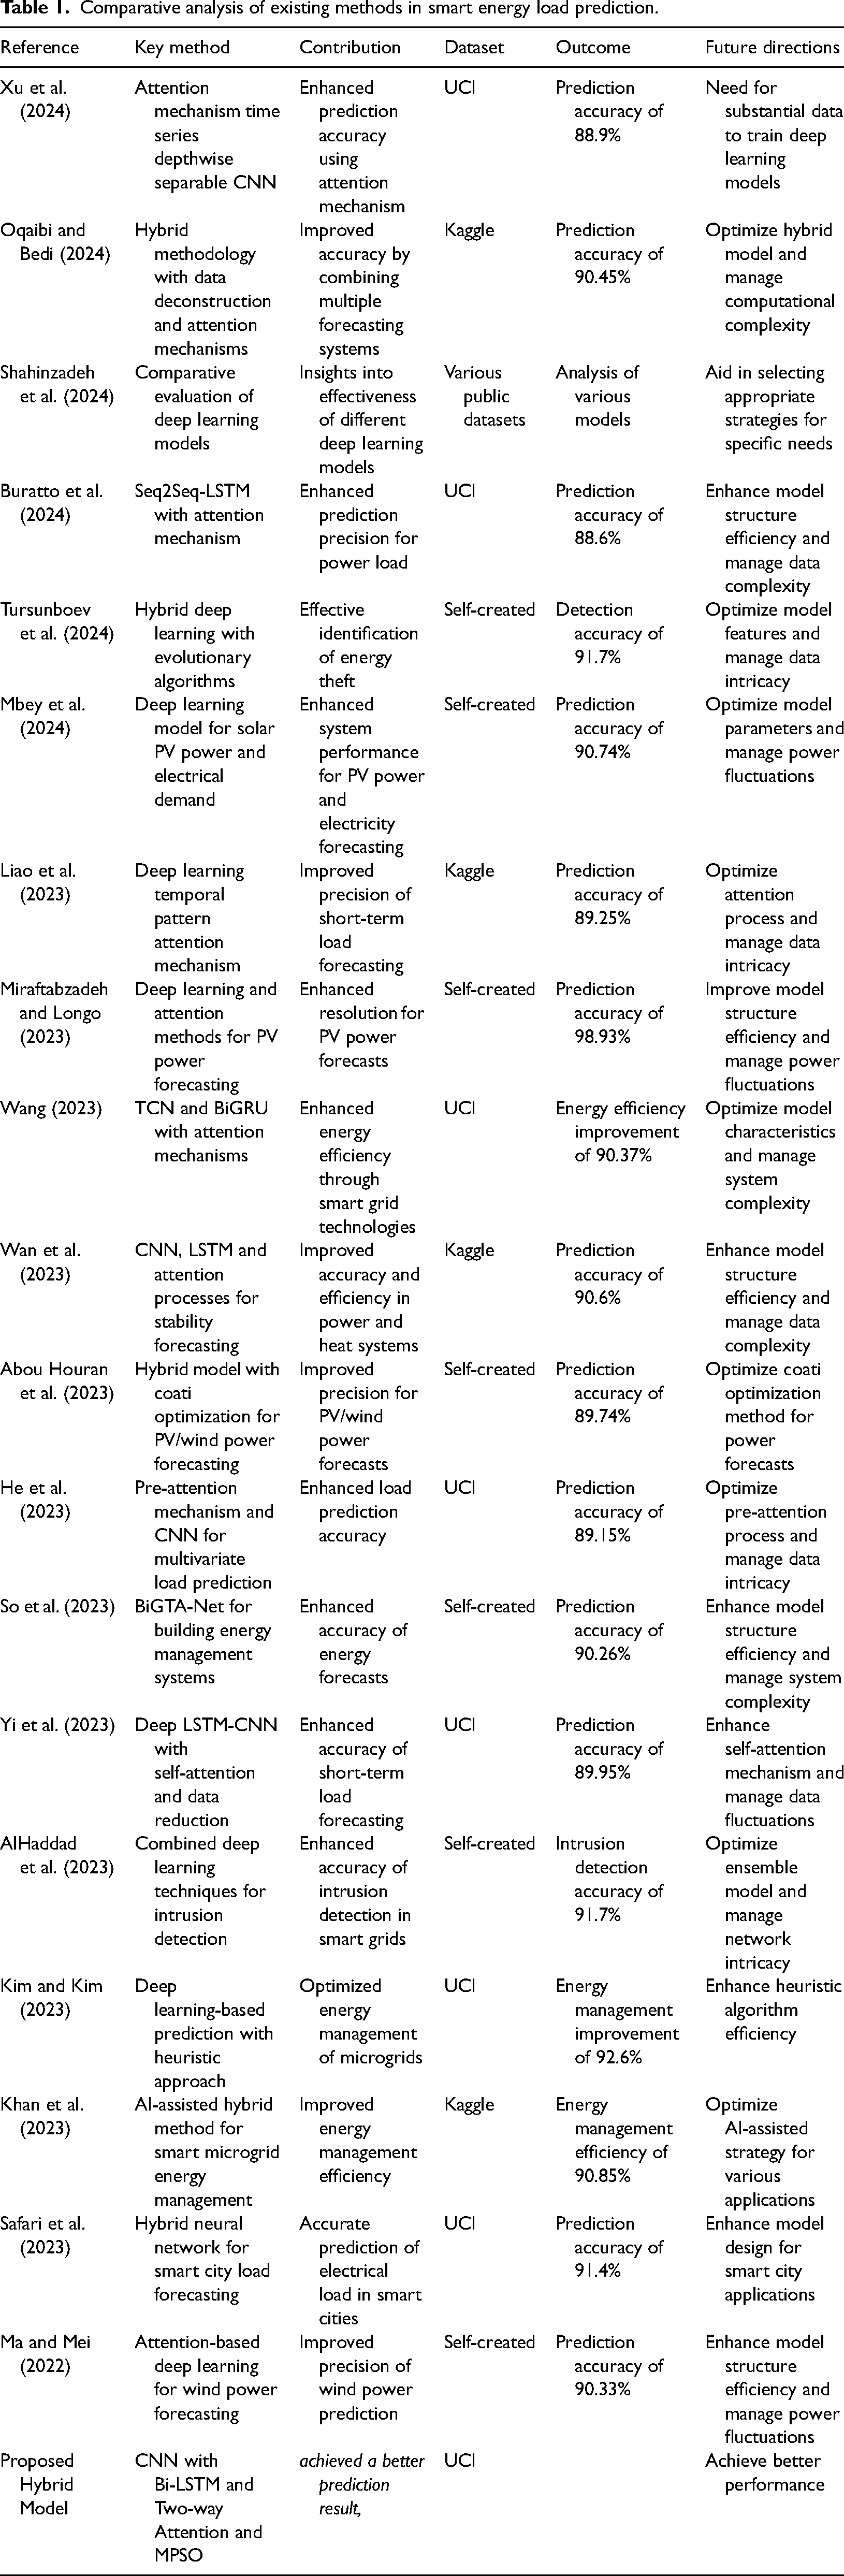
In 2023, Safari et al. introduced a novel hybrid neural network model that accurately predicts the electrical load of smart cities over multiple periods. The model utilizes neural networks to enhance the precision of load forecasting in intelligent urban areas. The results showcase the efficacy of the suggested model, with a prediction accuracy of approximately 91.4%. Nevertheless, there are still obstacles to overcome in order to enhance the model's design for various smart city applications. Ma and Mei (2022) introduced a novel method that combines attention-based deep learning techniques to forecast wind power. The methodology integrates attention processes with deep learning to enhance the precision of wind power prediction. The results indicate the efficacy of the suggested method, with a prediction accuracy of approximately 90.33%. Nevertheless, there are still obstacles to overcome in order to enhance the efficiency of the model's structure and manage the fluctuations in wind power production. Table 1 presents a comparative analysis of existing methods in smart energy load prediction.
Comparative analysis of existing methods in smart energy load prediction.
Materials and methods
This section describes the key methods used in this research.
Proposed hybrid model
The proposed model combines CNNs and Bidirectional LSTM Networks, augmented with a two-way attention procedure and optimized using MPSO to forecast Stability in a smart grid. Furthermore, the t-Nearest Neighbours (t-NN) preprocessing technique is employed to augment data quality and enhance the accuracy of predictions (Ji et al., 2022). Figure 1 presents the architecture of the proposed hybrid model.
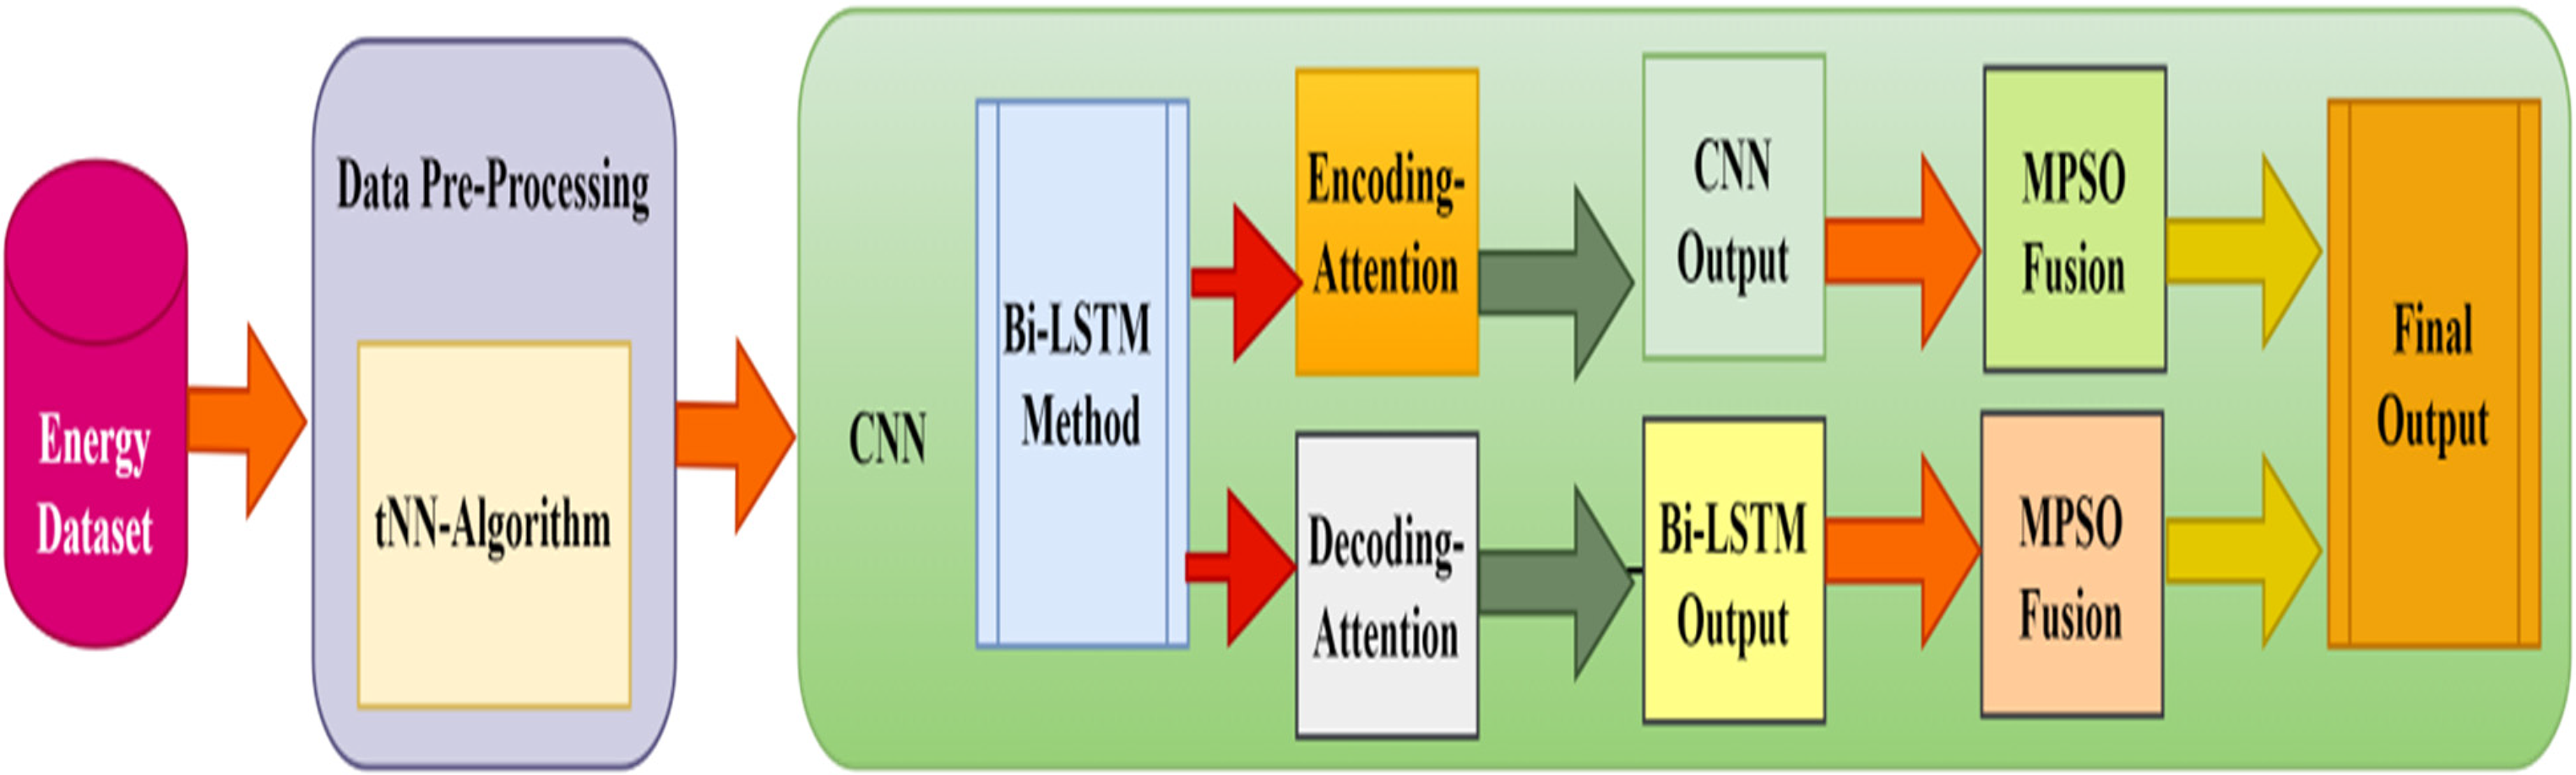
The architecture of proposed hybrid model.
Convolutional Neural Network module
The proposed hybrid model incorporates a CNN module to extract spatial characteristics from its input statistics. The extracted characteristics are subsequently utilized by the subsequent layers within the proposed hybrid framework (Liao et al., 2023). Figure 2 presents the architecture of the CNN Model. Below is an intricate analysis of the functioning of the CNN component.
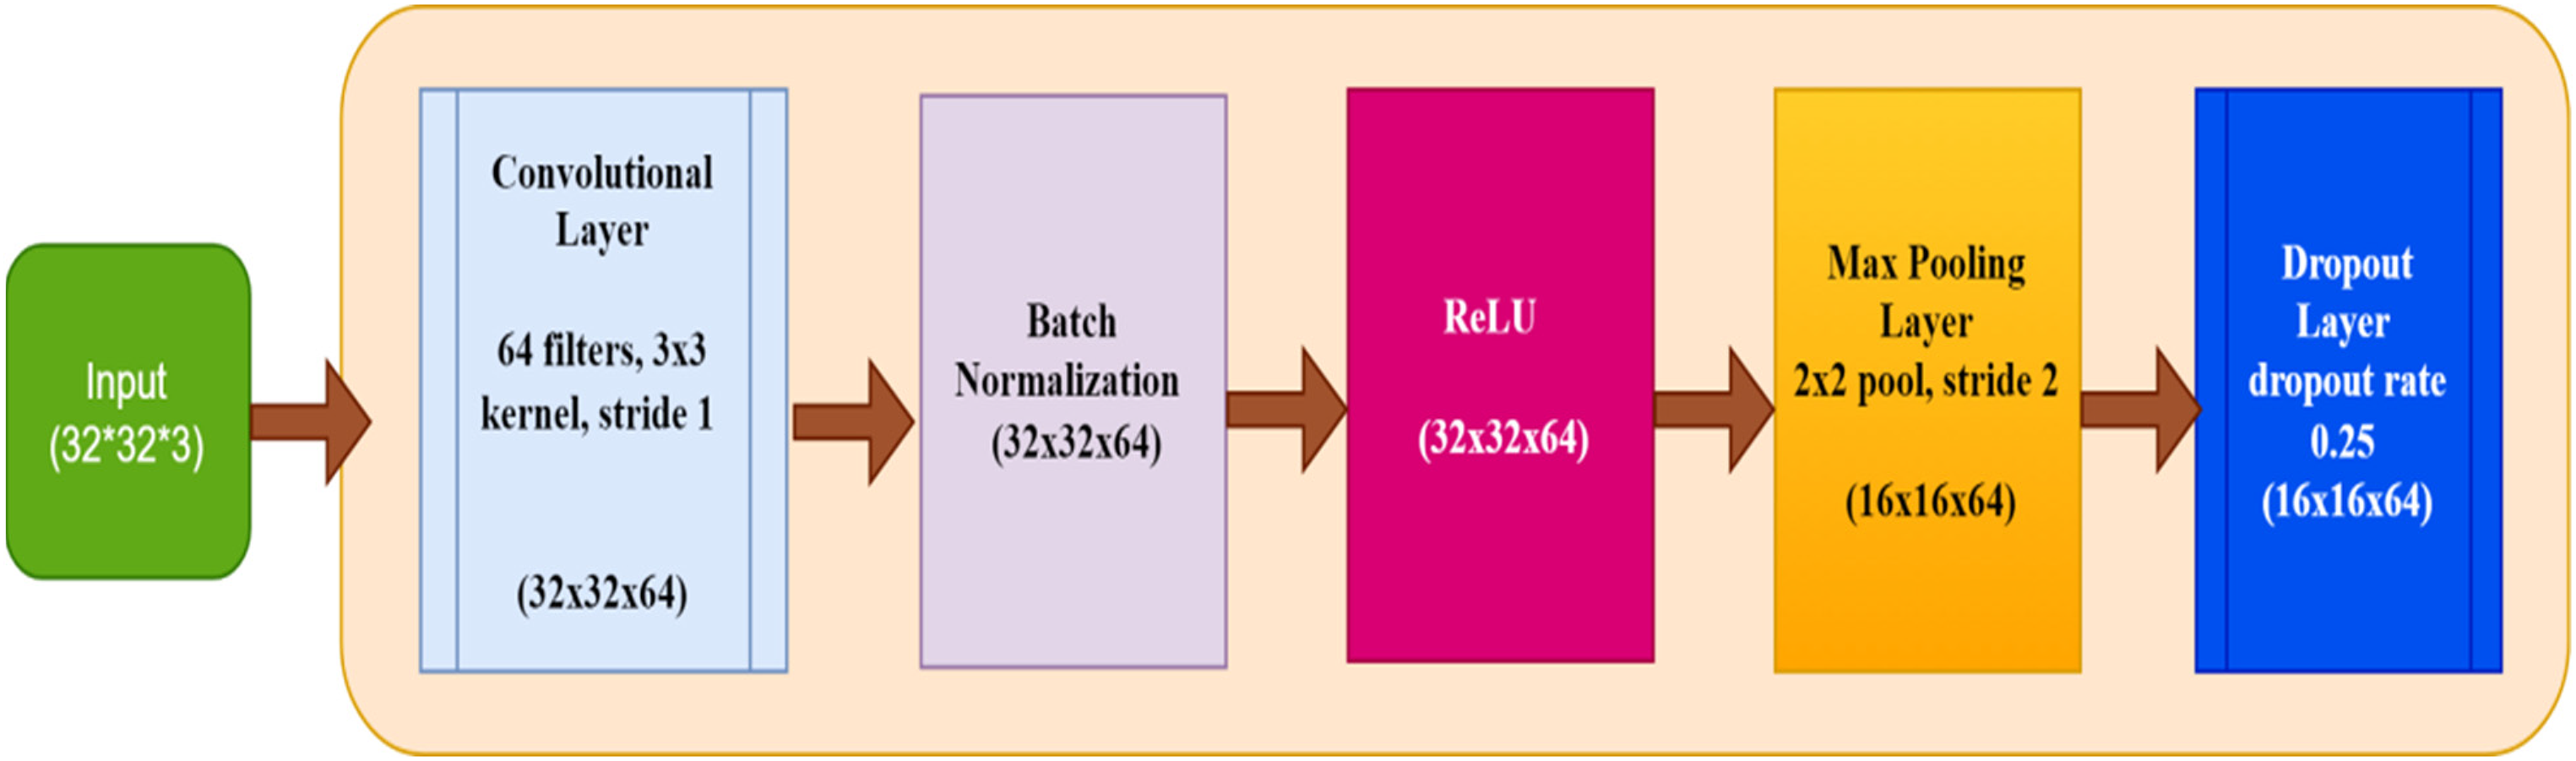
The architecture of the CNN model.
Convolutional layer
The convolutional layers are the central element of the CNN module. The purpose of these layers is to perform convolution operations on the input data to acquire spatial characteristics (Miraftabzadeh and Longo, 2023).
Convolutional Operations: To perform a convolution operation, one must first slide a filter, known as a kernel, over the given input data and subsequently calculate the dot product of the input data and the filter at each position. This operation produces a feature map and an activation map, emphasizing particular patterns within the information being entered. Filter: Filters are compact matrices consisting of trainable parameters. During the training process, the CNN acquires the most effective parameters for these filter parameters to accurately detect substantial patterns within the information being processed. In order to capture distinct patterns, individual convolutional layers may employ multiple filters (Chung et al., 2022). Stride and Padding: Stride refers to the distance when the filter is shifted through the original input data. When the filter has a stride of one, it changes positions one spot at a time; however, when it has a stride of two, it shifts two simultaneously. Padding refers to adding additional boundaries across the original input data to regulate the spatial dimensions concerning the resulting feature map. ‘Valid’ (no padding) and ‘Same’ (padding so that the resultant file has precisely the same measurements as the input) are two common padding mechanisms (Tang et al., 2022).
Activation function
The activation function makes the model less linear after every single convolution operation. We are utilizing a ReLU activation function in the proposed hybrid model, as presented by equation (1). The Rectified Linear Unit (ReLU) function replaces each negative value within the feature map with zero, enabling the model to capture and acquire non-linear features (Ozcan et al., 2021):
Pooling layers
Pooling layers are employed to decrease the spatial dimensions associated with the feature maps, thus diminishing the total number of the variables and their computational complexity.
Max Pooling: Max pooling is a process where a window is moved across the feature map, and the most significant value inside the window is selected. This operation preserves the essential characteristics while decreasing the spatial dimensions. Average Pooling: Average pooling is a process where the mean value inside a given window is calculated rather than the highest possible value being selected. This procedure applies a smoothing effect to the feature map.
Flatting layers
It is common practice to flatten the feature maps into a one-dimensional vector after the layers of convolution and pooling have been applied. After flattening the vector, it can be fed into densely connected and fully connected layers for further processing. During the Flattening process, all the feature maps that are either 2D or 3D are transformed into a 1D vector so that the dense layers can use it.
Dense/fully connected layer
The flattened vector is traversed by any number of fully connected layers. These successive layers learn complicated representations by combining characteristics derived from the convolutional layers. A dense layer comprises neurons that establish complete connections with every neuron in the preceding layer. After applying an activation function based on the weighted average of its inputs, each neuron transfers the output to the subsequent layer (Ma and Mei, 2022).
Output layer
The predictions are generated in the output layer, the final layer of the CNN module. In the output layer, regression tasks such as Stability prediction commonly employ a solitary neuron whose activation function follows a linear pattern. The output layer generates the ultimate energy consumption prediction. It might employ a linear activation function (LAF) to generate continuous values in the context of regression.
Bi-LSTM module
The BiLSTM component improves the model's capacity to comprehend temporal relationships in stability forecasting by analyzing the incoming values in both directions, backward and forward. The bidirectional strategy, in conjunction with the efficacy of LSTM networks, ensures that the model encompasses extensive sequence information, resulting in more precise and dependable predictions. The output generated by the BiLSTM module is subsequently combined with the CNN and attention methods to generate accurate predictions for the final energy load (Syed et al., 2021). A BiLSTM contains two layers. Figure 3 presents the architecture of the BiLSTM model:
Forward LSTM: It mainly follows start-to-end input patterns. Backward LSTM: It mainly follows an end-to-start input pattern.
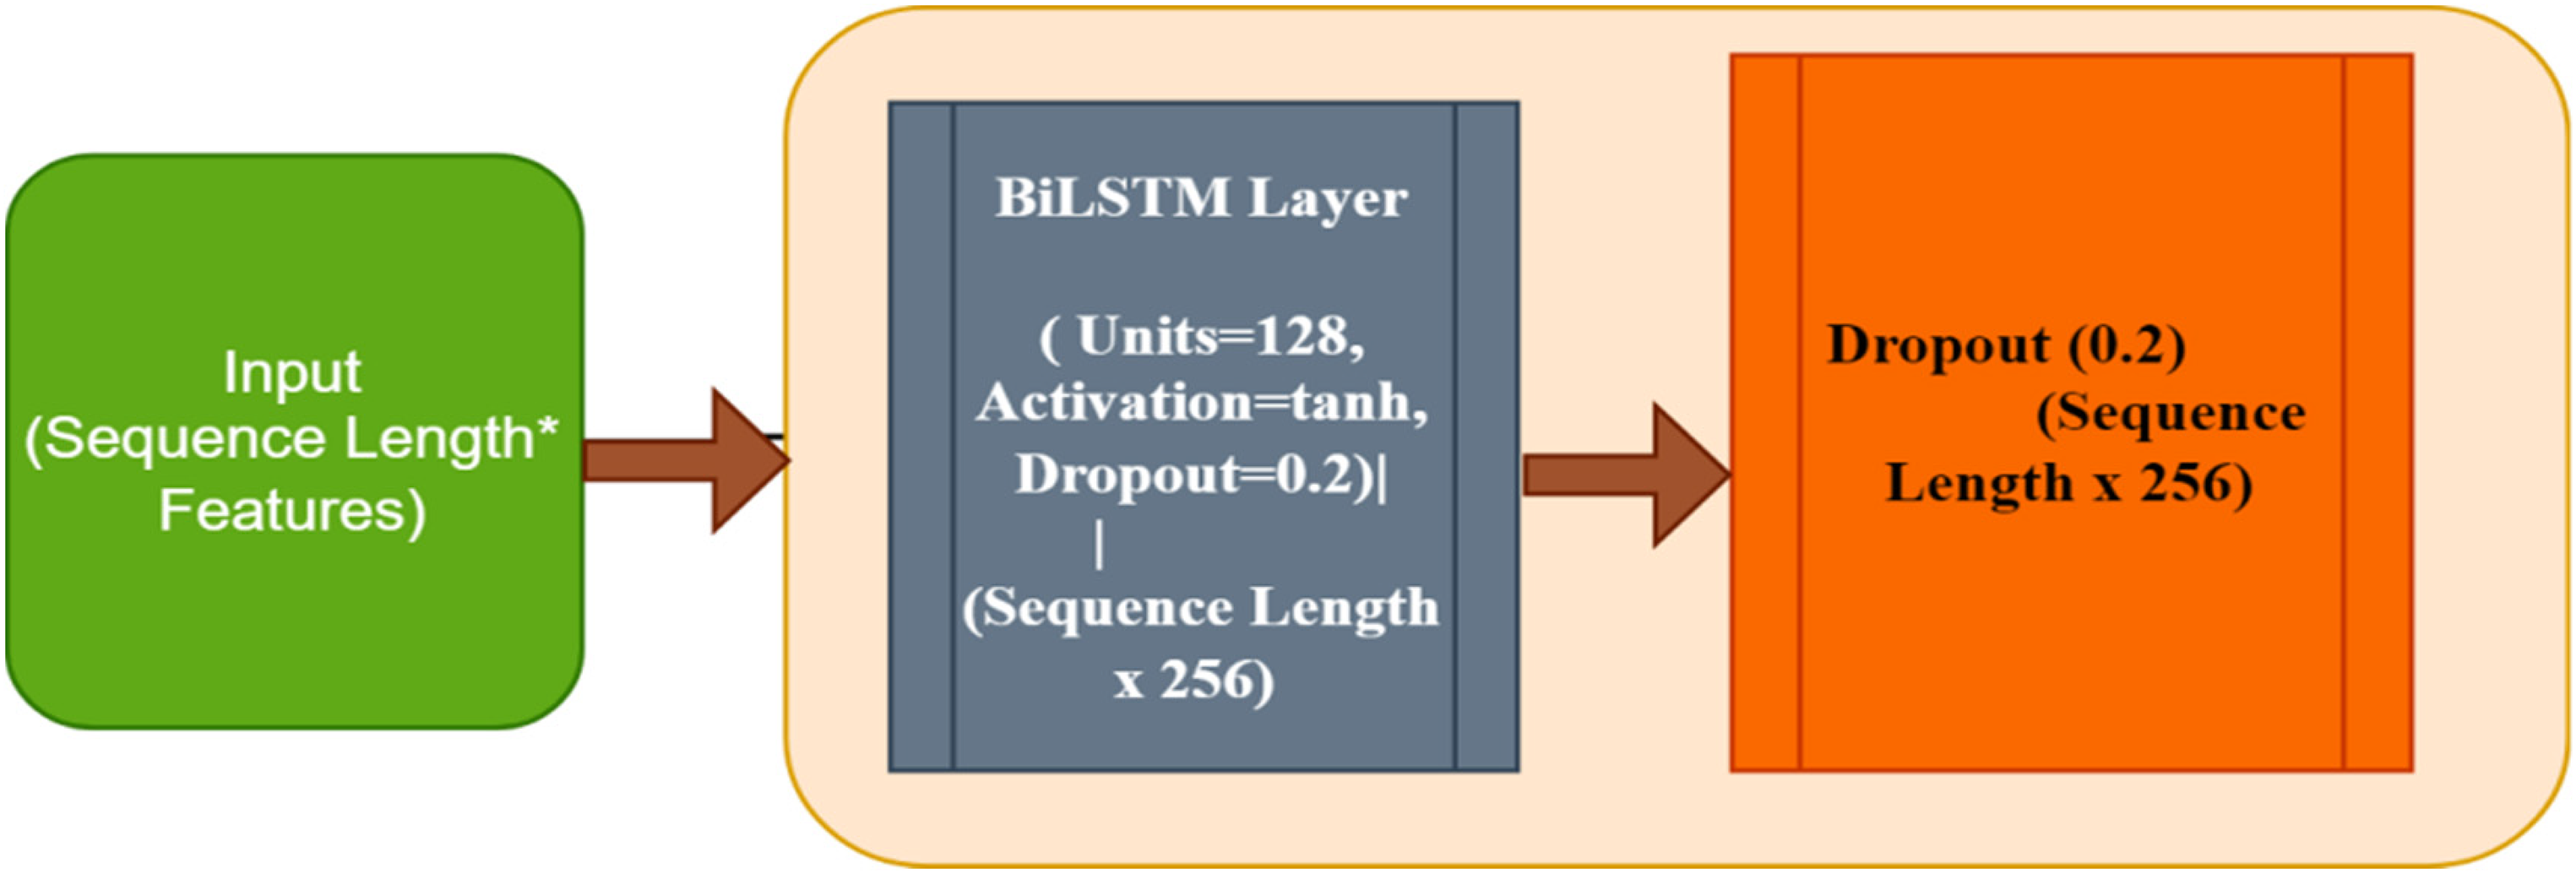
Architecture of BiLSTM model.
At each time step, the outputs of both LSTM units are combined, allowing the network to incorporate information from both previous and upcoming contexts. A Bi-LSTM includes the following layers (Ünal et al., 2021):
Input Layer: The input data consists of preprocessed features, which can be obtained through the CNN component or from the source during the preprocessing stage. Embedding Layer: When the input features contain categorized variables, these are converted through dense vectors applying an embedding layer. Forward LSTM: The forward LSTM model sequentially analyses the input sequence starting from the initial time step and ending at the final time step. It records the chronological order of events from the past up to the present. Backward LSTM: The reverse LSTM operates by processing the input sequence in reverse order, starting from the final step and moving towards the first. It records data regarding the chronological order from the future to past times. Concatenation Layer: At each time step, the results from the forward and backward LSTM models are combined by concatenation. This joining together takes the data from both directions and makes it easier to understand the sequence context. Dense/Fully Connected Layer: The combined results are transmitted through some completely interconnected (dense) layers. These layers acquire more complex representations and generate ultimate predictions. Output Layer: Finally, the predictions for the Stability are generated by the final layer. A typical example of this is a single neuron with a linear activation function used for regression analysis.
Optimization based on MPSO
Multi-objective Particle Swarm Optimization is an advanced optimization technique inspired by the social behaviour of birds flocking or fish schooling. It is particularly effective for solving complex optimization problems with multiple conflicting objectives. In the context of the ‘Smart Grid Stability Prediction Model using Two-way Attention Based Hybrid Deep Learning (CNN and BiLSTM), t-NN Pre-processing and Multi-objective PSO’, MPSO is used to optimize various parameters and hyperparameters of the model to improve its prediction accuracy and efficiency (Ünal et al., 2021).
In MPSO, the primary objective is to identify the best trade-offs between multiple objectives. This frequently involves optimizing conflicting criteria, such as minimizing prediction error while maximizing computational efficiency. The MPSO algorithm was developed to accomplish this. Please find below a comprehensive explanation of how the MPSO operates:
Initialization: It mainly includes the initialization of populations and important objective functions.
- Particles and Swarms: It is the responsibility of MPSO to initiate the formation of a swarm of particles, each of which stands for a possible solution to the optimization problem. There is a position vector for each particle in the solution space and a vector of velocity that directs the particle's movement. - Objective Functions: To optimize the objective functions, it is necessary to define them. In the context of Stability prediction, these may include minimizing MSE, reducing computation time and optimizing resource distribution. Evaluation: This phase mainly includes fitness calculations. Assess the suitability of each particle by considering the specified objective functions. The fitness of each particle is calculated based on its ability to fulfil its goals. Multi-objective fitness entails the computation of a collection of Pareto optimal outcomes instead of a solitary optimal result. Update the Velocity and Positions: The phase includes updating the velocity value position.
- Updation of Velocity: The velocity is updated using three main components, that is, inertia, Cognitive and Social. It is calculated by equation (2): - Updation of Positions: Equation (3) can determine a position update: Update the Best fits (Personal and Global): Every particle maintains a record of the best position it has encountered, determined by its fitness value, to establish its personal best. The global best position is the most optimal position discovered by any particle within the swarm. The update occurs when a particle discovers a solution superior to the current global best.
where w represents initial weight,


Two-way attention mechanism
The proposed hybrid model incorporates a dual attention method, also called a two-way attention method, to improve its predictive abilities. This method enables the model to concentrate on pertinent segments of the input pattern from the forward and the backward direction, resulting in a more holistic data comprehension. This is a comprehensive explanation of the function and operation of the bidirectional attention process in the hybrid model as presented by equation (4):
Dataset
This research utilizes the Electrical Grid Stability Simulated Dataset, which is a publicly accessible dataset from the University of California (UCI) Machine Learning Repository. This dataset was designed to facilitate research and analysis in the field of electrical grid stability, making it more convenient for users. The dataset titled ‘Electrical Grid Stability Simulated Dataset’ includes synthetic data that mimics various crucial factors impacting the stability of an electrical grid.
The dataset displays information on frequency, voltage, current and power flow. To comprehend and forecast the stability and performance of electrical grids, one must consider these variables. The dataset is generated using sophisticated mathematical models and simulation techniques to accurately replicate grid conditions in the real world. This dataset offers a robust platform for the development and evaluation of stability prediction models, encompassing a diverse set of scenarios and operating states. This synthetic method enables the dataset to accurately capture the complexity and variability found in real electrical grids. As a result, it becomes a valuable resource for researchers and practitioners in the field.
Data preprocessing
The initial data preprocessing stage involves gathering pertinent historical energy usage data and corresponding characteristics. The data is easily obtained from smart meters, weather observatories and other pertinent sources (Jiang et al., 2021). The characteristic attributes comprise:
Historical data on the amount of energy consumed, measured in kilowatt-hours (kWh) Weather data (including the humidity, temperature and speed of the wind) Temporal attributes (such as hour of the day, day of the week and month)
Data cleaning
Data cleaning is the process of eliminating or rectifying inaccurate or incomplete data to ensure the integrity of the dataset. This step encompasses the following:
Dealing with Missing Values: The t-NN algorithm fills in missing values in the dataset. This entails identifying the t closest neighbours for every missing value using Euclidean distance and substituting the missing value with the mean of these neighbours. Outlier identification and elimination: Outliers can have a substantial impact on the performance of a model. Methods such as Z-score or IQR (interquartile range) are employed to detect and eliminate outliers from the dataset.
Feature engineering
It entails creating novel features or modifying existing ones to enhance the predictive capability of the model (Lilhore et al., 2022b). This step encompasses the following:
Developing a time-dependent system Functionality: Create supplementary attributes such as weekday, time of day and special occasions to capture temporal trends in energy usage. Lag Features: Generate lagged features that capture previous values of the target variable, such as energy consumption in previous time intervals. These characteristics aid the model in comprehending temporal dependencies. Moving Statistics: Generate moving statistics, such as the mean and standard deviation, using various window sizes to capture patterns and seasonal variations in the data.
Normalization
Normalization is essential for ensuring that all features are standardized to a comparable scale, accelerating the deep learning model's convergence and enhancing its performance. This step encompasses the following:
Min-max scaling
Normalize the features to a predetermined range, typically [0, 1]. The Equation for Min-Max scaling consists of equation (5):
Standardization
Standardize the characteristics with a mean of Zero and a standard deviation of one. Equation (6) presents the formula for standardization. Here, 
tNN-Preprocessing
The t-NN preliminary processing phase improves the data quality by filling in the missing values and reducing noise. The procedure has the following components.
Euclidean distance calculation
Determine the Euclidean distance among every statistic and its closest neighbours.
Choice of neighbours
Pick the t closest neighbours for each data point.
Imputation along with smoothing
If a value is missing, it should be filled in by averaging the results obtained from t-NN. To eliminate noise in the data, replace each value with the mean of its t nearest neighbours.
Splitting the dataset
Division of a data set among training, validation and testing sets serves as crucial for assessing the performance of the model and preventing overfitting from occurring; this step encompasses the following:
Training data sample
Utilized for model training. For this study, we use 80% of the data available as the training set.
Testing data sample
Utilized for model testing. We are utilizing 10% of the data available for this study as the testing set.
Validation data samples
Utilized for model validation. This study uses 10% of the data as the validation set.
Data reshaping/transformation
Data transformation refers to the process of restructuring the data in a manner that is appropriate for feeding the results into the model used for deep learning (AlHaddad et al., 2023, He et al., 2023, Khan et al., 2023, Kim and Kim, 2023, Safari et al., 2023, So et al., 2023, Yi et al., 2023). This step encompasses the following:
Reshaping for CNN
When employing a CNN, it may be necessary to transform the data into a two-dimensional format, where the dimensions correspond to time steps and features.
Sequence generation for LSTM
In the case of LSTM networks, sequencing comprises input data in which each sequence indicates a specific time window of previous observations utilized to forecast future values (Bisen et al., 2023).
Key performance indicators
The following key performance indicators are used to measure the performance of proposed hybrid and existing deep learning models.
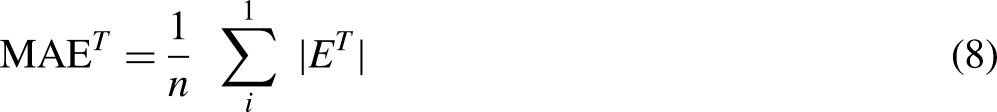
MAE
It can be measured by calculating the mean of absolute errors using prediction and actual errors as defined by equations (7) and (8). Here, 
MAPE
The term refers to calculating the average absolute error by dividing the total amount of all the absolute errors by the actual value as defined by equation (9):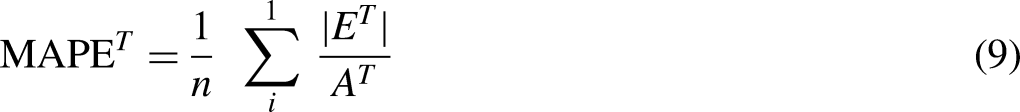
MSE
An MSE can be derived by using equation (10):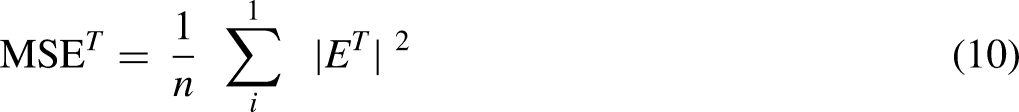
RMSE
An RMSE can be derived using equation (11):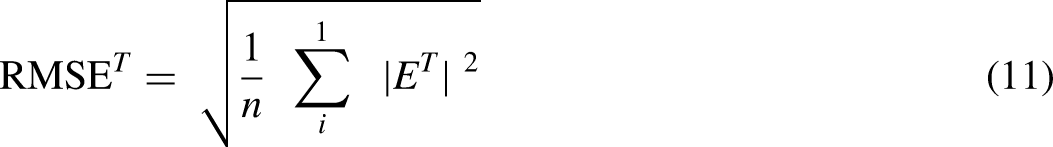
RRSE
The term ‘total squared error’ refers to the sum of the squared differences between actual and forecasted values. This calculation concerns the errors that occur when the forecasting is based on averaging absolutes. Equation (12) displays the formula for RRSE: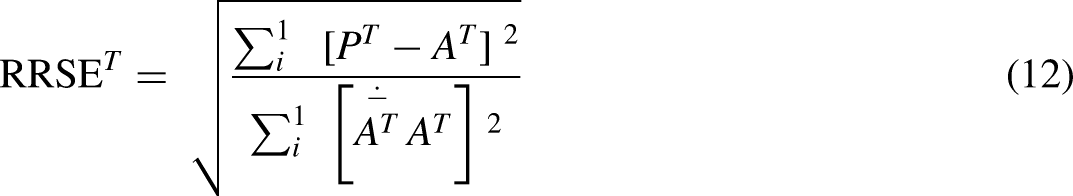
CV
Calculating the coefficient of variation (CV) involves determining the ratio between the standard deviations representing the predicted error with the median of the actual amount, as defined by equation (13):
Precision
A precision can be calculated by equation (14):
Accuracy
Accuracy can be determined by using equation (15):
Recall
Recall can be calculated by using equation (16):
F-Measure
F-Measure can be calculated by equation (17):
Simulation and experimental results
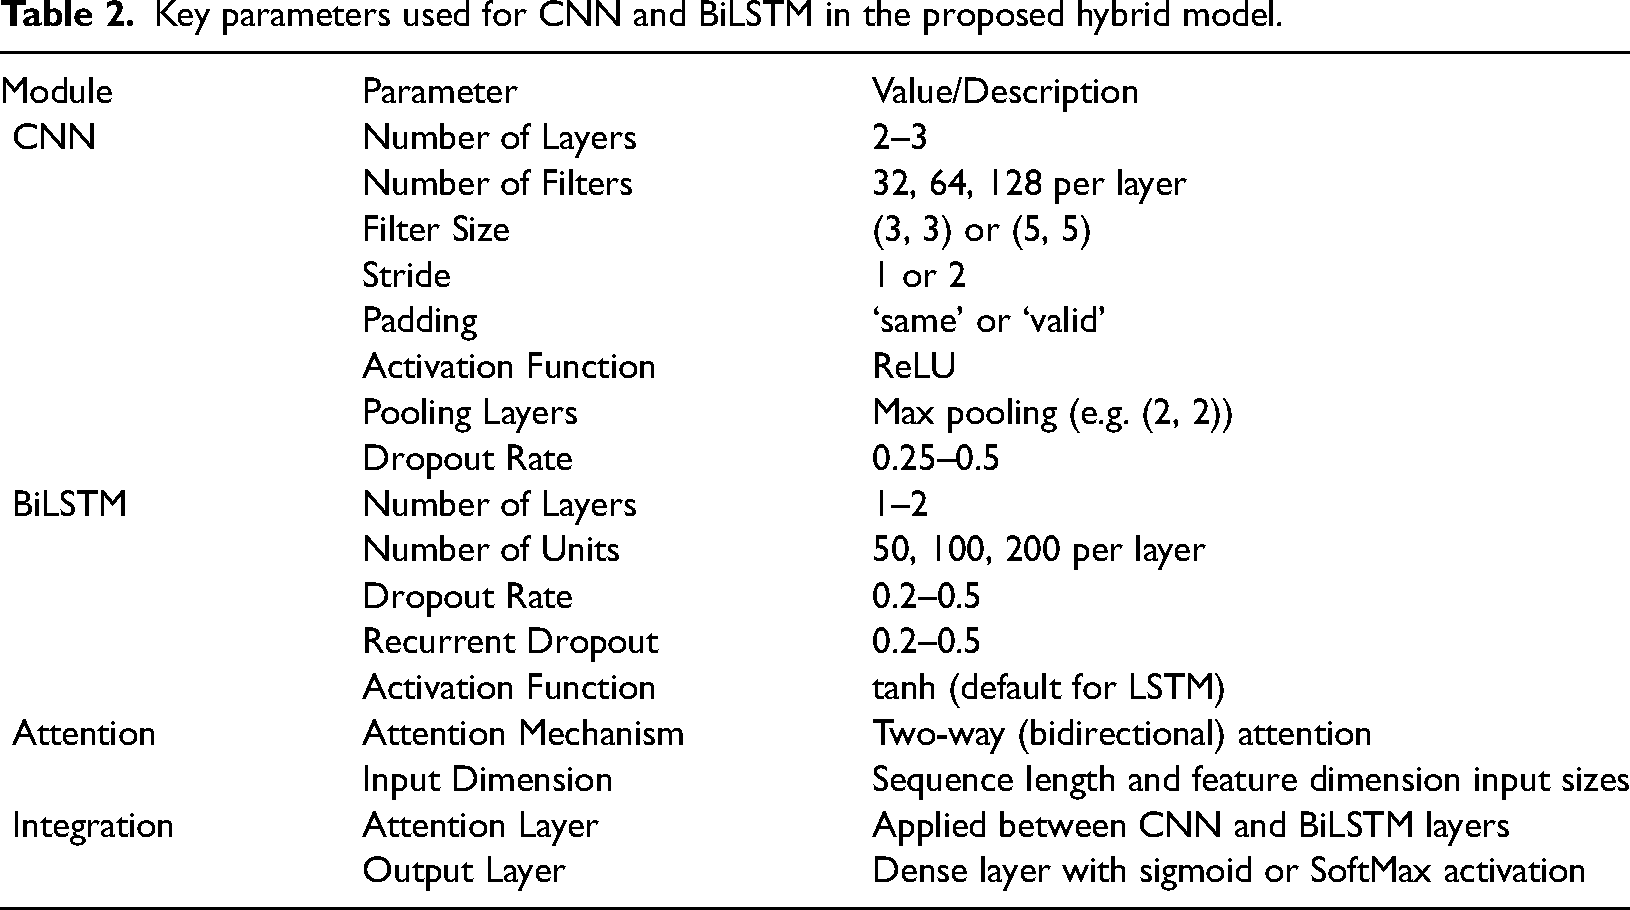
The proposed and existing models are implemented using the Python programming language. It is recommended to have a system that includes a minimum of an Intel Core i7 / AMD Ryzen 7 CPU, an NVIDIA GPU (such as GTX 1080 Ti or a higher model) with CUDA support, 16GB of RAM (32GB is recommended) and a 512GB SSD. The software configuration comprises Python 3.8 or a higher version, along with essential libraries such as NumPy, Pandas, Matplotlib, Seaborn and Scikit-learn installed using Anaconda. For the development of models, it is necessary to install deep learning frameworks such as TensorFlow and PyTorch (Lilhore et al., 2022a, Simaiya et al., 2021). Table 2 presents the proposed hybrid model's key parameters used for CNN and BiLSTM.
Key parameters used for CNN and BiLSTM in the proposed hybrid model.
The dataset was divided into training: 80, Testing: 10 and Validation: 10. Following results were calculated.
Testing and evolution results for common data length
The proposed model is trained on 80% of the training dataset. After training mode, we calculated the performance results for different error metrics for the testing dataset of 10% and 10% validation dataset with a common data length of 16 bits. Figures 4 and 5 present the simulation results for the testing and validation phase for the proposed and existing model.
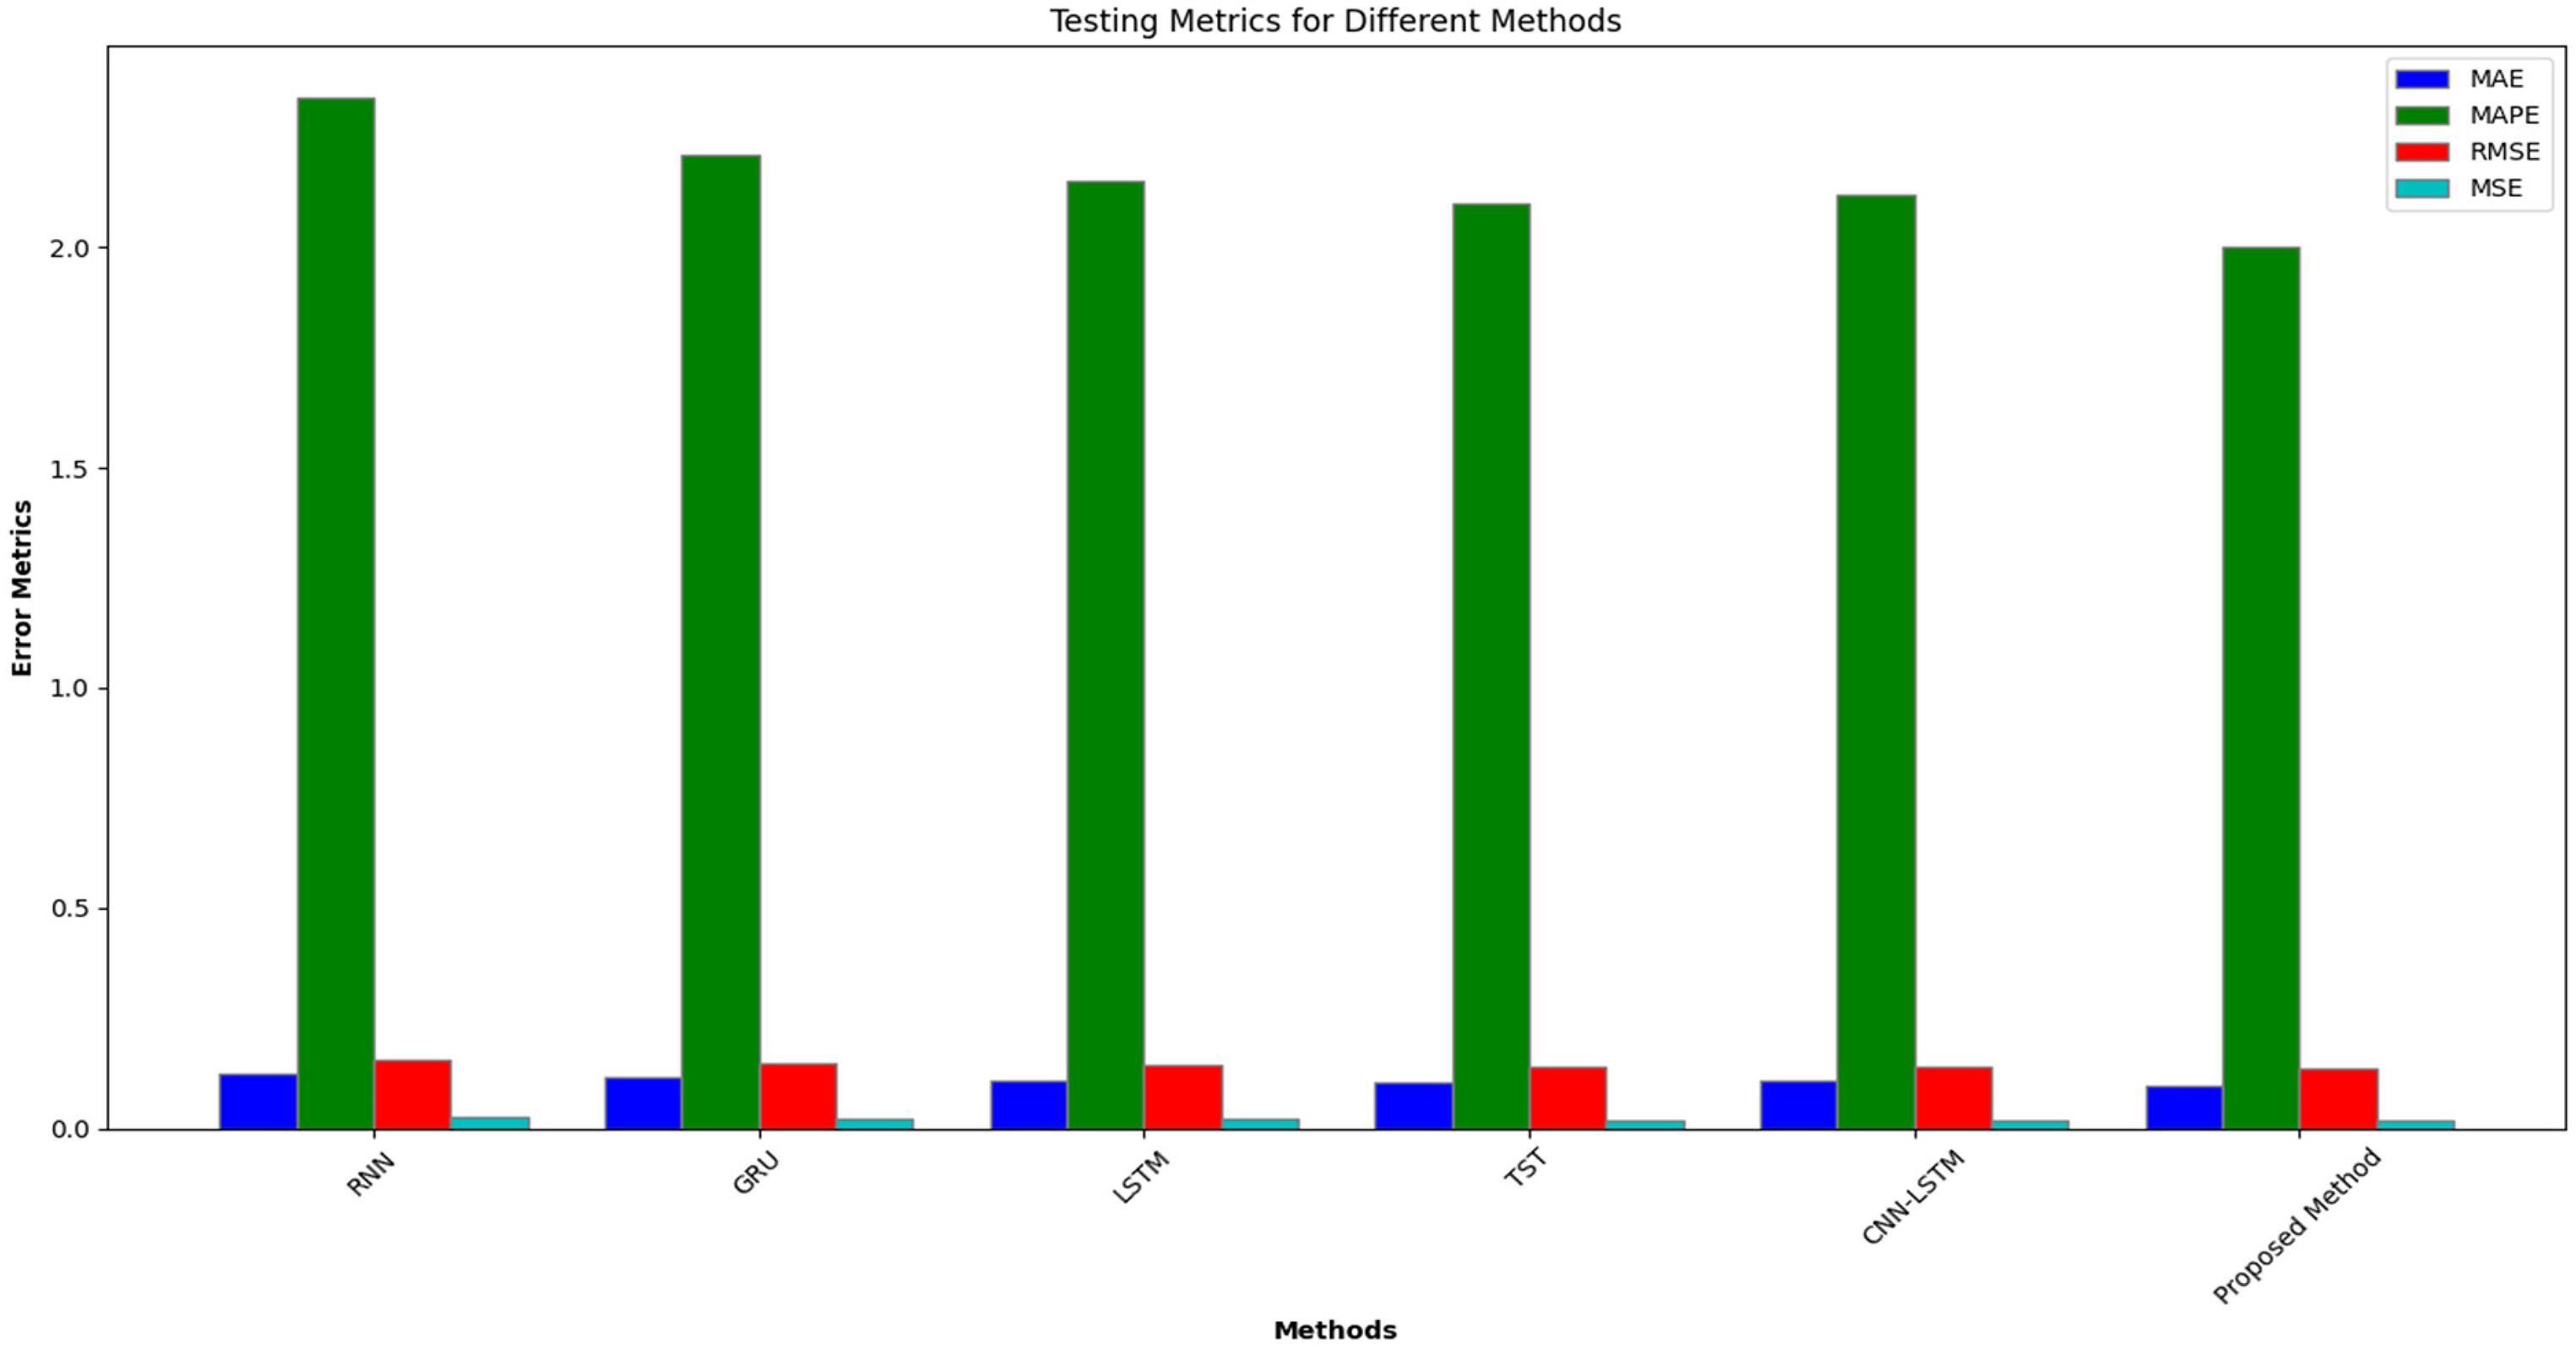
Error metrics results for existing and proposed methods during testing.
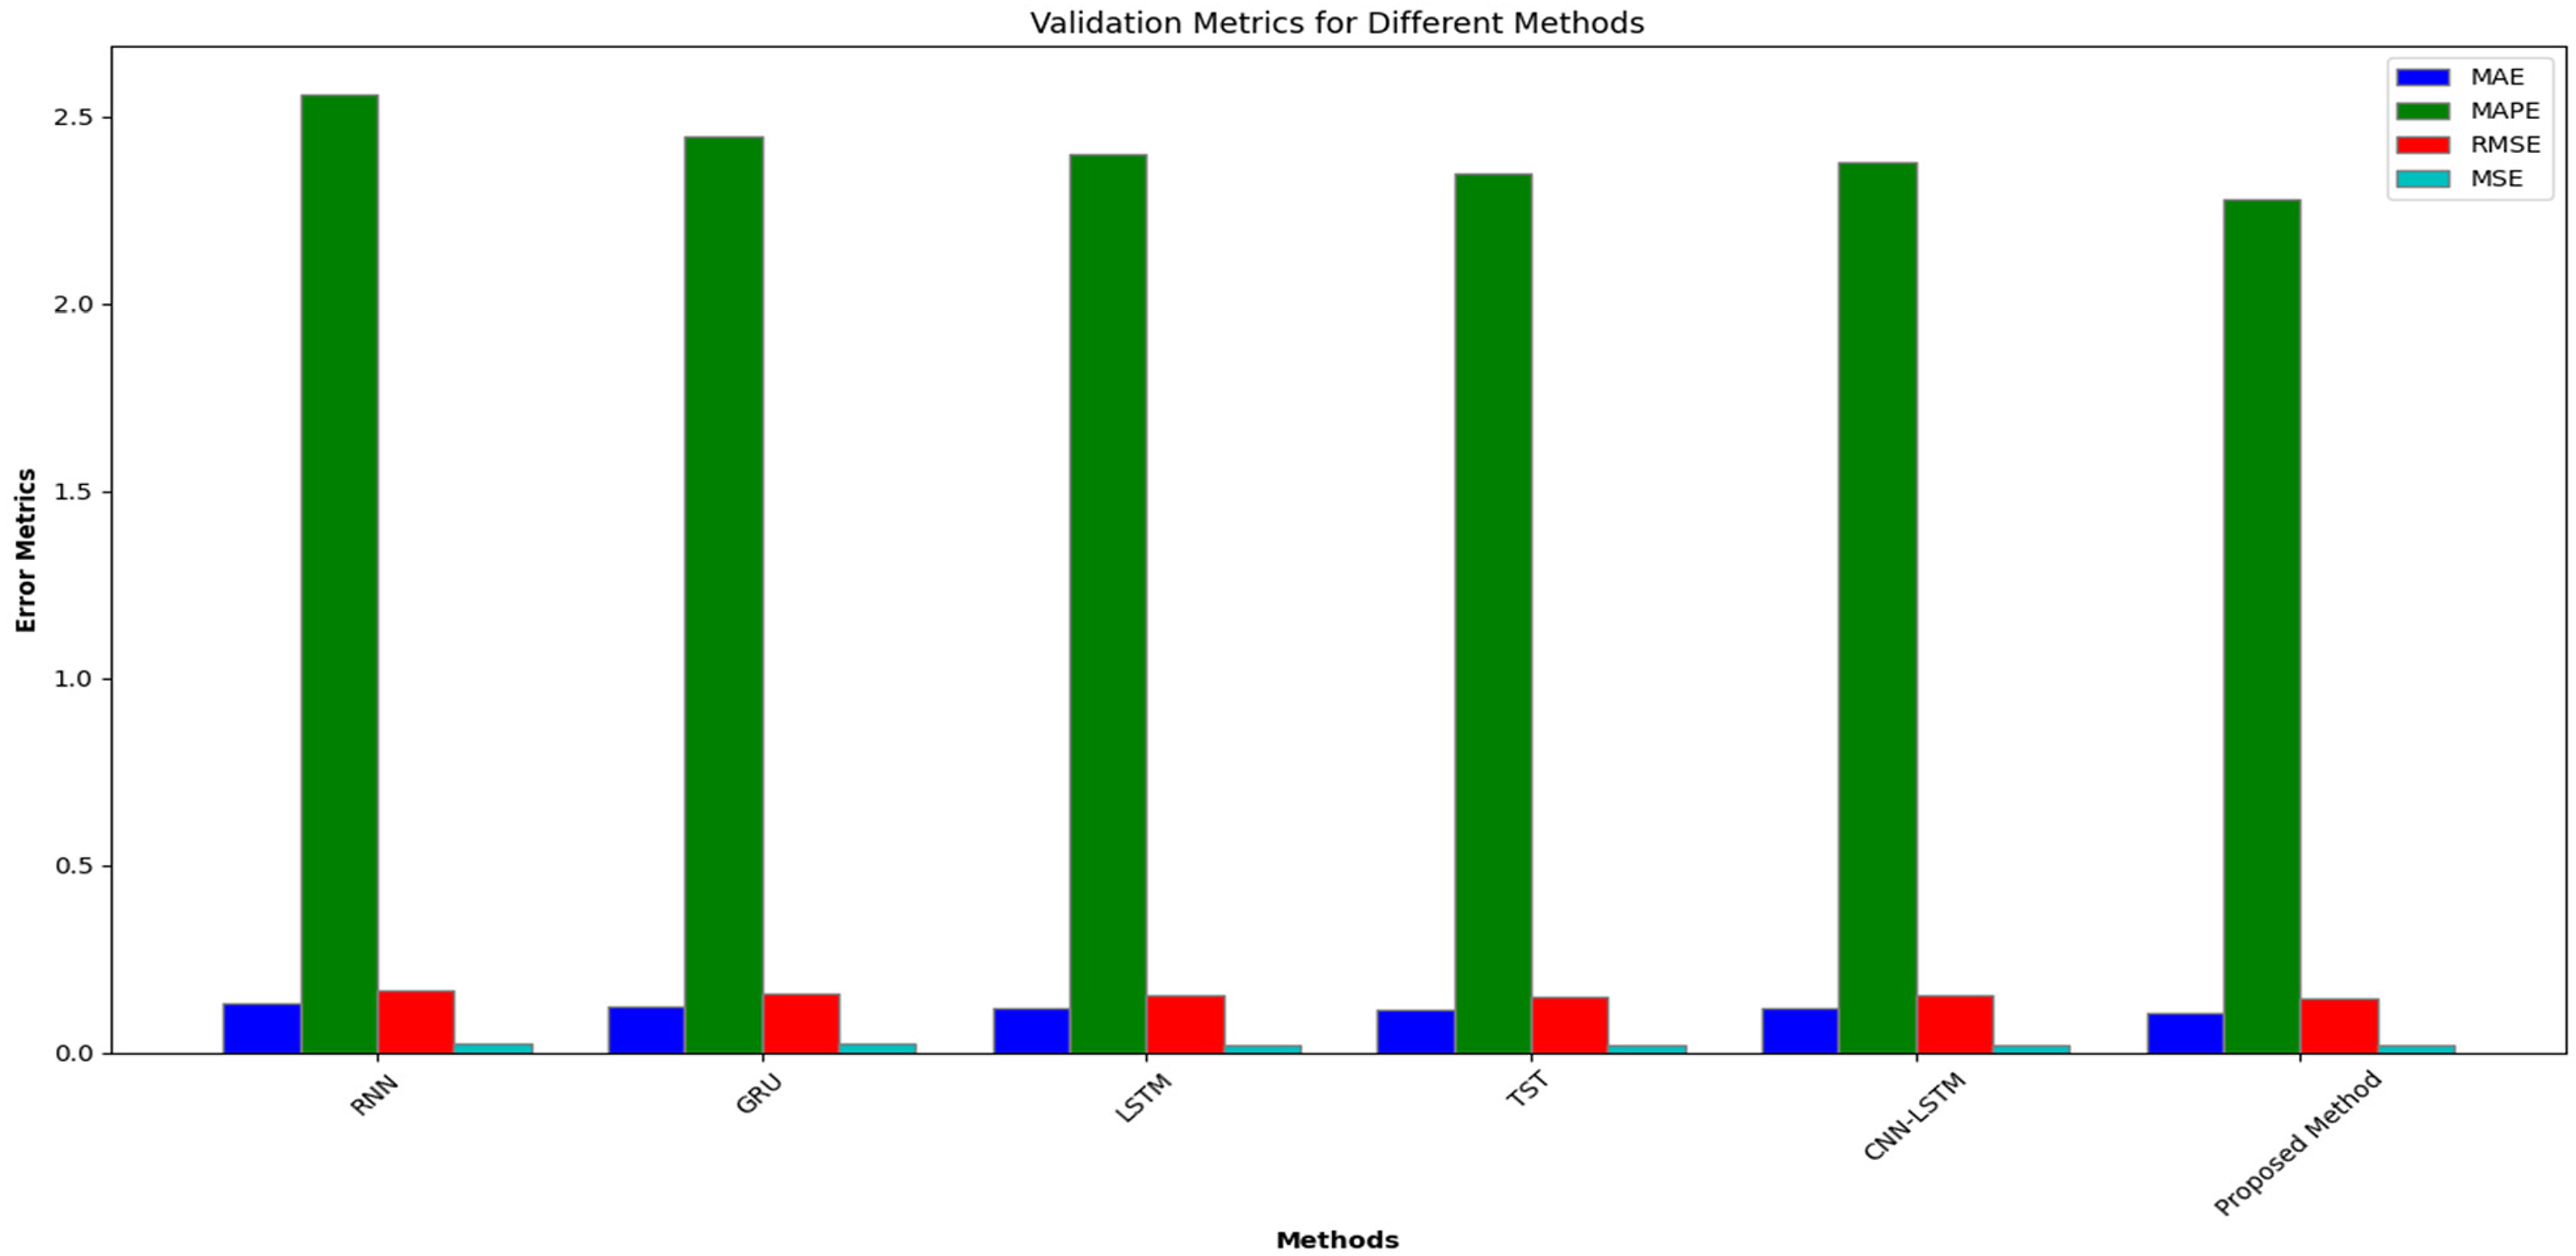
Error metrics results for existing and proposed methods during validation.
Table 3 presents a comparative analysis of Error Metrics results for Existing and Proposed Methods during Testing and Validation. The results in Table 3 demonstrate that the proposed method for energy consumption prediction significantly outperforms existing methods, including RNN, GRU, LSTM, TST and CNN-LSTM. The proposed method achieves the lowest error rates across all evaluated metrics: MAE (0.098 for testing and 0.108 for validation), MAPE (2.00% for testing and 2.28% for validation), RMSE (0.135 for testing and 0.145 for validation), MSE (0.0182 for testing and 0.0210 for validation), RRSE (0.117 for testing and 0.126 for validation) and CV (8.8%). This indicates that the proposed model provides more accurate and consistent predictions.
Error metrics results for existing and proposed methods during testing and validation.
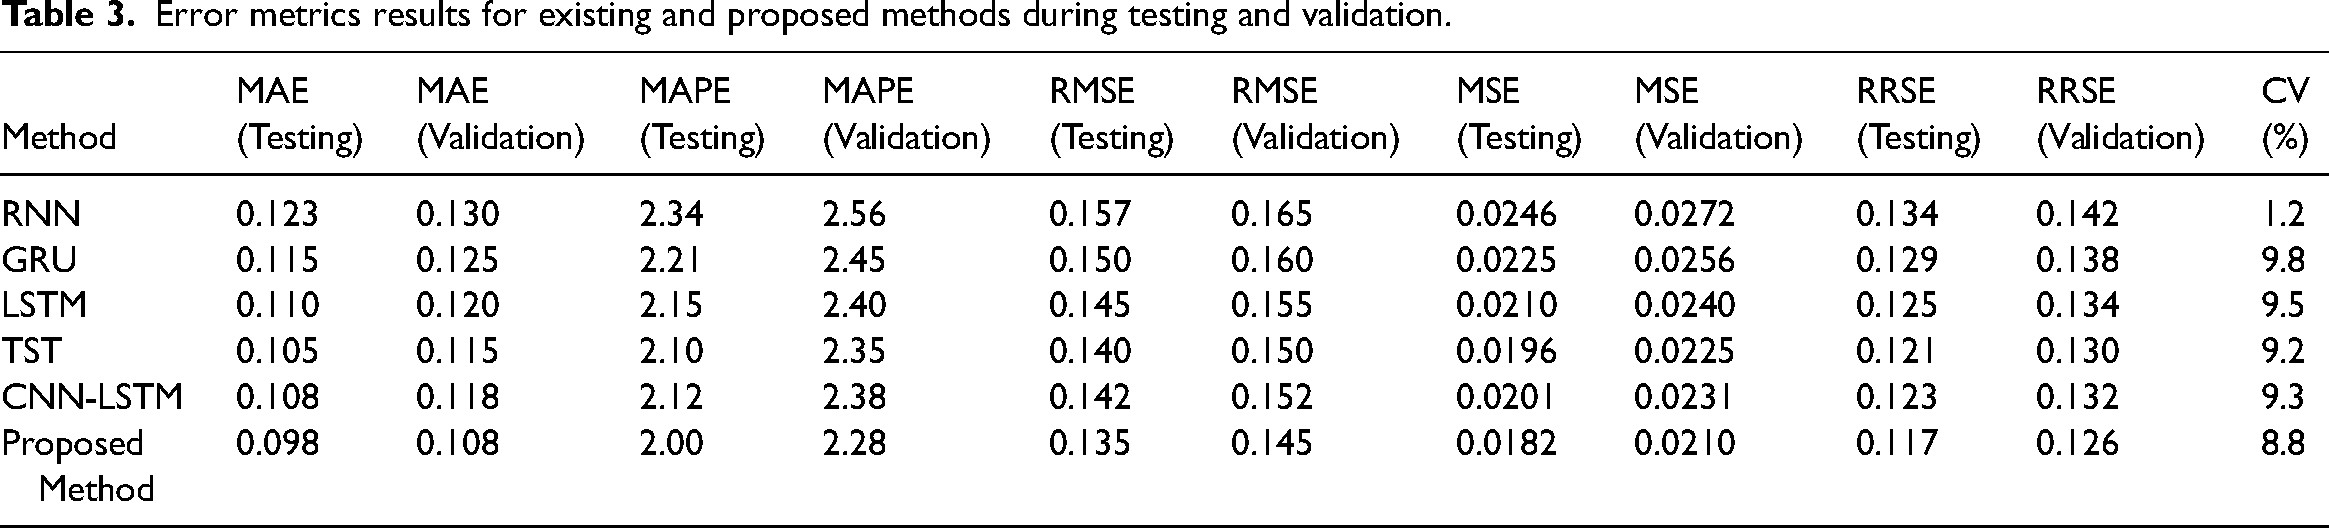
The superior performance is largely due to the two-way attention mechanism, which effectively focuses on relevant parts of the input sequence, and the hybrid architecture combining CNN for spatial feature extraction and BiLSTM for capturing temporal dependencies. Furthermore, the MPSO fine-tunes the model parameters, ensuring optimal performance. These elements collectively enhance the model's ability to capture complex patterns in the data, resulting in better prediction accuracy and reliability than existing methods, even with a common data length of 16 bits.
Results based on hyperparameters
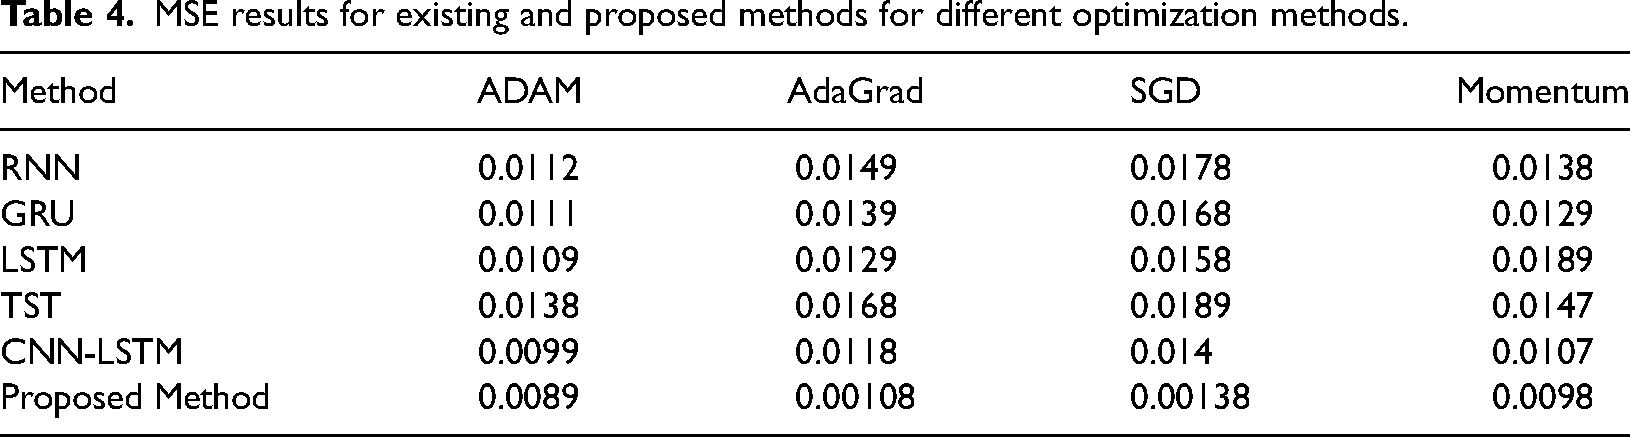
We have also calculated the MSE results using different optimizers, that is, Adam, AdaGrad, SGD and Momentum, for existing and proposed methods in the next simulation analysis. Table 3 and Figure 6 present MSE results for Existing and Proposed optimization methods.
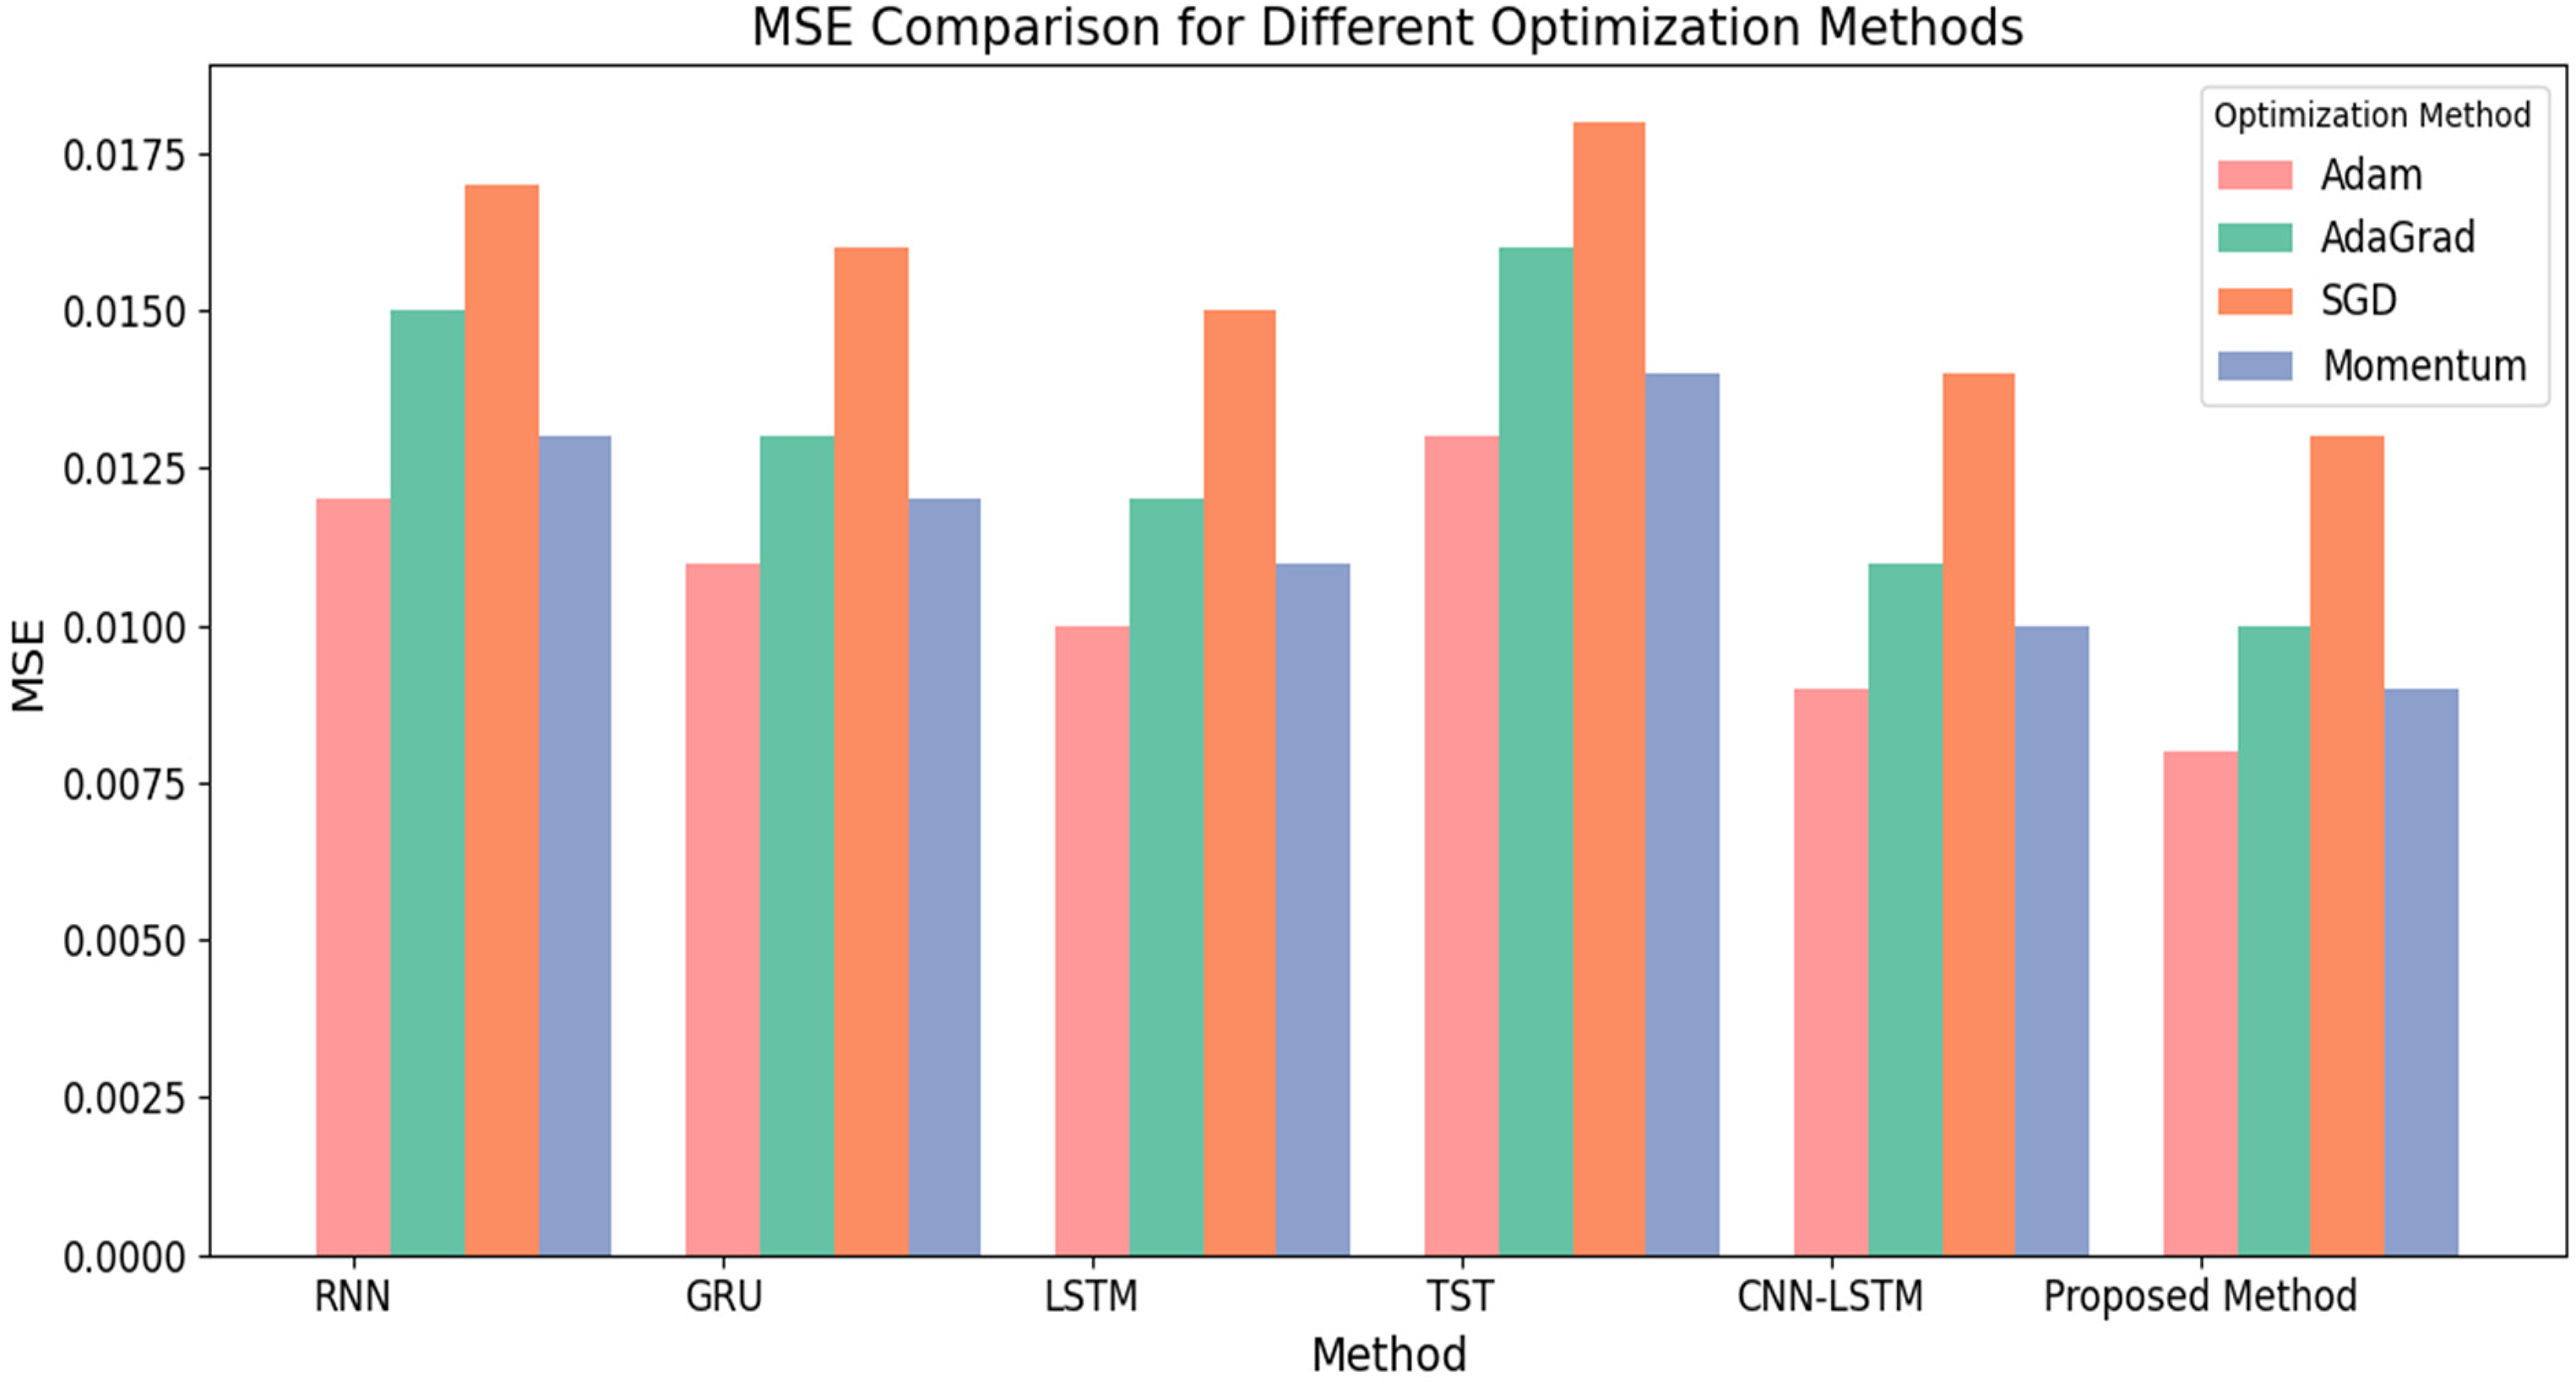
MSE results for existing and proposed methods for different optimization methods.
The data displayed in Table 4 demonstrates the Mean Squared Error for different optimization techniques (ADAM, AdaGrad, SGD, Momentum) applied to various models, such as RNN, GRU, LSTM, TST, CNN-LSTM and the proposed method. The proposed method consistently attains the lowest Mean Squared Error among all optimization techniques, showcasing its superior performance in predicting energy consumption. The proposed method achieves an MSE of 0.0089 with the ADAM optimizer, which is the lowest among all the methods. AdaGrad achieves a significantly lower MSE of 0.00108, in contrast to other methods with MSE values ranging from 0.0118 to 0.0168. The proposed SGD optimizer method finally, the MSE for the proposed method in terms of Momentum is 0.0098, surpassing the results of the other methods.
MSE results for existing and proposed methods for different optimization methods.
Results based on different learning rates
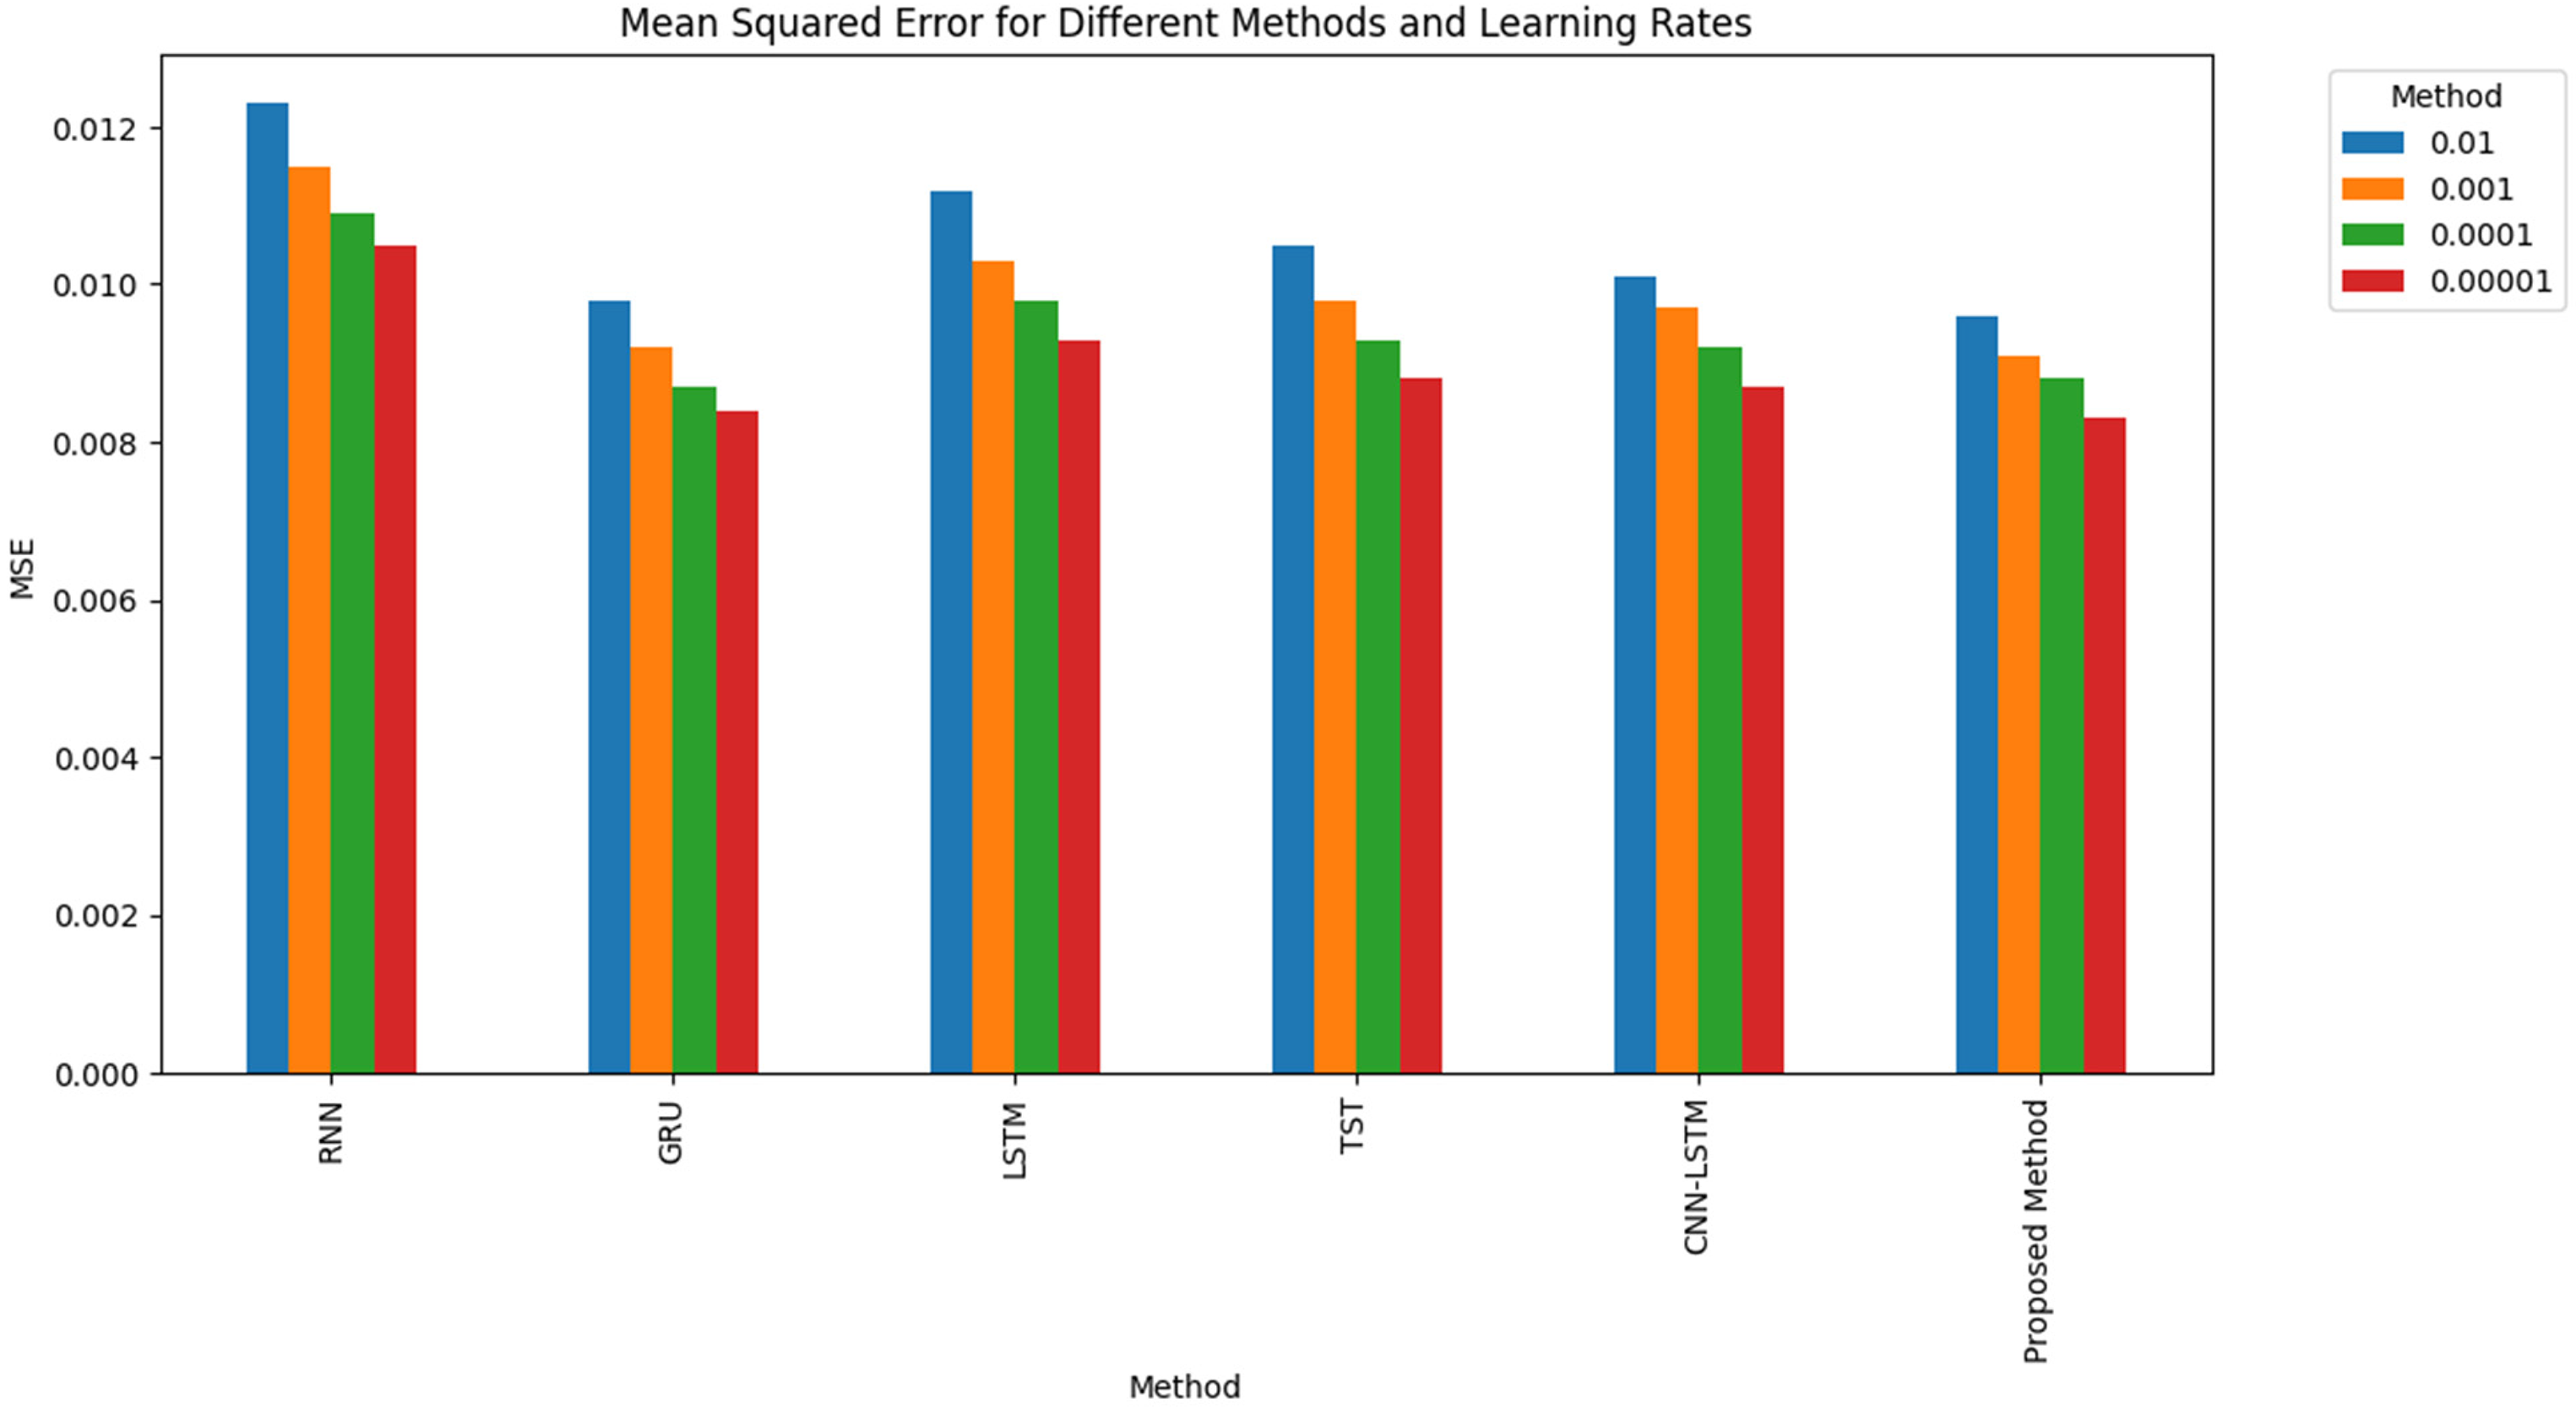
We have also calculated the MSE results using different learning rates, that is, 0.01, 0.001, 0.0001 and 0.0001, for existing and proposed methods in the next simulation analysis. Table 4 and Figure 7 present MSE results for Existing and Proposed Methods for different learning rates.
MSE results for existing and proposed methods for different learning rates.
Table 5 displays the MSE outcomes for different models, such as RNN, GRU, LSTM, TST, CNN-LSTM and the suggested approach. The models were assessed at different learning rates (0.01, 0.001, 0.0001 and 0.00001). The table displays the performance of each model at different learning rates, emphasizing the superiority of the proposed method compared to existing methods.
MSE results for existing and proposed methods for different learning rates.
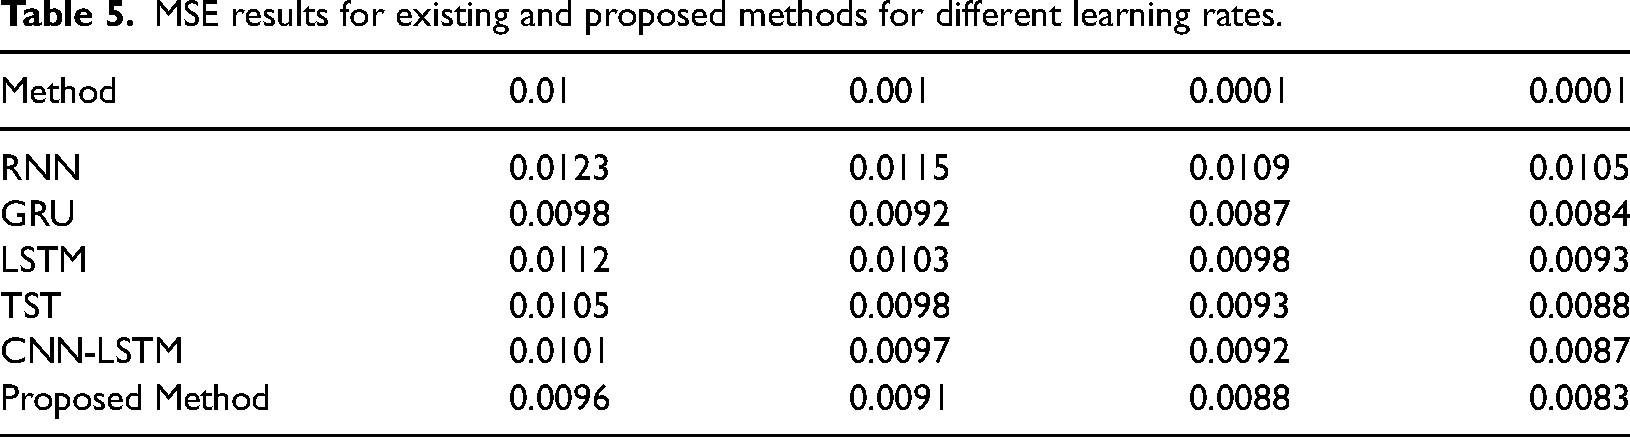
The proposed method generates the lowest MSE of 0.0096 across the various approaches when using a learning rate 0.01. The GRU model corresponds closely with an MSE of 0.0098. When the learning rate is reduced to 0.001, the proposed approach consistently outperforms any additional model with an MSE of 0.0091. When the learning rates are reduced to 0.0001 and 0.00001, the proposed method performs better than the existing methods, with MSE values of 0.0088 and 0.0083, respectively. Regardless of the learning rates used, the consistently lower MSE values observed with the proposed method indicate its high efficacy in minimizing prediction errors.
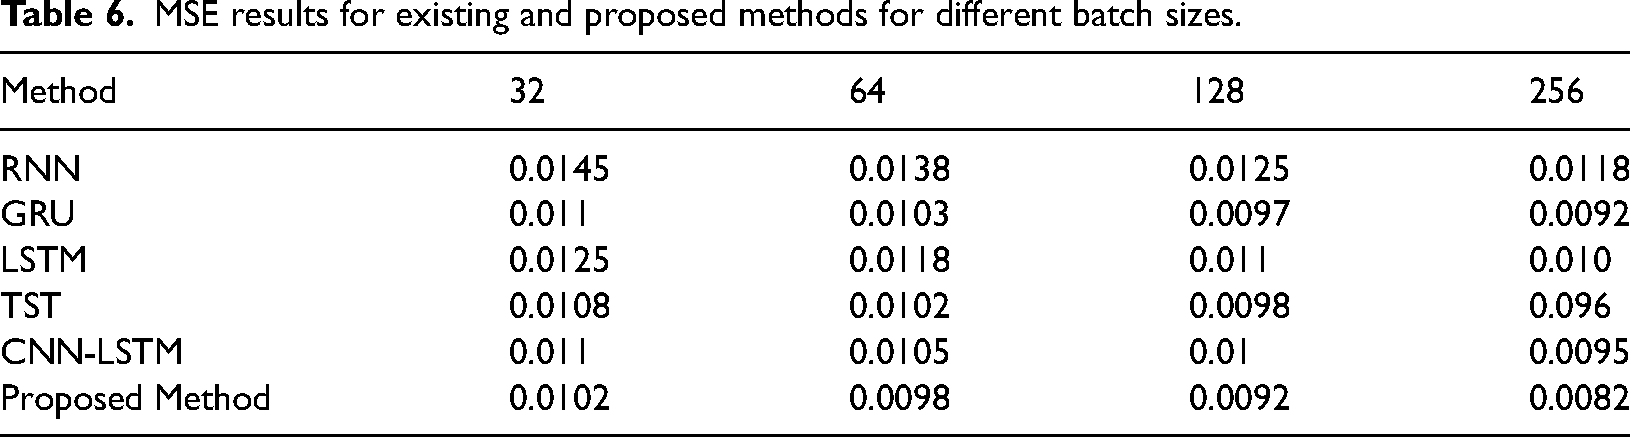
Results based on different batch sizes
We have also calculated the MSE results using different batch sizes, that is, 32-bit, 64-bit, 128-bit and 256-bit, for the existing and proposed method in the next simulation analysis. Table 6 and Figure 8 present MSE results for Existing and Proposed Methods for different batch sizes.
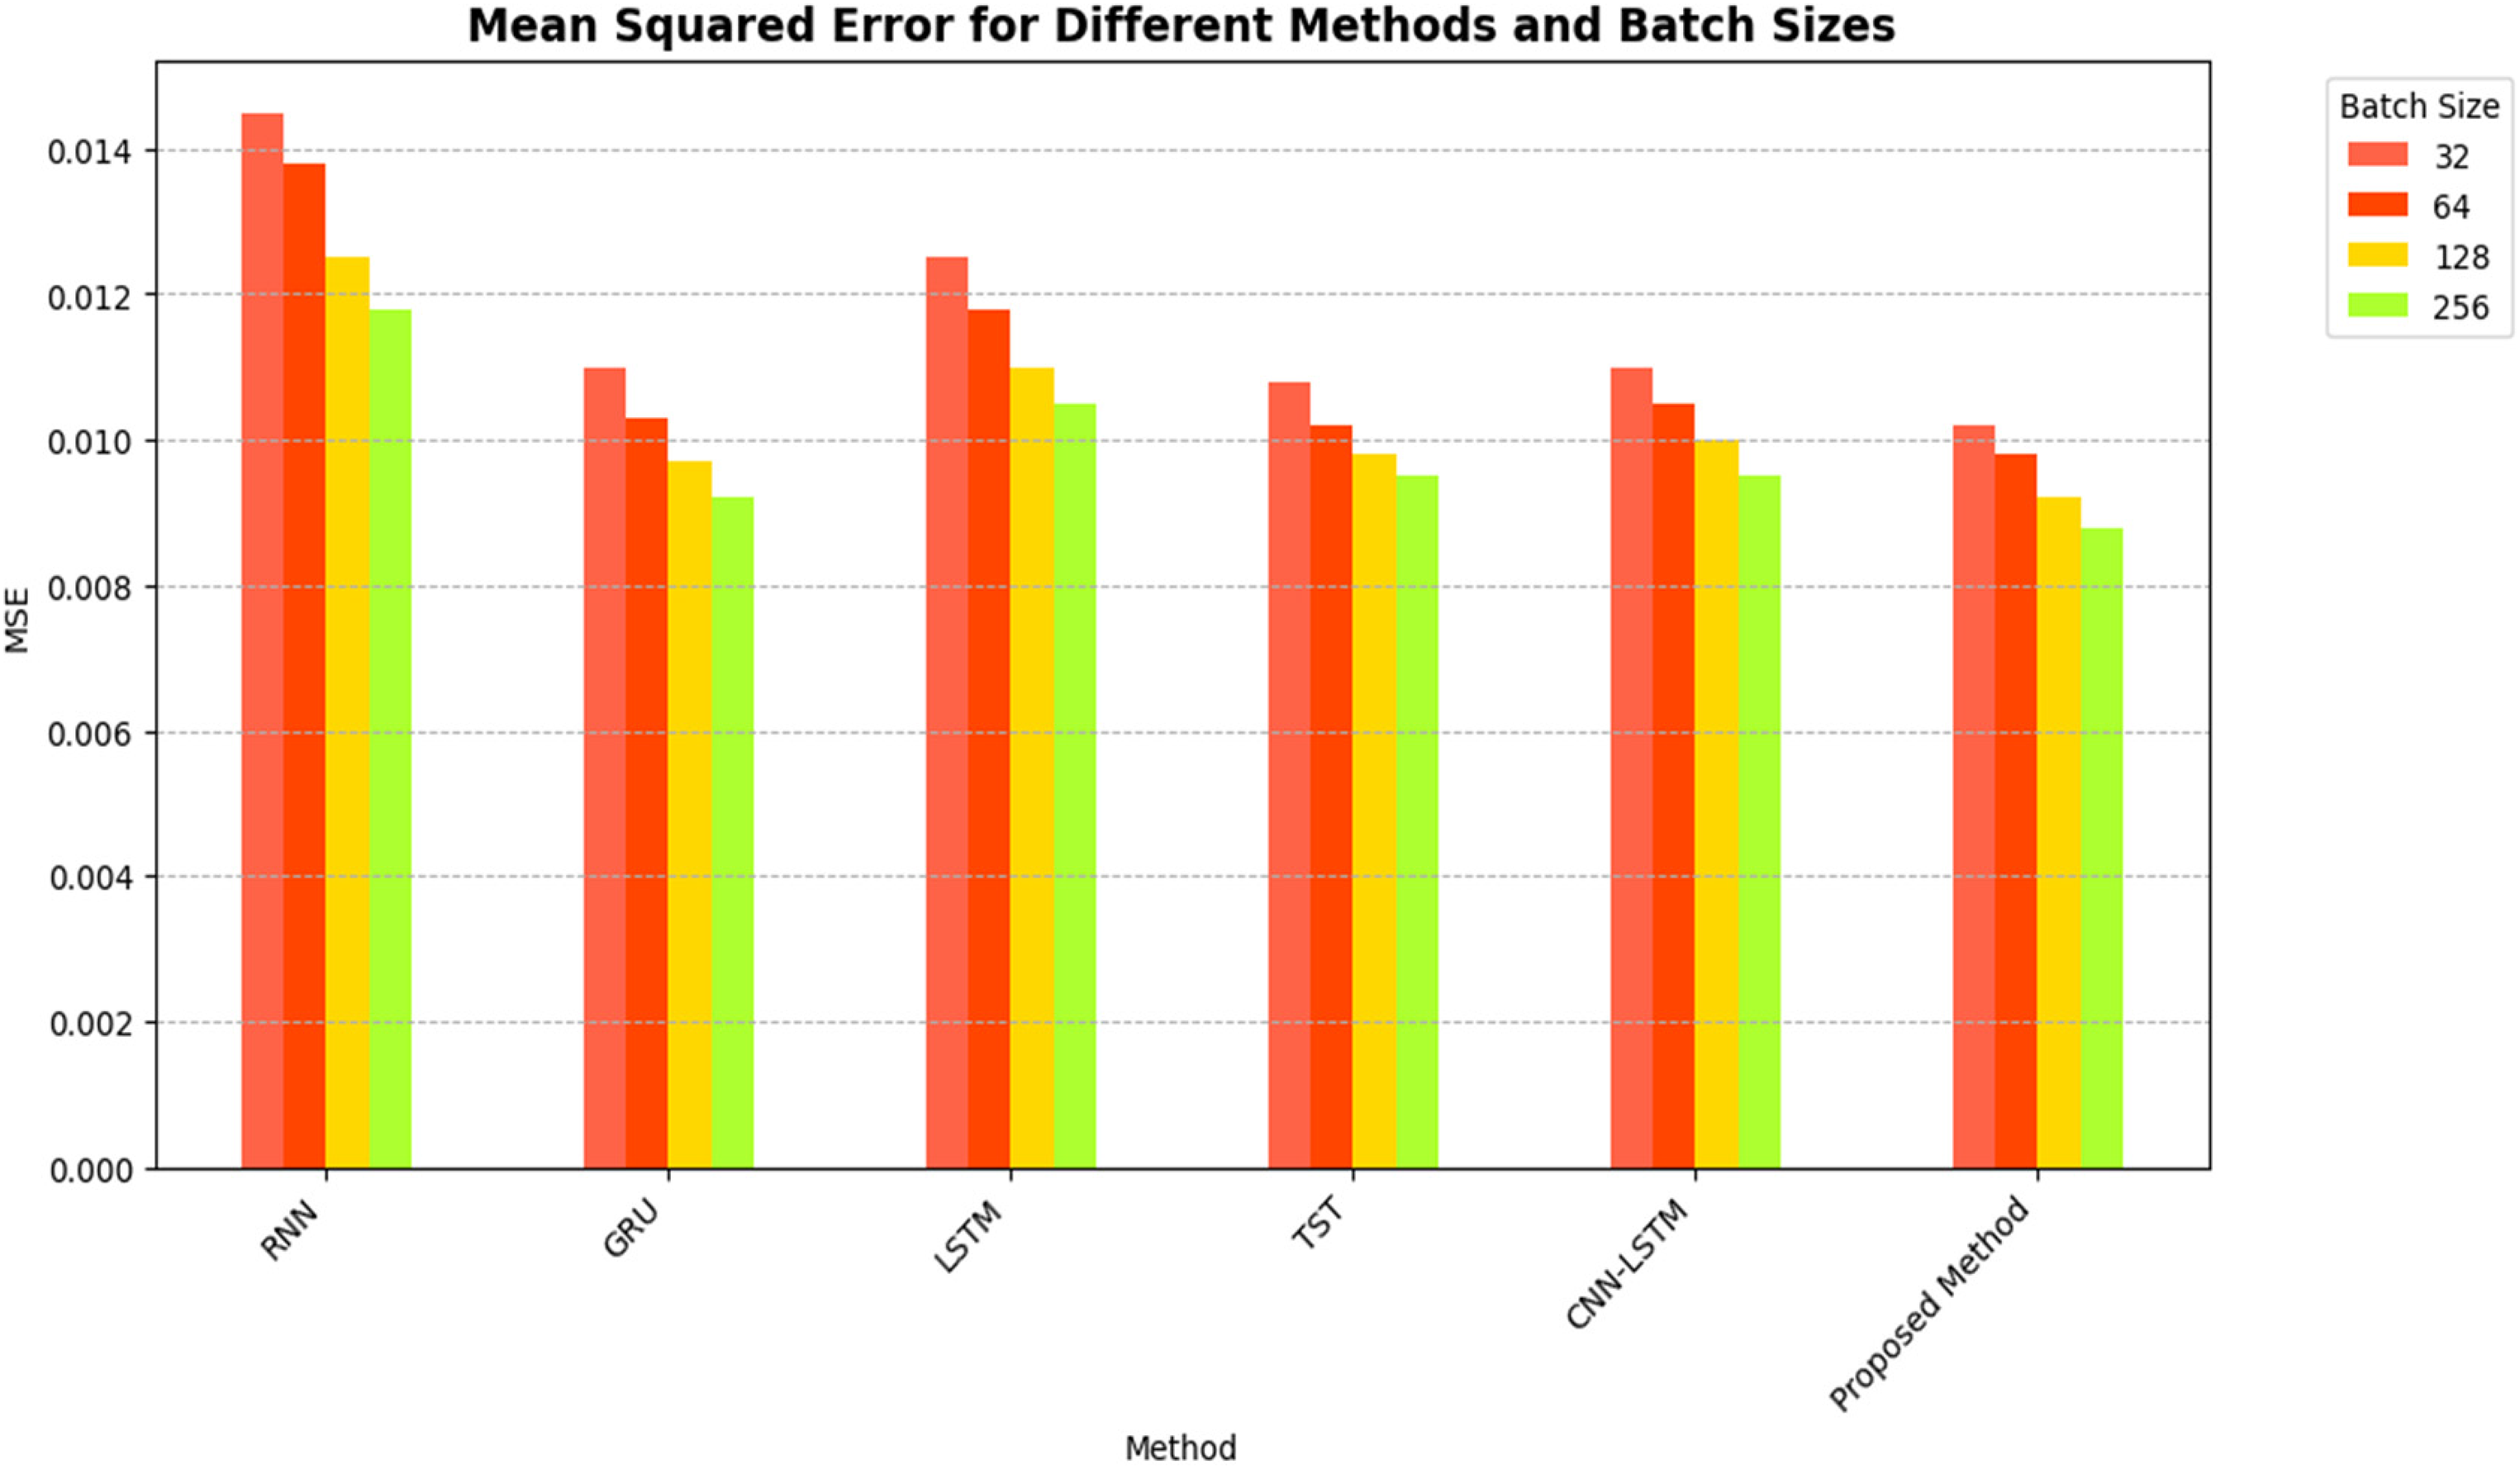
MSE results for existing and proposed methods for different batch sizes.
MSE results for existing and proposed methods for different batch sizes.
Results for energy consumption prediction
Results are calculated for energy consumption for existing and proposed hybrid models. It has an important role in Smart Grid Stability. Figure 9 and Table 7 present MSE results for Existing and Proposed Methods for energy consumption.
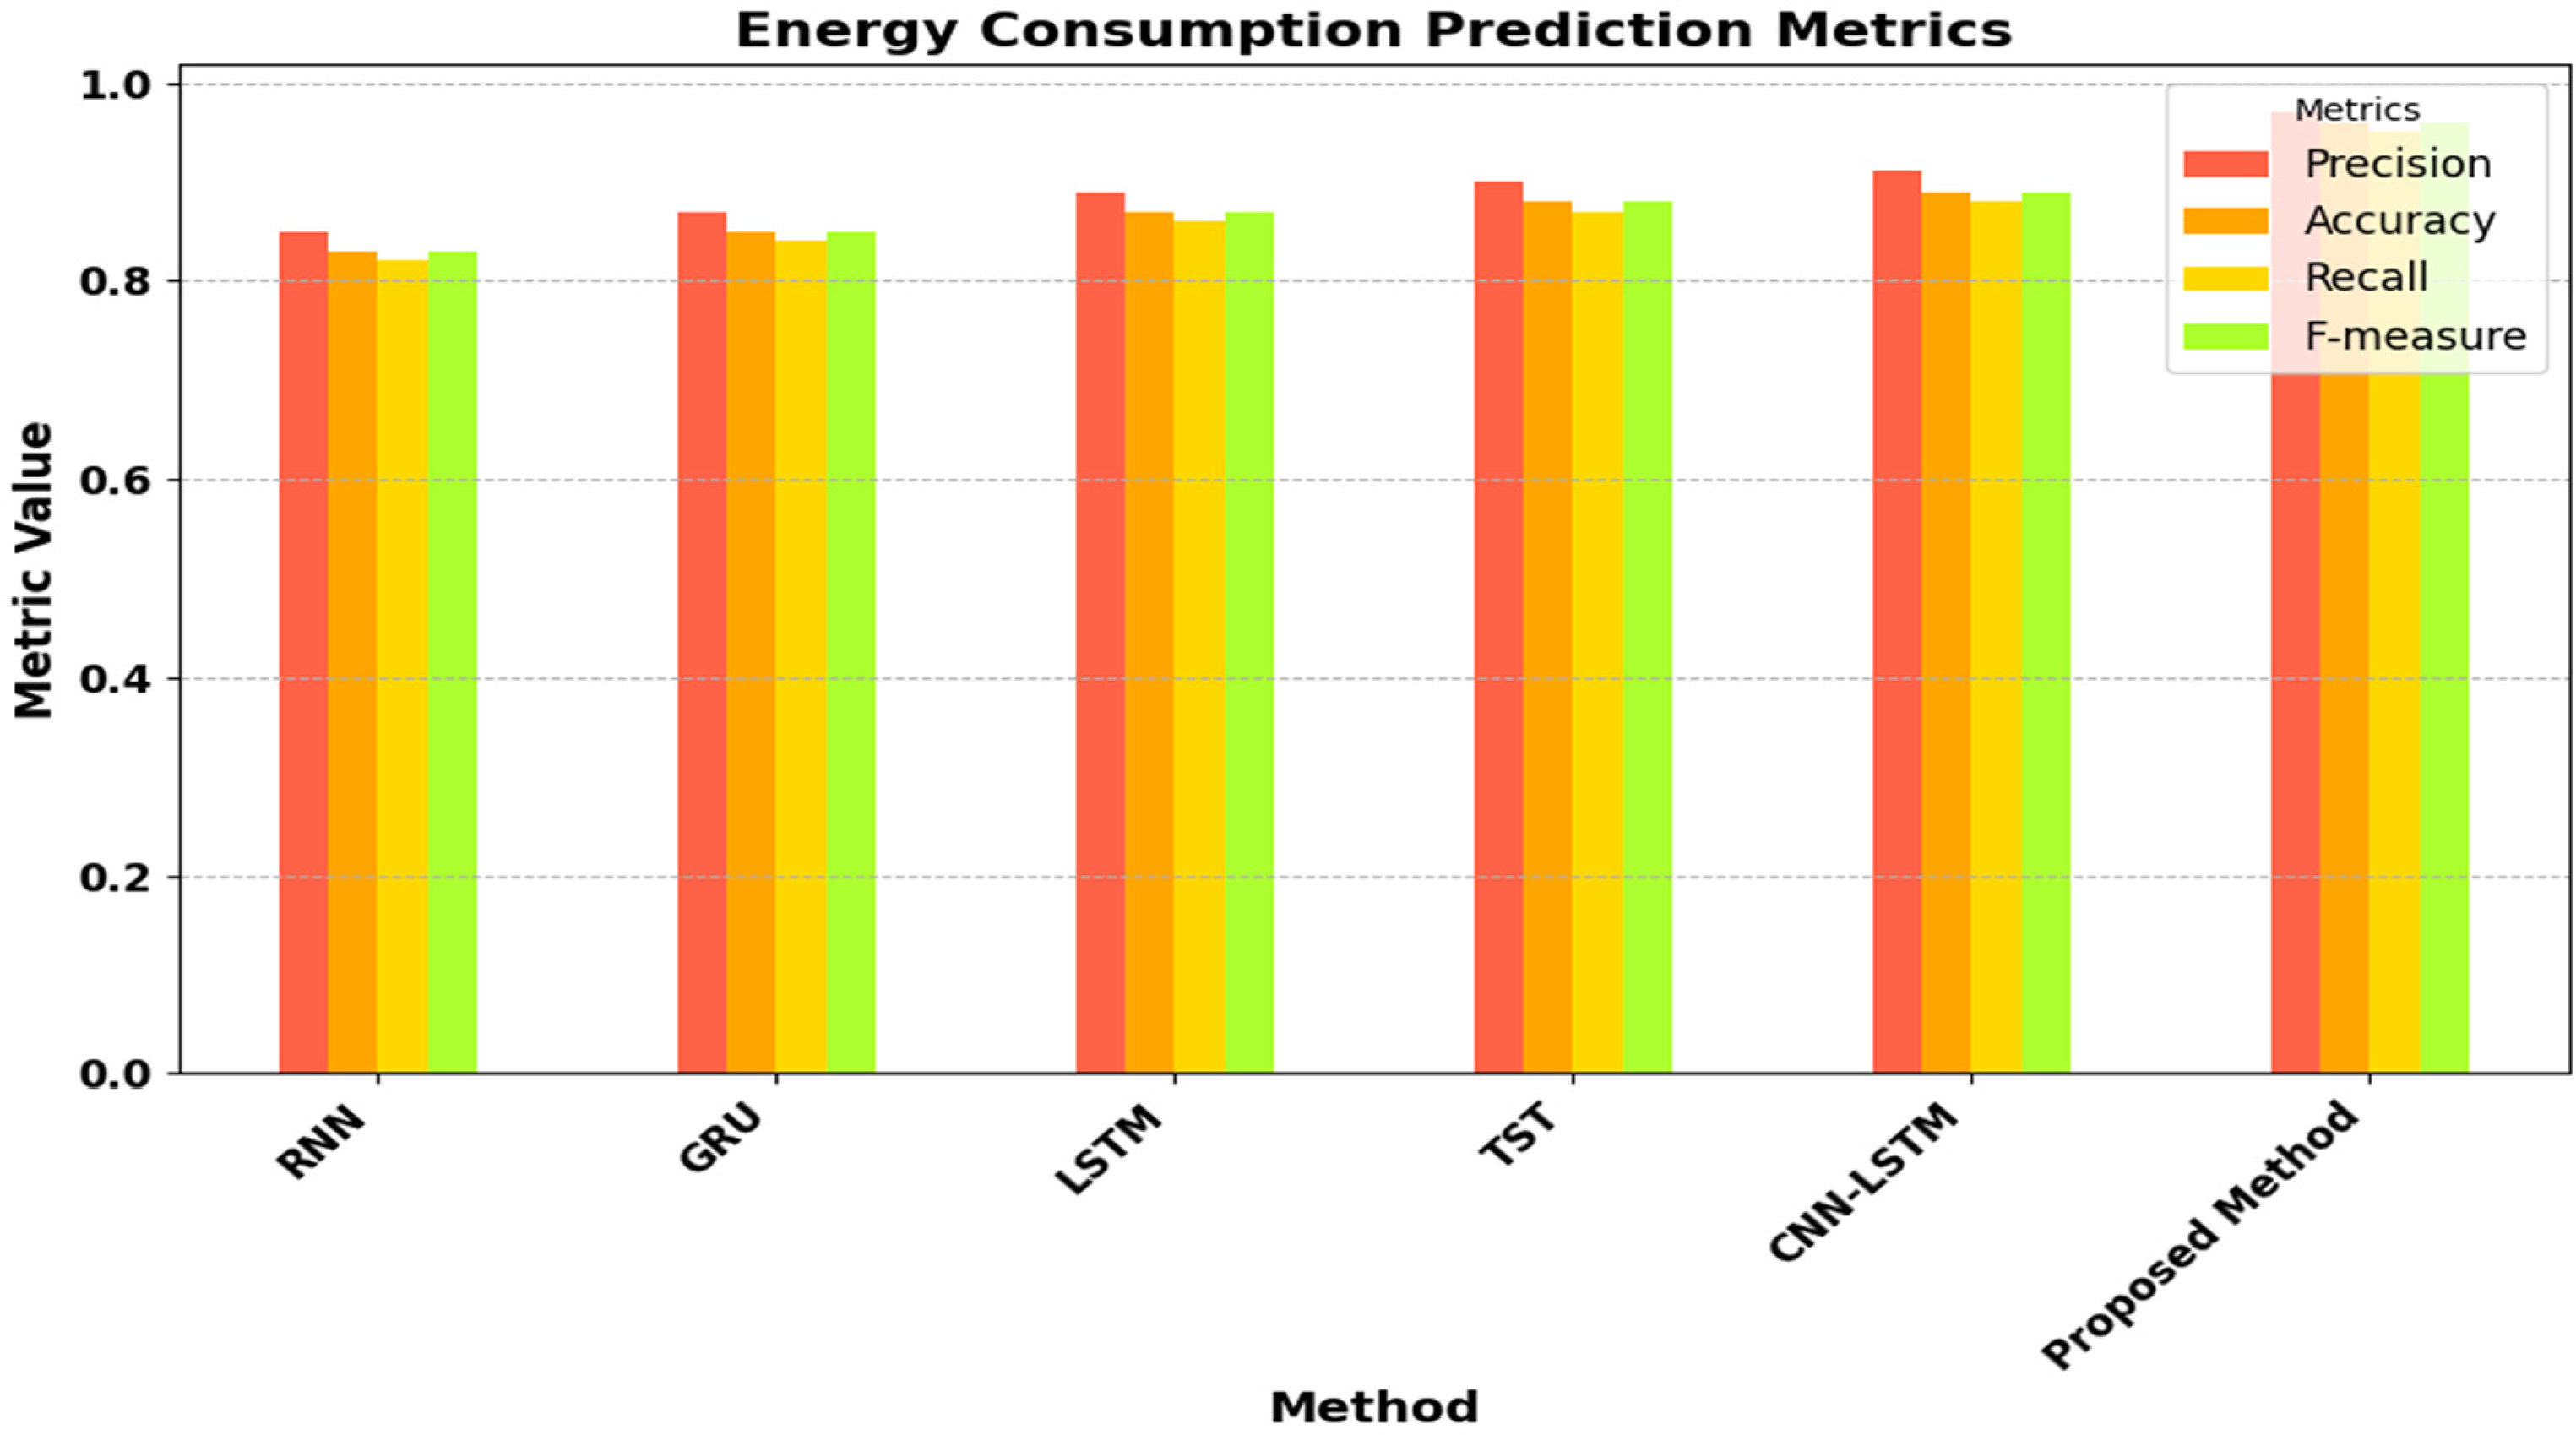
MSE results for existing and proposed methods for energy consumption prediction.
MSE results for existing and proposed methods for energy consumption prediction.
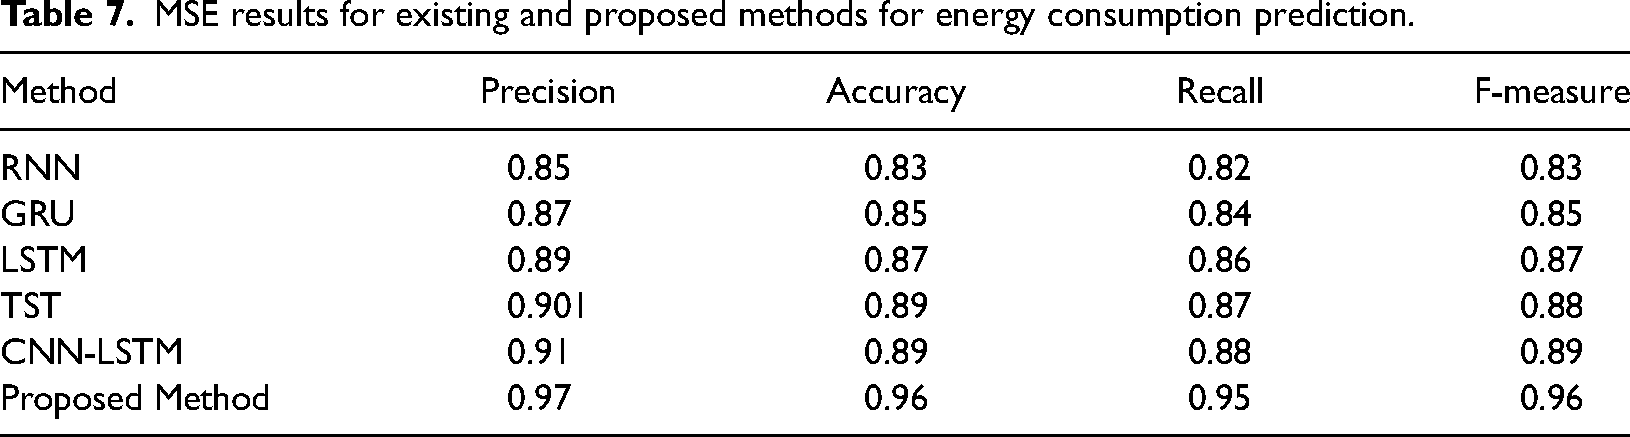
Table 7 presents the precision, accuracy, recall and F-measure results for various methods, such as RNN, GRU, LSTM, TST, CNN-LSTM and the proposed method, in predicting energy consumption. The proposed approach consistently performs better than conventional techniques in all metrics, with precision, accuracy, recall and F-measure values of 0.97, 0.96, 0.95 and 0.96, respectively.
The results demonstrate that the proposed method attains superior precision in identifying positive instances (accurately predicted energy consumption patterns), higher accuracy in overall predictions and improved recall in capturing all positive instances. The exceptional performance can be credited to the inventive approach of the proposed method, which probably integrates more advanced features, superior model architecture or more efficient training strategies compared to the current methods.
Greater precision implies fewer false positives, meaning fewer incorrect predictions of energy consumption patterns. This is vital for energy management systems to prevent unnecessary allocation of resources. The increased accuracy of the proposed method implies a reduced number of prediction errors, resulting in more dependable energy consumption forecasts. The proposed method's superior performance in all metrics proves its effectiveness and efficiency in predicting energy consumption compared to conventional techniques, making it an attractive strategy for real-time energy management solutions.
Ablation analysis
Ablation analysis is conducted to assess the influence of different elements of the proposed hybrid model on its efficacy. The present research examines the proposed hybrid model by individually eliminating and altering features.
Table 8 presents the results of an ablation analysis for existing and proposed methods. The ablation analysis shows how important each part is in the proposed Smart Grid Stability Forecast Model. The Two-way Attention Mechanism, Hybrid Deep Learning (CNN and BiLSTM) and MPSO optimization are important for high precision, accuracy, recall and F1-score. Putting these parts together makes a complete model that can accurately predict Stability in smart grid systems.
Ablation analysis results for existing and proposed methods.
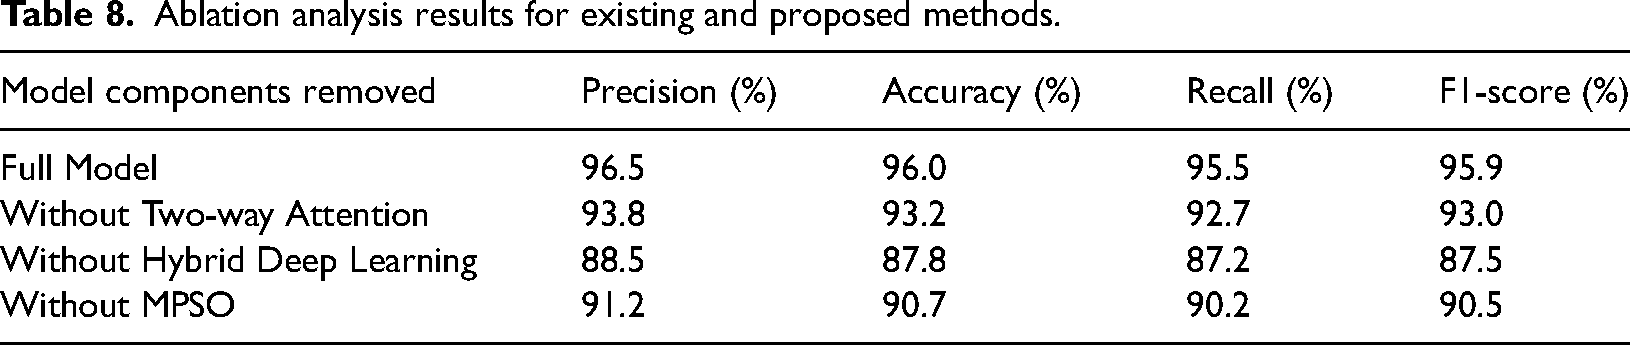
The ablation analysis shows that the proposed hybrid model achieves the best performance. Removing away a Two-way Attention feature makes performance go down a lot, which shows how important this feature is for paying attention to crucial components of the input pattern. When the Hybrid Deep Learning parts (CNN and BiLSTM) are taken away, the performance decreases significantly. This shows how important it is to use spatial extraction of features and temporal dependency modeling. Reducing MPSO optimization also lowers performance, showing how useful it is for fine-tuning the model's parameters for better prediction accuracy. Each part is important; putting them together ensures the model can make better predictions.
Conclusion and future directions
This research involved an examination of different load forecasting methods in smart grids. We then created a model that combines a hybrid deep learning model (CNN with Bi-LSTM) with a two-way attention method and a MPSO. This proposed hybrid model is specifically designed for short-term load prediction in smart grids. The primary benefit of developing this model is to attain optimal precision. The researchers conducted experiments on publicly available real-time load datasets using deep learning models, including RNN, GRU, LSTM, TST and CNN-LSTM. This research utilized a real-time online Stability dataset to measure the performance of proposed and existing models. We have examined the simulation results based on various settings, that is, different batch sizes, Learning rates, Optimizers and energy consumption rates.
The proposed Smart Grid Stability Prediction Model, which combines a Two-way Attention Hybrid Deep Learning (CNN and BiLSTM) approach with MPSO, has shown substantial enhancements in the accuracy of energy consumption prediction compared to current methods. The model's capacity to accurately capture spatial characteristics and temporal relationships, in conjunction with the optimization capabilities of MPSO, has led to exceptional performance across a range of metrics. The proposed model has demonstrated significant potential in improving the efficiency and effectiveness of energy management systems. The proposed models’ strong performance and ability to handle various batch sizes, learning rates and optimization methods make them highly valuable for predicting energy consumption in smart grid environments.
To improve the model in the future, it can be enhanced by integrating various additional sources, including weather trends and consumer behaviour data, as well as real-time grid statistics. In addition, investigating sophisticated deep learning architectures and optimization techniques may result in more precise and efficient models for predicting energy consumption. Integrating emerging technologies such as the IoT and Blockchain could further improve the model's real-time ability to manage and optimize energy.
Footnotes
Declaration of conflicting interests
The author(s) declared no potential conflicts of interest with respect to the research, authorship, and/or publication of this article.
Funding
The author(s) received no financial support for the research, authorship, and/or publication of this article.