
Abstract
During underground coal mining, Mining-induced seismicity is a crucial factor leading to roadway deformation. Based on a case study of rib spalling caused by mining-induced seismicity in China, this paper utilizes the Universal Distinct Element Code to investigate the mechanism of rib spalling. It analyzes the stress evolution process of roadway surrounding rock and the damage process under the influence of mining-induced seismicity. Additionally, it examines the relationship between seismic wave amplitude, frequency and the damage characteristics of roadway surrounding rock. Findings show that seismic waves induce stress concentration zones in the deeper surrounding rock, causing shear failure, while stress concentration zones emerge in the top, bottom and shoulders of roadway, leading to tensile failure in the shallower surrounding rock. With increasing seismic wave amplitude, the critical crack length of surrounding rock decreases, resulting in a linear increase in crack count and distribution area. The roadway exhibits a ‘
Keywords
Introduction
Coal burst is one of the most severe dynamic disasters in Chinese coal mines (Cao et al., 2016; Dai et al., 2022; He et al., 2017; Kaiser and Cai, 2012), primarily occurring in roadways and posing a significant threat to coal mine safety (Zhao et al., 2018). It is characterized by the abrupt instability and failure of the surrounding rock (Wang et al., 2020; Zhu et al., 2022) and its support structure during longwall retreating and roadway excavation, often leading to roadway rib spalling (Wang et al., 2019; Xu et al., 2019b). This dynamic failure occurs when the combined dynamic and static stress in coal and rock exceeds the ultimate stress levels (He et al., 2016).
Mining-induced seismicity is a key factor contributing to coal bursts, including roadway rib spalling (Cao et al., 2023b). It results from the response of coal and rock mass to regional or local stress adjustments during mining, often accompanied by energy release and vibrations (Li et al., 2021). The movement and fracturing of roof strata, as well as fault sliding during coal mining, generate mining-induced seismicity or microseismicity (Cao et al., 2023a; He et al., 2022). The strength and thickness of the roof influences the energy of these seismic events, with greater values leading to more intense seismicity (He et al., 2016). After mining a longwall panel, the unsupported roof area increases during the retreat of an adjacent panel, intensifying roof instability and increasing the frequency of mining-induced seismic events.
Seismic waves from mining-induced seismicity propagate to the surrounding roadway, imposing dynamic loads on the surrounding rock. The energy of these seismic events and their distance to the roadway primarily determine the intensity of the dynamic load disturbance (Qi et al., 2022; Xu et al., 2019a, 2019b). This directly affects the degree of roadway deformation and failure (Cao et al., 2021; Jia et al., 2022; Wu et al., 2021; Yang et al., 2017; Zhou et al., 2022). The arrival of seismic waves accelerates the development of tensile cracks in the shallow surrounding rock, leading to stress concentration in deeper surrounding rock (He et al., 2023; Li and Weng, 2016). Geological discontinuities along with the propagation path, such as joints or fractures, can attenuate seismic waves (Feng et al., 2022; He et al., 2020; Wang and Cai, 2017), reducing their dynamic disturbance effects on the roadway rock. Strengthening roadway support can mitigate deformation and damage caused by dynamic stress (Gao et al., 2014). Greater microseismic energy corresponds to larger seismic wave amplitudes, indicating higher dynamic stress (Chen et al., 2020). Under certain static load conditions, increased dynamic stress amplitude (Yang et al., 2021) promotes crack growth and development in the surrounding rock, leading to expanded deformation and damage in the roof, floor and ribs of the roadway (Gao et al., 2021; Liu et al., 2021). As the number of dynamic load cycles increases (Zhuang et al., 2023), the cracks in the rock exhibit a two-stage development process: an initial stable growth phase followed by a rapid, unstable expansion phase approaching critical failure (Miao et al., 2021; Zhou et al., 2022; Zhuang et al., 2023). Previous studies have made significant contributions to understanding the impact of dynamic stress on rock stability (Hao et al., 2020; Li et al., 2017; Yan et al., 2020). Researchers have employed Hopkinson pressure bar tests to replicate rockburst phenomena under combined dynamic and static loads, demonstrating how dynamic stress promotes crack initiation and growth (Miao et al., 2021). Experiments conducted under true-triaxial conditions revealed that exceeding certain thresholds of amplitude and frequency in dynamic stress leads to a rapid increase in rockburst intensity (Hu et al., 2020; Su et al., 2017a, 2017b), with different disturbance patterns resulting in varying failure modes, such as impact failure and fatigue failure.
Existing research has primarily focused on the influence of seismic wave amplitude, the number of seismic wave disturbances and the extent of seismic wave attenuation on roadway rock damage. However, the relationship between seismic wave frequency and roadway rock damage mechanisms remains unclear. This study addresses this gap by focusing on a roadway rib spalling event caused by mining-induced seismicity in a specific mine in China. A large-scale Universal Distinct Element Code (UDEC) model, based on the geological and mining conditions, was established to simulate the damage and failure process of the roadway under seismic waves. This study explores how seismic wave frequency parameters affect the stress state and crack propagation of the surrounding roadway rock. It aims to establish a relationship between the degree of roadway rock damage and seismic wave frequency-amplitude parameters. By enhancing the understanding of the impact of seismic wave frequency on roadway damage, this research provides a reference for the timely prediction and warning of potential roadway damage based on microseismic frequency and amplitude information.
Engineering background
Based on the engineering background of the Nalinhe mine in China, the 31103 working face is 241 m in length, and the strike length extends to 1787 m. The coal seam is 5.5 meters thick, nearly horizontal. It is buried at a depth of around 550 m. As shown in Figure 1, there was a roadway deformation incident in the 31103 working face return airway. The roadway near the 22nd connection gallery, located approximately 90 m ahead of the working face, exhibits the most severe deformation of 1.4 meters. The coal pillar exhibited different degrees of lateral deformation ahead of the working face: 1 m within 5 meters, 1.2 m within 5–40 meters and 0.6 m within 40–90 meters. As shown in Figure 2, the stress variation curves of stress monitoring points near the rib spalling incident are displayed.
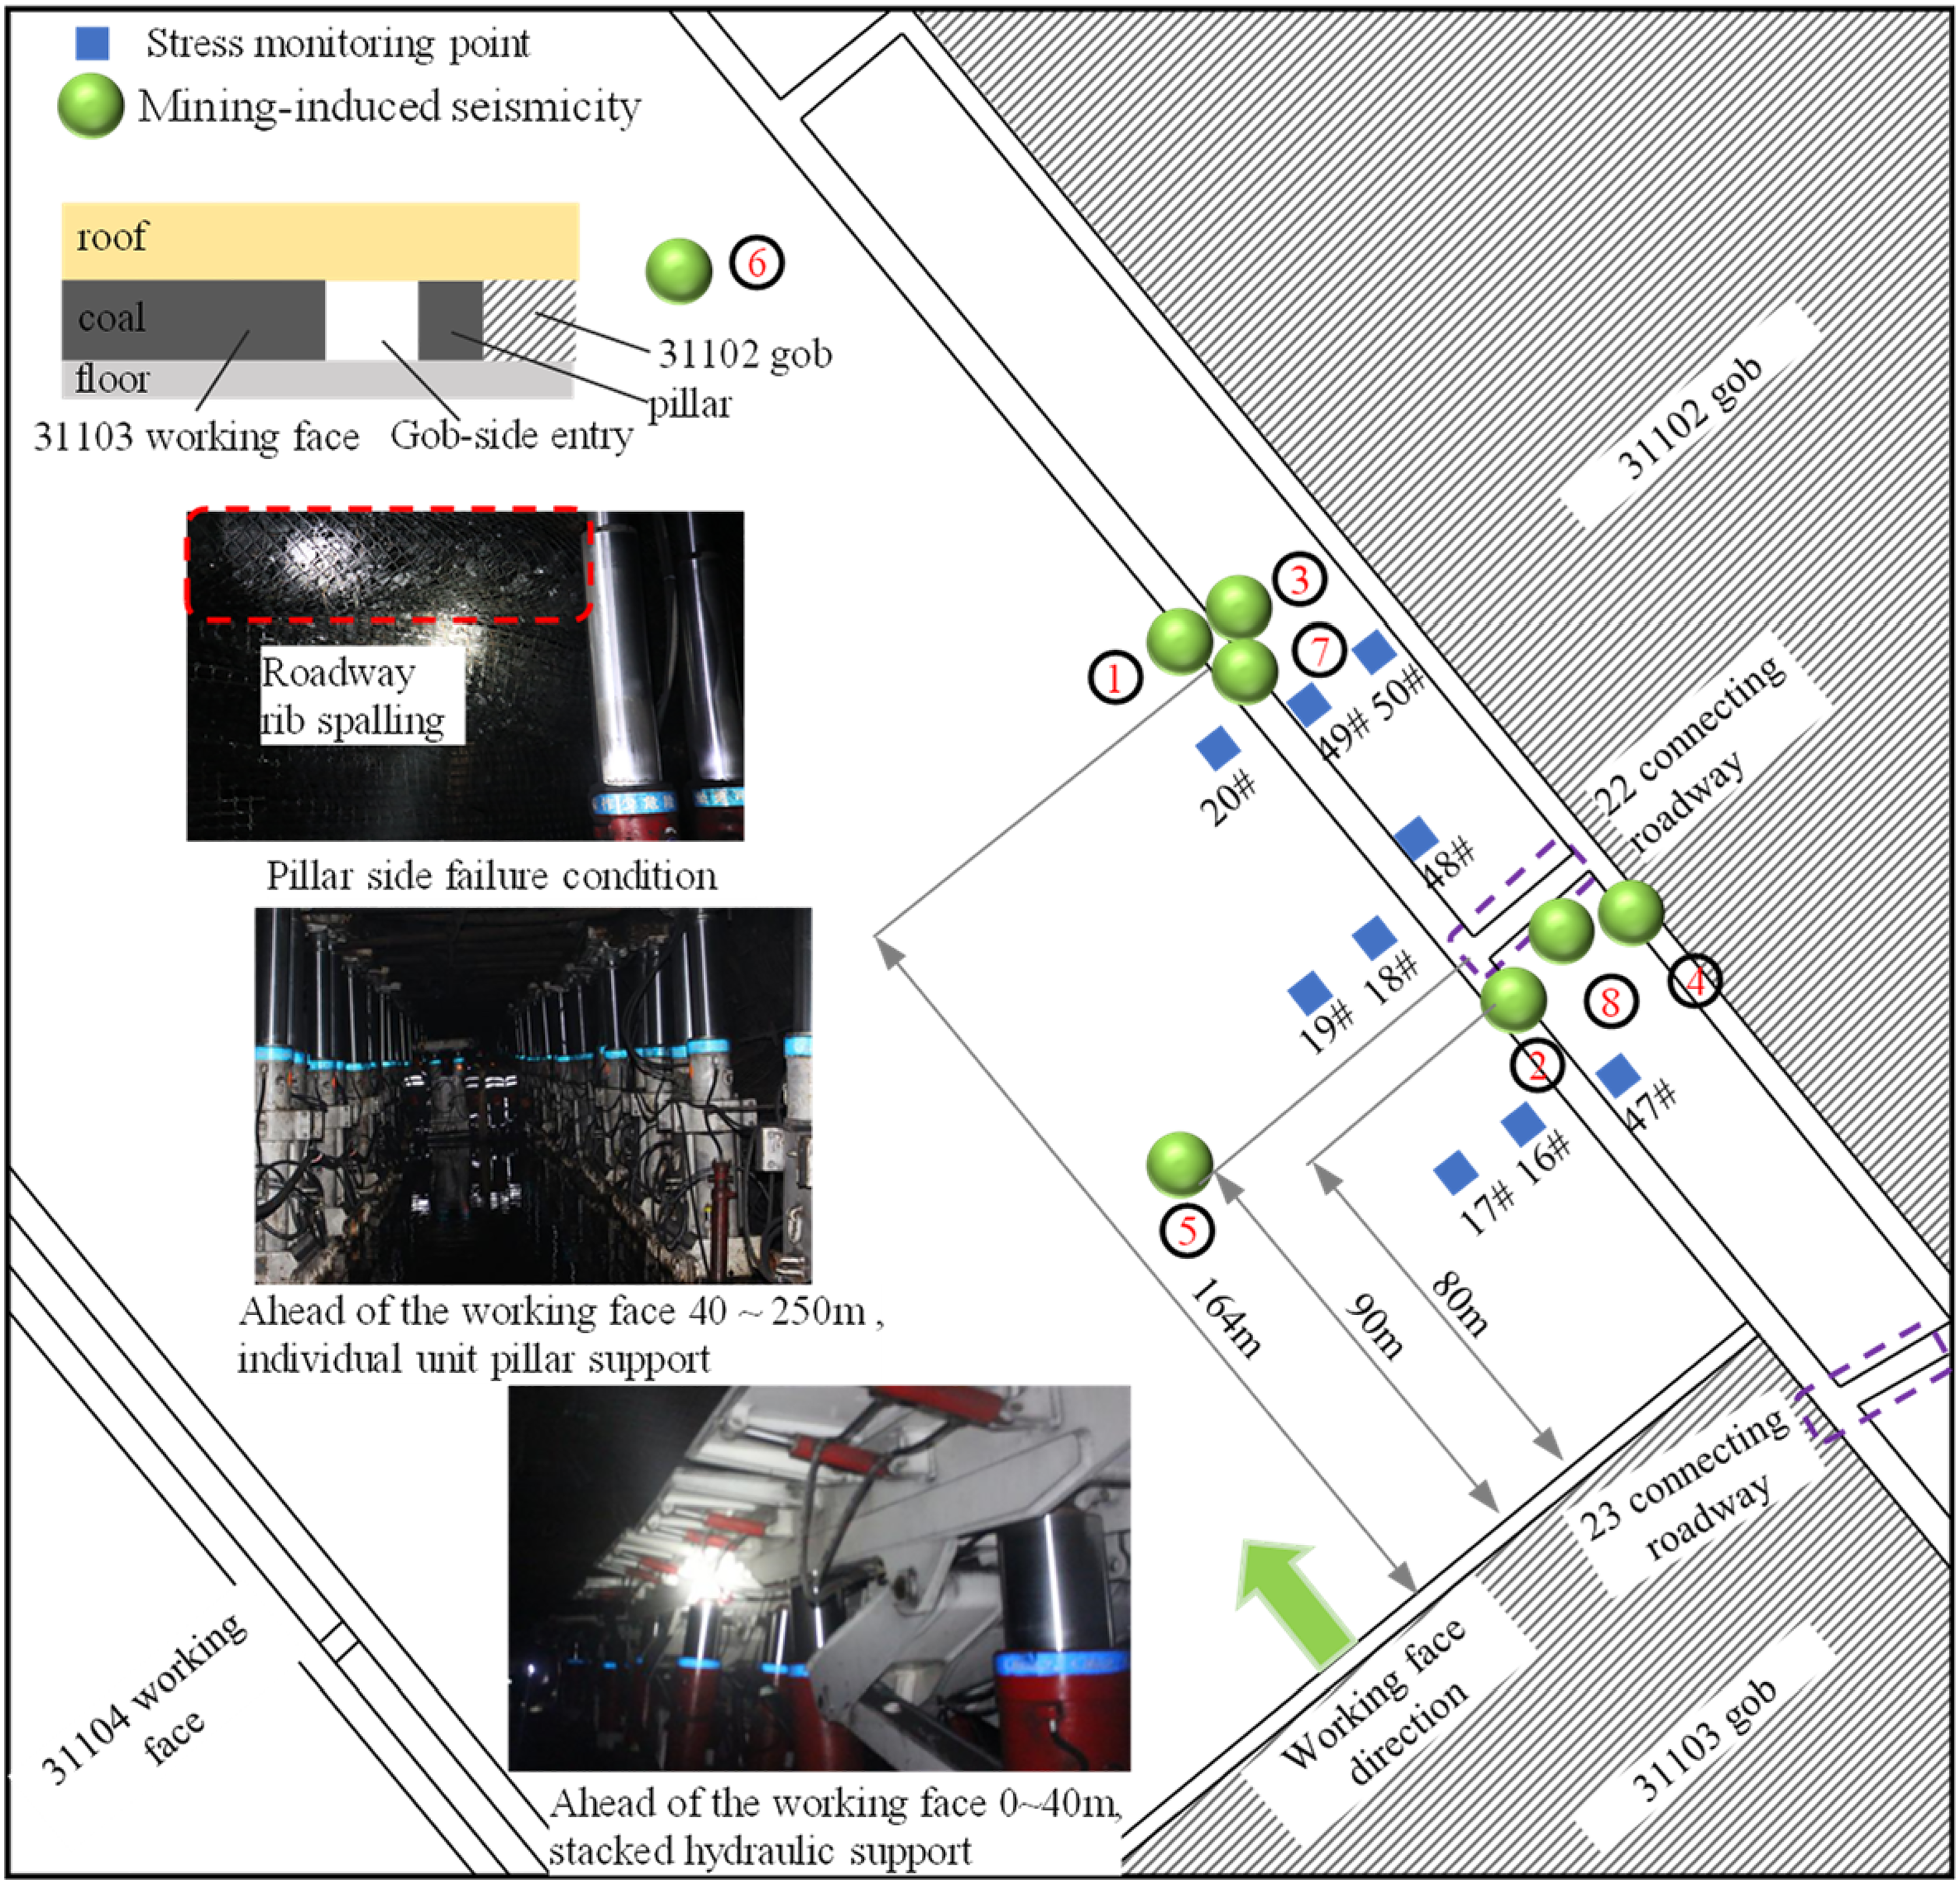
Roadway rib spalling events and mining-induced seismicity distribution characteristics.
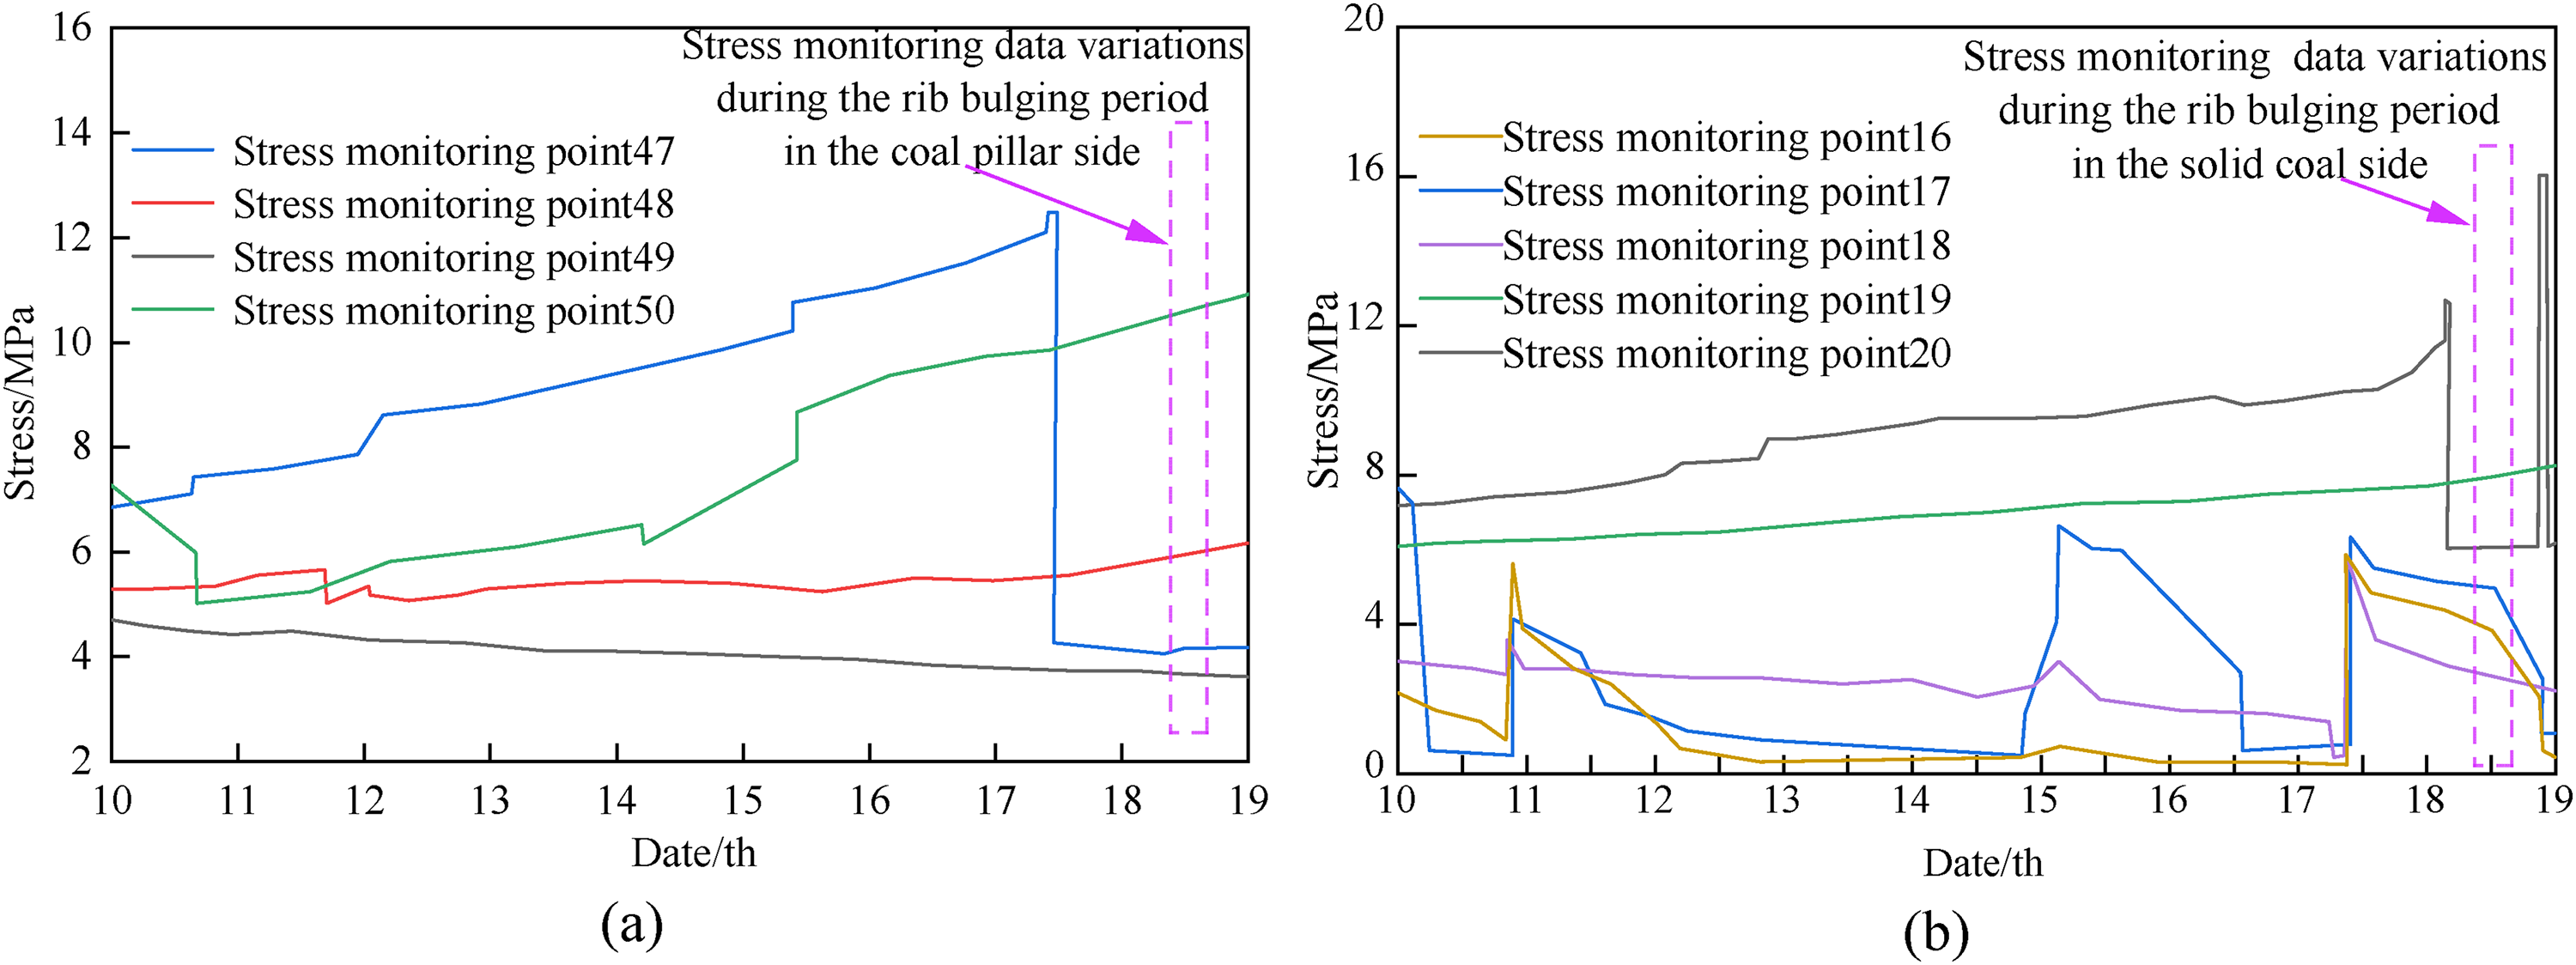
Stress monitoring curve of roadway ribs: (a) Changes in the stress of solid coal; (b) Changes in the stress of coal pillars.
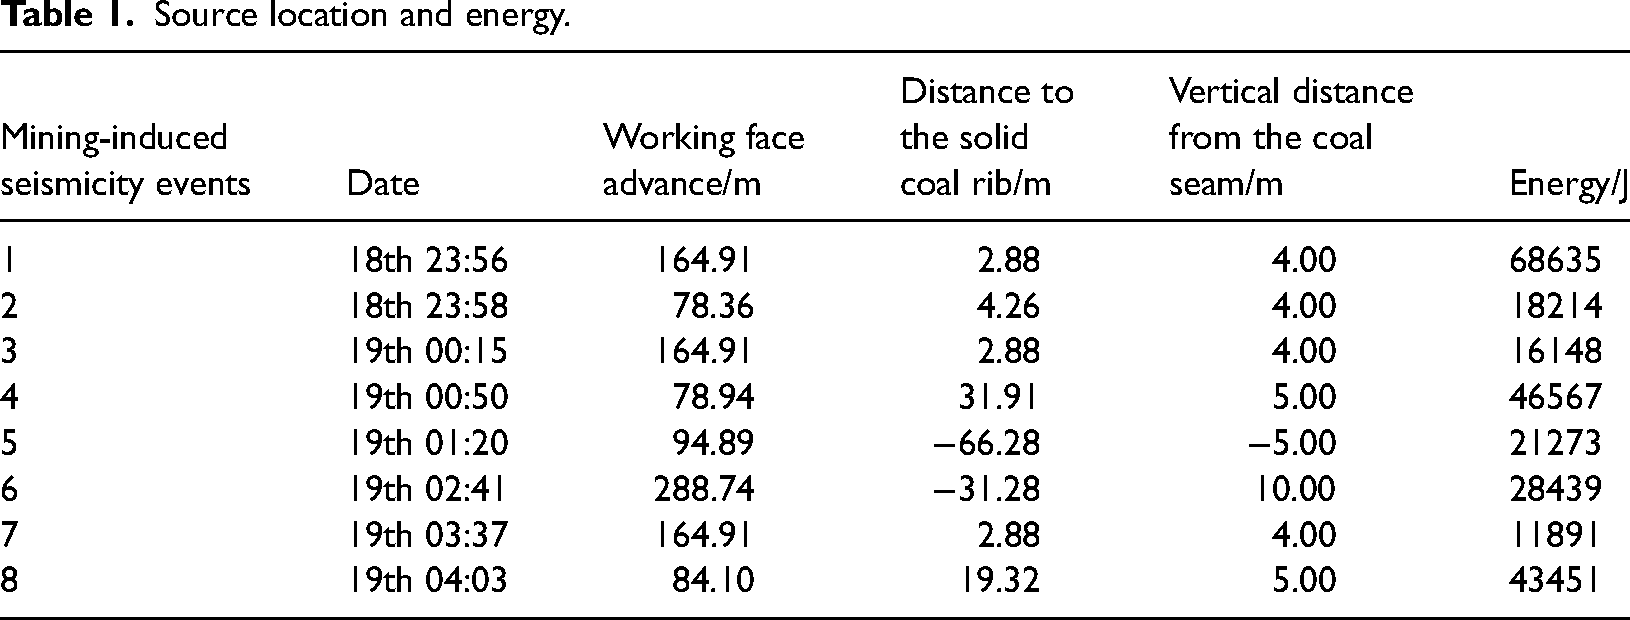
During the rib spalling incident, monitoring Points 16, 17 (40 m ahead of the working face) and 18 (97 m ahead of the working face) show a decreasing trend. Monitoring Points 19 (97 m ahead of the working face) and 20 (160 m ahead of the working face) show an increasing trend. Point 48 (100 m ahead of the working face) and point 50 (158 m ahead of the working face) show an upward trend. Monitoring points 47 (38 meters ahead of the working face) and 49 (158 meters ahead of the working face) show a decreasing trend in stress. At the time of the incident, the overall monitoring points did not exhibit sudden changes. However, three significant energy releases from mining-induced seismicity were observed near the location of the rib spalling. According to the mechanism of coal burst induced by the superposition of dynamic and static stresses (Dou and He, 2001; Li et al., 2017), dynamic failure occurs when the sum of dynamic and static stresses in the coal and rock exceeds the ultimate stress level (violating the strength criteria). Therefore, the dynamic loading from seismicity is the primary factor leading to the roadway rib spalling. On the day of roadway rib spalling, the high-energy Mining-induced seismicity events detected by the microseismic monitoring system are shown in Table 1. During the operational period, three seismic events with energies of 104 J were recorded at the 22nd connecting gallery of the return airway entrance, specifically at locations 2, 4 and 8. The energies of these events were 1.82 × 10⁴ J, 4.66 × 10⁴ J and 4.35 × 10⁴ J, respectively. The three Mining-induced seismicity events near the coal seam roof, occurring approximately 5 m above it and at distances ranging from 4 m to 32 m from the rib side of the return airway, represent dynamic loading conditions.
Source location and energy.
This study analyzes the spectral characteristics of three mining-induced seismicity vibration waveforms that occurred near the 22nd connection gallery, as illustrated in Figure 3. The main frequencies of the three mining-induced seismicity vibration waveforms are 55 Hz, 43 Hz and 87 Hz, respectively. In addition to the main frequencies, each waveform still contains other high-amplitude frequency components. The high-amplitude frequency components in the three events are mainly concentrated in the 20–100 Hz.
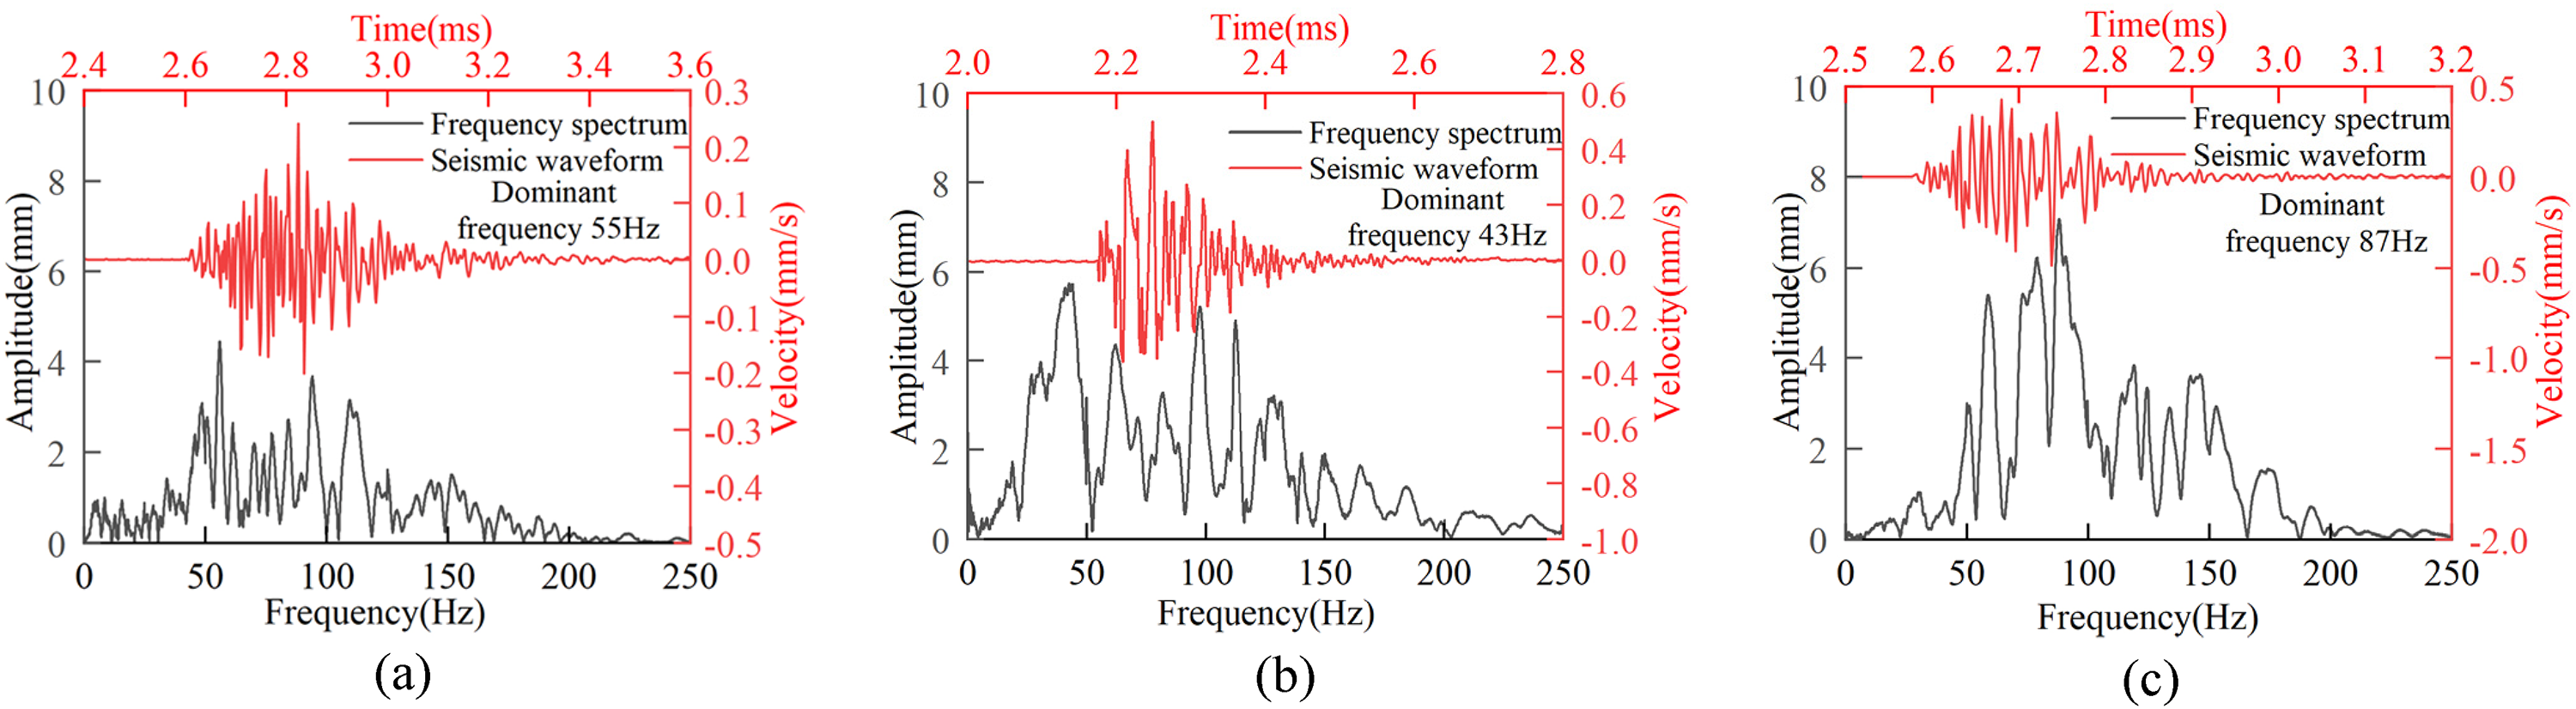
Mine earthquake waveform and frequency spectrum characteristics: (a) Vibration Waveforms and Spectral Characteristics of mining-induced seismicity event 2; (b) Vibration Waveforms and Spectral Characteristics of mining-induced seismicity event 4; (c) Vibration Waveforms and Spectral Characteristics of mining-induced seismicity event 8.
Numerical simulation model and simulation approach
Based on the drill hole columnar diagram of the 31103 working faces, a model was established using UDEC as shown in Figure 4 to investigate the relationship between seismic waves and damage to the roadway. The model dimensions are 72 m × 300 m, and the Mohr–Coulomb model was used for all rock layers. The constitutive relationship for joints was the Coulomb sliding model. According to the parameter, calibration processes for numerical simulation (Cao et al., 2023a, 2023b; Gao and Stead, 2014; Ju et al., 2021; Wu et al., 2019). First, the mechanical parameters of the intact rocks were examined in the laboratory, including elastic modulus, uniaxial compressive strength and Poisson's ratio. Then, the elastic moduli of the rock masses were estimated using the RQD method (Zhang and Einstein, 2004), as shown in equation (1). The uniaxial compressive strength was estimated according to an empirical method (Singh and Rao, 2005), as shown in equation (2):

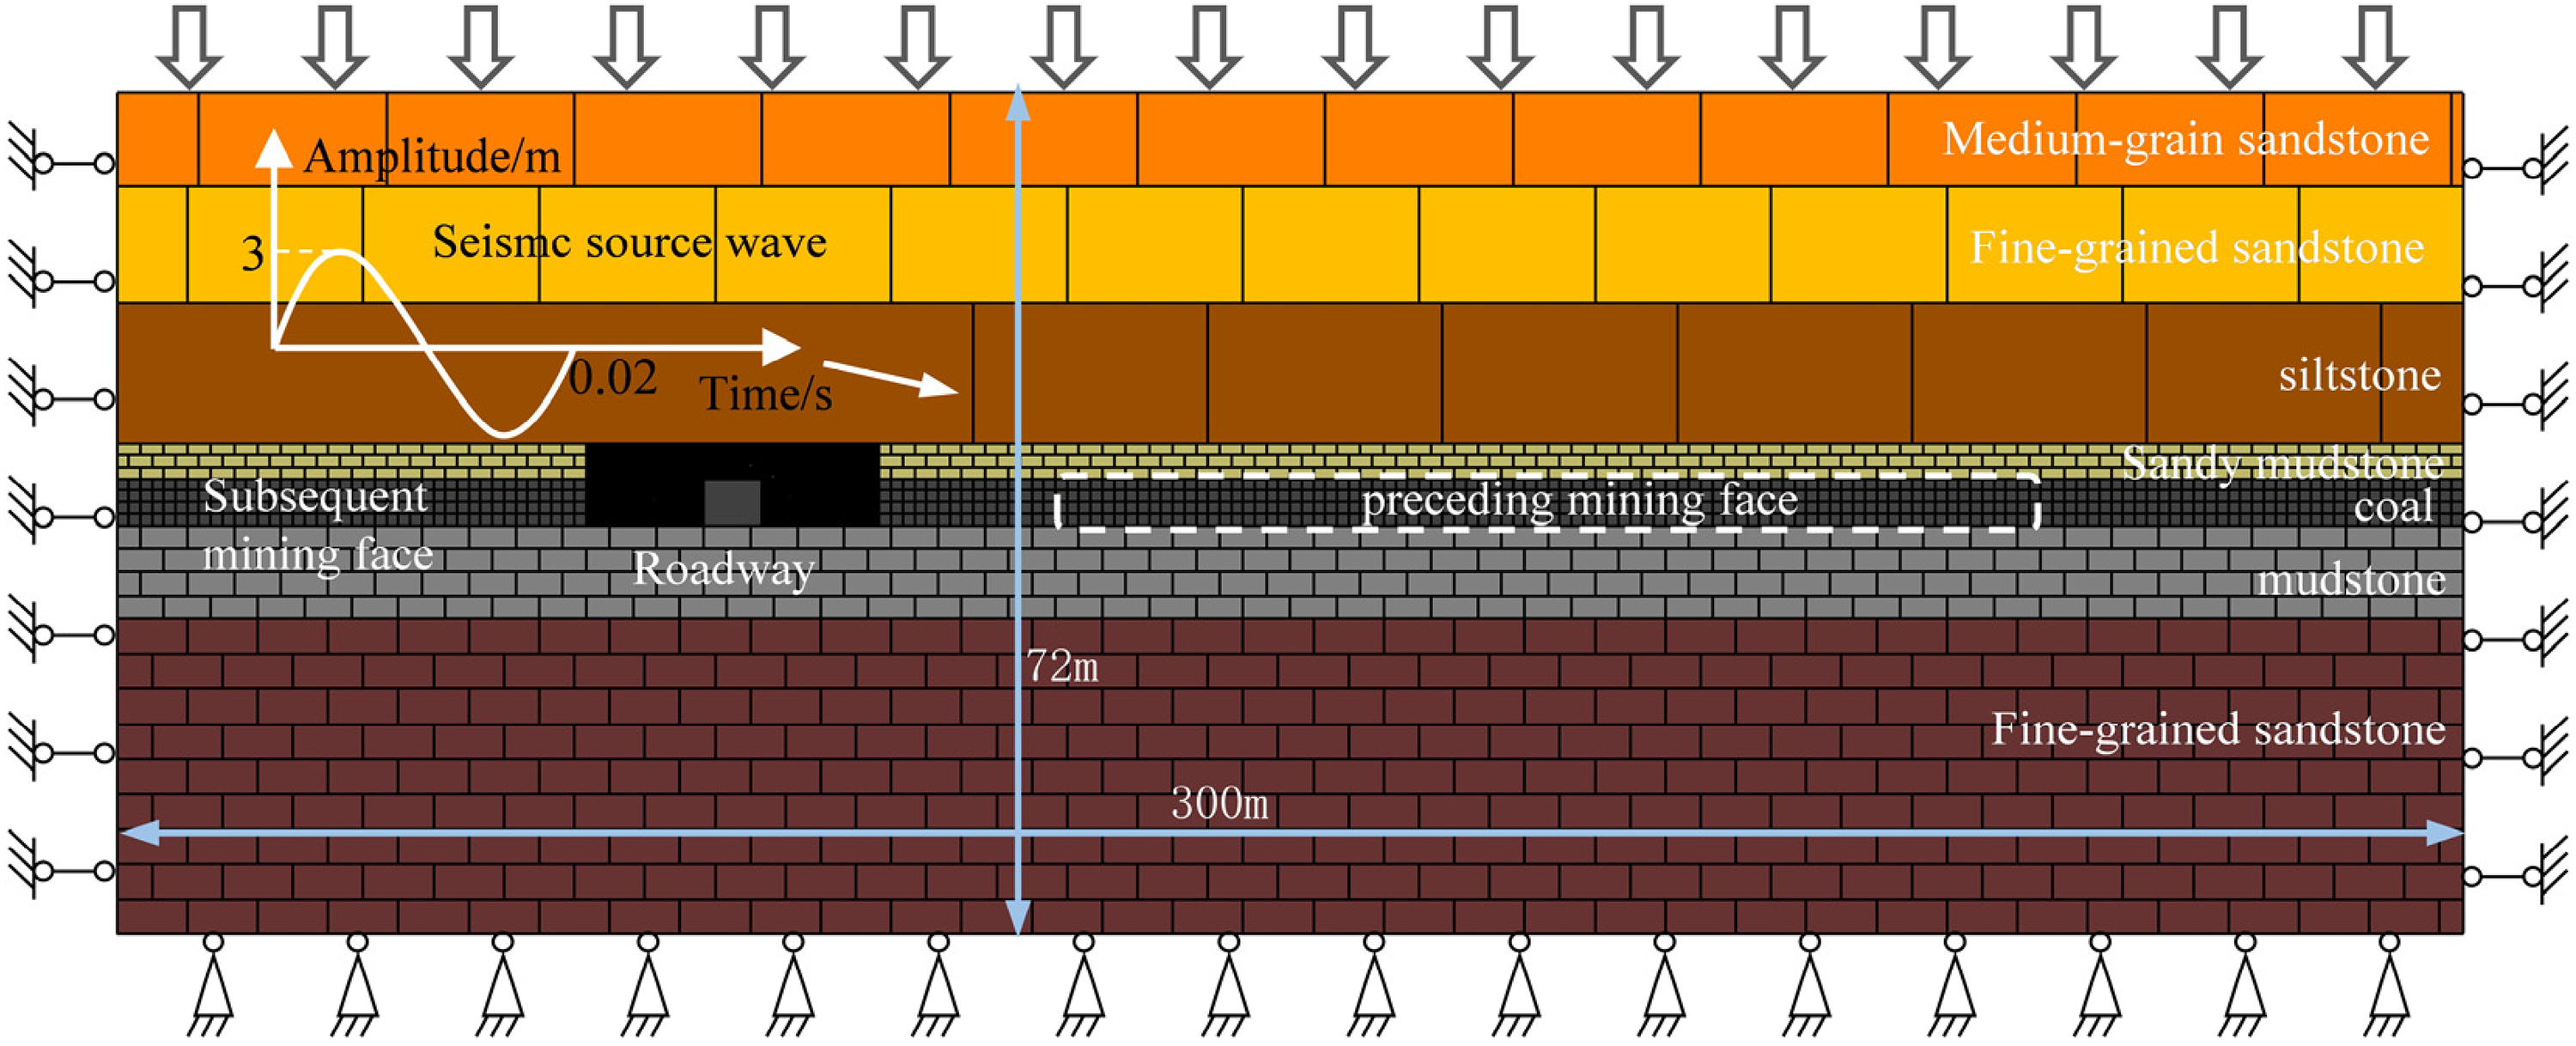
Numerical simulation of roadway instability mechanisms induced by seismic wave.
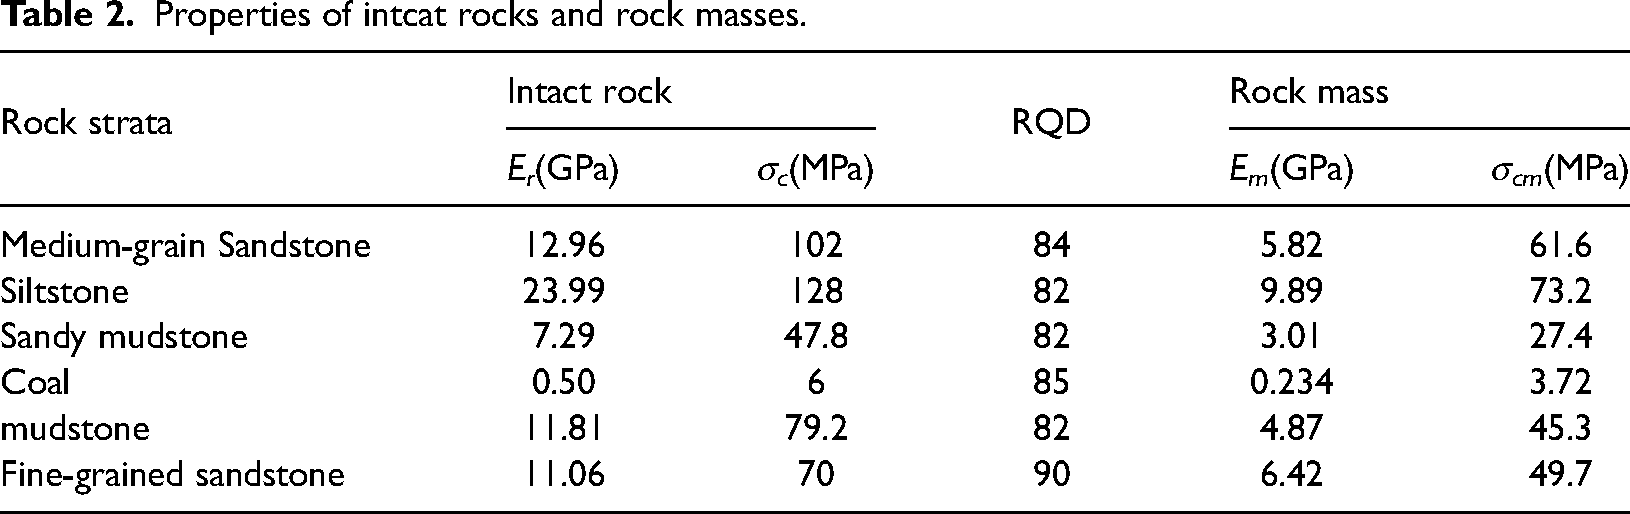
The mechanical parameters of intact rocks and rock masses are shown in Table 2.
Properties of intcat rocks and rock masses.
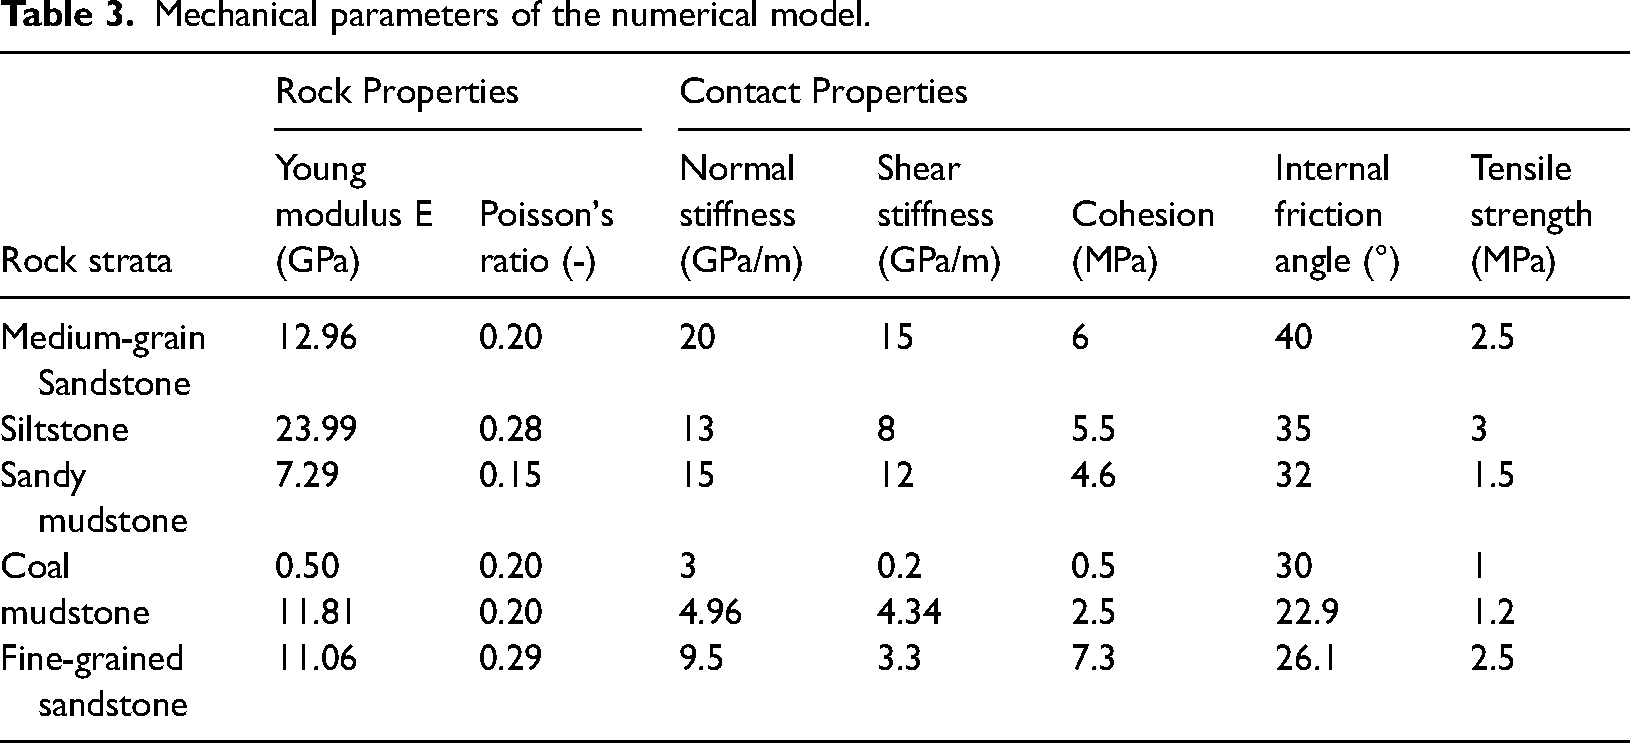
Finally, the model was calibrated through a trial-and-error method using a UCS test, as illustrated in Figure 5. To minimize the influence of block size on the results, the block size was set to 0.4 m, matching the block size of the region of roadway surrounding rock in the large-scale model. The calibrated micro-properties are presented in Table 3. The stress–strain curves from the numerical tests are shown in Figure 5. When comparing the elastic modulus and compressive strength of the rock mass in Figure 5 with those in Table 2, the maximum error between the target values and the numerical simulation results does not exceed 5%. This level of accuracy is acceptable for mining engineering purposes.
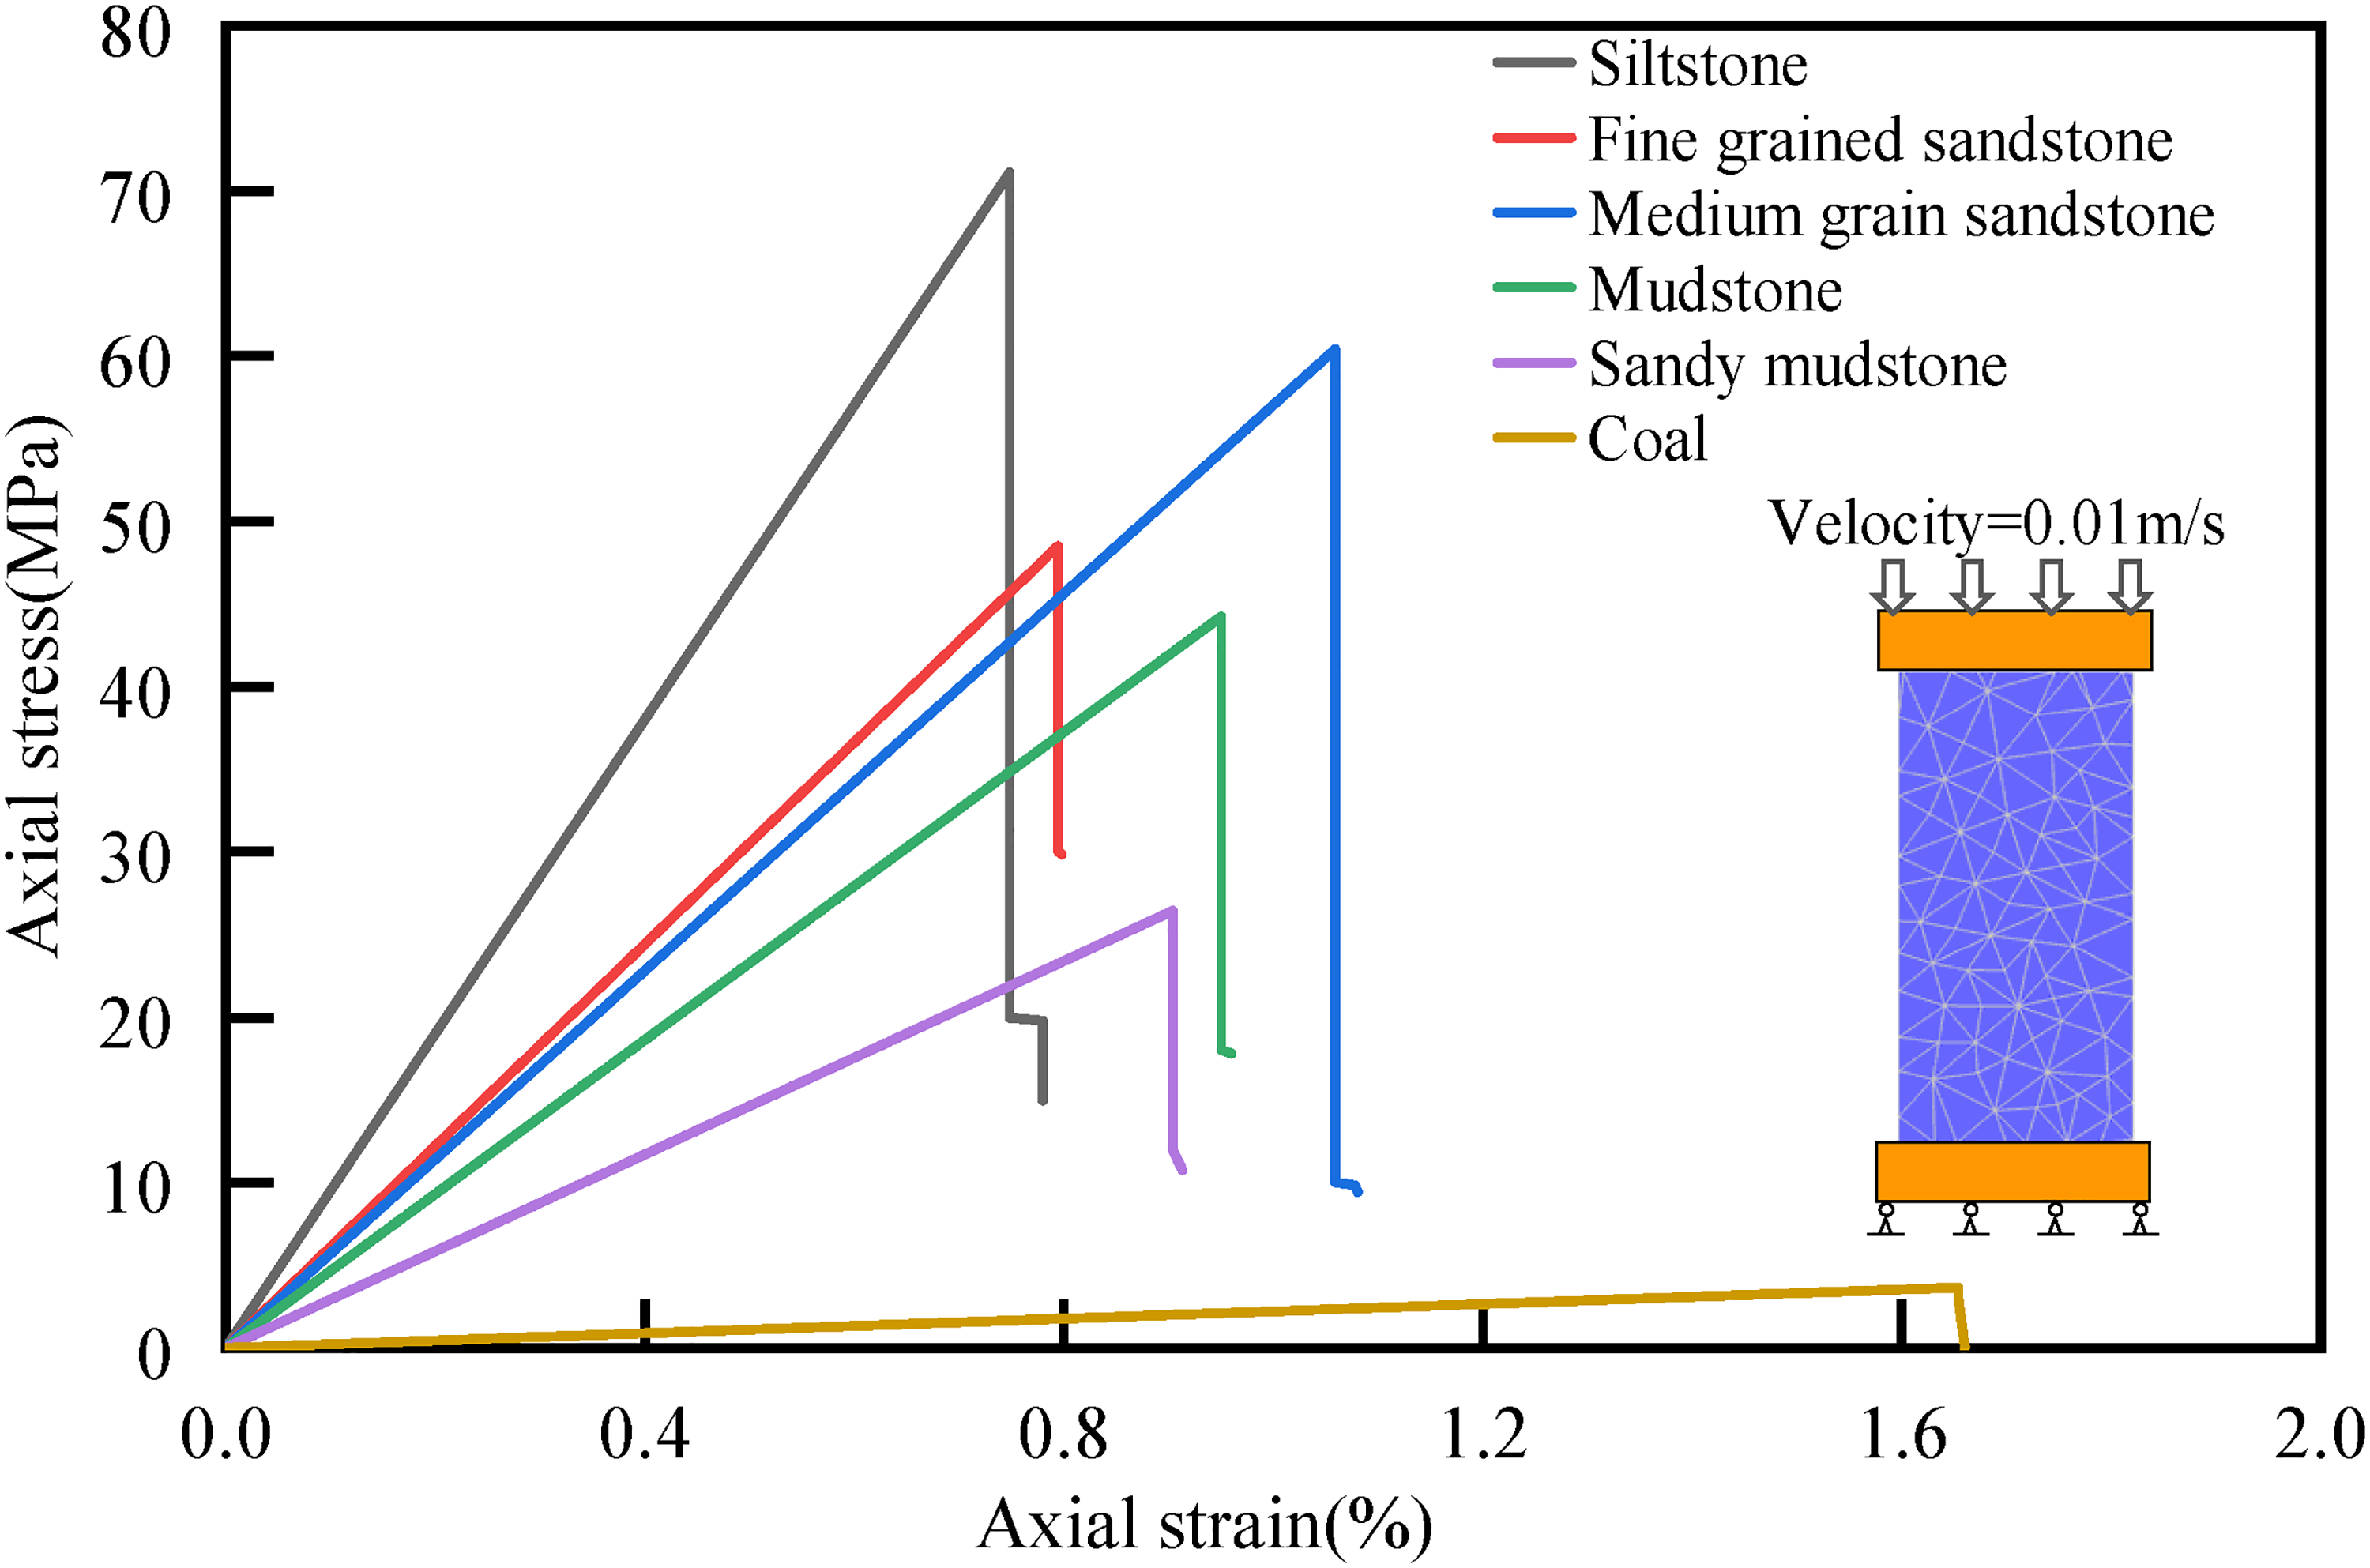
Calibration of mechanical parameters in UDEC–Trigon model: axial stress–strain curves for UCS-test of different types of rock masses.
Mechanical parameters of the numerical model.
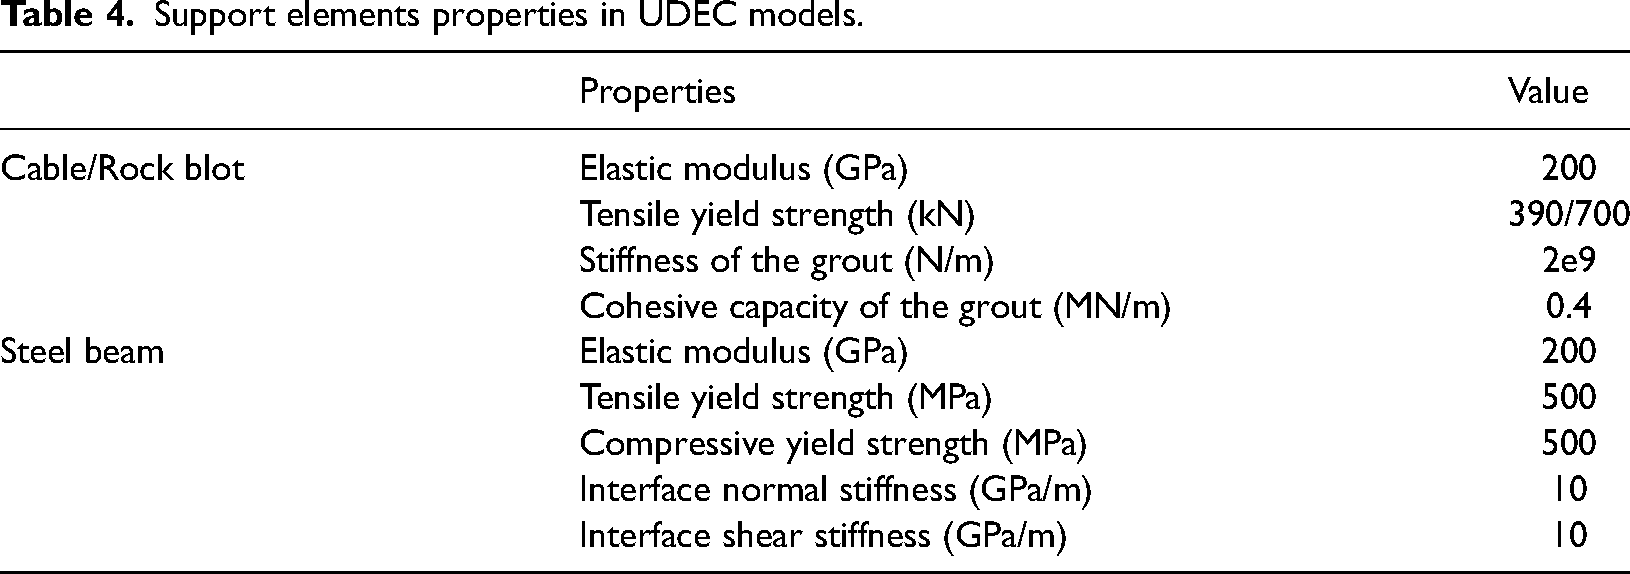
Based on the actual support conditions of the roadway, the roadway was supported using cables, rock blot, steel beam and hydraulic support. The support parameters (Gao et al., 2014) are shown in Table 4. The dimensions of the roadway are 4 m × 5 m, and the support system and arrangement of monitoring points are shown in Figure 6.
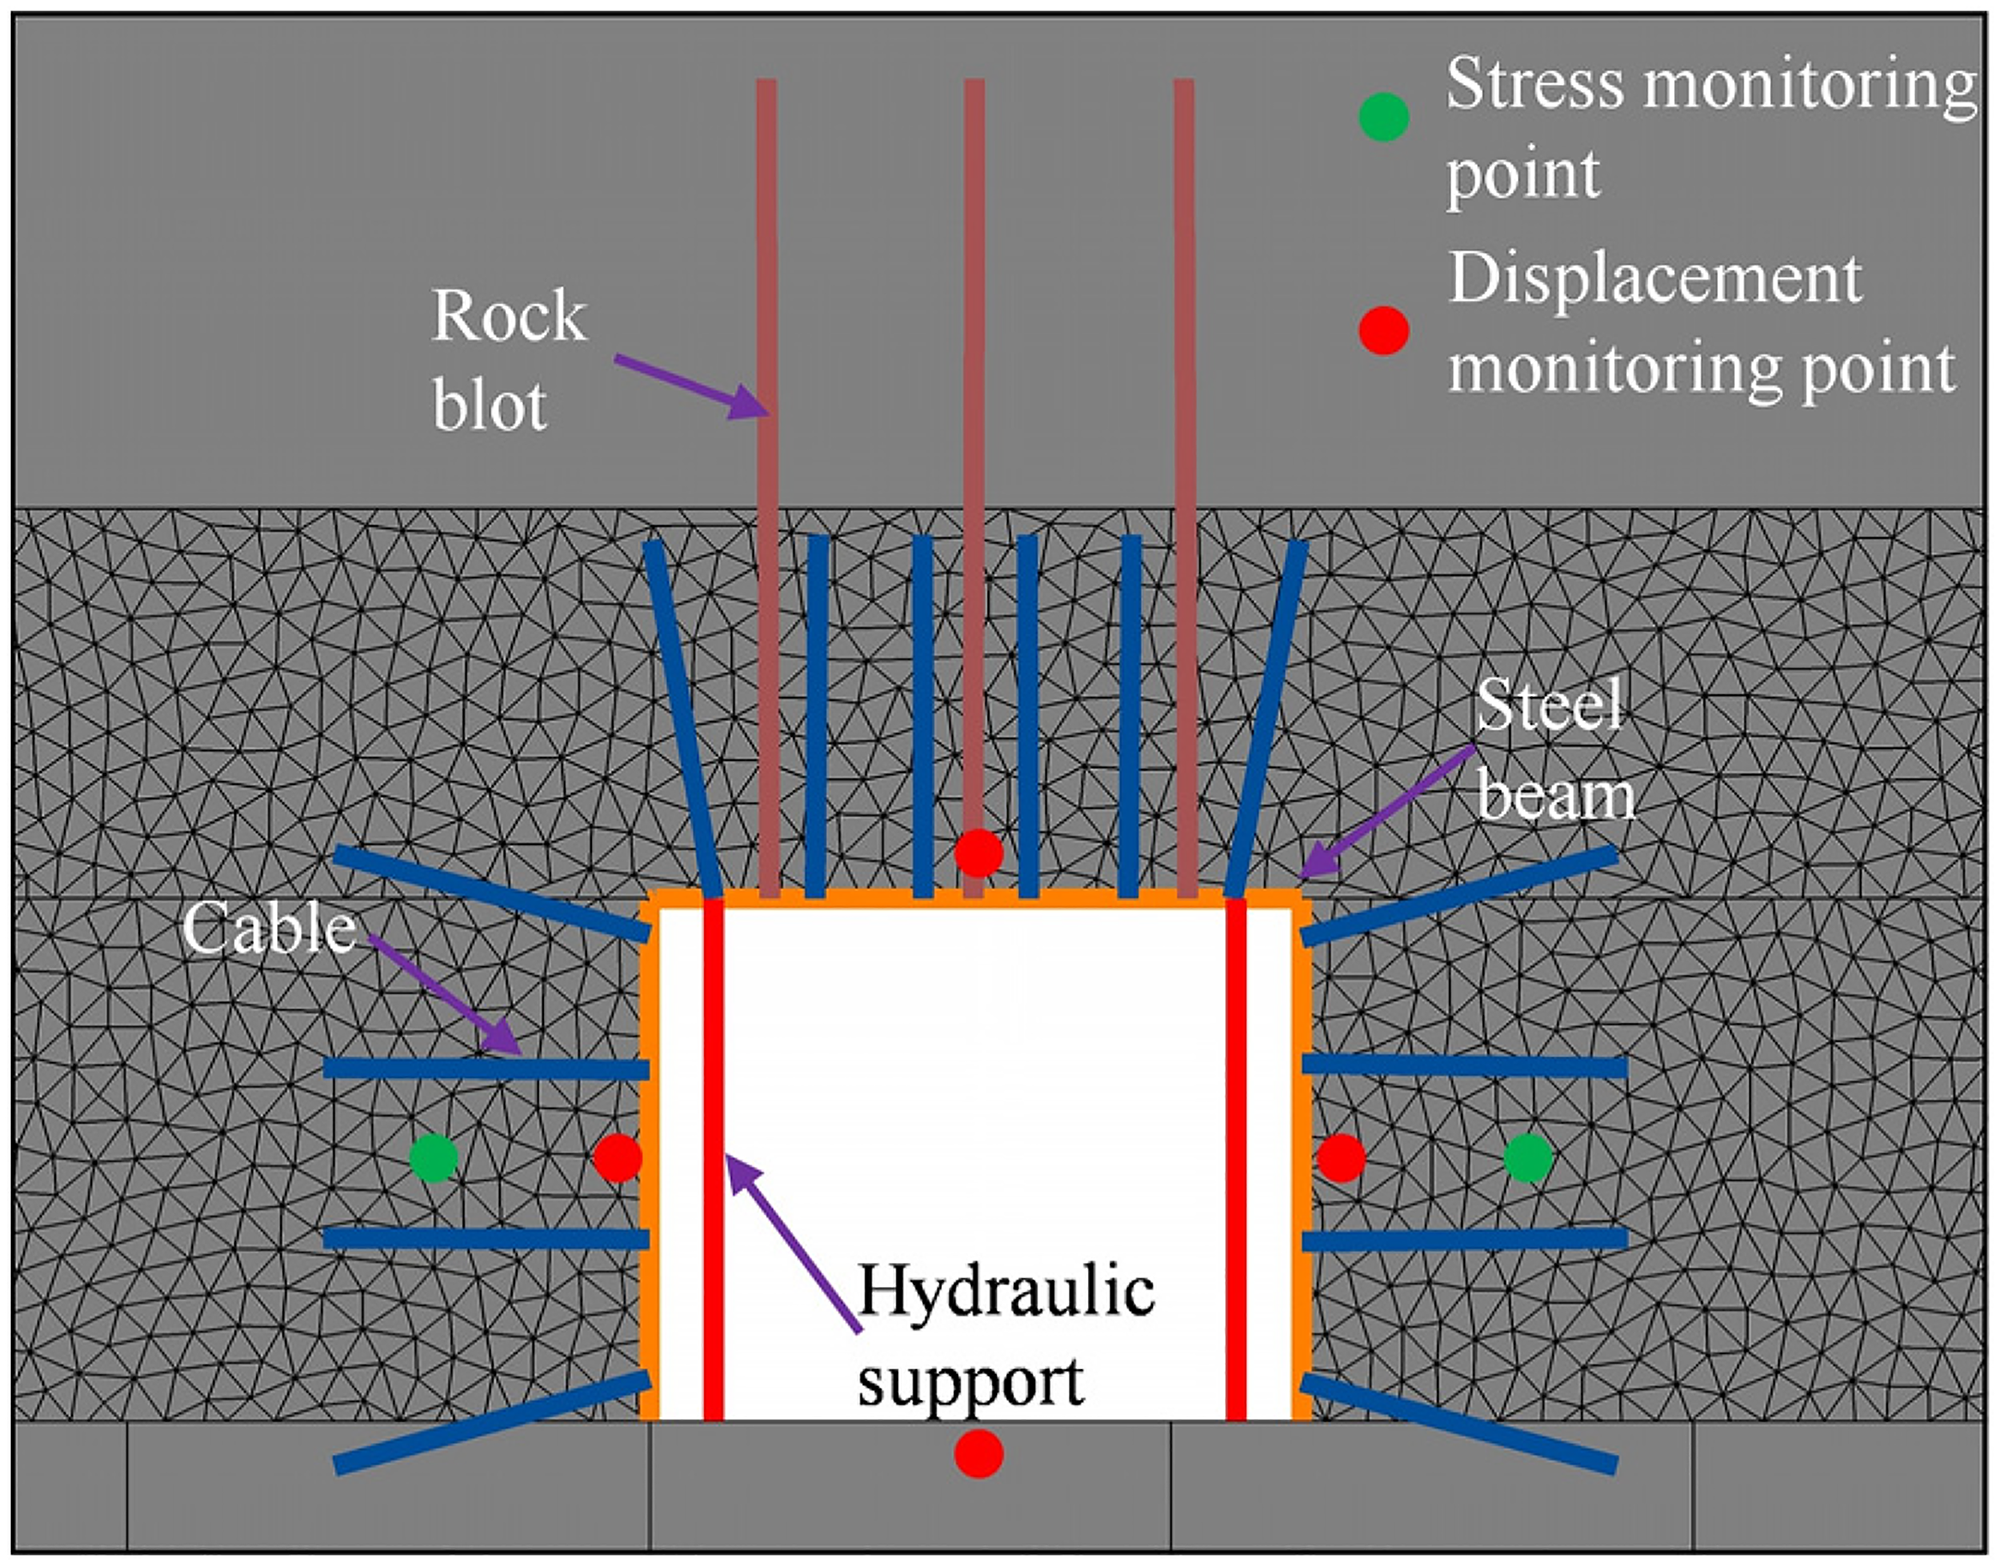
Roadway support method and arrangement of monitoring points.
Support elements properties in UDEC models.
Universal Distinct Element Code–Trigon was used to divide blocks near the roadway surrounding rock, studying the process of damage. Following Figure 7, establish the length of siltstone blocks within the numerical model. The length of the key block B, which is a subdivision of the sandstone layer, can be calculated using equation (Zhang and He, 2016):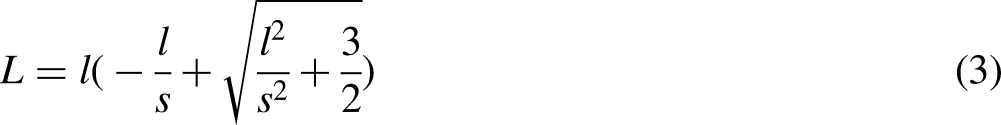
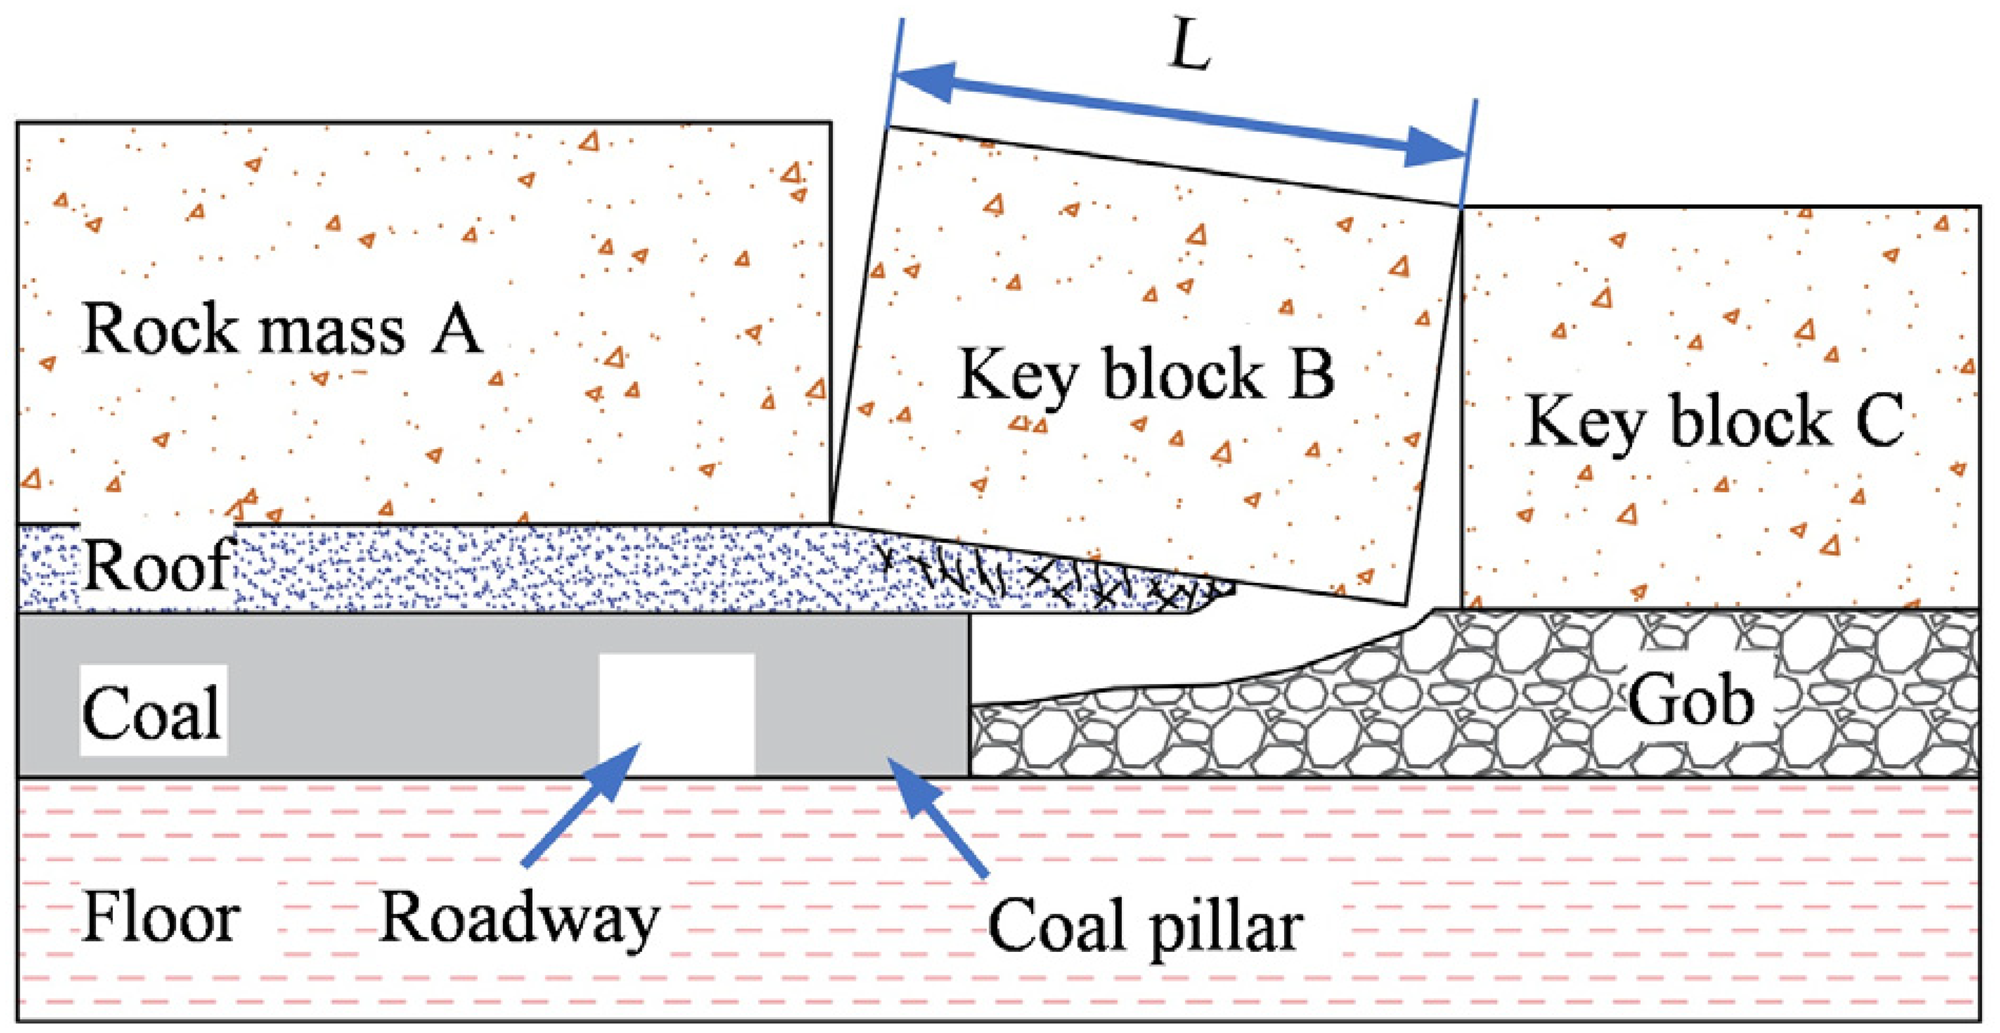
Mechanical model of overburdened rock structure roadway along gob.
where L represents the basic top lateral fracture step distance; s is the length of the advancing face; l is the step distance for periodic collapse.
The span of periodic collapse in the main roof can be calculated using equation (4):
Firstly, the bottom and sides of the model are fixed, and the overlying strata are represented by equivalent loads to get initial ground stress. Secondly, the roadway is excavated and supported by cable, rock bolts, hydraulic prop and a steel beam, while the upper mining face is also excavated. Subsequently, solving the model provides the static stress state and deformation before dynamic stress disturbance. Moreover, to absorb the seismic waves at the model boundaries during dynamic calculations, the model boundaries are transformed into viscous boundaries. Finally, considering the attenuation of seismic waves due to the damping effect of the rock mass during propagation (Bouchaala et al., 2016; Matsushima et al., 2018), this model utilizes Rayleigh damping with a damping ratio of 0.02 (Cao et al., 2023a). Based on seismic theory, we assume that the seismic waves from the seismic source are sine waves and apply them to the seismic source location in the model shown in Figure 4. Seismic waveforms near the rib spalling events exhibit high-amplitude frequencies concentrated between 20 and 100 Hz. To explore the impact of amplitude and frequency on roadway rib spalling, we conducted a comparative analysis under controlled variable conditions, varying amplitudes from 1 m to 4 m and frequencies from 20 Hz to 100 Hz.
Results and analyses
Roadway surrounding rock seismic response characteristics
Figure 8 illustrates the seismic vibration response process of the coal-rock mass after applying a single complete sine wave with a frequency of 50 Hz. Starting from the seismic source, the roof vibrates in upward and downward directions, propagating in the form of shear waves towards the solid coal side. The orange-coloured region represents the upward vibration of the medium, while the green-coloured region represents the downward vibration of the medium. With the seismic wave propagating, the green-coloured vibration region exhibits geometrically spreading attenuation and its influence region gradually increases.
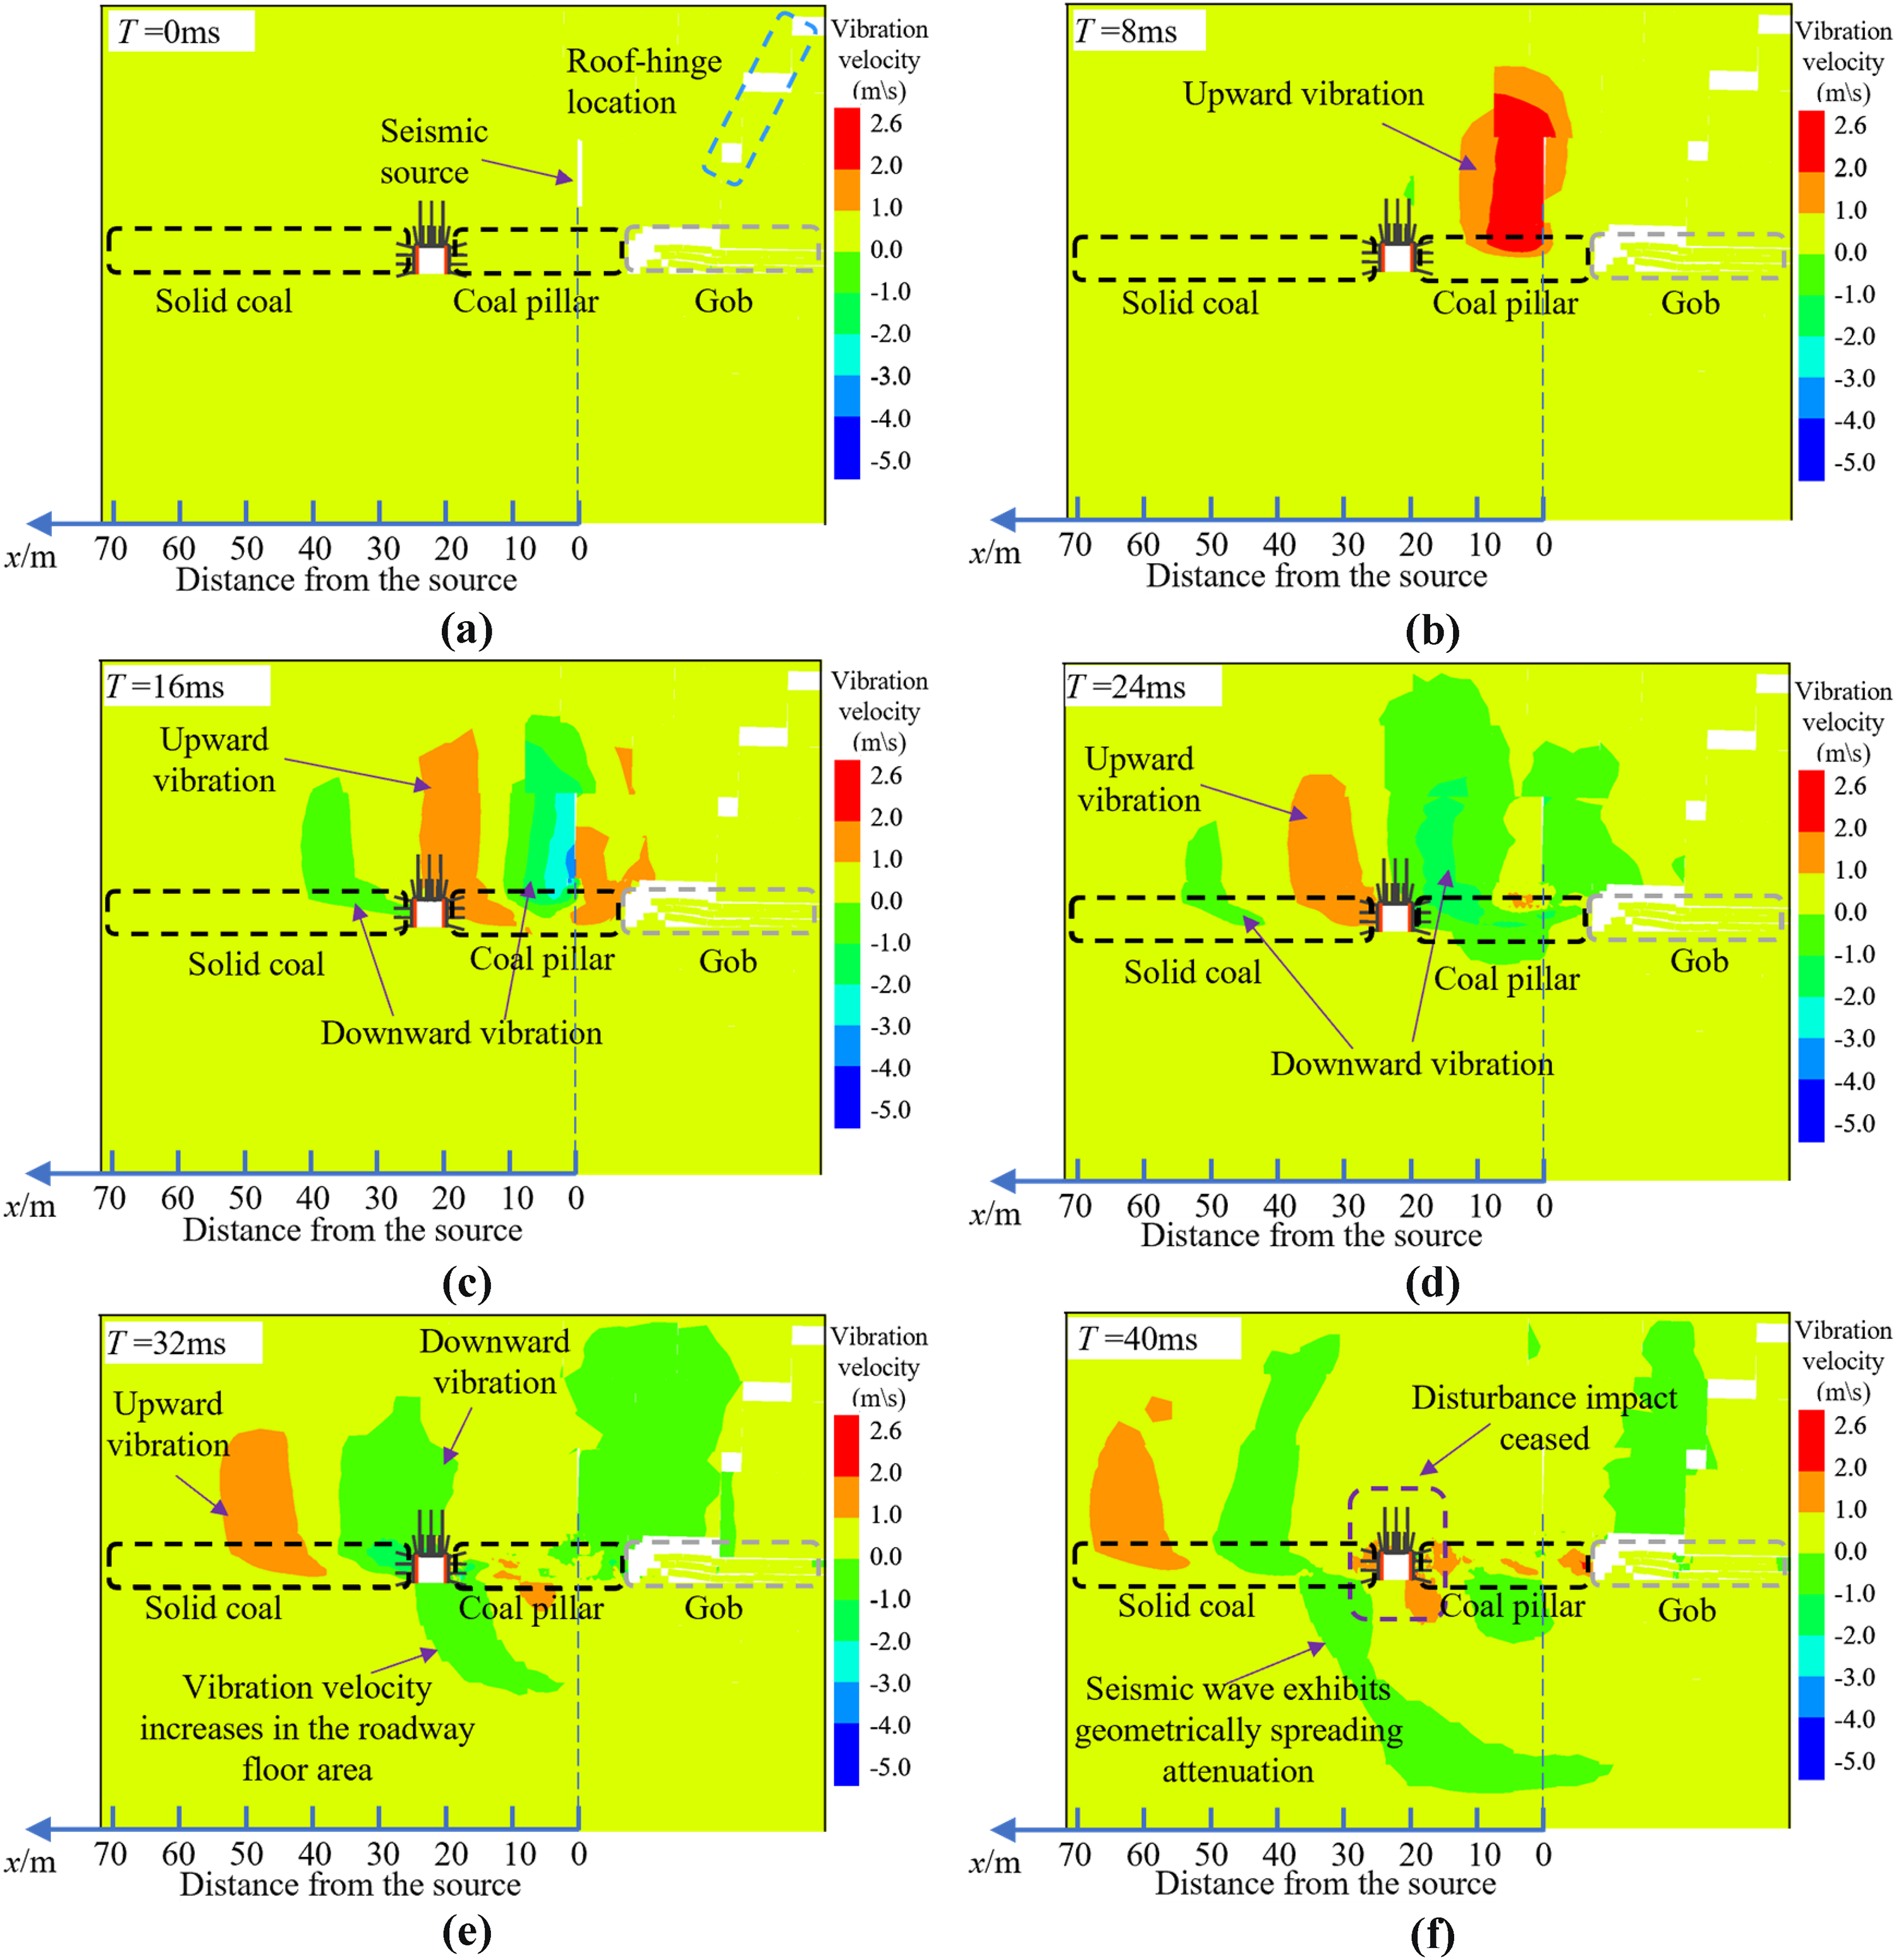
Characteristic of roadway surrounding rock vibration response. (a) dynamic load time = 0 s; (b) dynamic load time = 0.008 s; (c) dynamic load time = 0.016 s; (d) dynamic load time = 0.0024 s; (e) dynamic load time = 0.032 s; (f) dynamic load time = 0.040 s.
Figure 9 illustrates the entire process of roof vibration under the influence of seismic waves. With the seismic wave propagates, the roof present a vibrational characteristic with an influence area for a length of 36 m. Within this effect, the initial 18 m of the vibrational affect area are upward direction, whereas the subsequent 18 m exhibit a downward direction. Based on the exponential decay law (Bouchaala et al., 2014), an attenuation formula for the seismic wave with a coefficient of determination of 0.95 was given in equation (5). The velocity attenuation pattern derived from numerical simulations conforms to the general trend of attenuation, thereby substantiating the validity of this numerical simulation:
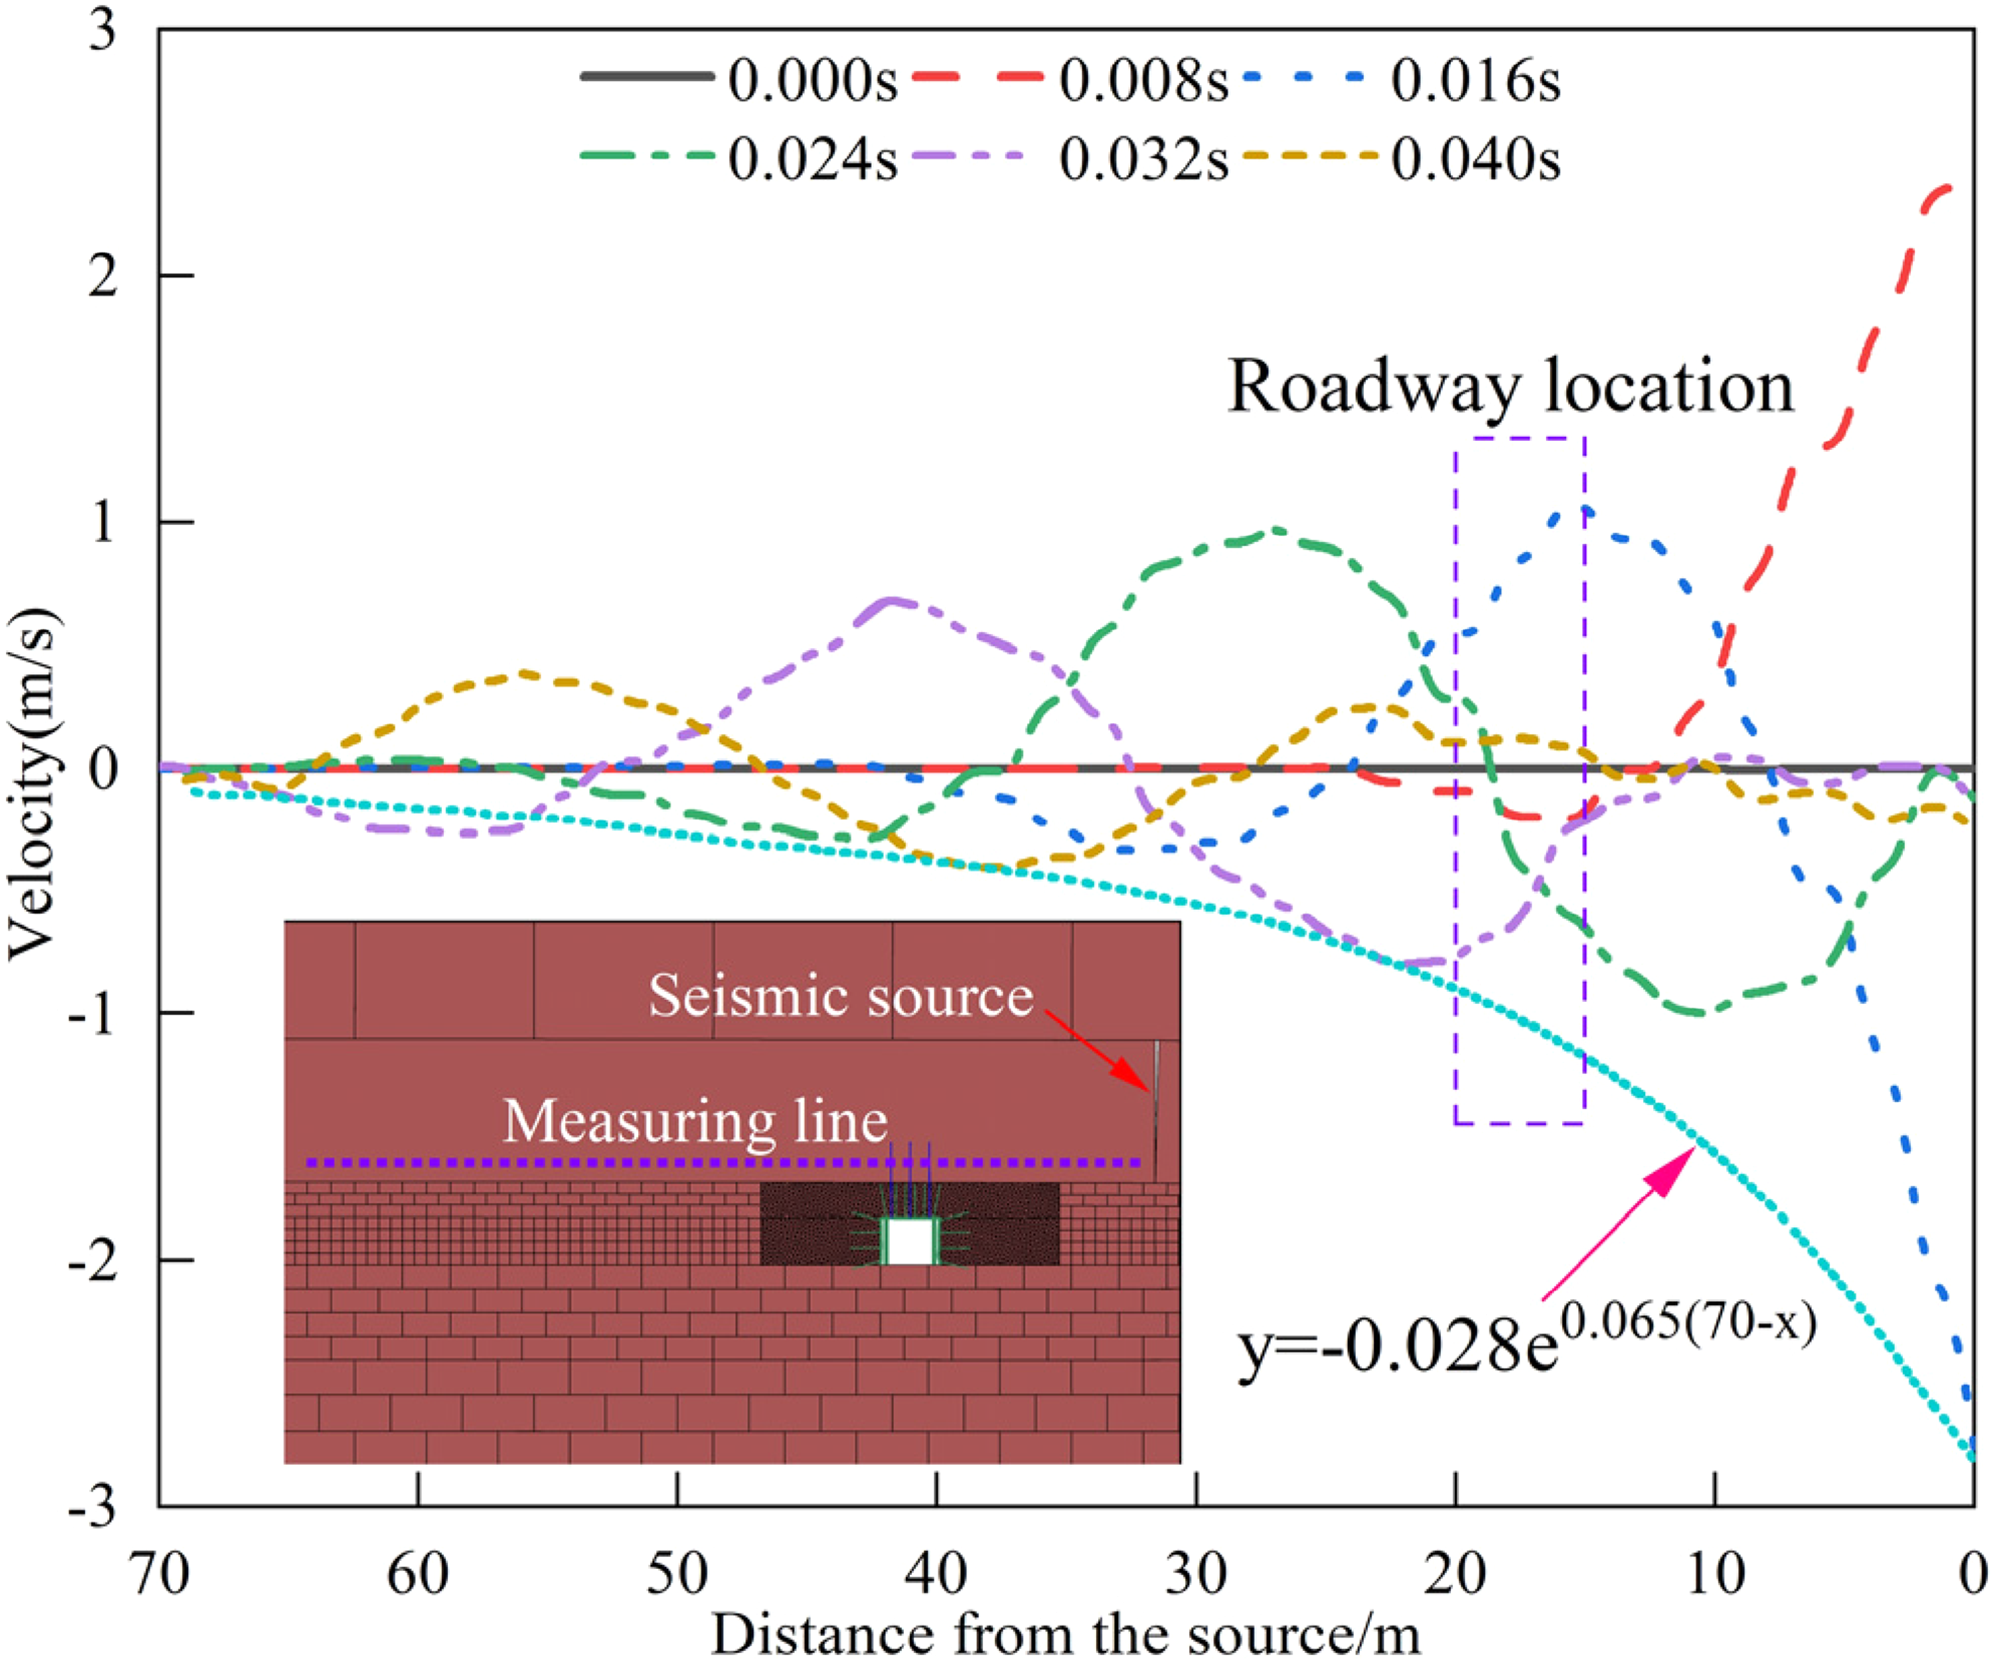
Attenuation law of seismic waves.
where x is the distance of the particle from the seismic source, and y is the vibration velocity of the particle.
Evolution of stress in roadway surrounding rock
Figure 10 illustrates the evolution process of the maximum principal stress in the roadway surrounding rock under the influence of seismic waves. By comparing (a)–(b) in Figure 8, it can be observed that the roof above the coal pillar starts to vibrate upwards from the source. This leads to stress concentration in the upper region of the roof, as shown in Figure 10(b) (red-outlined section). After dynamic loading disturbance, the red-outlined section experiences an increase in stress from 18 MPa to 25 MPa, affecting an area of approximately 120 m². When the seismic source vibrates downward, the contact area between the coal pillar and the roof experiences stress concentration, with a factor of 1.3 and affecting an area of approximately 60 m², as shown in Figure 10(c). Under the influence of the downward vibration, a stress concentration zone forms on the right floor of the roadway. The stress concentration coefficient is 1.24, affecting an area of approximately 3 m², as shown in Figure 10(e). This provides an important force source for the delamination instability of the roadway right sidewall. As the seismic wave continues to propagate, disturbances in the roadway surrounding rock dissipate, returning to its stress state before the disturbance, as shown in Figure 10(f).
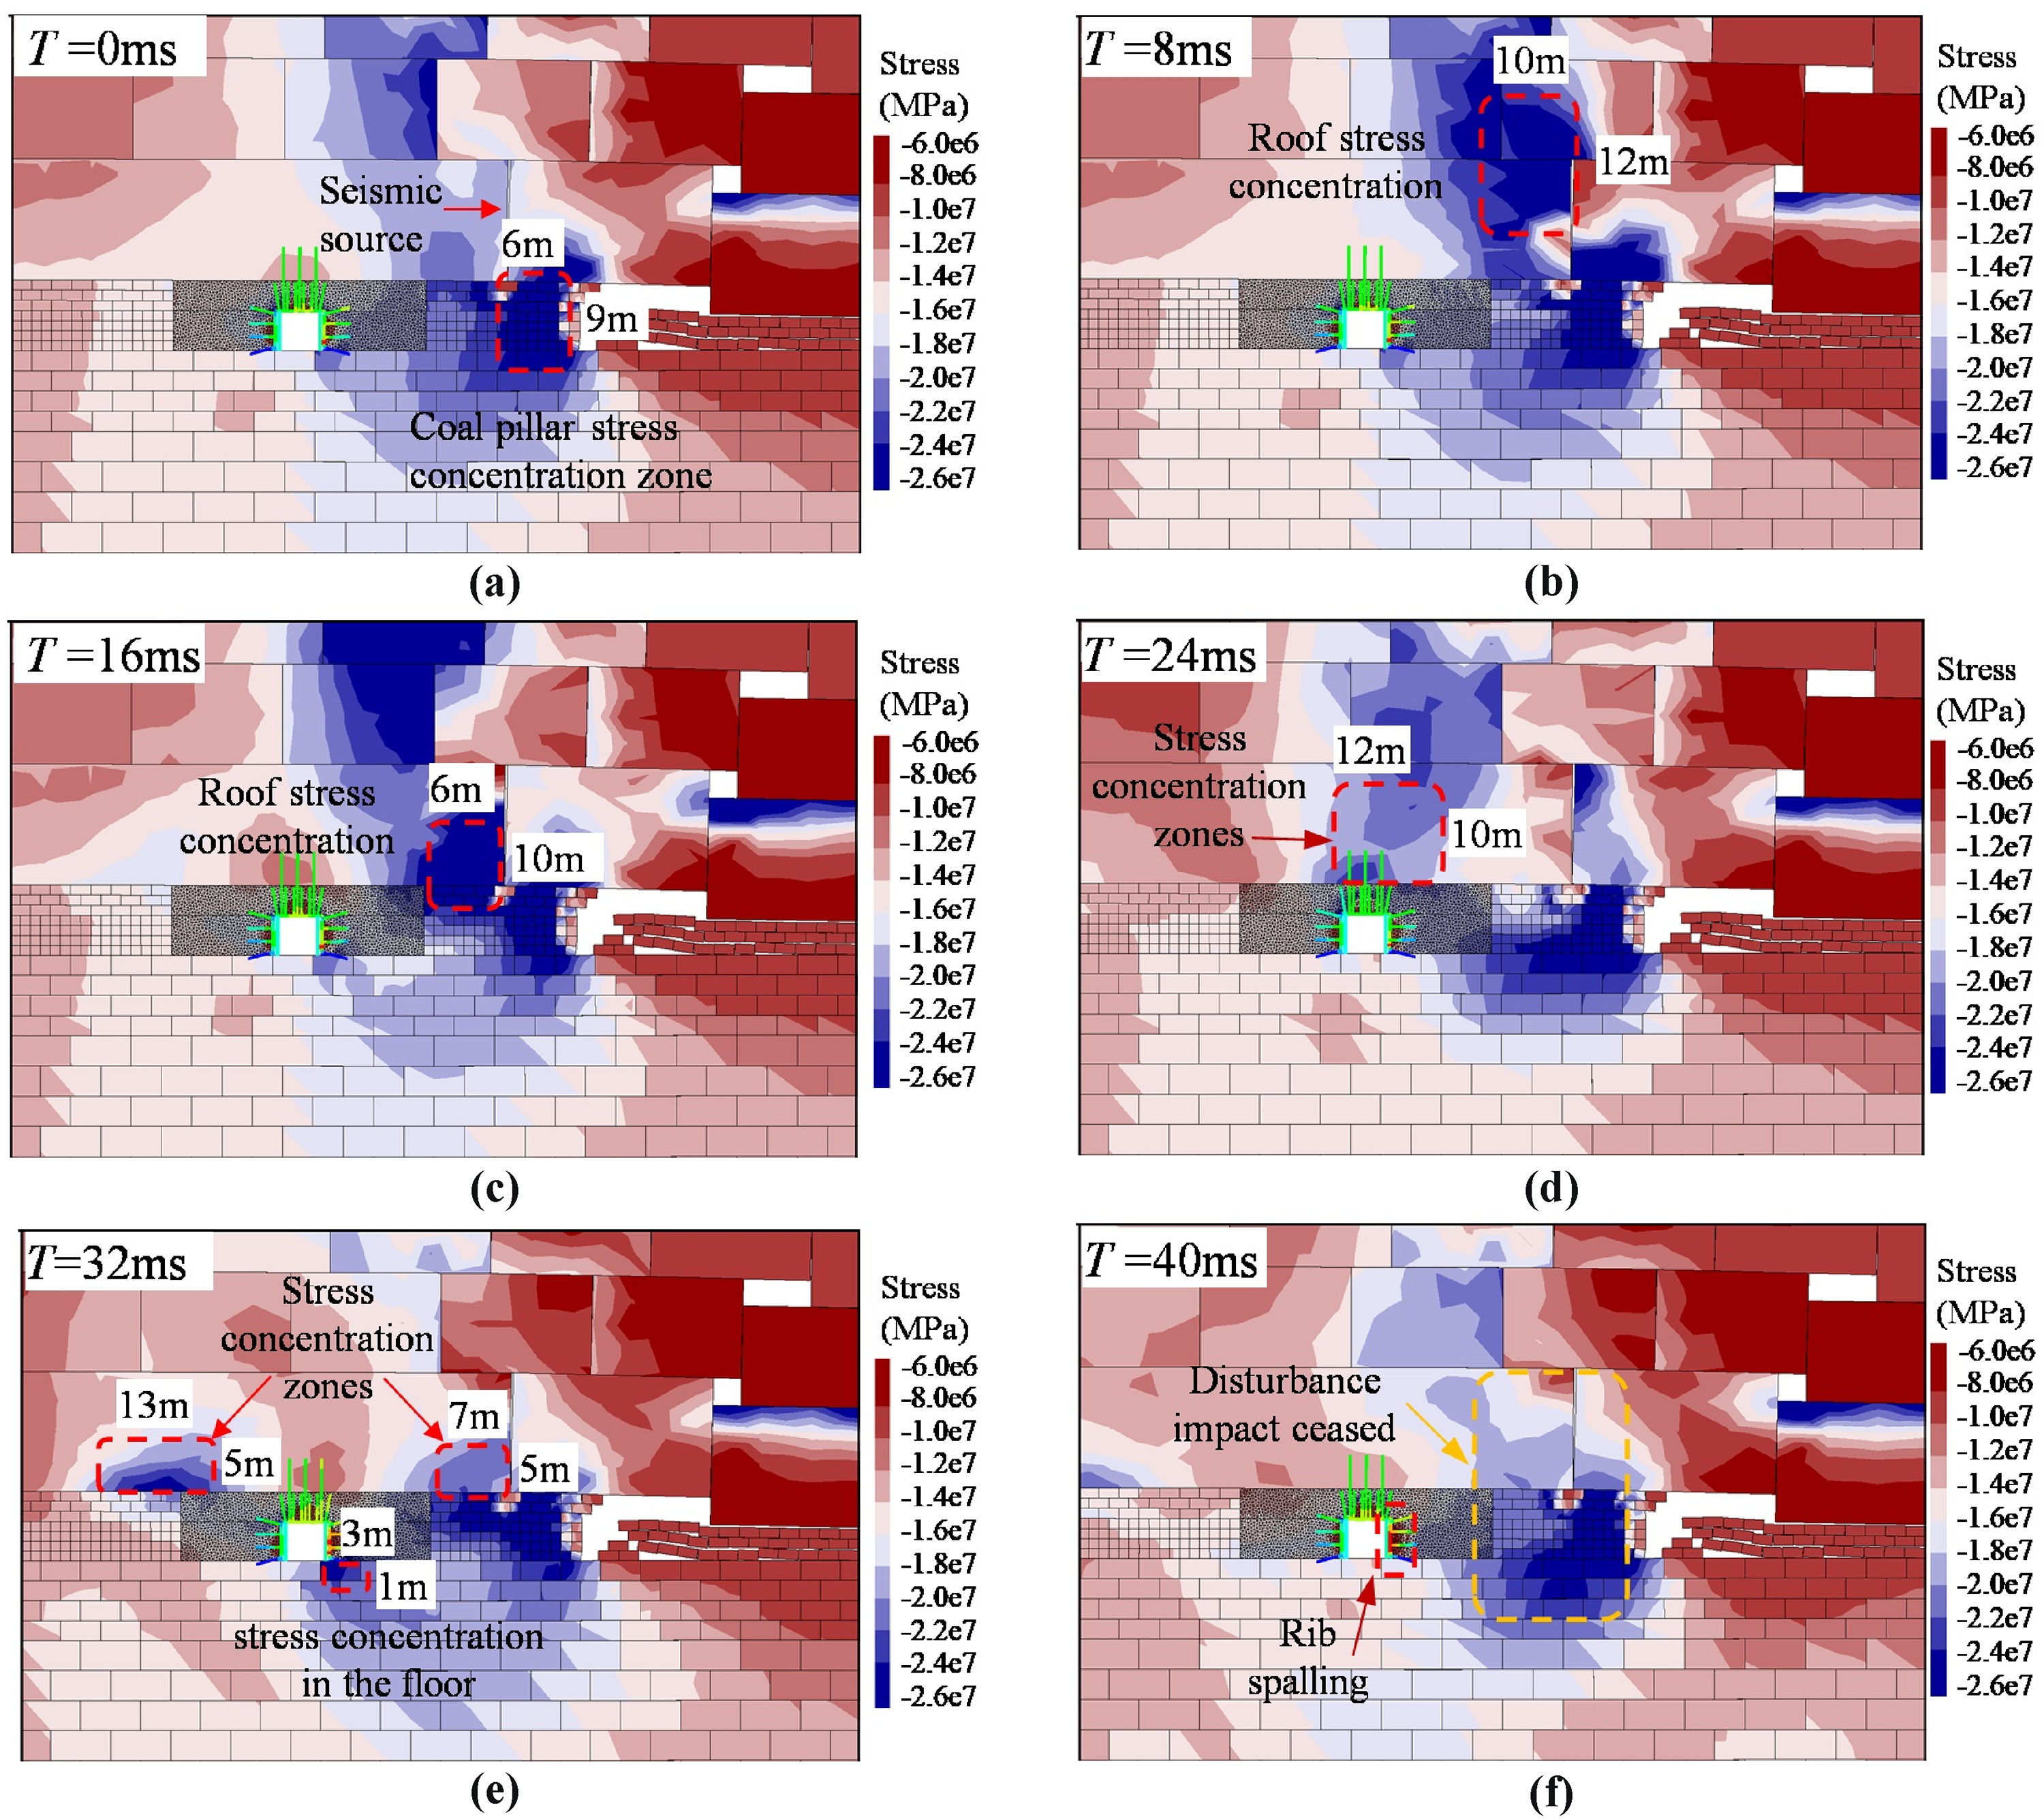
Evolution of maximum principal stress in roadway surrounding rock. (a) dynamic load time = 0 s; (b) dynamic load time = 0.008 s; (c) dynamic load time = 0.016 s; (d) dynamic load time = 0.0024 s; (e) dynamic load time = 0.032 s; (f) dynamic load time = 0.040 s.
At 24 ms under dynamic loading disturbance, two distinct areas of upward and downward vibration, each with a range of 18 m, as shown in Figure 11, have formed. Consequently, under these conditions of opposite vibration directions, stress concentration occurs in the central regions of these areas, exhibiting maximum principal stress within a range of 18 m.
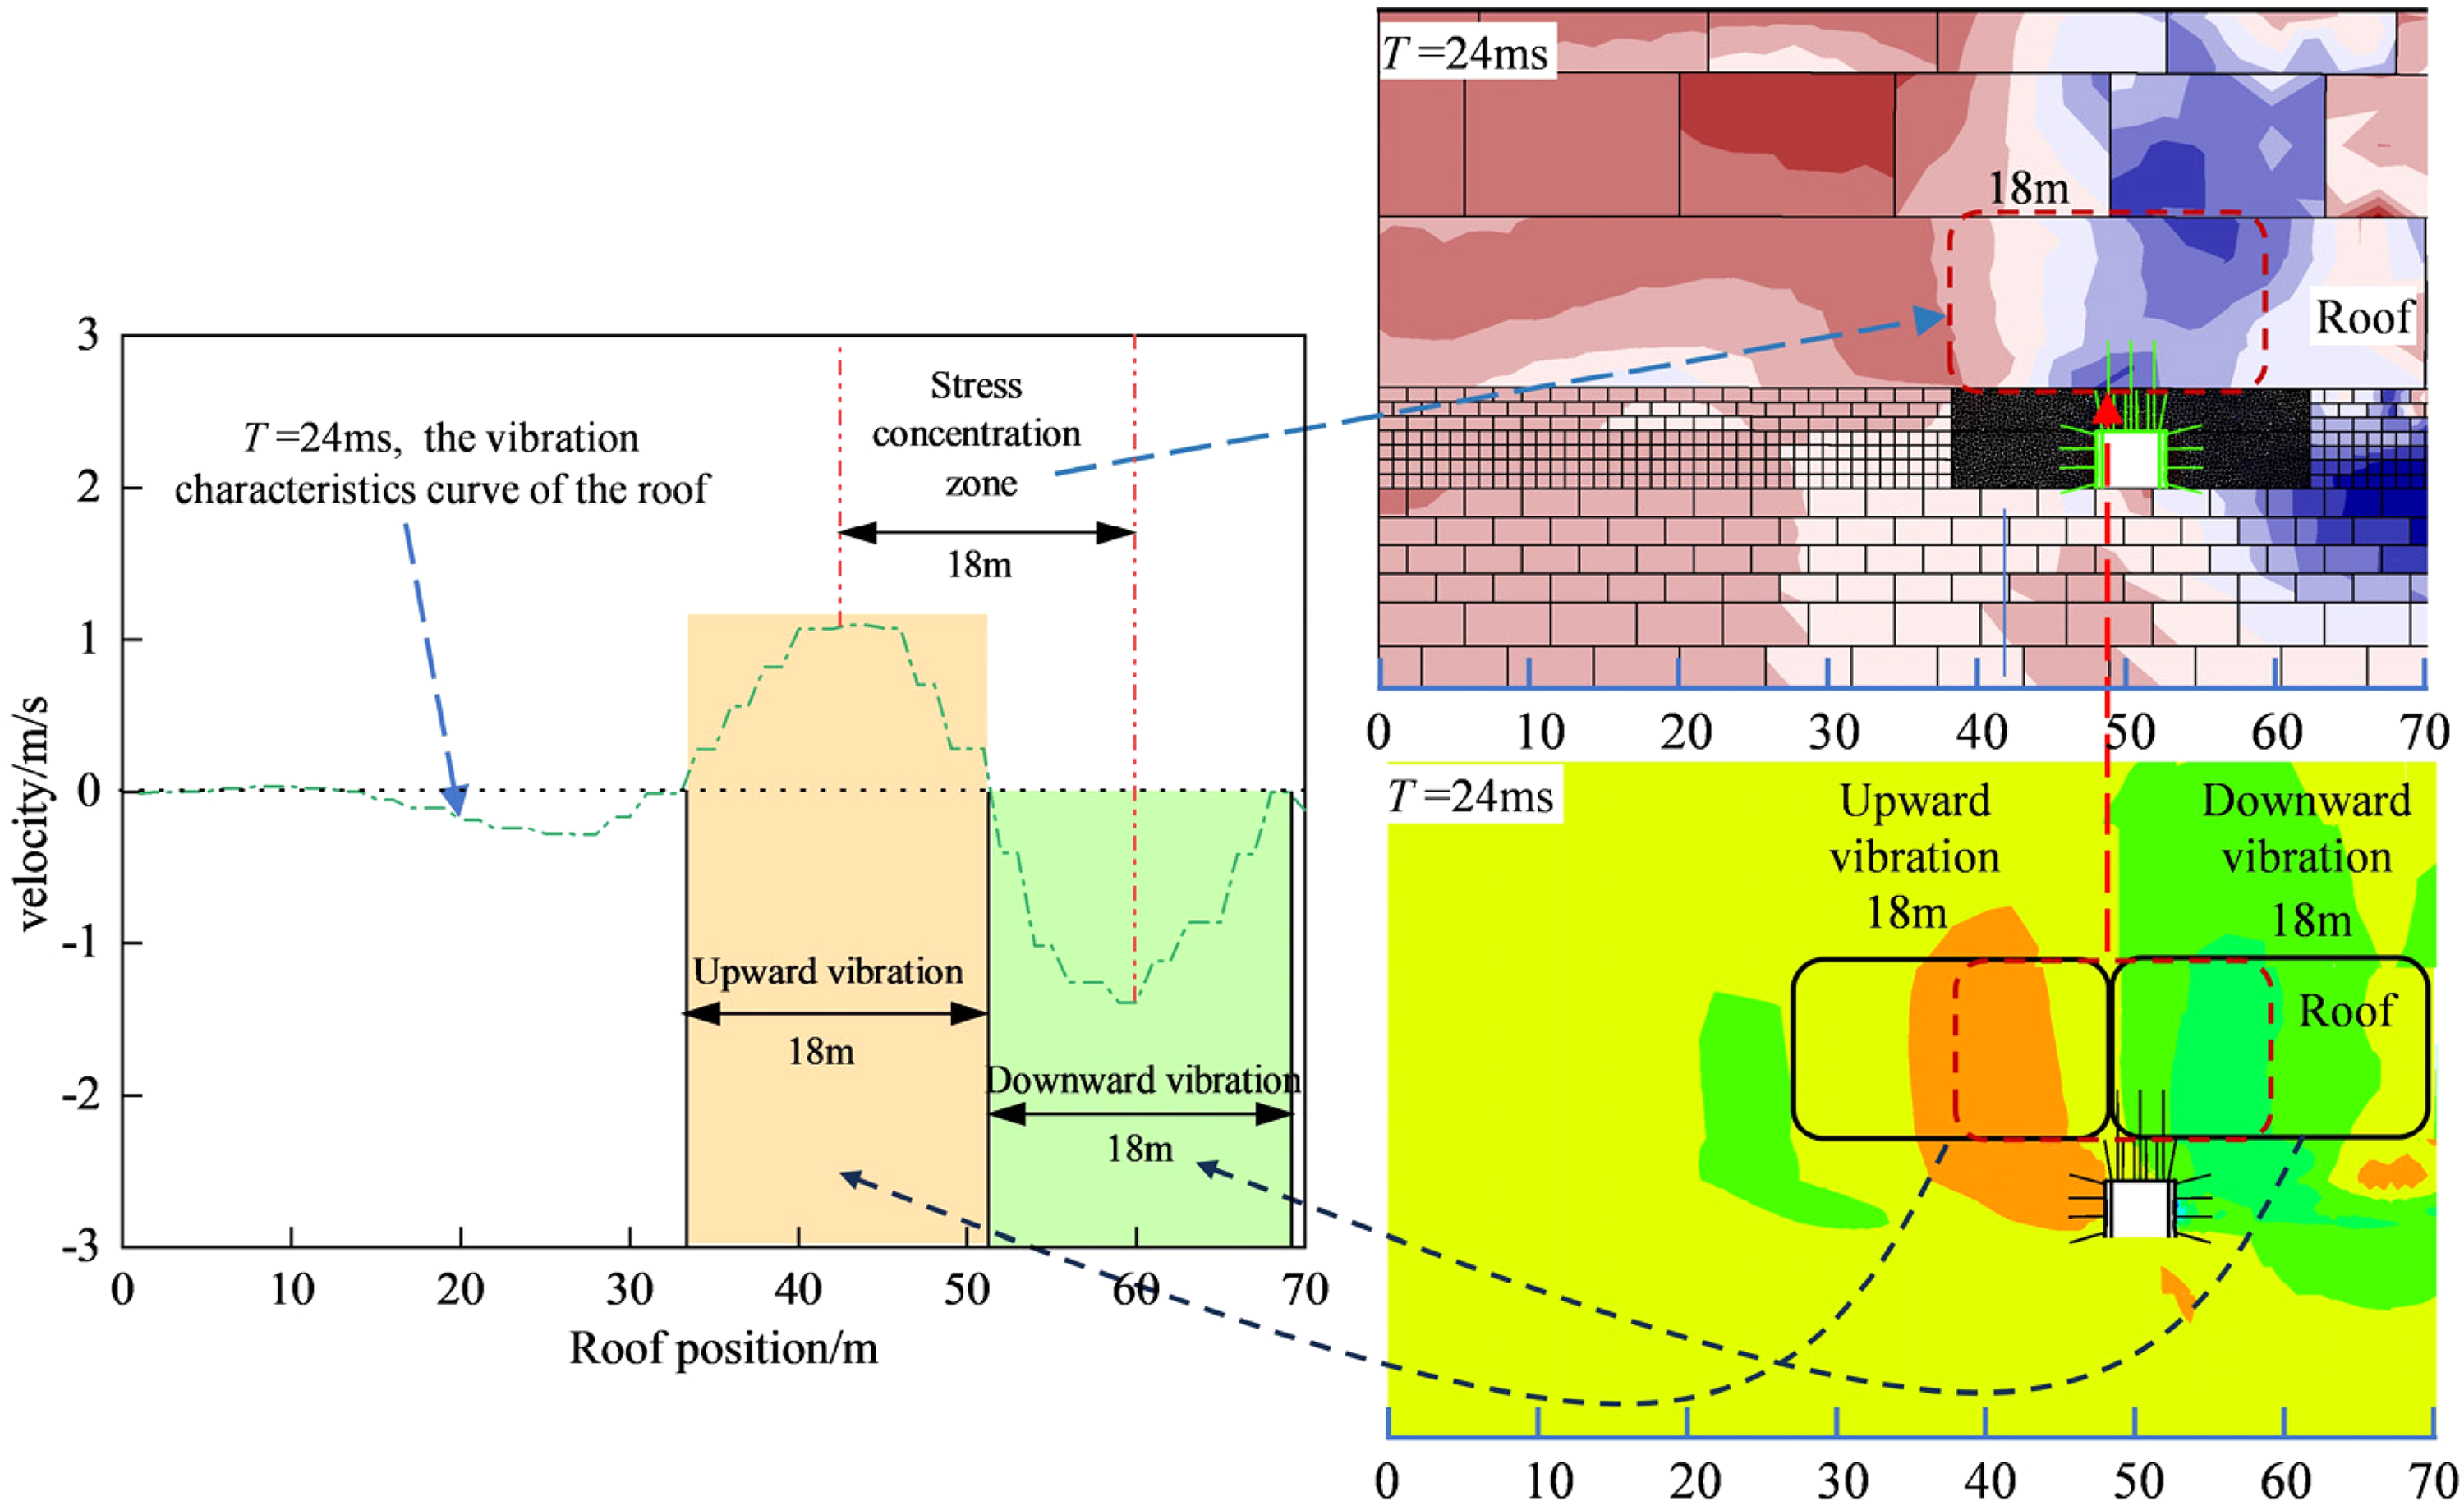
Vibration characteristics and distribution of maximum principal stress.
Roadway surrounding rock damage and failure process induced by mining-induced seismicity
Figure 12 presents the development process of tensile cracks and shear cracks in the roadway surrounding rock under the influence of seismic waves. After the dynamic stress disturbance subsides, the right rib displacement reaches 0.120 m, while the roof displacement reaches 0.014 m and the floor displacement reaches 0.012 m. The left rib displacement is only 0.005 m. Corresponding to the propagation process of the seismic waves in Figure 8 (a)–(f), it can be observed that under the influence of the green-coloured vibration region, the right shoulder area of the roadway experiences shear failure first.
Damage and failure of roadway surrounding rock. (a) dynamic load time = 0 s; (b) dynamic load time = 0.008 s; (c) dynamic load time = 0.016 s; (d) dynamic load time = 0.0024 s; (e) dynamic load time = 0.032 s; (f) dynamic load time = 0.040 s.
With the seismic waves propagate, shear failure also occurs in the roadway's left shoulder area (indicated by the orange cracks in Figure 12). When the green-coloured seismic vibration fully reached the roadway area, the shear failure damage in the roadway's right sidewall increased significantly, and the number of tensile failure cracks in the roof also increased. With the seismic wave continuing to propagate towards the solid coal, the damage and energy absorption in the roof and right sidewall resulted in relatively minor changes in the extent of damage in the roadway's left sidewall. The right sidewall experienced a significant increase in tensile failure under the green-coloured seismic vibration influence, eventually leading to roadway delamination and instability failure of the right sidewall. From the overall observation of Figure 12 (a)–(f), it can be concluded that under the perturbation of seismic waves, the extent and region of tensile damage in the roadway surrounding rock are the main factors determining the stability of the roadway.
Figure 13 illustrates the development pattern of damage cracks in the roadway surrounding rock. Under the influence of seismic waves, the number of cracks in the roadway surrounding rock gradually increases. When t = 0.032 s, the length of shear-induced cracks in the roadway surrounding rock reaches its peak. Combining this with Figure 8(e), it is evident that at this time the seismic wave fully propagated the roadway area. It is precisely under the dynamic stress caused by this seismic wave that the damage extent of roadway ribs and roof increased significantly, leading to the roadway being in a critical instability condition. After t > 0.032 s, the development rate of crack length in the roadway surrounding rock decreased gradually. This matches, Figure 8(f), where it can be observed that at this point, the disturbance of the roadway by dynamic stress was essentially coming to an end.
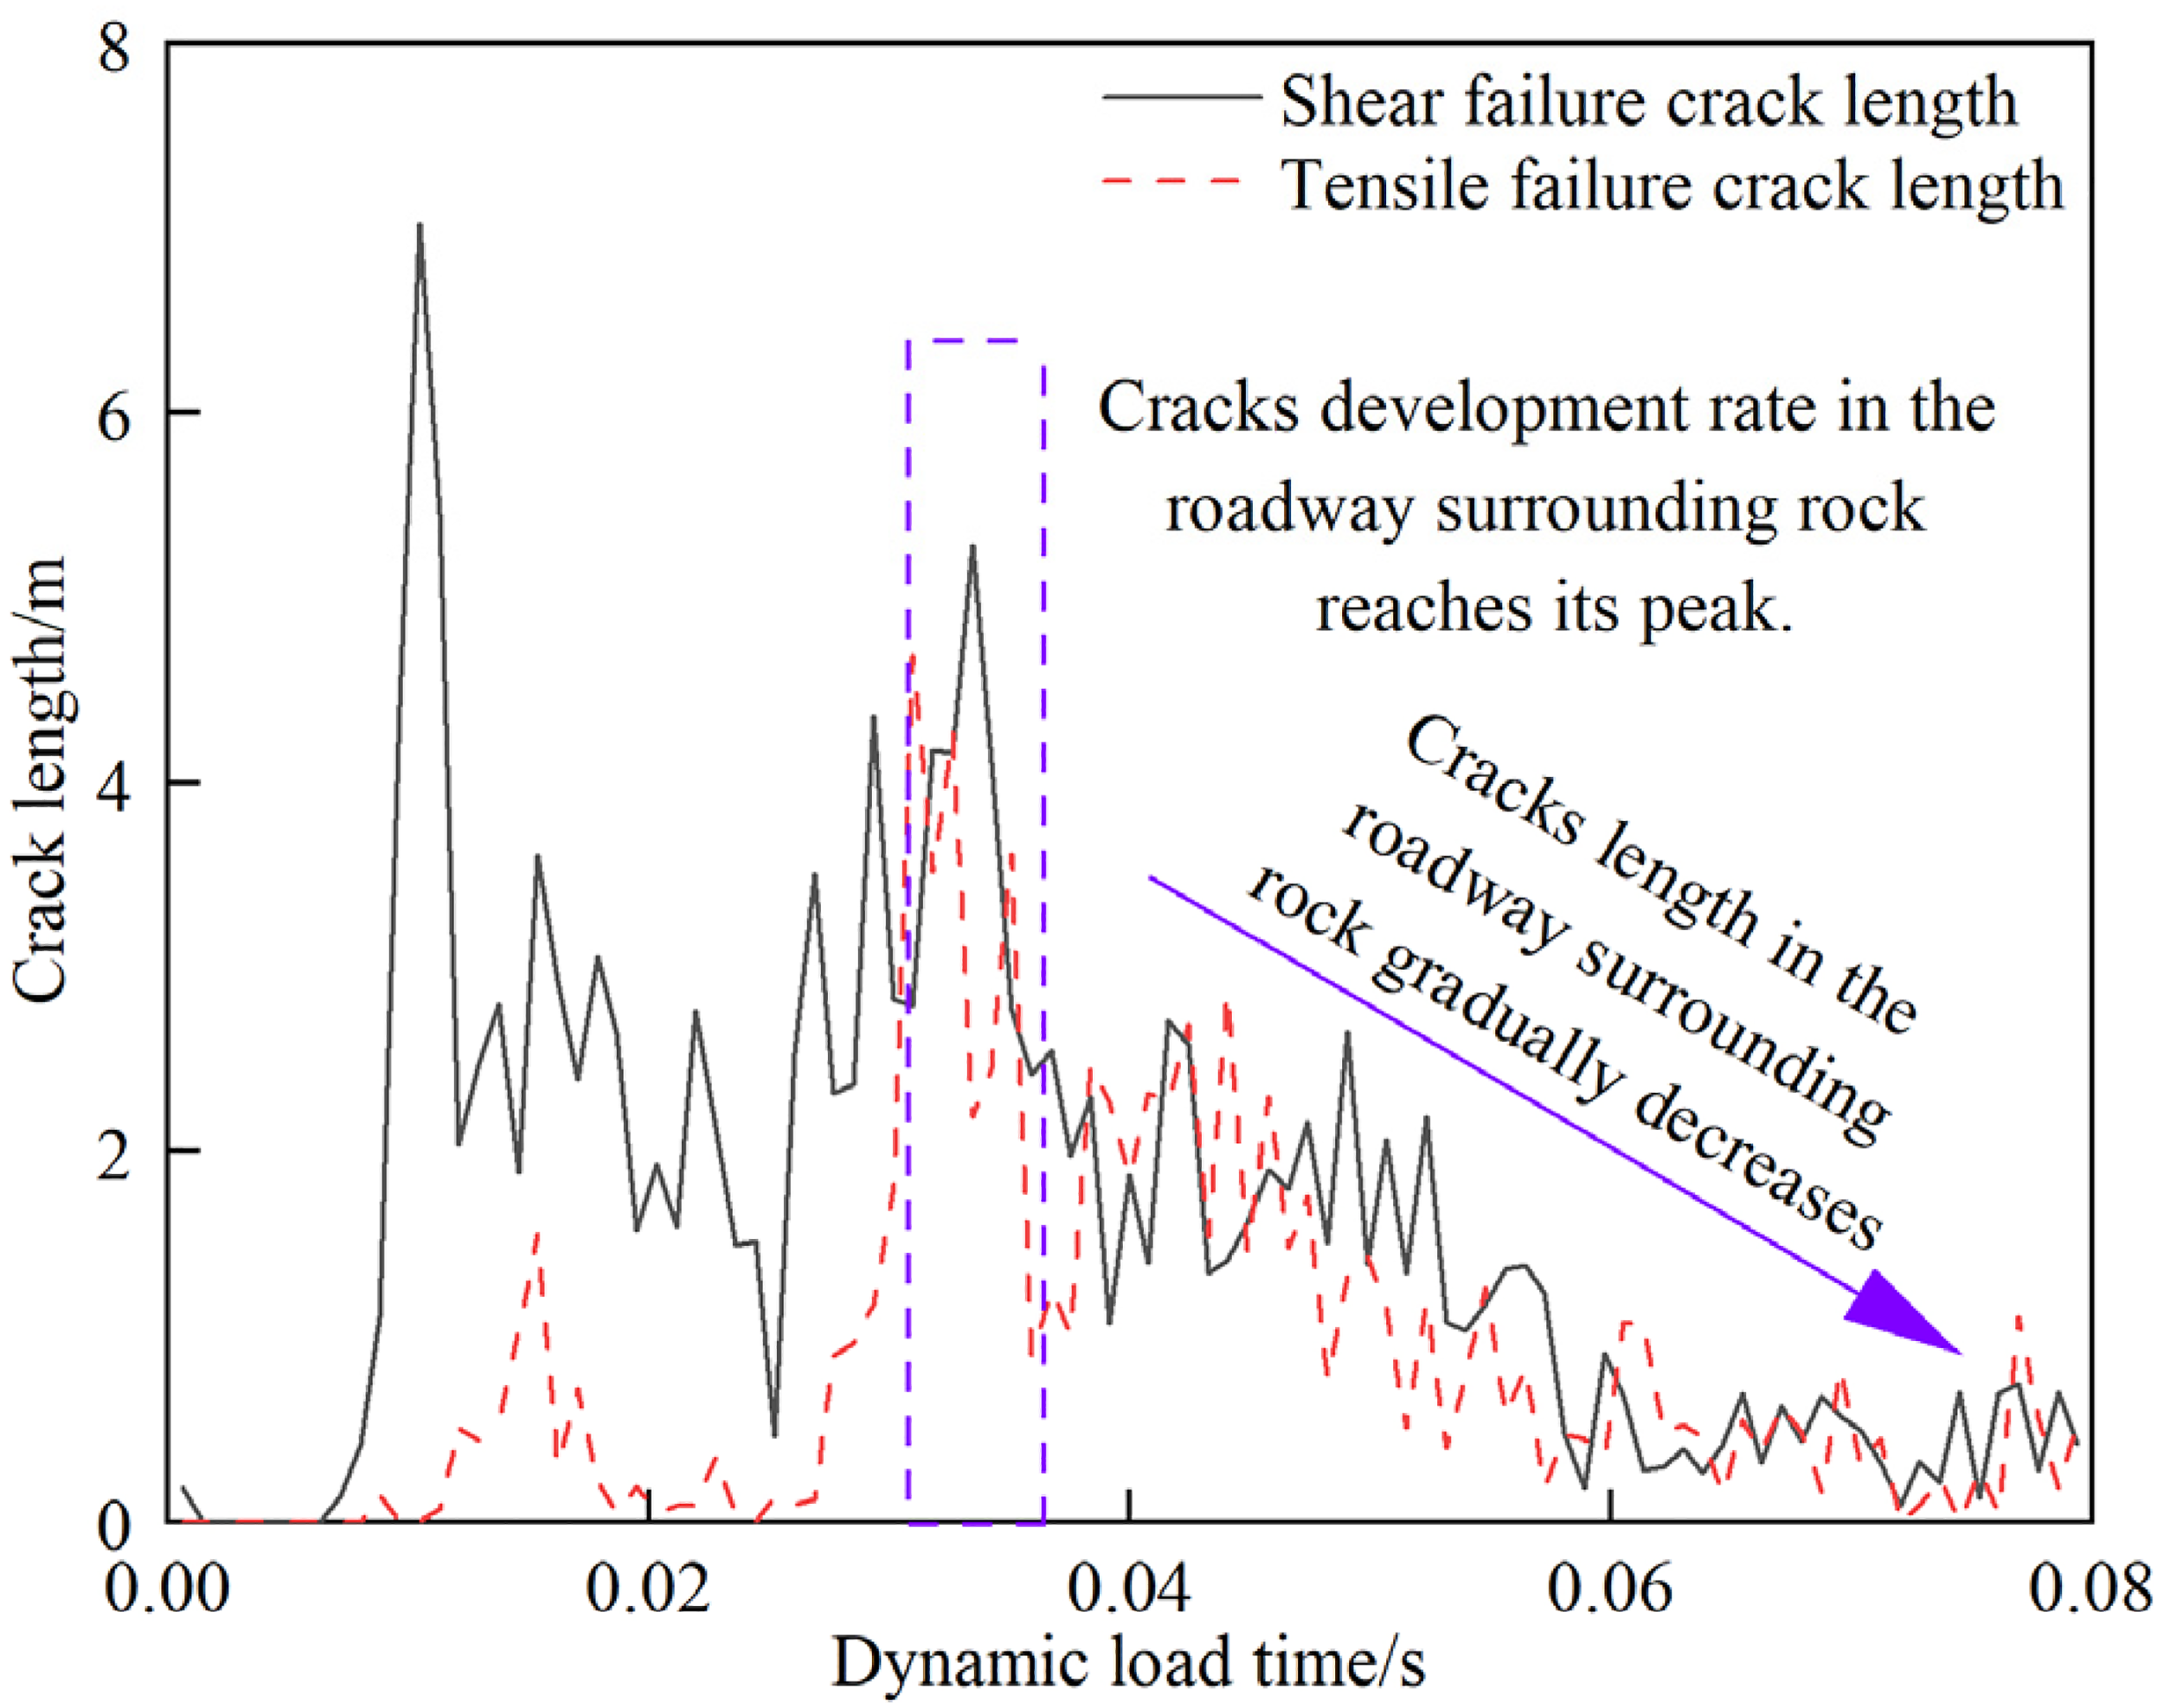
Development of damage-induced cracks in roadway surrounding rock.
Figure 14 shows the stress response characteristics of monitoring points in the roadway sidewall. Under dynamic stress, the vertical stresses on the left and right sidewalls of the roadway increased from 11.9 MPa and 15 MPa to 12.2 MPa and 15.5 MPa, respectively. The right side surrounding rock stress in the roadway peaks at t = 0.032 s due to vibration, causing deformation and failure on the roadway's right rib. After the cessation of seismic disturbance, the vertical stress at the monitoring point on the roadway's right sidewall decreases to 9.5 MPa. Part of the released stress affects the rock mass, resulting in its damage and failure, while another portion contributes to the driving force required for roadway delamination.
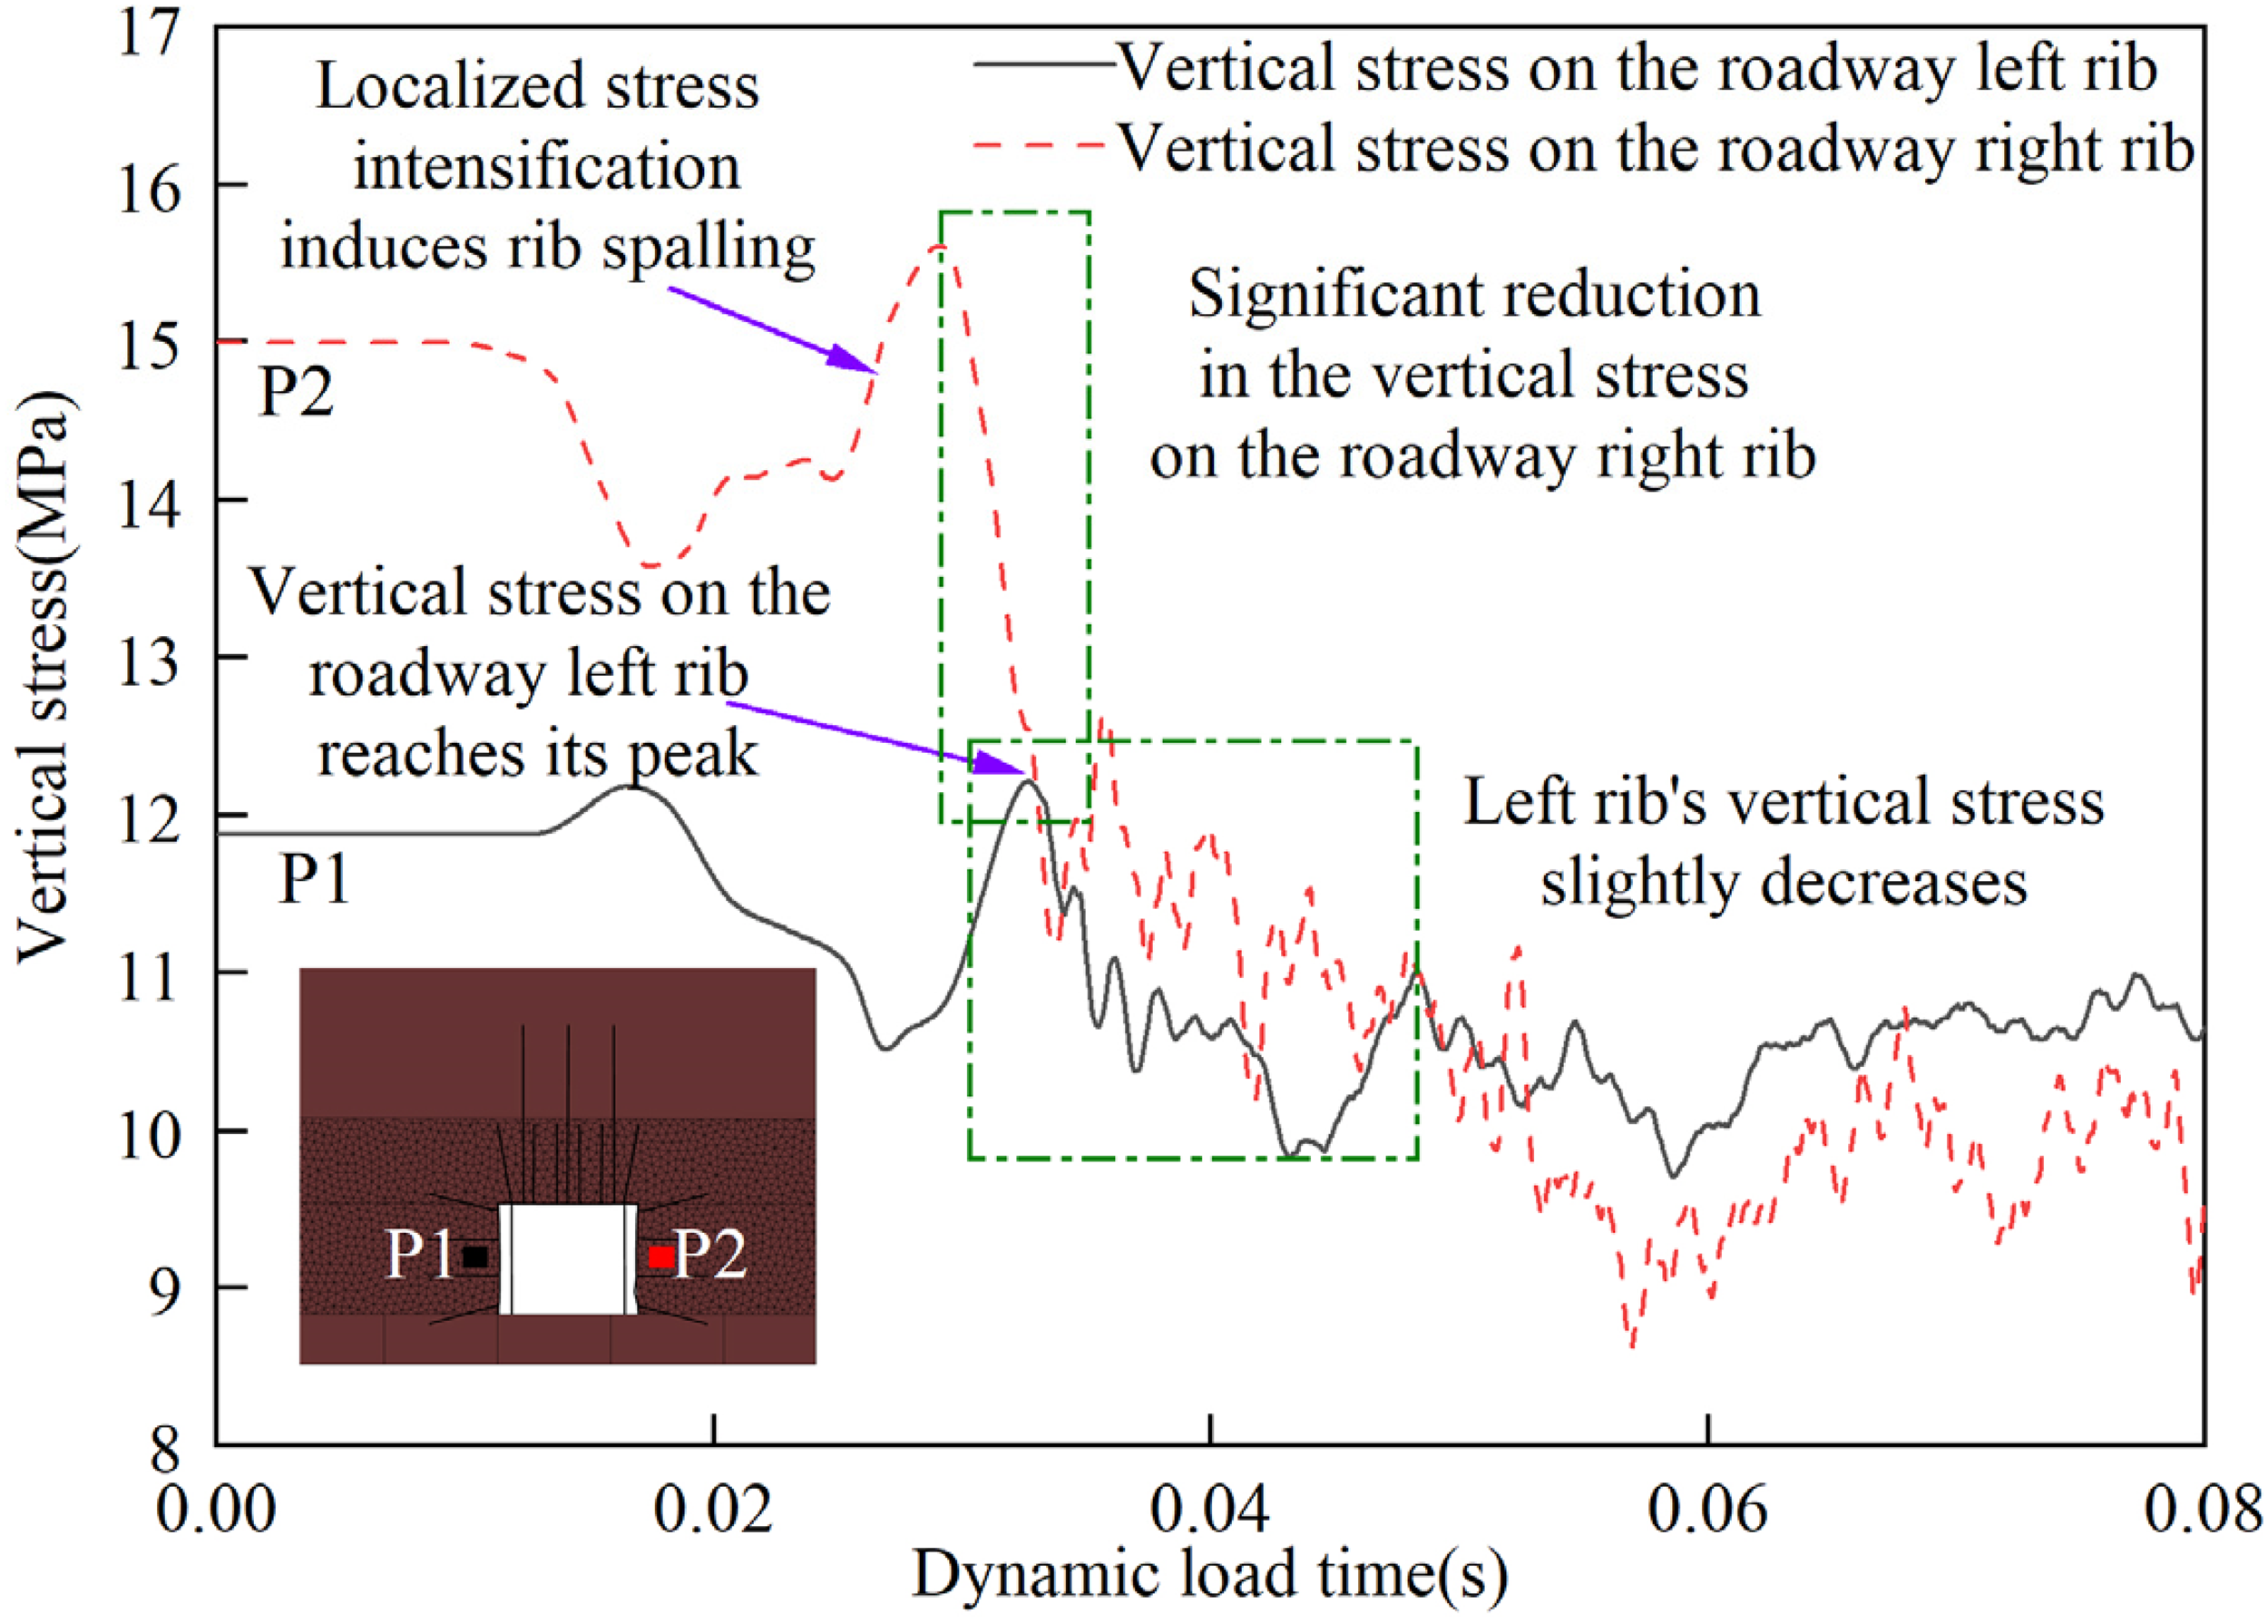
Stress response characteristics of roadway ribs.
Discussion
Seismic frequencies impact on roadway surrounding rock stress state
Figure 15 shows the state of maximum principal stresses in the roadway surrounding rock under different frequencies of seismic waves. As the frequency of seismic waves increases, the region of stress concentration in the roadway surrounding rock gradually decreases. Among them, the stress concentration in the roof is the most pronounced. When the frequencies of the seismic waves are 20 Hz, 40 Hz, 80 Hz and 100 Hz, the zones of stress concentration in the roof are 24 m, 20 m, 14 m and 10 m, respectively. The stress concentration factors are 1.5, 1.7, 1.3 and 1.2, respectively. The different stress concentration zones in the roadway surrounding rock result in different magnitudes and zones of loading forces that cause roadway failure and instability are different. Therefore, the extent and region of roadway rib spalling vary.
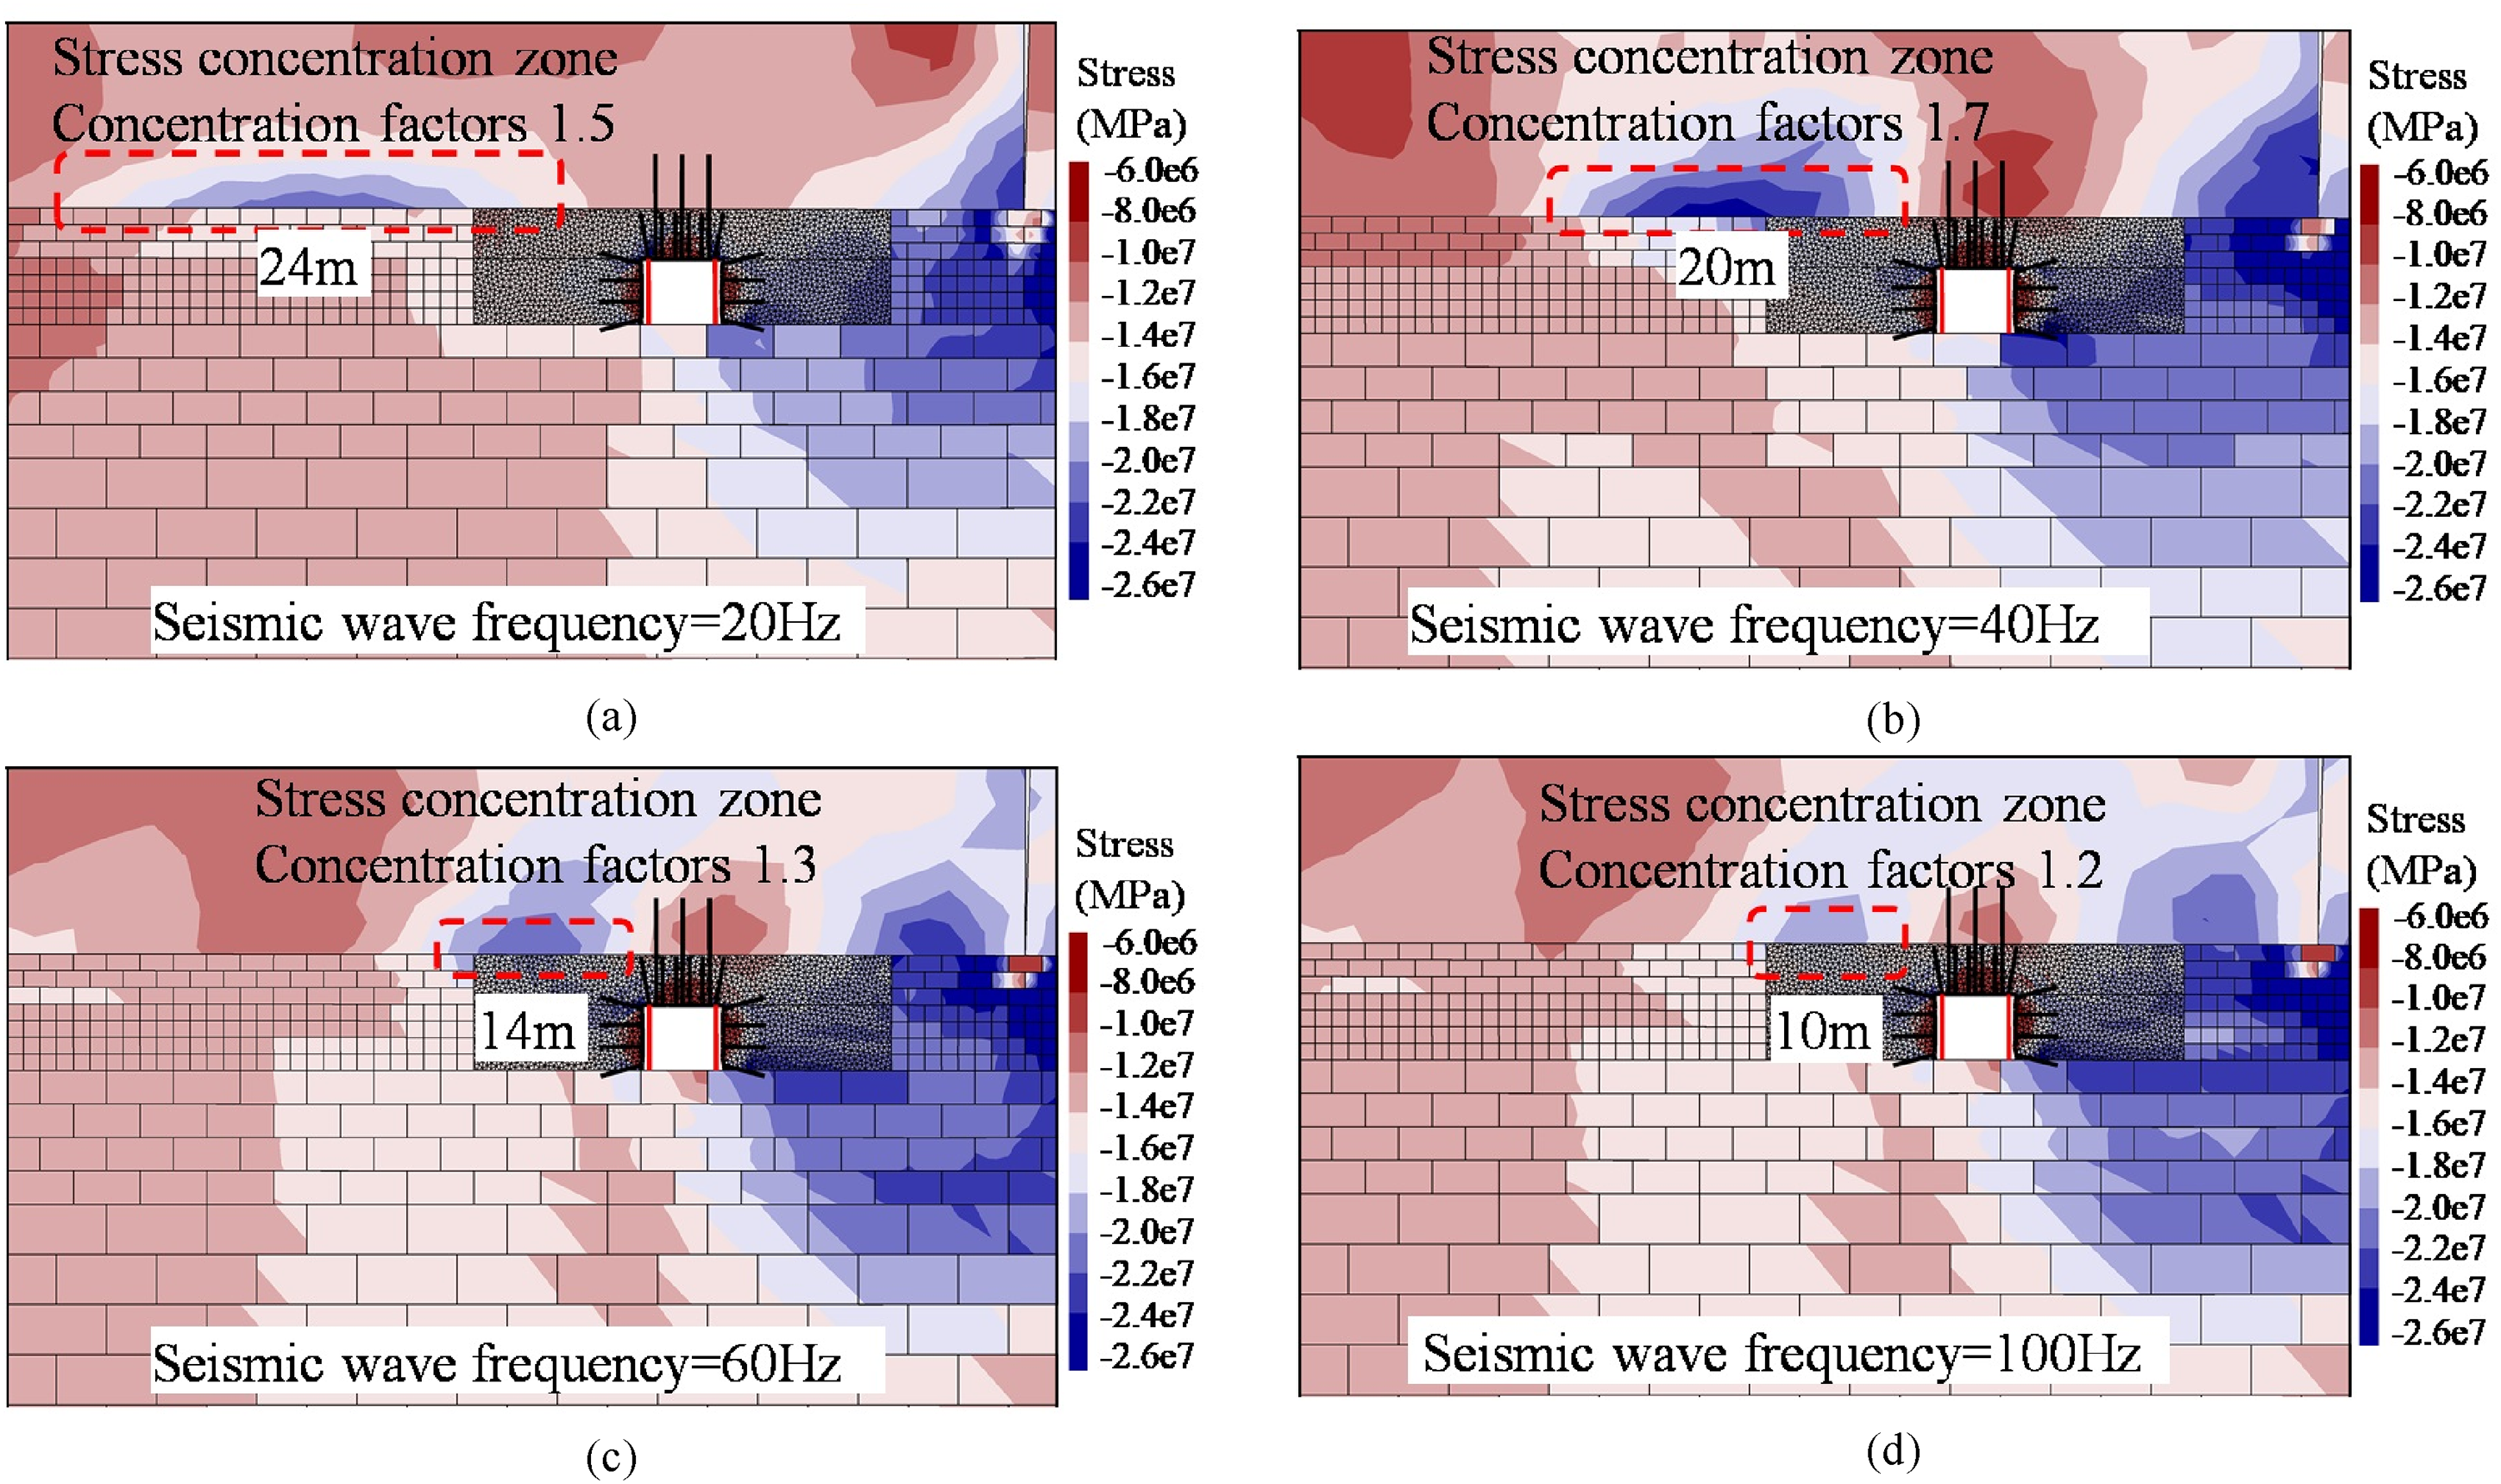
Stress state characteristics of roadway surrounding rock under different seismic frequencies: (a) seismic wave frequency = 20 Hz; (b) seismic wave frequency = 40 Hz; (c) seismic wave frequency = 80 Hz; (d) seismic wave frequency = 100 Hz.
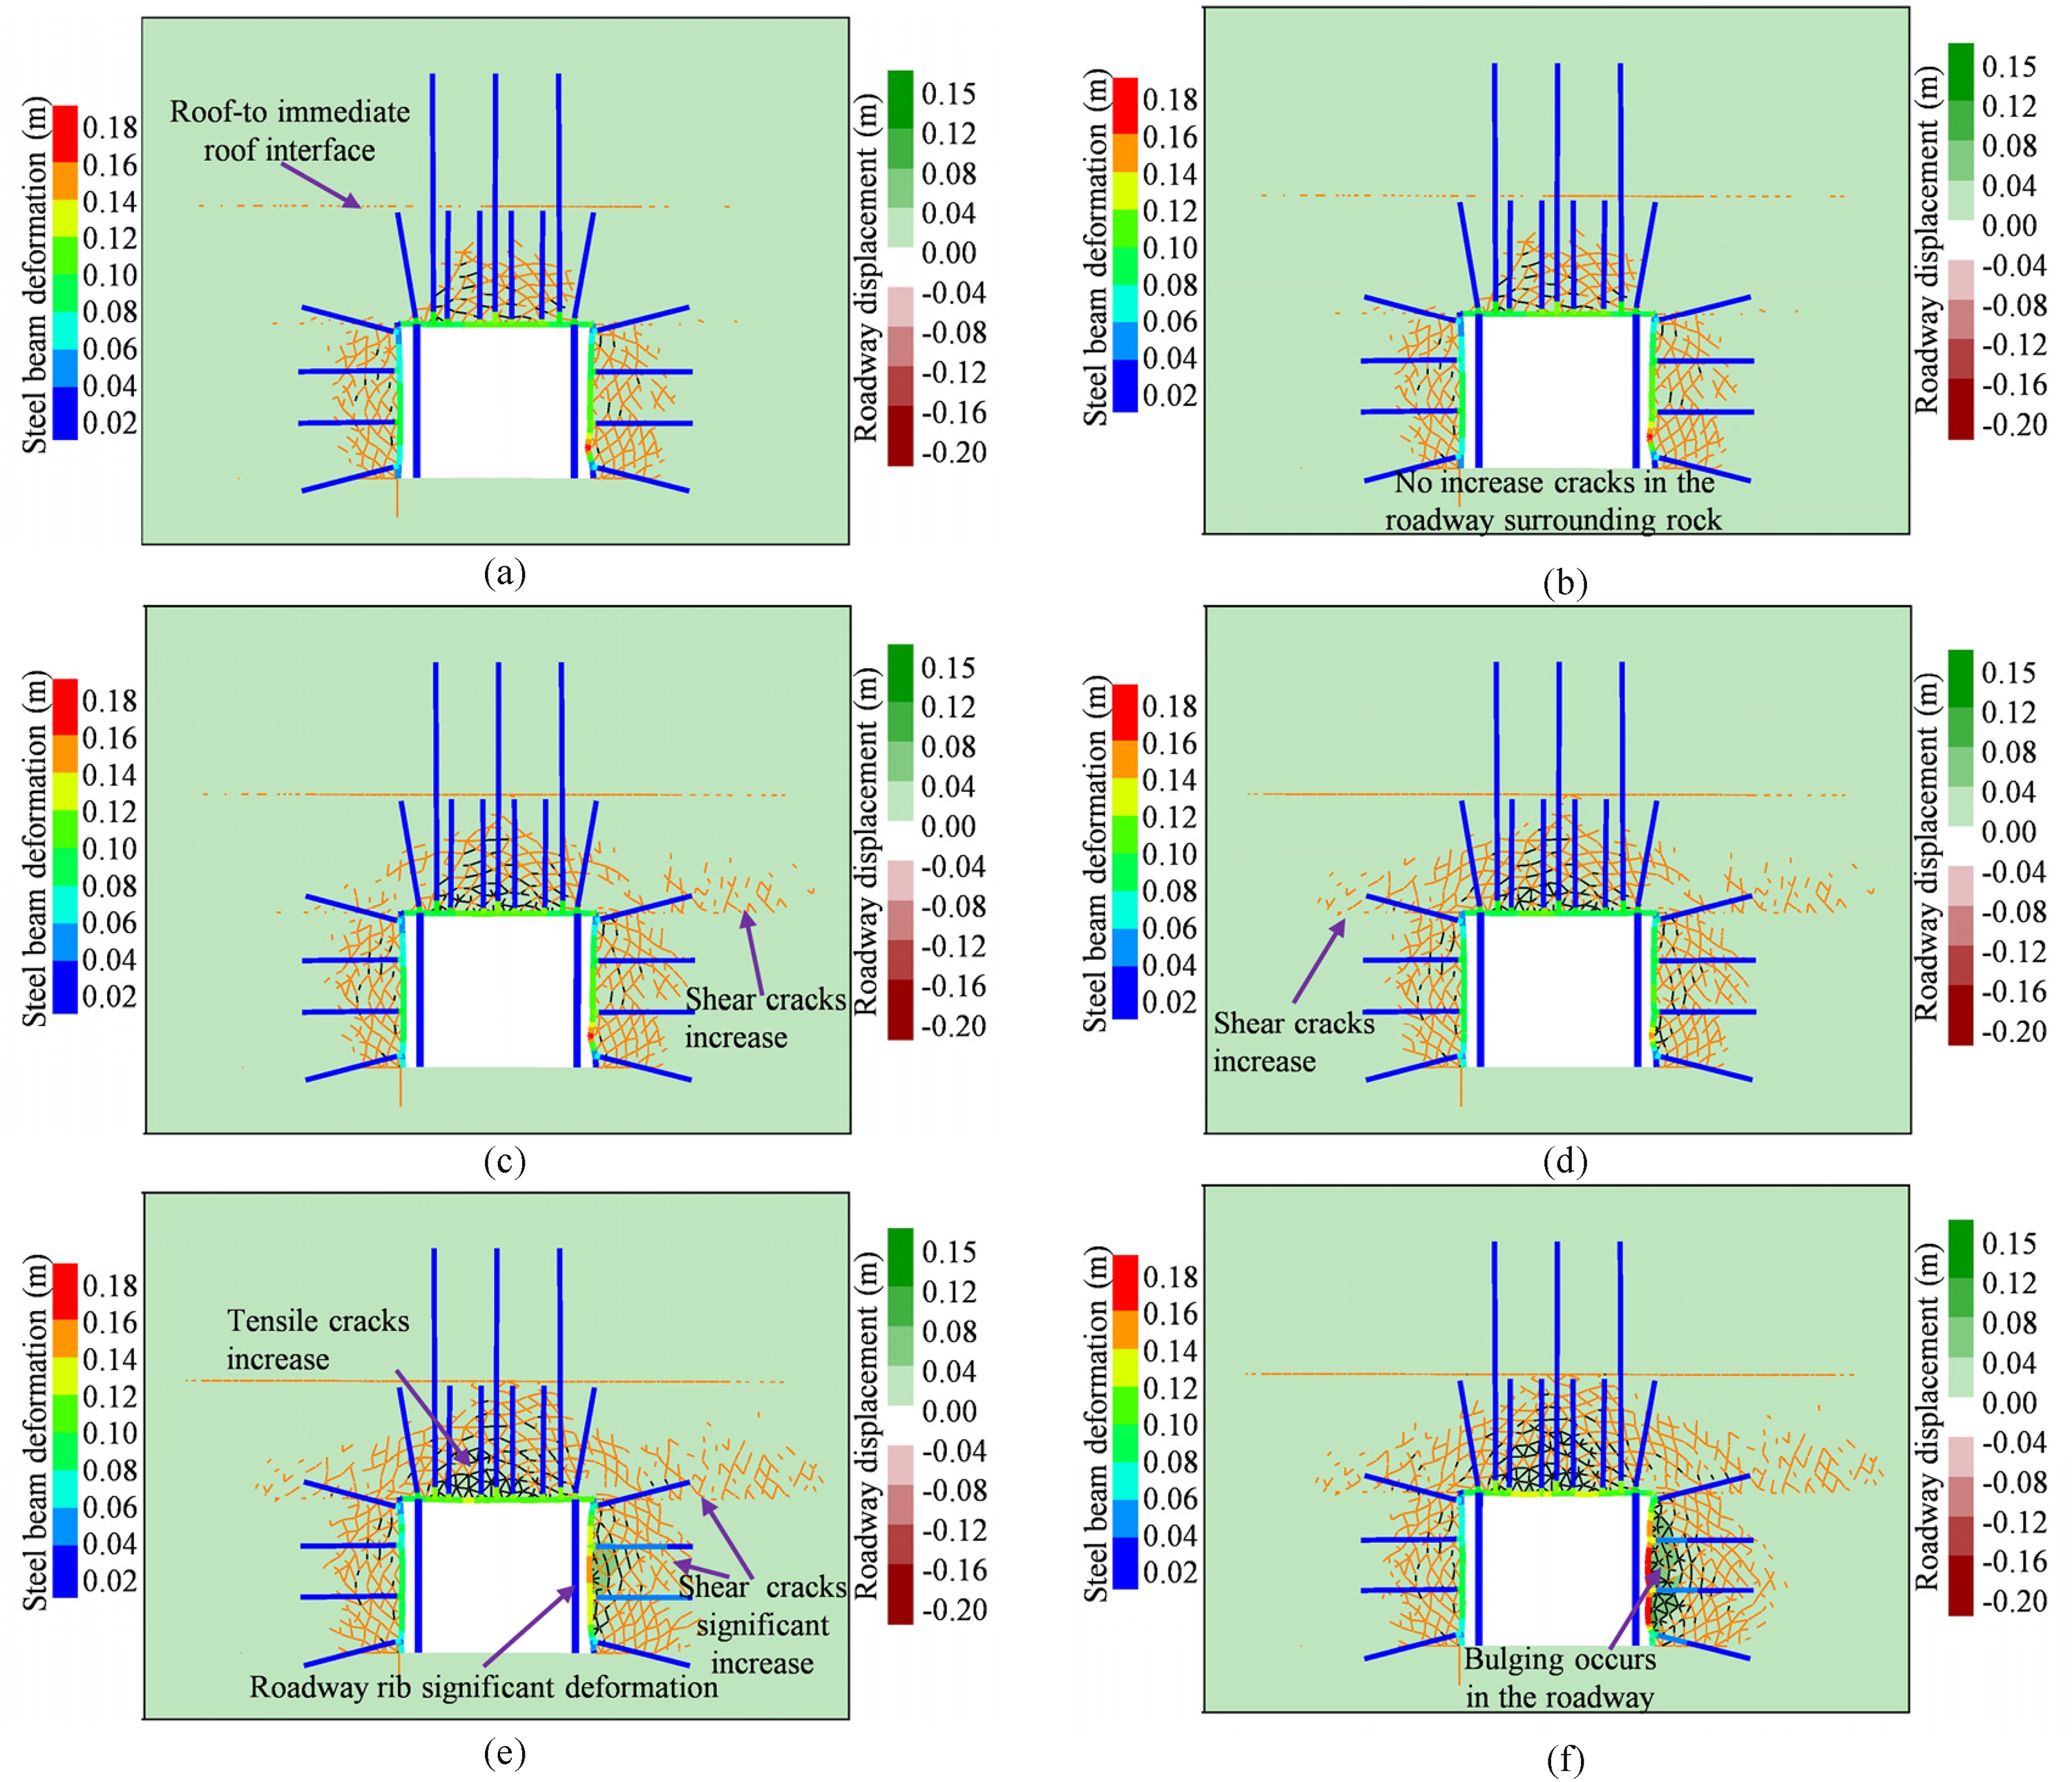
Influence of seismic wave frequencies on roadway surrounding rock damage severity
Figure 16 shows the damage characteristics and the deformation of the roadway surrounding rock under the influence of different seismic wave frequencies. When the seismic wave frequency is 40 Hz, the number of tensile failure cracks (represented by the pink cracks in the Figure 16) in the roadway surrounding rock is the highest, and the displacement of the surrounding rock is also the largest, approximately 0.12 m. When the seismic wave frequency is 80 Hz, the displacement range of the roadway surrounding rock significantly decreases compared to 40 Hz, but the number of tensile damage cracks in the roadway's roof increases further. Furthermore, when the seismic wave frequency is 100 Hz, both the number of tensile damage cracks and the displacement region in the roadway surrounding rock decrease further compared to 80 Hz. The overall damage characteristics of the roadway surrounding rock exhibit a ‘n"-shaped pattern, with tensile failure predominating in the shallow part of the roadway sidewalls and shear failure predominating in the deeper regions. The total length of cracks near the roadway surrounding rock was analyzed using the Fish language in UDEC, and the variation of the total crack length with dynamic load time at each moment was obtained. The results are shown in Figure 17.
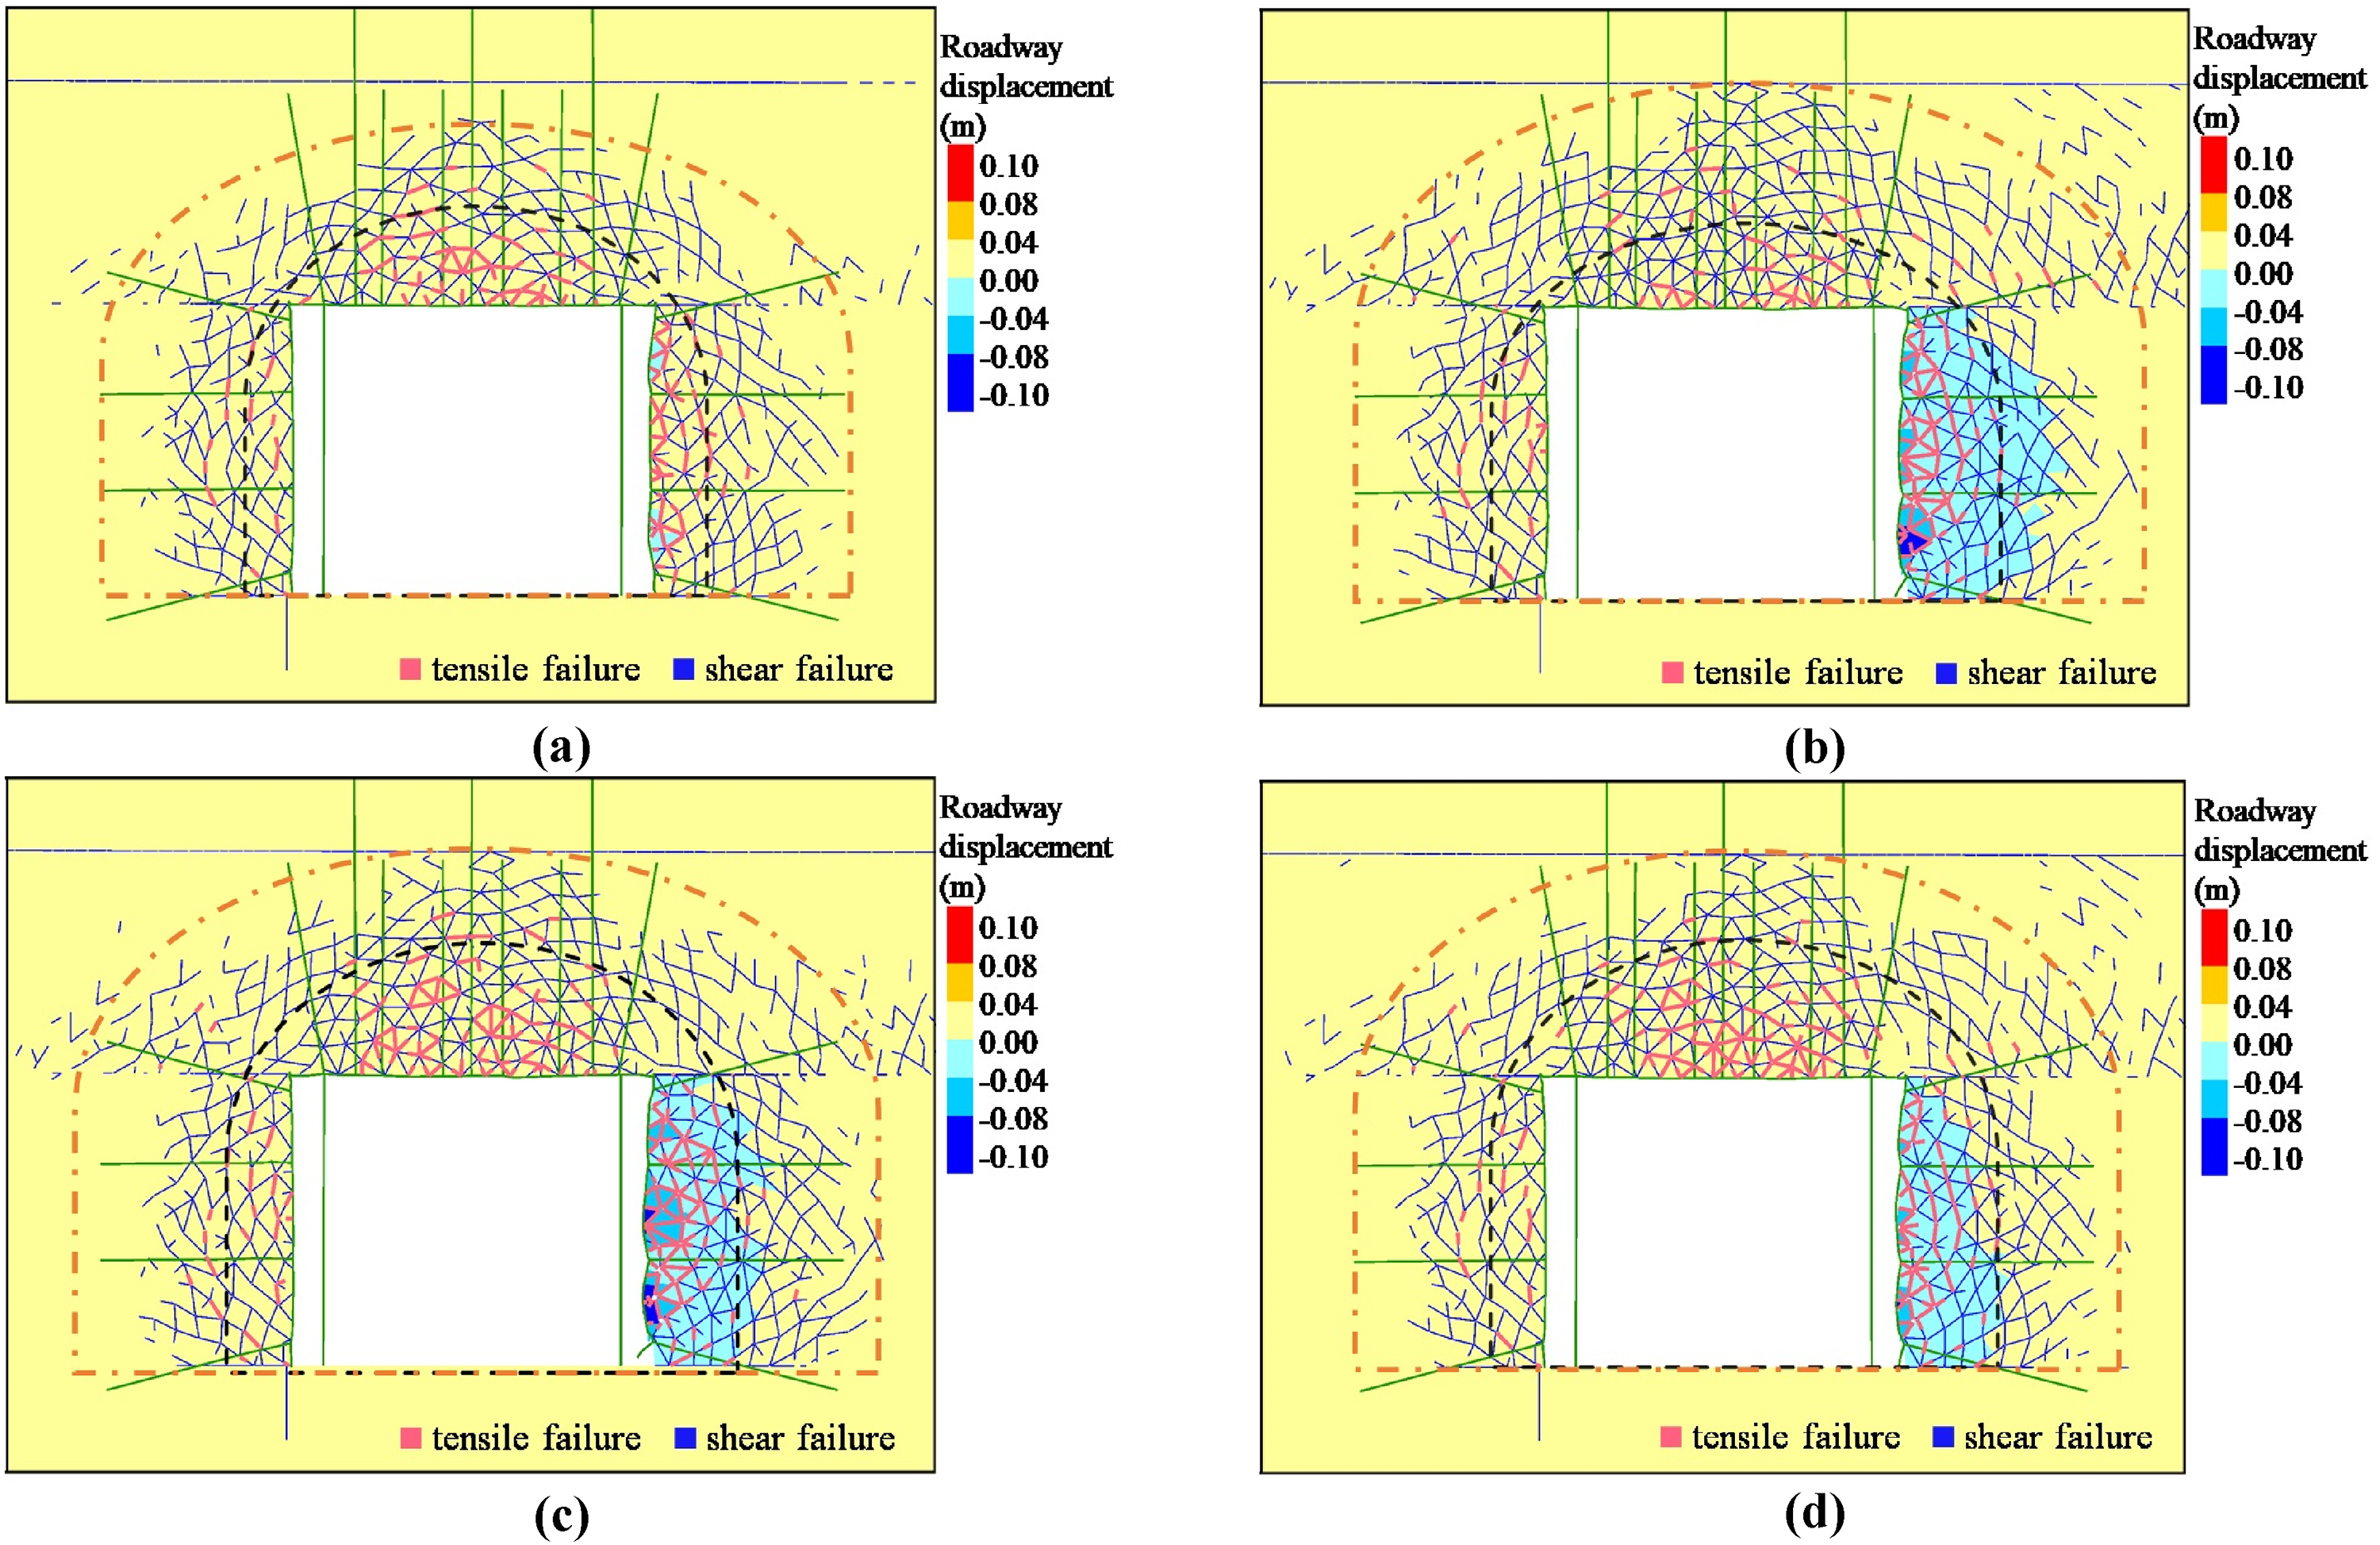
Damage features of roadway surrounding rock under different seismic frequencies: (a) seismic wave frequency = 20 Hz; (b) seismic wave frequency = 40 Hz; (c) seismic wave frequency = 80 Hz; (d) seismic wave frequency = 100 Hz.
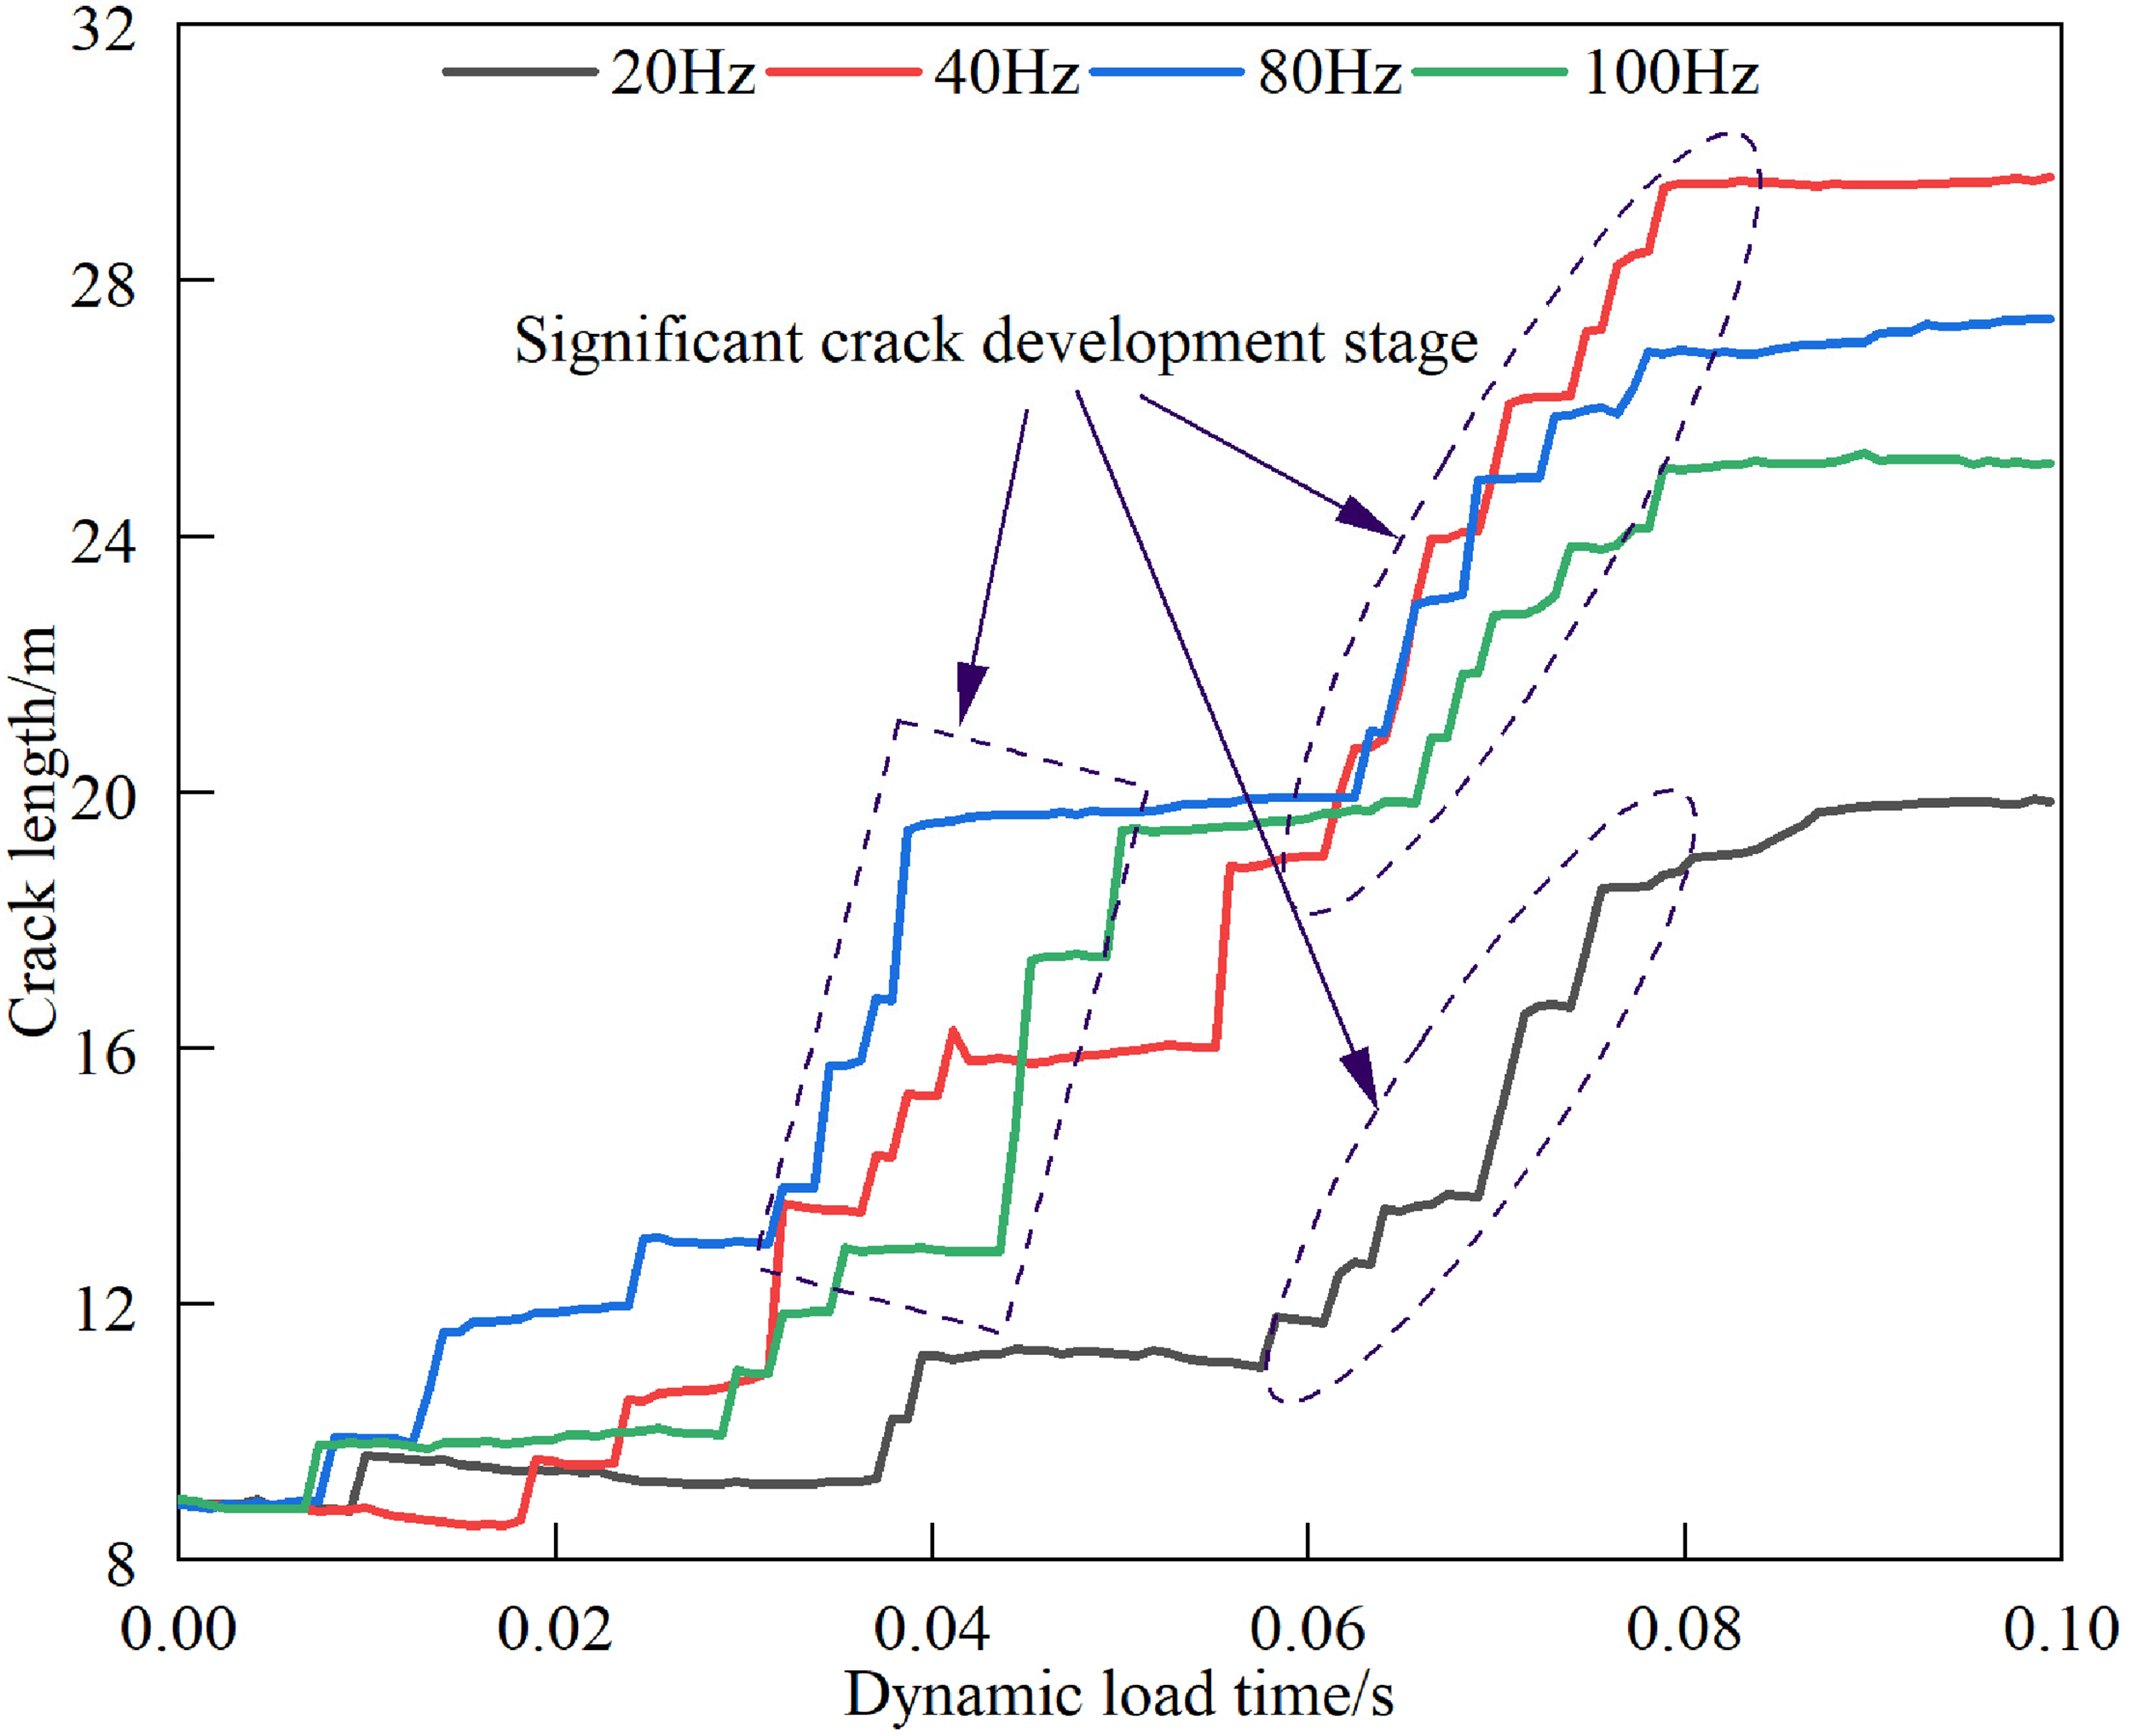
Seismic frequency impact on the total crack length of surrounding rock.
For the seismic waves with frequencies of 80 Hz and 100 Hz, the total crack length in the roadway surrounding rock increases sharply in the time interval of 0.03 s to 0.04 s. This increase corresponds to the shear failure cracks that occur in the deep part of the right-side shoulder of the roadway, as shown in Figures 16(c) and (d). The development of cracks in the roadway surrounding rock during the time interval of 0.06 s to 0.08 s is caused by the propagation of seismic waves to the roadway sidewall. After 0.08 s, the dynamic stress disturbance ends, and no new cracks develop in the roadway. In conclusion, under the influence of seismic frequencies (80–100 Hz), the surrounding rock near the seismic source will experience significant shear damage with numerous shear cracks (represented by the blue cracks in Figure 16).
Figure 18 shows the delamination of the roadway's shallow surrounding rock under the influence of different seismic waves. As the frequency of the seismic waves increases, the delamination of the roadway's ribs exhibits a trend of initially increasing and then decreasing. When the frequency of the vibration waves is 40 Hz, the delamination area of the right rib of the roadway is approximately 4m2, with a maximum delamination displacement of 20 mm. When the frequency of the vibration waves is 20 Hz, 80 Hz and 100 Hz, the corresponding delamination areas of the right sidewall are 2.8 m2, 3.6 m2 and 3.4 m2, respectively.
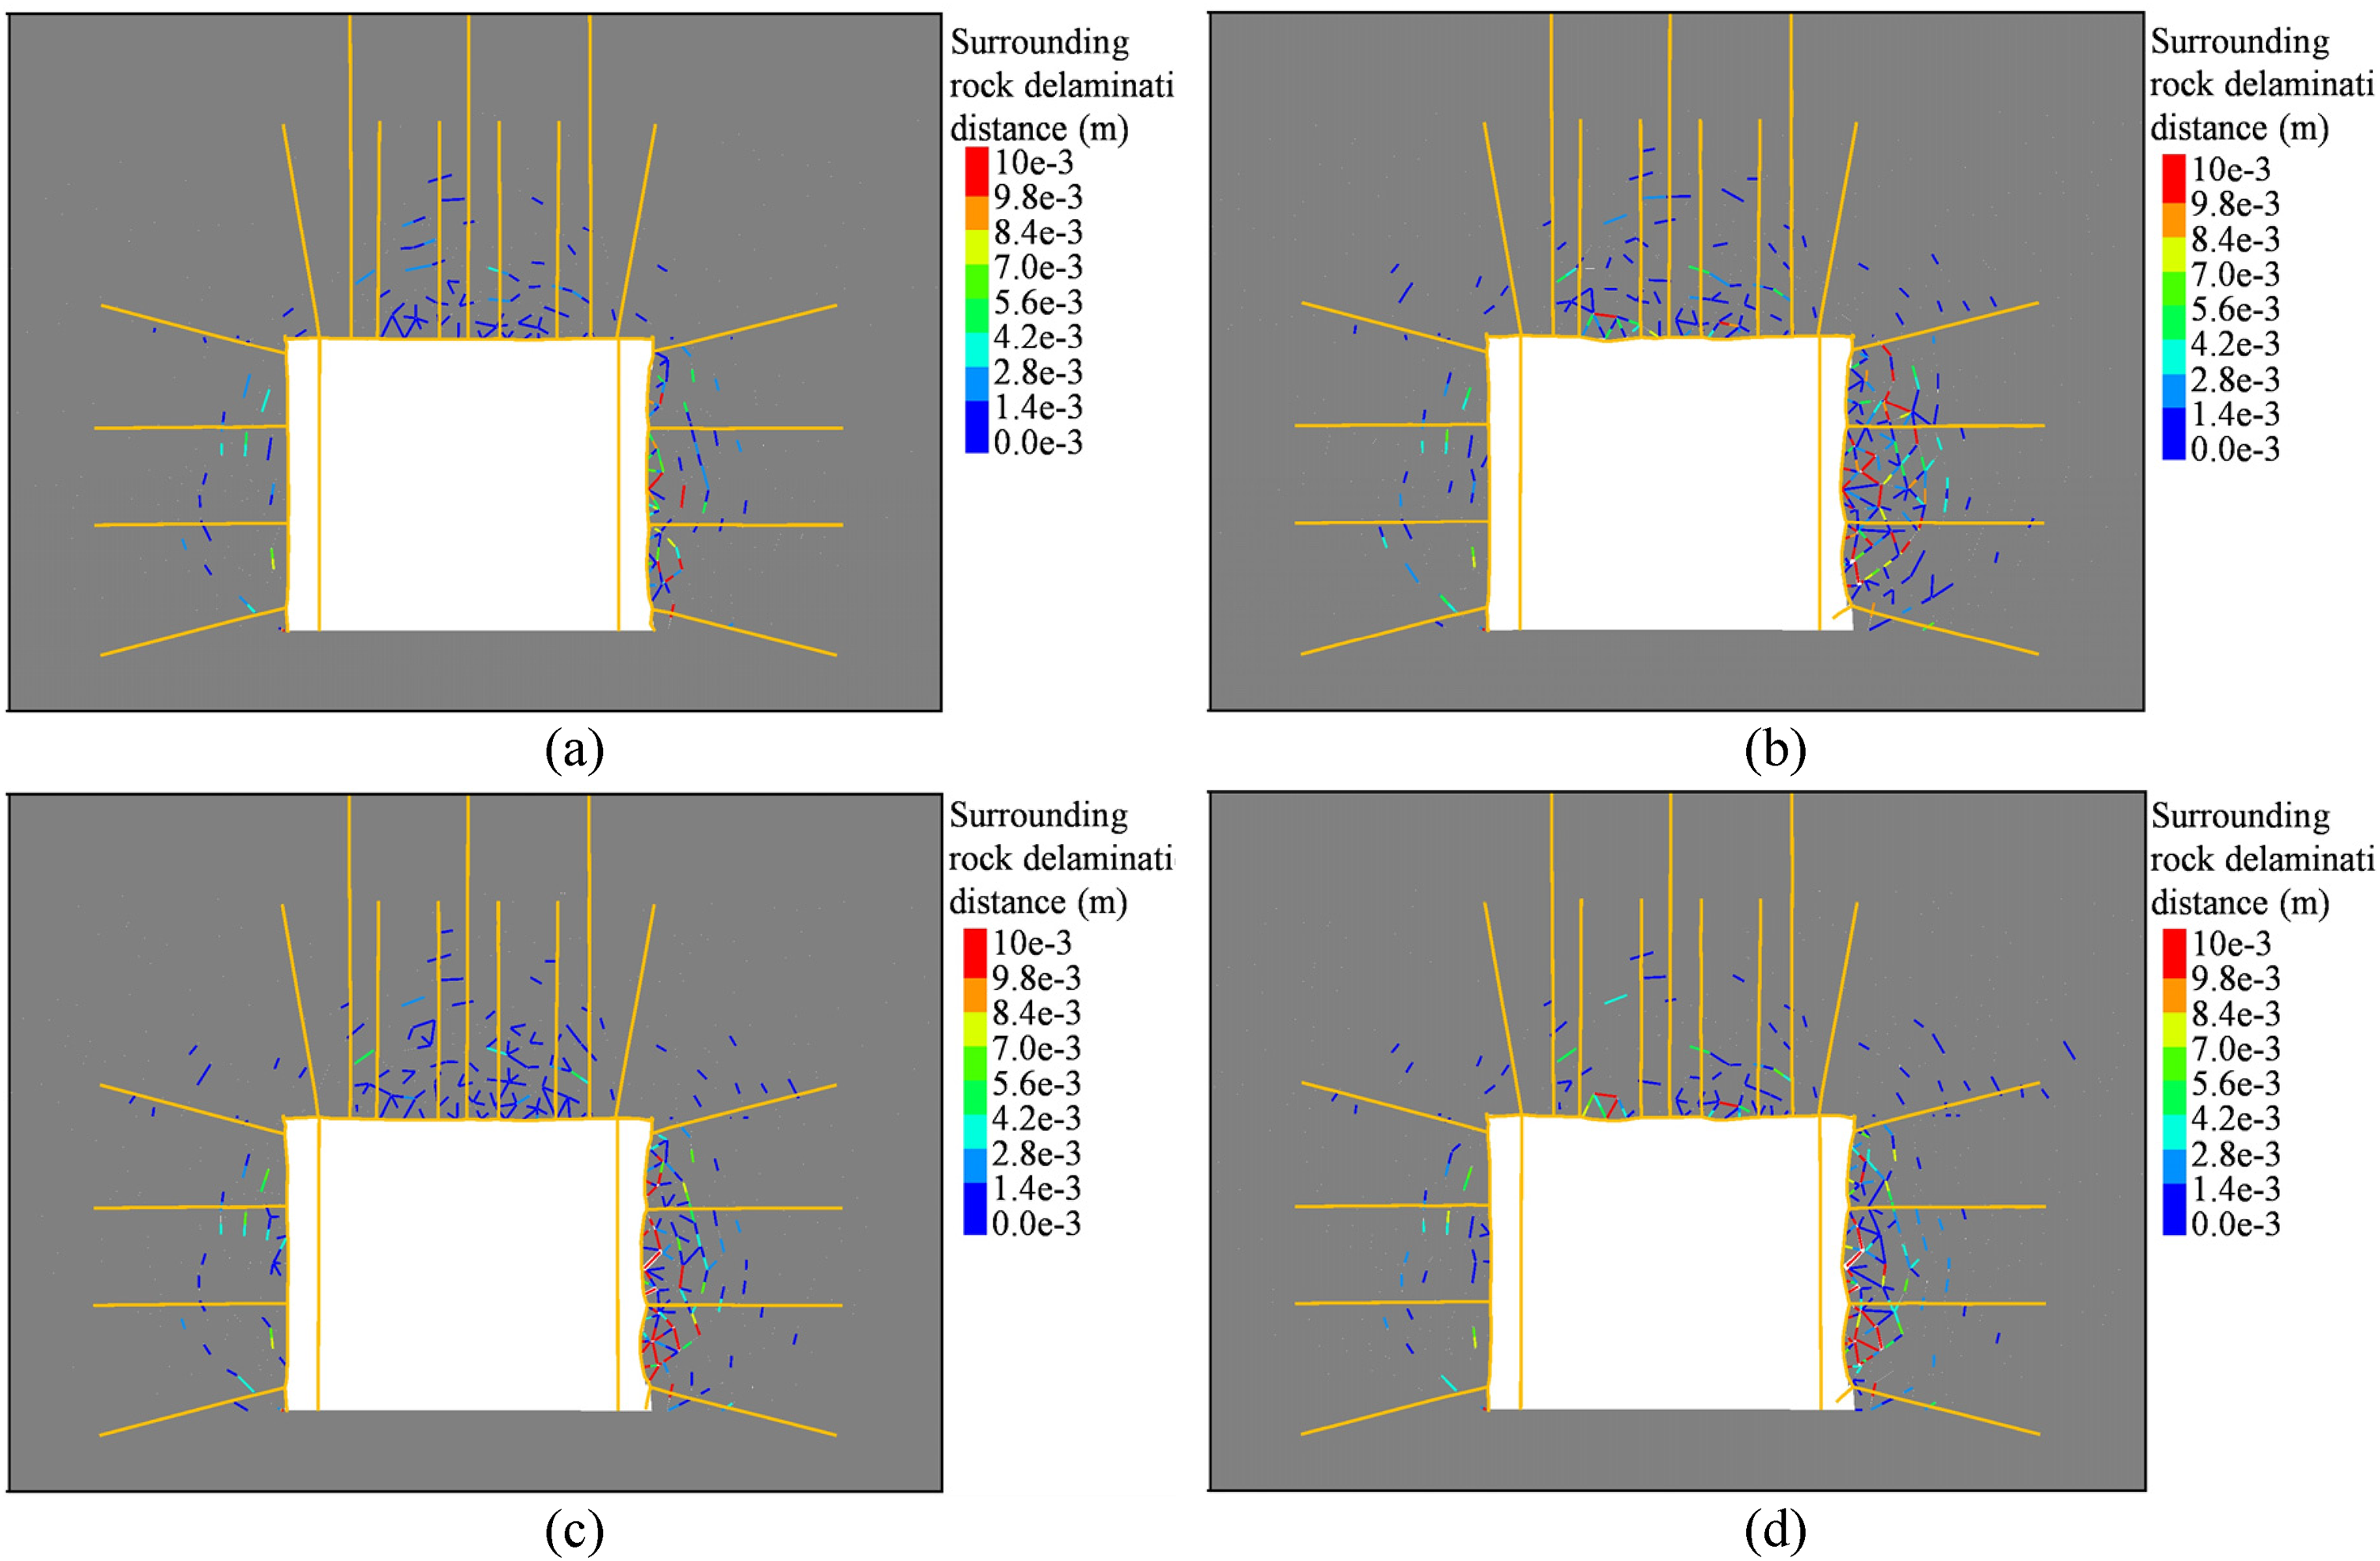
Delamination of roadway surrounding rock under different vibration frequencies: (a) seismic wave frequency = 20 Hz; (b) seismic wave frequency = 40 Hz; (c) seismic wave frequency = 80 Hz; (d) seismic wave frequency = 100 Hz.
The authors (Li et al., 2022) analyzed the dynamic response characteristics of the roadway sidewall under the impact of seismic waves. They modelled the elastic force and the damping acting on the dynamic response unit with an elastic element and a viscous element, respectively, as illustrated in Figure 19.
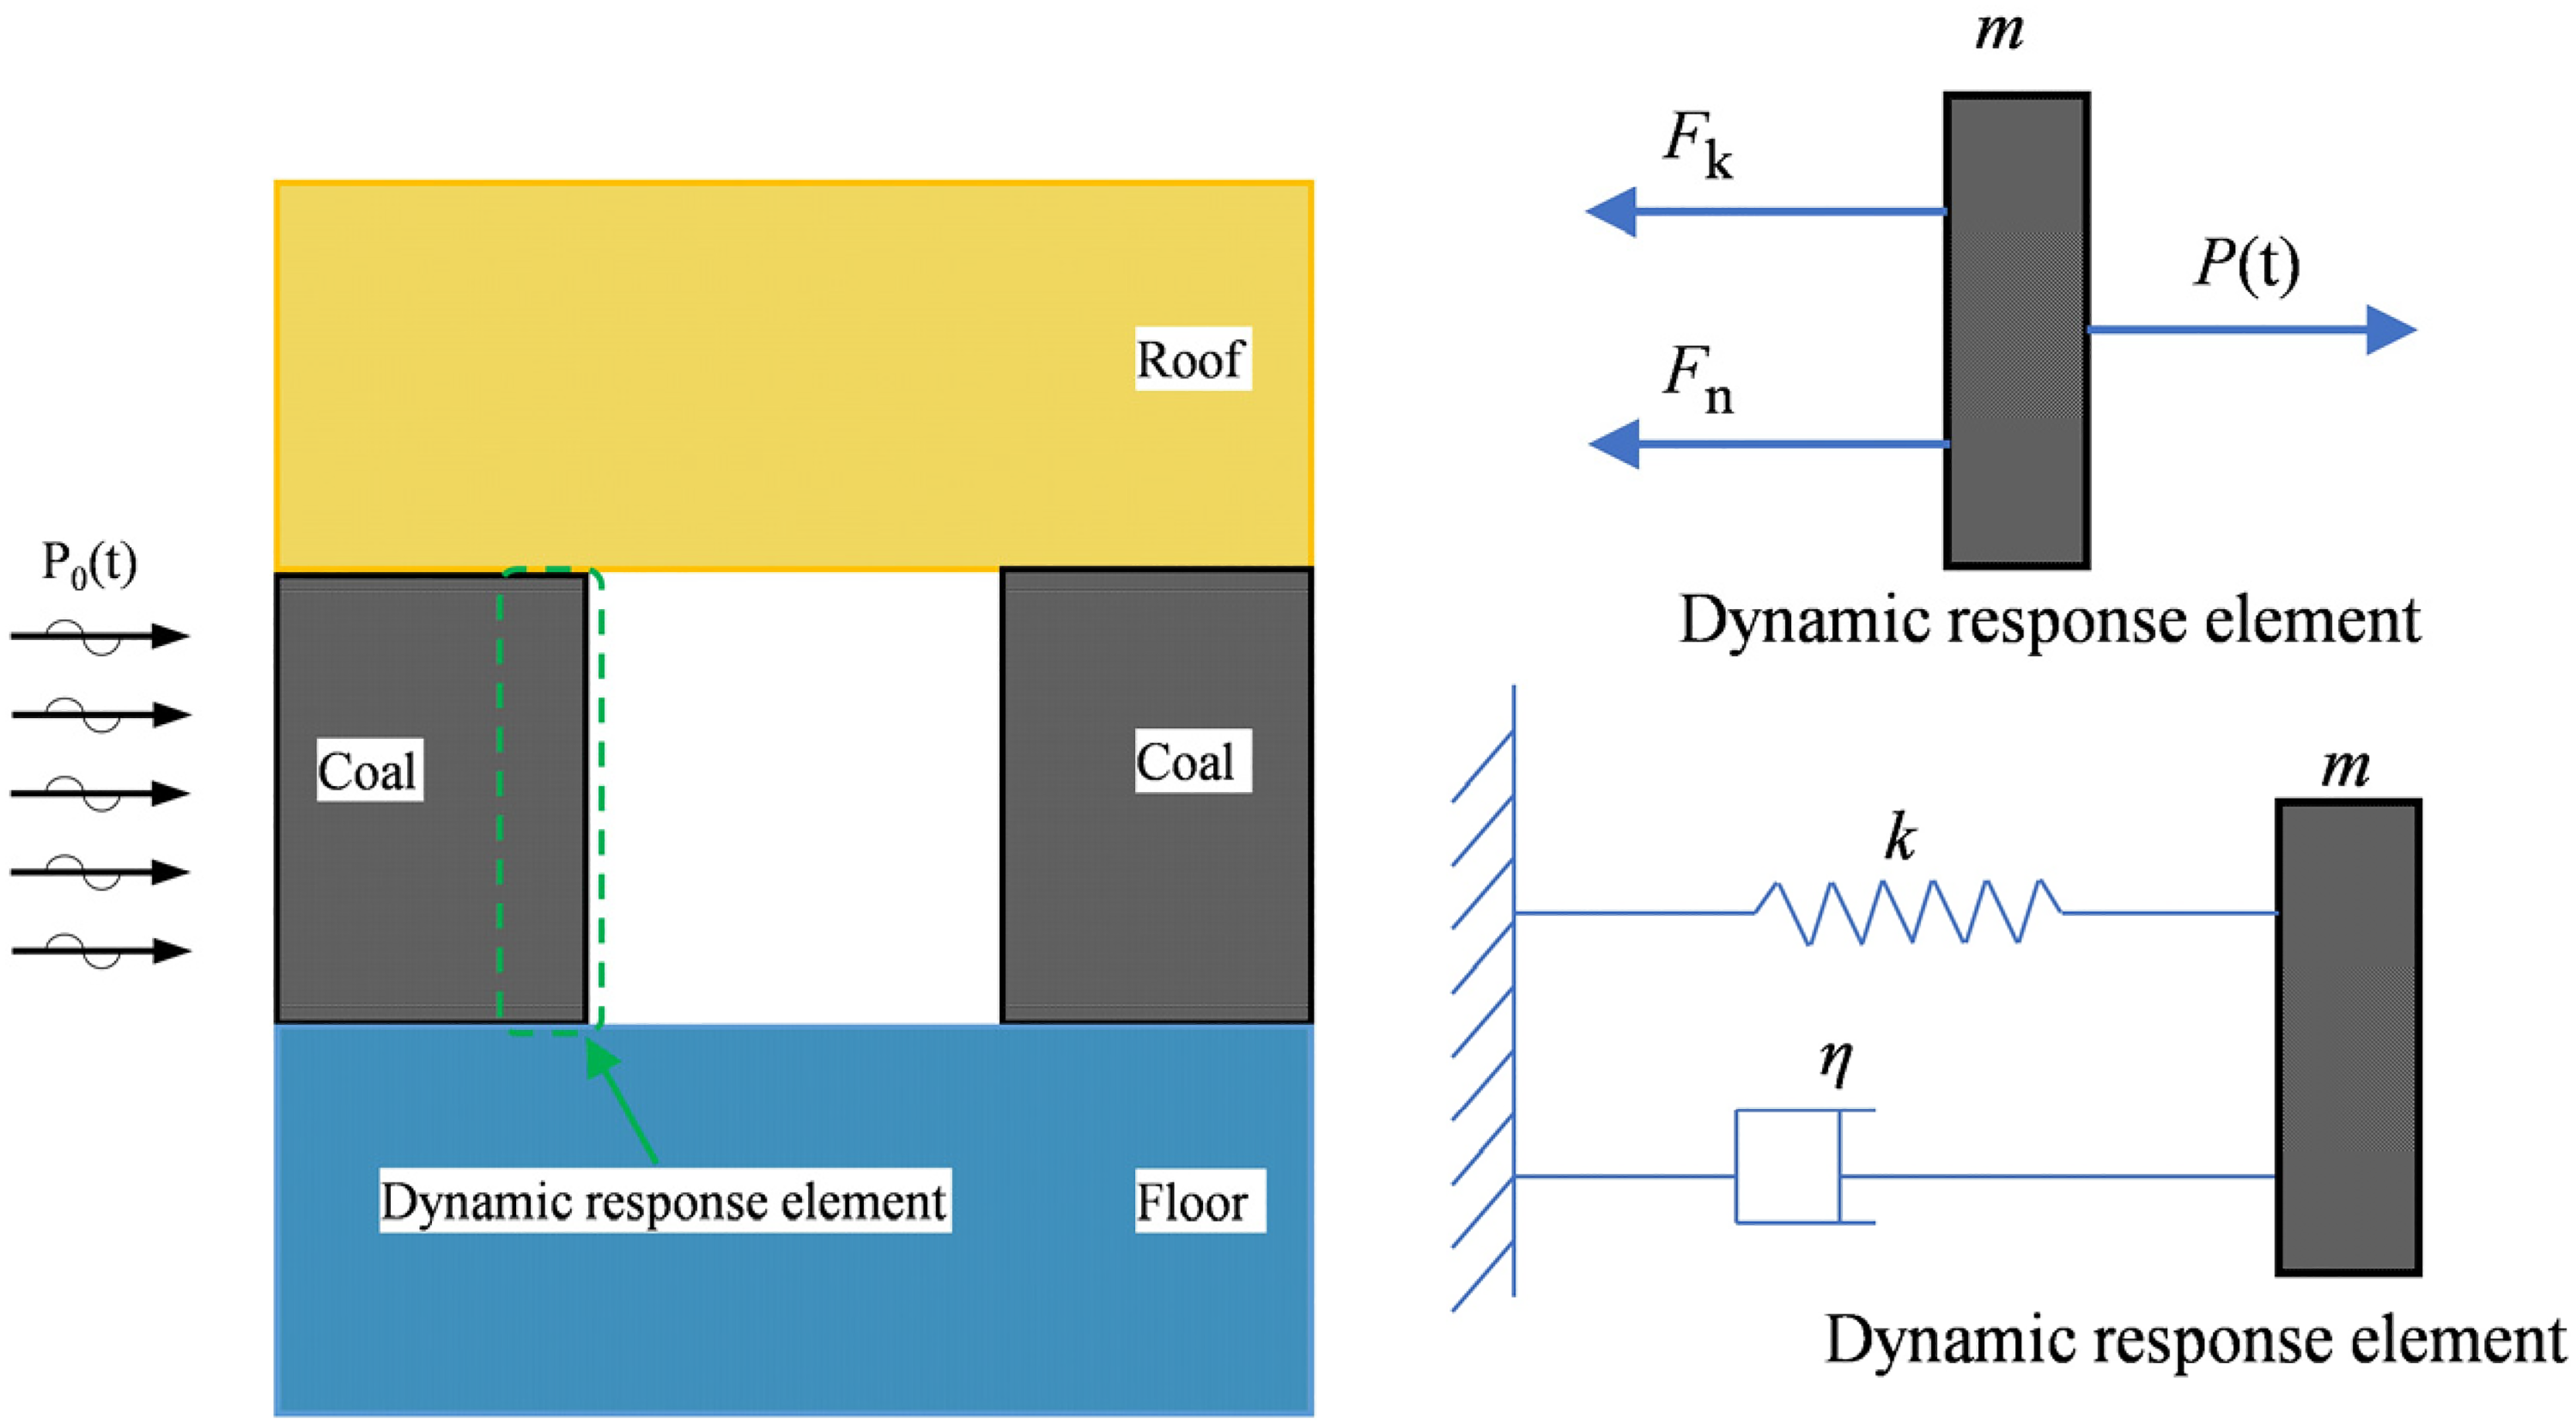
Mechanical model of dynamic response unit of roadway rib.
When dynamic loads propagated to the rib, they derived the following equation according to the equilibrium conditions of mechanics:
Assuming wn2 = k/m,2β=η/m; q = p/m, there have:
They solved equations (6) and (7) and obtained the amplitude factor of the roadway sidewall unit under dynamic stress as: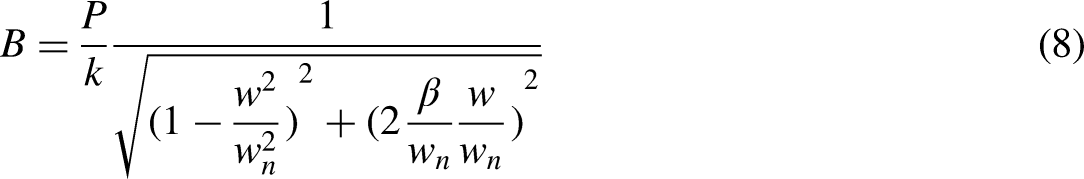
Based on the geological and mining conditions of the return airway in the 31103 working face, the rib-side unit elastic coefficient(k) is 0.5 Gpa/m, the rib-side unit viscous coefficient(η) is 1.1 MPa·s and the rib-side unit mass(m) is 2450 kg. The damping ratio (ξ) of the coal medium is 0.05. Figure 20 illustrates the relationship between seismic wave frequency and the amplitude factor, which represents the dynamic response magnitude of the roadway rib-side unit under a unit force of 1 N, with wn being 50 Hz. As the frequency of dynamic stress disturbance increases, the degree of dynamic response of the roadway exhibits a trend of initial escalation followed by reduction. When the seismic wave frequency aligns with the wn, the roadway's dynamic response reaches its most intense level. This trend corresponds with the regularity uncovered in my paper's numerical simulation results.
Relationship between seismic wave frequency and amplification factor.
Impact of seismic wave amplitude and frequency on roadway
Under the influence of seismic vibrations, the loading on the rib side of the roadway can be expressed as:
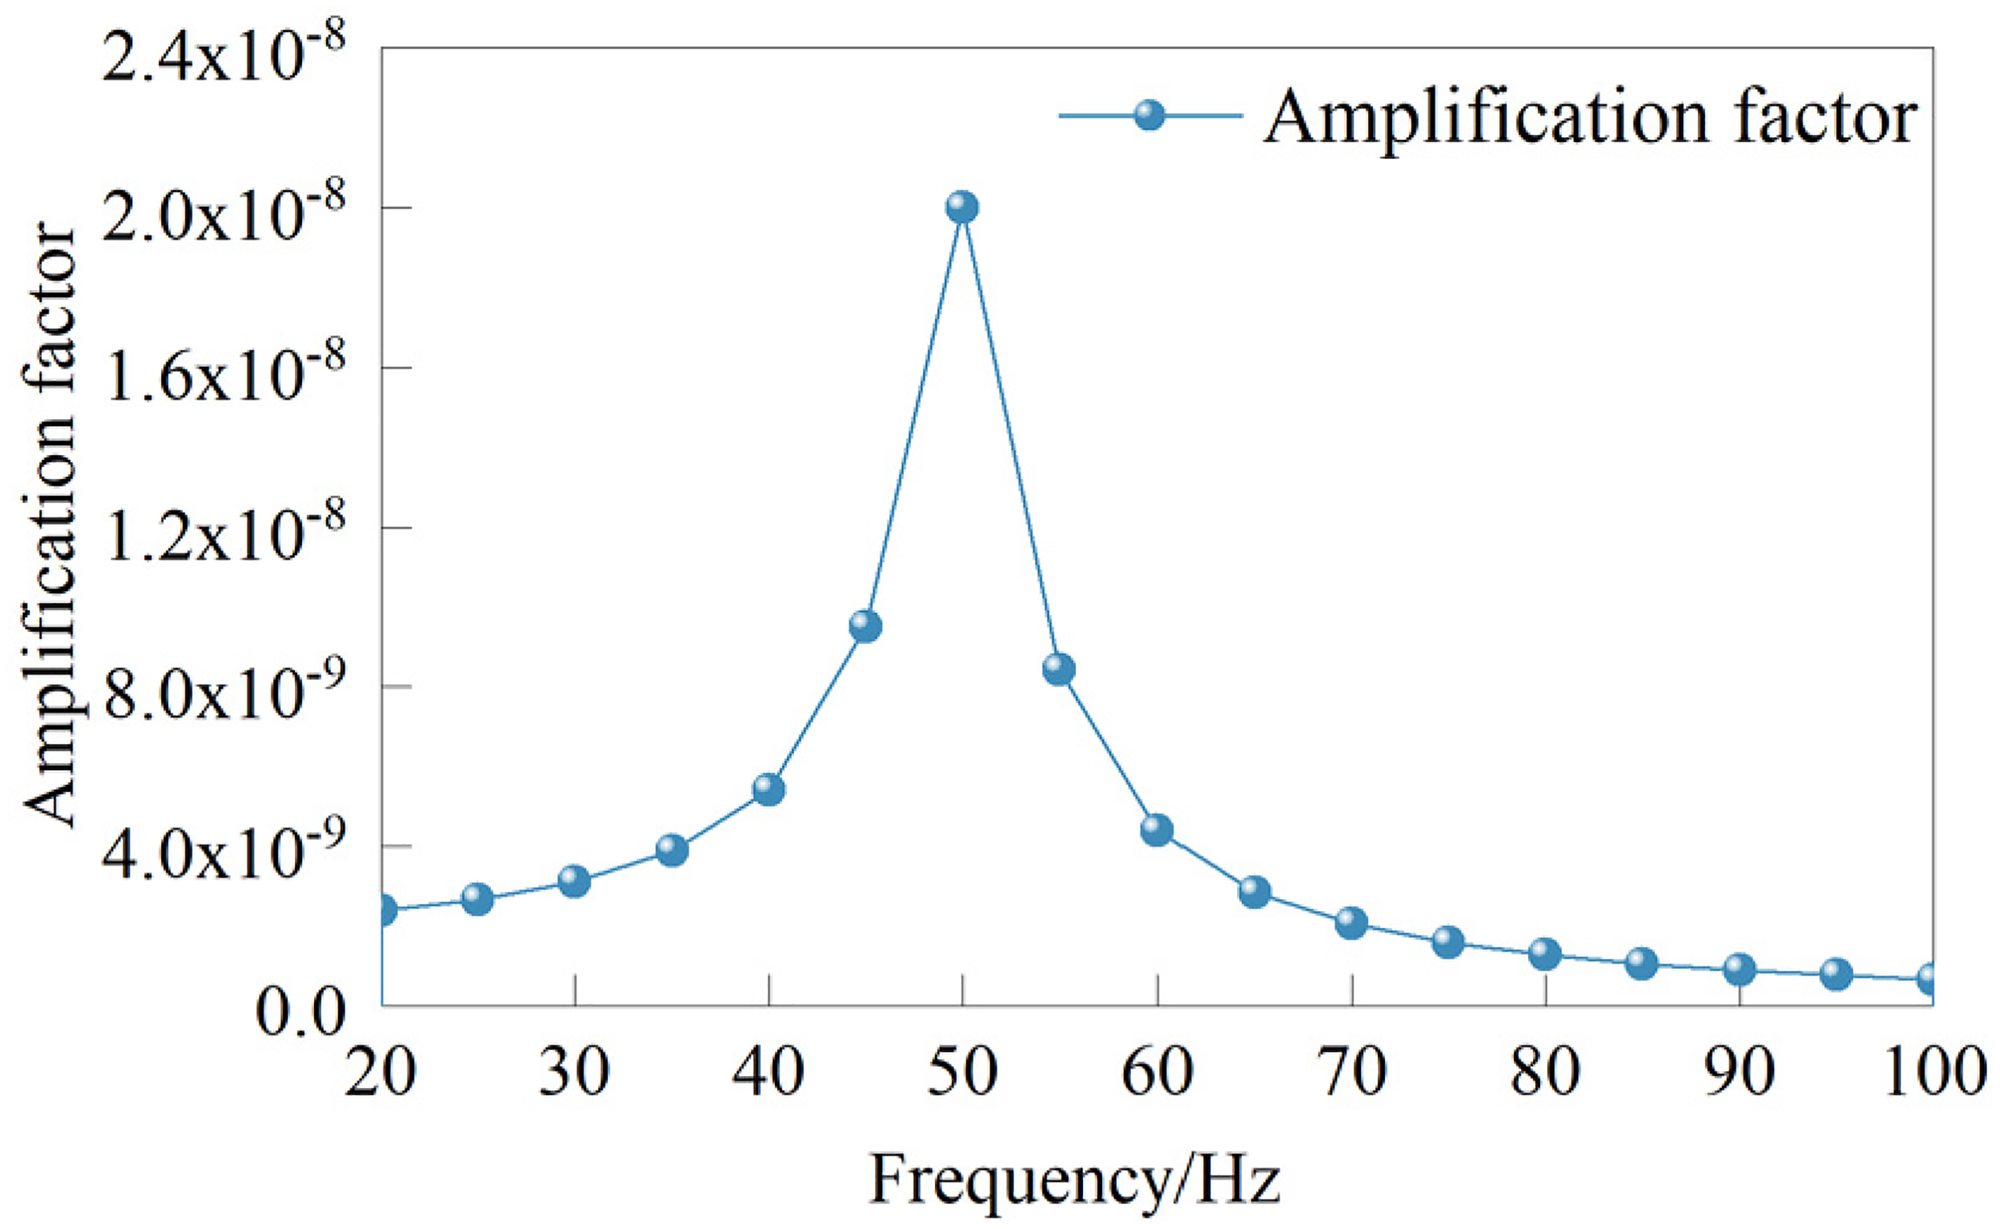
Assuming the roadway follows a plane strain model as shown in Figure 21. According to the damage mechanic principles, the critical crack length at which damage occurs in a medium under a given stress state can be determined using the following equation (Gross and Seelig):
Mechanical damage model for roadway surrounding rock.
where ac is the critical length of a crack; E is the rock elastic modulus; v is the rock Poisson ratio; γ is the solid surface energy.
Based on the geological and mining conditions of the return airway in the 31103 working face, with coal elastic modulus of 0.5 GPa, Poisson's ratio of 0.2, a static load of 10 MPa, and assuming a coal surface energy of 1 J/m², the relationship between the vibration amplitude of seismic waves and the critical crack length of coal was illustrated in Figure 22. The result indicates that increasing amplitude would promote the propagation of failure cracks in the roadway surrounding rock.
Relationship between seismic wave amplitude and critical crack length.
Figure 23 shows the displacement of roadway surrounding rock under the influence of seismic waves with different frequencies and amplitudes. It can be observed that the amplitude variation has the greatest impact on roadway deformation, and the disturbance effects of the seismic waves on the roadway surrounding rock increase with the amplitude.
The relationship between seismic wave frequency amplitude characteristics and surrounding rock deformation: (a) amplitude-frequency characteristics and right rib roadway displacement; (b) amplitude-frequency characteristics and left rib roadway displacement; (c) amplitude-frequency characteristics and roof displacement; (d) amplitude-frequency characteristics and floor displacement.
Based on the comprehensive analysis of Figures 15–18, it can be observed that there exists a significant correlation between the deformation magnitude of the roadway and its damage condition. Therefore, focusing on the most prominently deformed right sidewall of the roadway, analyzed the relationship between amplitude-frequency parameters of seismic waves and the characteristics of roadway rib spalling. According to Figure 16, when the displacement of the roadway right rib exceeds 4 cm, the spalling characteristics and delamination zone of the roadway surrounding rock increase. As shown in Figure 23(a), under the condition of the simulated source location in this study, different frequencies of seismic waves result in the roadway exhibiting rib spalling characteristics, requiring different amplitude conditions. For frequencies between 20–25 Hz and 80–100 Hz, an amplitude greater than 3 m is required. Frequencies between 25–30 Hz and 55–80 Hz necessitate an amplitude greater than 2 m, while frequencies between 30 and 55 Hz require an amplitude greater than 1.5 m.
Figure 24 presents how the frequency and amplitude of seismic waves are related to the number of cracks in the roadway surrounding rock. Figure 25 illustrates the correlation between seismic wave frequency, amplitude and the types of damage in the surrounding rock of the roadway. Figures 24 and 25 show that the overall damage to the roadway surrounding rock increases with the amplitude and decreases with the frequency of the seismic waves, and that shear-induced failure is predominant. When the seismic wave frequency is constant, the damage degree increases linearly with the amplitude. When the amplitude is constant, the failure degree increases first and then decreases with the frequency. The impact of amplitude variation plays a more significant role compared to the frequency variation of the seismic waves. By fitting the frequency and amplitude of the seismic waves with the number of failure cracks (S) in the roadway surrounding rock, the following equation can be obtained:
The relationship between seismic wave frequency amplitude and roadway surrounding rock failure cracks number.
Tensile crack and shear crack length in roadway surrounding rock with different seismic frequencies and amplitudes.
where A represents the seismic wave amplitude, and f represents the seismic wave frequency.
Conclusions
Under the effect of seismic waves, stress concentration emerges in the deep surrounding rock of the roadway near the seismic source side, leading to shear failure. Stress concentration zones form in the top, bottom and shoulder of the roadway. The roadway surface serves as an open space for stress release, resulting in tensile failure in the shallow surrounding rock. This determines the extent of delamination in the roadway's shallow surrounding rock.
As the amplitude of the seismic waves increases, higher loads are imposed on the roadway surrounding rock, leading to a reduction in the critical crack length and promoting crack propagation. This results in an increased number of cracks, distributed in a “n”-shaped pattern, with tensile failure dominating in the shallow regions and shear failure dominating in the deep regions.
As the seismic wave frequency increases, the number of cracks in the surrounding rock shows a trend of increasing first and then decreasing, and this trend is more obvious with larger seismic wave amplitudes. For seismic waves with the same amplitude, the dynamic response of the roadway sidewall is most significant when the seismic wave frequency is between 40 Hz and 60 Hz.
Rib spalling damage in the roadway is influenced by the frequency and amplitude of seismic waves. Frequencies within the ranges of 20–25 Hz and 80–100 Hz require amplitudes exceeding 3 m to induce damage. For frequencies ranging between 25 and 30 Hz, as well as 55–80 Hz, an amplitude greater than 2 m is necessary. Frequencies falling between 30 and 55 Hz necessitate amplitudes exceeding 1.5 m.
Footnotes
Data availability statement
All data are presented within the paper.
Declaration of conflicting interests
The author(s) declared no potential conflicts of interest with respect to the research, authorship, and/or publication of this article.
Funding
The author(s) disclosed receipt of the following financial support for the research, authorship, and/or publication of this article: This research was funded by the National Natural Science Foundation of China (52274147, 51974302). Ordinary University Graduate Student Scientific Research Innovation Projects of Jiangsu Province (KYCX23_2800). The national research and development program under the grant (2022YFC3004603).