
Abstract
Electricity theft detection (ETD) techniques employed to identify fraudulent consumers often fail to accurately pinpoint electricity thieves in real time. The patterns associated with electricity use are leveraged to identify anomalies indicative of electricity theft. However, challenges in the benchmark ETD include overfitting and a high incidence of false positives (FPs) resulting from incorrect usage patterns formed by considering only electricity consumption patterns without accounting for external factors that contribute to variations in normal consumption patterns. Further investigation is required to precisely detect instances of electricity theft, thereby minimizing nontechnical losses and forecasting future electricity demand to maintain a stable supply. This study employs a master energy meter located on the transformer side to monitor the amount of energy distributed to the region. Zones with a high likelihood of energy theft are detected by comparing the sum of readings from all the smart meters with the readings from the master energy meter installed on the HV of the substation transformer within the same electric feeder. Ensemble XGBoost machine-learning algorithm and K-Means algorithm are used for the classification of malicious and nonmalicious samples and grouping similar types of consumers together, respectively. This makes the proposed model resistant to false-positive rates caused by changes in usage patterns that aren’t done on purpose. Furthermore, energy thieves are identified by detecting anomalies in consumption behavior while maintaining constant internal and external environmental variables. This novel model proposed here mitigates the FP rate found in the present research of electricity usage data. Our approach outperforms support vector machines, convolution neural network, and logistic regression in simulations. Precision, F1-score, recall, Matthews Correlation Coefficient, Receiver Operating Characteristics (ROC)-Area Under The Curve (AUC), and Precision Recal (PR)-Area Under The Curve (AUC) validate our model. The simulation results show that the proposed K-Means-LSTM-XGBoost model improved the classifier’s F1-score, precision, and recall to 93.75%, 95.16%, and 92.38%, respectively. Our model classifies huge time series data with high precision and can be utilized by the utility for real time electricity theft detection.
Introduction
Many electricity theft detection (ETD) methods have been tried by electricity utilities to avoid losing huge money. Many authors had proposed different methods for theft detection in their scientific articles (Messinis and Hatziargyriou, 2018). The ETD models are broadly classified as hardware-based and data-driven-based methods. State estimation, game theory, machine-learning-based methods use data driven approach to tackle electricity theft.
The aim of this study is to explore the existing research in the field of ETD and explore the landscape and factors in detecting electricity theft in challenging environments characterized by inconsistent power supplies and seasonal weather changes. The primary objective of this innovative approach is to reduce false-positive rates (FPR) in areas where traditional machine-learning models struggle. By focusing on challenging environments with varying power supplies and seasonal changes, the integrated model aims to improve the accuracy and efficiency of ETD. The proposed integrated model combines smart meter data, uses K-Means clustering, and employs an integrated ensemble techniques to assist electric utilities with limited field staff in identifying theft clusters. This approach aims to reduce FPR in areas where seasonal changes, voltage fluctuations, and scheduled and unscheduled electricity shutdowns affect regular electricity supply.
The machine-learning methods are most widely used methods because of efficient, accurate detection and are economically cost-effective. Hardware-based solutions include use of sensors, Radio Frequency Identification (RFID) tags, etc. have huge deployment costs and require frequent maintenance due to system failure caused due to moisture or heat in extreme cold and warm climatic conditions. The power system is defined by its states, that is, state of voltage magnitudes and phase angles in its bus system. Estimation method is a tool for checking the abnormalities in the system operators. The state estimator calculates the system state by taking sets of random and redundant readings and measurements of the system variables. In the paper (Wen et al., 2018) authors propose a scheme for ETD. The bias estimation is compared with the true bias of all the users. If the predefined values are satisfied, we consider the user has no anomaly in usage pattern. A recursive filter estimates the consumer's electricity theft based on the state estimation method for detecting abnormal data. Game theory approach is represented as a play-off between electricity thieves and electricity suppliers or distribution utility amidst the different adversaries. The approach uses electricity thief as a player who tries to steal an amount of electricity, and the distribution utility that tries to maximize the probability of detecting and catching the electricity thief and minimize its operational cost for regulating anomaly detection. The name game theory is because consumers and supplier both participate as players in the game, electricity thieves (fraudulent consumer) minimize the possibility of being caught and electricity suppliers (distribution utility) try to augment the chance of detection, and both are using different strategies to complete their tasks (Cárdenas et al., 2012). This approach fails to construct a robust plan to control the electricity thieves and regulate them. The authors in the paper (Cárdenas et al., 2012) formulate a game between the supplier and the malicious user, which uses a probability density function, and tries to achieve Nash equilibrium using energy meter measurements. Data-driven approach based on artificial Intelligence in Nagi et al. (2008) proposes the use of the machine-learning algorithms like support vector machines (SVM), recurrent neural networks (RNN), extreme learning machine (ELM), extra trees (ET), convolution neural network (CNN), and online sequential extreme learning machine (OSELM), and so on for ETD. The approach mentioned in Nizar et al. (2008) identifies the abnormal load consumption of a consumer using load-profile evaluation technique. The machine-learning-based ETD model uses real-world electricity consumption dataset to find the abnormal usage behavior of the consumer for detection of the electricity theft. Classification-based approaches often face a challenge with nonmalicious factors that change electricity consumption patterns. Change of people living in house, appliances, seasons, etc. If overlooked, these factors could raise FPR. False positives in ETDs can be very expensive because for levying final charges against theft, On-site inspection is needed as proof for energy theft. The amount of data about electricity usage has multiplied exponentially in recent years due to the expanding use of smart meters (SMs), and so on. A popular area of research at the moment is the data mining, analysis, and efficient use of big data (Chen, 2014; Zhou et al., 2017). Additionally, use of ensemble machine-learning algorithms where more than one machine-learning method is used in combination to give more accurate and precise result than a single machine learning algorithm. Ensemble models are essentially used to improve the efficiency and performance of classification problem.
The following is a summary of the key contributions of our work
The proposed model leverages smart meter data to utilize K-Means, long short-term memory (LSTM), recurrent neural network architecture, and the XGBoost ensemble method. Its purpose is to aid electric utilities with limited inspection staff in identifying clusters of electricity theft and, consequently, pinpointing the fraudulent consumers engaged in theft. This approach is designed to diminish FPR, particularly in areas where climate fluctuations significantly affect regular electricity supplies.
The model operates in two stages. Initially, a master energy meter is installed on the transformer side to aggregate smart meter readings for the total electricity usage in the area, revealing nontechnical losses (NTLs). Anomalies are detected using the LSTM-XGBoost ensemble machine-learning model to identify deviations from normal electricity consumption behavior. This model relies on consumption patterns and short-term usage forecasting, showcasing enhanced detection rates (DR) and low FPR compared to other classification-based ETD models.
The study utilizes electricity consumption dataset from state grid corporation of China (SGCC), Kashmir Power Distribution Corporation Limited (KPDCL) for experimentation and validation. To address unbalanced datasets, theft data are incorporated into the dataset after anomalies are detected over time, and records are saved as sensitive records. If a physical inspection confirms the anomaly as theft, these sensitive records are added as theft records; otherwise, they are added as normal data in the dataset until a sufficiently large dataset is prepared. The dataset is then divided into “benign” and “malicious fake attack” sets, and additional data attacks are synthetically added to balance the dataset. This approach effectively mitigates the FPR, enhances the DR, and identifies various types of stealing attacks.
K-Means clustering is employed to group consumers with similar electricity state and availability. Forming clusters based on similar parameters and environments significantly reduces the false-positive rate. Clustering aids in training the classifier to detect anomalies in cities or provinces experiencing erratic supply due to feeder overloading, high demand, low energy availability, and frequent faults during adverse weather conditions.
The other parts of the paper are section II which presents the related work about ETD. Section III that describes the methodology approach used for identification of theft to address the false positive rates (FPR) in machine learning-based ETD. Section IV discusses the methodology application phase of proposed K-Means-LSTM-XGBoost (K-MLX) model in detail. Comparison, Training, and selection of model is described in Section V. Evaluation of model is described in Section VI. Finally, conclusion is presented in Section VII.
Related work
Several machine-learning and statistical models have been proposed for ETD in the literature; however, they require manual feature engineering and specific domain knowledge to be effective. Since it is difficult to extract underlying characteristics of electricity consumption from one-dimensional data as most of the current models are employing only one-dimensional data (Smith, 2004). The authors of Wen et al. (2018) make an identical argument, that a lack of adequate features engineering in many existing machine-learning models causes the models to produce poor generalization outcomes. As an added challenge, the current model use dataset which is multidimensional. Therefore, it's a very challenging task to extract the most abstraction features from the high-dimensional data. Weak feature engineering generally leads to high FPR, which lowers the system’s performance.
The researchers acknowledge the fact that there isn’t any adequate feature engineering processes described in previous methodologies in Salinas et al. (2012), Cárdenas et al. (2012), Nagi et al. (2008), and Nizar et al. (2008). The feature engineering methodology demands extended time and subject understanding. In contrast, the auto encoder is employed in Cárdenas et al. (2012) to extract semantic information from high-dimensional electricity user behavior. It still needs to be enhanced in order to detect sophisticated attacks, such as zero-day attacks, with accuracy. According to the researchers of Muniz et al. (2009a) and Cody et al. (2015), in the literature, the characteristics related to electricity consumption are essentially made directly employing subject expertise. But, arbitrarily changing patterns in usage of electricity by consumers are insufficient for efficient pattern recognition and NTL detection for general users and particularly for industrial users.
The authors of Muniz et al. (2009b) and Krishna et al. (2015) emphasize that several earlier research use various machine and deep learning models for efficient ETD and feature building. But, none was able sustain long-term temporal connection of a consumer electricity consumption pattern for reliable ETD. It is also challenging to identify underlying patterns with one-dimensional power consumption data. In comparison, common machine-learning models in Lo and Ansari (2013) and Khoo and Cheng (2011) have poor detection capabilities and performance due to a variety of nonmalicious reasons. A semisupervised learning-based method for ETD is proposed in Amin et al. (2012). However, this still demands enhancement to increase DR and decrease FPR.
Based on the table summarizing the research studies in Table 1, several technical gaps are identified in existing methods that the proposed K-MLX model aims to address.
Comparison of various ETD techniques.
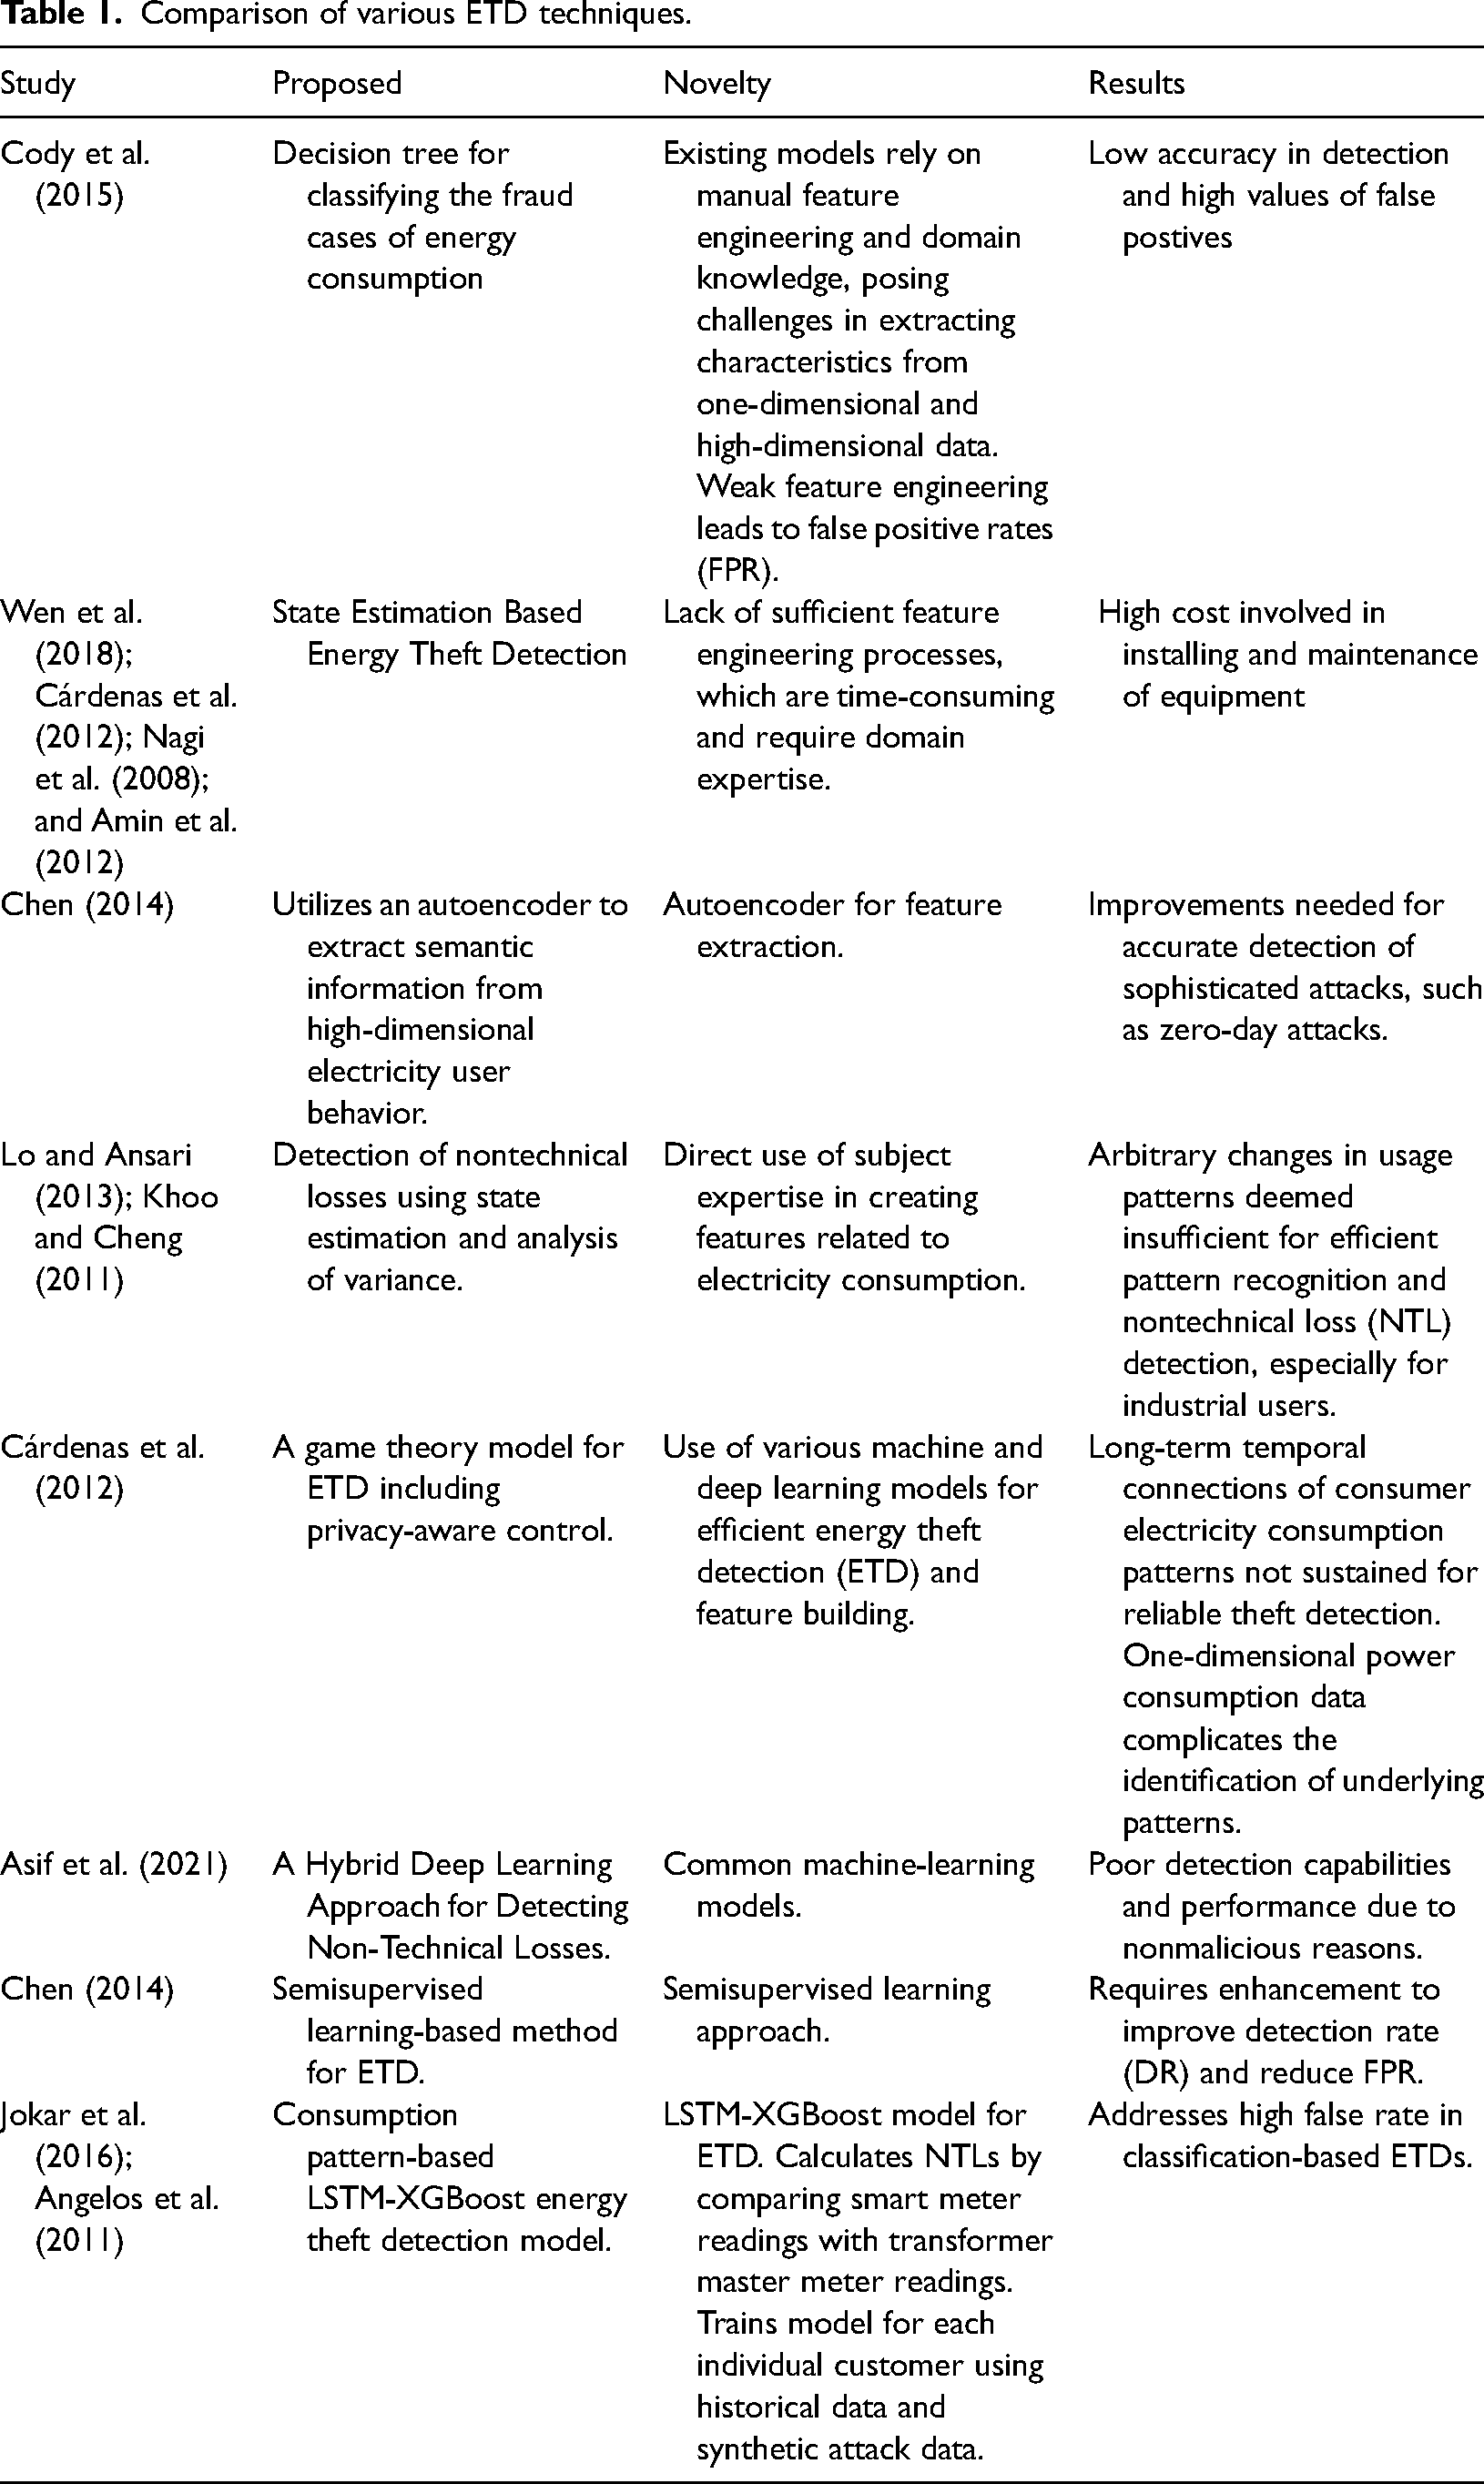
Existing ETD models heavily rely on manual feature engineering, requiring-specific domain knowledge, leading to time-consuming and challenging processes. Current models struggle to extract meaningful characteristics from one-dimensional data, hindering the identification of sophisticated attack patterns. Inadequate feature engineering often results in poor generalization outcomes and impacts model effectiveness in real-world scenarios. Complexity arises from the use of multidimensional datasets, making it challenging to extract abstraction features and detect theft patterns. Limited efficiency in pattern recognition for NTL detection is due to insufficient feature engineering, particularly affecting industrial users. Furthermore, existing models fail to sustain long-term temporal connections in consumer electricity consumption patterns, crucial for reliable theft detection. Common machine-learning models exhibit poor detection capabilities, especially when anomalies are nonmalicious. Semisupervised learning-based methods in ETD require enhancement to improve DR and reduce FPR. Many existing machine-learning and statistical models require manual feature engineering and specific domain knowledge to achieve effectiveness, as highlighted in Cody et al. (2015) and Muniz et al. (2009b).
The proposed K-MLX model aims to address this gap by automatically extracting relevant features from the data using the LSTM component, reducing the need for manual feature engineering.
Challenges in extracting features from high-dimensional data: Studies (Cody et al., 2015; Muniz et al., 2009b) mention the difficulty in extracting underlying characteristics from high-dimensional data using one-dimensional approaches. The K-MLX model aims to tackle this challenge by leveraging the capability of LSTM networks to handle sequential, high-dimensional data and capture temporal patterns. Lack of long-term temporal pattern recognition: As mentioned in Amin et al. (2012) and Enguo and Xuan (2011), existing methods struggle to sustain long-term temporal connections of consumer electricity consumption patterns, which are crucial for reliable theft detection. The LSTM component in the proposed model is designed to capture and learn these long-term dependencies, enabling better recognition of temporal patterns in electricity consumption data. Inefficient handling of nonmalicious anomalies: Common machine-learning models mentioned in Jokar et al. (2016), Enguo and Xuan (2011), Yang et al. (2011), and Anas et al. (2012) exhibit poor performance due to their inability to distinguish between malicious and nonmalicious anomalies in electricity consumption data. The K-Means component in the proposed model aims to cluster customers based on their consumption patterns, enabling the LSTM-XGBoost model to learn customer-specific patterns and better differentiate between malicious and nonmalicious anomalies. High FPR and low DR: Studies like Chen (2014) highlight the need for improving DR and reducing FPR in energy theft detection models. The combination of K-Means clustering, LSTM feature extraction and XGBoost classification in the proposed model aims to address this gap by providing a more accurate and robust energy theft detection system. By addressing these technical gaps, the proposed K-MLX model aims to provide an improved and more effective energy theft detection solution compared to existing methods.
The current study proposes a consumption pattern-based LSTM-XGBoost energy theft detection model to address the high false rate in classification-based ETDs. The novelty lies in the LSTM-XGBoost model and the approach of calculating NTLs by comparing smart meter readings with transformer master meter readings, training the model for each individual customer using historical data and synthetic attack data. This research utilizes a pattern-based approach combining K-Means, LSTM, and XGBoost for detection of theft in electricity usage, employing innovative techniques to address the high FPR in detection rate. The model begins by calculating NTLs by comparing combined reading of usage reported by the SMs with the total amount of consumption measured by transformer master meter in each neighborhood. If a NTL is recognized at this level, consumers in the area who exhibit aberrant patterns will be picked as potential malicious users. Model is selected after training it for each individual customer by employing both the user’s historical data and a synthetic attack data. After that, the classifier is selected and put to use to determine whether or not a new sample is malicious or benign.
This study employs the K-MLX to solve the classification problem and use the combined approach on the SGCC and Power Distribution Corporation Limited (PDCL) electricity consumption dataset and simulate the various attacks as per the scenarios of real-world to constitute supervised learning problem. The model is used for classification of data samples to detect anomaly in the consumer’s electricity consumption behavior based on abnormal pattern. The primary objective of this innovative approach is to reduce FPR in areas where traditional machine-learning models struggle. By focusing on challenging environments with varying power supplies and seasonal changes, the integrated model aims to improve the accuracy and efficiency of ETD. The proposed integrated model combines smart meter data, uses K-Means clustering, and employs an integrated ensemble of LSTM-XGBoost algorithms to assist electric utilities with limited field staff in identifying theft clusters. This approach aims to reduce FPR in areas where seasonal changes, voltage fluctuations, and scheduled and unscheduled electricity shutdowns affect regular electricity supply.
Problem statement
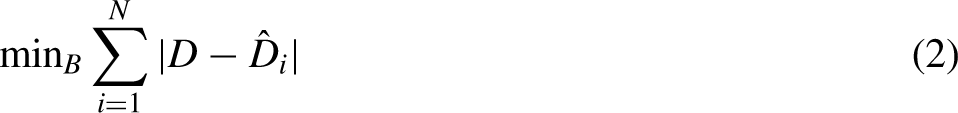
Let the electricity usage dataset be represented by users X (X 
Algorithm of K-MLX
The proposed K-MLX model addresses gaps in existing energy theft detection methods. It combines K-Means clustering to group customers by consumption patterns, LSTM networks to extract temporal features from sequential data, and XGBoost for robust classification. This approach tackles challenges like manual feature engineering, handling high-dimensional data, recognizing long-term patterns, and reducing false positives (FPs). By clustering customers, the model captures customer-specific behaviors and anomalies. The LSTM extracts relevant features, overcoming manual engineering. XGBoost handles nonlinear relationships, improving accuracy. Results demonstrate higher DR, better precision-recall balance, lower FPs, and robustness to nonmalicious anomalies, improved temporal pattern recognition, and scalability over traditional methods.
Mathematically the model can be shown as:
Step I: K-Means Clustering Objective Function: Step II: LSTM network equations defined below governs the flow of information within an LSTM unit, allowing it to learn and retain long-term dependencies in sequential data. This is useful for detecting patterns indicative of electricity theft in consumption data. We have: Step III: XGBoost Objective Function:
Where k is the number of clusters, 
Equation (4) known as forget gate describes what information should be discarded or kept in the cell state. Here 


In Equation (10), L is the loss function, yi is the observed values, 
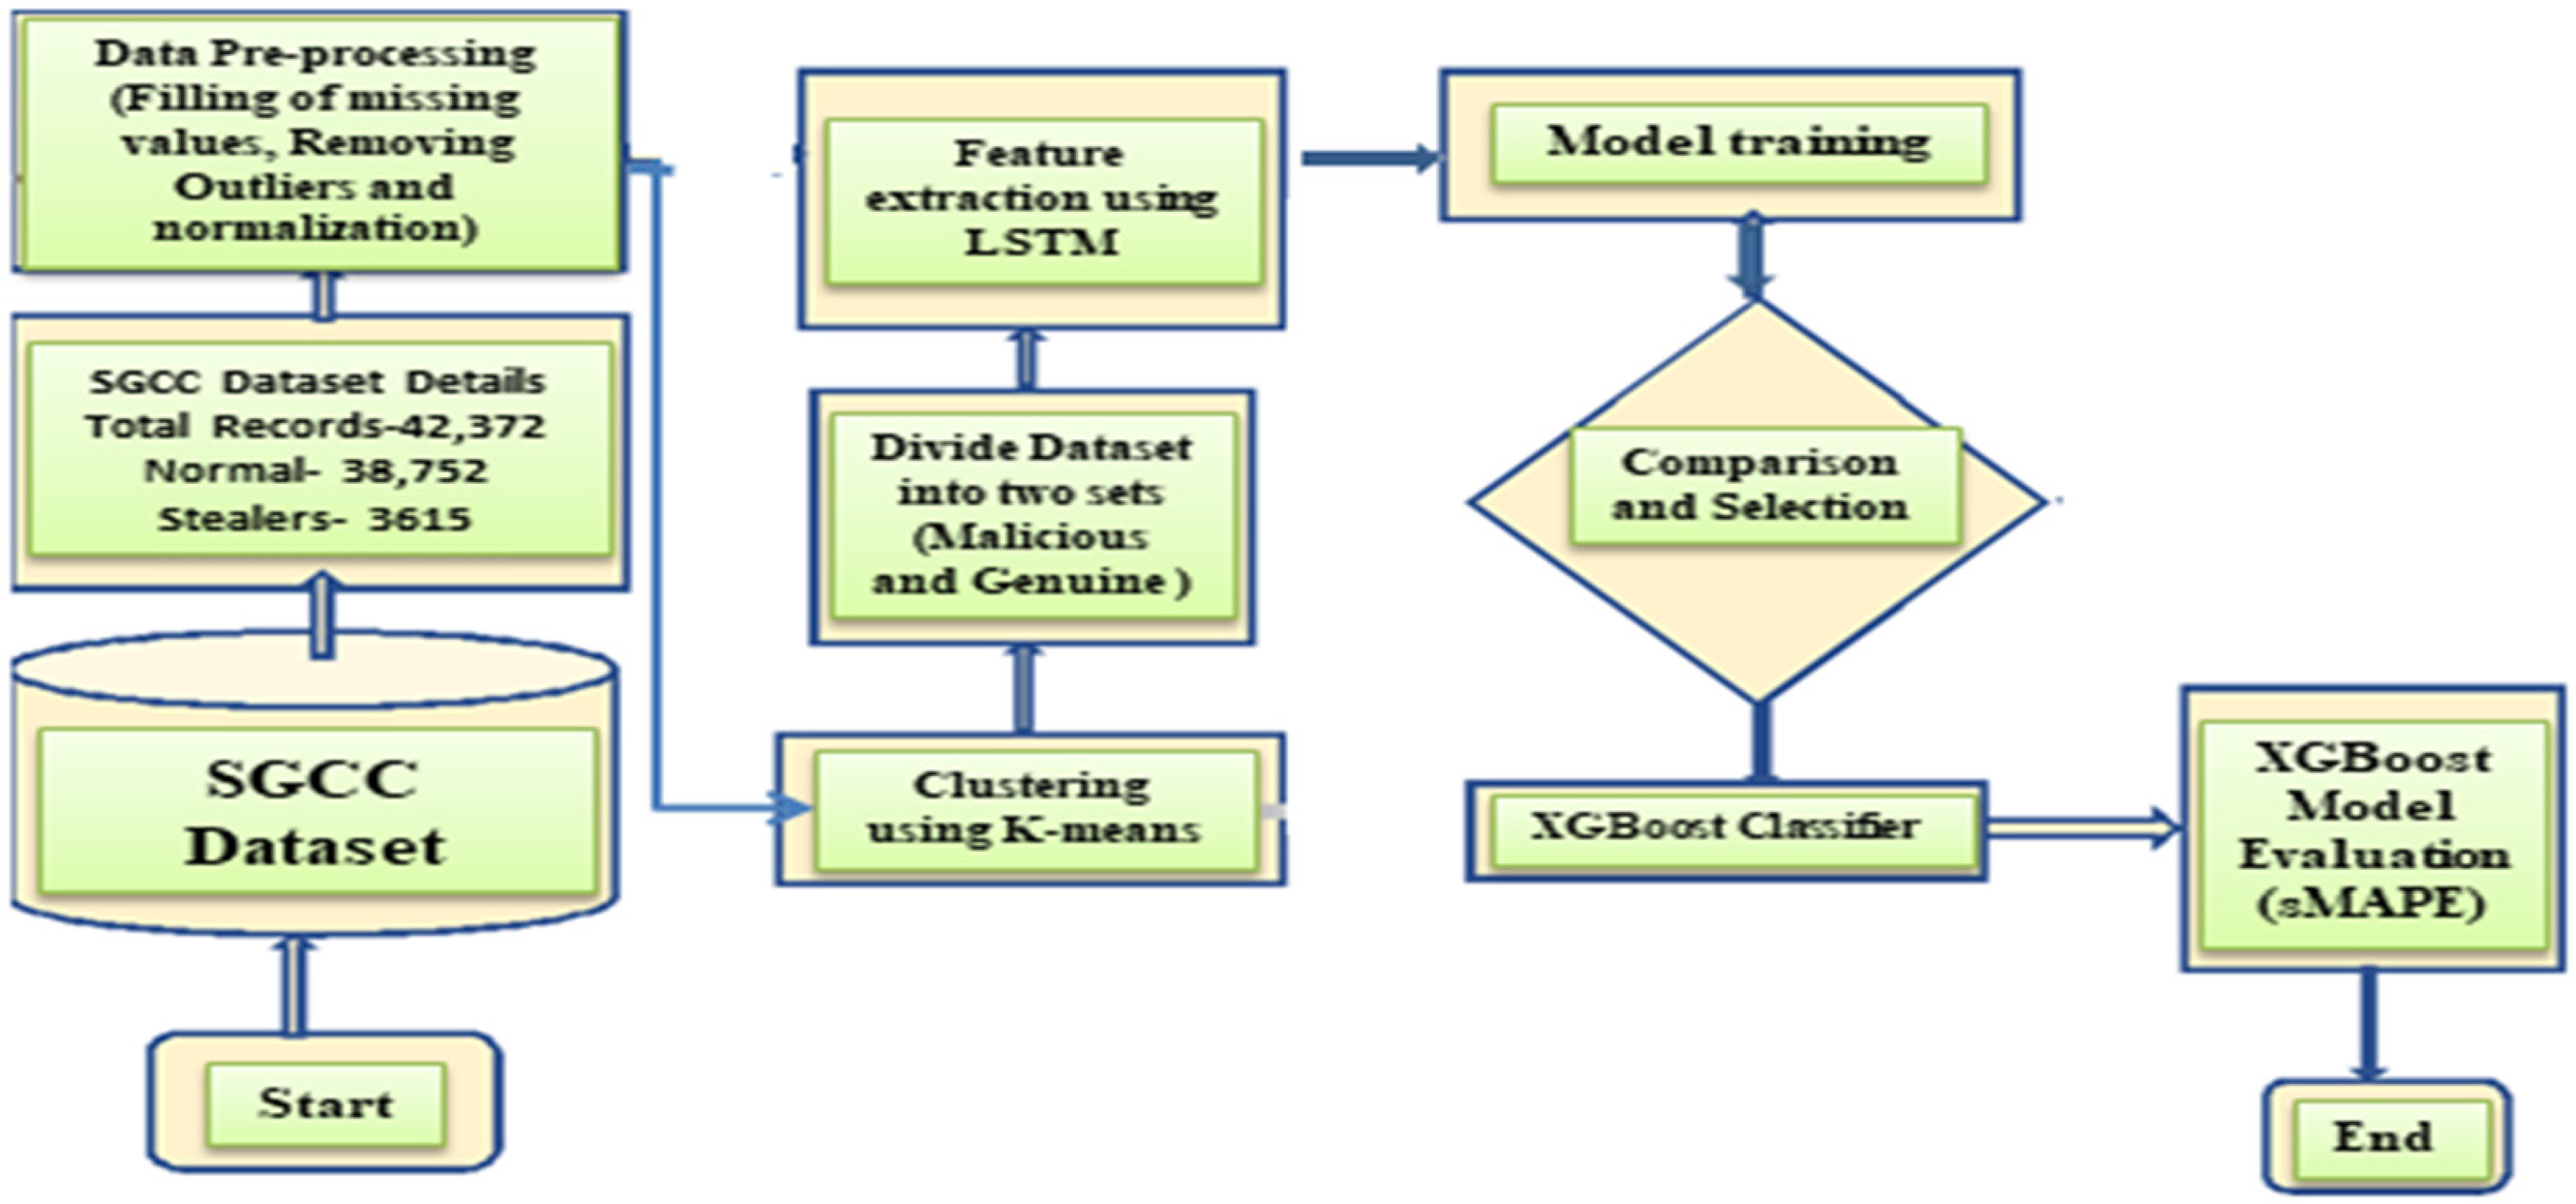
This section discusses in detail how each segment of proposed model works. Figure 1 shows how the proposed method works from start to end. We argue that the permissible FPR depends on regionally varying parameters such as the theft rate. The steps executed in model to accomplish our goal of ETD are based on ensemble ML method. The proposed model K-MLX is generally employed for detection of electricity theft on SMs data but more specific can be used to reduce FPs in the areas that experience harsher climatic conditions, erratic power supply and varying peak time demand during different seasons.
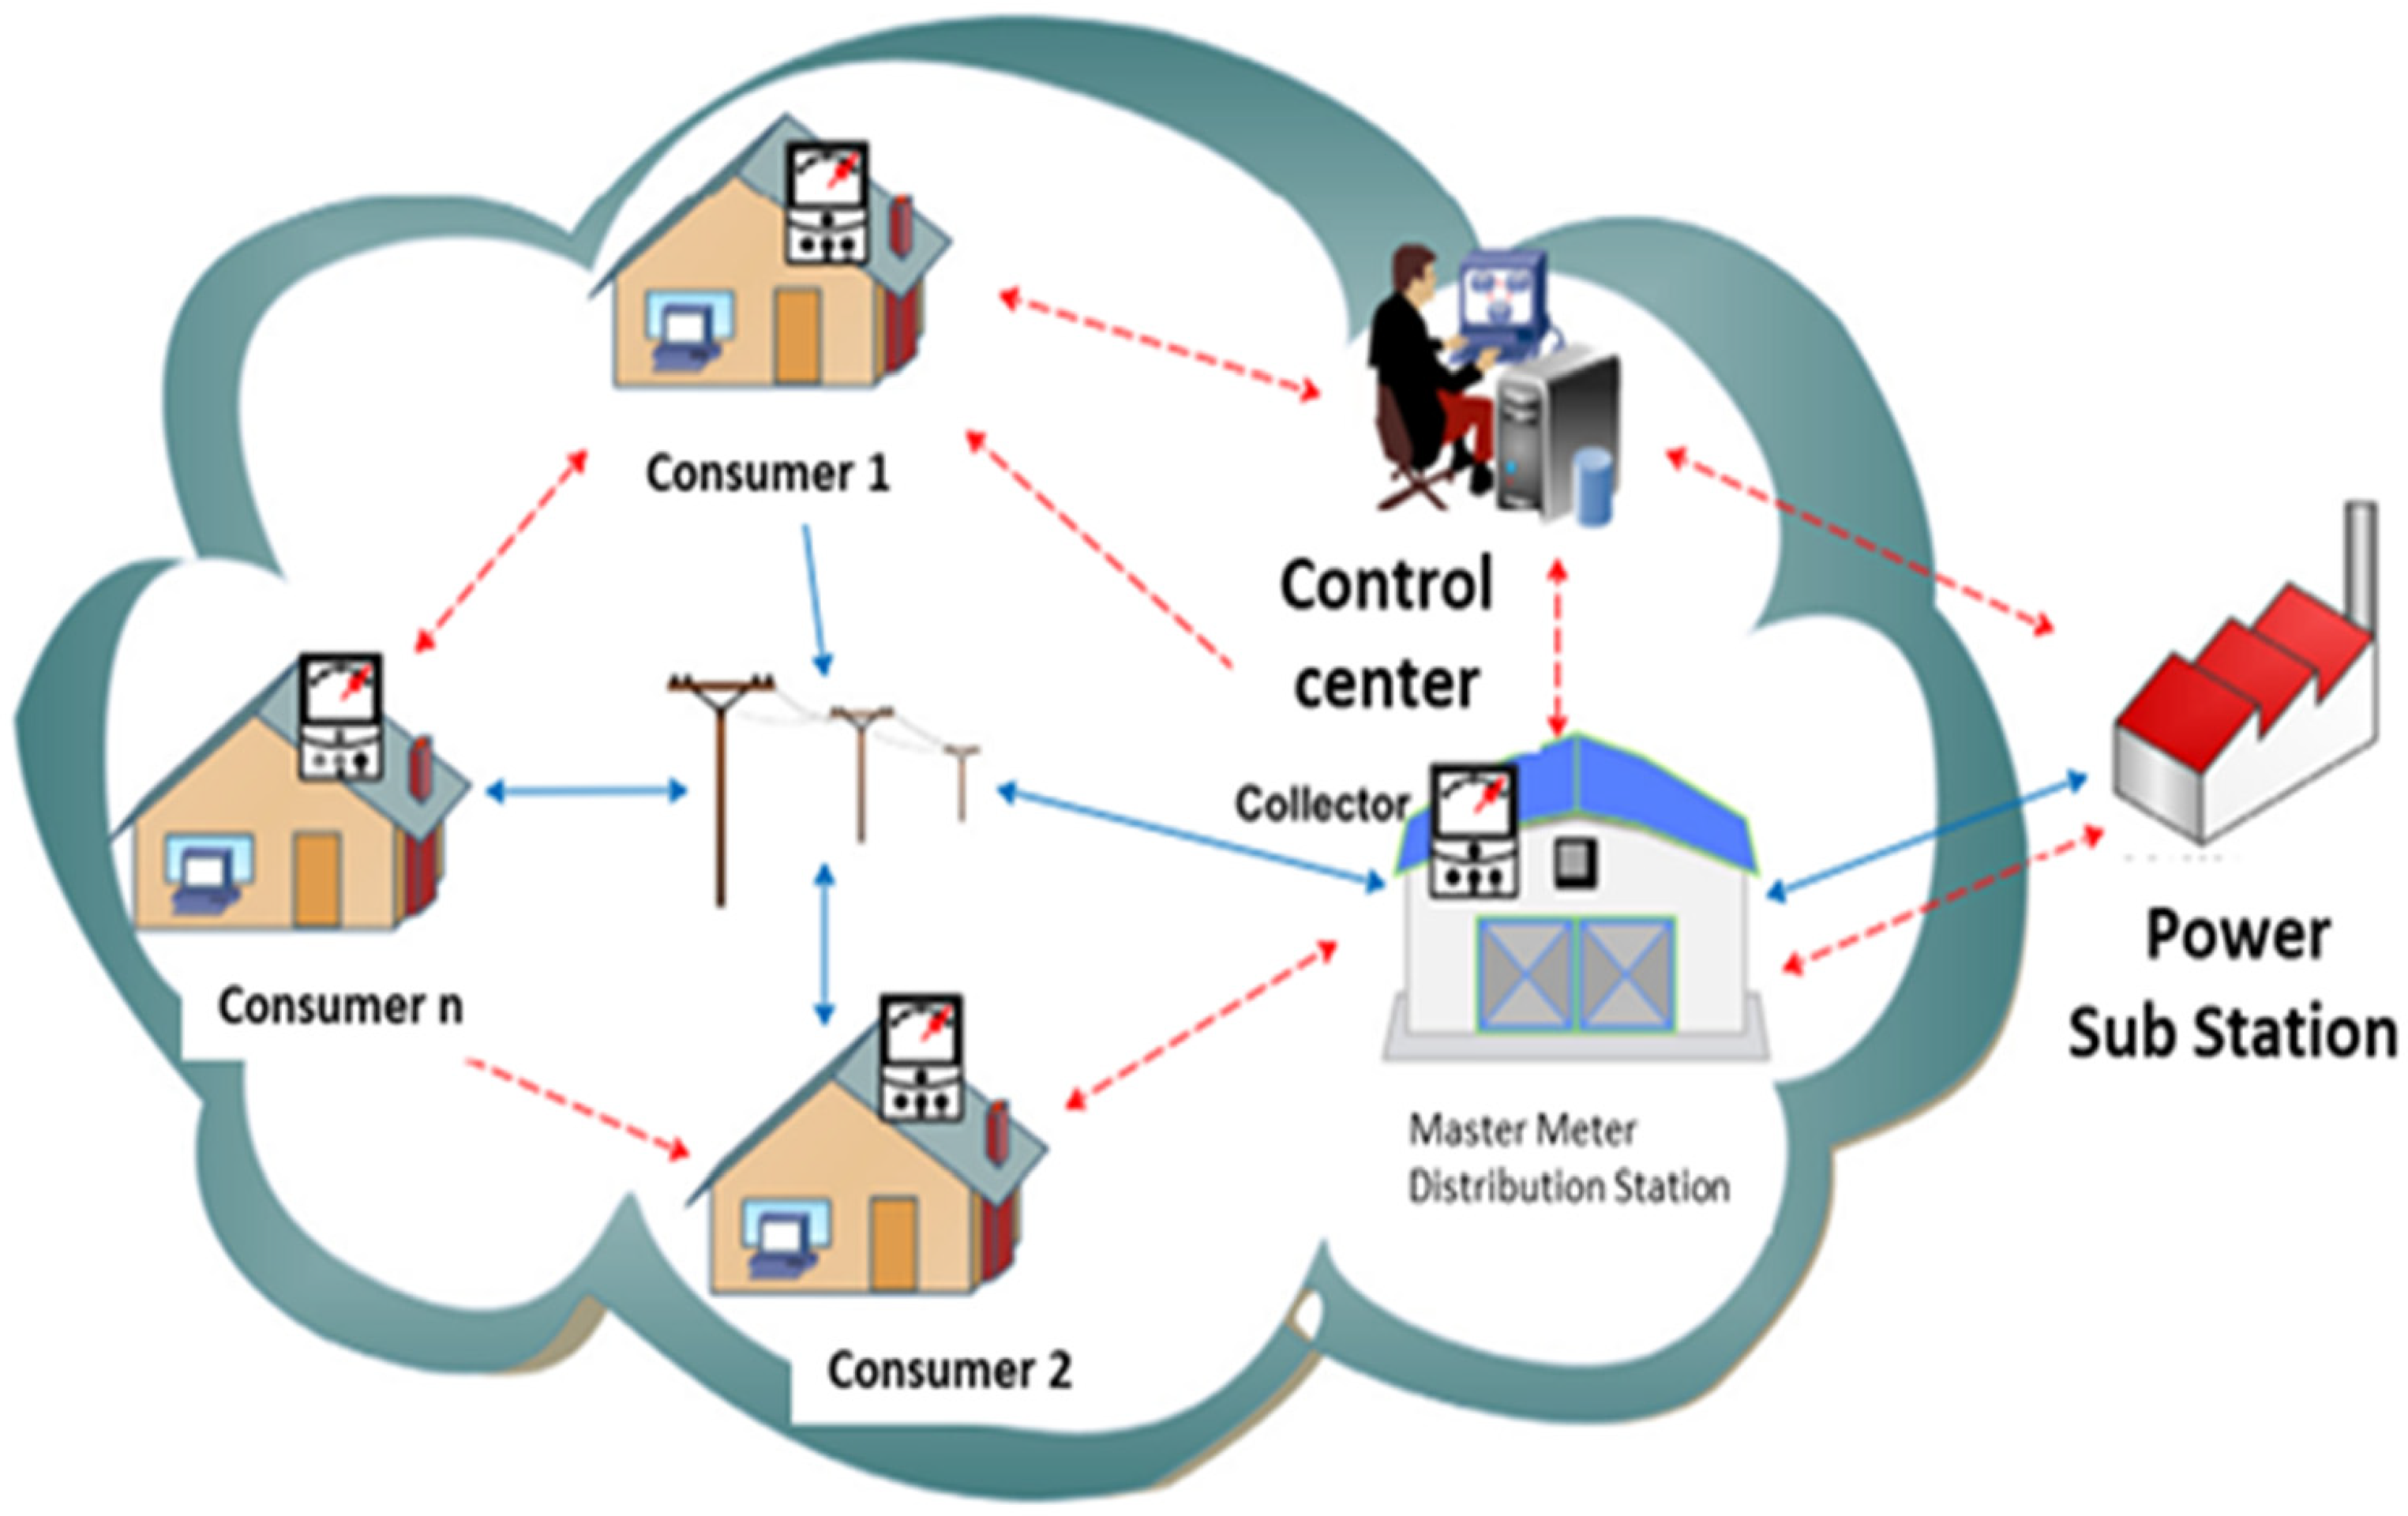
An overview of consumers smart meters connected to control center for precise anomaly detection.
For data Preparation, interpolated median method is used for imputation to handle the missing values Three-sigma rule for removal of outliers. Min-Max method for quantifying categorical data in the dataset.
K-Means clustering is used for clustering of consumers where electricity is being provided in a similar way, considering those cities or provinces where supply is erratic due to feeder overloading/high demand, and low availability of energy, or where electricity remains off due to frequent faults occurring due to wind, snow, rain, etc. A cluster is formed based on similarities in the availability and consumption of electricity.
Dataset is divided into two sub-sets one having malicious samples and another with genuine data. Synthetic data attacks are generated with six different types of attacks to remove the class imbalance, and over-fitting issues. For extracting important features and reducing the dimensionality of a high-dimensional electricity dataset, our model uses the LSTM technique.
Finally, the XGBoost ensemble method is used to determine the genuine and malicious samples.
To assess the model's effectiveness, interpretation and validation are carried out using the symmetric Mean Absolute Percentage Error (sMAPE) algorithm and standard metrics, and then compared to existing ML techniques such as k-NN, Extra Trees, MLP, Random Forest, SVM, logistic regression, AdaBoost, and so on. The results show that the proposed KSLX model outperforms existing techniques for detecting and removing FPs. After looking at the data of customers who stole energy and were penalized for it, the proposed model was 83% accurate.
Methodology proposal
The study’s key contributions are as follows:
Development of a novel hybrid model that integrates K-Means clustering, LSTM networks, and XGBoost for classification of theft and nontheft cases. Utilization of K-Means clustering to effectively segment customers based on their consumption patterns with similar features. Implementation of LSTM networks for extraction of temporal features from sequential data. Employment of XGBoost for robust classification, enabling the model to handle complex patterns and reduce FPs. Performing a thorough analysis to showcase the better performance of the proposed model over existing techniques, with potential for generalizing the model to other domains involving time-series data analysis.
The proposed model could be employed to identify potential energy theft instances by leveraging K-Means clustering for capturing consumption patterns, LSTM networks for temporal feature extraction, and XGBoost for robust classification. The model’s ability to handle high-dimensional data and capture long-term dependencies could prove advantageous in detecting sophisticated theft techniques. By deploying the model, the utility company could reduce revenue losses, enhance operational efficiency, and promote responsible energy consumption practices. The insights gained from the model could inform targeted inspection and enforcement strategies, further deterring energy theft.
A significant amount of metering data collected from SMs is actually used in order to analyze the consumption behavior of a consumer. The data utilized for analysis includes electrical power parameters i.e., voltage, current, power factor and nontechnical parameters daily/weekly/monthly usage details of electricity, connected sub-station information, connected feeder information, GIS information, and so on are all included in the electricity data for analysis (Enguo and Xuan, 2011) as shown in Figure 1. This study takes the transmission losses constant in all the clusters under study.
The abnormality detection based on analysis of electricity consumption behavior of consumer consists of the three primary components: the collection of user consumption data, the processing of user electricity data, and finally the analysis and verification of the user detection results (Messinis and Hatziargyriou, 2018; Yang et al., 2011; Anas et al., 2012).
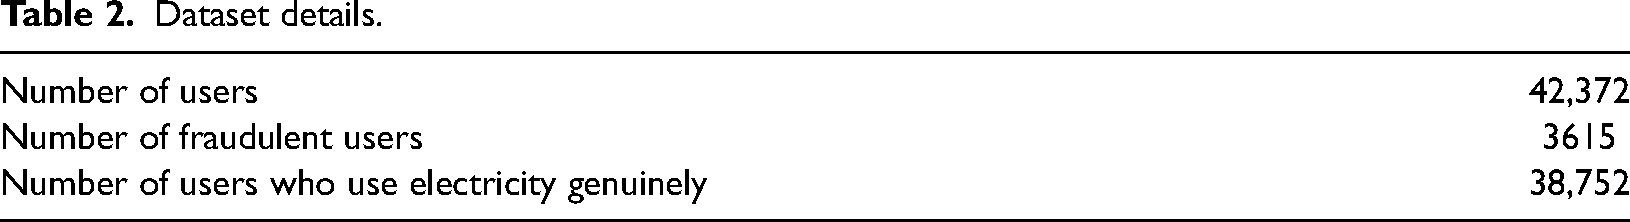
Dataset details
Training Phase: This study puts to use the SGCC dataset, which is publicly available at (http://www.sgcc.com.cn/) and is a real electricity consumption dataset for China. Another dataset PDCL was used and recreated by injecting the theft data. The SGCC dataset comprises 38,752 honest and 3615 fraudulent consumers for a total of 42,372 users shown in Table 2.
Apart from dataset of electricity consumption from SMs, including both normal and anomalous (energy theft) consumption patterns. Auxiliary dataset like weather data and GIS data is also used. The dataset cover a diverse range of residential and industrial customers, spanning different time periods (e.g., daily, weekly, monthly). The dataset is properly labeled, with instances marked as either normal or energy theft cases.
Data preprocessing: The dataset of electricity consumption often has erroneous and missing values because of problems with the energy meters, cyber-attacks, servicing, data transfer, and storage issues. Erroneous and noisy data has a poor impact on the model's performance. In this paper, the appropriate preprocessing techniques for specific problems are used (Asif et al., 2021). Linear interpolation method is used for filling in the missing values. It takes the average values of electricity consumption on the day before the current day and on the next day of the current day. Noise and outliers are also needed to deal so as to work the model well. In this paper, the “three-sigma rule of thumb” (TSR) is used to deal with the outliers. Finally, the data needs to be normalized to avoid poor performance of classification ensemble/ deep learning models on different forms of data (Asif et al., 2021). So Min-Max method is used for normalization. Set the range of values to similar metrics. Data from the user’s electricity usage is normalized using a Min-Max technique. The split in the dataset into training, validation, and testing sets, ensure a representative distribution of normal and energy theft instances in each set.
Dataset details.
Removal of Class Imbalance: The next step is to prepare a dataset for training on various classifiers. Using historical data, it’s easy to obtain benign samples for each customer. However, malicious or anomalous samples may not be available easily because the stealing of electricity doesn’t happen more often as can been seen in Figure 2.
Class imbalance between theft and nontheft data in the real-world dataset.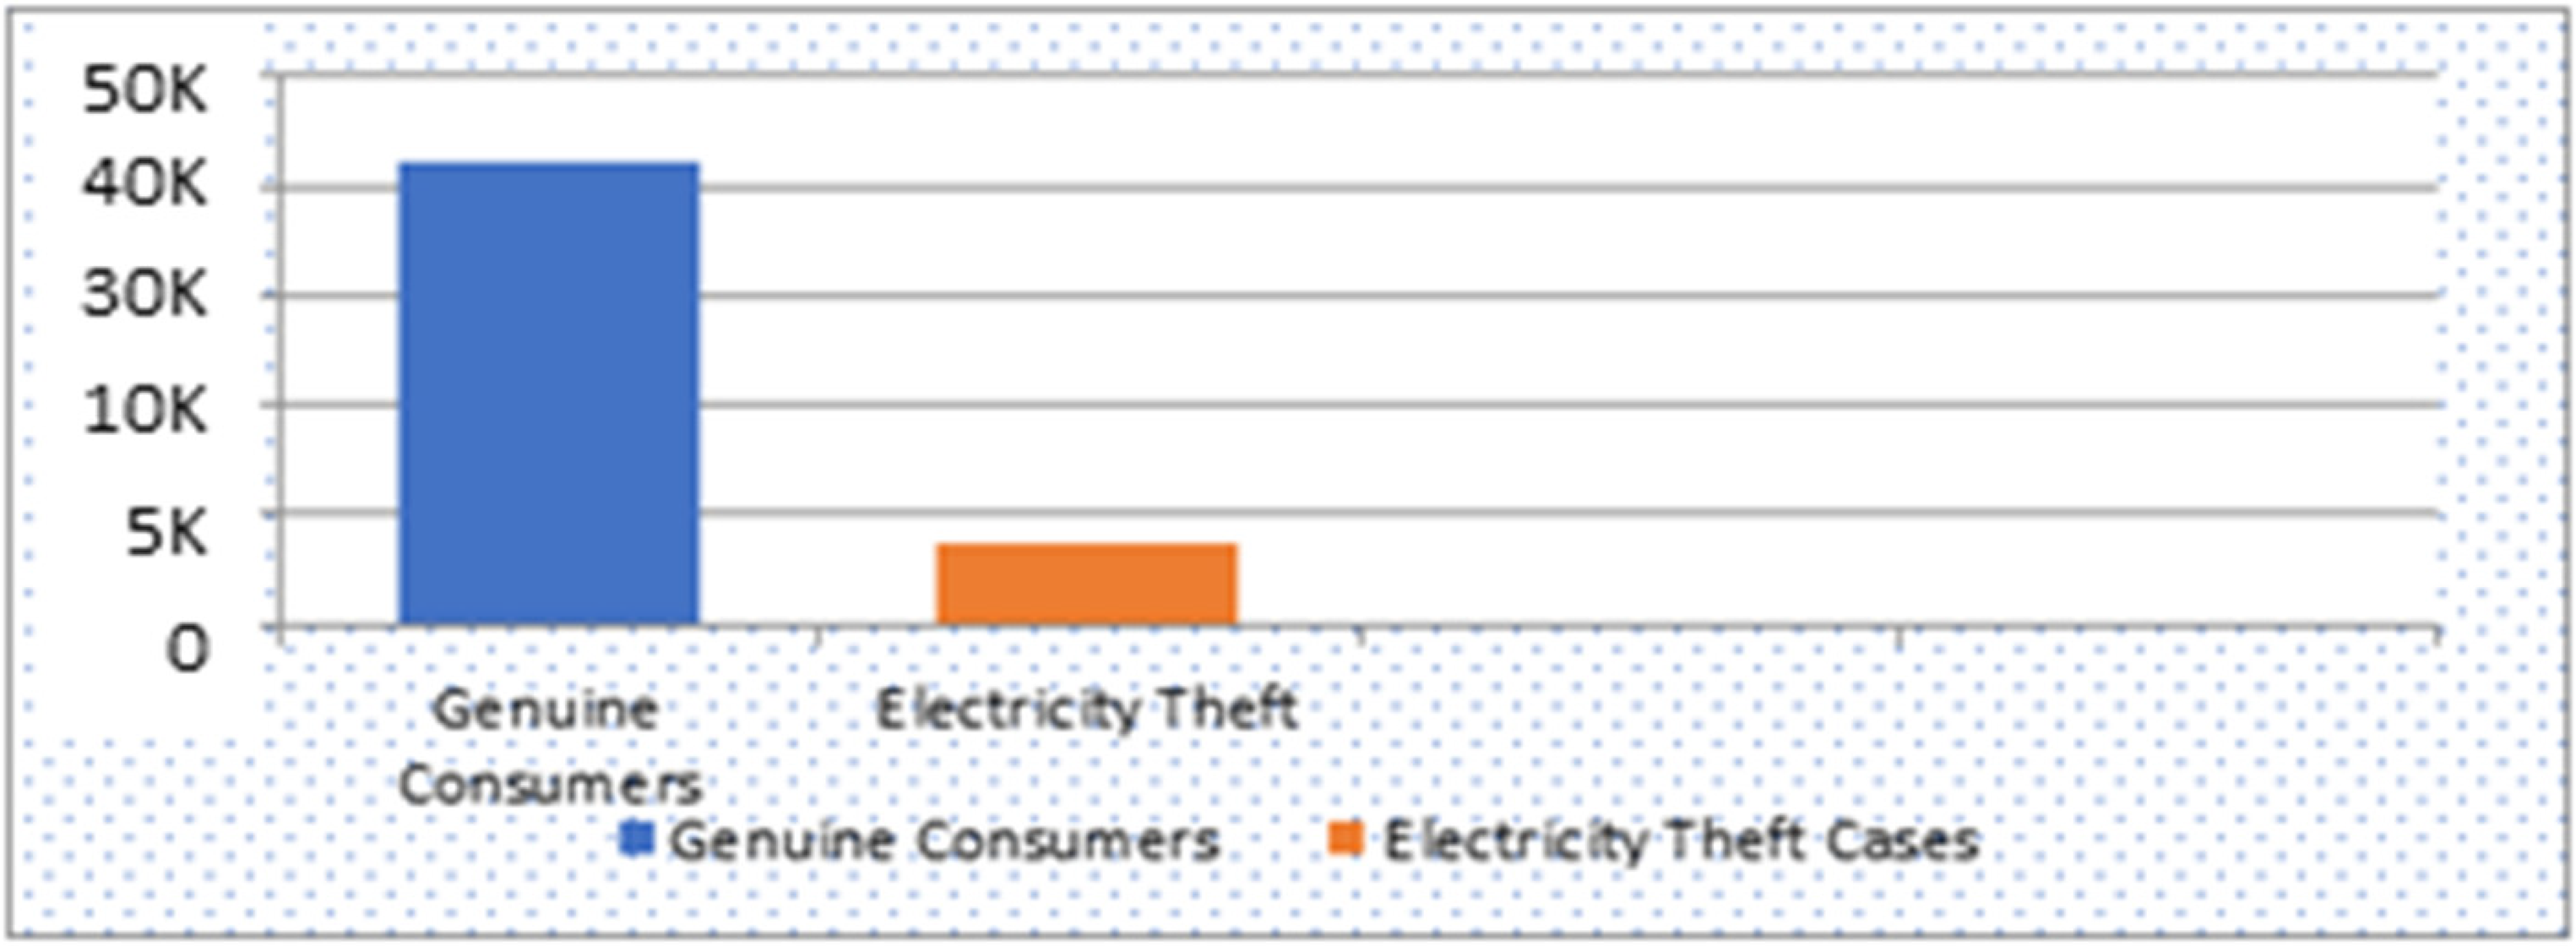
One way to deal with the problem of imbalanced data is to use single-class classification techniques, in which the classifier is trained using only normal samples. But, the one-class classifier doesn’t work well for this type of problems. Density function approximation methods, like the ones in (Jokar et al., 2016), are another way to solve the problem. But these methods only work if the approximation function can model the data accurately, which might be hard to do in real life. Instead, we want to use the benign samples to make a set of malicious samples. The goal of the stealing is to report less energy use than the real amount or to move high usage to times when prices are low. So, in this study, the malicious samples are artificially created taking the reference of benign ones. We assume A Type 1 is that attack where a smart meter's reading is multiplied by the same parameter (say
A Type 2 is that type of attack where smart meter's reading is multiplied by a different random number at different times (say
A Type 3 attack is that type of attack, where a smart meter sends only half of the actual readings, i.e., 0.5 × x (half of the actual load x) during peak load time, i.e., night hours during the winter, and actual load during off-peak hours. This type of attack is known as a “load shifting attack” (Jokar et al., 2015). In a load-shifting attack, the attacker changes the readings during peak load times and sends the real readings when the system isn’t overloaded. This makes it hard to detect if someone is stealing electricity because the average load during peak hours looks normal. This kind of theft attack can be detected by using advanced machine-learning algorithms that analyze the use of electricity on a seasonal and hourly basis. A Type 4 attack is a form of electricity theft in which the average value of the consumption reading is multiplied by a random factor (
A Type 5 energy theft attack is an attack where the energy meters send the average value of energy consumption to the control center of the utility. This type of attack is known as a baseline attack (Jokar et al., 2015). A Type 6 electricity theft attack, also known as a reverse order attack is an attack, where fraudulent consumers send the readings of their consumption in reverse order to the utility during the day (Jokar et al., 2015). During this kind of attack, the highest readings taken during peak hours are sent out during off-peak hours, and the lowest readings are sent out during peak hours. This type of attack is typically done to avoid high dynamic pricing during peak hours. The impact of this type of attack can be difficult to detect because the readings appear to be plausible.
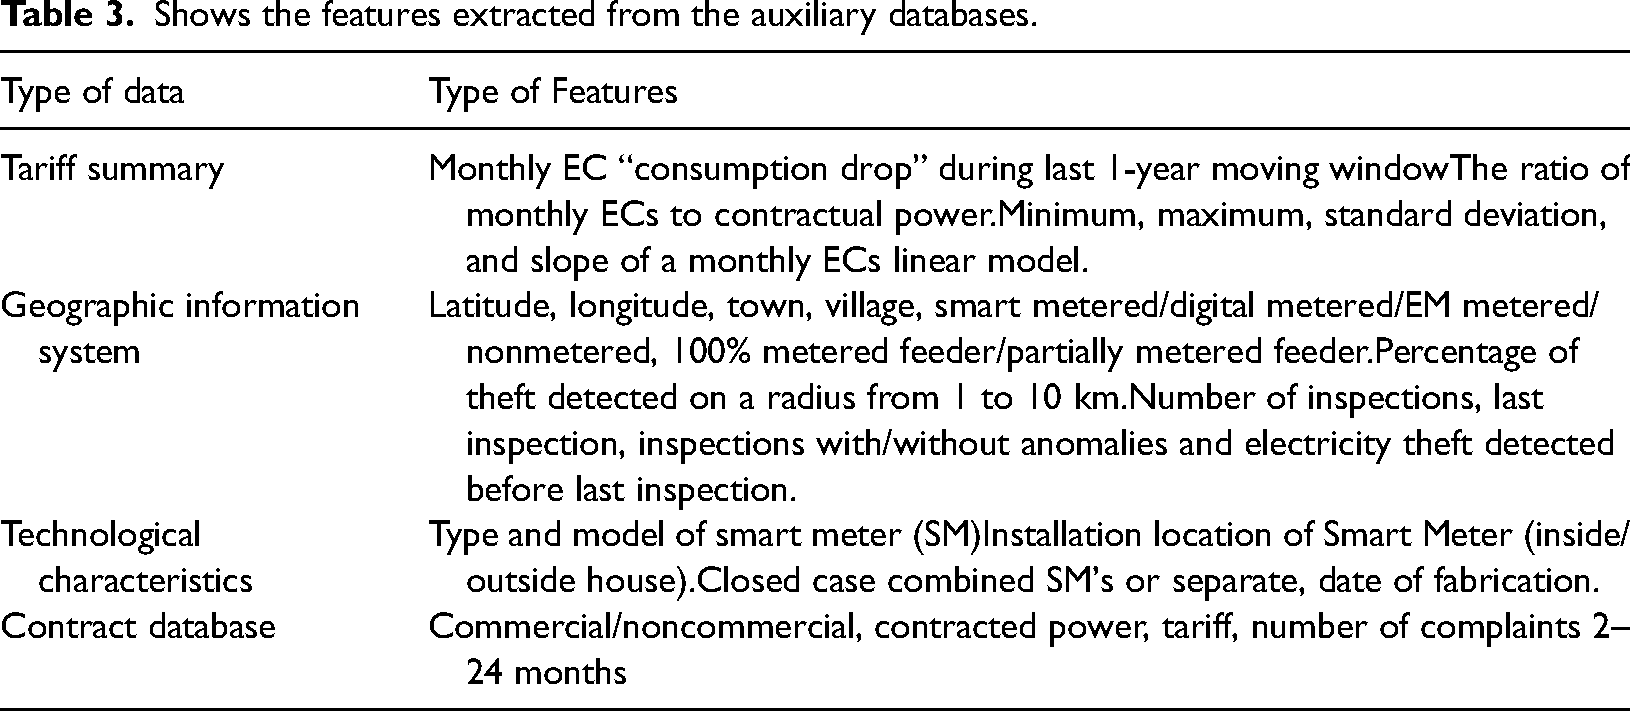
Feature extraction and dimensionality reduction: For each customer cluster, training is done using LSTM network on the time-series consumption data of customers in that cluster. The trained LSTM networks is used to extract relevant features from the sequential data, capturing temporal patterns and dependencies. Each data vector in the dataset contains a customer’s electricity readings over a 24-h period; for example, for n measurements per hour, the data vector has 24 × n components. There are several methods for dimension reduction that minimizes performance degradation by extracting only useful data features. The unusual data information on energy consumption caused by electricity theft is not always a single parameter, but a situation of electricity theft would cause several abnormal phenomena at the same time. In order to carry out theft detection, extensive features are required to be extracted from a variety of abnormal electricity consumption phenomena and quantified characteristics induced by a variety of abnormal energy consumption behavior (Angelos et al., 2011; Messinis and Hatziargyriou, 2018).
Shows the features extracted from the auxiliary databases.
Long short term memory (LSTM), a RNN-based DL is used to strengthen the feature extraction. LSTM (Adil et al., 2020) extracts key features as the electricity consumption adds records every fifteen minutes and makes it huge. So, dimensionality reduction is much needed in these huge datasets like the dataset. If a conventional recurrent neural network (RNN) (Rumelhart et al., 1986) is used for dimensionality reduction, it encounters issues of vanishing gradient and exploding gradient. For exploding and vanishing gradients, LSTM, an advanced RNN variant, is widely used (Pamir et al., 2022). After the RNN finds the time correlation between both the input data and the prior data during training, the output is completed. As its memory is temporary and short-lived, it can’t figure out how the current and previous states are related in time. However, LSTM captures temporal correlation smoothly (Pamir et al., 2022). It reduces the dimensionality of vast time series data. Its unique memory cells use historical data. LSTM memorizes significant features from huge time series data. This is saved and kept by the long-term memory (cell state) of LSTM. These important parts of the dataset hold the most important information.
Training the model: In this study, electricity theft is detected in two stages. One is the installation of a master energy meter at the substation transformer to measure the difference in energy supplied and revenue generated by the total number of SMs installed in the neighborhood, and the other is the application of a machine-learning algorithm to the cluster to detect anomalies in the consumer’s electricity usage.
Step I: The master energy meter installed on sub-station transformer measure the total amount of electricity supplied to customers in the neighborhood. Electricity supplied through the master EM is compared to sum of electricity consumed by consumers and recorded by their SMs installed and fed by the sub-station transformer equal to Step II: If Step 1 fails to detect anomaly in new sample and treat the sample as benign, the benign dataset is updated by adding the sample into it and the corresponding attack sample is made to add in the attack dataset. Step III: If the classifier detected the attack in Step 1, the classifier detects consumer’s SM anomaly in usage. When the anomaly is detected m number of times in a certain amount of time, this is treated as an indication of energy theft. During this study time of SM, all the new samples are temporarily stored in a temporary database. The onsite inspection could also be conducted to verify the energy theft. The onsite inspected is scheduled on priority if, the NTL is high in the smart meter and if many SM's in an area are having higher NTL. Further, if a theft is positive, the samples stored temporarily in another buffer database is transferred into the malicious database. If not, these attack patterns are not transferred into the malicious dataset but are added to the benign database. Step IV: Another possibility is that the machine-learning classifier finds an anomaly, but Step I didn’t find the NTL. Such a concern might happen by any one of three factors. It could be because the classifier has misclassified the anomaly or the NTL calculation isn’t correct, but this cannot happen for many days in a row. Thirdly, it could happen when consumers have alterations in consumption habits because of changes in the use of electrical appliances that can cause changes in electricity consumption. So, when the classifier finds an anomaly or outlier but master energy meter in Step I shows no signs of NTL, this sample is stored temporarily in a temporary database. If this happens for long time over the next few days, the old dataset is replaced by this temporary dataset. The classifier is re-trained on the updated dataset if it is large enough. Every smart meter has a unique binary variable called a credibility factor (CF), which is initially set to 1. The CFI is reset to one when the problem has been rectified and zeroed out when a nonmalicious anomaly is discovered, as explained above. Smart meters with CFI = 1 are more likely to take action when the algorithm determines that energy is being stolen. Through this algorithmic process, K-MLXS becomes robust against accidental shifts in consumption habits. Step V: Another possibility is if the anomaly is identified by master meter, (which calculates the difference in the readings supplied at transformer levels and total sum of the reading of all the individual SMs connected through that transformer to compute the amount of NTLs considering the amount of the TL losses as constant) but machine-learning algorithm does not detect the theft attack and it continues to be like that for many samples over time. In this scenario, when the benign customer dataset is examined for evidence of data contamination attack, here, the adversary gradually modifies data and contaminates the dataset to deceive the machine-learning model by treating the theft data as normal data. In this case, consumer is studied for consumption over time. A declining long-term electricity usage curve indicates contamination attack and the model raises alarm, even if the machine-learning algorithm has not detected the contaminated attack on the historic data. Also, the model continues its normal activities for new sample in this scenario. This type of attack happens rarely if a new heavy consumption load is directly linked to a line.
Methodology application phase
The suggested K-MLX model is divided into five stages: (1) data preparation, (2) data balancing, (3) dimensionality reduction and feature extraction, (4) classification, and finally (5) validation as shown in Figure 3. This section describes the basic structure of the model architecture as well as the execution steps. This model elucidates the use of the supervised ML method for the detection of anomaly in the electricity consumption of a consumer. Dataset used “SGCC” and PDCL electricity consumption dataset publicly available and for experimentation and validation of results respectively.
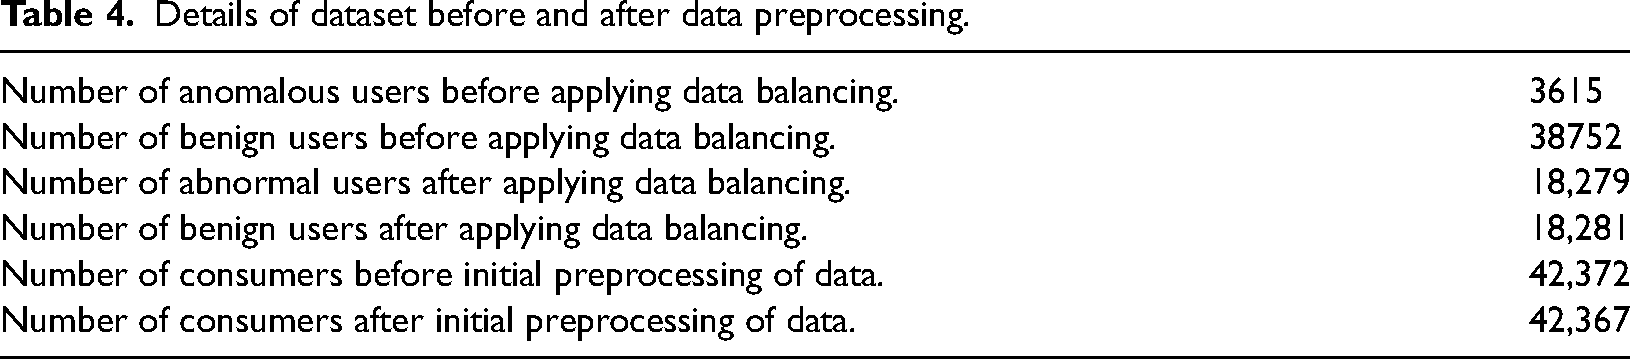
Data Preparation: Data preprocessing is necessary for the identification of anomalies in the electricity dataset because raw data often contains errors, outliers, missing values, and irrelevant information. Preprocessing helps to clean, transform, and standardize the data, making it more suitable for analysis and modeling. This makes the results more accurate and reliable, making it easier to identify people who steal electricity. Also, preprocessing can help reduce the number of dimensions in the data and solve the problem of class imbalance, both of which come up often when analyzing data on electricity usage. The removal of imbalance in the cases of theft and nontheft after applying the data balancing technique is shown in Table 4. Filling of missing values: Linear interpolation is a method that can be used to fill missing values in an electricity consumption dataset (Jokar et al., 2015). It estimates the missing readings based on the values of the other points in the dataset. Linear interpolation method uses a simple linear equation to estimate missing values based on the values of the other points in the dataset.
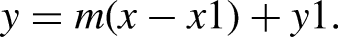
Flowchart of the proposed model for electricity theft detection (ETD). Details of dataset before and after data preprocessing. Given two data points (x1, y1) and (x2, y2), the linear equation can be represented as: y = mx + b, where m = (y2–y1)/(x2–x1) is the slope of the line and b = y1–mx1 is the y intercept. To fill a missing value, we can use the linear equation to estimate the value based on the values of the two surrounding data consumption points (Jokar et al., 2016). For example, given a missing value at x, we can use the linear equation to estimate y as: The value of m can be determined from the values of the two surrounding points, and the value of y can be estimated based on the value of x. This process is repeated for each missing value in the dataset, using the values of the surrounding points to estimate the missing values. Outlier detection: The TSR is a statistical method used to identify outliers in a dataset (Jokar et al., 2016). The basic idea behind the TSR is that a data point can be considered an outlier if it lies more than three standard deviations from the mean of the data. Mathematically, the TSR can be expressed as follows:
Let x be the data point in question Let μ be the mean of the data Let σ be the standard deviation of the data If The TSR is a simple way to identify outliers in a dataset and is a widely used rule of thumb for identifying outliers; It can be a useful tool for quickly identifying outliers in large or complex datasets. Clustering using K-Means algorithm This process is repeated until convergence or a maximum number of iterations are reached. The resulting clusters are analyzed to examine the patterns in the electricity consumption data that led to the formation of each cluster. The results of the K-Means algorithm are verified through a visual inspection before conclusions are drawn about the patterns in the electricity consumption data The K-Means algorithm can be represented by the following formula: C(i) = 1/n × Σ(j = 1 to n) x(j), where C(i) is the cluster centroid for the ith cluster, n is the number of data points in the cluster, and x(j) is the jth data point in the cluster The root of squared distances between the data points and centroids are added and calculated as mentioned in Equation (11): Feature extraction and dimensionality reduction using LSTM: LSTMs module consists of three gates, these are input (xt), output (ot), and forget (ft) gates. The forget (ft) gate selects whether the cell should keep or discard the current input (xt) and the hidden values (ht1) of previous state. The sigmoid (s) activation function uses ht1 and xt to decide whether to keep or discard the cell state’s previous output by selecting 1 or 0. The input gate selects data to change memory or cell states (Ct). The second sigmoid repeats the details from ht1 and xt and decides whether to keep or discard them. The cell state (Ct) uses the tanh activation function on ht1 and xt, for storing the result. Adding the multiplication of the “cell state, input gate, forget gate, and cell state outcomes” gives an updated cell state (Ct0). Finally, Ct0 gets updated. The final output gate (ot) conducts the sigmoid function on xt and ht1 and stores the result. Multiplying tanh(Ct0) and ot yields the next hidden state (ht). The product of the multiplication is applied to the sigmoid function and stored in the variable ht. Equations (12)–(17) elucidate the mathematical expressions for the forget, input, and output gates (Javaid, 2021; Wu et al., 2022). where bo, bi, and bf are the biases of output, input, and forget gate, Wi, Wo, and Wf are input, output and forget gate weights respectively. Ct and Ct0 represent past concealed state information and updated cell state information, respectively. LSTM feature extraction requires optimum hyperparameter settings. Two LSTM, two LeakyReLU, one batch normalization, and a single dropout layer comprise our LSTM feature extractor. The dropout probability for the dropout layer is 0.2, the learning rate (LR =


Comparisons, training and selection of the model
A 10-fold nested cross-validation was applied for model selection and evaluation. The model selection of hyper-parameters was done with the help of SGCC and PDCL customers. The model was fitted using benchmark ETD models: random forest, SVM, logistic regression (LR), k-nearest neighbors (K-NN), and LSTM using the Scikit-Learn toolkit. The fitting of the model with XGBoost (Liu et al., 2023) was done by using grid-search method of Python API Scikit Learn.
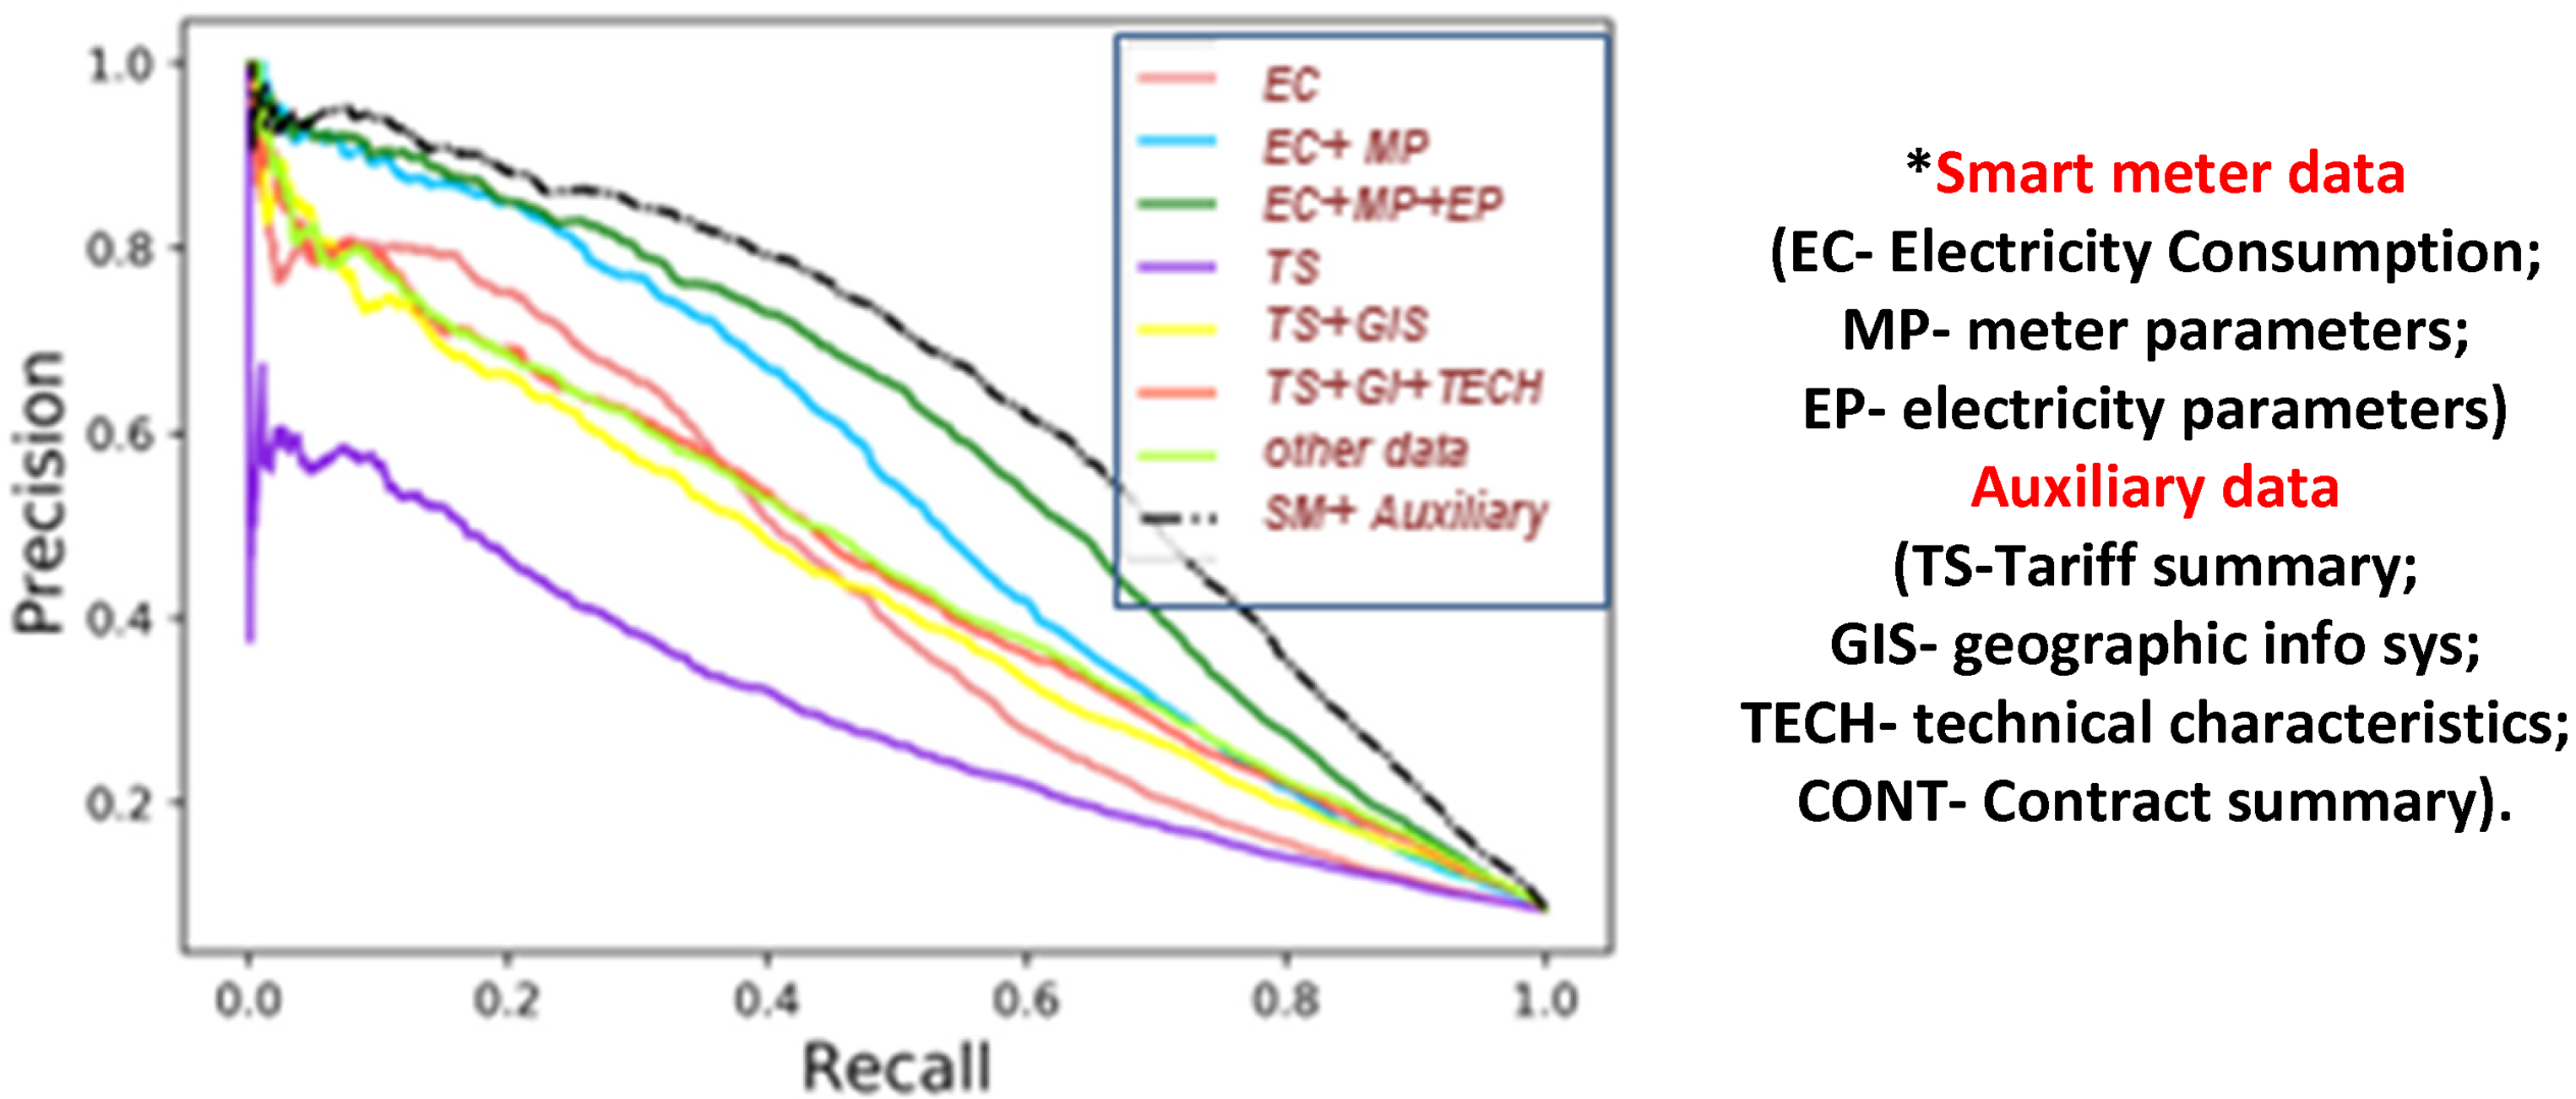
Precision Recall (PR)-Recall curves on various feature-set of dataset.
Model comparisons
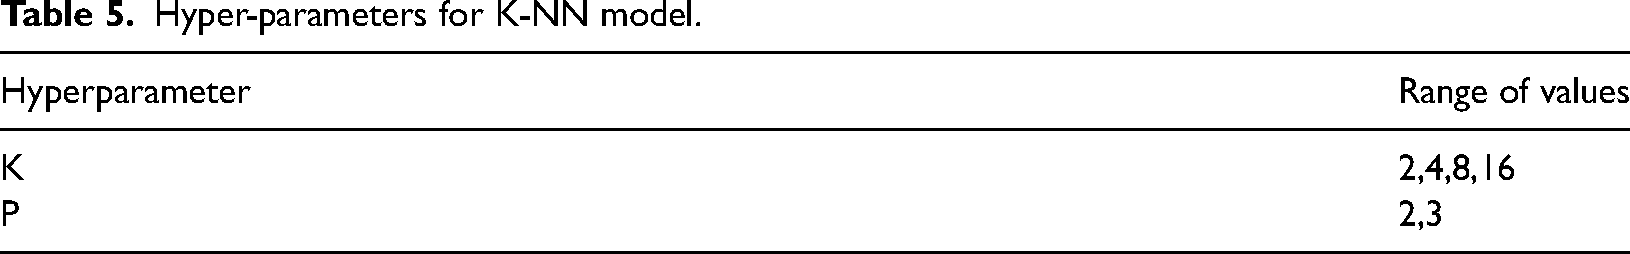
K-N: K-NN is the easiest algorithm to group things. At test time, K-NN uses training data to find the nearest neighbors. In ETD problems, the algorithm begins by using the previous theft data confirmed by field inspections or other means to help in finding anomaly in the usage behavior of the new consumer. So, to check out the likelihood of electricity theft in the new customer, the results of the previously detected fraudulent consumer's record of the nearest neighbor are averaged. Using k = 16 (neighbors) and p = 2 (power parameter set to 2) equal to the Euclidean distance, Table 5 shows the grid-search hyper parameters for the best results.
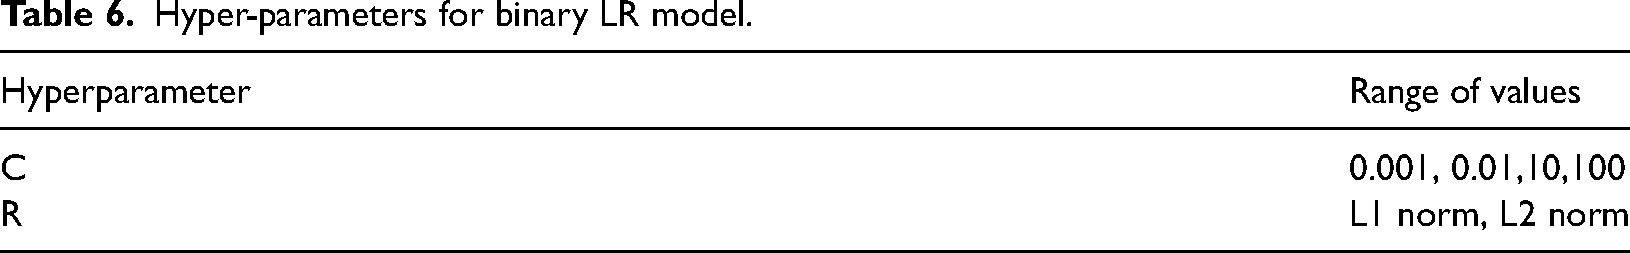
Binary LR algorithm: The sigmoid function used in LR classification takes input features X in the form of the matrix and multiplies each value with a weight matrix theta (Ɵ) as g(z) = Ɵ, where z = Ɵ The LIBLINEAR solver (Yan and Wen, 2021) was used to train the classifier on a logarithmic loss function. Table 6 shows the hyper parameters that LR uses when it does a grid search. The C-value of hyper parameter represents inverse of the regularization strength, and avoids overfitting of model during its training. The regularization type is shown by the R hyper-parameter. The validation proves that a C of 0.01 and an L2 regularization produced the best results.
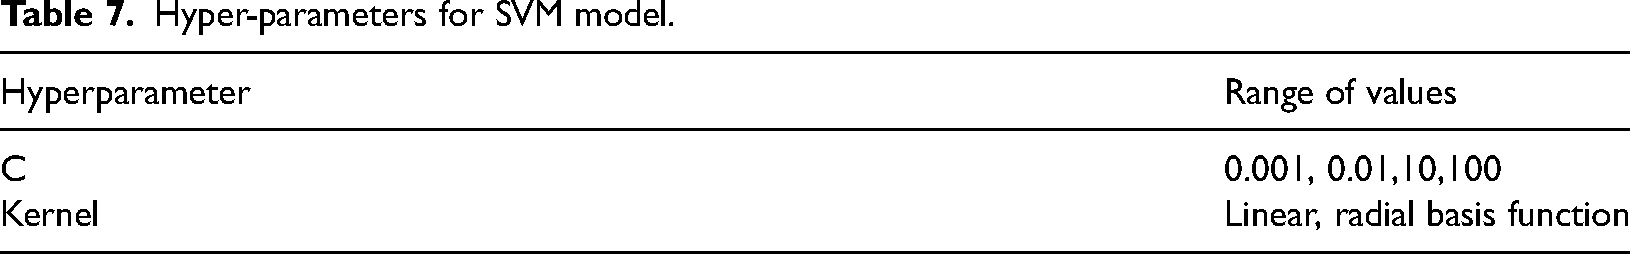
Support vector machines: SVM predicts decision values Instead of estimating probabilities,. To maximize the margin plane separating the two vector classes, the input characteristics are placed in a high-dimensional space and an SVM approach is applied (Yan and Wen, 2021). This gap is established by comparing the two classes’ support vectors. The training dataset customer examples most similar to the decision function are the ones used to create the support vectors. The regularization strength is represented by the hyperparameter C, which is analogous to the LR parameter. The kernel parameter is used to create a hyperplane separation between nonlinear customer groups in high dimensional space. We found that a C = 0.001 and a linear kernel produced the best validation fold results. Grid-search SVM hyperparameters are displayed in Table 7.
Extreme Gradient Boosted (XGBoost) Trees: XGBoost algorithm employs gradient boosting (Zhou et al., 2015) in conjunction with a regularized cost-function. GB creates a model by additive integration of the predictions of a large number of “weak” classifiers. The model uses a regression tree which starts the training on a single regression tree. This single regression tree is in search for some rules that can separate consumers by some best possible ways with and without abnormalities. Following the construction of the initial tree, it builds a new regression tree on new round of training. During a new training round, it searches for those areas where the prior tree's results were not correct or had an error in prediction and then it develops a new tree that corrects the previous tree’s mistakes making new set of rules.
Selection of a classifier
For each customer cluster, XGBoost classifier is trained to use the LSTM-extracted features as input and the labeled instances (normal or energy theft) as targets. Also XGBoost hyperparameters are optimized (e.g., learning rate, maximum depth, regularization parameters) using grid search technique.
Hyper-parameters for K-NN model.
Hyper-parameters for binary LR model.
Hyper-parameters for SVM model.
XGBoost, a tree-boosting system is used on a huge datasets like electricity consumption dataset (Zhou et al., 2015) in which XGBoost constructs a model based on the training data, and determines the input data as malicious or benign. It labels the input samples as “1” and “0” means a theft case or a genuine case respectively. In the first step of the process, a generalization function is used to translate the one-dimensional data vector to a higher-dimensional, two-dimensional space where the data classes can be distinguished more easily. We use XGBoost classifier in KSLX model to construct a model based on the training data, and to determine or detect whether or not the data samples is malicious. In the first step of the process, a generalization function is used to translate the one-dimensional data vector to a higher-dimensional, two-dimensional space where the data classes can be distinguished more easily. XGBoost by way of using the algorithm called the “weighted quantile sketch algorithm” helps the classifier to get incorrectly classified data corrected during each new iteration. The loss function performs the regularization and avoids the possibility of over-fitting (Zhou et al., 2015).
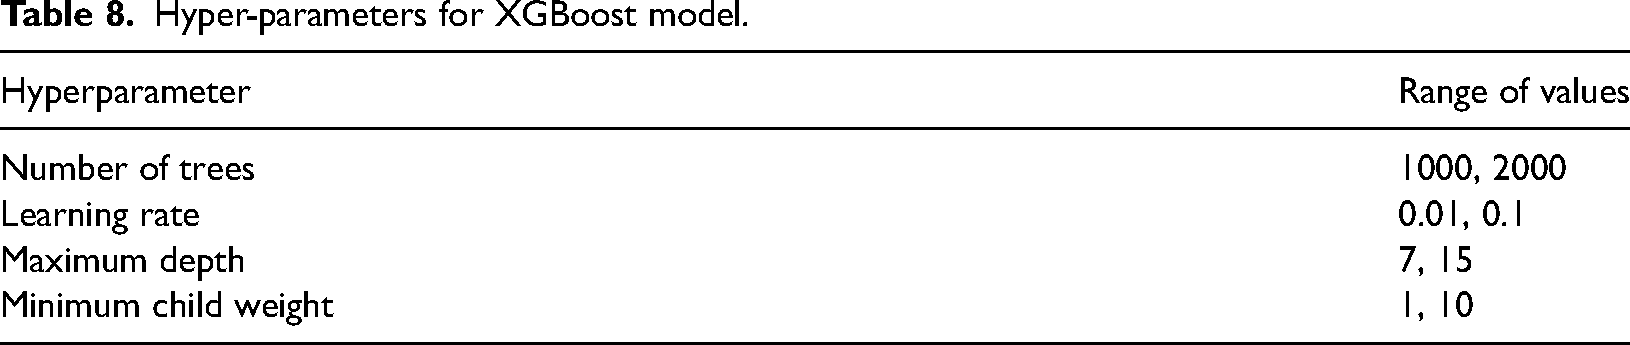
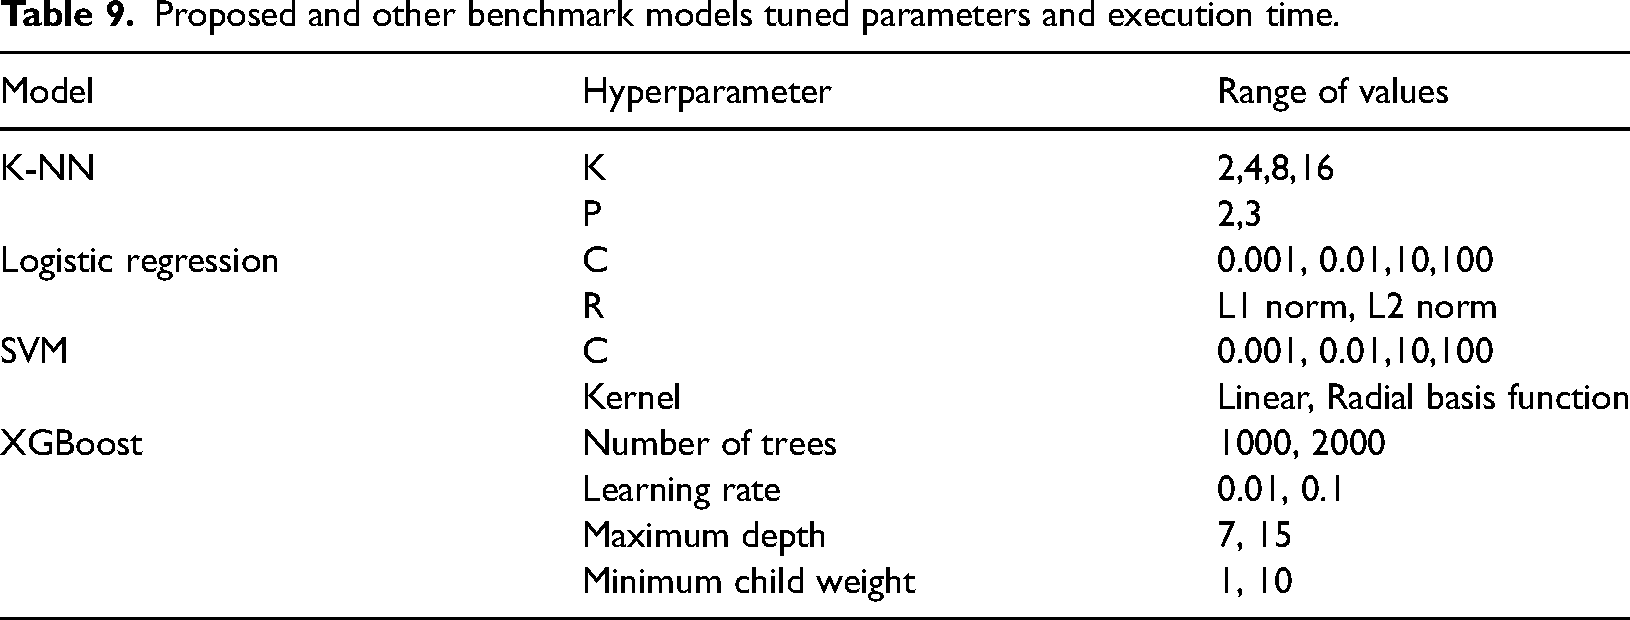
The hyperparameters utilized during grid-search for XGBoost are shown in Table 8. The following hyperparameters produced the best results for XGBoost. The chosen parameters range where the no. of trees are 1000 to 2000, learning rate is 0.01, 0.1; Maximum depth = 7,15; and Minimum child weight = 1–10. The best performance is obtained at LR = 0.01, max. depth =15 min. child wt. equal to 1, RT equal to 5000, and evaluation metrics is AUC. The optimal hyperparameters are obtained using 10-fold CV in GridSearchCV function of Scikit learn. The GridSearchCV chooses the best parameters in our model for XGBoost estimator. The GridSearchCV provided increased accuracy by choosing the best parameters as shown in Table 9.
Hyper-parameters for XGBoost model.
Proposed and other benchmark models tuned parameters and execution time.
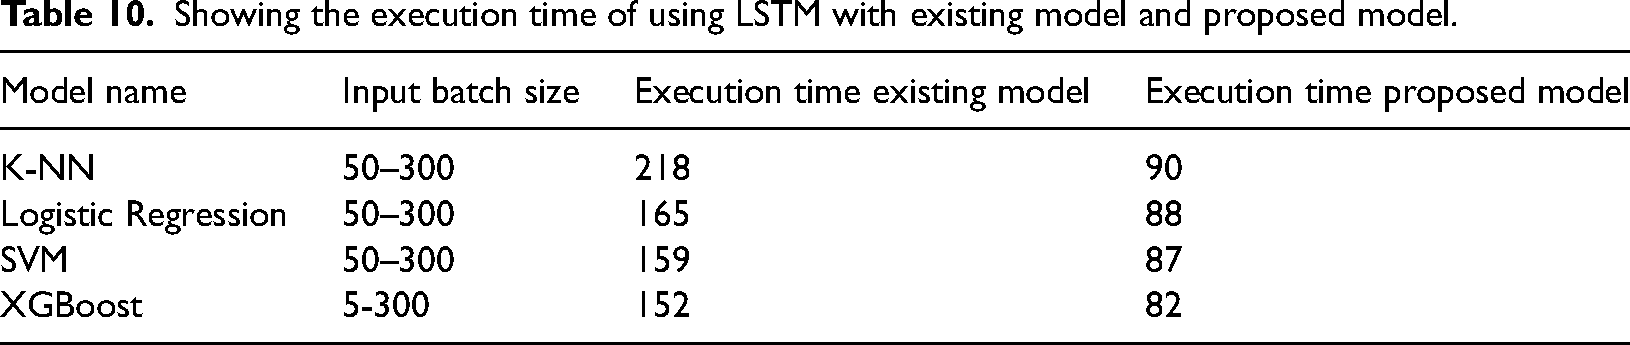
The accuracy of our proposed model improved from 0.85 to 0.93 when parameters were set to default. Table 10 showing the execution time of using LSTM as feature extraction algorithm with XGBoost and existing classification model.
Showing the execution time of using LSTM with existing model and proposed model.
XGBoost predicts the input samples as “1” and “0” as theft case or genuine case respectively. XGBoost by way of using the algorithm called the weighted quantile sketch algorithm helps the classifier to get incorrectly classified data corrected during each new iteration. The objective function having loss function (L), a regularization term (Ω) and the parameter (θ) is mentioned below in Equation (18). It is mostly used in supervised learning problems where the target variable 

where 0 indicates normal power consumption and 1 indicates abnormal power consumption. Equation (20) is the result of a tree ensemble model function with inputs as K additive functions 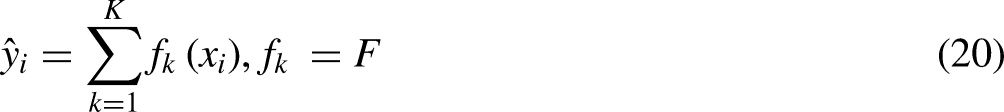
It is pertinently mentioned that XGBoost optimizes functions rather tree model weights as mentioned in Equation (21) also used by authors in (Zhou et al., 2015).

The loss function measures how well a model fits during training by calculating the difference between 


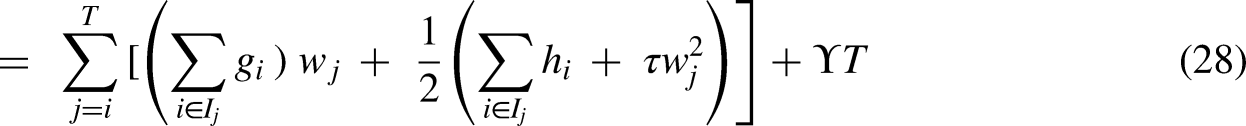
Since XGBoost allows user-defined loss functions, the above equations can be used as an optimization target for the new tree (Zhou et al., 2015). Regularizations are added to the loss function to simplify the new tree and prevent from over fitting.
Evaluation of model
Customers whose EC was used in the study were installed with a smart meter placed in their houses. This dataset is a valuable source in the study area and with a analyzing data from SMs since it contains a huge number and types of consumers, enough period of data collection for study. Additionally, it is available to the general public. Also a data file, that contains data in an interval of 30-min of each individual customer. We reduced the frequency of sampling to every hour, and then, for each user, we split the file into a dataset consisting of benign and malicious users, each of which had 24 components. The total data records in SGCC dataset have 42,372, customers with 38,752 normal users and 3615 fraudulent user records. The dataset have a sample frequency of 24 records per day. Since the malicious users are much fewer in number, six distinct types of malicious attacks are generated for each benign sample that had the values x = “x1, x2… x24.” If the NTL is detected falsely by the ML classifier when there is erratic power being supplied to the NAN cluster due to the reasons when one or many feeders are put off to accommodate the peak load demand in the area or because of the overloading of grids/substations/feeders or because of the feeder fault during heavy rains and snowfall. In that case, once the electricity is restored after some gap, the consumption increases, and the usage pattern changes leading to an increase in FPs as this change is treated as an anomaly by the machine-learning classifier. Our model forms a cluster using K-Means and this anomaly is neglected as the cluster is changed as a whole provided the number of SMs is fed from the same feeder or sub-station houses.
Classifying of data samples: It can be seen below the number of genuine and dishonest consumers registered in our data set. The genuine users have different usage patterns than the fraudulent users Electricity consumption pattern of fraudulent consumers is aberrant, i.e., it often shows periods of very low spikes and with periods of few highs as can be seen in Figure 6, also it has irregular patterns, contain low periodicity of electricity usage and their amount of usage is low for longer periods than usual which is possible in case of meter tempering or other methods. In contrast, the normal consumers follow a consistent pattern or periodicity and have usage of identical periods for the more consecutive days in a month or a week as shown in Figure 5. The machine-learning algorithms are trained on data to track the anomalous electricity usage behavior for identifying the electricity stealers. The electricity consumption as expected, after sunset reaches its peak points while after midnight to sunrise it go down to its minimum values most of the time. During standard working hours usually from 09:00 a.m. to 10:00 p.m. we have both high and average amounts of electricity consumption throughout the year. According to the graph between January & August electricity consumption amounts increases during colder season months than the other months (Figures 5 and 6).
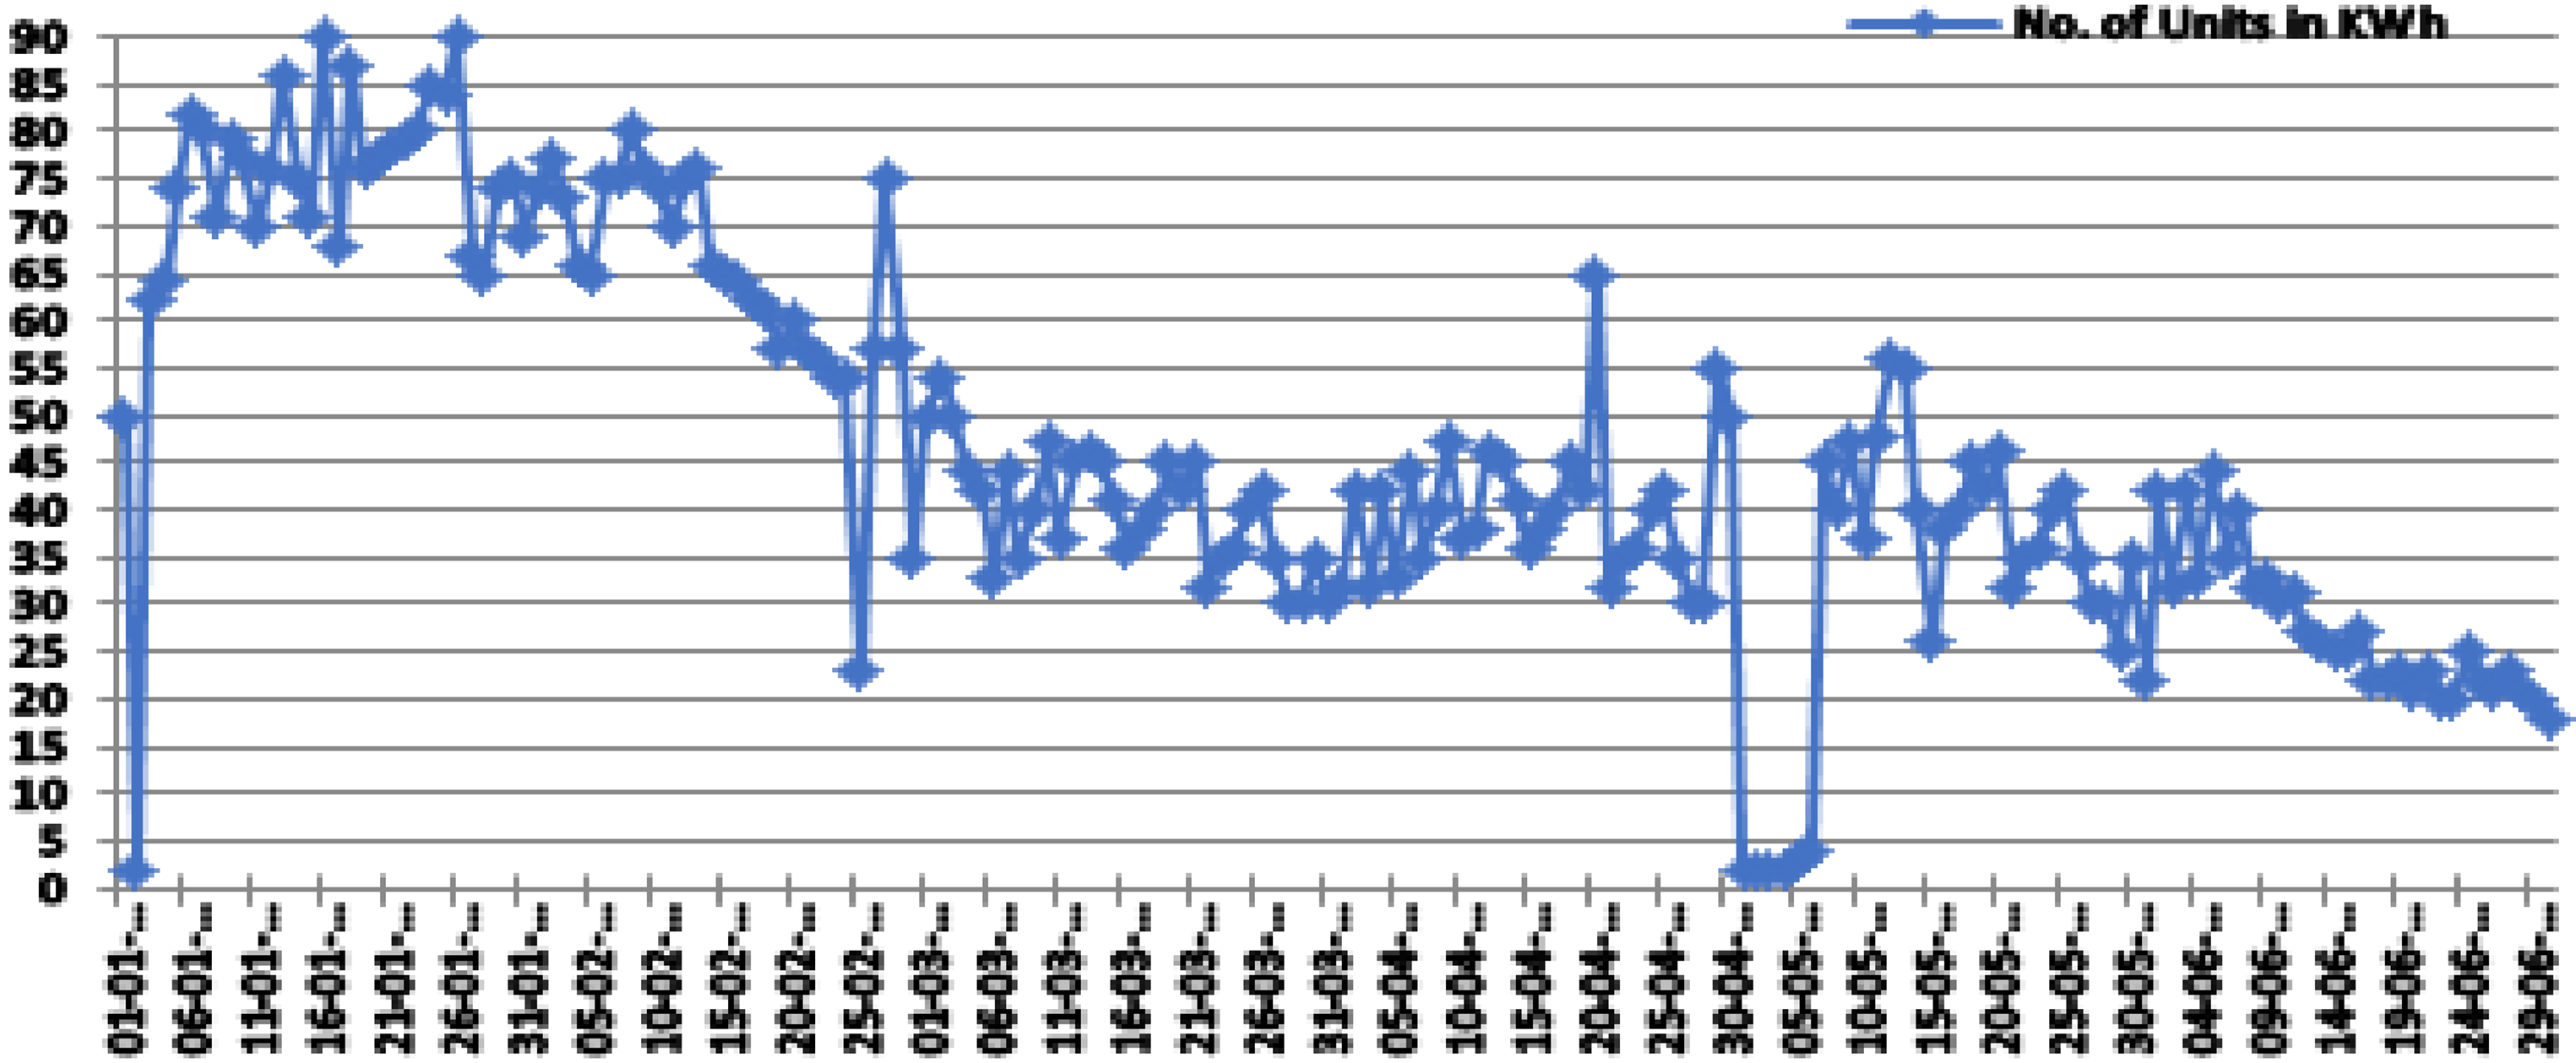
Typical energy usage pattern of a genuine consumer over six months, with occasional spikes in both low and high consumption for valid reasons.
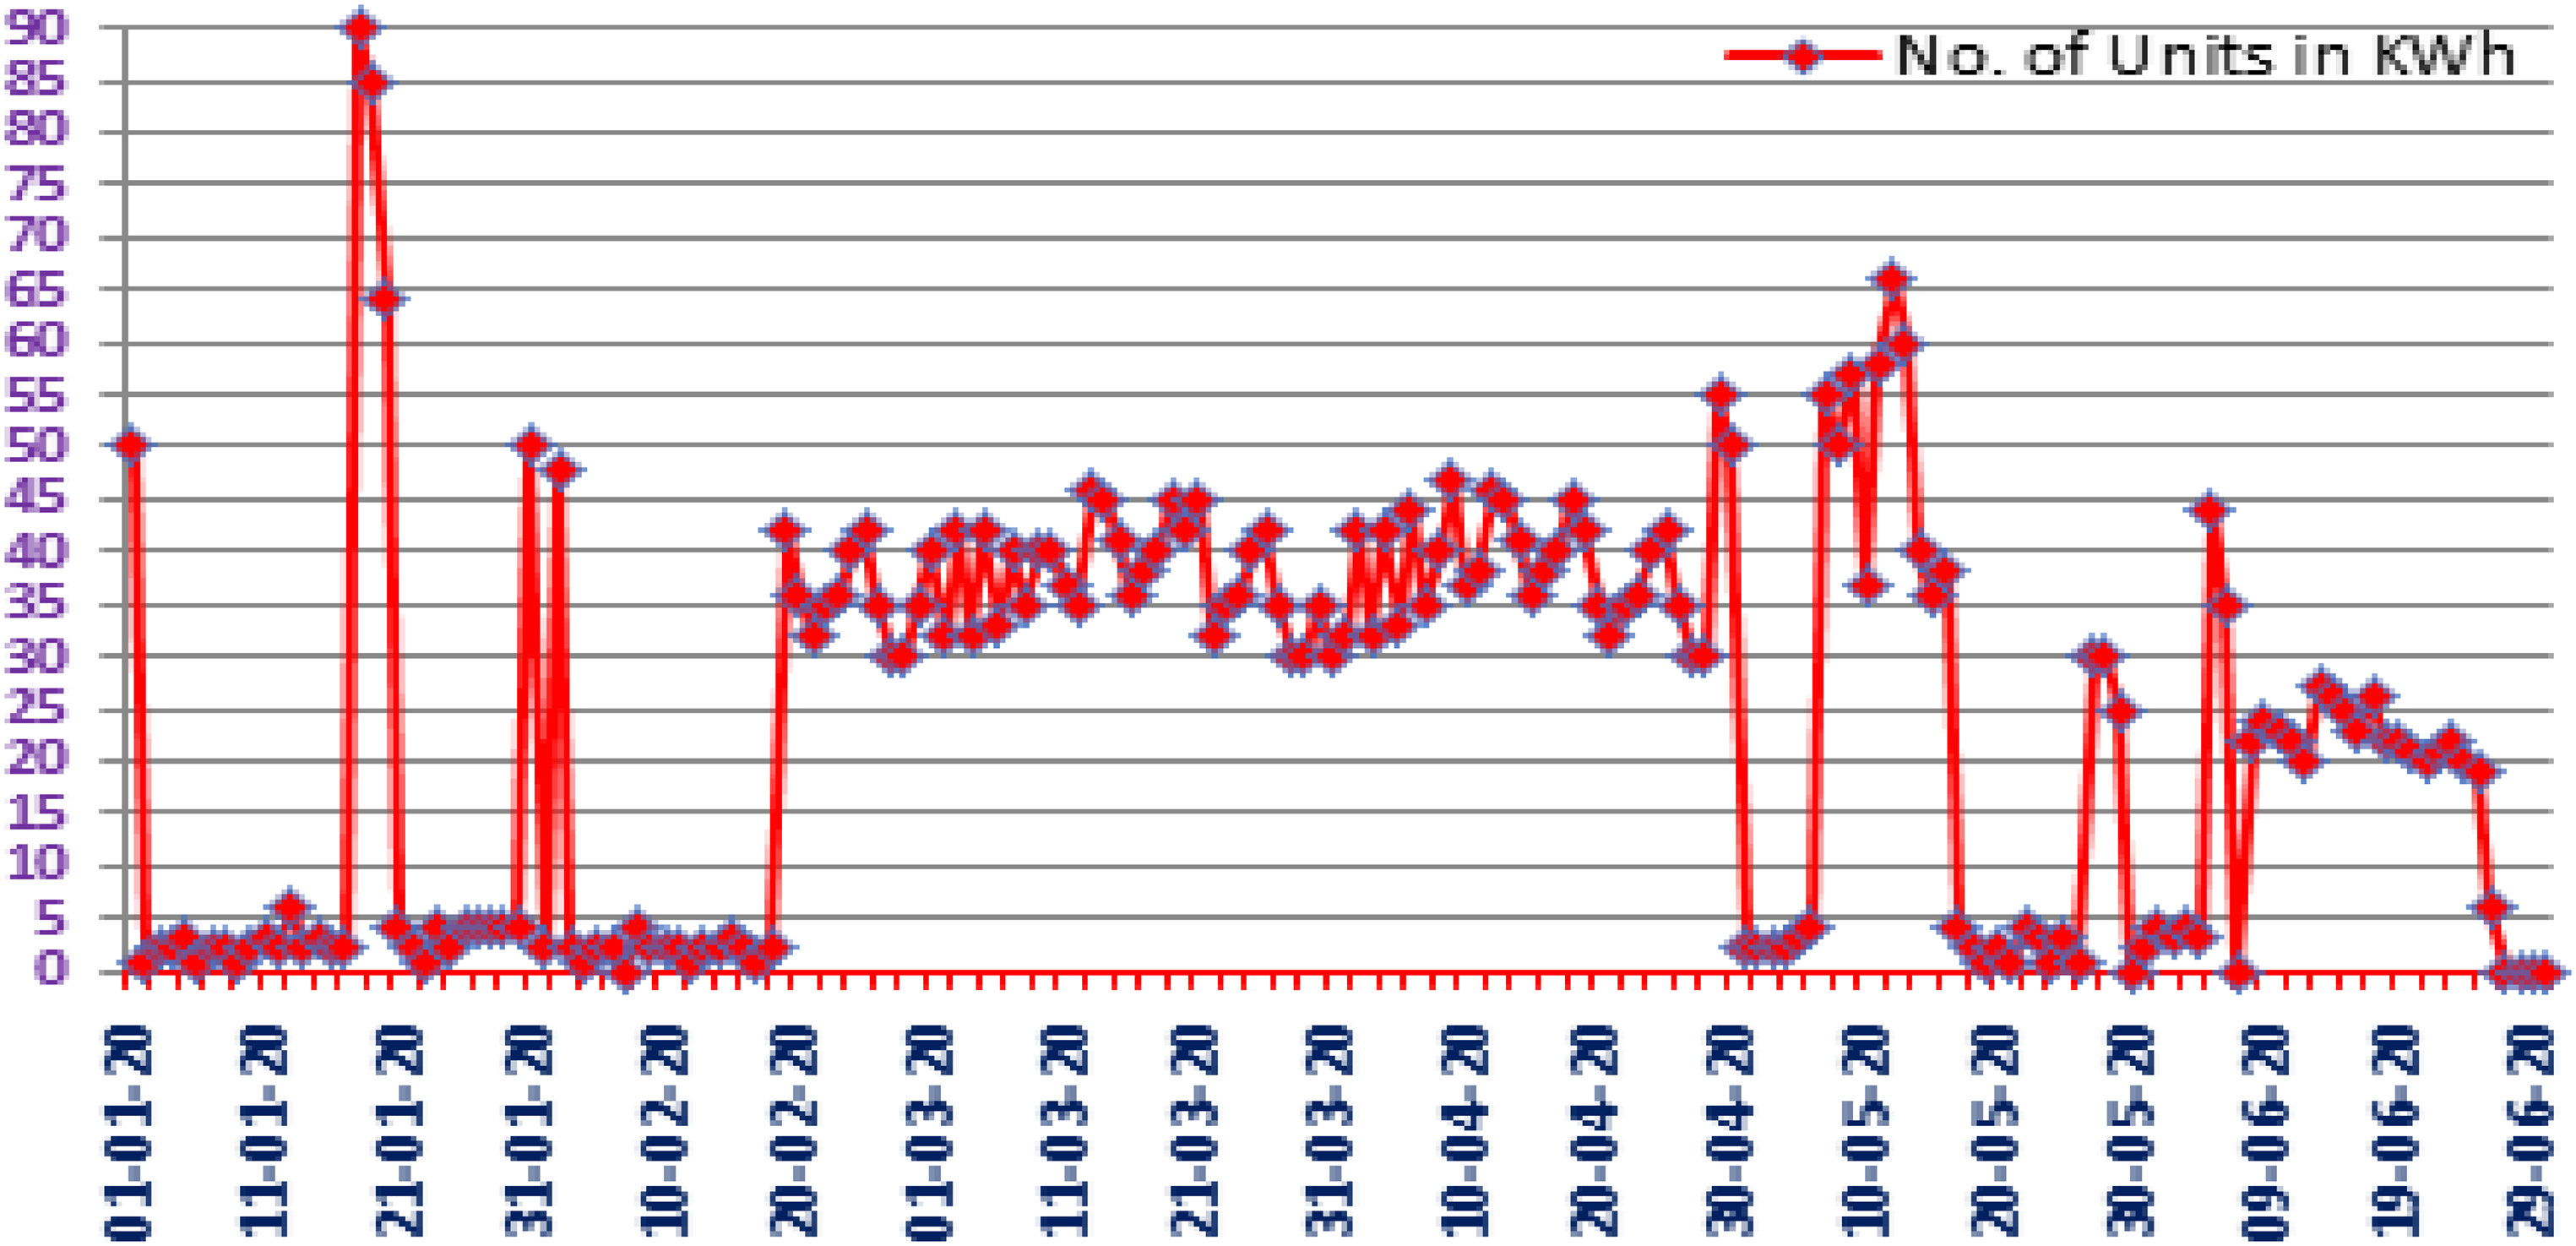
Energy usage pattern of a malicious consumer, featuring sporadic low consumption periods and intermittent spikes.
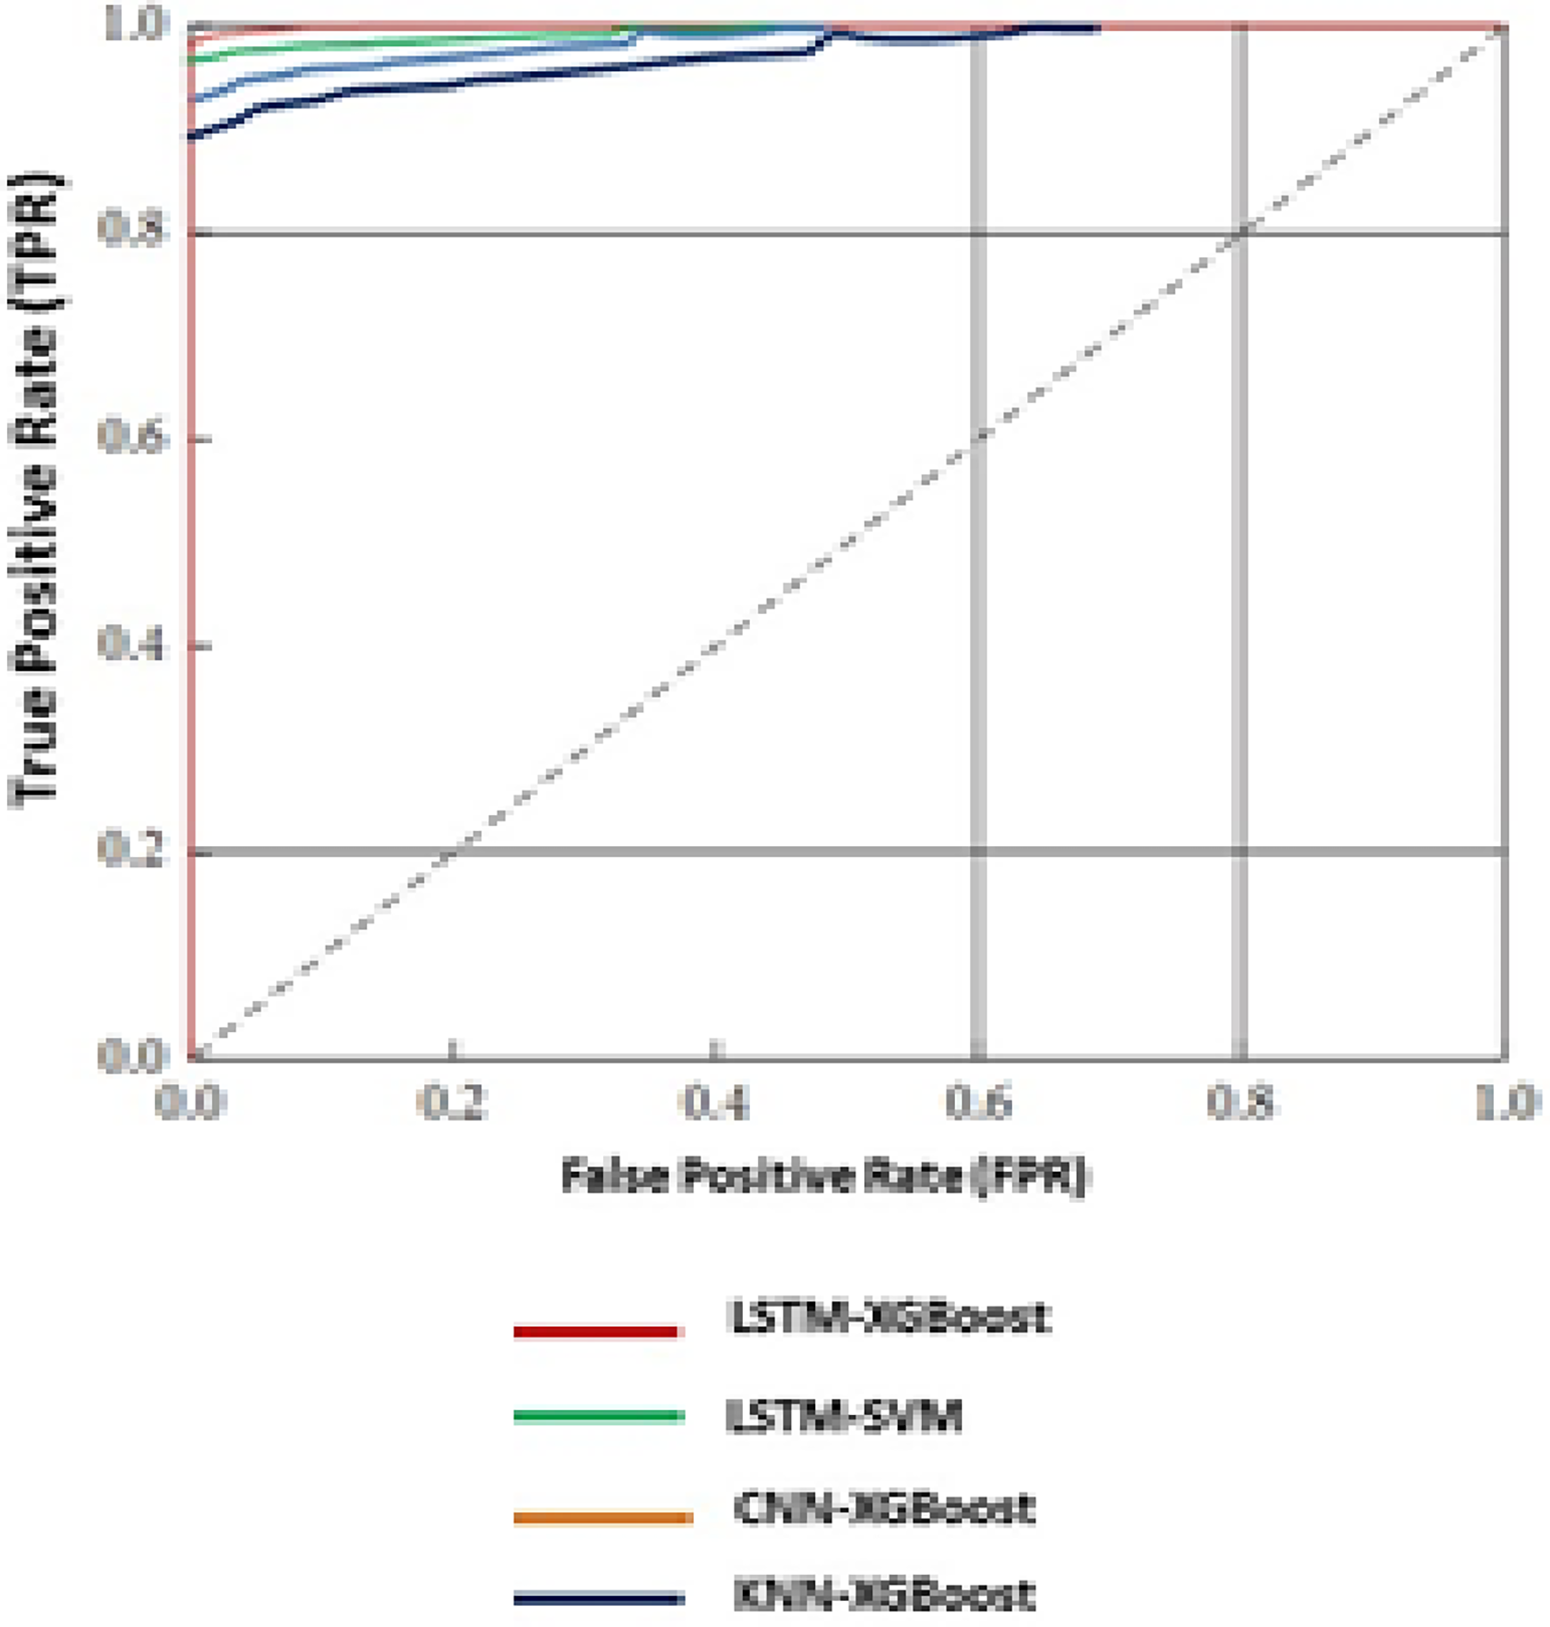
We tried to figure out the AUC score by training the XGBoost classifier on a subset of features from SMs and other databases. A smart meter has data on how much electricity is used, the parameters of the smart meter, and the parameters of the electrical power. The features of the auxiliary database include tariff summaries, geographic information, technological characteristics, and contract data
The AUC of 0.88 was reached by using only the features the SM offered. Even with the extra databases, the AUC was found to be 0.87, which is less than the SM subset alone as can been seen in Figure 7. Auxiliary database features and smart meter features were used to get the FPRs of 5.92 and 2.01, respectively.
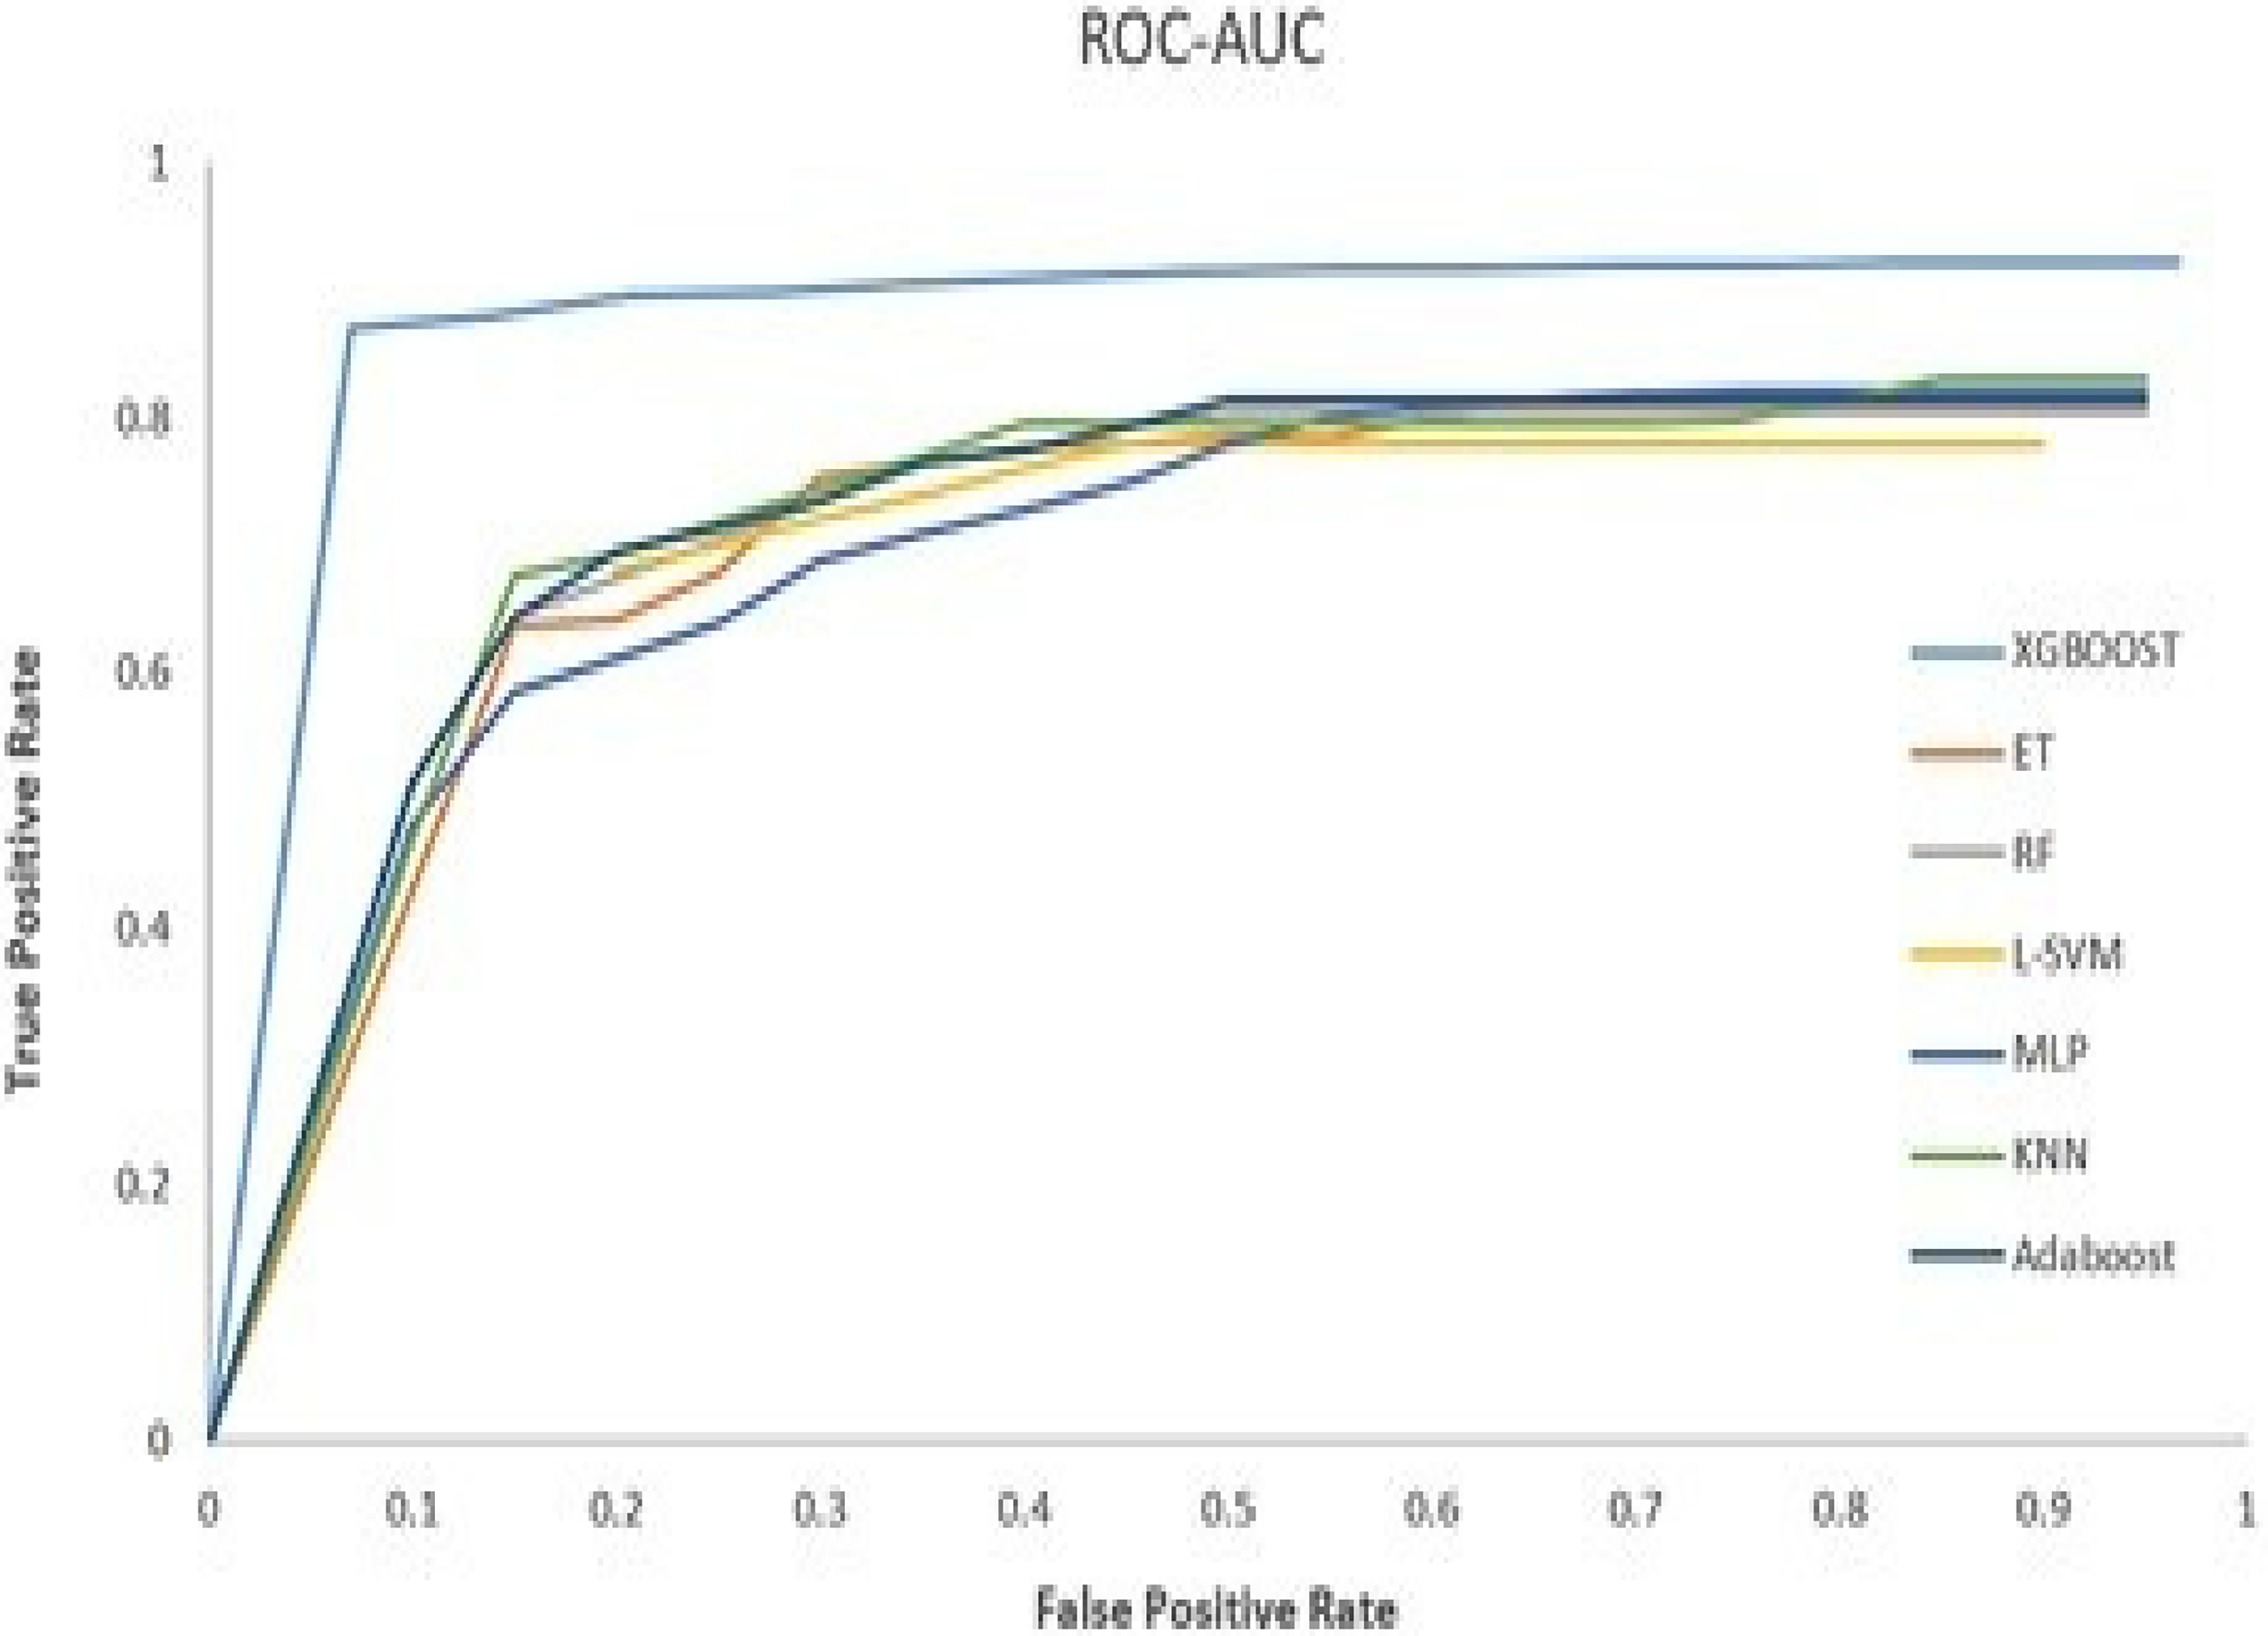
ROC of proposed XGBoost and other various models in electricity theft detection (ETD).
Proposed K-MLX model outcome interpretability using the symmetric Mean Absolute Percentage Error (sMAPE) algorithm:
The interpretability of the proposed K-MLX model outcomes is assessed using the sMAPE algorithm. We utilize the trained XGBoost model for prediction, validate its generalization, and employ the sMAPE to assess model performance as shown in Table 11. Specifically tailored for models like gradient boosted and other ensemble ML techniques, sMAPE quantifies the disparity between predicted and actual values. It calculates the sum of absolute differences between predicted and actual values, normalized by the average of the predicted and actual values. The formula for sMAPE calculation is as follows:
Performance evaluation of the proposed KM-LX model using 10-fold cross-validation (CV).
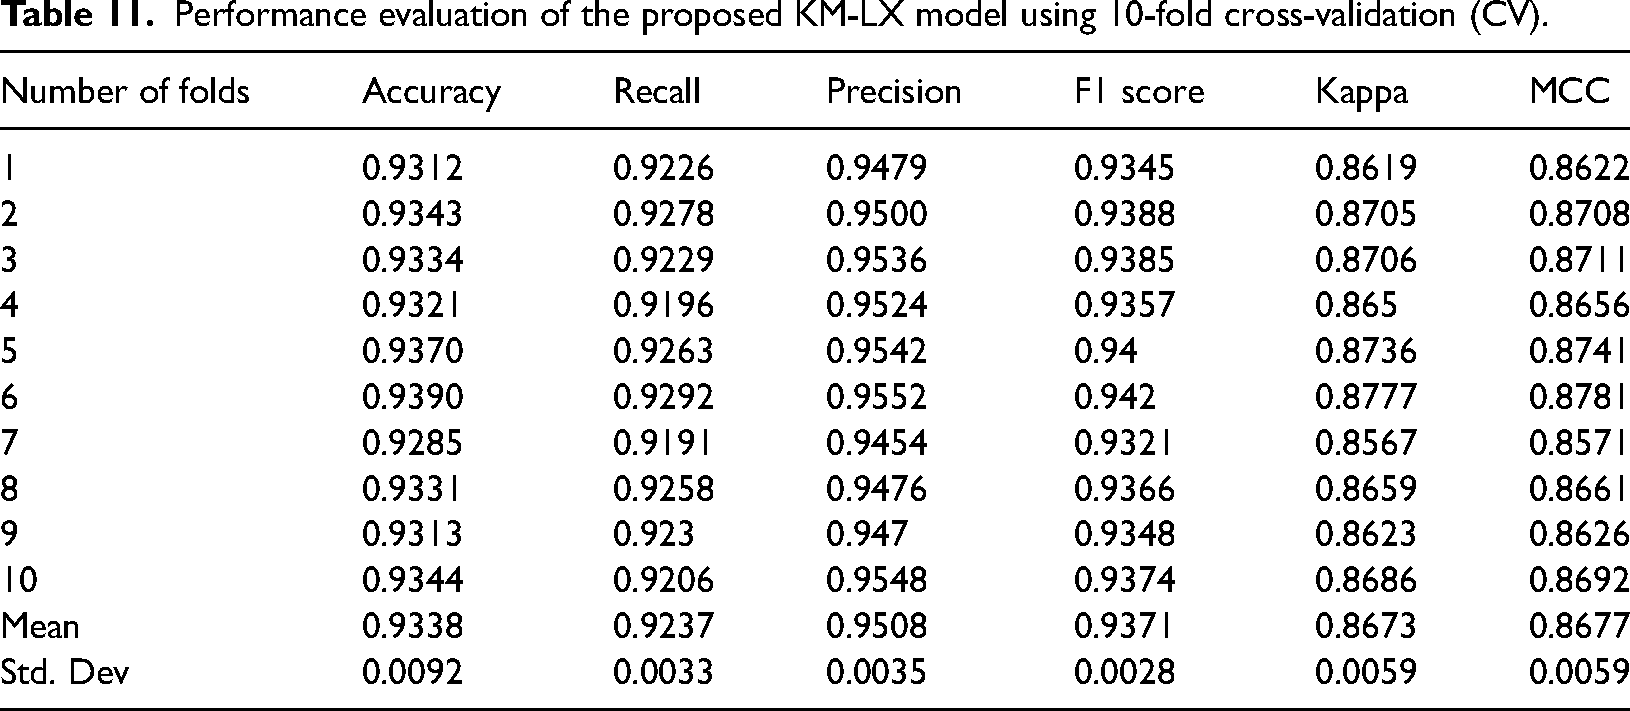

where n represents data point count, actual_i is the actual value for data point i, and predicted_i is the corresponding predicted value. SMAPE has several advantages over other evaluation metrics such as mean absolute error (MAE) or mean squared error (MSE). Unlike MAE, which can be influenced by large errors, SMAPE gives equal weight to both over-prediction and under-prediction errors. Also, SMAPE is symmetric and more intuitive to interpret, as it provides a percentage error between actual and predicted values. A confusion matrix table shows the performance of a classification model, including the detection of electricity theft. It provides a summary of the model’s predictions compared to the actual class labels of the data. The matrix typically contains four elements: true positive (TP), FP, true negative (TN), and false negative (FN).


The confusion matrix can be utilized to compute various evaluation metrics such as accuracy, precision (PR), recall, and F1 score. These metrics provide a deeper insight into the model's performance and can serve as a roadmap for model enhancement. For detecting electricity theft, the positive class can be labeled as theft, while the negative class is labeled as no theft. A TP signifies a correct identification of theft, a FP indicates a wrongful identification of theft when none occurred, a false negative represents a failure to detect theft when it actually occurred, and a TN signifies a correct identification of no theft. In Equation (30), True Positive (TP) denotes the count of positive samples correctly classified as positive as used by researchers [32]. We utilize the F-measure, as depicted in Equation (32), to concurrently assess Recall and Precision. Additionally, the ROC Curve plots the number of FPs on the x-axis against the number of TP s on the y-axis. Precision is equivalent to TP. The ROC curve illustrates the detection capability in ETD of a binary classifier system as the threshold varies. The discrimination threshold measures the probability of theft occurrence. True negatives (TNs) represent negative samples correctly classified as negatives, while false negatives (FNs) denote negative samples erroneously classified as positives. In evaluating the proposed model, the “positive label” refers to electricity theft, and the “negative label” denotes no theft [32] as per the standard. We have also considered three evaluation indicators: detection rate (DR), false positive rate (FPR), and Bayesian detection rate A higher detection rate indicates better performance of a model [32] as a standard.
The AUC Score is a reliable metric to measure the performance of imbalanced datasets like ETD [40] as per the standard calculation. This metric measures the rate of change of TPs with the change in FP. If decision threshold is changed, ROC curve is an appropriate indicator to measure the change between true and false- positive rates. It is observed that KSPXS's XGBoost outperforms the widely used classifiers shown in Table 12 whilst L-SVM obtains the lowest performance. The DR, FPR and highest difference HD of our proposed model for ETD as shown in Table 13 is having 93.15%, 3.58% and 82.64% compared to the traditional models.
Displays the classification performance metrics, including f1-score, precision, recall, AUC-ROC, and PR-AUC, of the proposed model with the existing top models.
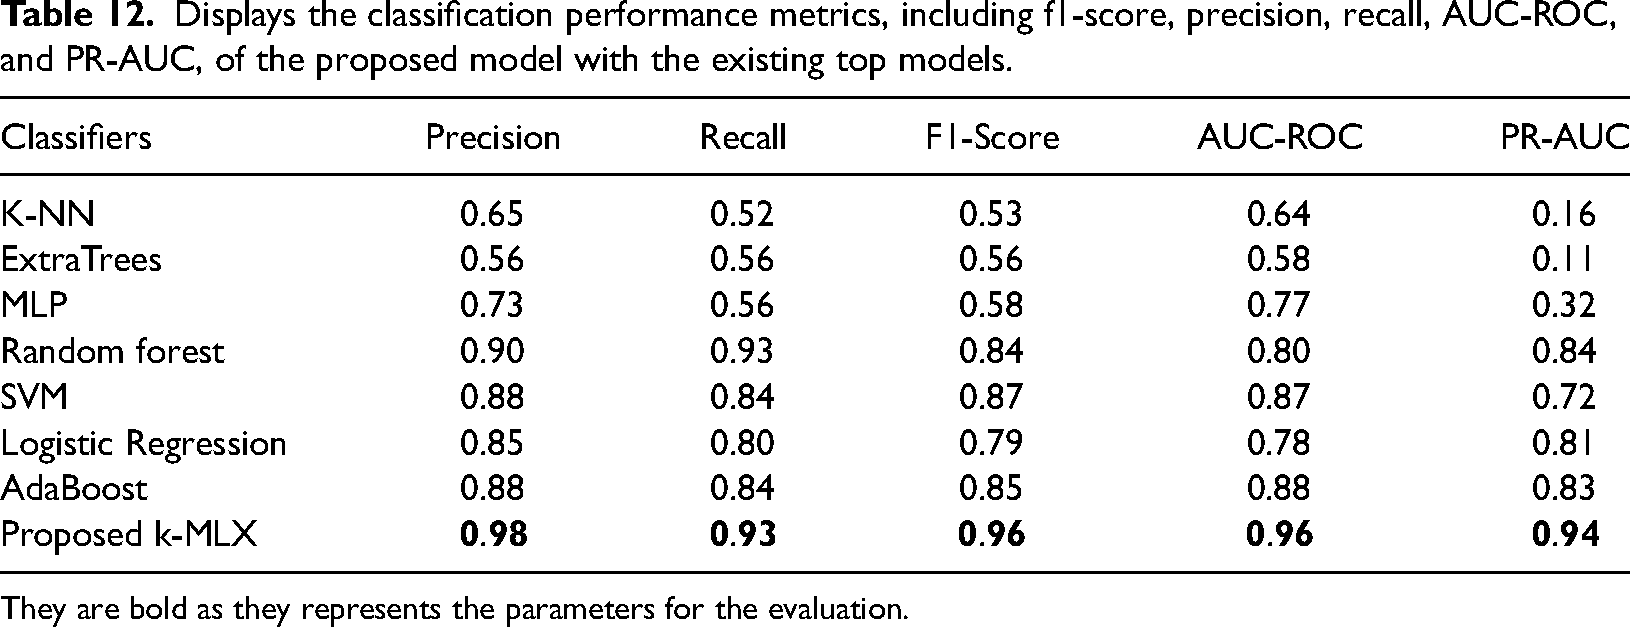
They are bold as they represents the parameters for the evaluation.
Displays the DR, FPR, and HD as percentages for the benchmark ETD models compared to our proposed model.
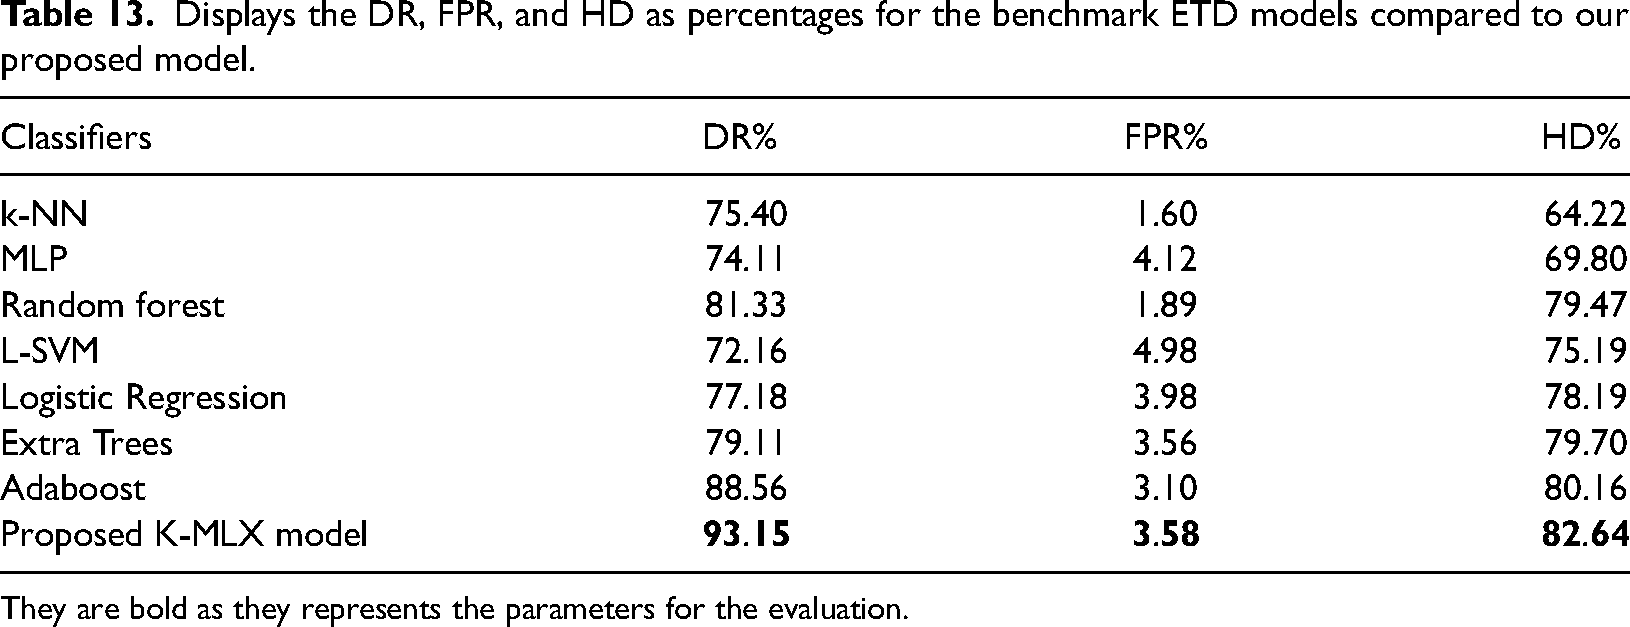
They are bold as they represents the parameters for the evaluation.
Our model achieved 80% precision when on-field inspections were done for the predictions. Figure 7 shows the AUC score of our model as compared to the other popular ETD models. Nevertheless, our approach doesn’t (Figure 8).
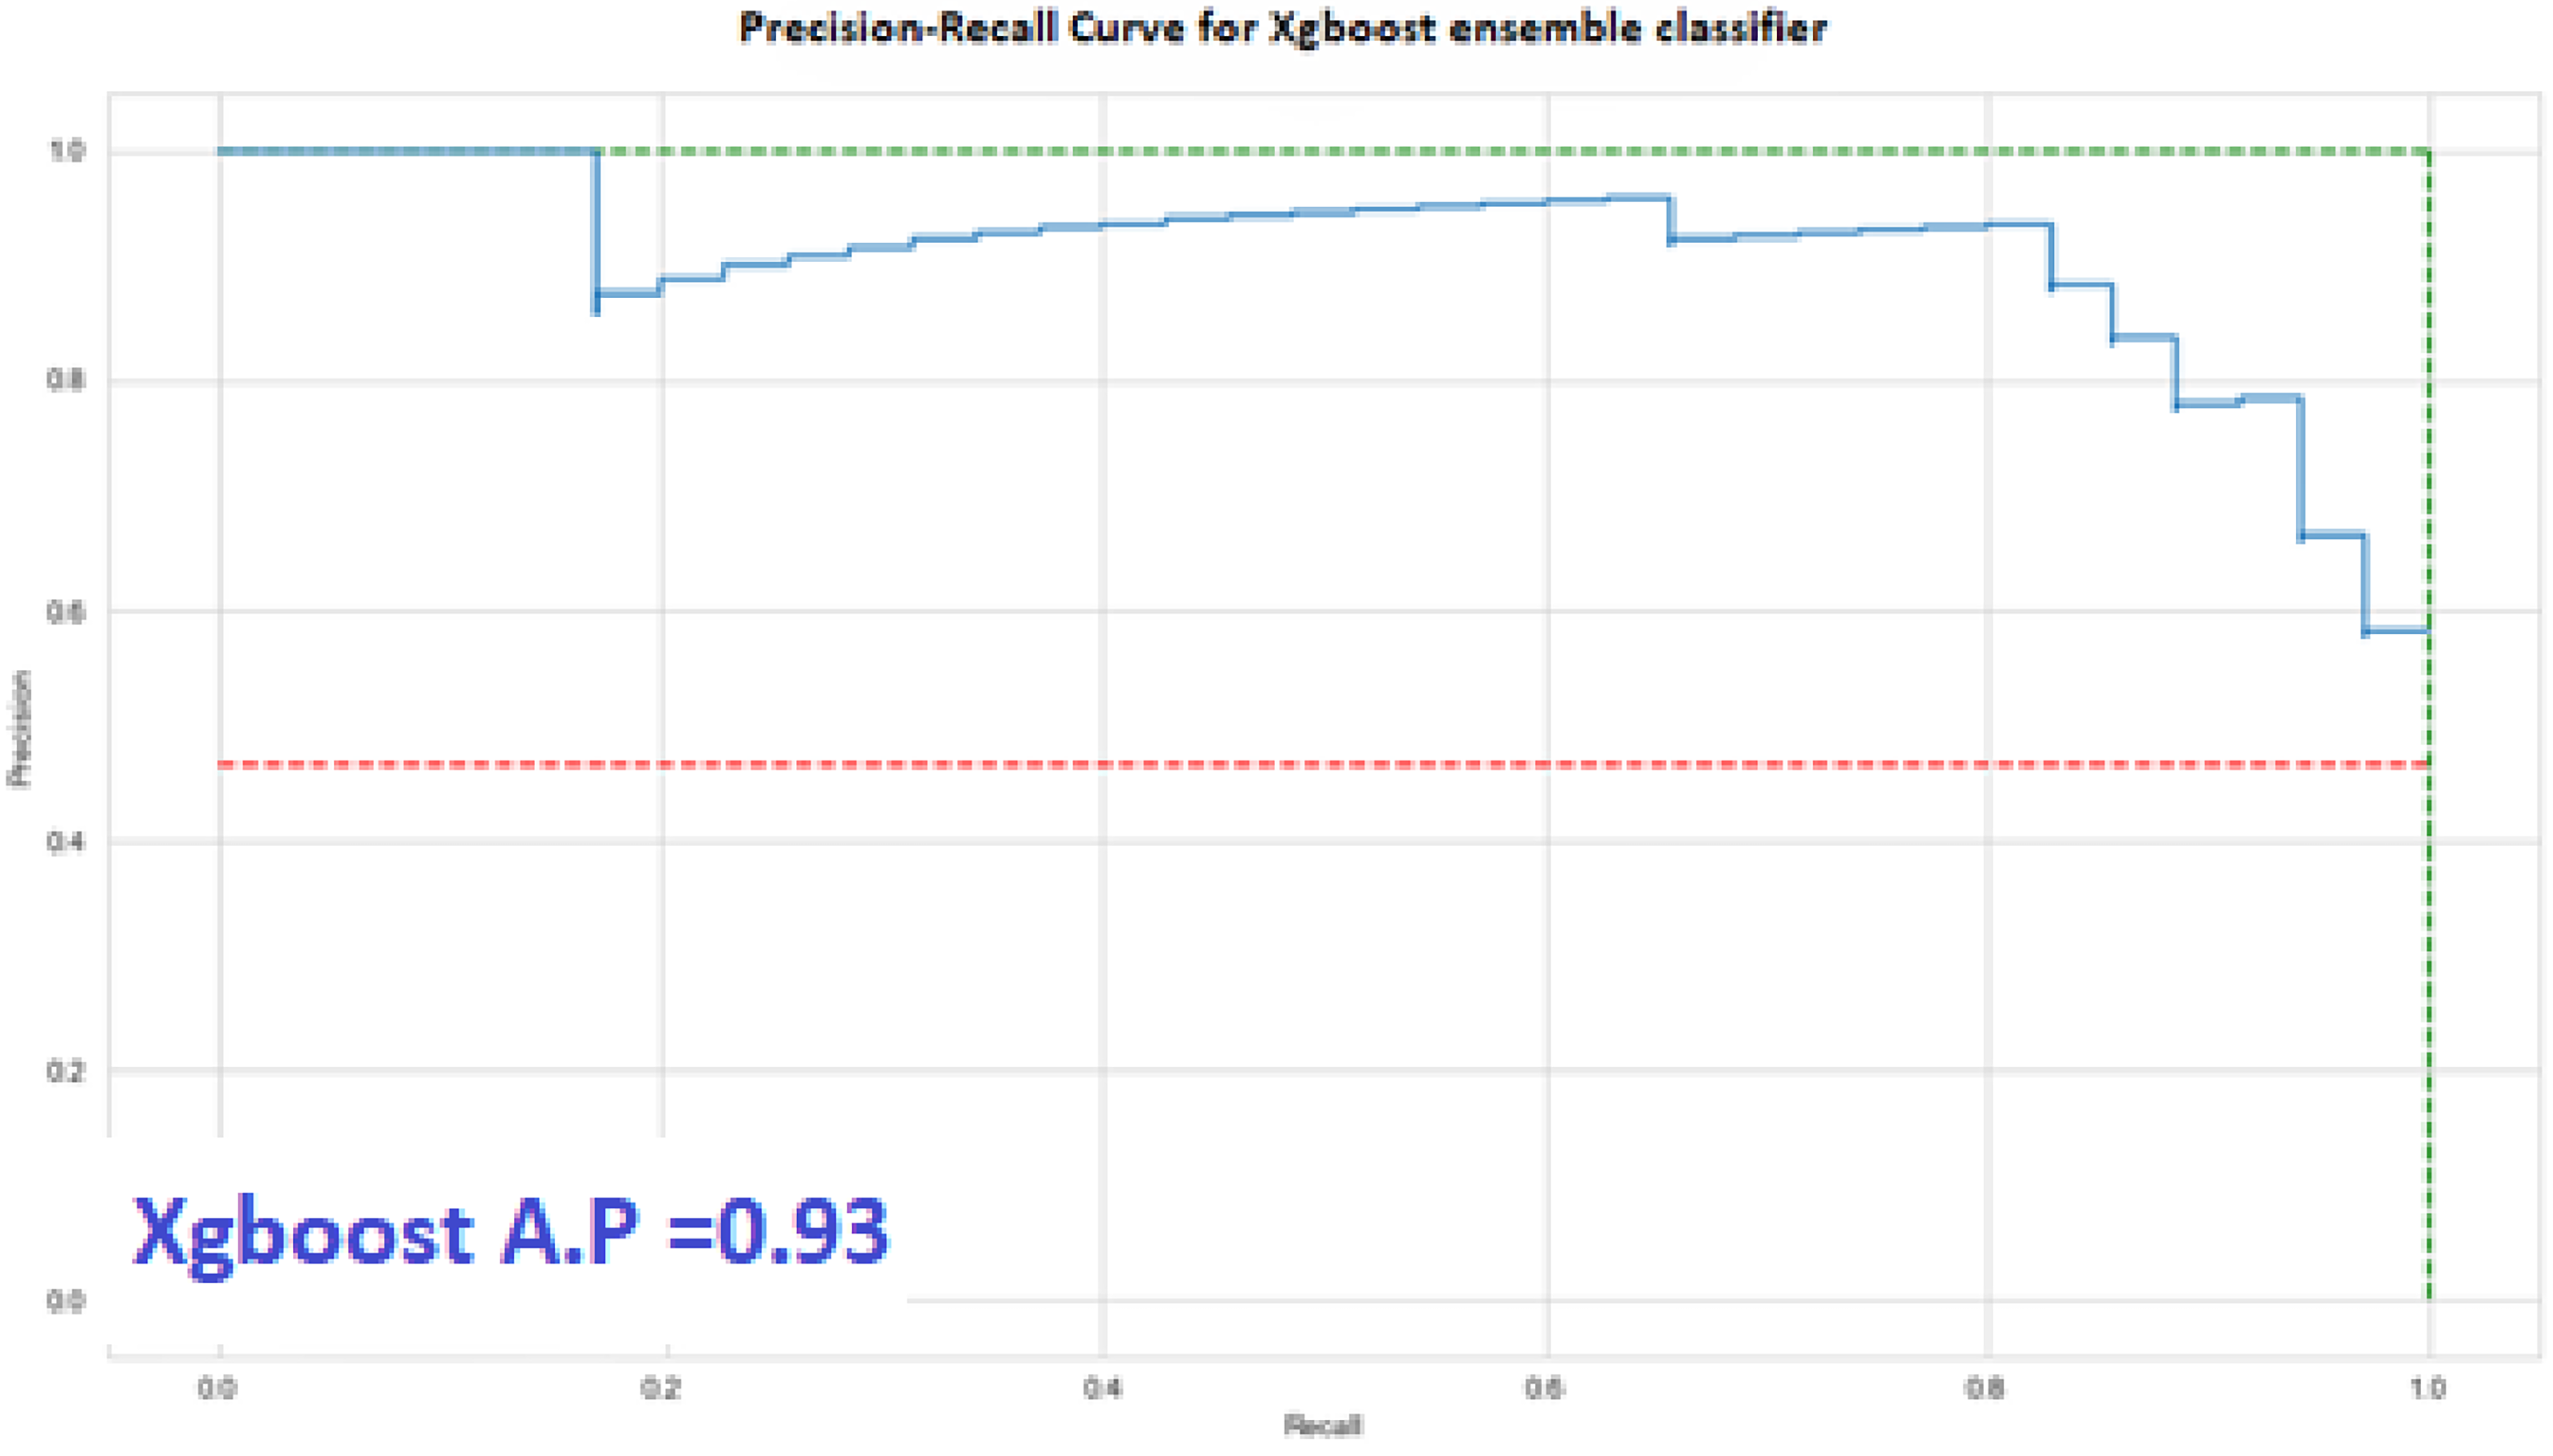
Precision recall PR curve for proposed XGBoost ensemble models for electricity theft detection (ETD).
go to find the high granularity as can been seen adopted by the authors in [33] and [34] as a part of their work to detect the intermittent frauds, but the high granularity of EC data will lead to privacy intrusion of customers. So an intermediate approach is adopted by our proposed model and the detection time is also better in the case of XGBoost method. The above figures depict the graphical representations of the Precision-Recall curve as shown in Figure 9 and the ROC curve in Figure 10. They emphasize the superior performance of the proposed K-Means-LSTM-XGBoost technique, showcasing higher True Positive Rates (DR) for a given False Positive Rate compared to existing benchmark models. These figures demonstrate that the proposed technique surpasses existing methods in achieving a higher True Positive Rate (DR) for a given False Positive Rate, indicating superior overall performance.
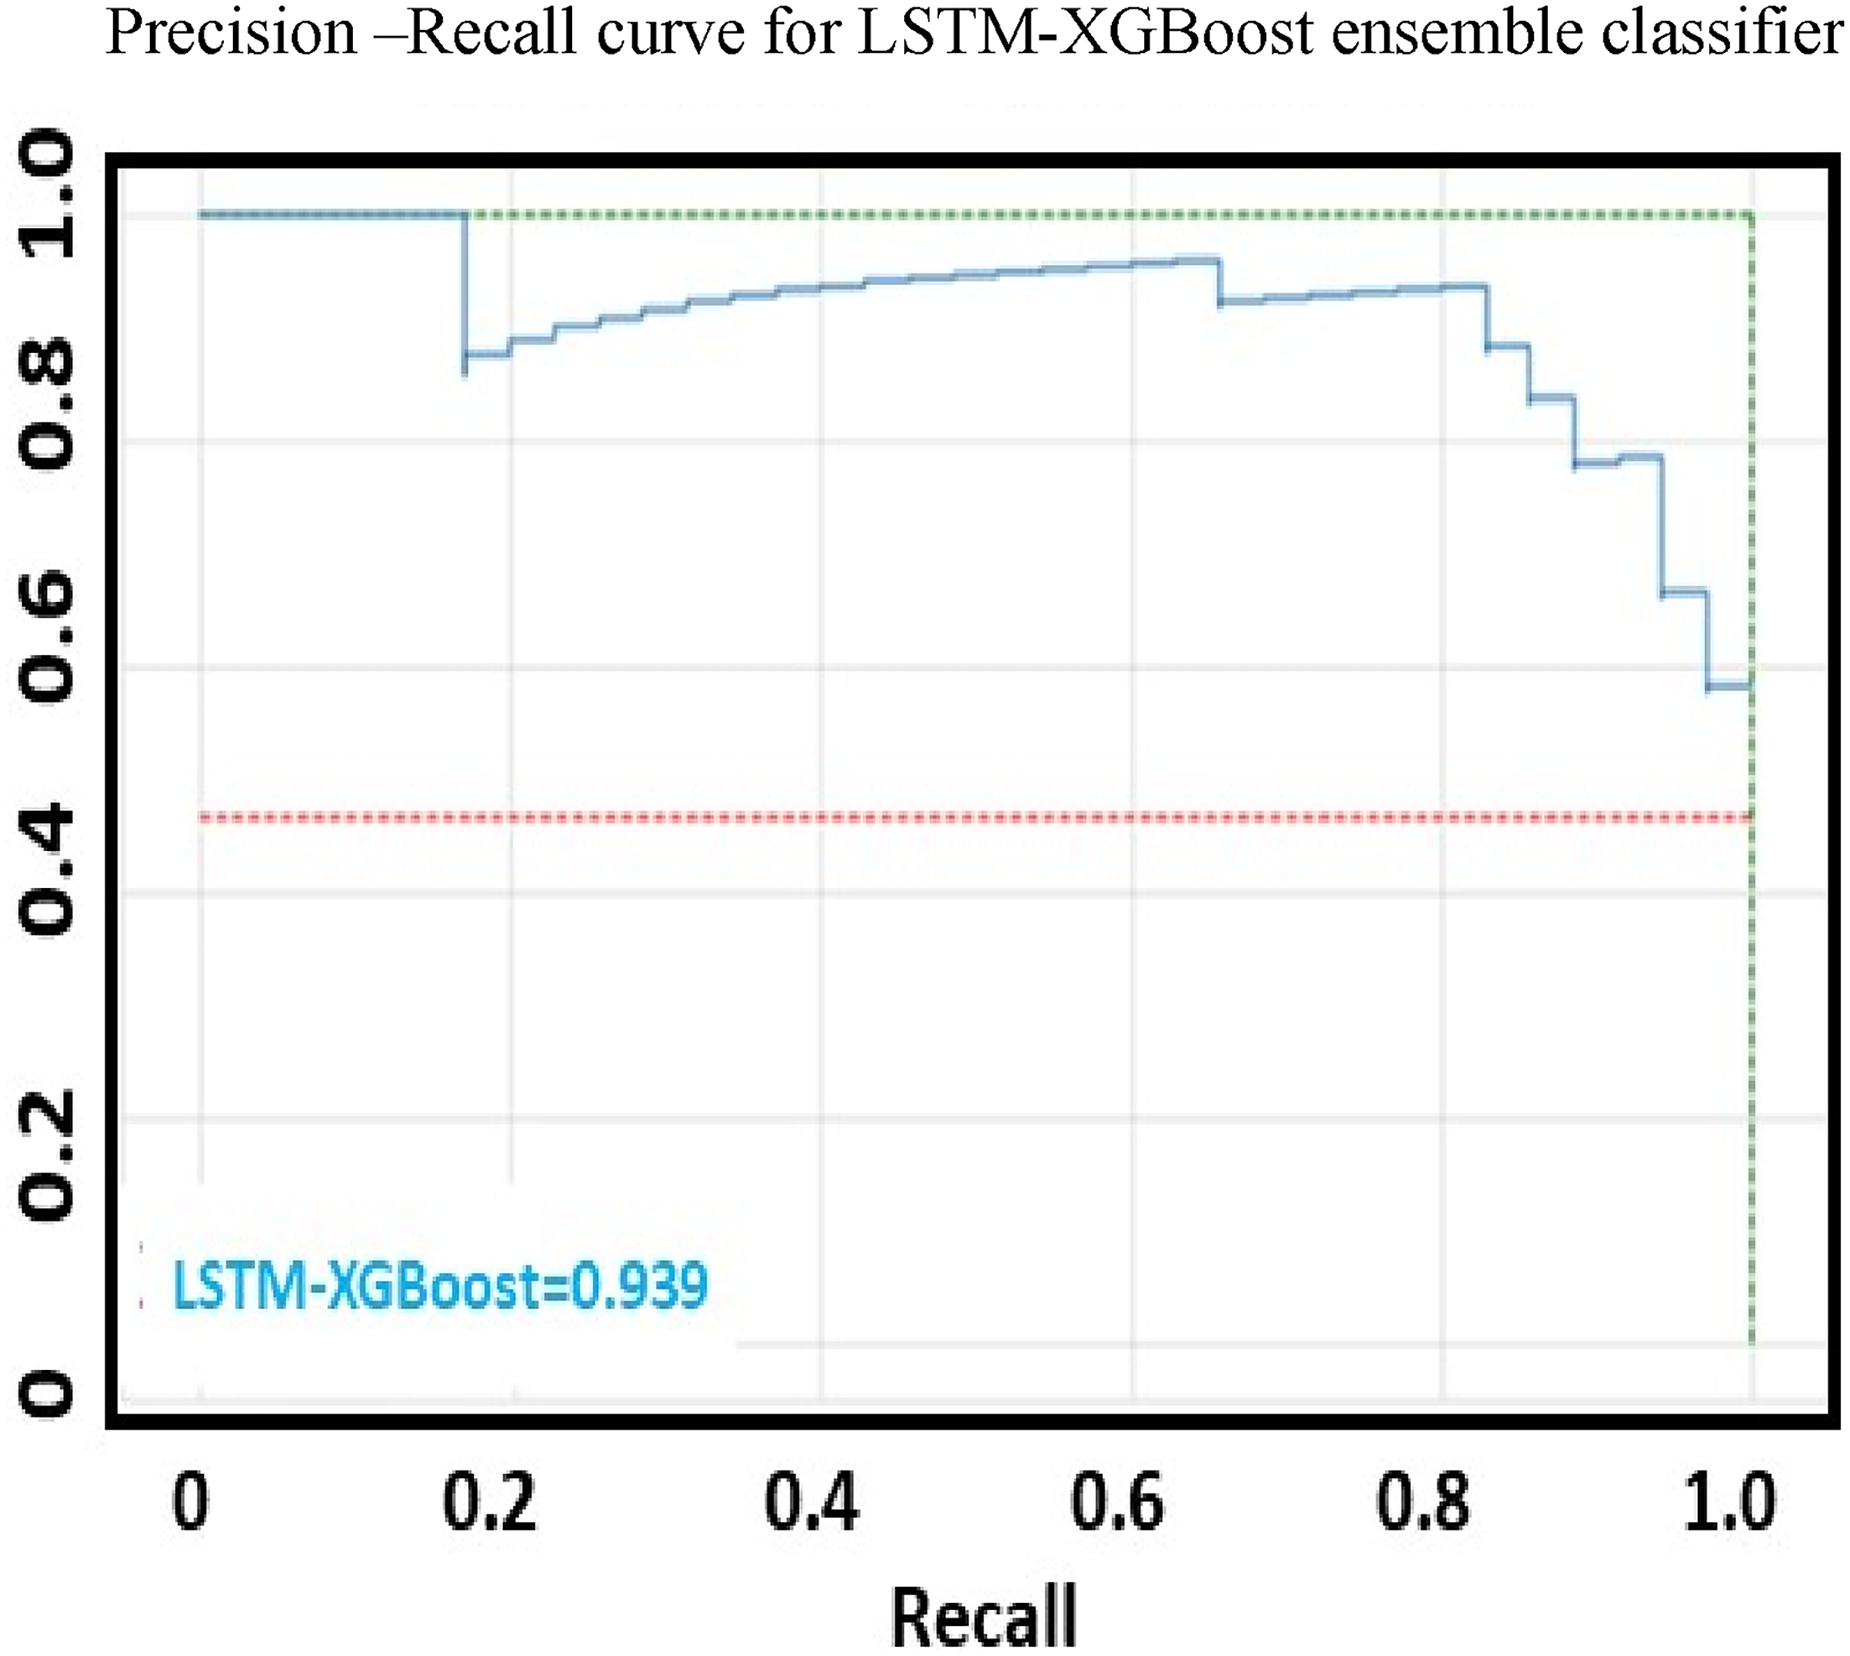
Illustrates the PR-recall curve of the proposed ensemble technique.
FPR-TPR comparison of proposed and existing models.
Future scope the proposed K-MLX model can be further improved by incorporating additional data sources, adapting to concept drift, developing explainable AI techniques, addressing deployment and integration challenges, and exploring generalization to other domains involving time-series data and anomaly detection
Conclusion
ETD presents a significant challenge, as it requires identifying anomalies in usage patterns and correlating them with routine anomalous measurements and other normal variations. Most of the studies primarily utilize electricity measurements (EC) from SMs and include few or no features from auxiliary databases, such as weather databases, curtailment schedules and tariff documents for theft detection. In contrast, our proposed approach incorporates additional features including feeder status, fault frequency, erratic power supply and local weather conditions in a cluster. These features play a crucial role in mitigating FP detections by machine-learning models. Focusing solely on usage behavior in this context often leads to a high number of FPs. The model’s performance is assessed using standard and reliable metrics suitable for imbalanced datasets, including Precision, Accuracy, F1-Score, AUC-ROC, PR-AUC, and Matthews Correlation Coefficient (MCC). This approach outperforms existing conventional machine-learning models for ETD. The performance metrics, including Accuracy, Recall, Precision, F1-Score, AUC-ROC, PR-AUC, and MCC, further emphasize its effectiveness. The proposed model utilizes K-Means for clustering and combines LSTM-XGBoost for feature extraction and classification respectively. The proposed model achieved outstanding performance metrics, including precision, recall, F1-score, AUC-ROC, and PR-AUC values of 0.98, 0.93, 0.96, 0.96, and 0.94, respectively.
Footnotes
Acknowledgments
Mohammed Aleisa would like to thank the Deanship of Scientific Research at Majmaah University for supporting this work under Project No: R-2024-1083.
Data availability statement
Declaration of conflicting interests
The authors declared no potential conflicts of interest with respect to the research, authorship, and/or publication of this article.
Funding
The authors disclosed receipt of the following financial support for the research, authorship, and/or publication of this article: This work was supported by the Deanship of Scientific Research, Deanship of Scientific Research, Majmaah University (grant number Project No: R-2024-1083).
Ethical approval
This article does not contain any studies with human or animal participants.