
Abstract
This research aims to predict the cost and energy consumption associated with pocket and groove machining using the hybrid particle swarm optimization-artificial neurons network (PSO-ANN) algorithm and the response surface method (RSM). A parametric study was conducted to determine the best predictions by adjusting the swarm population size (pop) and the number of neurons (n) in the hidden layer. The results showed that machining strategies and sequences can have a significant impact on energy consumption, reaching a difference of 99.25% between the minimum and maximum values. The cost (Ctot) and energy consumption (Etot) values with the PSO-ANN algorithm increased significantly by 99.99% and 92.41%, respectively, compared to the RSM model. The minimum mean square error values for Etot and Ctot with the PSO-ANN models are 3.0499 × 10⁻⁵ and 4.6296 × 10⁻¹⁰, respectively. This study highlights the potential of the hybrid PSO-ANN algorithm for multi-criteria prediction and highlights the potential for improved machining of 2017A alloy.
Keywords
Introduction
The energy consumption of numerical control (CNC) machine tools is a major issue in the industry. Indeed, these machines are widely used to manufacture precision parts in many industrial sectors, such as aerospace, automotive, and electronics. CNCs use a variety of electric motors to drive machine axes. However, these motors tend to consume a lot of energy, which can lead to higher operating costs and greenhouse gas emissions. Optimizing energy efficiency in parts manufacturing is closely linked to several key aspects, including innovative machine tool design, production line rationalization, and the adoption of advanced management practices. Energy optimization strategies are implemented in the parts-handling process (Feng et al., 2022b). This involves the careful optimization of processing parameters, from machining methods and tool selection to precise cutting parameters, machining strategies, and the optimum sequence for part processing. By intelligently adjusting these parameters, it is possible to minimize energy consumption and machining costs while maintaining high production quality. Production organization also plays a crucial role in reducing energy consumption. Thanks to meticulous production planning and advanced tool path management, unnecessary machine downtime can be avoided and idle cutting reduced to a minimum, thus contributing to more efficient energy use. In addition, the integration of advanced technologies, such as intelligent energy management and real-time monitoring of machine performance, allows continuous optimization of energy consumption and machining costs at all production levels.
The structure of this article is organized as follows: the second section introduces a literature review of previous research work. The third section describes the general context of this article. The fourth section presents the equipment and tools used to carry out the experimental tests. The fifth section presents the results, discussions, and sensitivity analyses. Finally, in the last section, conclusions are presented and suggestions are offered for future research studies.
Literature review
For this reason, manufacturers and researchers have set up research and development programs to reduce the energy consumption of CNCs. Khan et al. (2019) aim to improve energy efficiency, surface quality, and the amount of material removed during the machining of AISI 1045 steel. The results showed a 20.7% reduction in energy consumption with an optimal cutting speed of 1200 r/min, a feed rate of 320 mm/min, a cutting depth of 0.5 mm, and a cutting width of 15 mm. This study is notable for its focus on reducing energy consumption while maintaining material removal quantity and surface quality. The work of Wang et al. (2019) highlights the importance of sustainable production in today's manufacturing sectors and the need for a comprehensive energy optimization approach to achieve sustainable production. The paper also presents an improved ant colony optimization solution. This solution is used to optimize the production of a part with typical manufacturing characteristics, and the results show an efficiency improvement of 25% to solve the optimization problem. A data-driven optimization approach for various machining settings was put forth by Zhao et al. (2022). They examined the connection between energy use and meta-actions under various machining conditions and proposed a Gaussian process regression-based energy consumption model. In order to reduce energy consumption and production time, a multi-objective optimization model was then put out and solved using multi-objective grey wolf optimization. Cutting speed is the most important cutting parameter for energy consumption and production time, which also demonstrates that the suggested energy consumption model has greater forecast accuracy for a number of machining setups. Feng et al. (2022a) presented a systematic method to improve the energy efficiency of the machining process by integrating an energy model and a multi-objective optimization model. The energy model was established by considering cutting energy and non-cutting energy. The results showed that the accuracy of the energy consumption model reached 99.4%. A multi-objective optimization model with a genetic algorithm is then used to optimize the cutting parameters, considering energy consumption, processing time, and surface quality. The research of Feng et al. (2022b) focuses on the optimization of feature processing sequences and machining parameters to reduce energy consumption in CNC machines. The developed energy model analyses the impact of feature sorting on reducing non-cutting energy consumption, while cutting energy consumption is established using the unit volume cutting energy (specific energy consumed (SEC)) over the cutting volume. The energy models are used to optimize cutting energy consumption, machining quality, and machining time using the Non-dominated Sorting Genetic Algorithm II and empty cutting energy consumption path optimization using a genetic algorithm. Xiao et al. (2021) proposed a multi-objective optimization approach for process route planning in mechanical production to reduce production costs and increase energy efficiency. The model was validated using a concrete example of an emulsion pump machining process, and the results showed that the proposed approach achieves optimal energy consumption and production cost while meeting the criteria of energy savings and production sustainability. The comparative analysis of the results showed that the combinatorial optimization algorithm provides better optimization speed and accuracy than the standard genetic algorithm. The study by Uzun et al. (2022) investigated the impact of four different machining methods, namely “Trochoidal“, “Follow Part”, “Zig”, and “Zig-Zag”, on surface roughness, cutting time, and tool wear. Their results show that the “Zig“ strategy requires the most cutting time, while the “Follow Part“ strategy requires the least. Moreover, the best surface roughness values are obtained with the “Follow Part“ and “Trochoidal“ machining strategies, while the “Zig” strategy gives the poorest results in terms of surface roughness. Weiye et al. (2022) explored the application of deep reinforcement learning (DRL) to optimize milling process parameters. Their approach focused on minimizing machining costs, which were defined as a combination of cutting energy efficiency and machining time costs. Compared with the conventional optimization algorithm, the proposed method offers considerable savings in computation time, up to 95% compared with the traditional approach. In addition, the method guarantees that the average processing cost after optimization is close to the minimum processing cost obtained by the conventional optimization algorithm. Lu et al. (2023) introduced a new multi-pass parametric optimization approach based on DRL. This method allows parameters to be modified in such a way as to maximize energy efficiency, taking into account variations in deformation limits at each machining pass. Compared with the traditional method, the proposed method showed a remarkable 45.71% improvement in material removal rate. In addition, specific cutting energy was reduced by 32.27%, demonstrating a significant improvement in the energy efficiency of the machining process.
Contributions and novelties
Optimizing the machining process has become a crucial issue to increase productivity and quality. In order to optimally process planning, it is essential to select an appropriate machining strategy (Bousnina and Hamza, 2020). However, in order to develop a more accurate and robust model for the energy demand and cost associated with machining, it is necessary to more explicitly understand the energy consumption as a function of all the parameters that can influence this process. Currently, there is a significant disparity between development models and the ability to link the model to the tool path, capture the effect of cutting variables, and thus enable process planning with low energy consumption and cost. On the other hand, all the work focuses mainly on defining simple machining features (facing, pocketing, etc.), which significantly limits the understanding of the influence of cutting parameters on output responses, as a part comprises a set of interacting features. In addition, most of these studies use certain strategies without considering the machining sequences, and several parameters of the machining process have not been studied exhaustively in the literature. This paper aims to study the main experimental parameters that can influence the energy consumption and the machining cost, going through the cutting parameters and arriving at the machining sequences and strategies using the hybrid algorithm particle swarm optimization-artificial neurons network (PSO-ANN) and response surface method (RSM), which have not been treated in any previous work.
General study context
The main goal of manufacturing industries is to reduce the production cost as much as possible while maintaining a superior product quality. However, nowadays, energy consumption has become the main factor that directly influences the cost of machining. Therefore, it is imperative to minimize the energy consumption of machine tools in the machining process. This can only be achieved by knowing all the machining strategies. The situation becomes even more complex when it comes to interactive machining functions, such as holes/pockets and pockets/grooves. A machining strategy is a method used to generate a series of operations to create a given shape. The choice of these strategies is crucial to achieve well-defined specifications and shapes. In this context, three machining strategies were selected, namely zigzag, zig, and inward parallel contour (Figure 1).
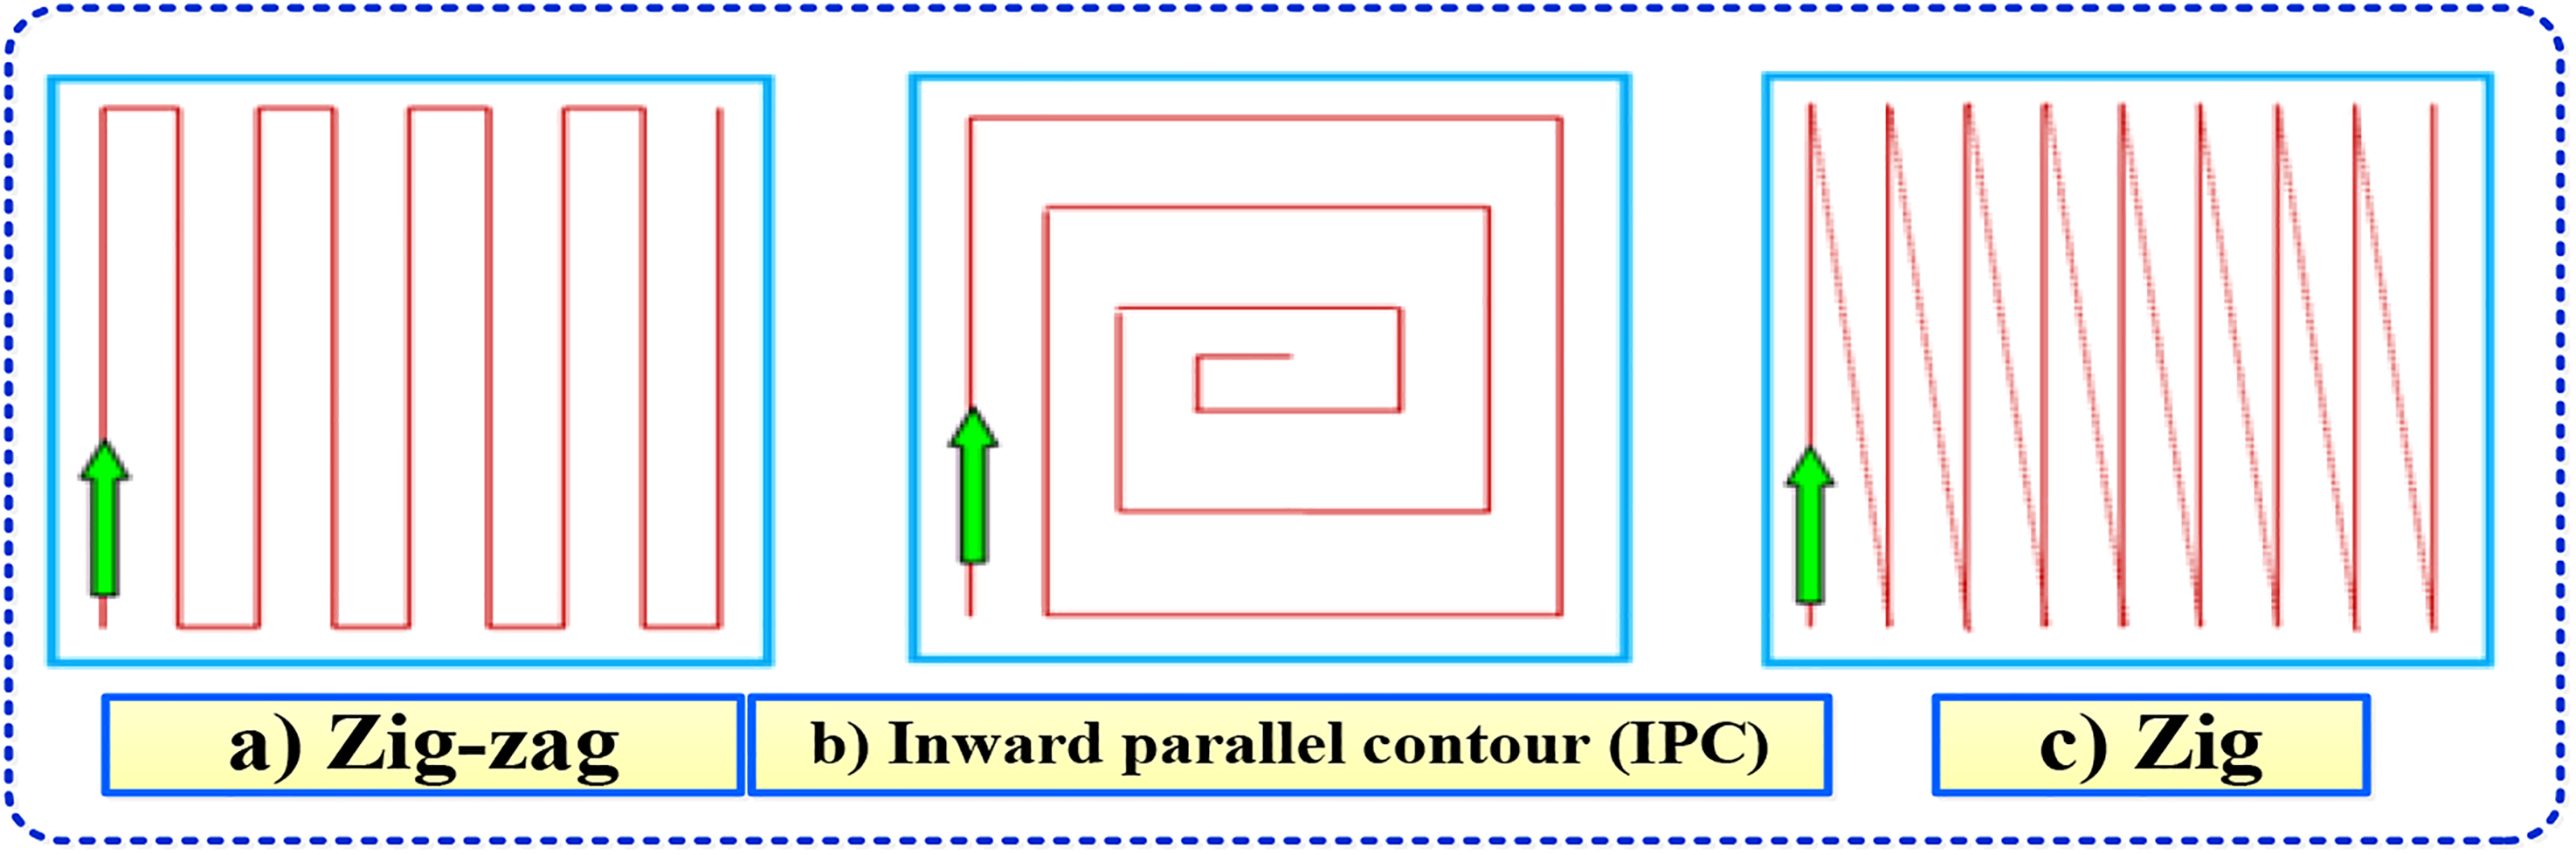
Different machining strategies.
This section examines the case of pocket/groove features by highlighting the effects of machining sequence planning, machining strategies, and cutting parameters on manufacturing cost and energy consumed. To illustrate this, Figure 2 shows all the machining sequences used in this study, with the different combinations of strategies such as zigzag, IPC, and zig.
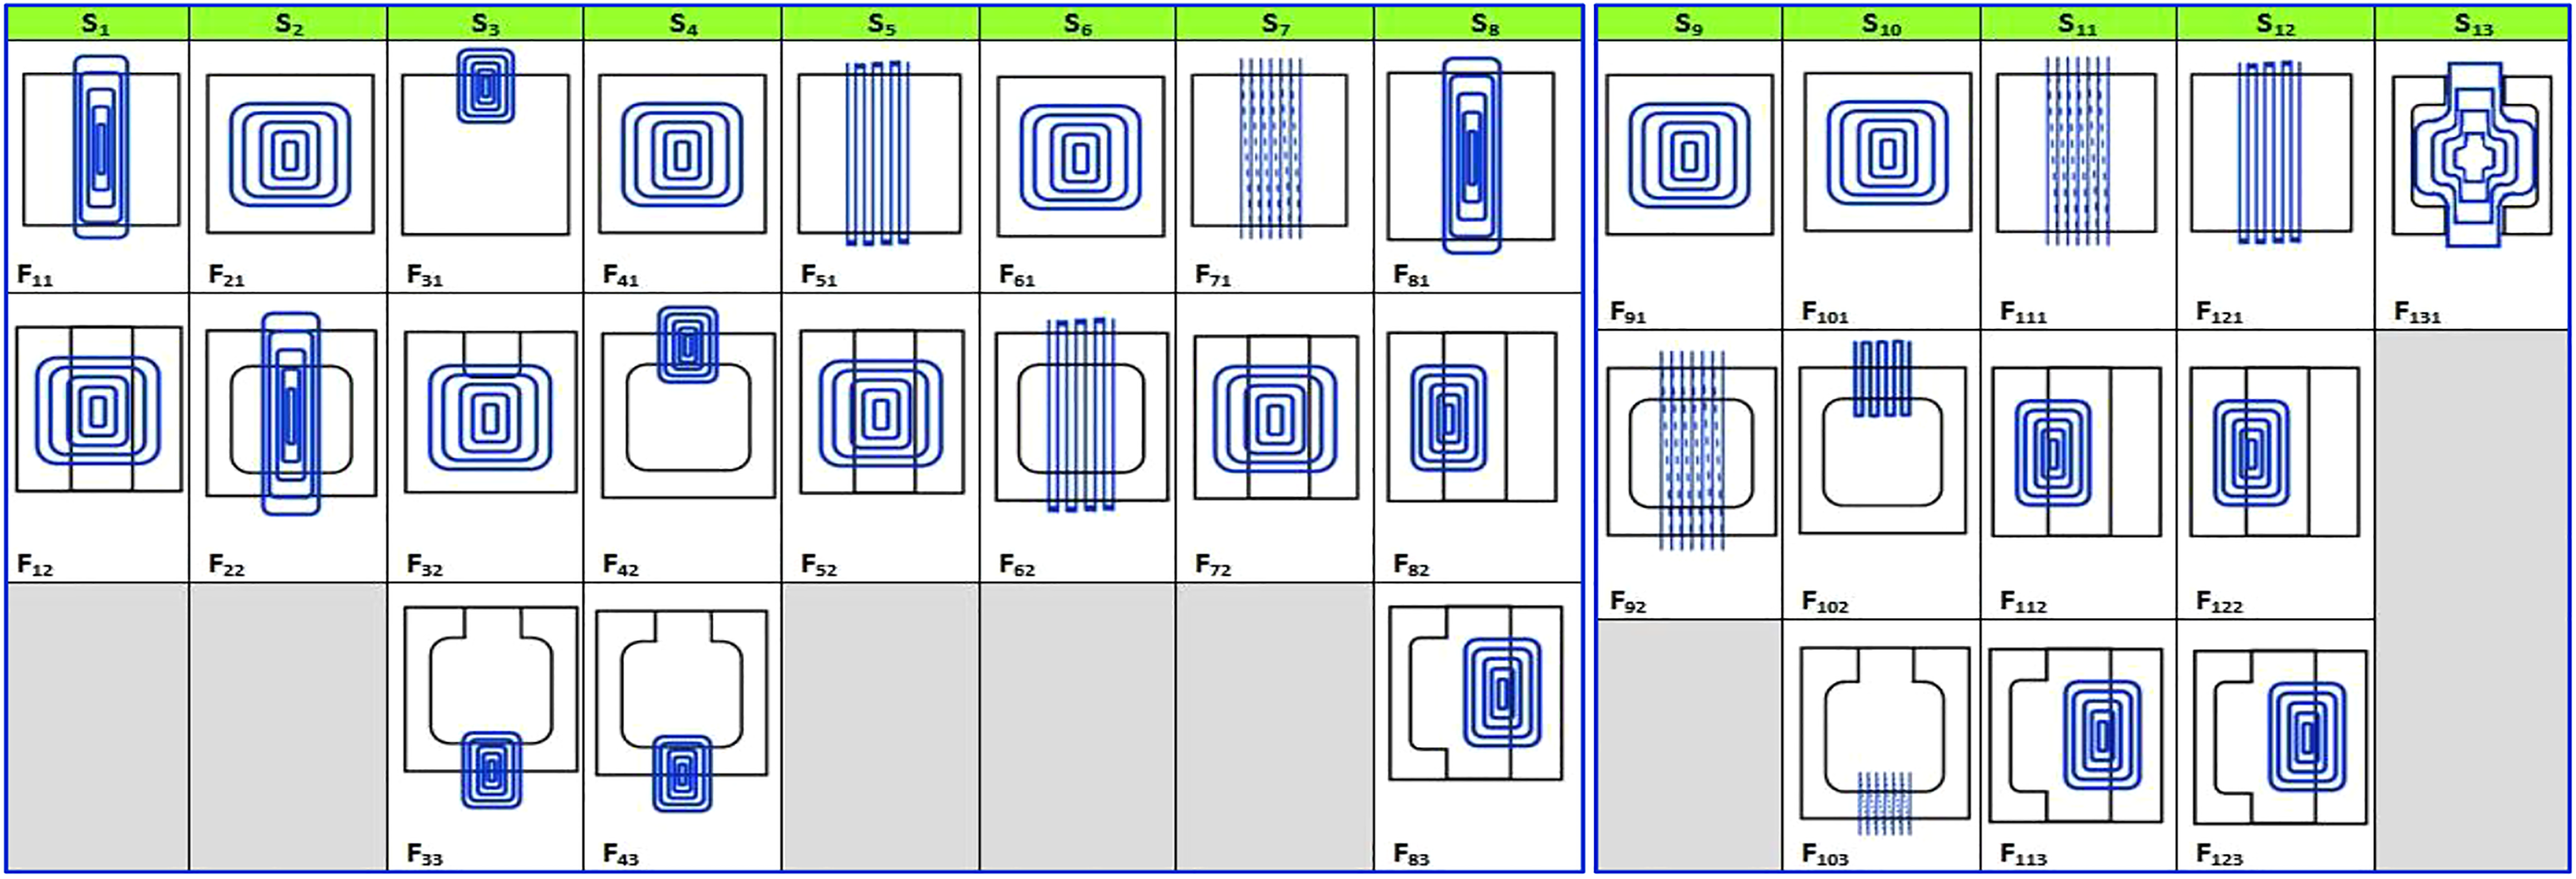
Different machining sequences.
Materials and measurements
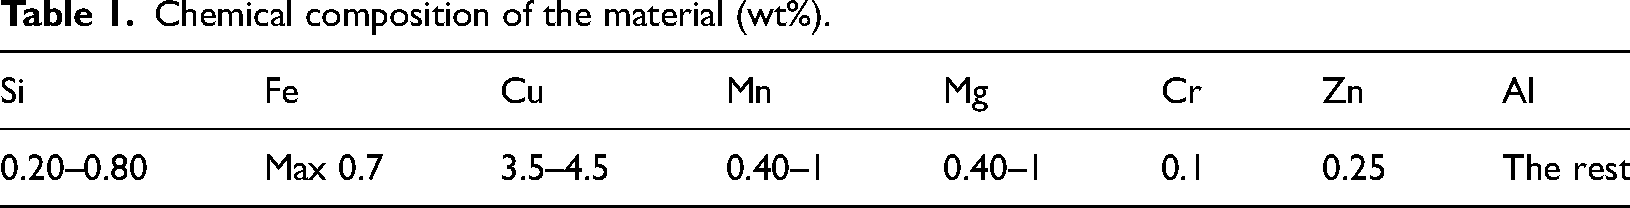
The machining center used in this study is a C300H 4-axis machine that can generate power ranging from 5.5 to 7.5 kW and has a maximum rotation frequency of 6500 r/min. It is powered by 380 V electrical energy and 6 bar pneumatic energy. Catia V5 software was used to create the tool paths and generate the G-code program compatible with the Num director of the center. The tool used in this study is an 8 mm diameter; HSSCo8 steel straight-end mill with two teeth and a helix angle of 30° (Figure 3). The material used for the machined part is an aluminum alloy (2017A: AlCu4MgSi) commonly used in industries such as aerospace and automotive due to its high mechanical characteristics after treatment, good machinability, polishability, and good heat resistance between 100 °C and 250 °C. The chemical composition of the material used is shown in Table 1. To measure the power consumed during each machining operation, a CA8332 power analyzer was used, and the data were processed using the Power Analyzer's Data view interface.
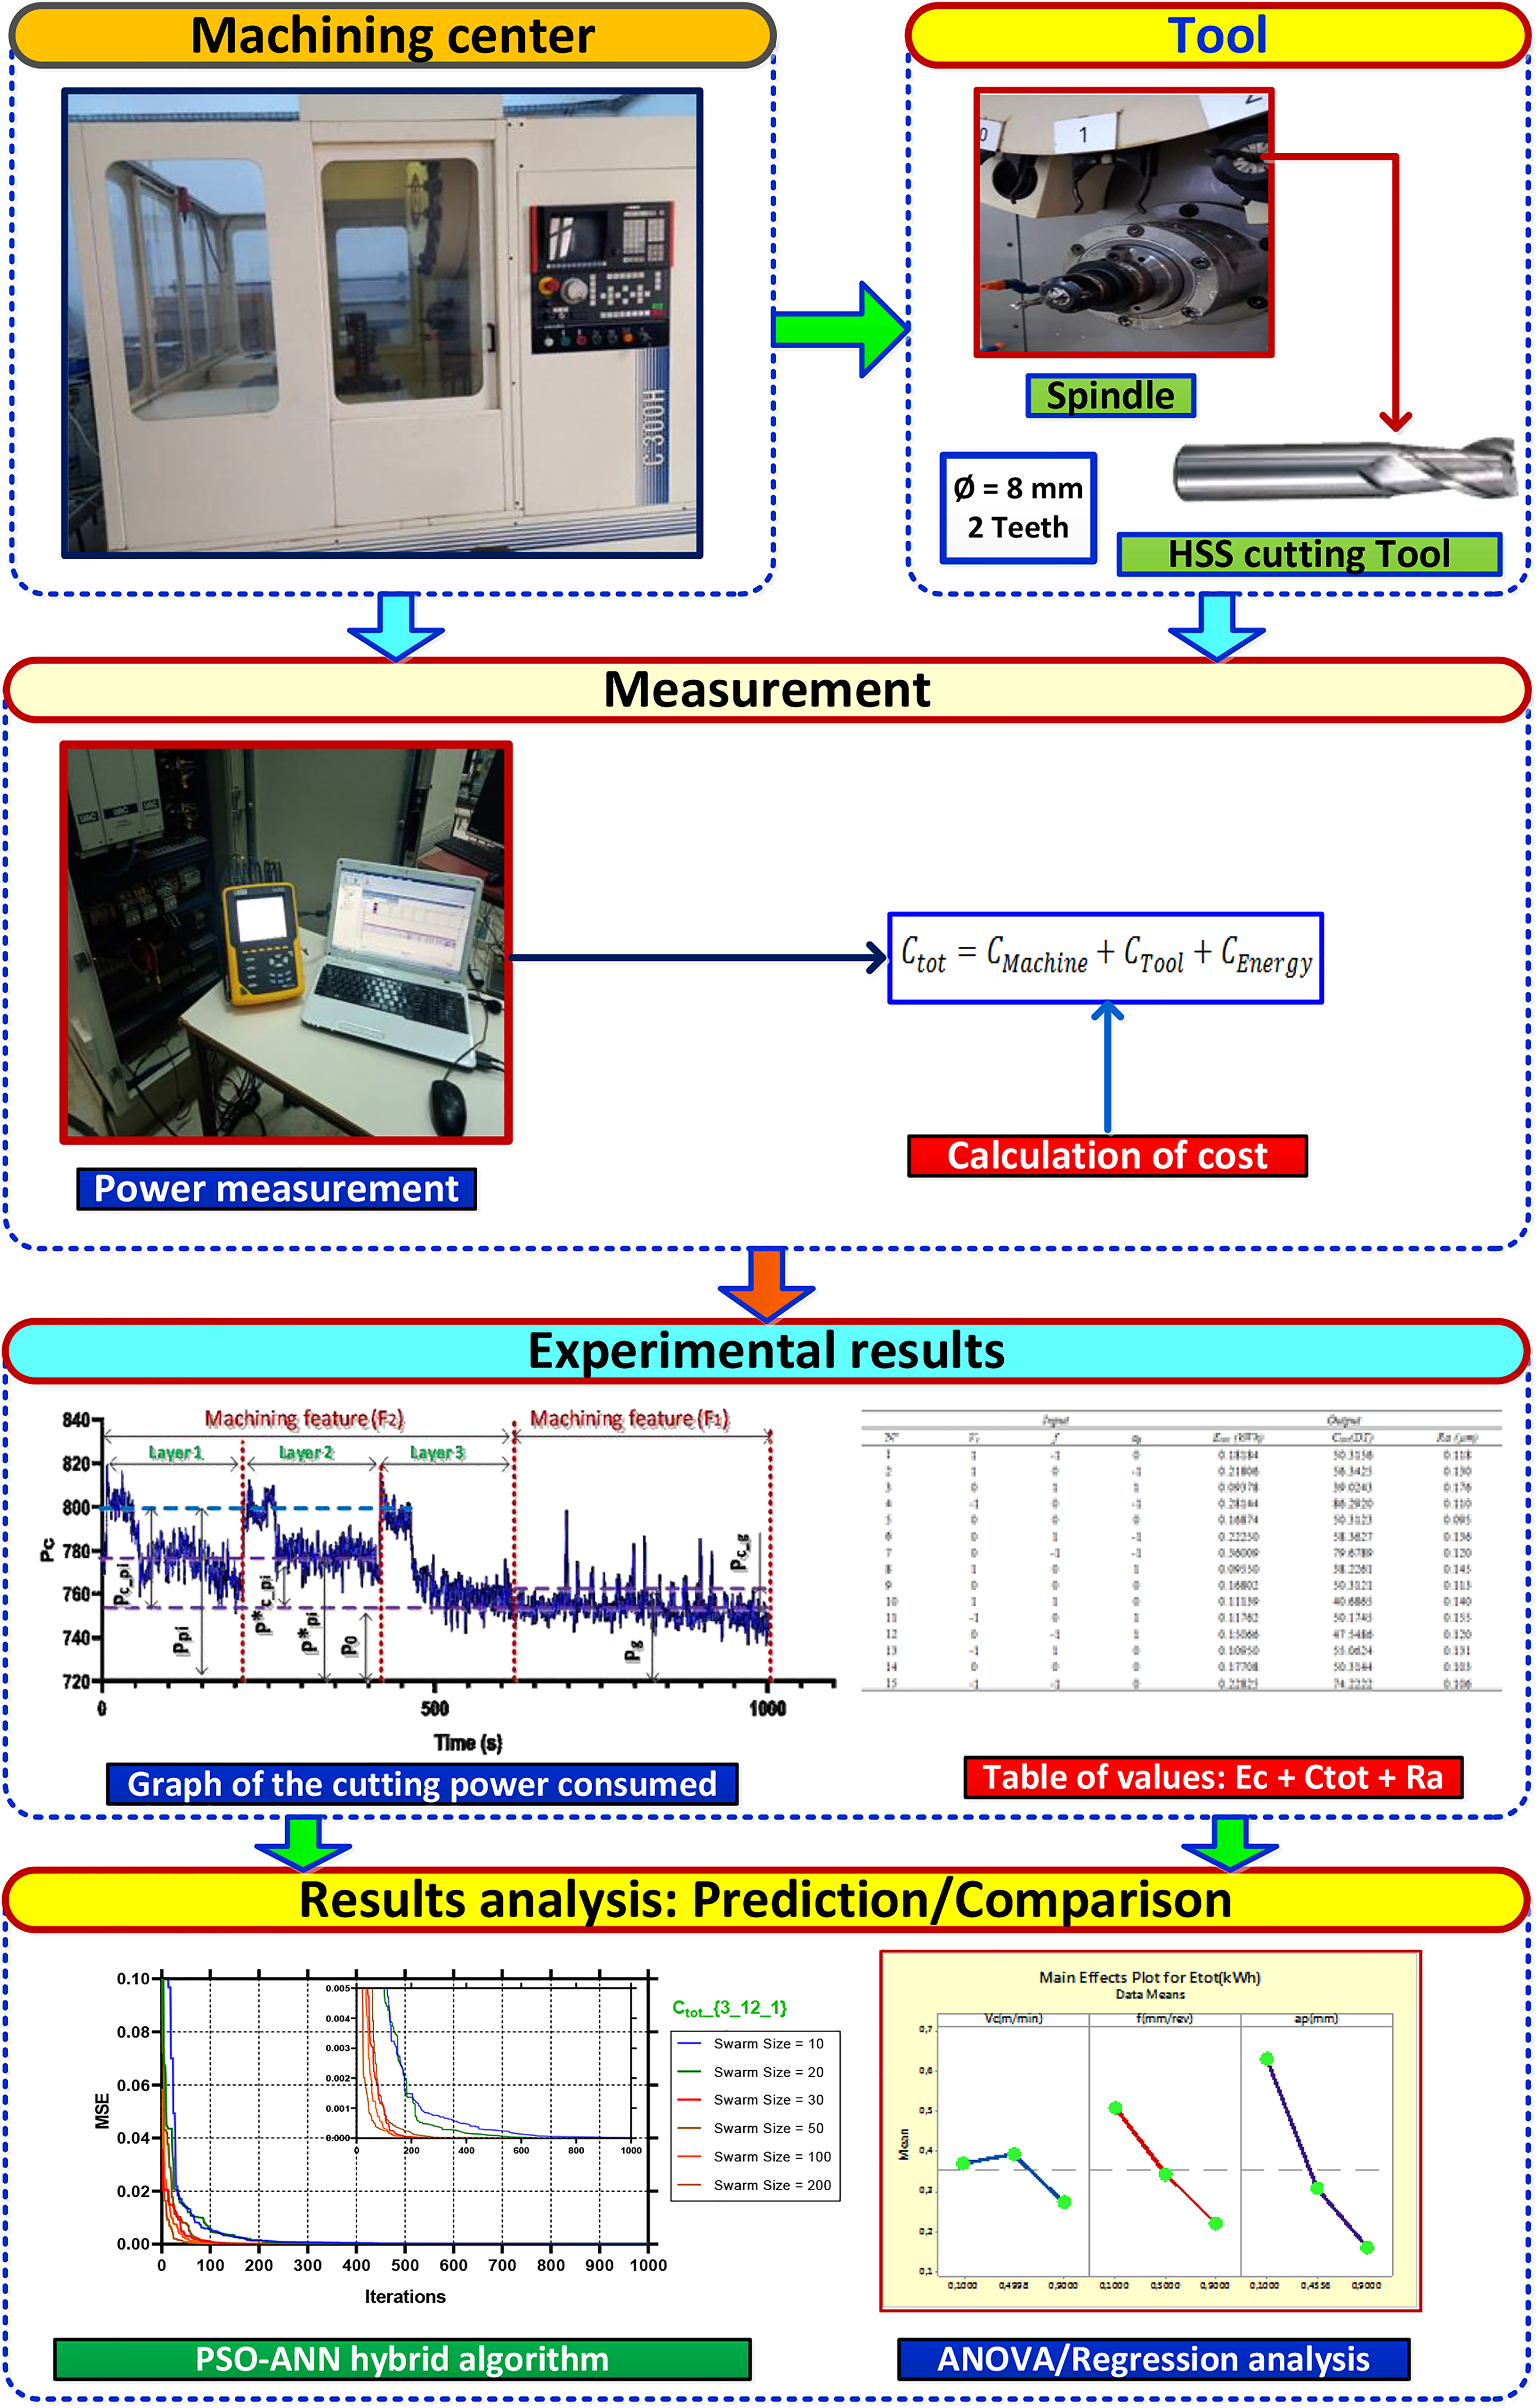
Measurement plan.
Chemical composition of the material (wt%).
The energy consumed can be written in the following forms:


Results and discussion
First case
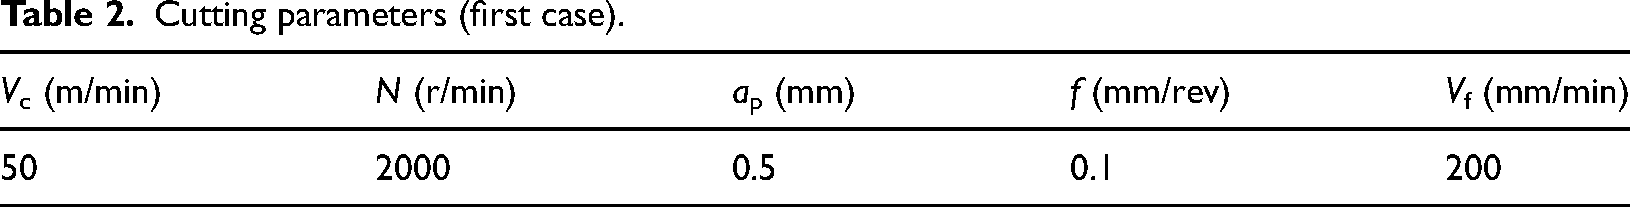
The first case study examines the different machining strategies and sequences by holding the cutting parameters constant for all experiments. The machining technology parameters were selected based on the tool manufacturer's catalog and the capabilities of the machining center. The values of the cutting parameters used for this first part are presented in Table 2. This study examined the machining sequences and strategies, that is, the toolpaths, to find the optimal sequence. The results, presented in Table 3, show the values of energy consumed and cost. The sequence S8 = F81–F82–F83 was identified as having the lowest cost and energy. This sequence is characterized by the fact that the tool is in full material throughout its cutting path, which saves time. In addition, sequence S8 uses the IPC strategy for all features F81–F82–F83, demonstrating that the choice of tool path and machining sequence has a significant impact on cost and energy.
Cutting parameters (first case).
Experimental values (first case).
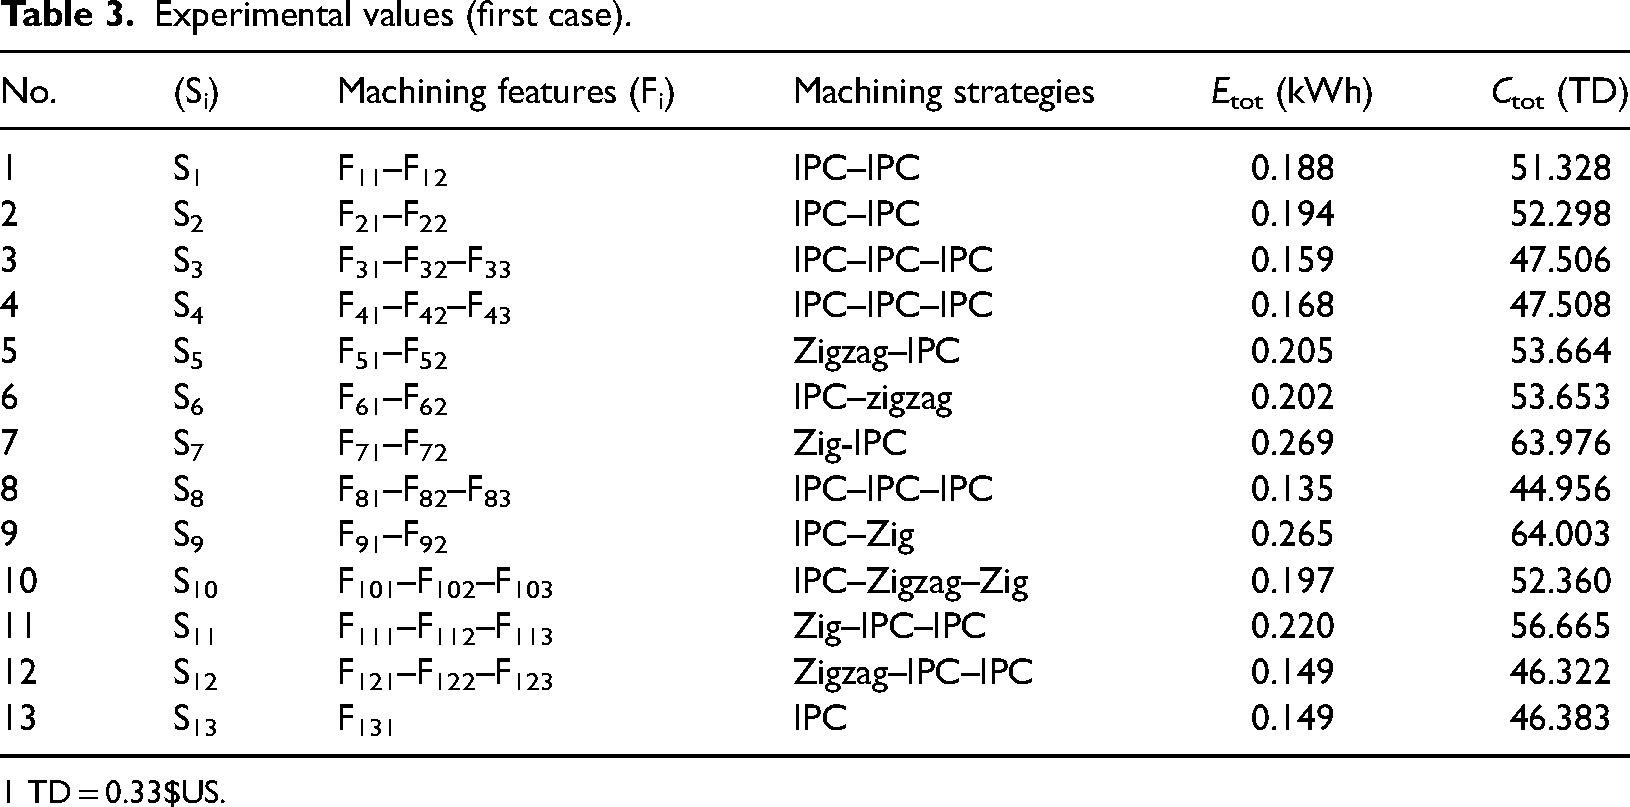
1 TD = 0.33$US.
Figure 4 shows the results obtained for the total energy consumed Etot for each groove processing strategy. It can be seen that the IPC strategy leads to minimum energy consumption, unlike the other two strategies. On the other hand, the zig strategy leads to maximum energy consumption for the F71 feature, suggesting that the tool spends a significant portion of its cycle in the air during cutting. This result is in agreement with the findings of studies conducted by (Edem et al., 2017) and (Altıntaş et al., 2016).
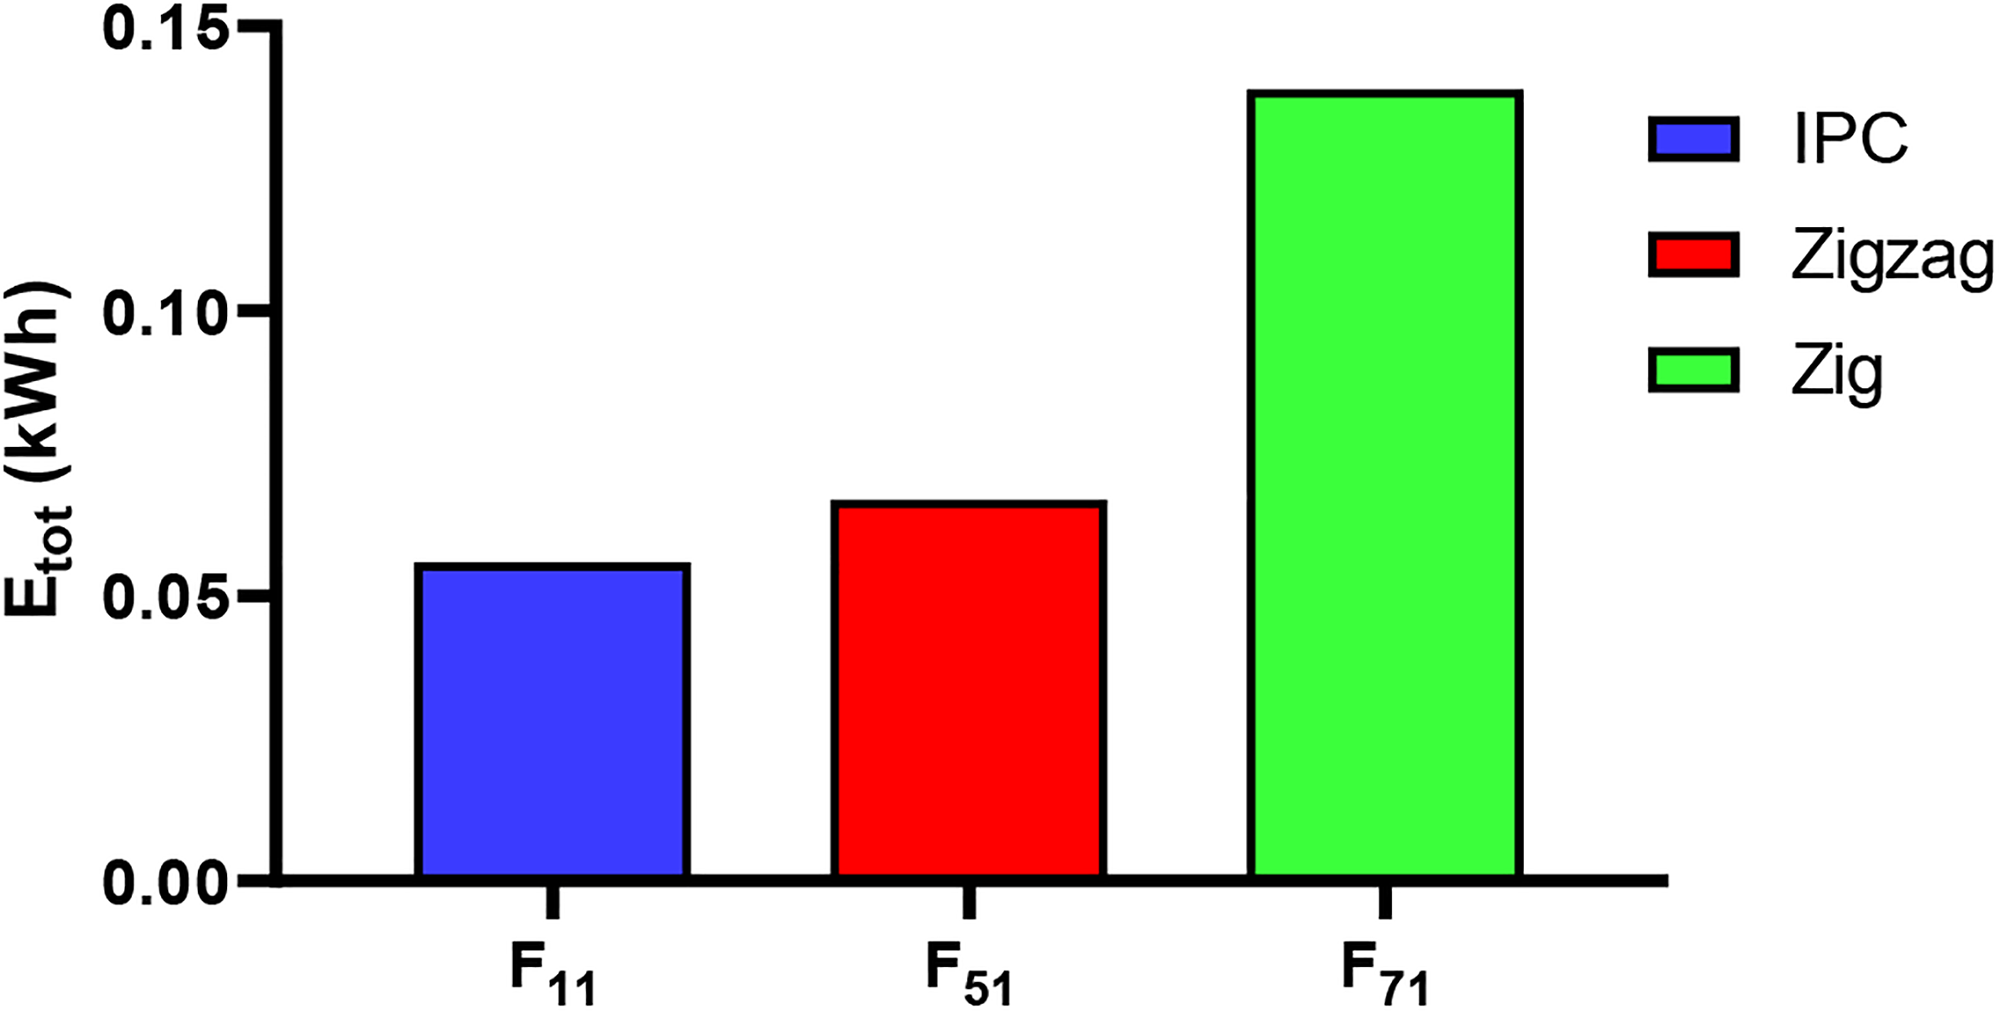
Histogram of the energy consumed for the machining of the groove with the different strategies.
The study is related to this sequence S8 with the combination F81–F82–F83 in what comes next.
Second case
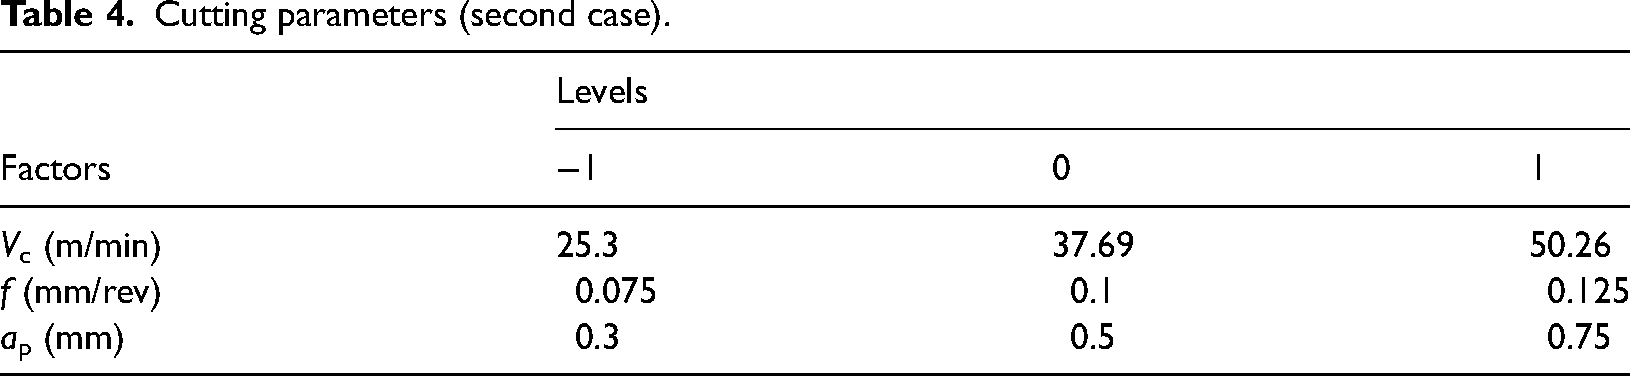
The second part of the study focused on the analysis of the cutting parameters and their influence on the output variables, specifically the Etot and Ctot variables. To achieve this objective, a statistical analysis method called “Response Surface Methodology“ as well as a hybrid “neural network coupled to swarm particles” (PSO-ANN) algorithm are used to predict the results of the experiments. The cutting parameters selected for this study are presented in Table 4 and are carefully chosen to represent the actual machining conditions of the part in question.
Cutting parameters (second case).
To ensure that the tool removes the same depth for each level, the cutting depth (ap) was chosen appropriately. The total cutting height of the part was set to 1.5 mm. The experimental results of Etot and Ctot for 15 machining trials of the S8 sequence were recorded for different combinations of cutting parameters.
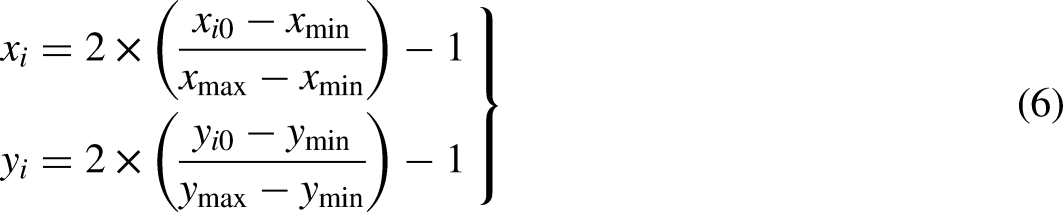
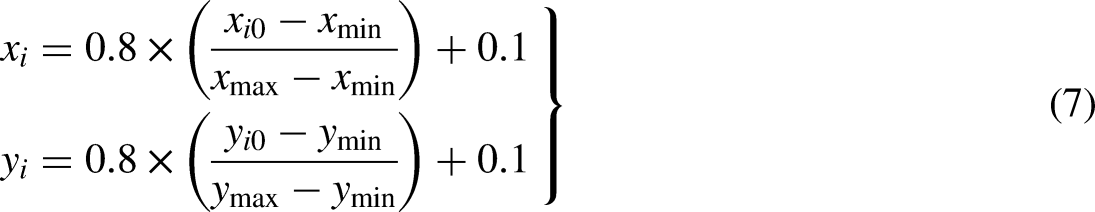
Normalization is an important step in modelling complex problems, especially when there are input and output variables of different magnitudes. Normalizing the data puts them all on a comparable scale, making it easier to process the data and design the model. It also reduces rounding errors and increases the accuracy of the results obtained. In the literature, several normalization formulas are used, such as equation (6) (Shariati et al., 2019) and (Rukhaiyar et al., 2018), equation (7) (Özgören et al., 2013) and (Çay et al., 2012), and equation (8) (Jahed Armaghani et al., 2017) and (Diyaley et al., 2019).
In this case, normalization was performed using equation (7), which is a common method in the literature. This equation normalizes the data to values between 0.1 and 0.9. This means that the experimental input and output values were adjusted to be in this normalized range. Normalization is an efficient way to process experimental data to make it usable for modelling and optimization.
where xi and yi are the values of the input and output parameters, respectively. Table 5 presents the normalized experimental values of the 15 trials of Etot and Ctot for the machining of the S8 sequence with a different combination of cutting parameters.
The effectiveness of two different approaches is evaluated using a measure of the mean square error (MSE). The latter is calculated by applying the following equation:
Normalized experimental values (second case).
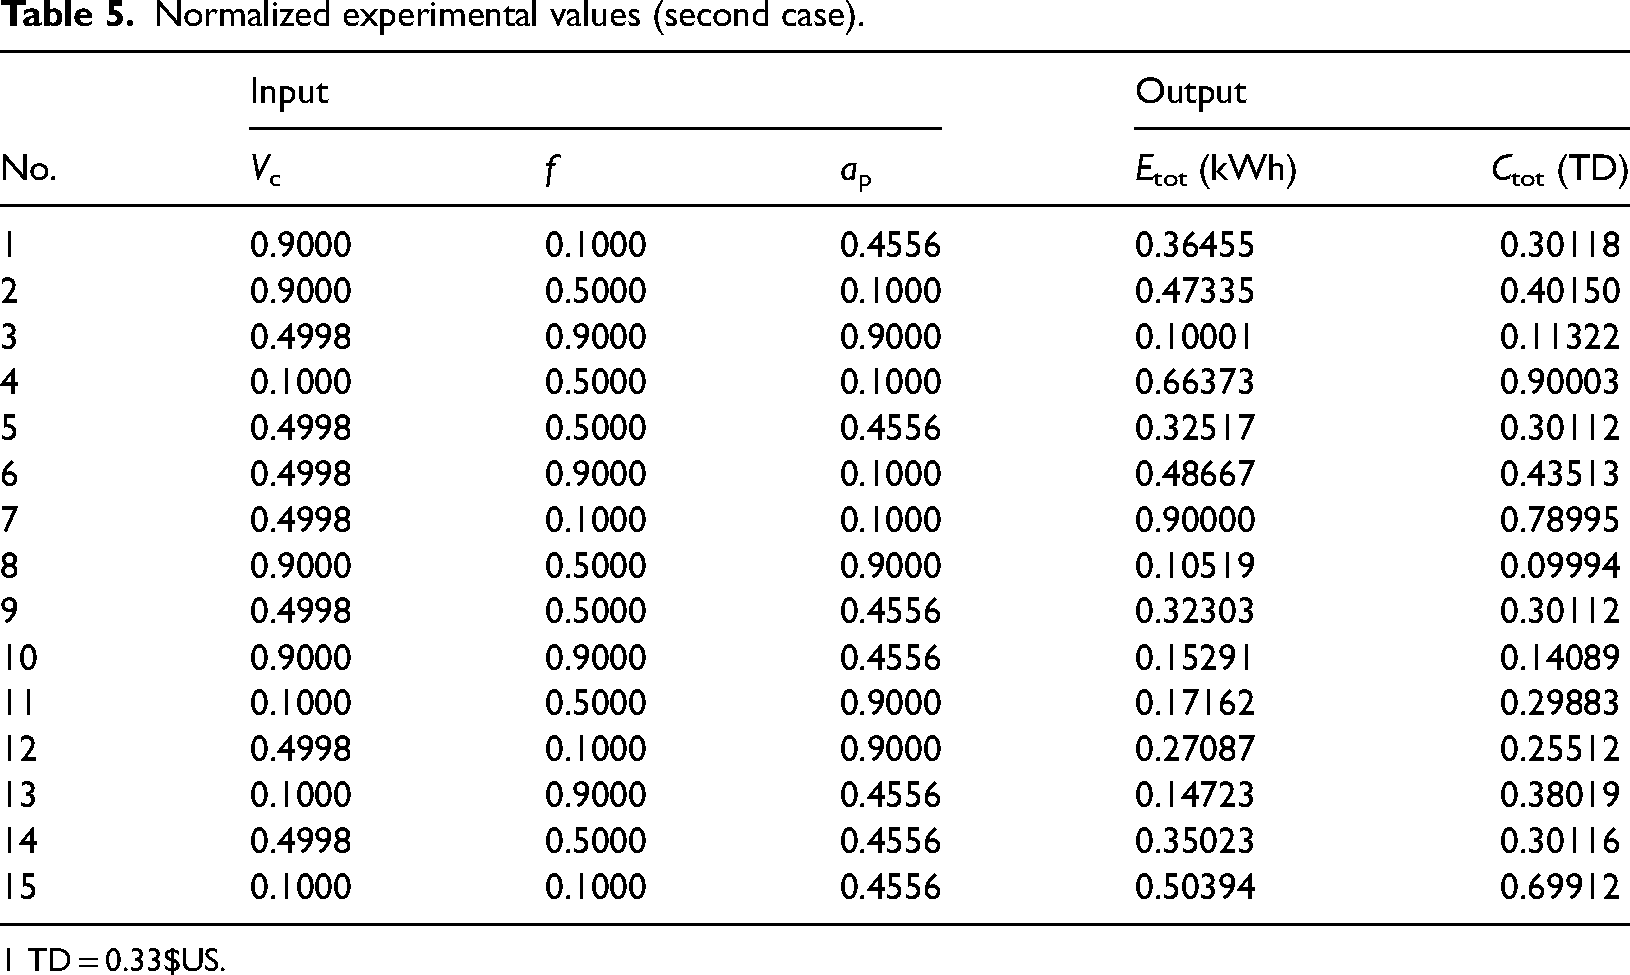
1 TD = 0.33$US.
The second performance indicator considered is the correlation coefficient (R2), which ranges from −1 to +1. A correlation coefficient close to +1 indicates a strong positive linear correlation between the input parameters and the output variables and that the model results are consistent with the experimental data (Lmalghan et al., 2018). The following formula is used to calculate the R2:

Prediction with the RSM
The RSM is a statistical approach commonly used to analyze the complex relationships between input variables and system response. The aim is to build a model that mathematically represents the relationship between a continuous output variable and a set of input variables using a suitable function. Using this method, it is possible to identify the key factors influencing the response variable, predict system performance under different conditions, and optimize processes to achieve the desired results.
Analysis of variance (ANOVA)
ANOVA is commonly used in engineering to analyze experimental data and evaluate the effect of different factors on output responses (Kuntoğlu and Sağlam, 2019). The results of the ANOVA for energy consumed and machining cost are presented in Tables 6 and 7, respectively. The p-value indicates whether the control factors are statistically significant, with a value of <0.05 being considered significant (Abolghasemian et al., 2022). The p-value is given by the following equation (Matlab 17.0 software):

ANOVA for Etot.
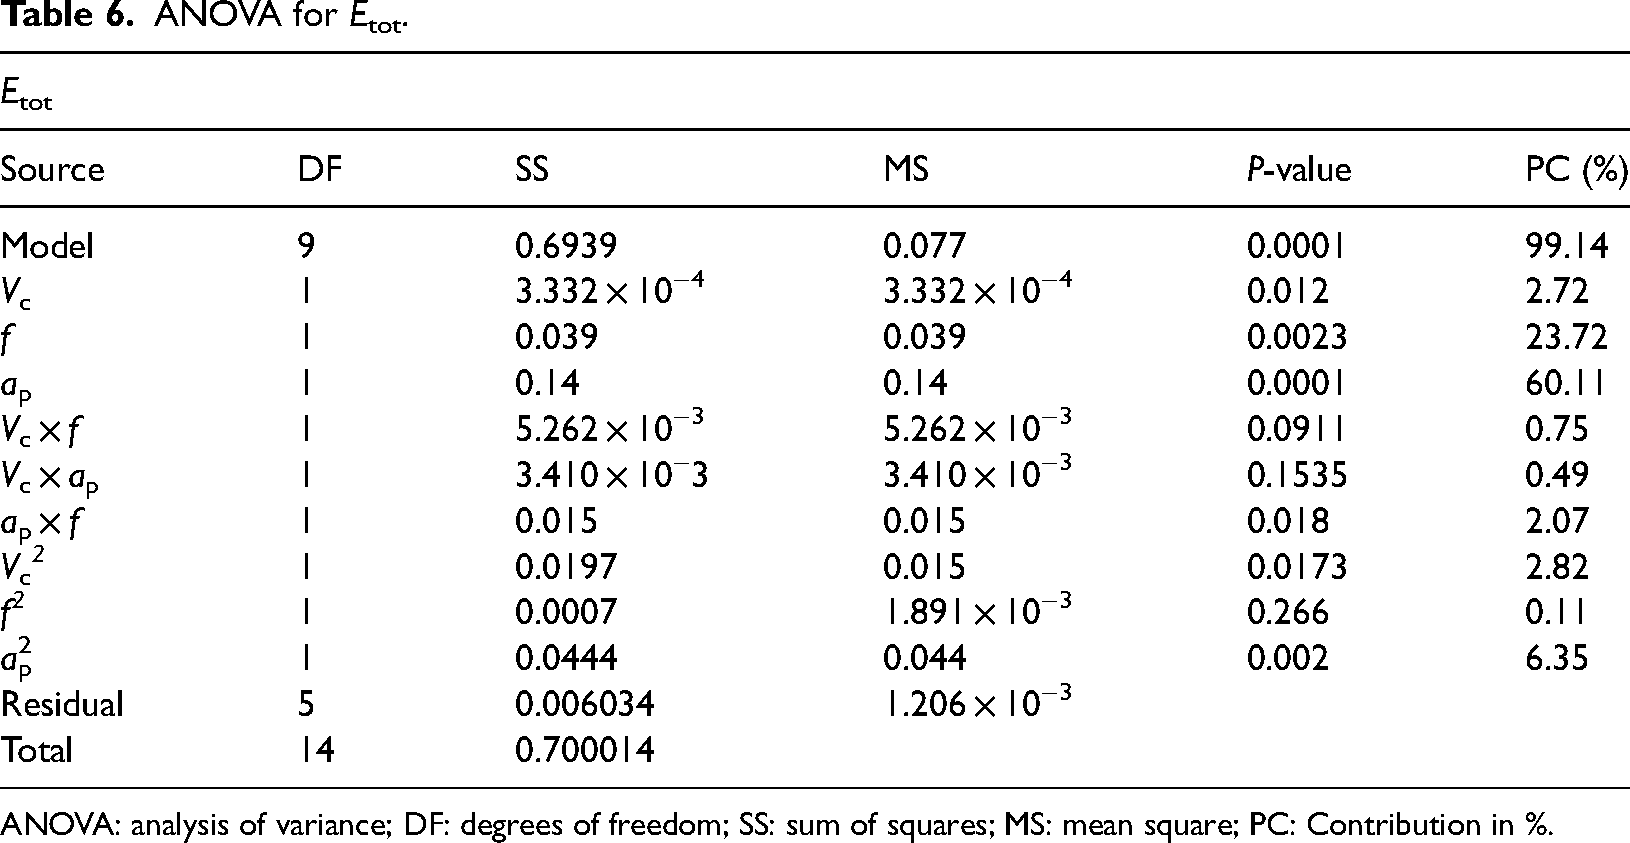
ANOVA: analysis of variance; DF: degrees of freedom; SS: sum of squares; MS: mean square; PC: Contribution in %.
ANOVA for Ctot.
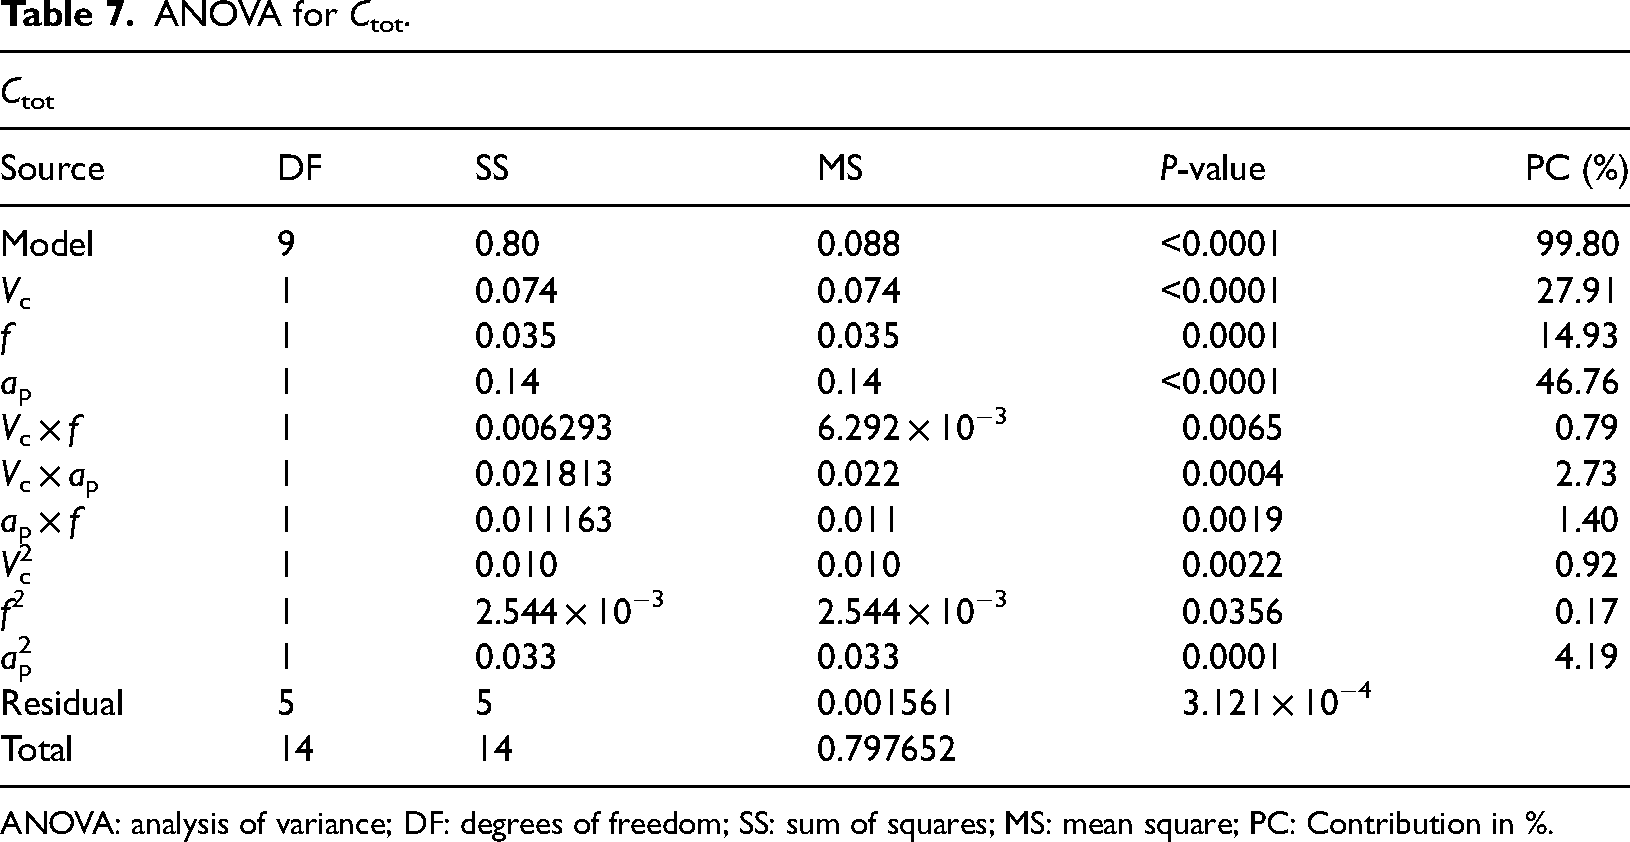
ANOVA: analysis of variance; DF: degrees of freedom; SS: sum of squares; MS: mean square; PC: Contribution in %.
where Z is the test static, n is the sample size, p0 is the assumed proportion of the population in the null hypothesis and p is the sample proportion.
In this study, the p-value for Etot and Ctot is 0.0001, which proves that both models are significant. The results also show that the depth of cut is the most significant factor for Etot and Ctot, contributing 60.11% and 46.76%, respectively. These results are similar to those of Shi et al. (2019), who also found that depth of cut was the most effective parameter for energy consumption. Similarly, Feng et al. (2021) also observed that depth of cut was the most influential factor but found that the effects of ap and f were very close to each other. Figures 5 and 6 clearly illustrate that the depth of cut has a significant effect on the energy consumed and the machining cost, as there is a greater slope than the other two parameters. The work of Zhao et al., (2022) converges to the same conclusion in terms of the impact rank on energy consumption. Similarly, also Li et al. (2019) found that the depth of cut is the factor that has more influence on the SEC than the cutting speed. These results suggest that optimizing the depth of cut could be an effective way to reduce energy consumption and machining costs while maintaining acceptable performance levels.
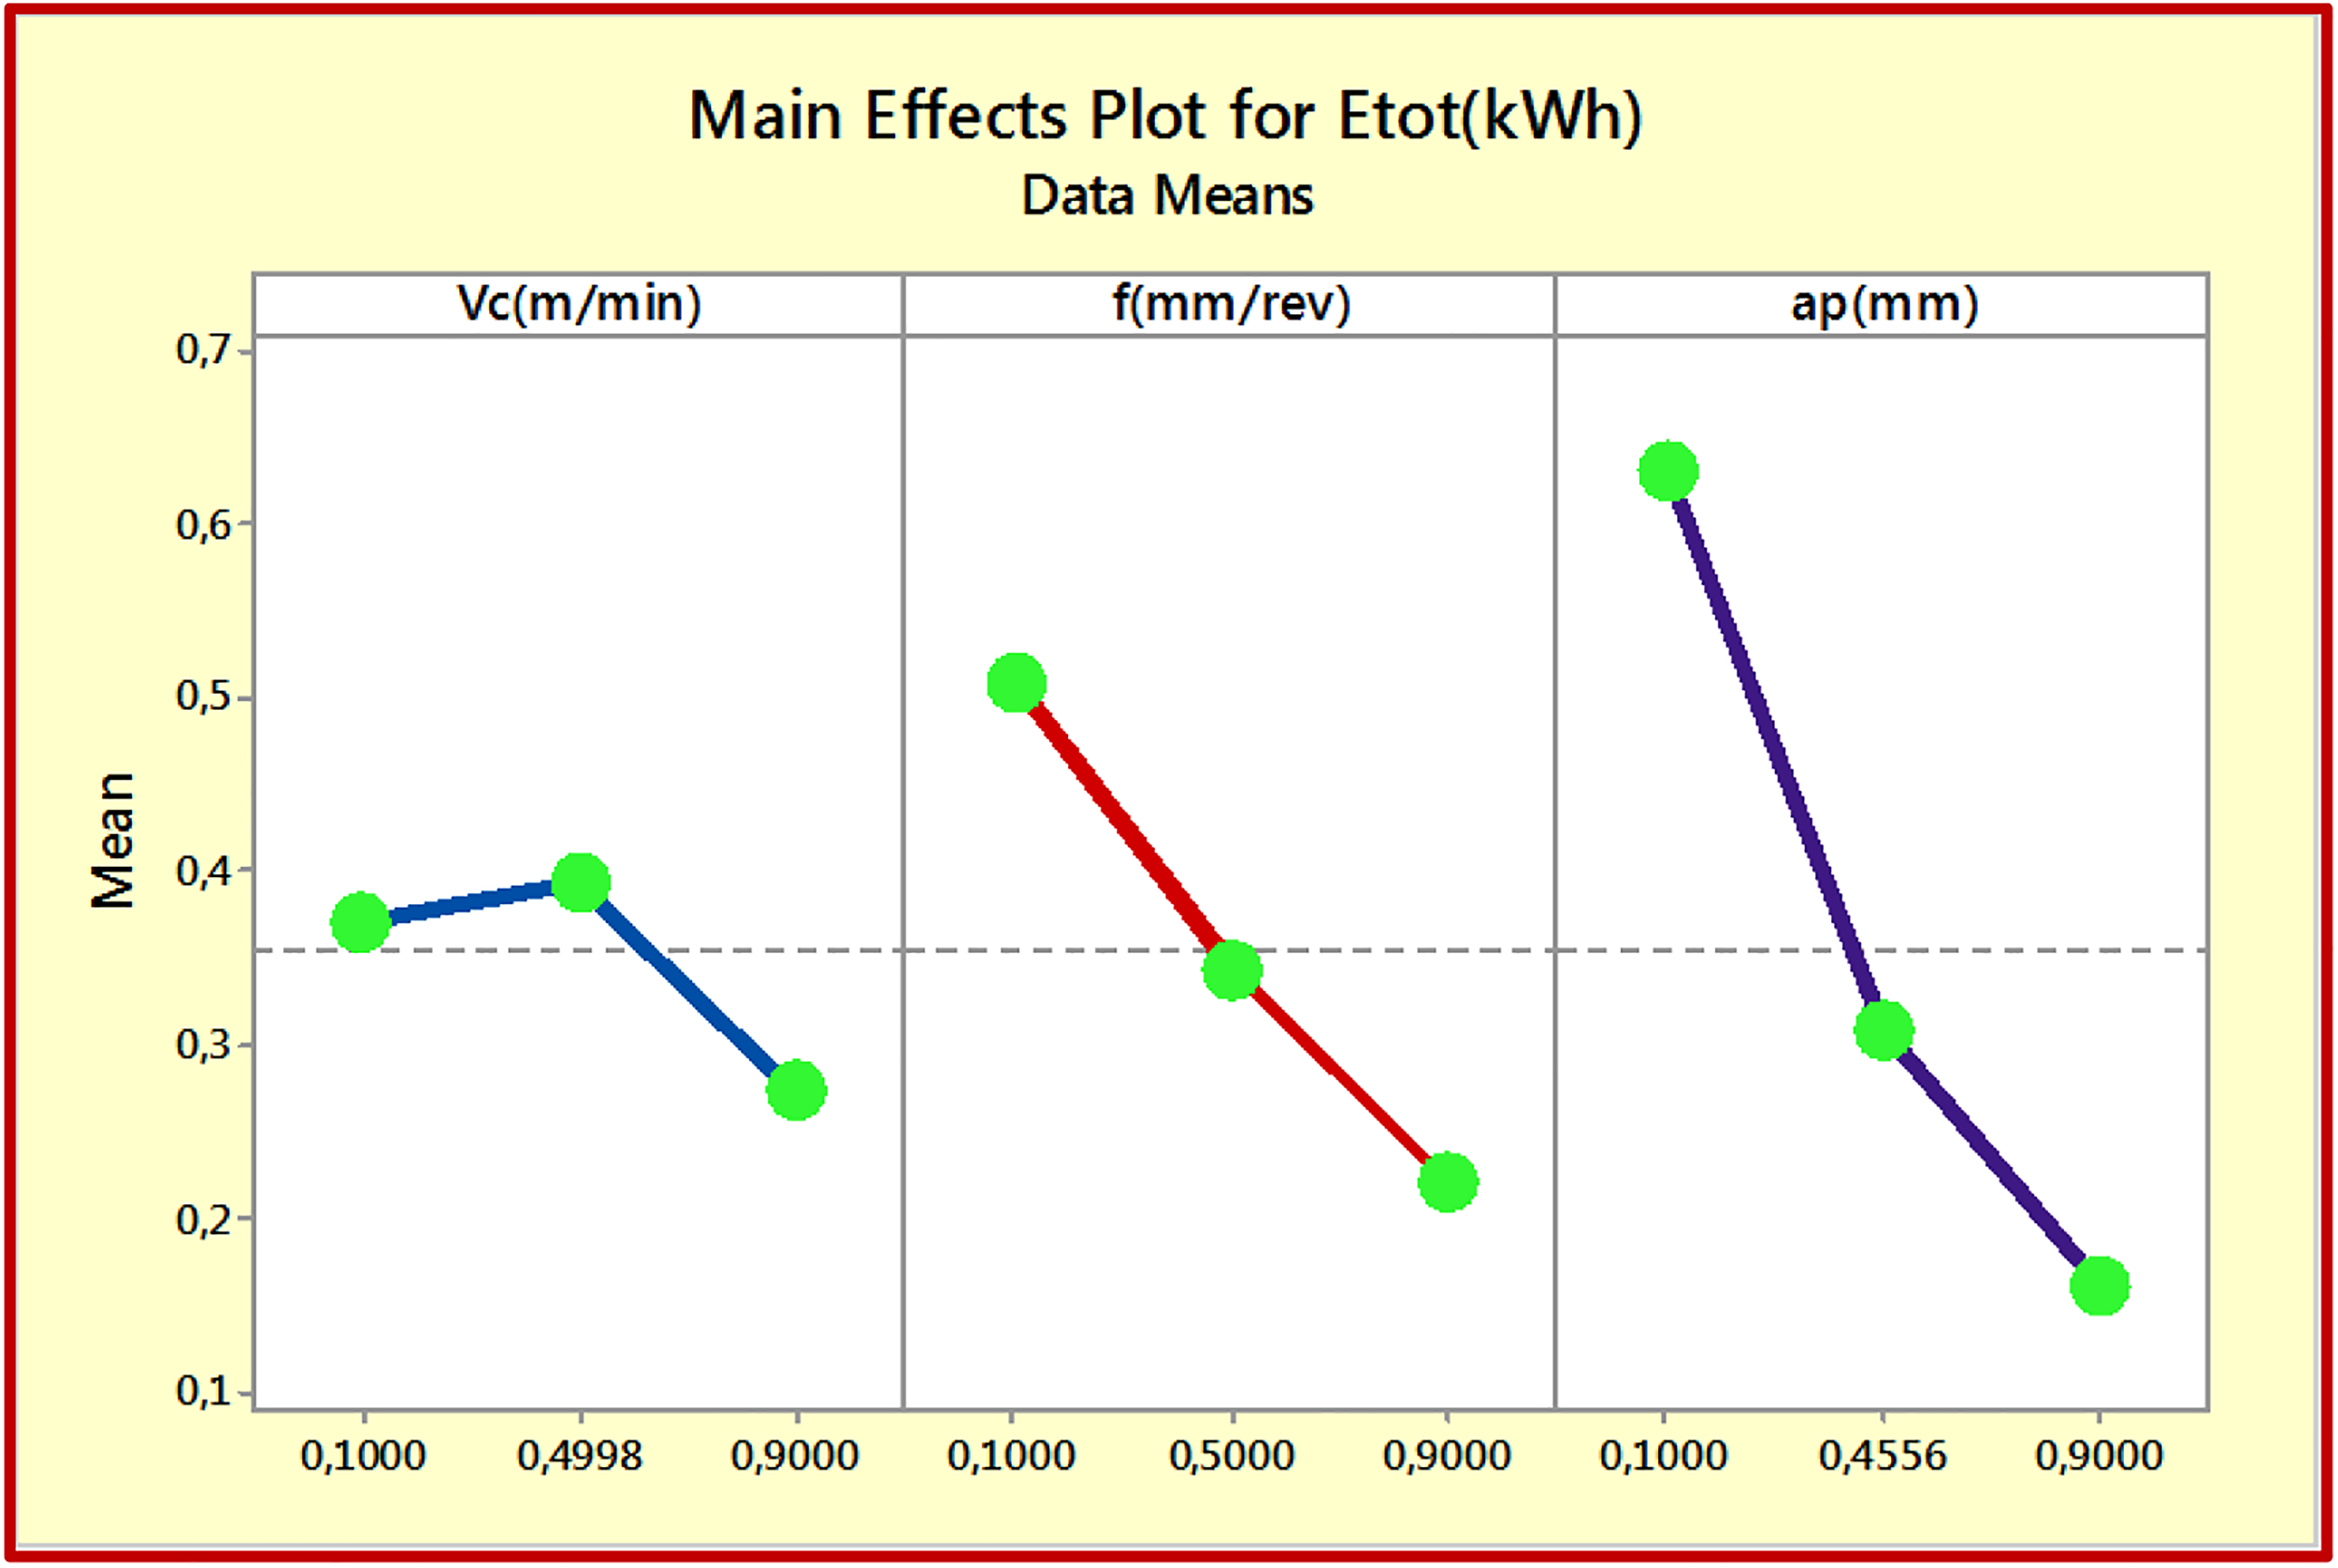
Main effects plot for Etot.
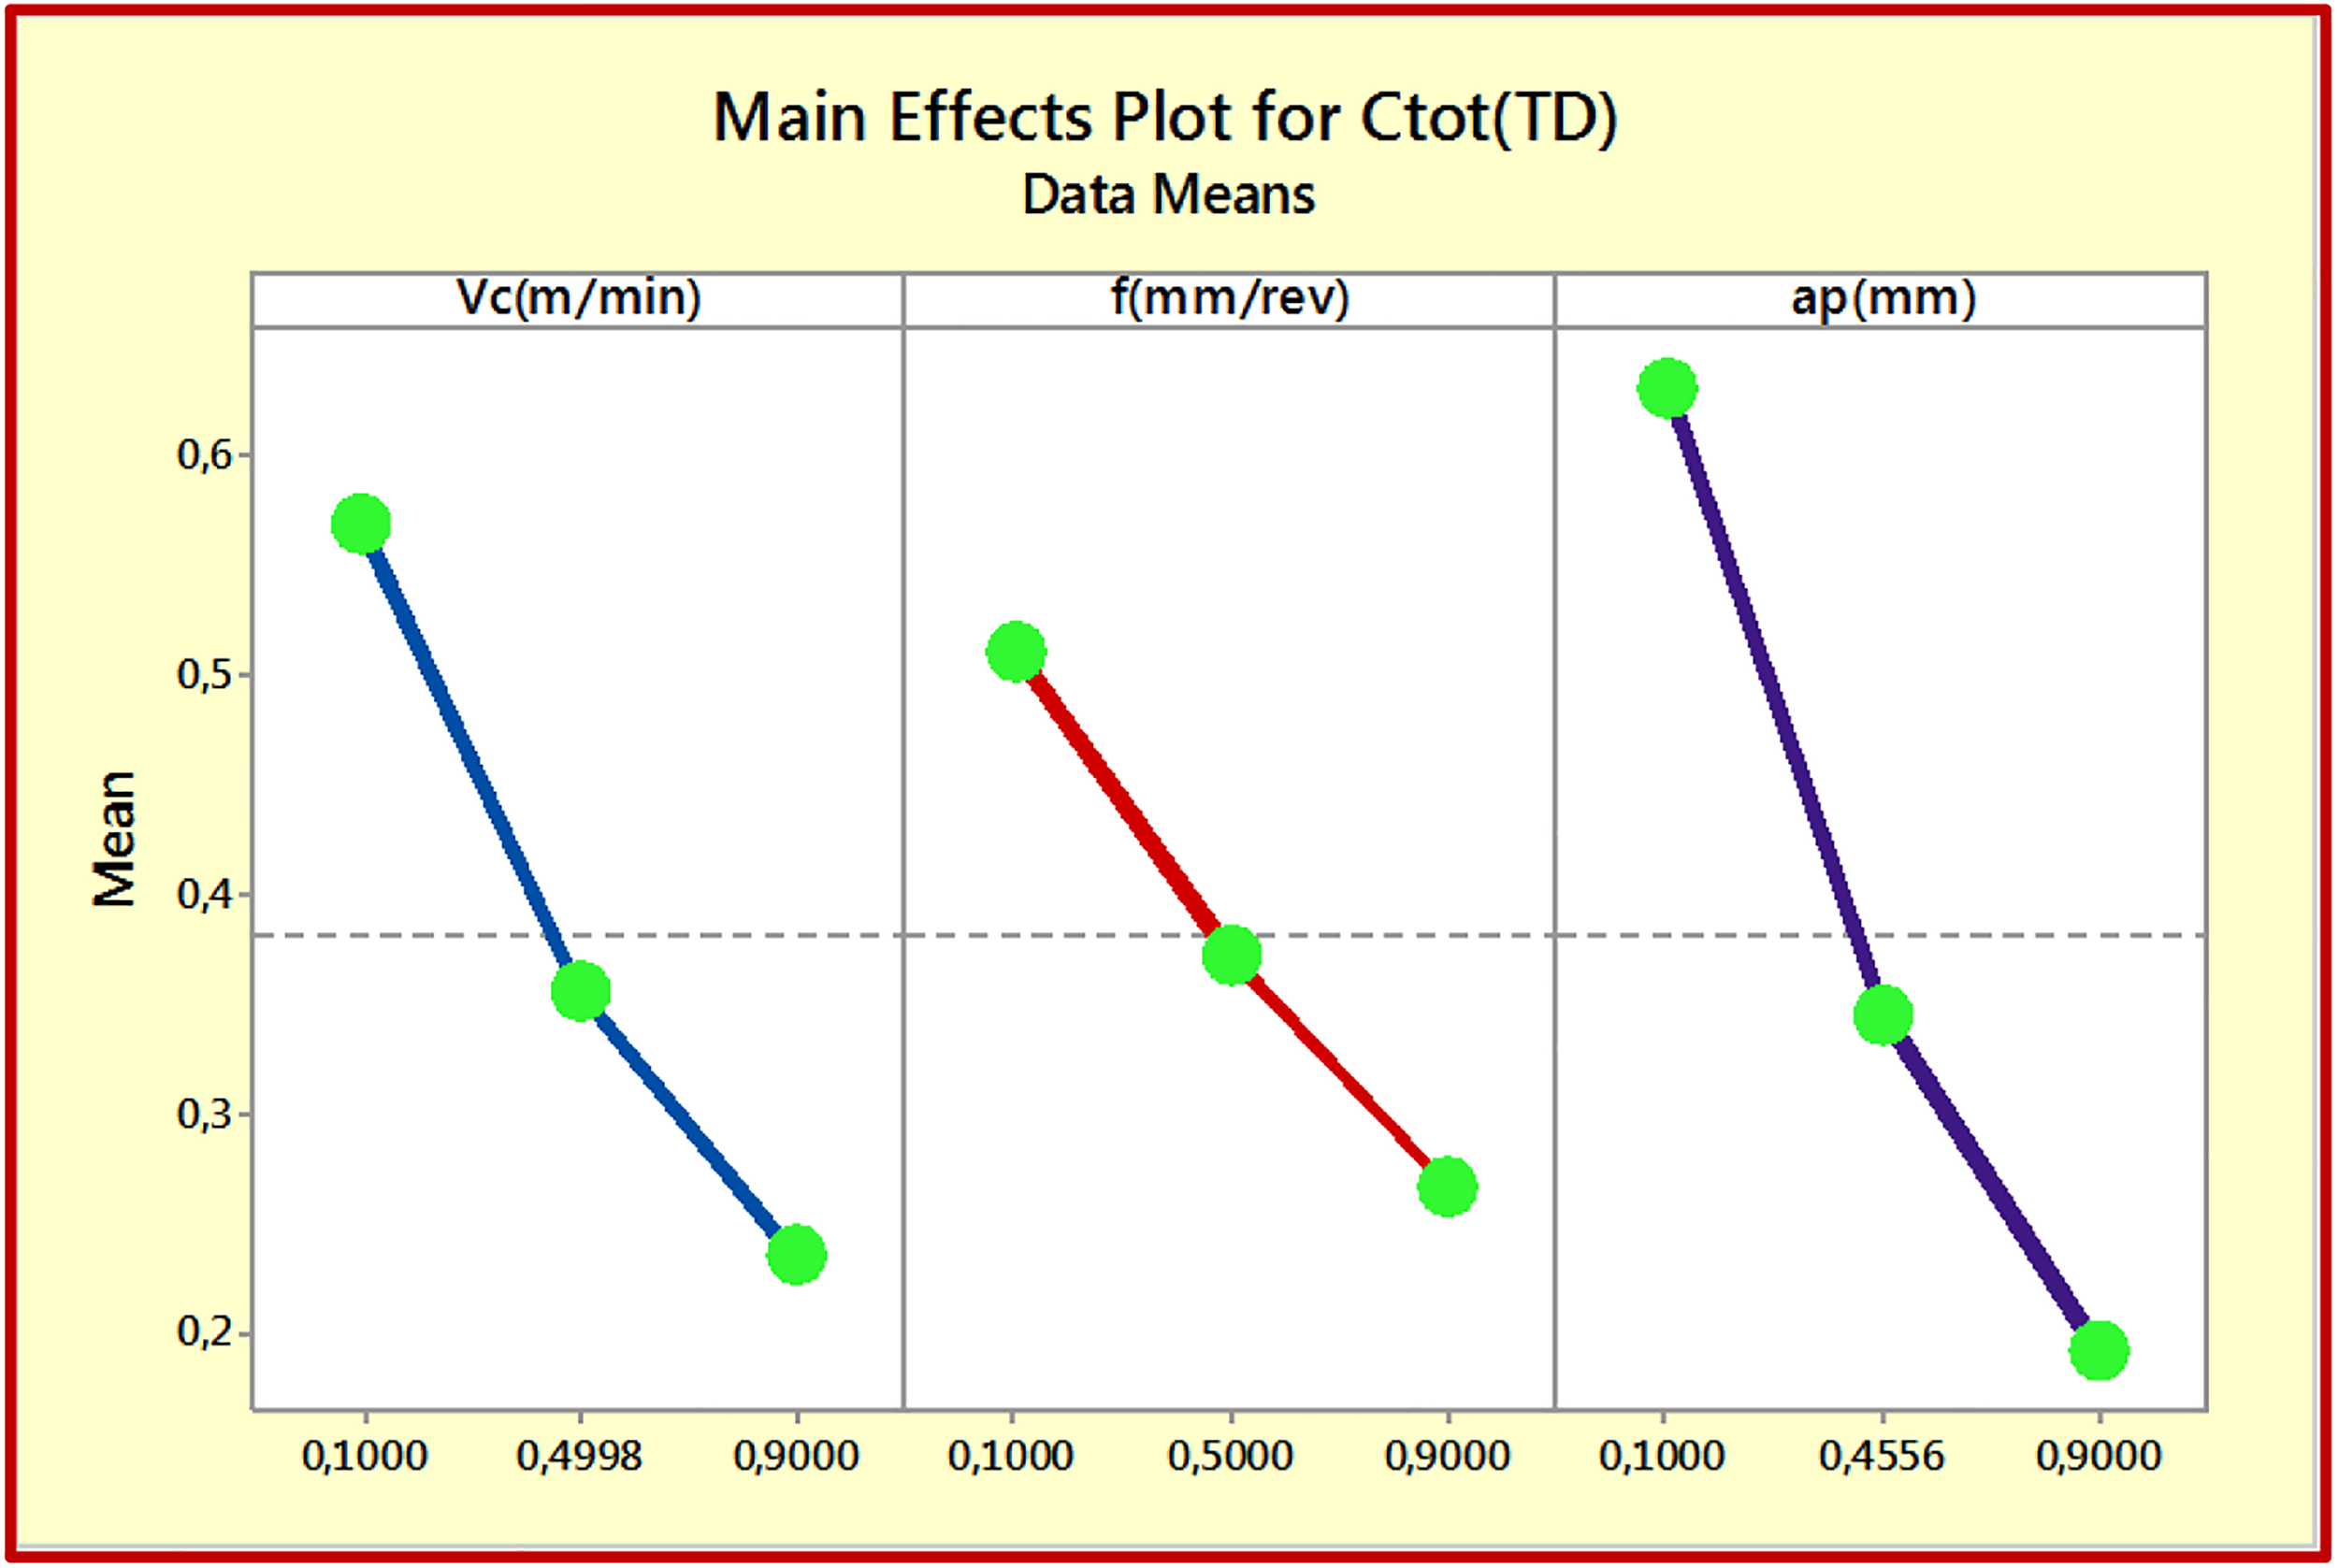
Main effects plot for Ctot.
Mathematical models of energy consumption and machining cost
The relationships between input parameters and performance measures, also known as outputs, are often evaluated using quadratic regressions. These models allow for a thorough representation of the complex relationships that can exist between different variables. Indeed, they offer a general, versatile form for modelling these relationships, which can be described mathematically by equation (13) (Abolghasemian et al., 2020; Hamza et al., 2022). This approach allows us to better understand the cross-influences of the different variables on the performance of the system under study and to better identify the key factors that influence this performance.
Mathematical models of energy consumption and cost as a function of cutting parameters are developed using Minitab 17.0. To ensure accurate results, the models are reduced by eliminating terms that do not have a significant effect on the responses (Bouacha et al., 2010).

Figures 7 and 8 present a detailed comparison between the measured values and the predicted values from the regression model for two responses. The results of this analysis conclusively demonstrate that the predicted values for each experimental combination are very similar to the measured values. This finding reinforces the idea that the regression model used is capable of capturing the underlying relationships between the independent variables and the responses studied, Etot and Ctot. Indeed, the average percentage difference in the predicted data is remarkably small, with a difference of only 1.72% for Etot and 0.77% for Ctot. This small difference suggests that the regression model is very accurate in its predictions and can be used with confidence to predict the values of Etot and Ctot from the independent variables.
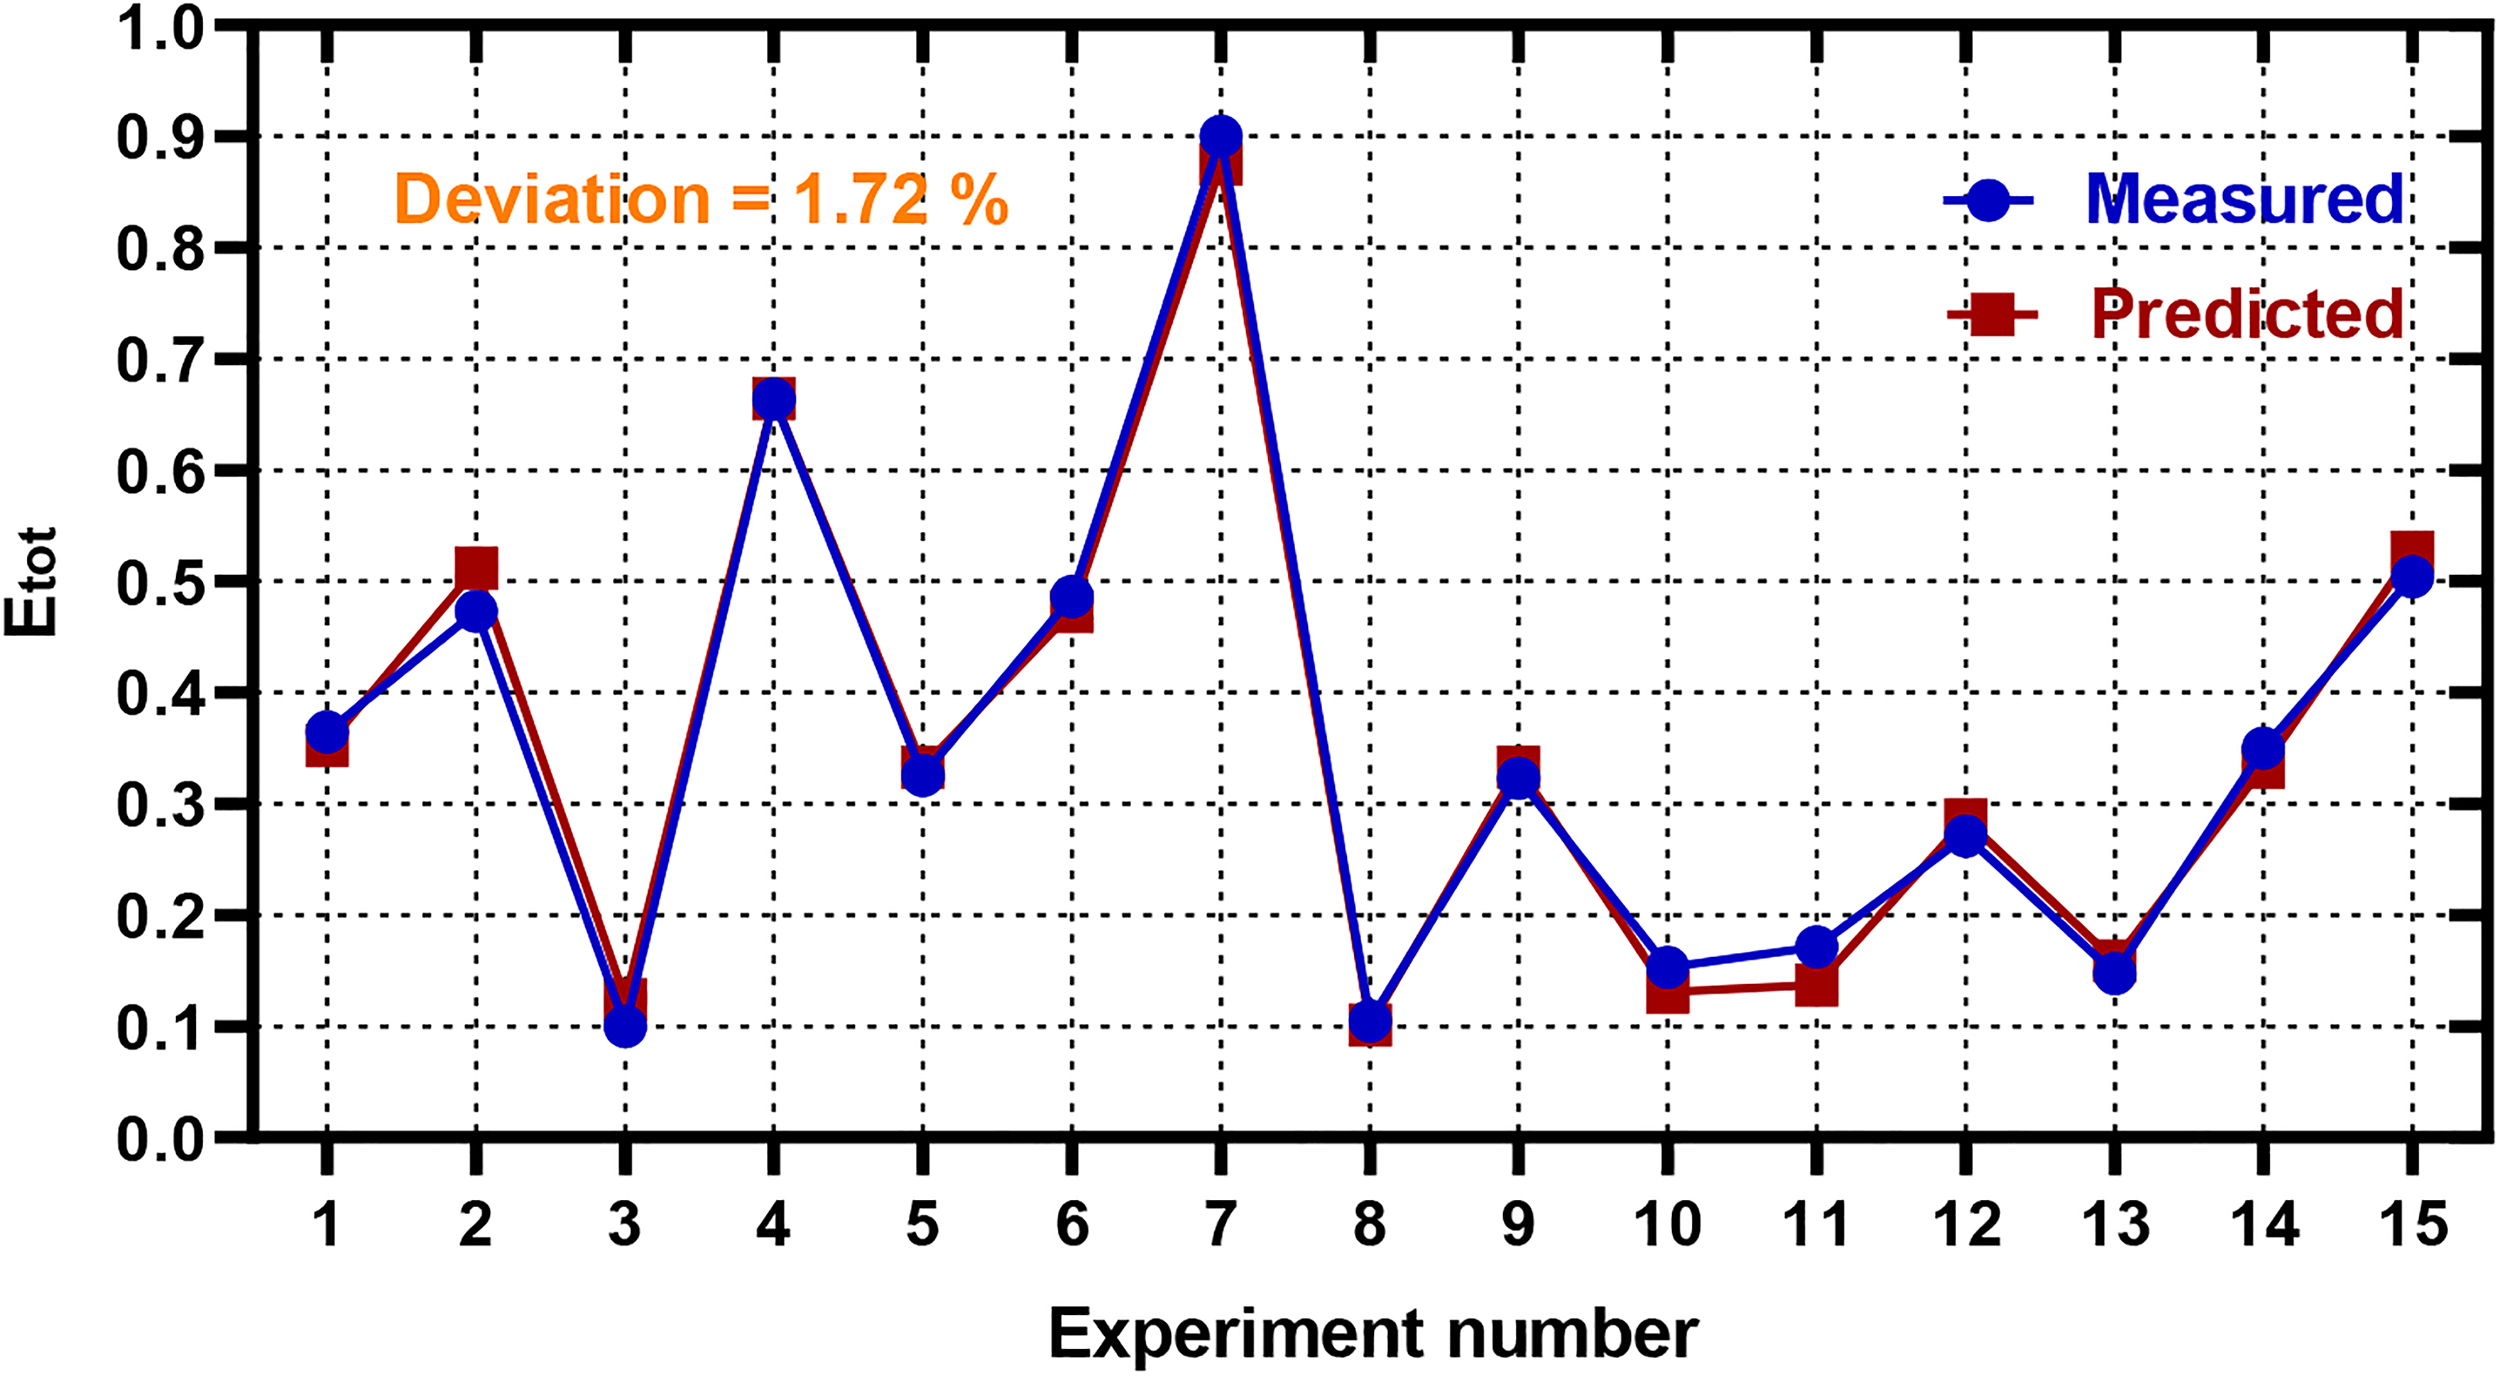
Comparisons of measured-predicted values for Etot.
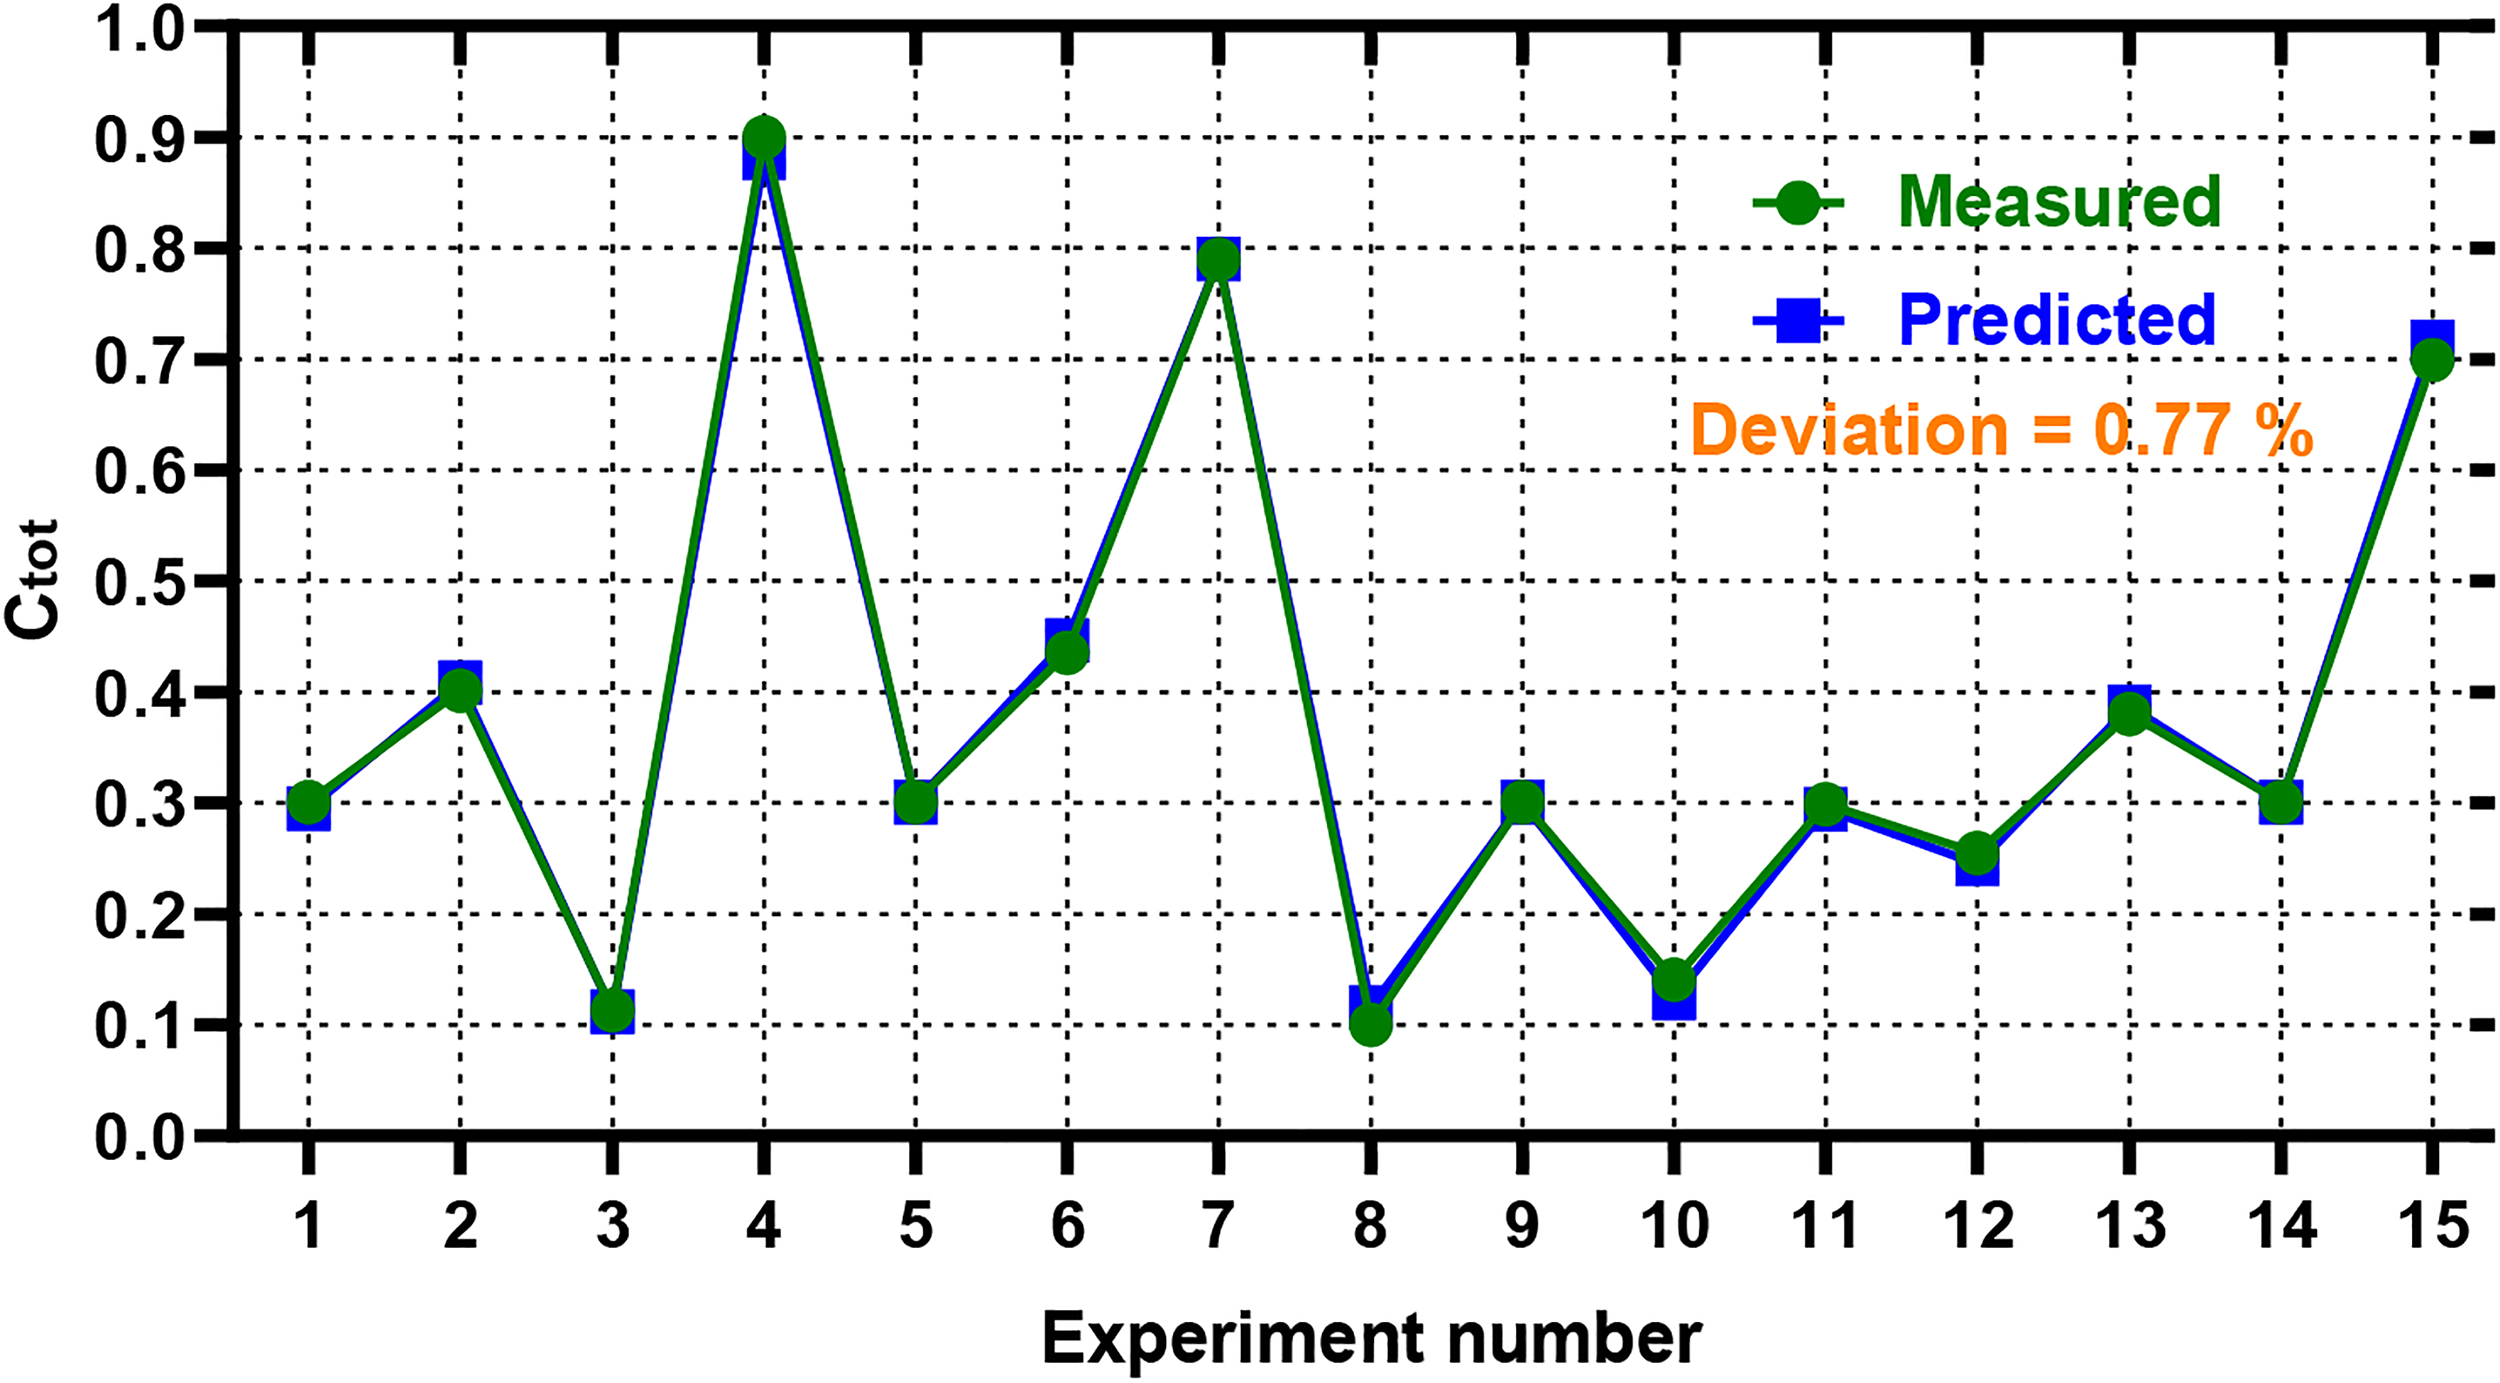
Comparisons of measured-predicted values for Ctot.
Prediction with PSO-ANN hybrid model
The success of an ANN depends on how well the fundamental parameters of the network (weights and bias) are optimized. However, conventional learning algorithms are often limited when it comes to solving complex problems (Bousnina et al., 2022; Rebouh et al., 2017). To overcome these limitations, a hybrid PSO-ANN model was developed to optimize the network architecture and minimize errors by determining the best values for weights and biases (Nguyen et al., 2020; Shariati et al., 2019). The model uses a PSO to represent a set of weights and biases in the neural network (NN). Figure 9 shows the flowchart of the developed model. First, the weights and biases are randomly initialized. Each particle (weight or bias) is represented by a position Xi in the search space. Then, at each generation, the positions and velocities are updated. The parameters “pbest“ and “gbest“ are corrected according to the performance parameter MSE, based on the network fitness function. Finally, the final positions of the particles will be determined by updating the velocity (equation (16)) and position (equation (17)) equations until the ideal weights and biases are attained.

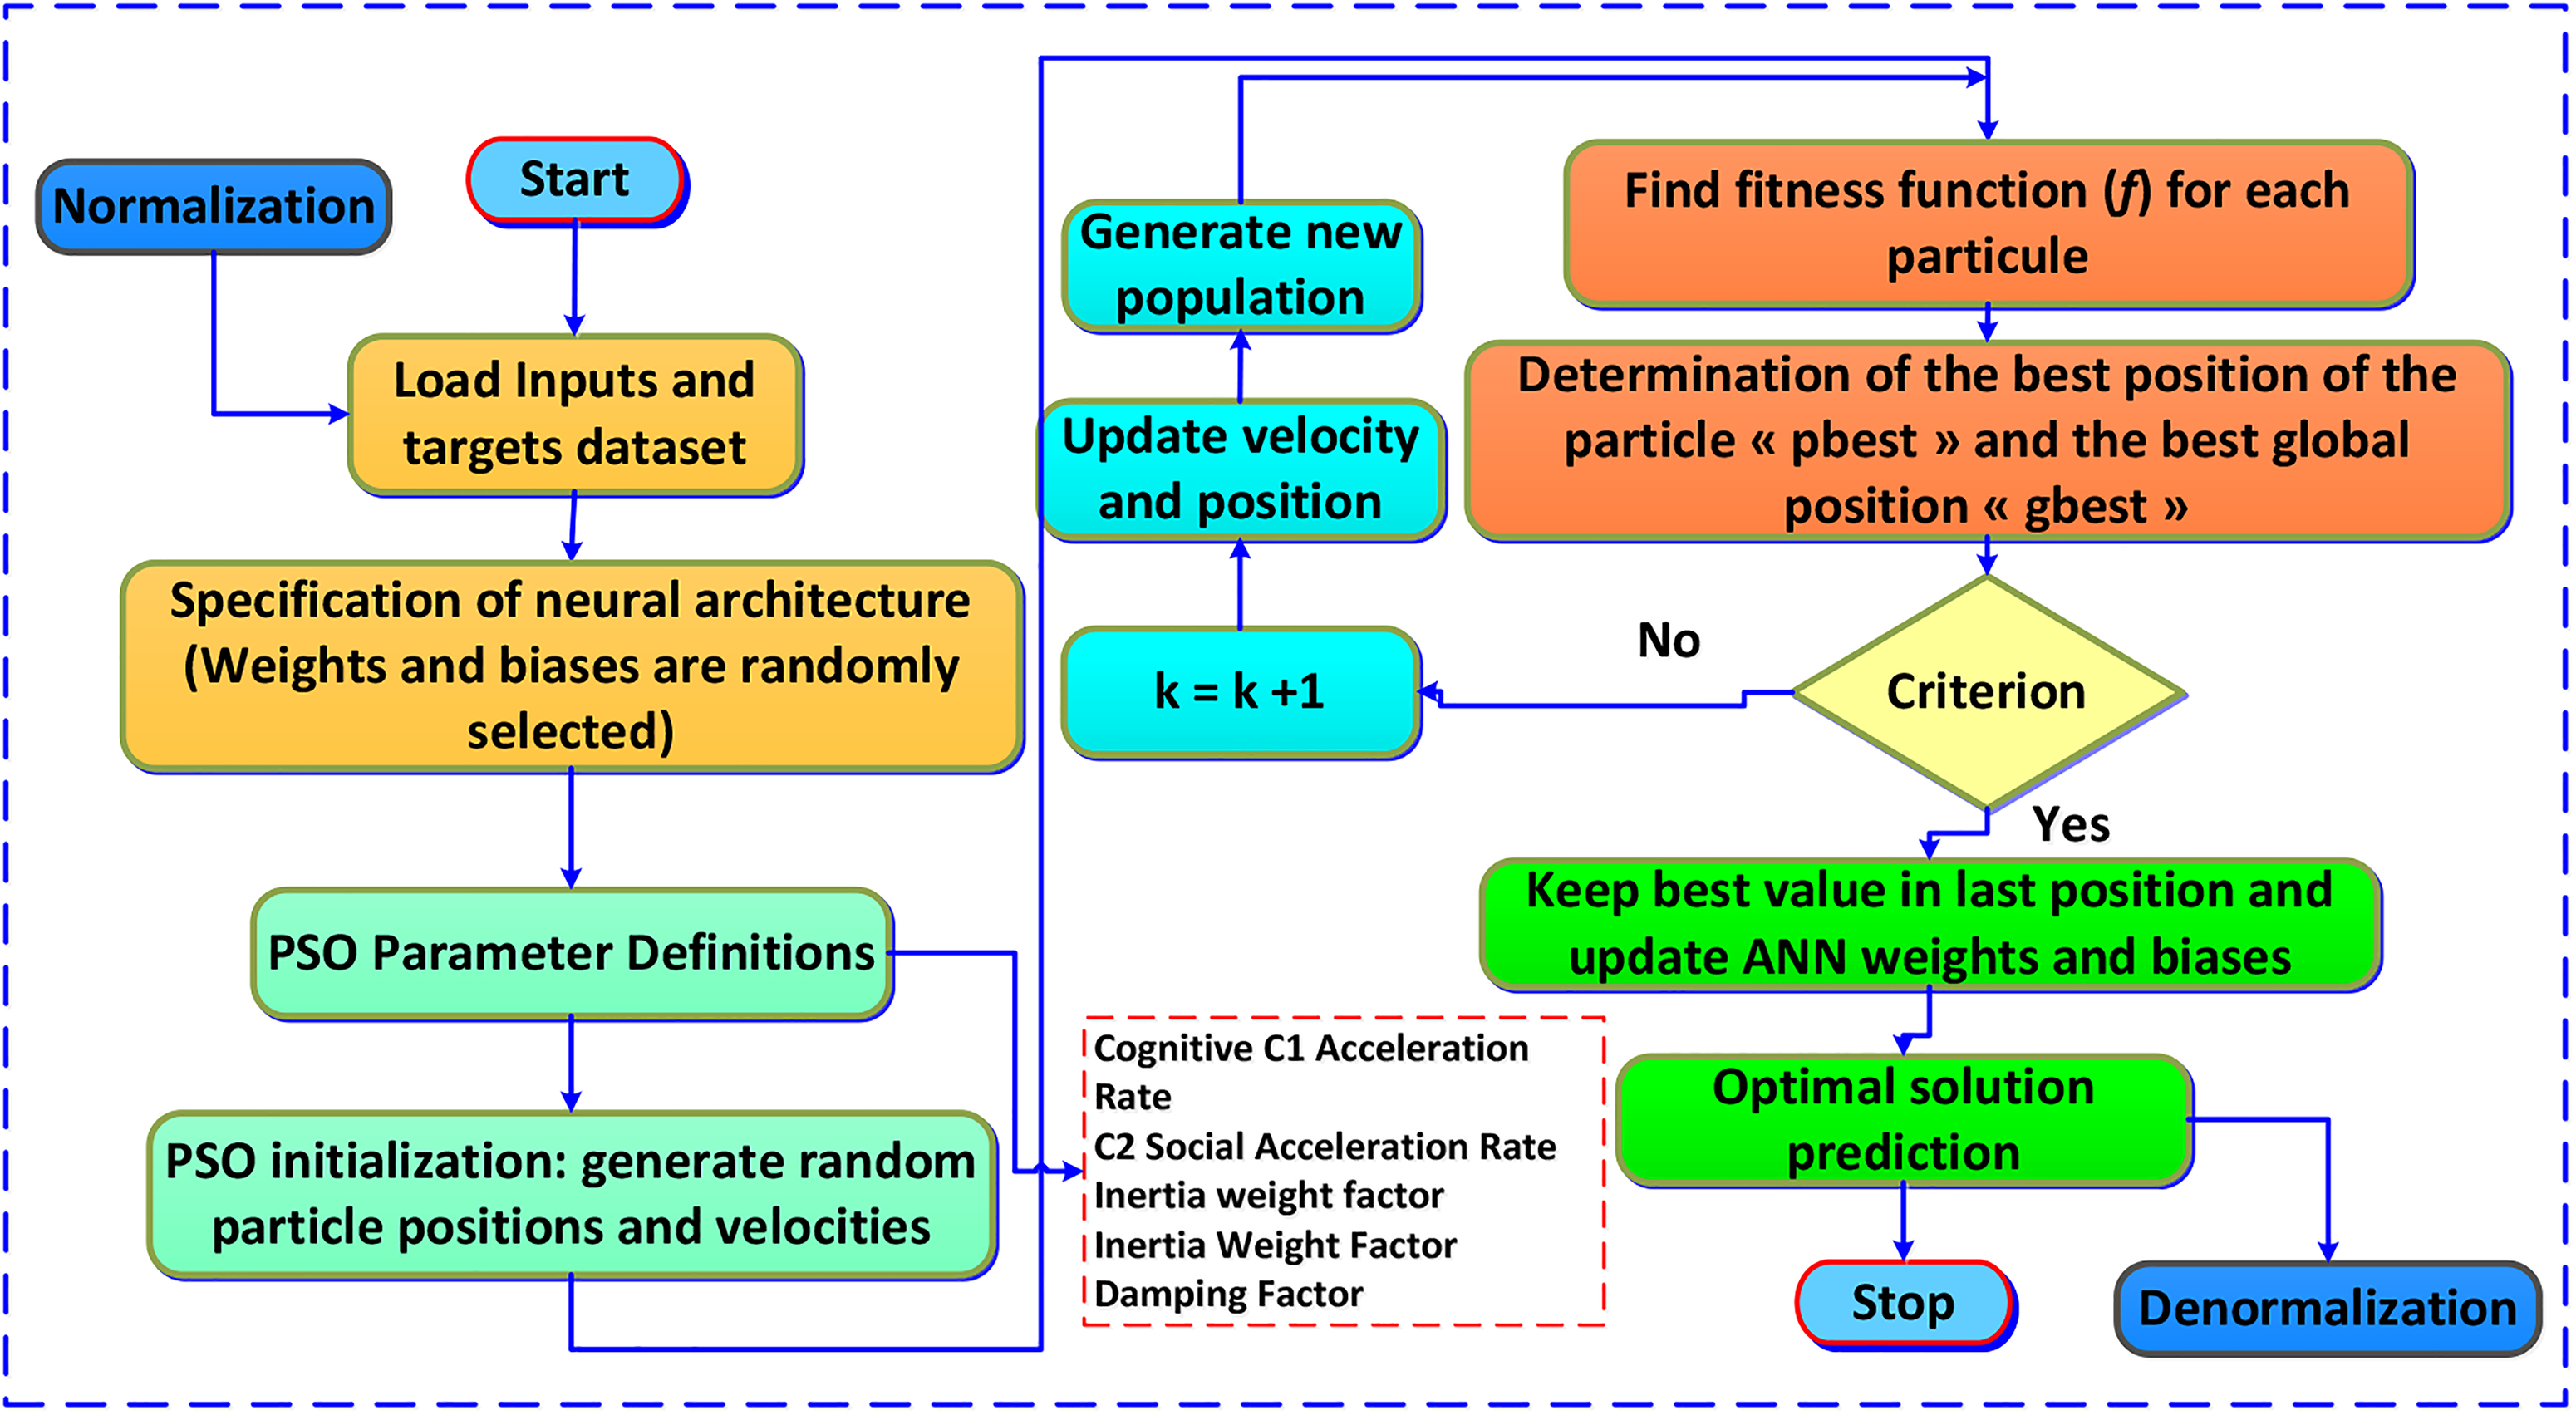
The flowchart of the developed model.
The position and velocity vectors are represented by X and
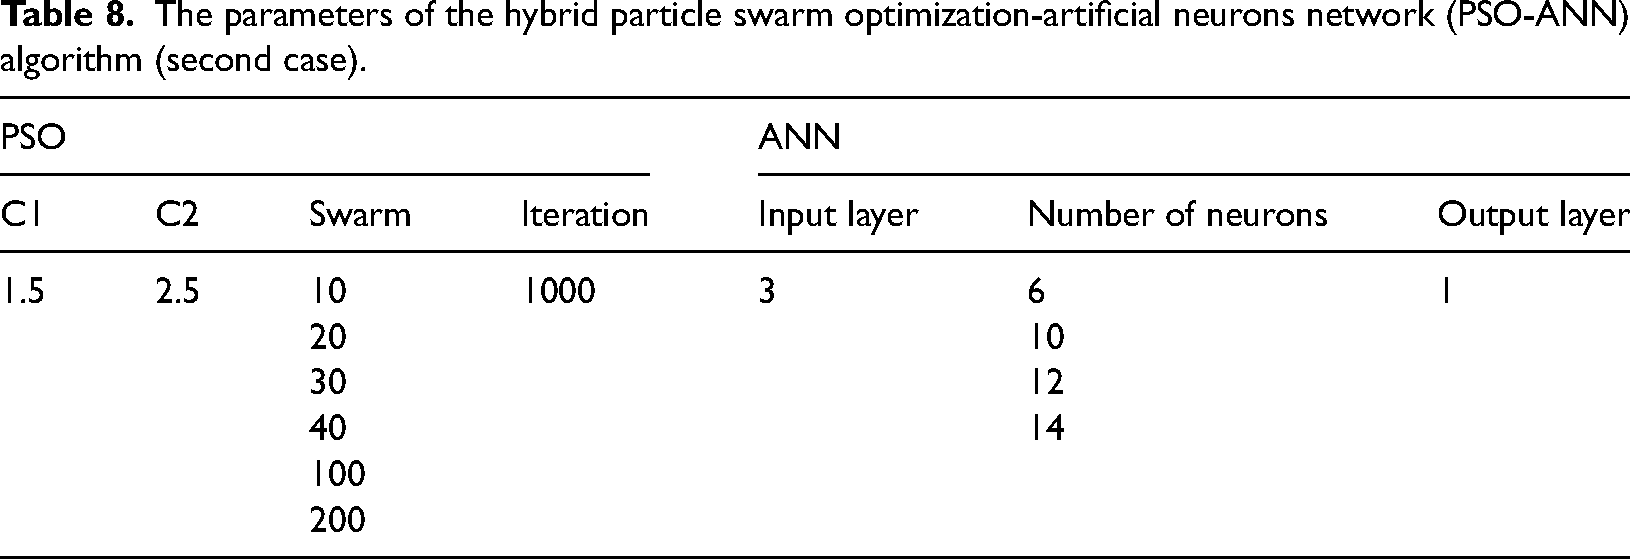
The parameters of the hybrid particle swarm optimization-artificial neurons network (PSO-ANN) algorithm (second case).
The optimal architectures of the particle swarm optimization-artificial neurons network (PSO-ANN) hybrid model (second case).
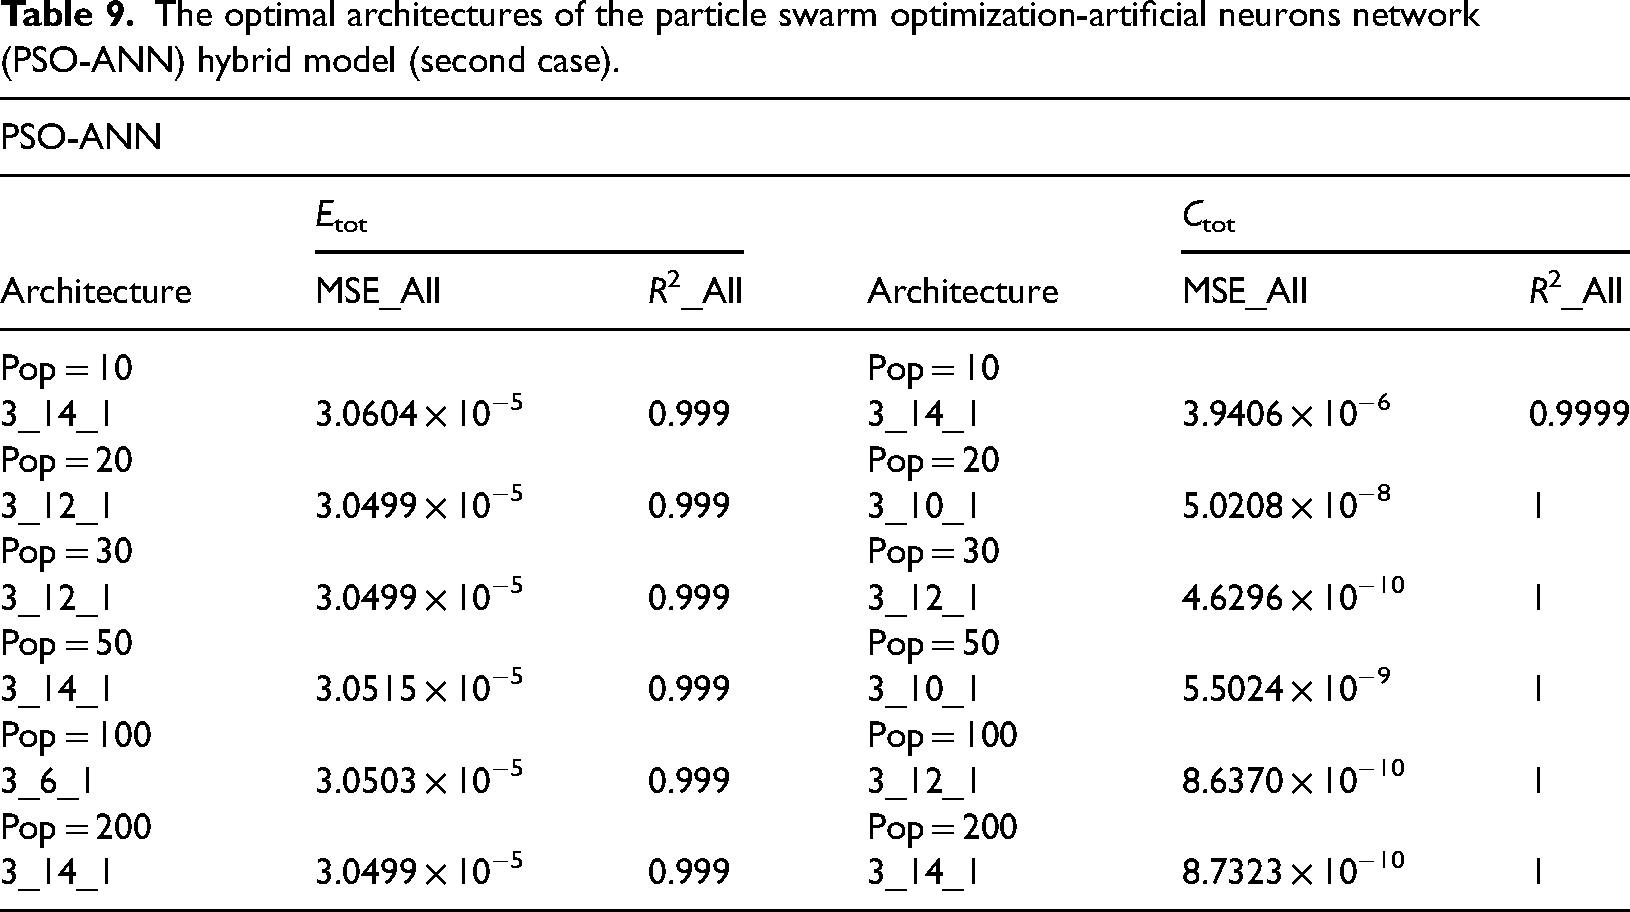
Based on the data presented in Table 8, the best neural configuration to achieve the best results for energy efficiency and machining cost is the one with a neural structure {3–12–1} and a population number of 30 (pop = 30). This configuration provides an MSE-All value of 3.0499 × 10⁻⁵ for Etot and an R2_All correlation coefficient of 0.999, indicating a close correlation between the results predicted by the model and the experimental data. For a cost, the MSE_All and R2_All factors are 4.6296 × 10⁻¹⁰ and 1, respectively, demonstrating high model accuracy for cost predictions. These results suggest that the {3–12–1} neural configuration with a population of 30 is an optimal option for achieving both energy savings and reduced costs in the machining process.
The results obtained thus suggest that the hybrid PSO-ANN model is a reliable and promising method for multi-criteria predictions, which may have significant implications for various industrial applications. Moreover, these results are in agreement with previous work by Ramesh et al. (2022) and Chakali et al. (2021), confirming the validity and reliability of the hybrid PSO-ANN approach for multi-criteria predictions.
Figure 10 shows the variation of the cost MSE with the {3–12–1} structure for the different population levels. The analysis of this figure indicates that for the largest population values (100 and 200), the MSE error decreases rapidly from the first 100 iterations. In contrast, for the smallest population values (10 and 20), the MSE reaches the values of 100 and 200 after a larger number of iterations, that is, 360 iterations for a population of 20 and 515 iterations for a population of 10. This conclusion is supported by a study conducted by Le et al., (2019). Their results showed that increasing the number of populations leads to a rapid decrease in the root MSE over iterations, compared to lower populations. This observation is important because it shows that population size is a crucial factor in the performance of the hybrid PSO-ANN model for the prediction of the machining cost. Indeed, the use of large populations allows for fast convergence of the model, while small populations require more iteration to achieve comparable performance. The graphical representation shown in Figure 11 provides a visualization of how the predicted values obtained using the PSO-ANN algorithm vary with the experimental values of the output responses Etot and Ctot. The results obtained indicate that a satisfactory correlation is observed for all output responses and that the line of linearity crosses most points, highlighting the suitability of the method used to predict the values of these responses. The use of the PSO-ANN algorithm gave acceptable prediction performance with several output responses in different domains. For example, in the work of Shariati et al., (2019), their objective was to predict the behavior of channel connectors embedded in normal, high-strength concrete. In addition, the work of Balonji et al., (2023) examines in depth the prediction of surface quality when milling aluminum (Al6061). In sum, these encouraging results suggest that the PSO-ANN algorithm may be a promising method for predicting output responses in this context.
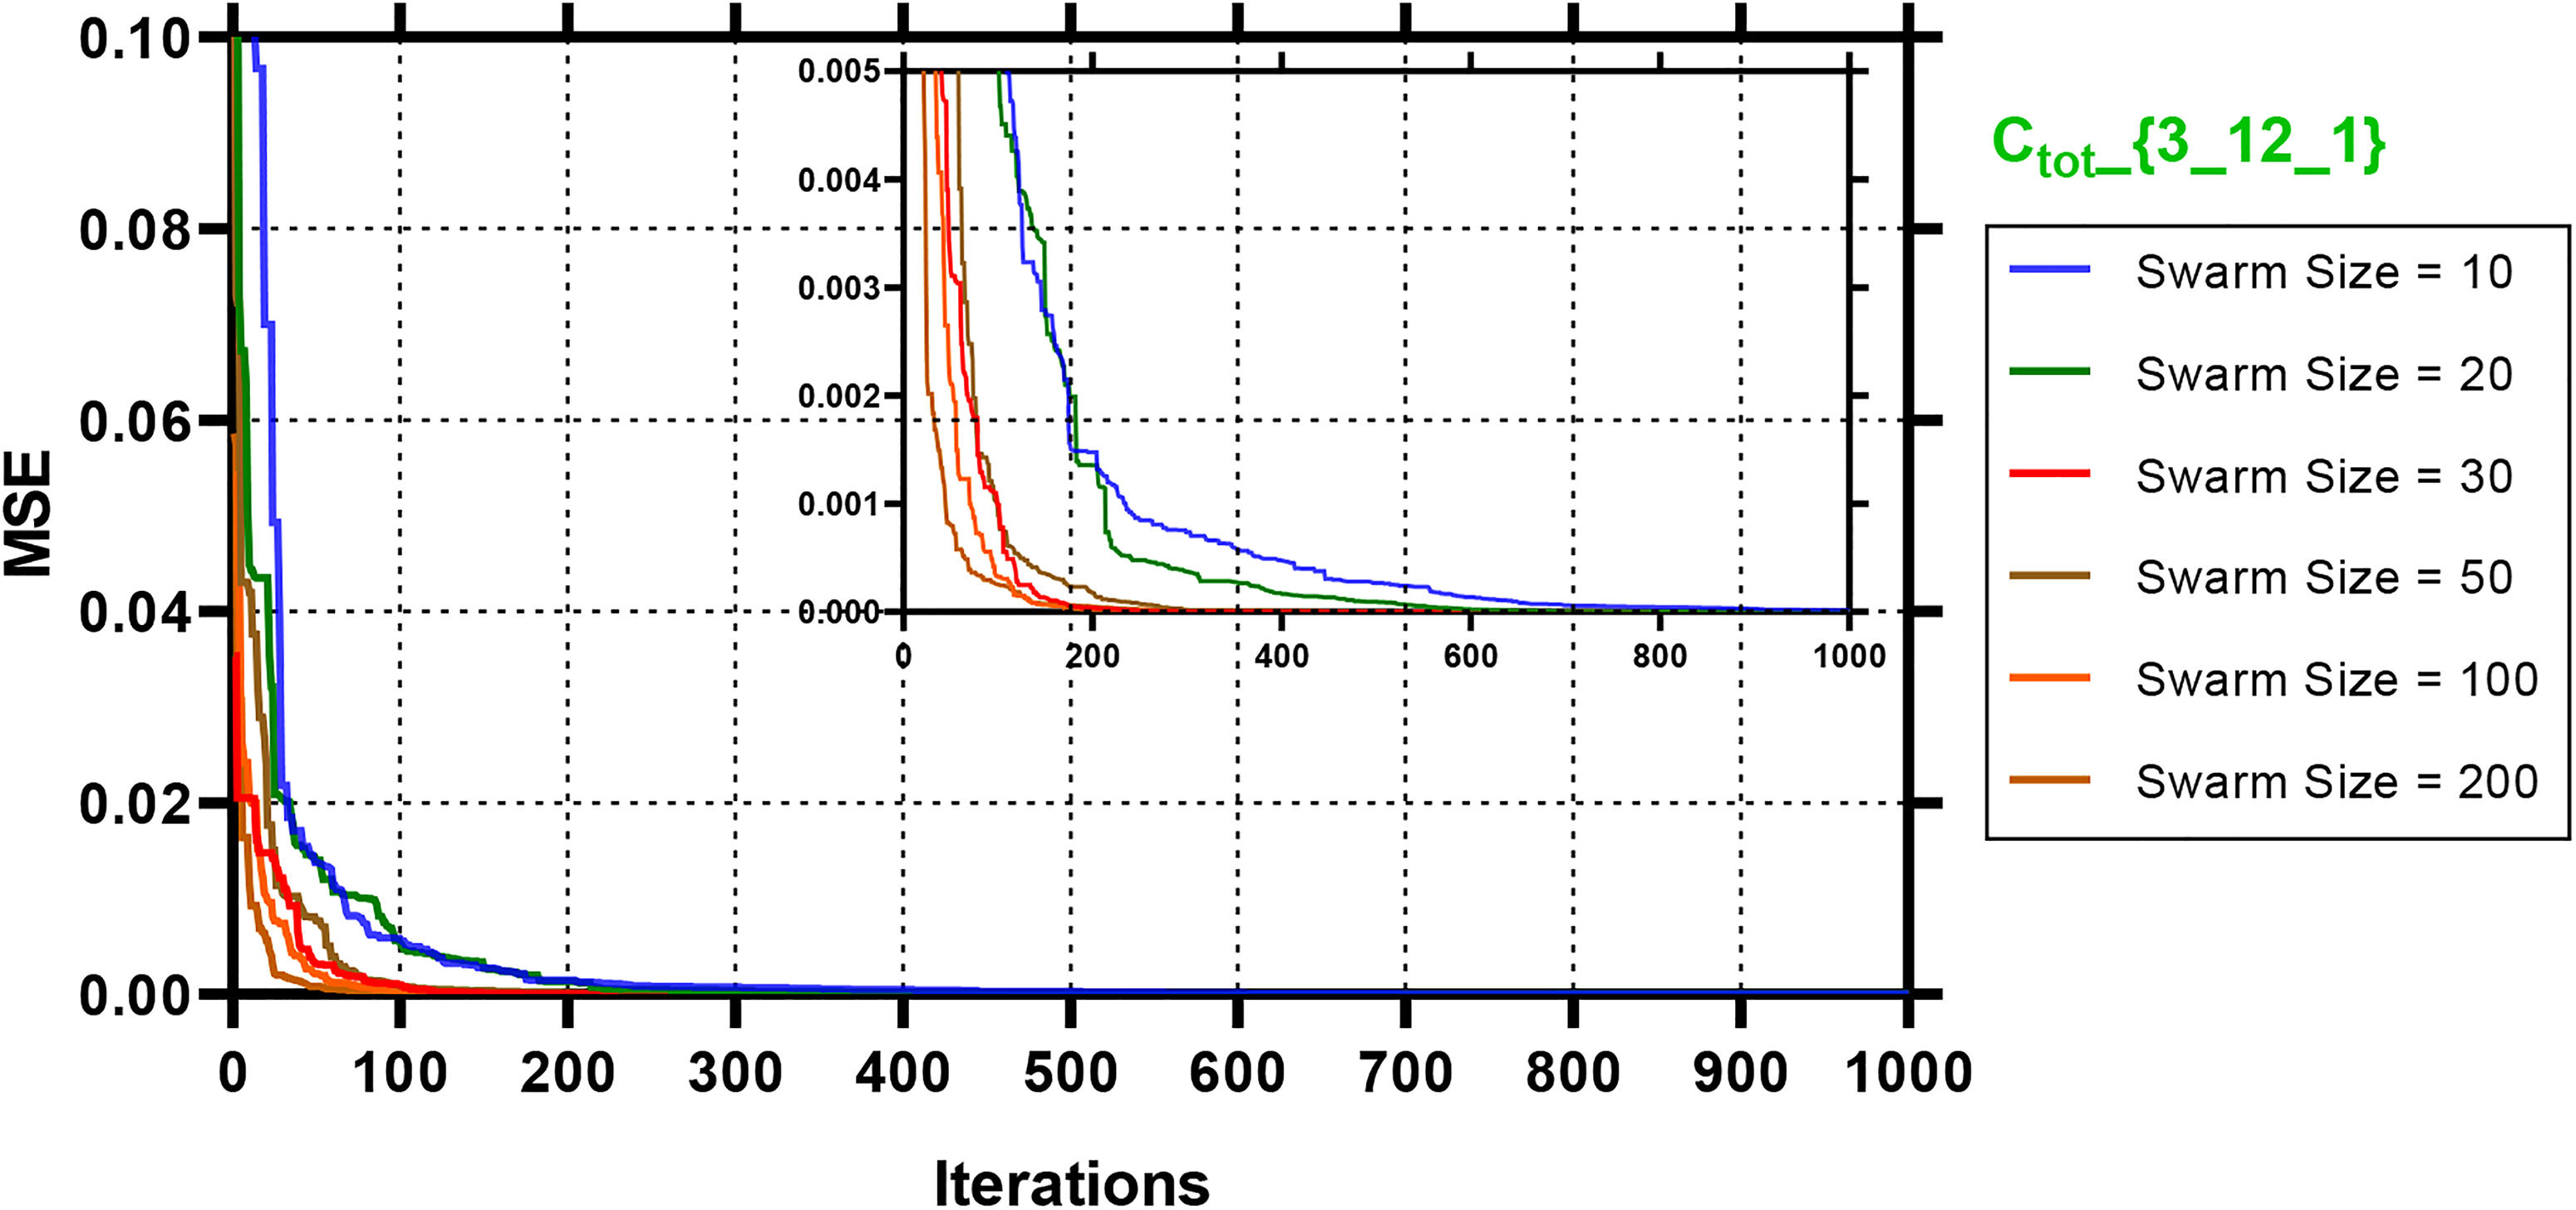
Variation of the mean square error (MSE) according to the number of iterations with the different populations. Ctot {3–12–1}.
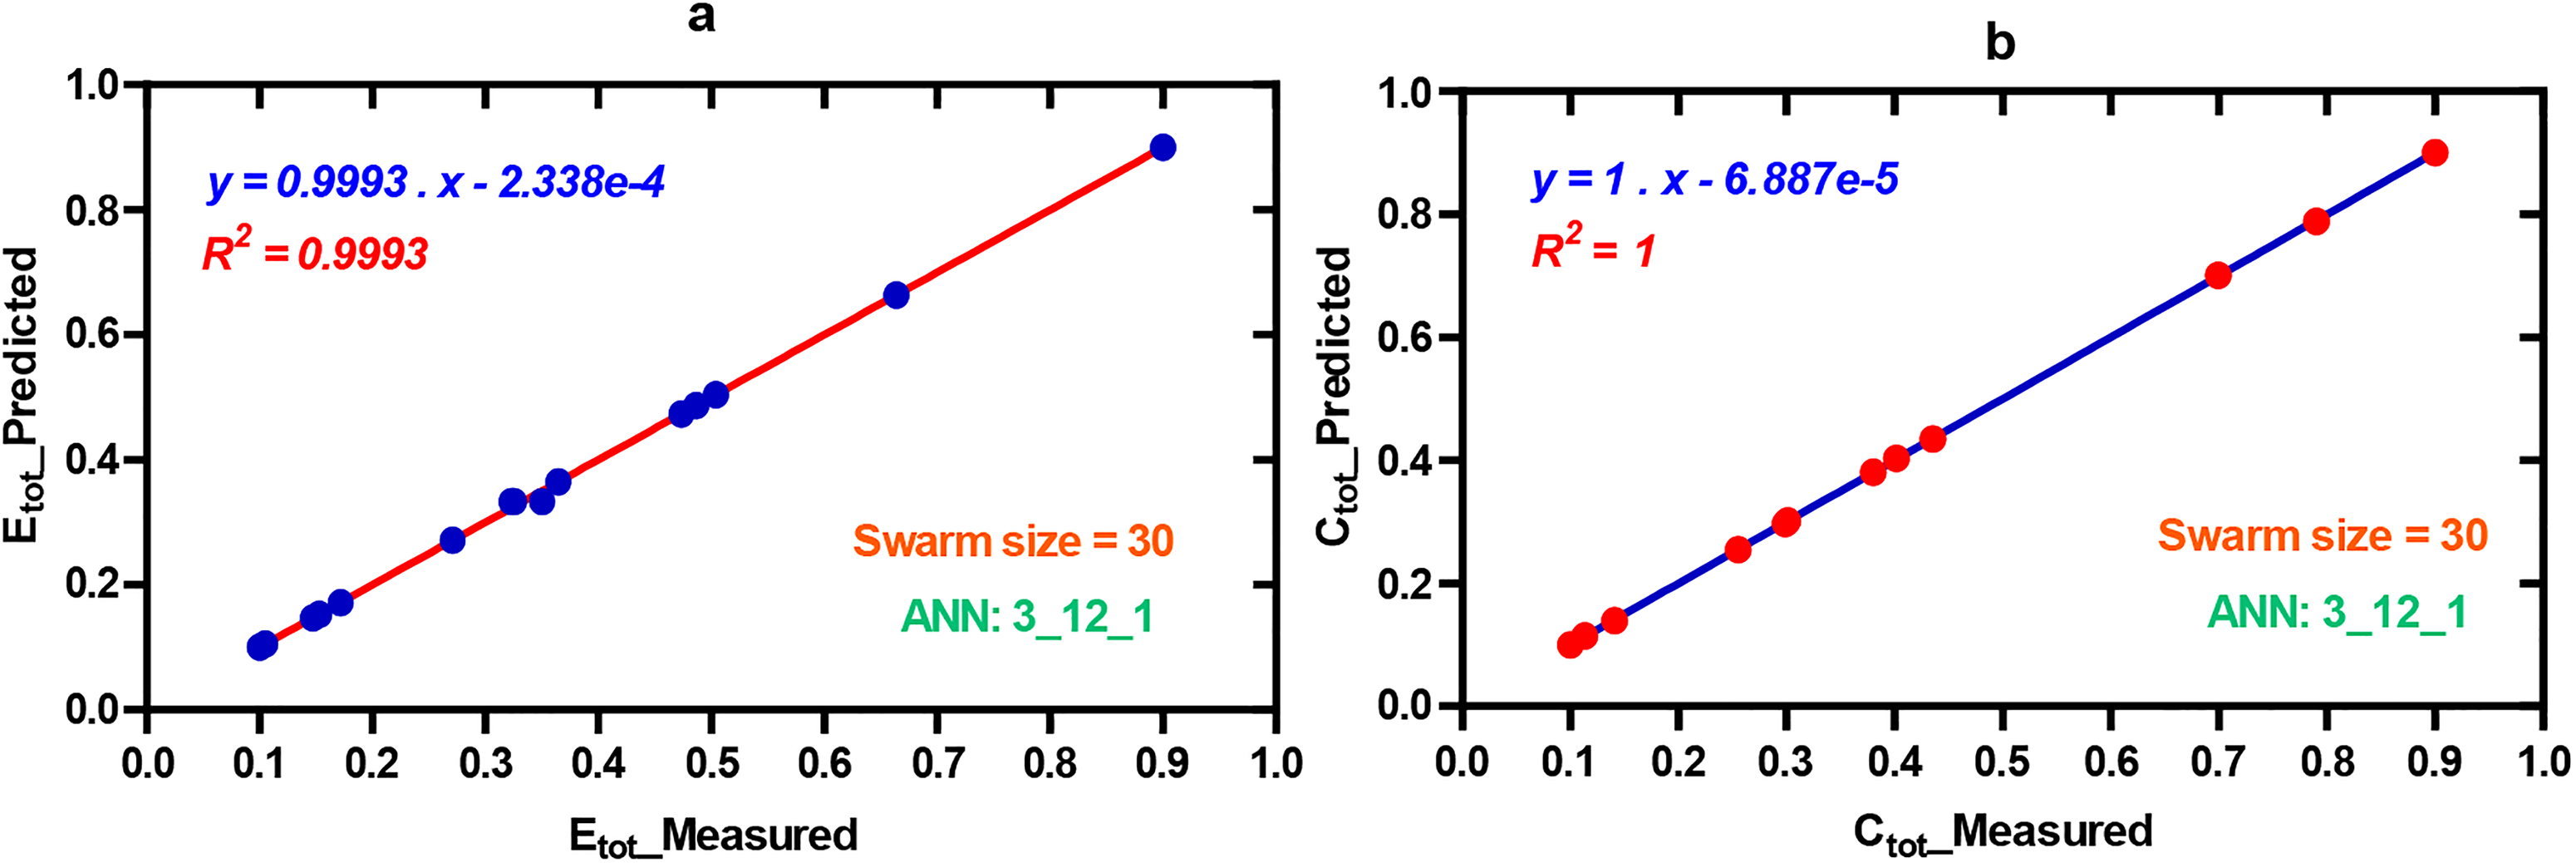
Experimental values versus predicted values (particle swarm optimization-artificial neurons network (PSO-ANN) model): (a) Etot and (b) Ctot.
Comparative study between PSO-ANN and RSM
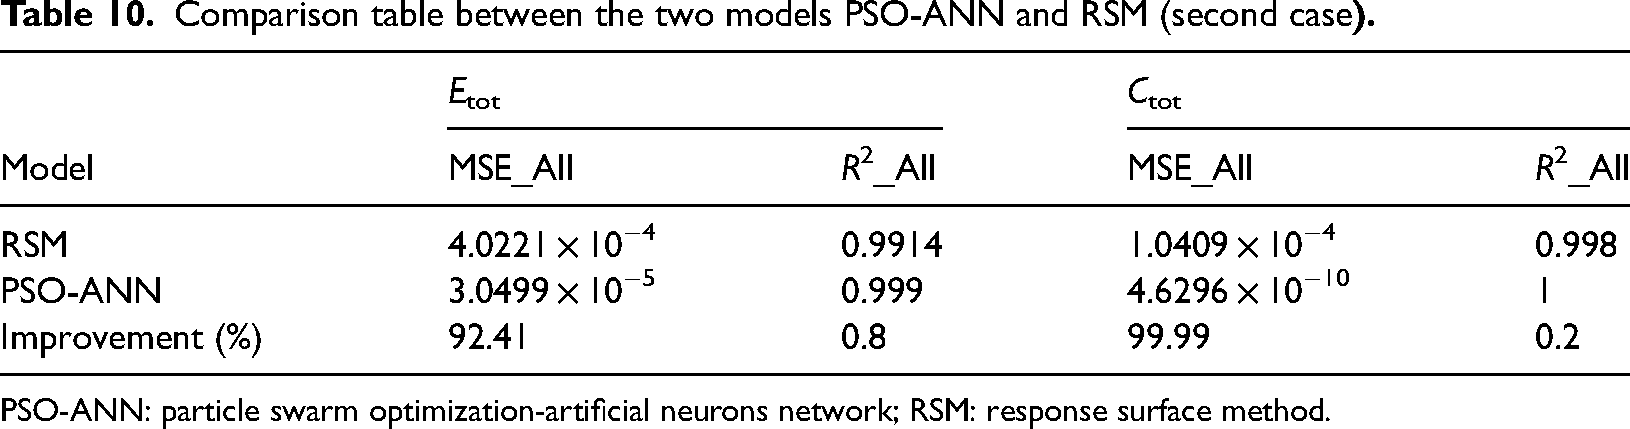
To evaluate the effectiveness of two different models, PSO-ANN and RSM, a comparative study was conducted, and the results are compiled in Table 10. This comparison is based on the mean square errors (MSE_All) for the different output variables of the two models studied. The results show that both models have a satisfactory R2 correlation coefficient for all output variables, although the PSO-ANN model is slightly higher than the other for all responses. In addition, the PSO-ANN model performed better than the RSM model in terms of MSE; this was also confirmed by Abd-Elwahed, (2022). Specifically, a significant improvement of 92.41% and 99.99% was observed for the Etot and Ctot output responses, respectively, compared to the results obtained with the RSM model. This improvement underscores the effectiveness of integrating the PSO algorithm into the ANN and confirms that this approach is superior to the RSM for predicting output responses in this context.
Comparison table between the two models PSO-ANN and RSM (second case
PSO-ANN: particle swarm optimization-artificial neurons network; RSM: response surface method.
Conclusion
The increase in the global population is leading to a growing demand for products, which results in considerable energy consumption in industries. An approach combining the hybrid PSO-ANN model and RSM was used to evaluate the trade-offs between manufacturing costs and energy consumption (CEnergy). Two in-depth case studies were conducted to understand the effects of parameters on multi-criteria responses. The results showed that machining strategies and sequence planning have a significant influence on energy consumption and machining costs. The study revealed that it was possible to reduce energy consumption by up to 99.25% by adjusting machining strategies and sequences. Furthermore, the PSO-ANN model produced good results in terms of MSE. Compared to the RSM model, the MSE values of Etot and Ctot with the PSO-ANN algorithm are improved by 92.41% and 99.99%, respectively. Future studies are recommended to take into account other factors in multi-criteria responses, such as dimensional error, temperature, and vibration. In addition, it would be beneficial to extend the application of prediction and optimization using metaheuristic algorithms combined with NNs, which could make a positive contribution to achieving the desired performance.
Footnotes
Declaration of conflicting interests
The author(s) declared no potential conflicts of interest with respect to the research, authorship, and/or publication of this article.
Funding
The author(s) received no financial support for the research, authorship, and/or publication of this article.