
Abstract
The methane adsorption at room temperature in the interlayer of the kaolinite–methanol complex (Kln–Me) with different methanol content is investigated with grand canonical Monte Carlo (GCMC) simulation. The mechanism and structure of methanol intercalated kaolinite (Kln) is proposed, and the effect of methanol on methane adsorption by Kln–Me is discussed. The results indicate that the methanol adsorption in the Kln interlayer is mostly physical with non-bonded energy. The interlayer spacing (d) of Kln–Me optimized by the DREIDING force field is in good agreement with the experimental data measured with X-ray diffraction. The configuration, adsorption properties, and adsorption isotherms are obtained for eight Kln–Me systems with different number (2–20) of methanol molecules in interlayer space. By comparing methane adsorption in the Kln–Me interlayer with different number of methanol molecules, we discover the complex interplay of factors influencing methane adsorption in the Kln–Me interlayer, especially the number of methanol molecules and free volume. It is found that the adsorption capacity of Kln can be enhanced by inserting methanol molecules into its interlayer. This analysis also underscores the GCMC simulation as a viable tool to calculate kaolinite/organic intercalation composites for potential applications.
Introduction
Clays play an important role in the adsorbing performance of unconventional reservoirs (Aringhieri, 2004; Du et al., 2019; Li et al., 2019; Ross and Bustin, 2009; Yue et al., 2019). They are also geological adsorbents to influence the migration and sequestration of environmental pollutants (Bhattacharyya and Gupta, 2007; Cygan et al., 2012; Suraj et al., 1998; Vasconcelos and Bunker, 2007). Shale gas, extracted from underground shale formations, has had a profound impact on global energy sources and carries significant implications for a low-carbon economy. It primarily consists of methane and exists in three distinct states within subsurface shale formations: adsorbed, free, and dissolved phases. In shale reservoirs, methane is predominantly adsorbed onto organic matter and the surface of inorganic matter, such as clay minerals. Kaolinite (Kln) is one of the main clay minerals in nature. It is a layered silicate mineral at the ratio of 1:1, with one tetrahedral sheet of silica (SiO4) linked through oxygen atoms to one octahedral sheet of alumina (AlO6) octahedra. There is no cation or water molecule between layers, while the strong hydrogen bonds strengthen the connection between the structural layers (Balan et al., 2010; Cao et al., 2021). As a potential adsorption material with high specific surface area and porosity (Bhattacharyya and Gupta, 2008; Wang and Cheng, 2023; Wang et al., 2021, 2022), Kln has been modified to improve the adsorption capacity and selectivity, one of which is the gas separation of carbon dioxide and methane. Based on the layered structure of Kln, appropriate organic molecules were inserted in interlayers to form the intercalation complexes (Cheng et al., 2015a), which maintain the original crystal structure and the unique adsorbability of clay minerals. The adsorbing properties of intercalation complexes have attracted wide interest, with most attention paid to montmorillonite as the carrier (Dahe et al., 2006; Deliang et al., 2019; Huang et al., 2020; Nesic et al., 2012). In addition, methane adsorption by porous adsorbents is important for the transportation of natural gas as well as the search for promising adsorbents for vehicular applications. However, there are few studies on methane adsorption by intercalation complexes of clay minerals. Thus, in this report, we will evaluate the feasibility of this type of material for gas storage/molecular sieve.
At present, the study on methane adsorption by clay minerals is mainly carried out with isothermal adsorption experiments, which could reveal macroscopic features and adsorption phenomena, but are limited in the explication of the microscopic process and adsorption mechanism. Recently, as a new analytical method, molecular simulation has attracted significant attention in the research on methane adsorption by clay minerals. Titiloye et al. applied the grand canonical Monte Carlo (GCMC) and molecular dynamics (MD) method to study the occurrence and migration mechanism of methane in hydrated Na-smectite clay (Titiloye and Skipper, 2000, 2001). Jin et al. studied the adsorption behavior of methane and carbon dioxide in the slit pores of montmorillonite with GCMC (Jin and Firoozabadi, 2013). The previous studies showed that GCMC simulation may serve as a generic tool for the investigation of fluid properties in clay minerals. Compared with experimental work, computer molecular simulation can control a certain factor without being subject to limitations on the experimental setup and budget (Cao et al., 2022). Moreover, the microscopic adsorption mechanism between porous materials and fluid molecules can be interpreted at the molecular scale with thermodynamic and dynamic information in the process of interaction. Molecular simulation results can be used for material engineering for desired properties.
Here, we present results for the methane adsorption in the interlayer of the kaolinite–methanol complex (Kln–Me). The influences of methanol content and pressure on the adsorbed methane are explained in terms of the microscopic phenomena revealed by GCMC and MD simulations.
Simulation details
Molecular model
The Kln intercalation complex model is based on the Kln unit cell structure [Al2Si2O5(OH)4], and the positions of the atoms in this unit cell are obtained from Young et al. (Young and Hewat, 1988). The space group belongs to 1P/1 and the unit cell parameters are: a = 0.515 nm, b = 0.893 nm, c = 0.738 nm, α = 91.93°, β = 105.04°, γ = 89.79°. The simulation box consists of eight unit cells of Kln (4a × 2b × 1c), with a vacuum space added to the z-direction of the supercell structure with dimensions of 20.6, 17.86, and 11.44 Å (which is also the initial interlayer spacing d) along the x, y, and z directions, respectively. The widespread use of X-ray diffraction (XRD) plays an important role in the analysis of Kln intercalation complexes (Cheng et al., 2012, 2016). Liu et al. applied dimethyl sulfoxide (DMSO)—of which the structure is characterized by XRD and Fourier transform infrared spectroscopy (FTIR)—as a precursor to prepare Kln–Me intercalation complex (Liu et al., 2014). The experimental results indicate that the intercalation agent DMSO was successfully inserted and the interlayer spacing of Kln increased from 7.18 to 11.44 Å. Accordingly, the Kln model with an interlayer spacing of 11.44 Å is used in our study as a compendial representation for the Kln-DMSO, as the substitution of methanol for DMSO is not easily realized in simulation. Although this model is relatively crude, it provides an idealized simple model that incorporates the physical characteristics of this study. A schematic diagram of the Kln-DMSO is shown in Figure 1. By using GCMC simulation at room temperature (298.15 K) under atmospheric pressures (101 KPa), the saturated methanol adsorption of the Kln supercell structure is found to be 20 (see the discussion below), when preloading methanol (CH3OH) molecules in the interlayer, the number of methanol molecules (sometimes referred to as methanol number below) is set to vary from 2 to 20 for the simulation. The proper model selection of the adsorption system provides a basis for understanding the adsorbing behavior. After the initial structure is built up, it is then optimized to get a reasonable distance between the Kln-Me interlayers in simulated conditions. The optimized structure obtained from geometry optimization is used as the initial structure of the isothermal adsorption of methane. The periodic boundary condition is imposed in all three spatial dimensions. In this simulation, Kln particles are considered rigid.
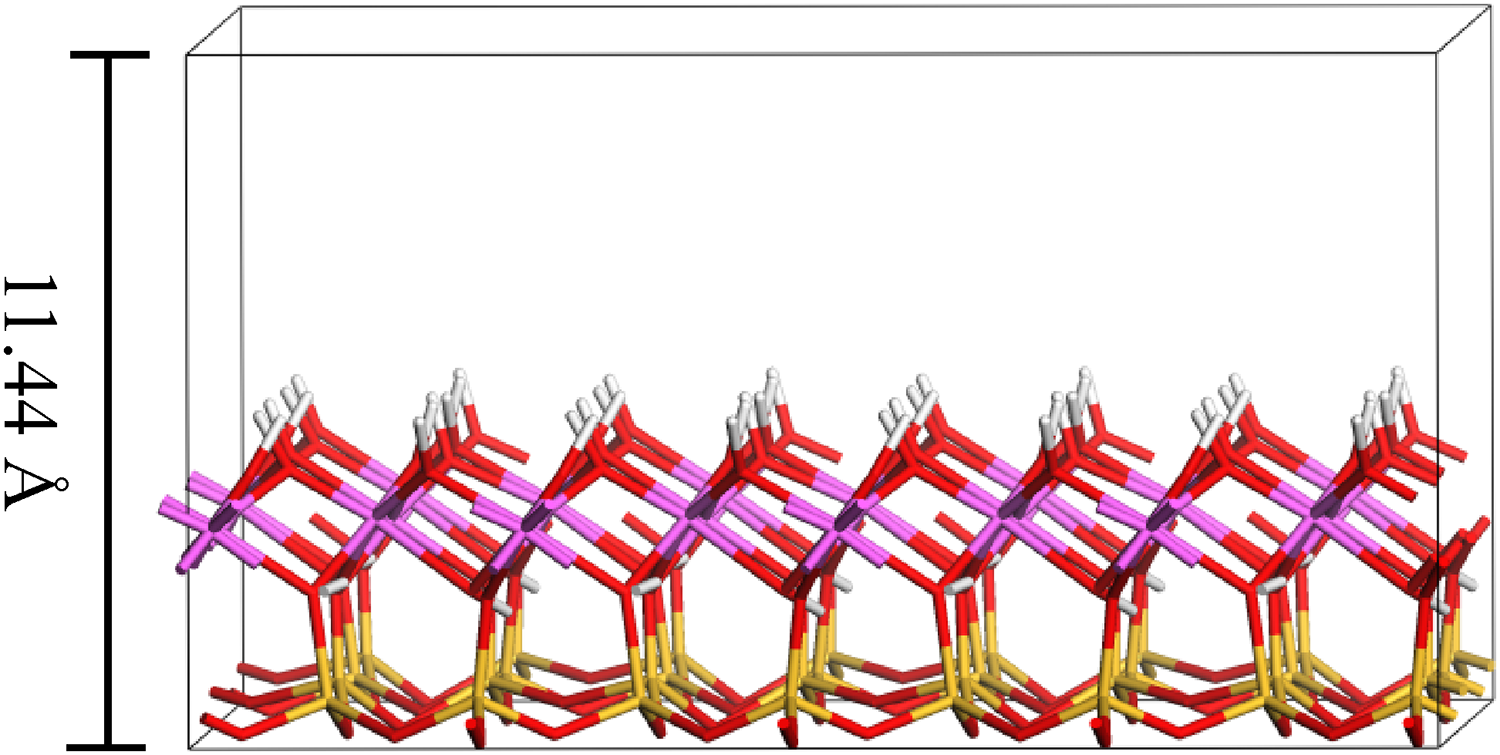
Schematic representation of the Kln–DMSO intercalation complex model with d(001) = 11.44 Å.
Potential model
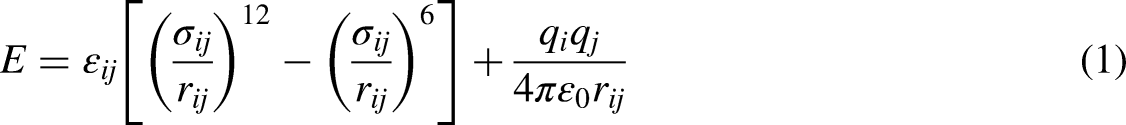
The adsorbate–adsorbent and adsorbate–adsorbate interactions in the simulation include Van der Waals (VDW) and electrostatic forces. In this work, as in the works of many researchers (Cygan et al., 2004; Kadoura et al., 2016), the potential energy model for the combined action of VDW and Coulomb force is described as

Simulation method
The force field defined to describe the adsorbate–adsorbent and adsorbate–adsorbate interactions determines the simulation effect directly. In the present study, we employ the Dreiding force field (Mayo et al., 1990), which represents well the organic small molecules, macromolecule, and main group element, to describe the interaction without any parameter fitting. We fix the number of methanol molecules within the Kln interlayer and the GCMC algorithm is employed to simulate the methane adsorption in the Kln–Me interlayer at room temperature (298.15 K) under pressures up to 10 MPa. The temperature, the chemical potential, and the pore volume are independent variables specified in advance. The chemical potential as a function of fugacity is given in the Redlich–Kwong equation of state (Soave, 1972). Before each GCMC simulation, the Dreiding force field is used to optimize the adsorbent and adsorbate model and the optimized structure is then used as the initial structure to study the adsorption effect of the host–guest molecules.
With Materials Studio 6.0 software, the Smart method in the Forcite module is used to optimize the adsorbent model and adsorbate molecule, while the isothermal methane adsorption is simulated in the Sorption module with Metropolis point-by-point computation method at constant temperature under fixed pressure. The cut-off radius is set to 9 Å for the LJ and electrostatic potentials. In addition, for every state, 3 × 10⁶ GCMC configurations are generated. The first 1.5 × 10⁶ configurations are discarded to guarantee the equilibration, whereas the rest 1.5 × 10⁶ configurations are adopted to average the desired thermodynamic properties. The pre-equilibrium configurations obtained from MC are then used as starting configurations in the MD simulations. The MD simulations are performed with 0.5 fs time step for up to 200 ps using an NVT ensemble. Interlayer molecular configurations are stored every 200 steps for later analysis.
Excess adsorption and absolute adsorption
The output of GCMC simulation is the absolute amount adsorbed (the total number of adsorbate molecules present in the adsorbent), whereas isothermal adsorption experiments yield the excess amount adsorbed (Wang et al., 2023). To make a direct comparison with the experimental data, the absolute amount adsorbed should be converted to the excess amount adsorbed which is used to judge the adsorption performance. At low temperatures below the normal boiling point, MC simulations of gas adsorption can be compared directly with the experiment. Nevertheless, for the gas adsorbed near or above its critical temperature, absolute simulation variables must be converted to excess values. For supercritical adsorption, Gibbs introduced the concept of the excess amount adsorbed,

Results and discussion
Adsorption of methanol in Kln interlayer
The average loading is about 20/unit cell in the Kln interlayer at room temperature (298.15 K) under atmospheric pressures (101 KPa). Consequently, we define 20 methanol molecules as the saturated methanol adsorption of the Kln supercell structure. In addition to the amount adsorbed, the isosteric heat is also a thermodynamic property for the evaluation of the adsorption system. The heat of adsorption is higher in smaller pores. It is worthwhile to point out that the isosteric heat of methanol adsorption in the Kln interlayer ranges between 12.105 and 96.241 kJ/mol, which is characteristic of physical adsorption.
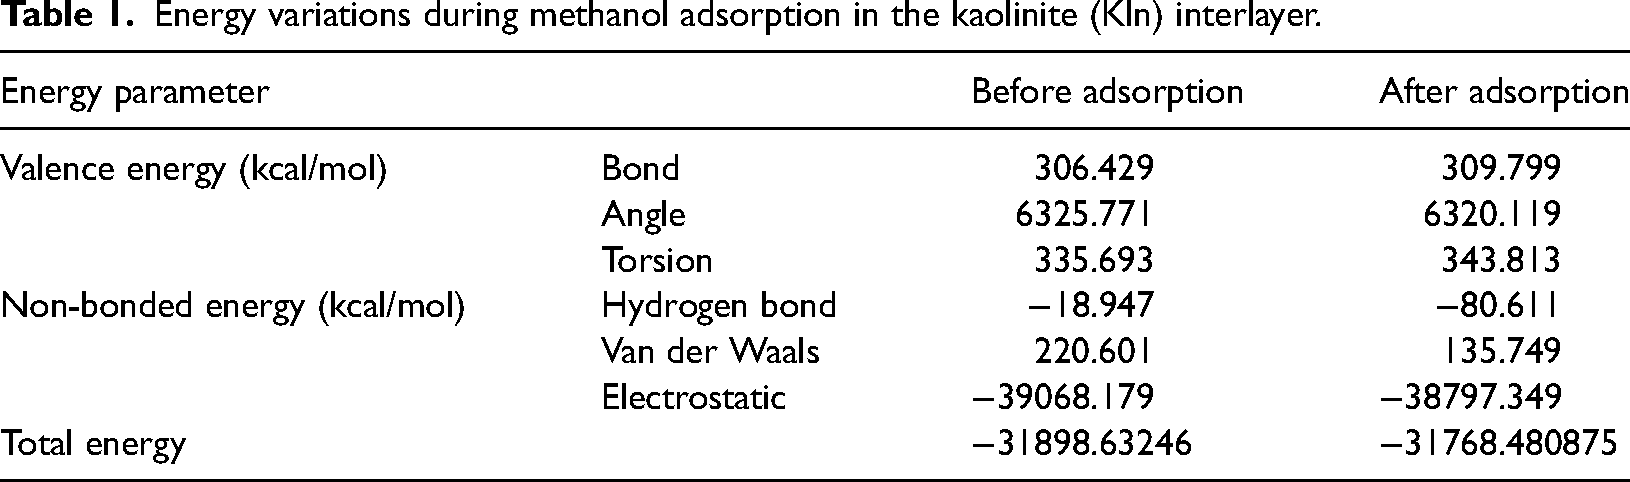
Table 1 presents the change of configuration energy, in valence energies and non-bonded energies before and after adsorption. For valence energies, the bond energy and torsion energy increased by 3.37 and 8.12 kcal/mol, respectively. But angle energy decreased by 5.652 kcal/mol. To non-bonded energy, the hydrogen bond increased by 61.664 kcal/mol, VDW energy decreased by 84.852 kcal/mol, and electrostatic energy decreased by 270.83 kcal/mol. This indicates that the aggregation of methanol is mostly affected by non-bonded energy. The methanol adsorption in the Kln interlayer is mainly due to the methanol–hydroxyl surface of Kln hydrogen bonding interactions, which is consistent with the findings in previous results (Cheng et al., 2015b), and weak dispersive interactions with dipole interactions between polar methanol molecules and the surface of the adsorbent.
Energy variations during methanol adsorption in the kaolinite (Kln) interlayer.
A snapshot of GCMC simulations for configurations of methanol molecules in the Kln interlayer is depicted in Figure 2. The methanol molecules confined in the interlayer tend to form a monolayer structure, in which they are uniformly distributed. Methanol molecules seem to fill up the interlayer, but there are still plenty of open spaces between methanol molecules. Methanol molecules tend to be adsorbed on the surface of Kln and most hydroxyl groups or hydrogen on the top of methyl of methanol are oriented toward the surface hydroxyl of Kln, which is consistent with the non-bonded energy change as given in Table 1.
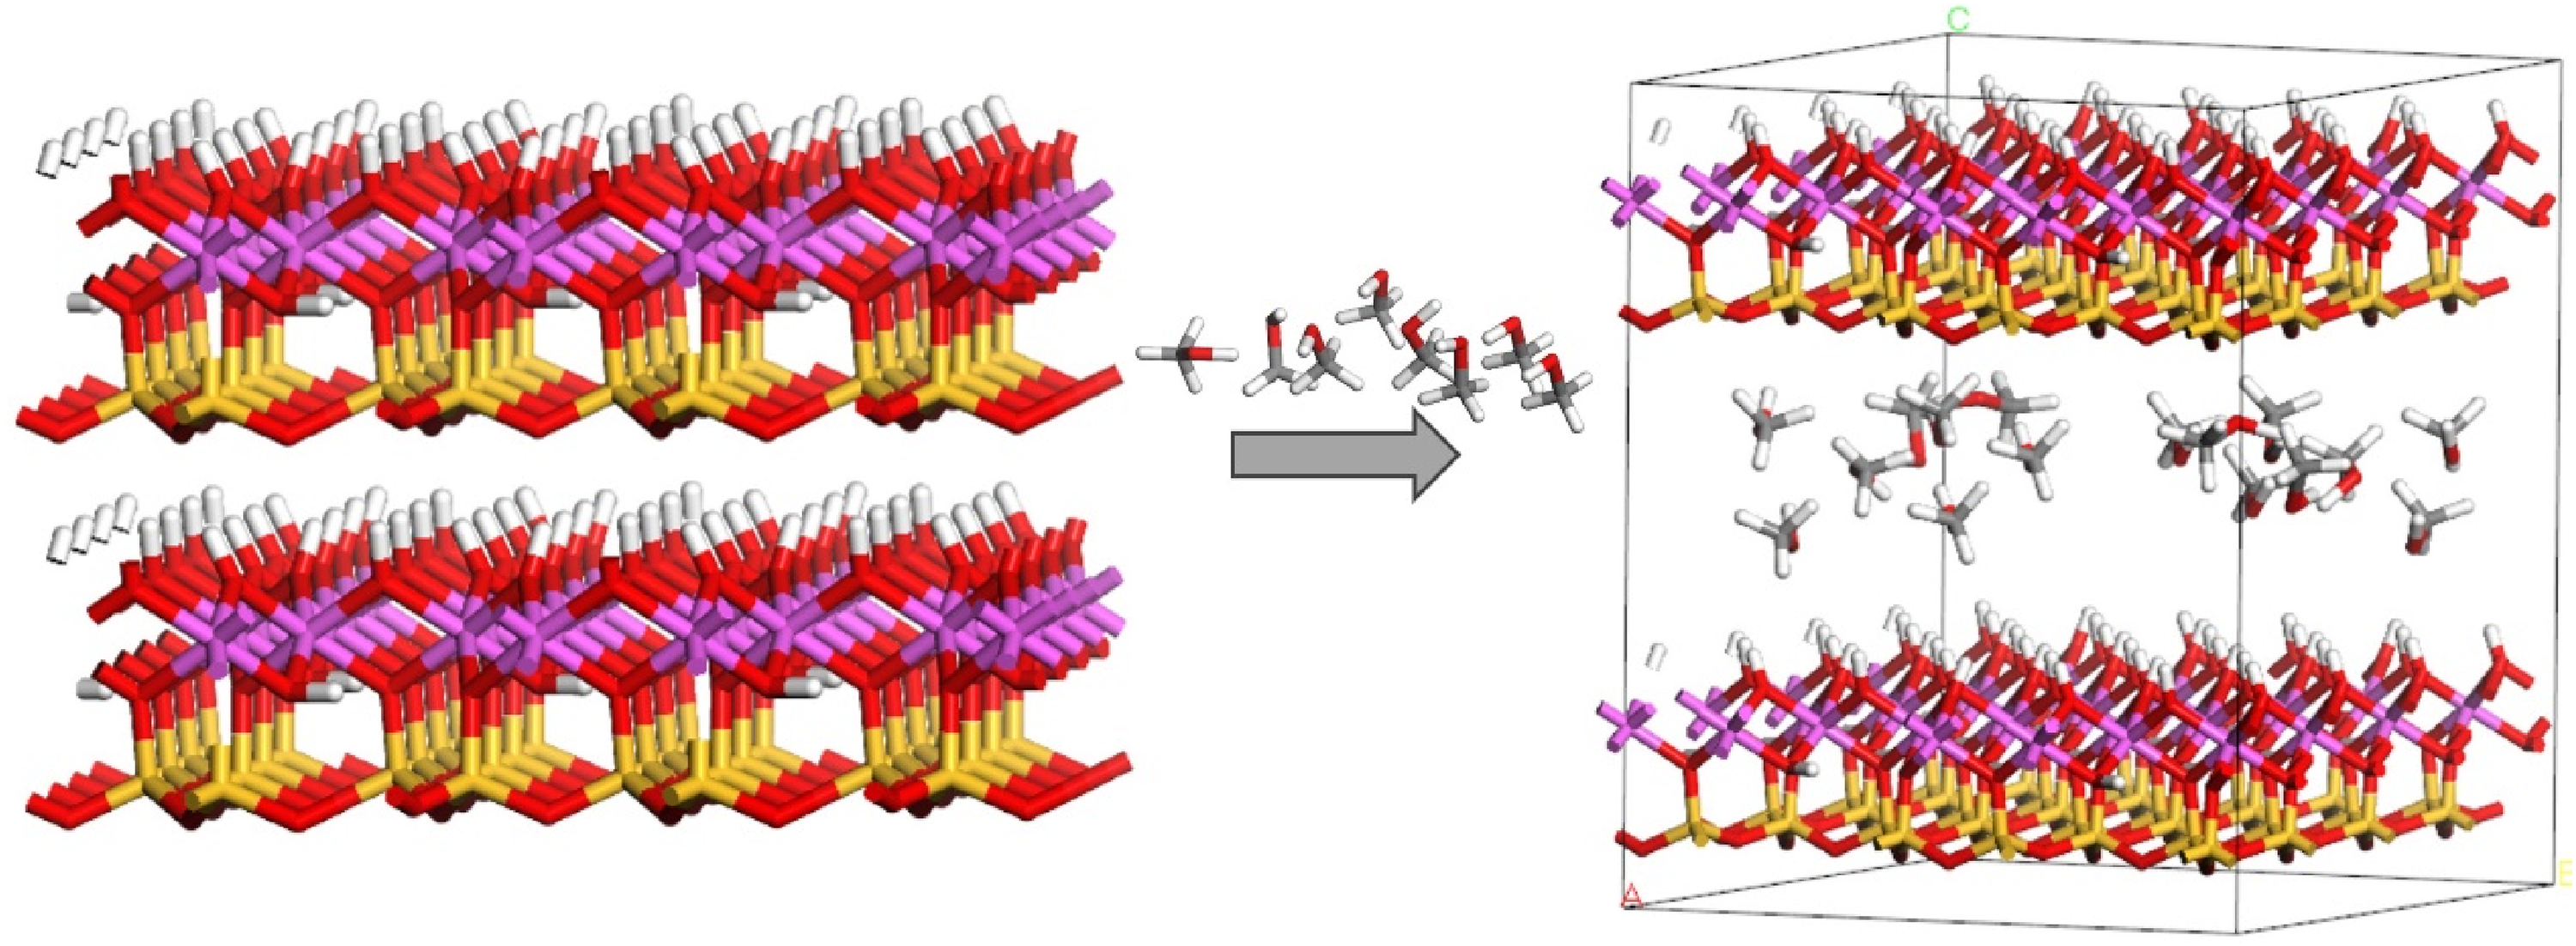
Snapshot of methanol molecules in the interlayer of kaolinite (Kln) at 298.15 K and 101 KPa with d(001) = 11.44 Å.
Methane adsorption with preloaded methanol molecules
We present the effect of methanol on methane adsorption in the interlayer of Kln–Me for different pressures with varying amounts of preloaded methanol. All the simulations are carried out in this work at room temperature (T = 298.15 K). The intercalation ratio of methanol should be considered to emphasize the influence of methanol on methane adsorption. In actual experimental conditions, methanol's intercalation ratio could not reach the simulated value. The number of methanol molecules in Kln–Me has been varied from 2 to 20 and each configuration is optimized for the reasonable interlayer spacing (d) to simulate methane adsorption. The Dreiding force field is used to optimize the Kln–Me geometry with methanol numbers between 2 and 20, and the optimized structure is used as the initial structure for GCMC simulation.
Table 2 summarizes the structural characteristic and simulated adsorption properties of all Kln–Me with different methanol contents. The optimized interlayer spacing (d) is in excellent agreement—the best match comes with N = 14/u.c—with the experimental data published by Cheng et al. (2015a, 2015b). This endorses the Dreiding force field as fully justified for describing such systems for reliable cell parameters. In Table 2, the interlayer spacing expands with the increase in methanol number, so the amount of intercalation agent does affect the interlayer spacing of Kln. Nevertheless, free volume increases at first and then decreases as the methanol number increases, which is consistent with the change in the maximum amount of adsorbed methane. At first, free volume increases with the expanded interlayer spacing which changes greatly with the increasing methanol number. Then, the interlayer spacing change rate becomes small and the increased presence of methanol molecules leads to reduced free volume. The effect of interaction energy on the loading is also considered. Additional methanols in the interlayer increase the loading heat of adsorption by providing interaction sites. These results demonstrate that methane adsorption depends mainly on the intercalated methanol number. As one would expect, this relation is not monotonic. Maximum adsorption increases from 0 to 1.472 mmol/g when the methanol number increases from 0 to 8/u.c. This is because of the significantly increased number of interaction sites and expanded interlayer spacing leading to an increased free volume of the simulated box. The increase in the loaded methanol content leads to an expansion of the interlayer spacing, thereby creating a larger free volume within the simulation box. This expansion provides additional sites for methane adsorption to occur. Maximum adsorption is highest at N = 8/u.c, which is about one-third of methane adsorption in raw (unintercalated) Kln(in which the methane absorption occurs only on the grain surface). It is suggested that the methane adsorption capacity is improved by the increased interlayer spacing of Kln. The interlayer spacing of raw Kln is smaller than the methane diameter (0.414 nm), so methane adsorption only takes place on the surface of Kln. The highest adsorption comes with the optimal amount of methanol molecules providing additional adsorption with increased free volume and the vacancies to be occupied by methane molecules. However, methane adsorption is greatly reduced as more methanol molecules are present in the interlayer. When the methanol number increases to 20, there is no space to accommodate methane molecules. This finding sheds some light on the mechanism and application of intercalation of Kln, although the amount of methanol may not be a factor easily controlled experimentally.
Structural characteristic and methane adsorption properties of kaolinite–methanol (Kln–Me) with different methanol contents.
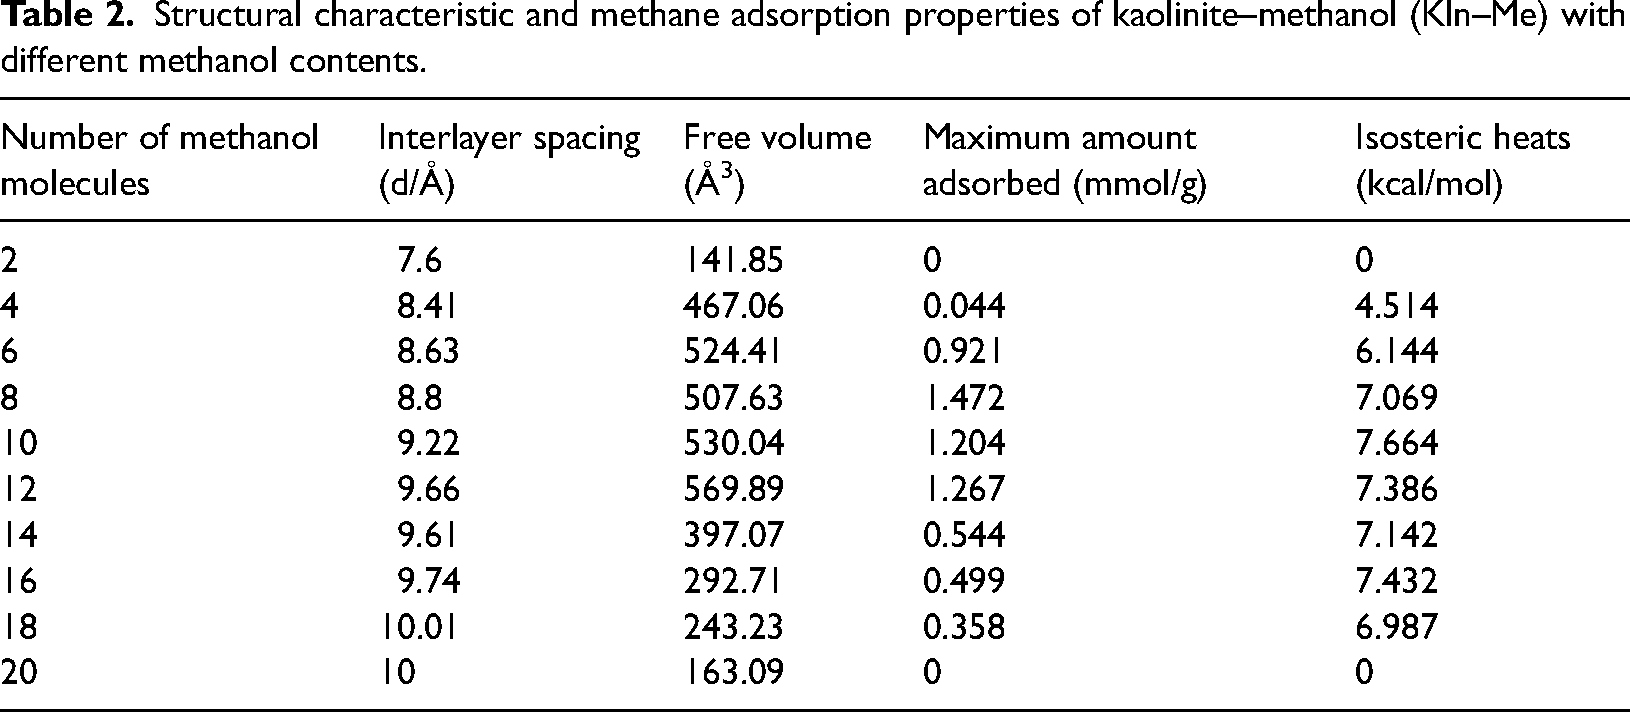
Figure 3 presents the total and excess adsorption isotherms of methane in the Kln–Me interlayer spacing with different amounts of methanol at 298.15 K. Figure 3(a) shows the simulated adsorption isotherms increase rapidly first in the low-pressure range before the increase rate slows down with the further increase in pressure. Figure 3(b) differs from Figure 3(a) in that each excess adsorption isotherm exhibits a maximum at a certain pressure. As pressure further increases, excess adsorption decreases due to higher bulk gas density.
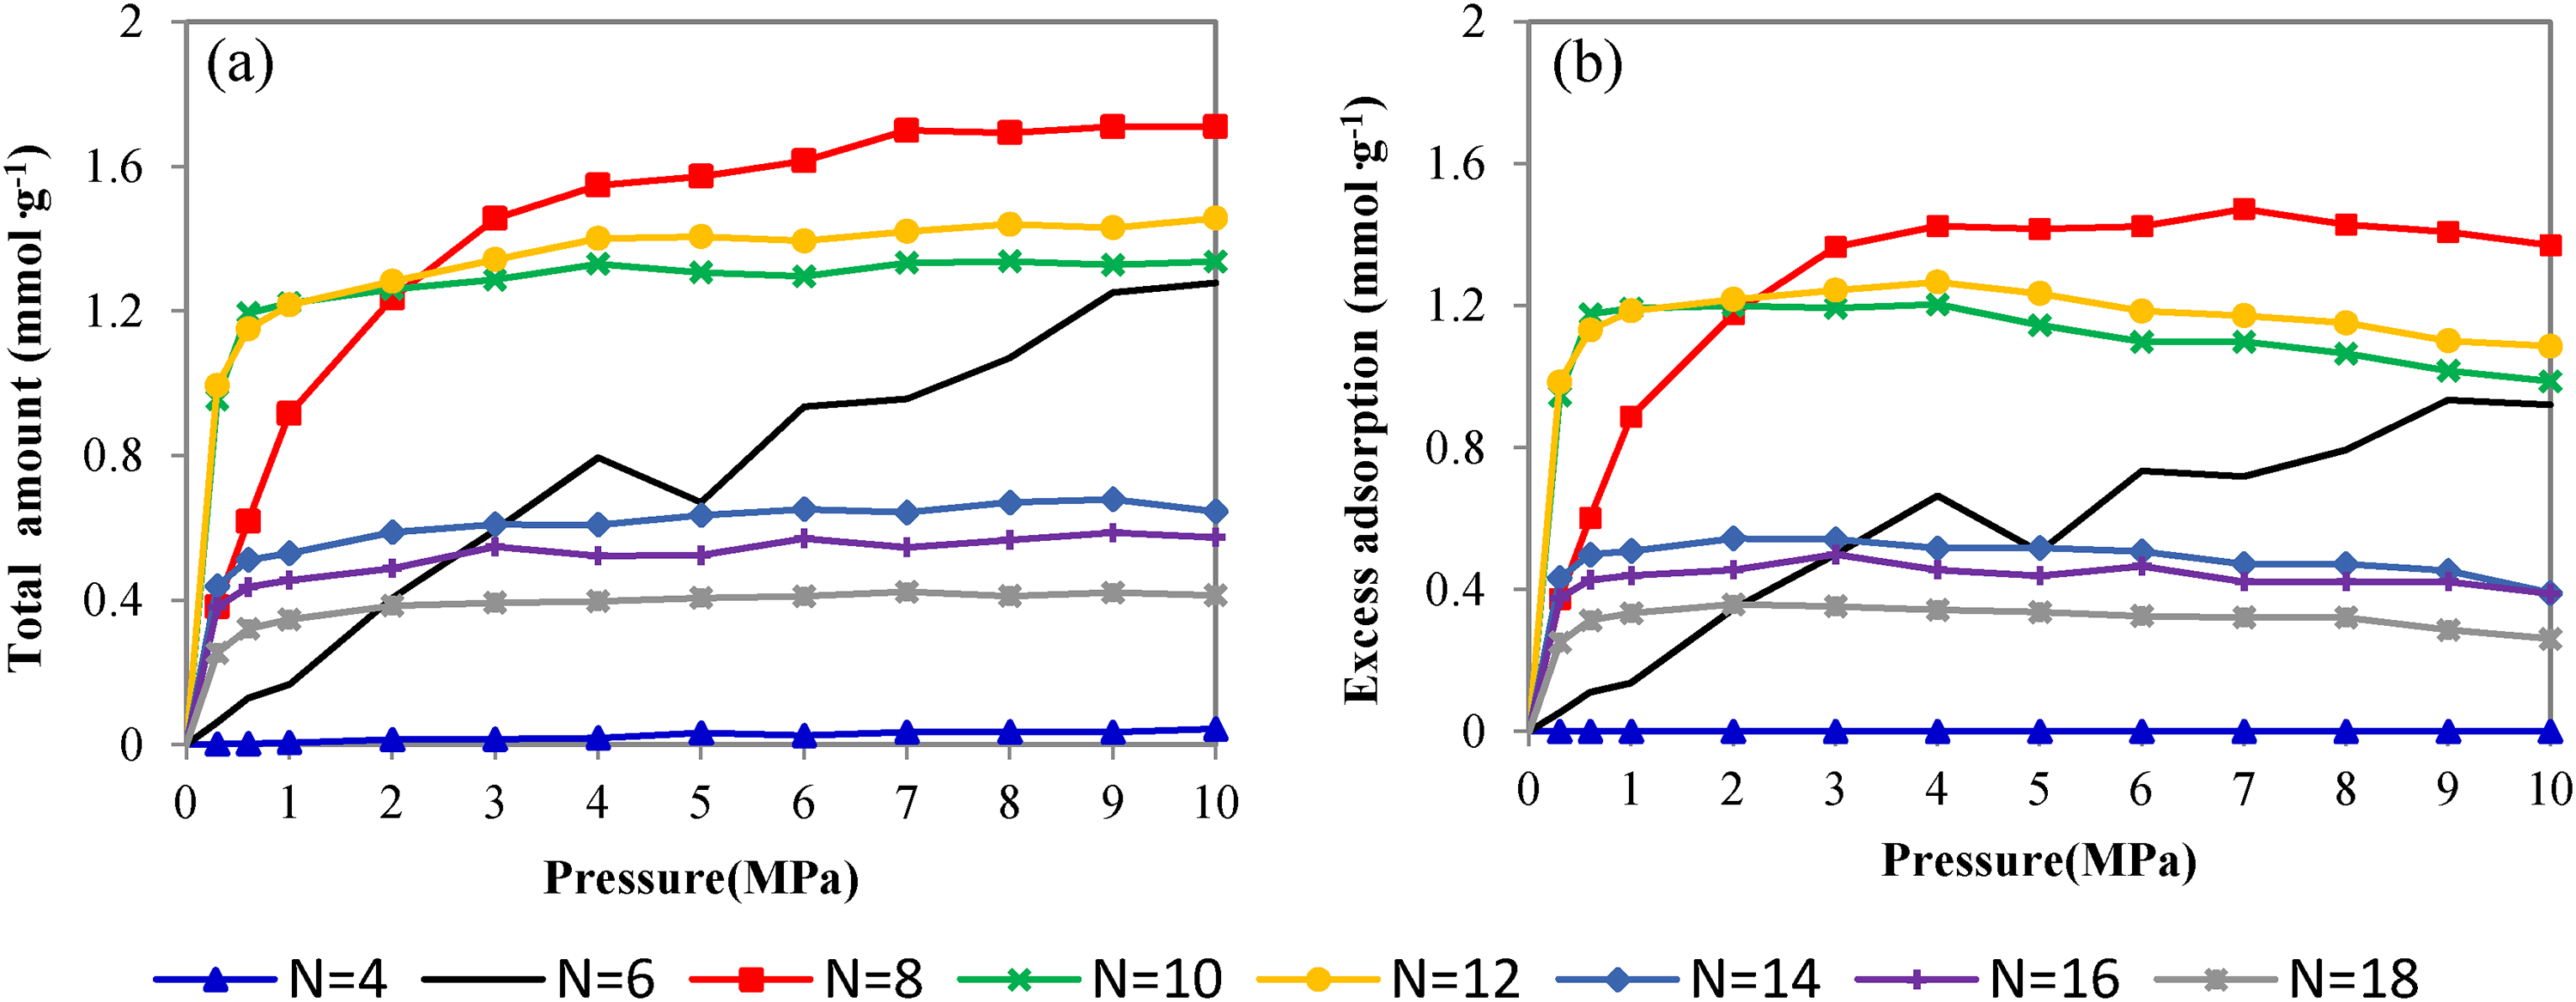
Total amount (a) and excess adsorption (b) isotherms of methane in kaolinite–methanol (Kln–Me) interlayer with different amounts of methanol at 298.15 K.
In Figure 3(b), as the methanol number increases from 4 to 8, so does the methane adsorption amount. But the adsorption amount drops when the methanol number continues to increase from 8 to 18. Therefore, there is an optimum methanol intercalation degree for methane adsorption. At first, the increasing number of methanol gradually expands the interlayer spacing to provide additional interaction sites for methane adsorption. Then, the adsorption space and sites are taken up by methanol molecules, leading to reduced methane adsorption. Four significant features are noticed: (1) methane adsorption is negligible at N = 4/u.c within the whole pressure range. Although the free volume of adsorbent is relatively large with much space between the intercalated methanol molecules, adsorption is limited by weak interaction potential and small interlayer spacing (d). (2) The isotherm of N = 6/u.c increases somehow linearly with pressure up to P = 10 MPa. It may reach equilibrium at some greater pressure. (3) The adsorption isotherms of N = 8/u.c, which has the largest adsorption capacity, rise to their equilibrium smoothly. (4) More methanols in the interlayer not only expand greatly the spacing between layers but also multiply the interaction with methane so that the adsorption isotherms saturate rapidly at low pressure before decreasing slowly (e.g. N = 10–18/u.c).
To provide further insight into the effect of methanol on methane adsorption in the Kln interlayer at 298.15 K under pressure corresponding to the maximum methane adsorption, a series of density distribution profiles are collected in Figure 4. For all systems, due to limited pore space, methane and methanol can form only one adsorption layer in the pores and the position of the main peak is almost constant. Also, the peaks become wider with dropped intensities observed as the methanal number increases. From the density profiles, methanol may form two symmetric secondary peaks from interactions (VDW force and hydrogen bond) with both (top and bottom) walls, but the symmetry is broken as the methanol number increases. The methanol secondary peak on the left-hand side is stronger than the one on the right-hand side because the hydrogen bond between methanol and hydroxyl groups on the hydroxyl surface of kaolinite is stronger than the hydrogen bond between methanol and oxygen atoms in the silicon-oxygen tetrahedron. With a relatively low methanol content (e.g. methanol number N < 8), the methane secondary peak is close to the hydroxyl group's surface, implying that the methane–methanol interactions are not negligible. In general, as the methanol number increases, the secondary peak of methane fades out, leaving behind only a major peak. It means that there is no accessible pore volume for methane near the hydroxyl surface of Kln and the methane accumulation only takes place in the middle of the interlayer.
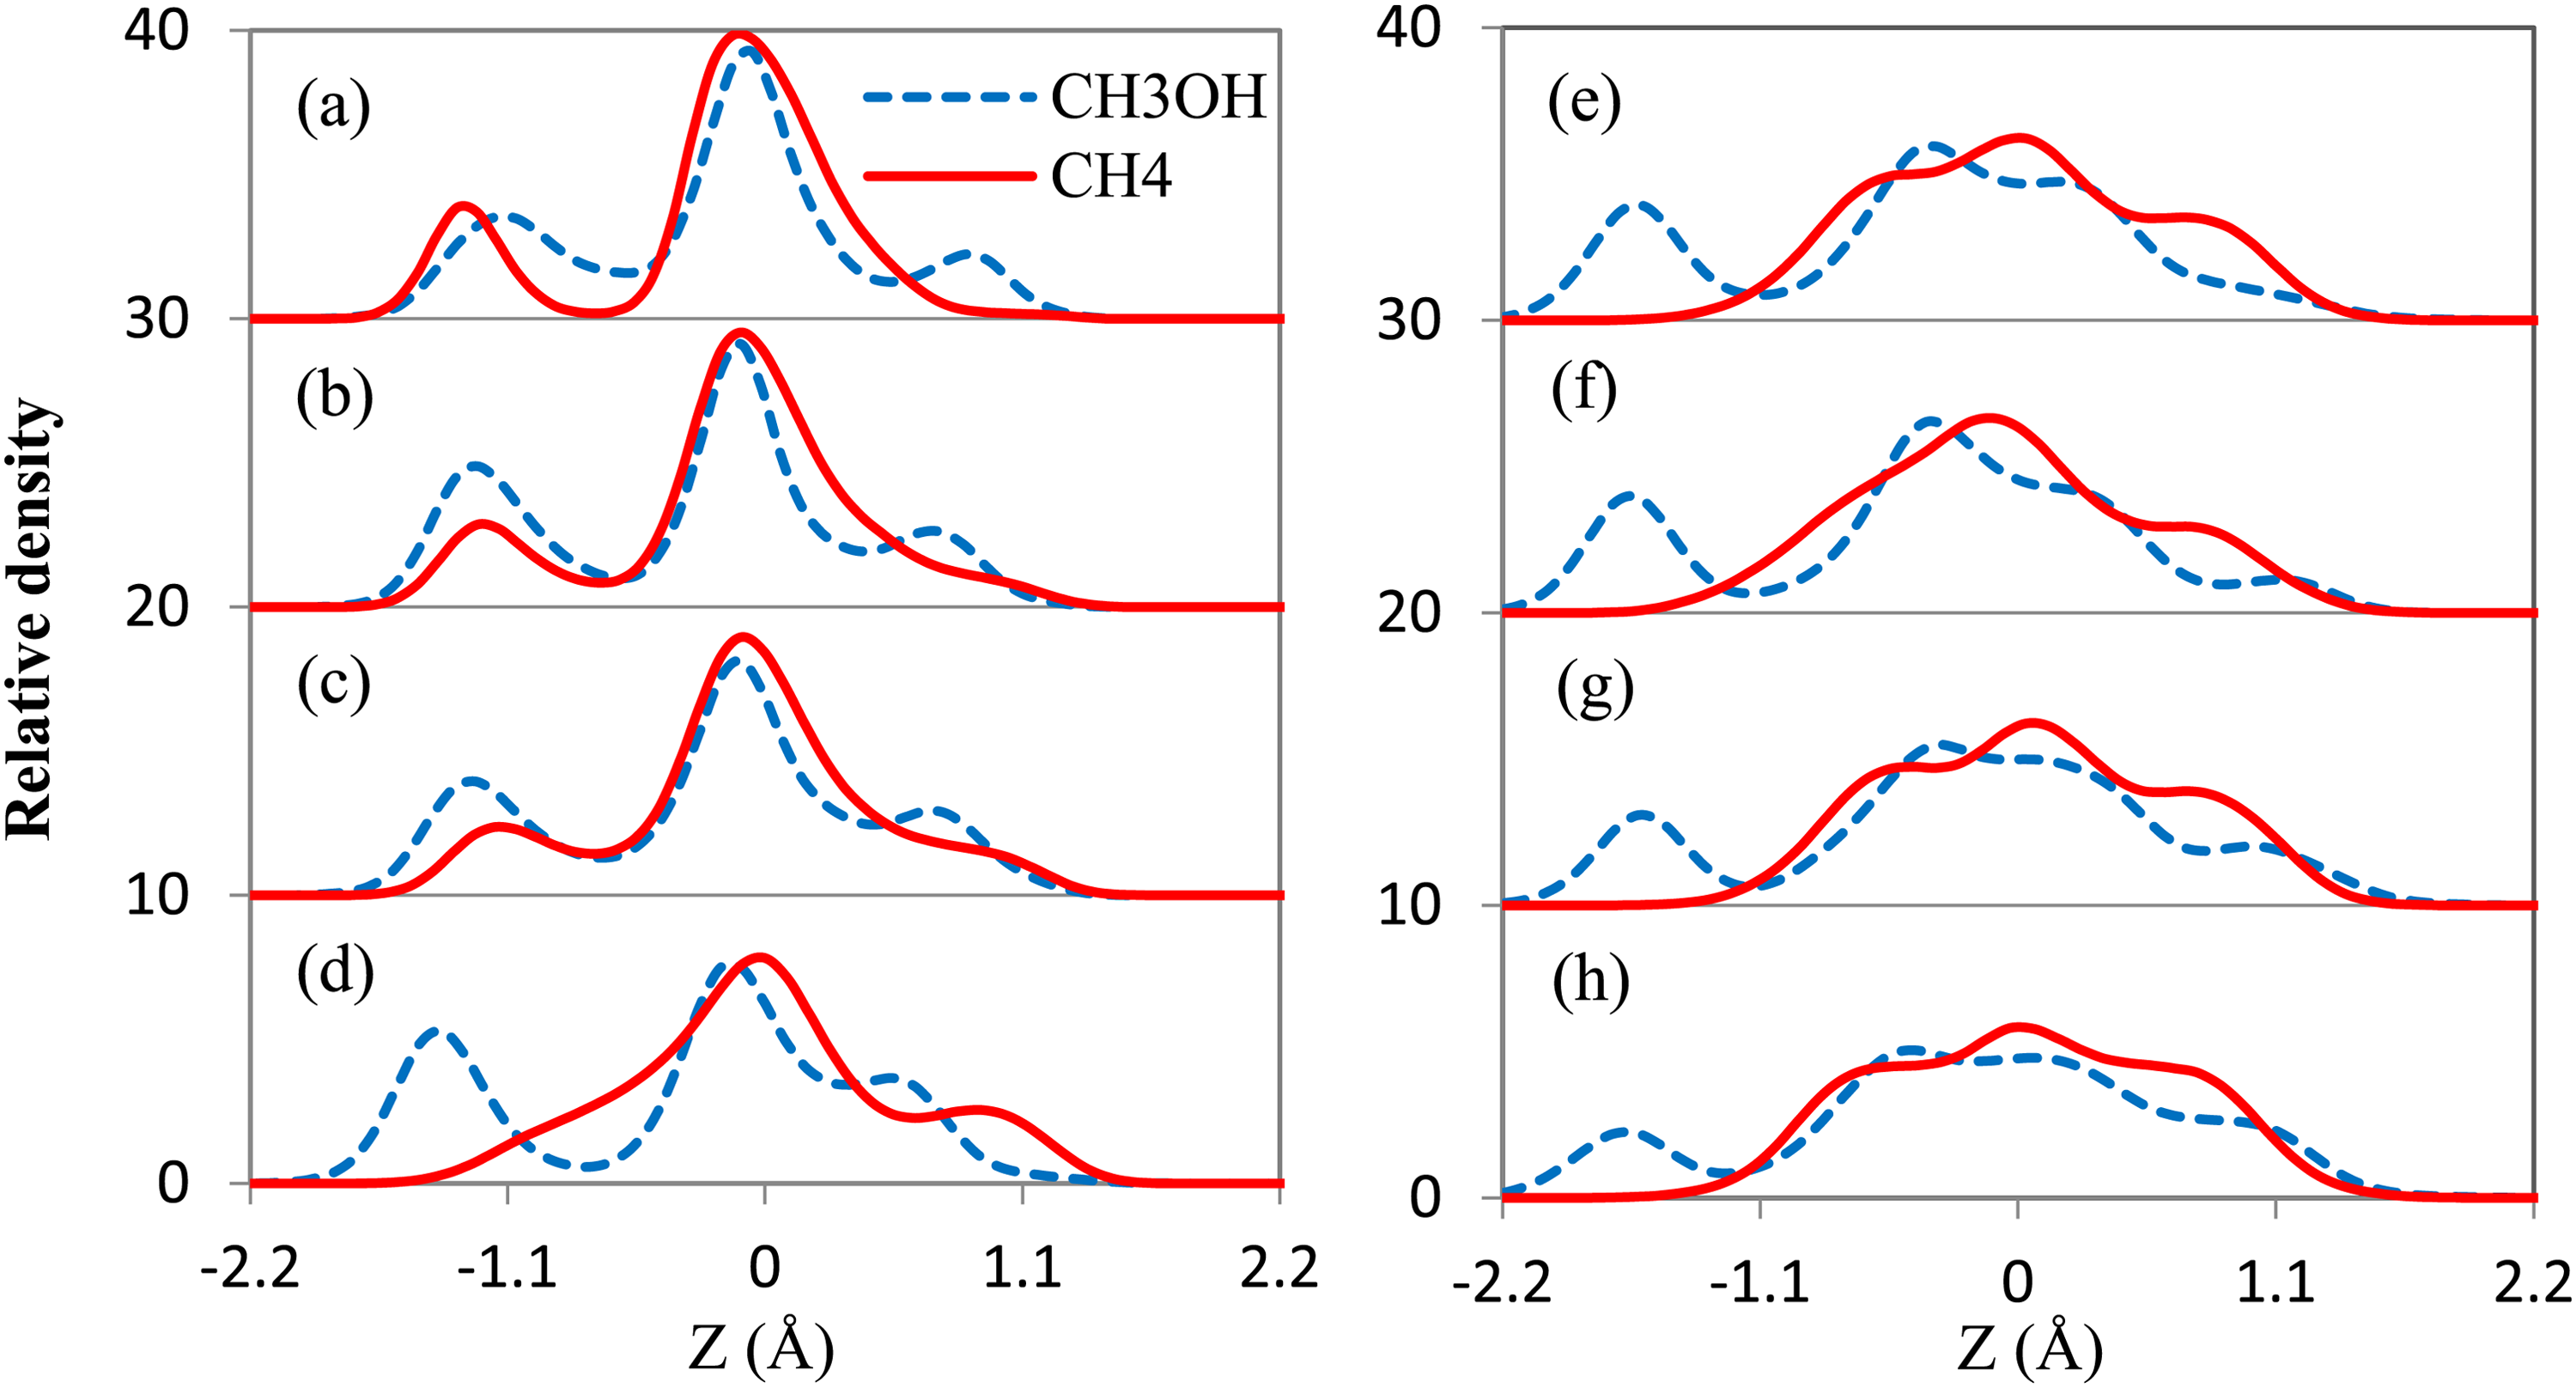
Density profiles for CH4 and CH3OH molecules as a function of distance from kaolinite (Kln) surface with (a) 4, (b) 6, (c) 8, (d) 10, (e) 12, (f) 14, (g) 16, and (h) 18 methanols at 298.15 K.
The results presented in this article suggest that methane adsorption in the Kln–Me interlayer is driven principally by weak dispersive interactions between methane molecules and methanol molecules and the Kln surface perhaps playing a role.
Conclusions
The saturated adsorption in the Kln interlayer is 4.845 mmol/g for methanol adsorption. The isosteric heats between 12.105 and 96.241 kJ/mol suggest that the intercalation of Kln with methanol is physical adsorption, in which non-bonded energy is responsible for the aggregation of methanol. The optimized interlayer spacing (d) of Kln–Me was found to be in good agreement with the experimental values, which validates the Dreiding force field as being justified for describing such systems.
The isothermal adsorption curves with different methanol numbers all follow similar Langmuir patterns. Methanol content corresponding to N = 8/u.c is the optimal value among all cases studied for methane adsorption at room temperature. Maximum methane adsorption in the interlayer of Kln–Me is 1.47 mmol/g, which is about one-third of the amount adsorbed by raw Kln. It is suggested that the modification of Kln can improve methane adsorption. The number of methanol in the interlayer is the primary factor affecting methane adsorption and distribution.
Footnotes
Acknowledgements
The authors gratefully acknowledge the financial support provided by the National Natural Science Foundation of China (42172043, 42202148) and the Fundamental Research Funds for the Central Universities, Chang’an University (300102263301, 300102273203).
Declaration of conflicting interests
The author(s) declared no potential conflicts of interest with respect to the research, authorship, and/or publication of this article.
Funding
The author(s) disclosed receipt of the following financial support for the research, authorship, and/or publication of this article: This work was supported by the National Natural Science Foundation of China (grant numbers 42172043, 42202148) and the Fundamental Research Funds for the Central Universities, Chang'an University (grant numbers 300102263301, 300102273203).