
Abstract
With the help of mechanical models and numerical calculations, the research obtained: (1) the range of compressive shear stress in well bore is in the shape of “dam body” with the dip angle of a reverse fault, also, the magnitude of the compressive shear stress is related to the load factor and the maximum compressive principal stress which have an increasing relationship; (2) the superposition stress of lateral abutment stress and SZZ of a working face is σA, which is related to the distance between reverse faults; (3) the closer the distance to the reverse fault and the greater the vertical well displacement and deformation as the advancement length of the working face increases, the sensitivity to the effects of the reverse fault and mining is: XDISP > ZDISP > YDISP, and the sensitivity to the boundary is such that: ZDISP > YDISP > XIDSP; (4) the closer the distance to the reverse fault and the larger the length of the working face, the greater the displacement and deformation of the vertical well. In addition, the sensitivity to the effects of reverse faults and mining is: XDISP > ZDISP > YDISP; (5) when the working face continues to be mined, the shear stress on the well bore and the circumference of the hole is sensitive to the influences of reverse faults as follows: SXZ > SYZ > SXY; (7) the density of strain energy at the well bore is most sensitive to the lateral distance to the working face strike mining line. Based on these results, it is proposed to arrange large-diameter pressure relief boreholes around the hole and arrange layers to eliminate the influence of the well bore boundary and eliminate the accumulation of shear strain energy around such a well bore.
Introduction
At present, surface wells are key to pre-drainage (Chen et al., 2020; Jiang et al., 2015), pressure relief drainage (Liu et al., 2017; Zhang et al., 2015), and goaf treatment of working face with high gas and outburst coal seams (Qin et al., 2015; Xiong et al., 2021), focusing on the well bore layout and other related parameters is worthwhile: if a hole is too close to the working face and is affected by mining, it is prone to plastic failure, if it is too far from the working face the influence of mining can be avoided, but it is difficult to achieve efficient gas extraction. It remains difficult to arrange surface wells to achieve “multi-purpose with one hole” layouts in the area near a reverse fault (Wang et al., 2021). As a result, it is necessary to conduct dynamic analysis and numerical simulation of surface wells in this area.
Regional dynamic analysis and numerical simulation of a reverse fault were conducted (Gudmundsson et al., 2008), and a mining model was constructed by numerical simulation with the help of mechanical calculations. However, the slip behavior of a reverse fault under the influence of mining is quite different from that of a normal fault (Cao et al., 2001): it readily forms a closed chamber, which becomes a gas accumulation “inclusion”; when working face is being mined, foot-wall coal rock activation is more obvious and mining-induced fractures are more than sufficient. Therefore, surface wells arranged in foot-wall of reverse fault are more conducive to efficient gas extraction (Jiang et al., 2015).
In addition, some studies have been carried out to analyze the impact of reverse fault dynamics on surface vertical wells, but the studies cannot cover the complete life cycle of the surface vertical wells, including the influence of drilling, cementing, and mining face (Huang et al., 2017; Mohiuddin et al., 2007; Zhu and Li, 2019).
At present, the range of influence of surface well dynamics in the reverse fault area is unclear, and it is difficult to distinguish the influencing factors of the compressive shear stress of the well bore. In addition, numerical simulation of cylindrical vertical wells is difficult. Here, mechanical analysis and numerical simulation were conducted in combination with the actual situation in the field, thus laying a theoretical basis for realizing “one hole with multiple uses” in a surface well.
Mechanical analysis model of vertical well
Stress analysis of a fault-vertical well overall model
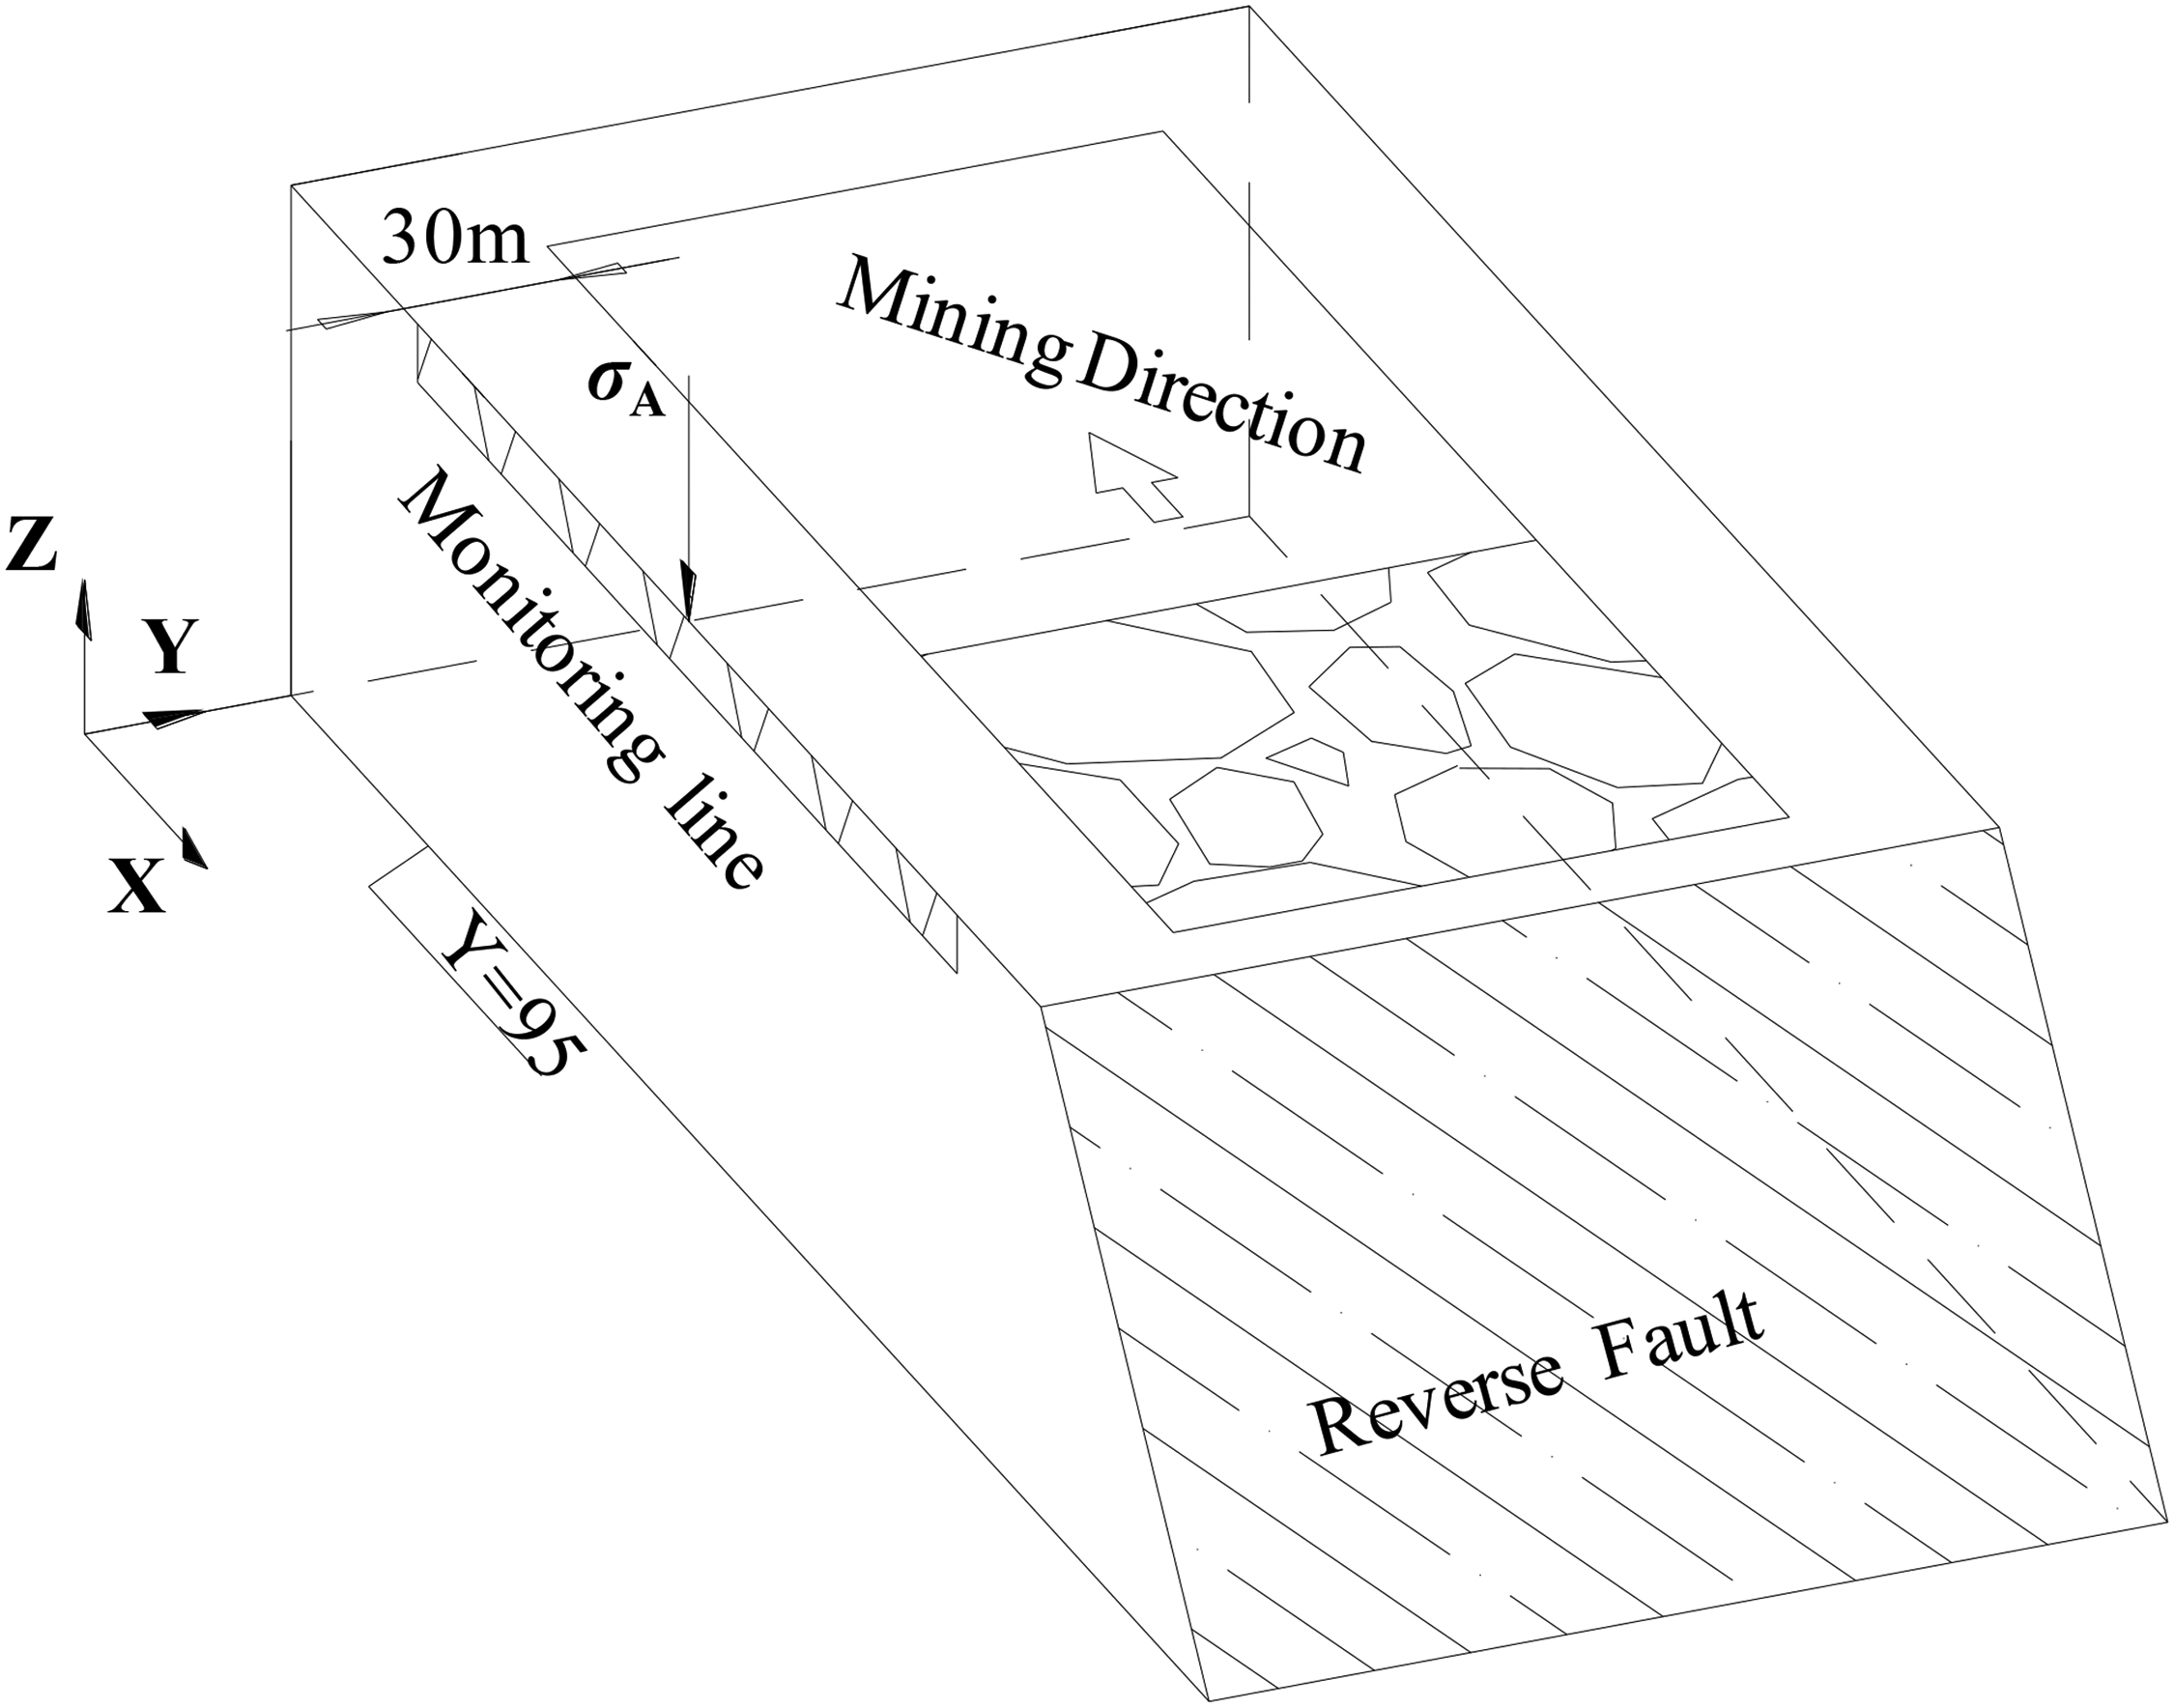
In the preface, the surface well should be in the foot-wall area of reverse fault, as shown in Figure 1, where the diameter of vertical well is 150–400 mm (Hu et al., 2015), so, this section focuses on establishing a mechanical model to study the angular range of well bore compression shear action.
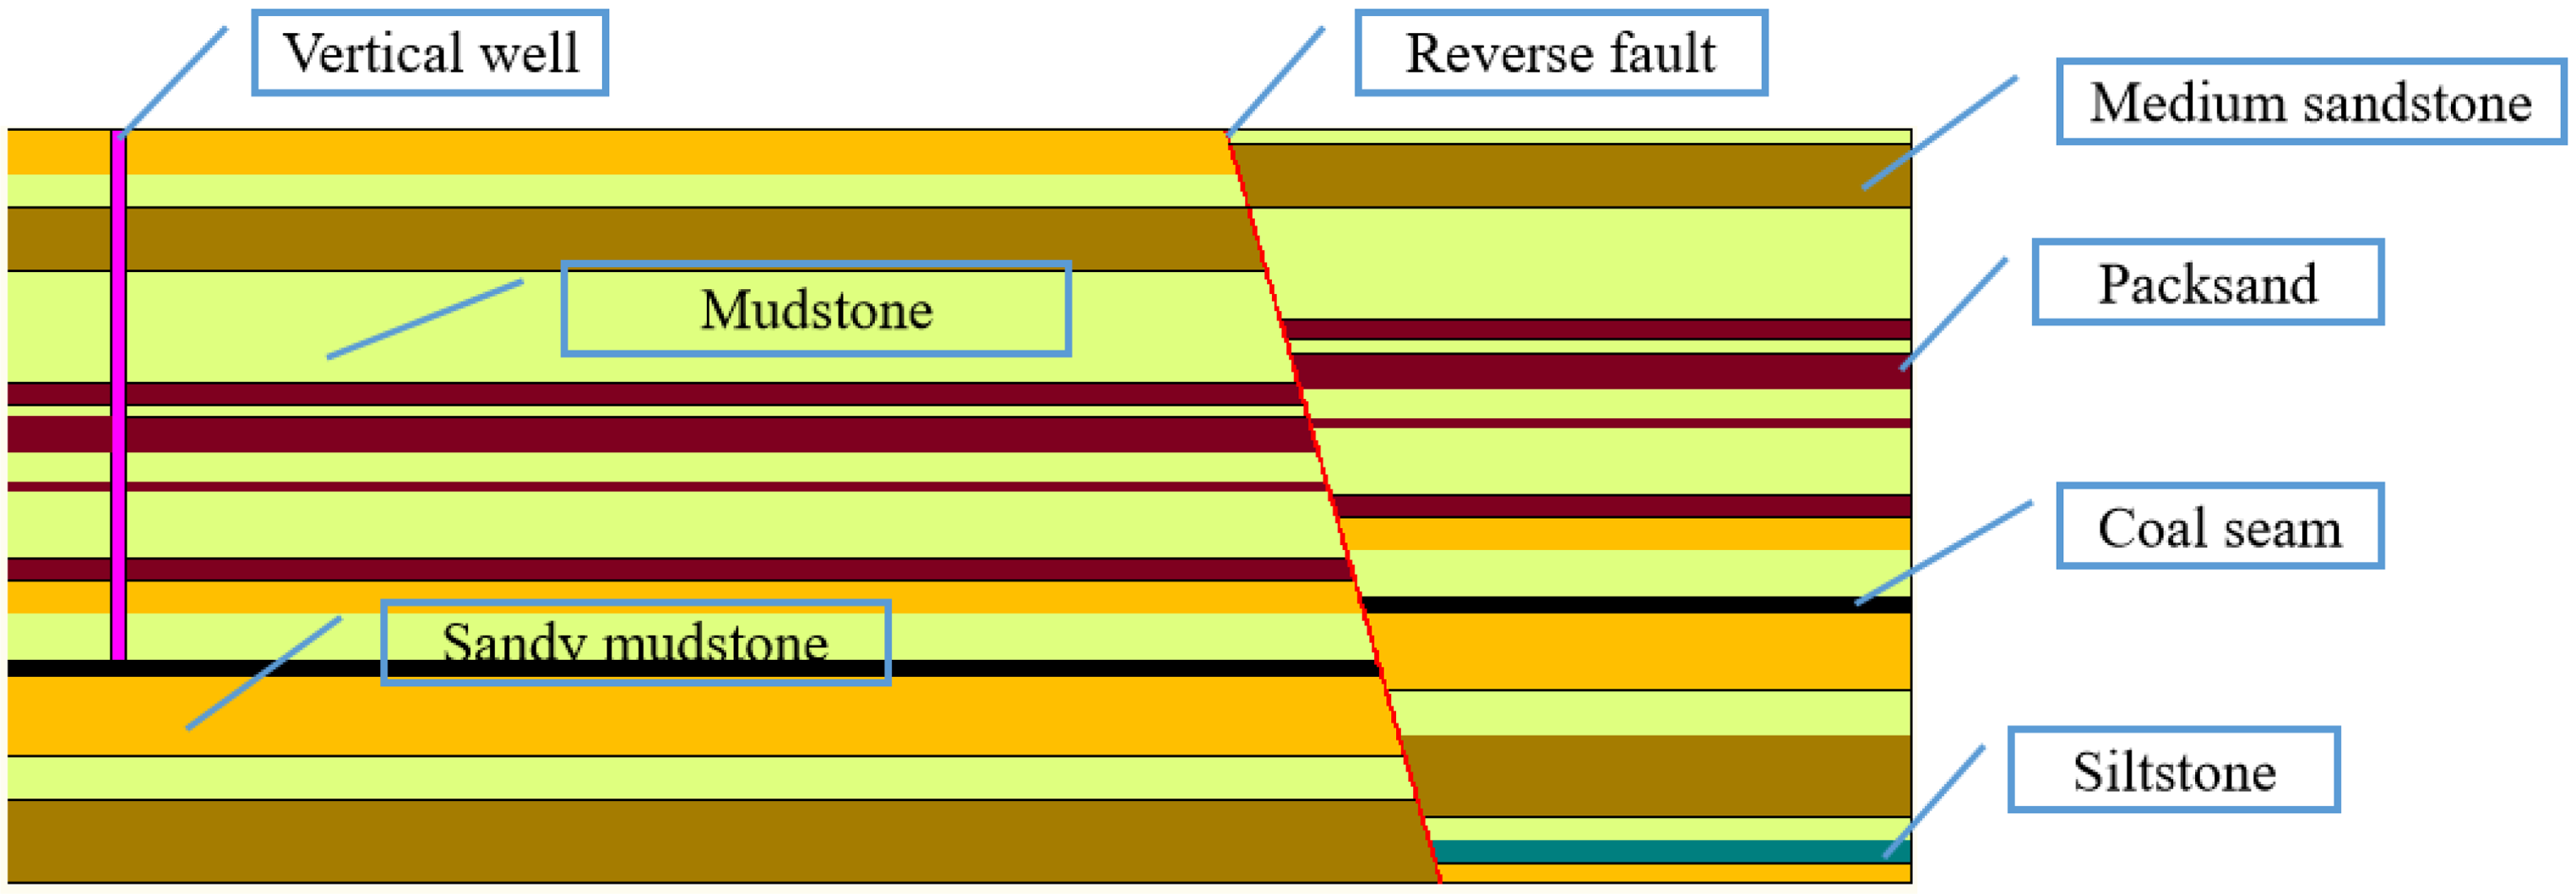
Three-dimensional schematic diagram of a surface well layout.
If the reverse fault slip and shear mechanics model is established separately, the relationship between the reverse fault and the well bore will be ignored, leading to error, therefore, the fault-vertical well must be considered in any comprehensive model.
Taking a section along the mining direction of the working face strike, as shown in Figure 2, when the stress of mining lateral support stress on the foot-wall working face of reverse fault superimposed with SZZ which represents vertical stress along the rock strata is σA, P is the normal stress of the whole fault-vertical well subjected to the bottom rock, the dip angle of the fault is θ, the normal stress of the fault plane is σN and the tangential force is τN, and the left side of the model is subjected to vertical stress σS and tangential force τS, and oblique shear force τW of vertical well and is at an angle β to the horizontal. In addition, the bottom length of the whole model is L and the height is H.
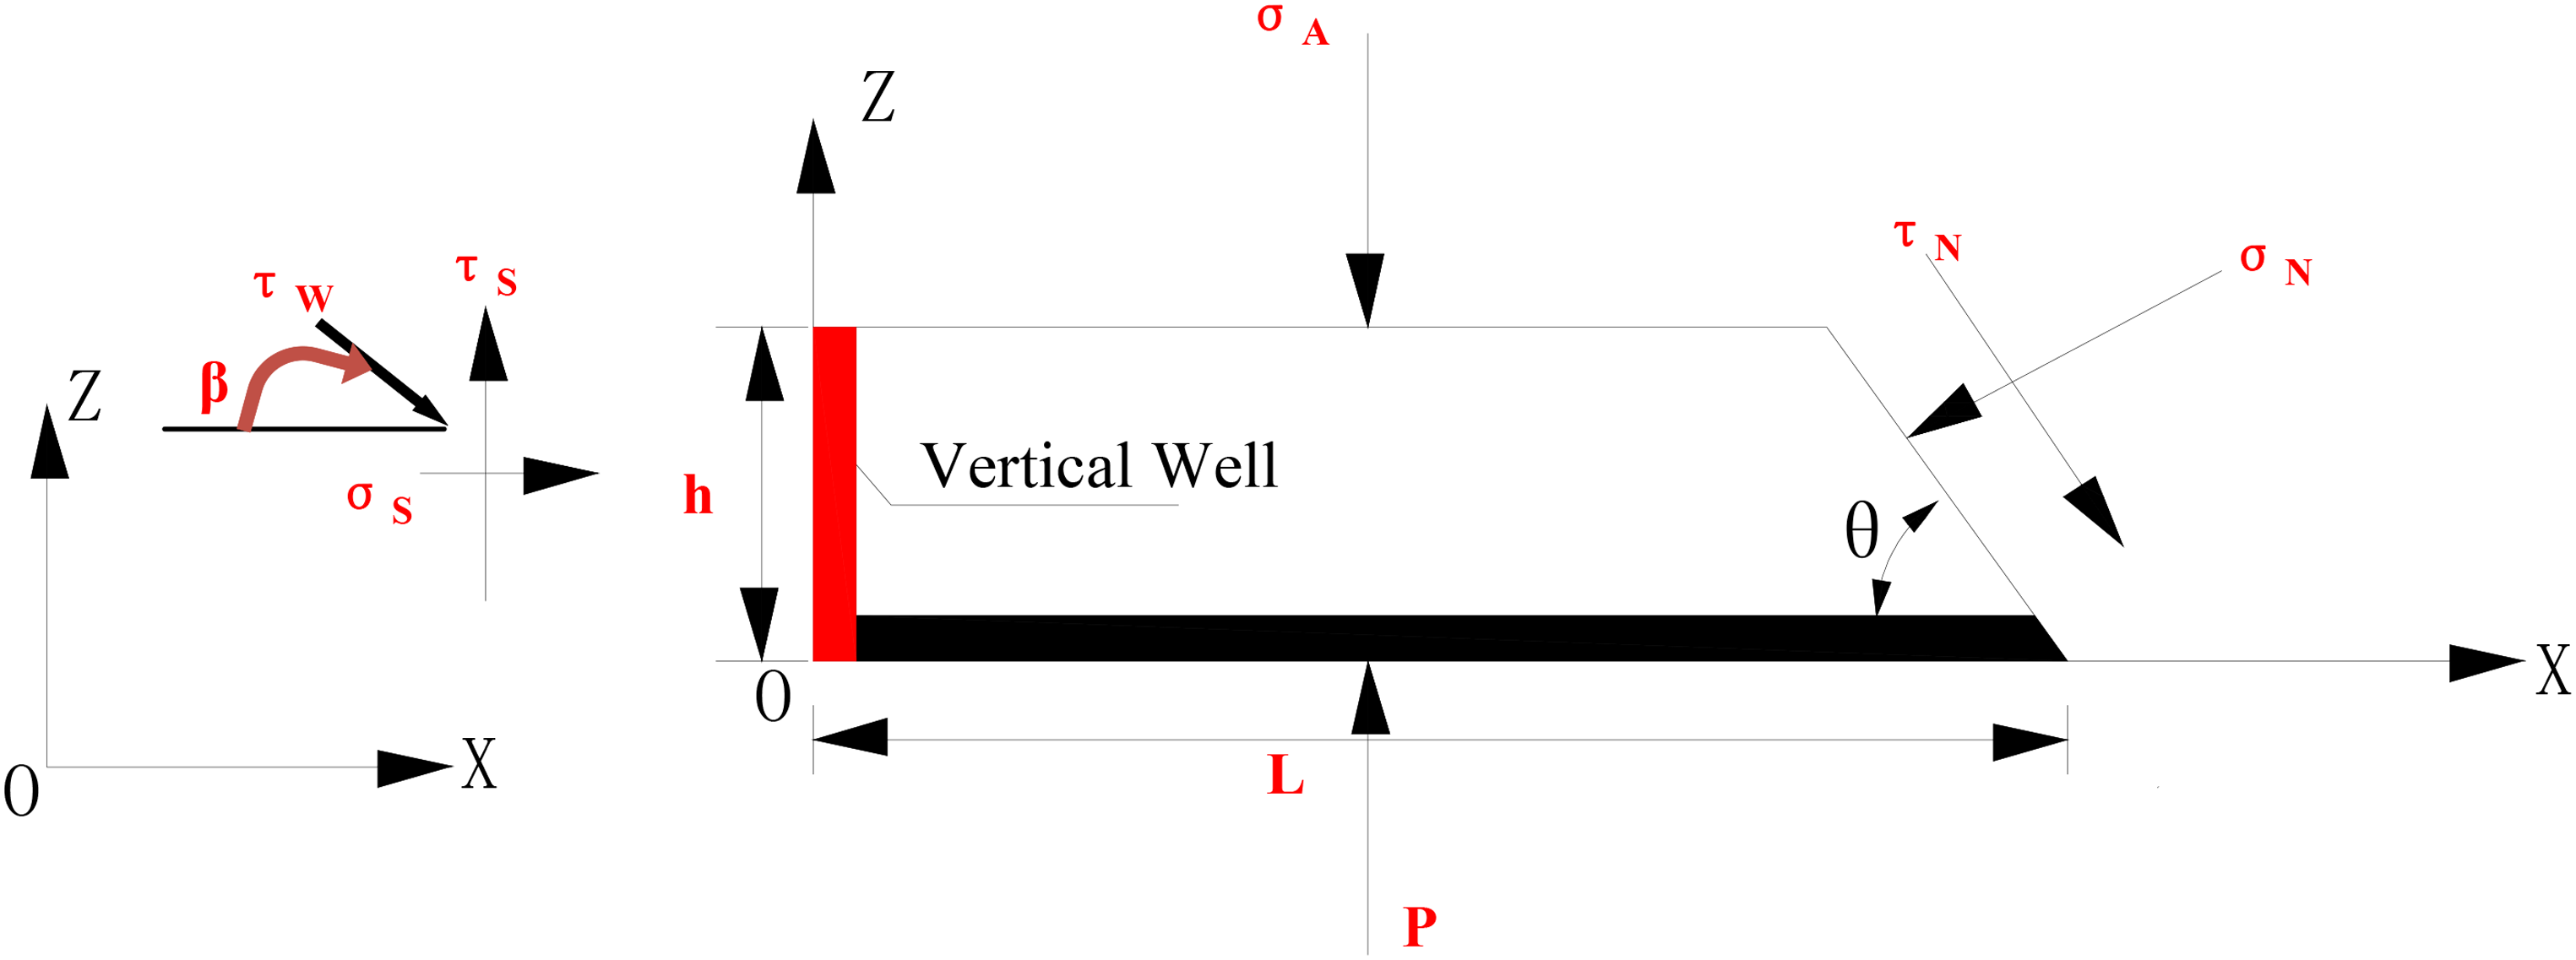
Fault-vertical well mechanical model.
When Z = (L−x) tanθ, the mechanical balance equation of the overall model in the x and Z-directions and the torque balance equation based on the origin are established, as shown in formulae (1) to (3):


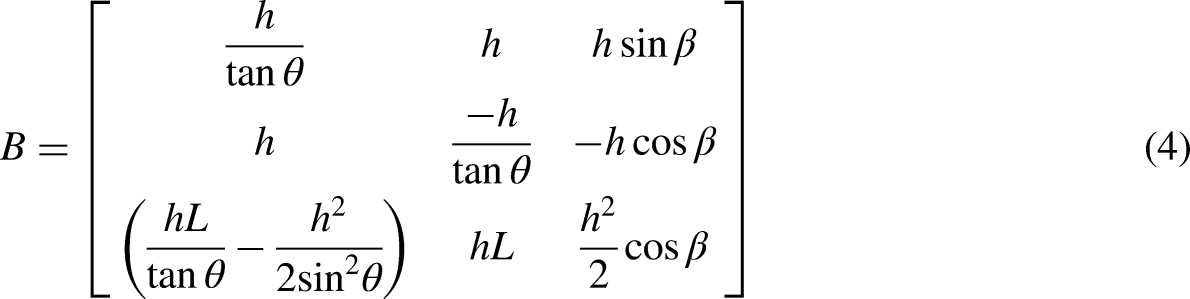
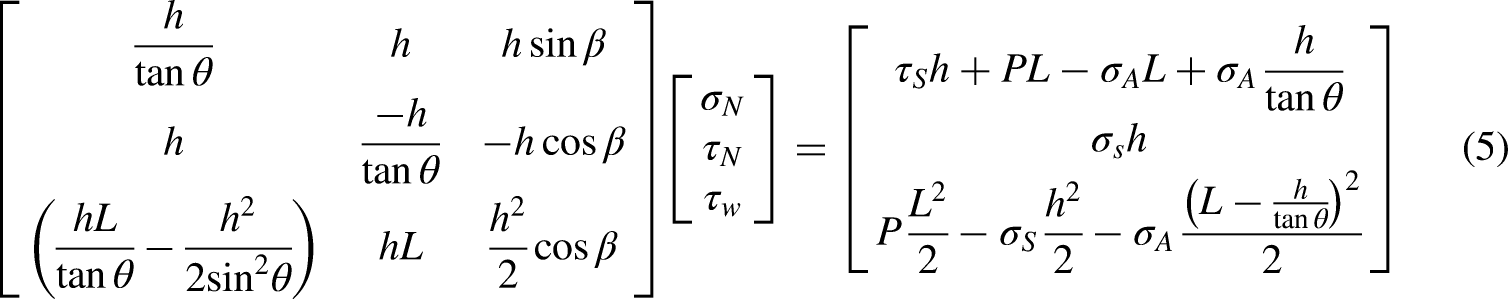
The matrix B is obtained from formulae (1) to (3), and the expressions for τW, σN, and τN are expressed as (5):
Formula (5) is required to have a solution, and determinant transformation of coefficient matrix B is needed to obtain expression (6) (Misawa et al., 2013):
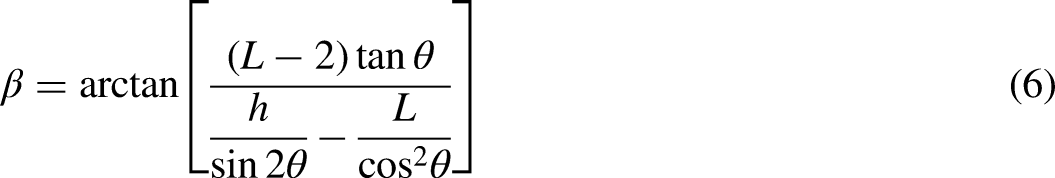
Relationship between β and θ.
Subsequently, the mechanical model will be verified in the numerical simulation (section “Verification of the range of β angles”); meanwhile, the numerical simulation solution method for determining key parameter σA in the mechanical model is detailed in section “Distribution of superimposed stress σa”.
Solution of vertical well compressive shear stress τw
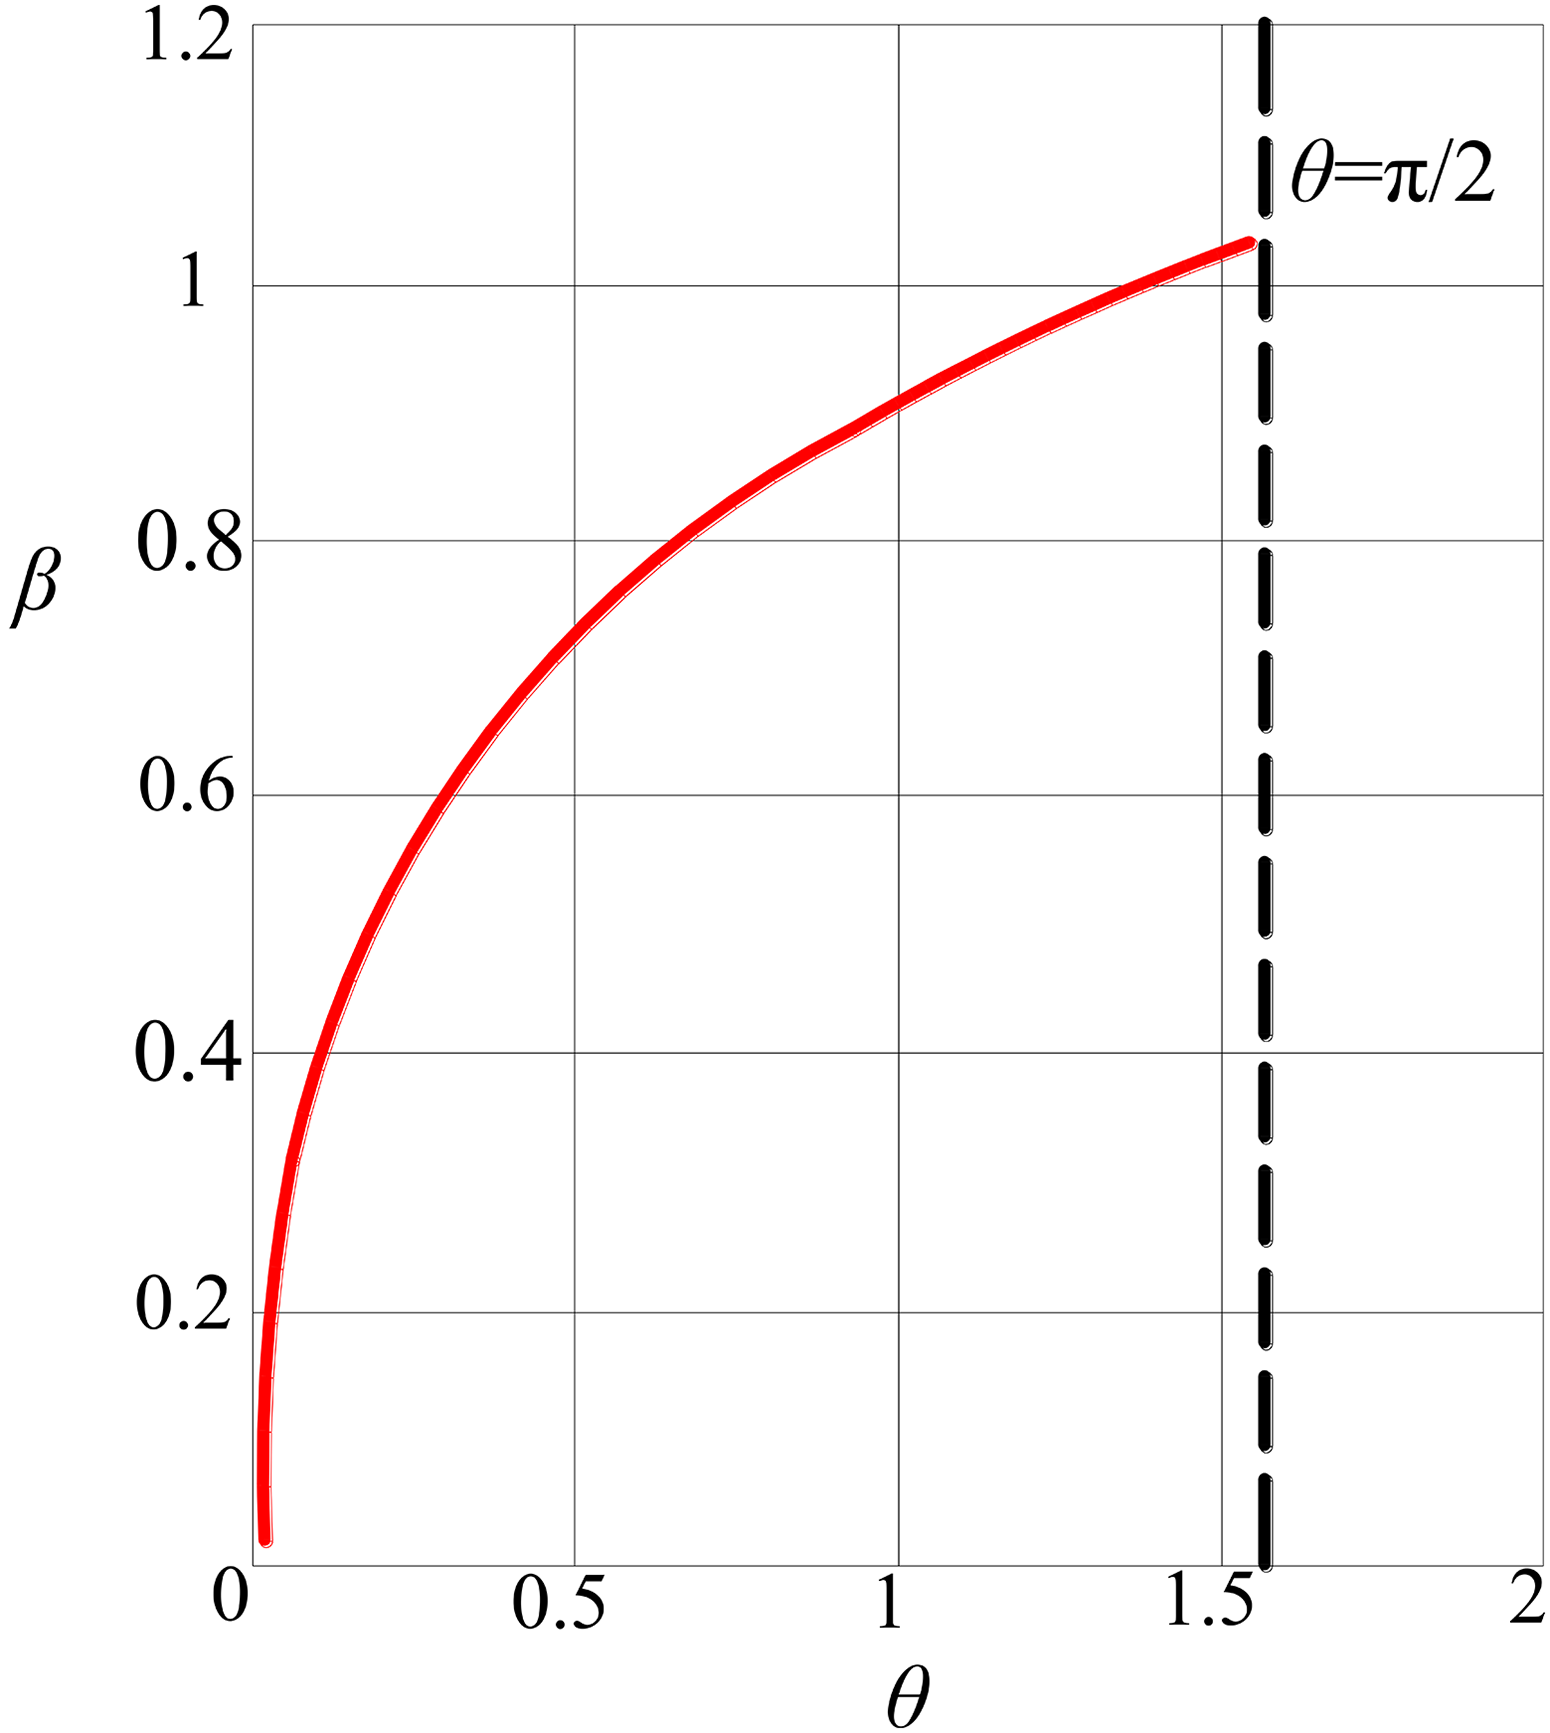
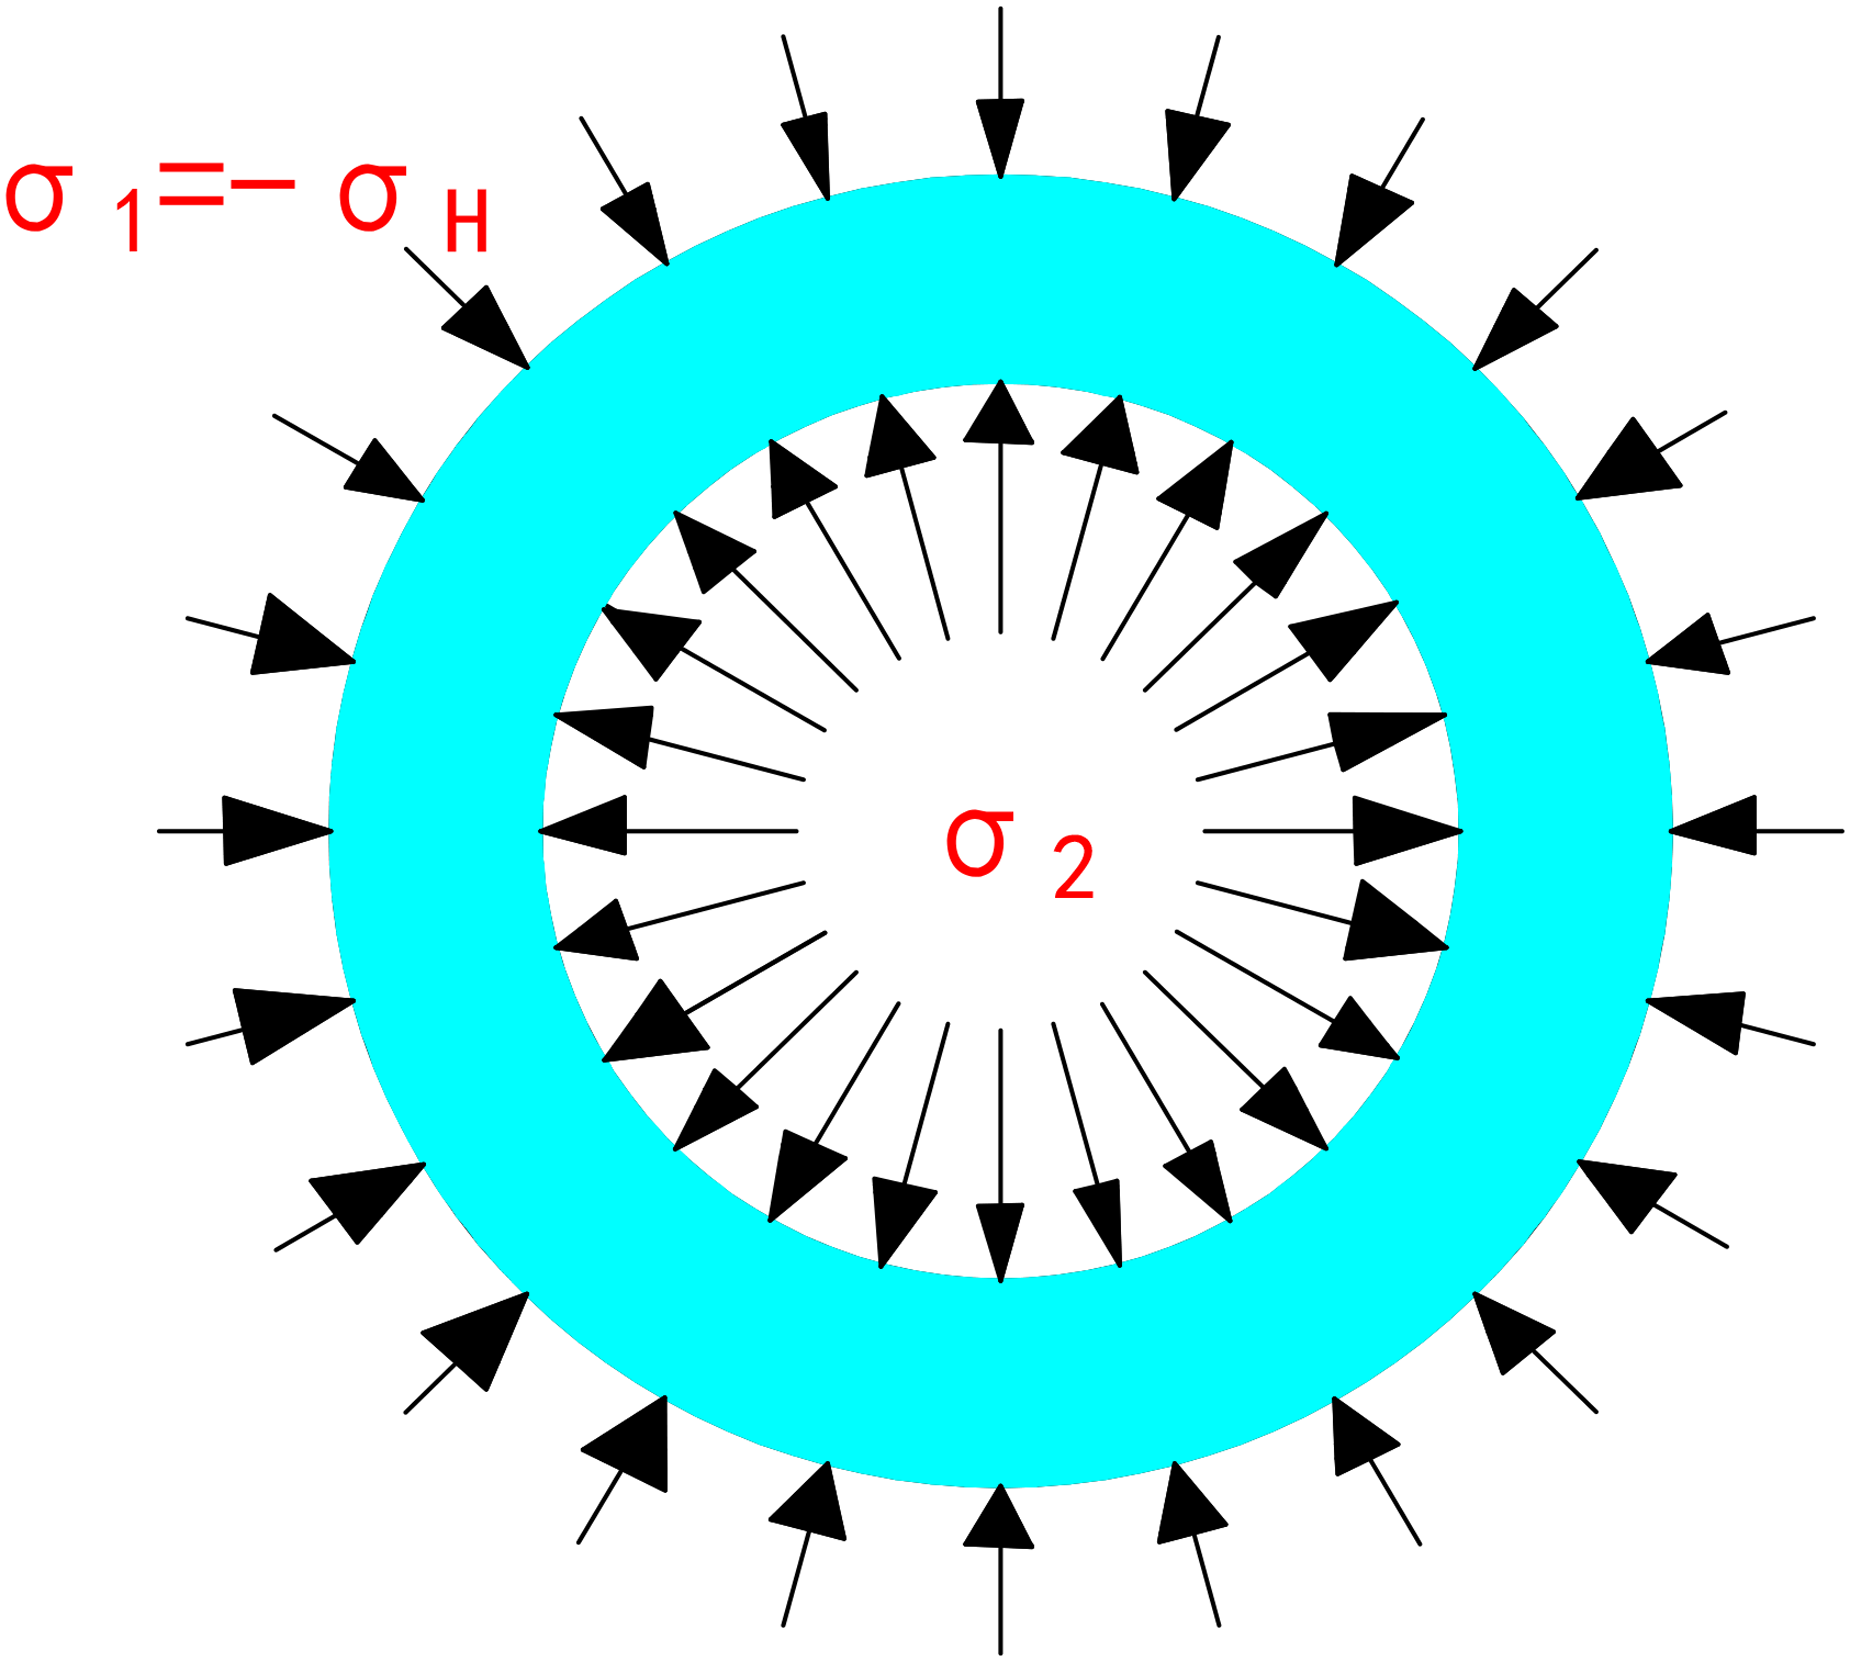
Then, the compression shear stress τW of the shaft subjected to section “Stress analysis of a fault-vertical well overall model” was calculated. The shaft section of the same elevation was subjected to uniform compressive stress σ1, σH was the maximum horizontal compressive principal stress, and the shaft wall was subjected to tensile stress σ2 (Hu et al., 2012; Kurguzov et al., 2015; Xia et al., 2017). The mechanical analysis was established along the horizontal and vertical directions of the shaft (Figures 4 and 5).
Stress field around a borehole.
Well bore compressive-shear stress model.
The expression of the disturbance stress field is as follows, where λ is the load factor:


According to the well bore stability criterion as follows, σN and τN are compression and shear yield stresses, respectively:


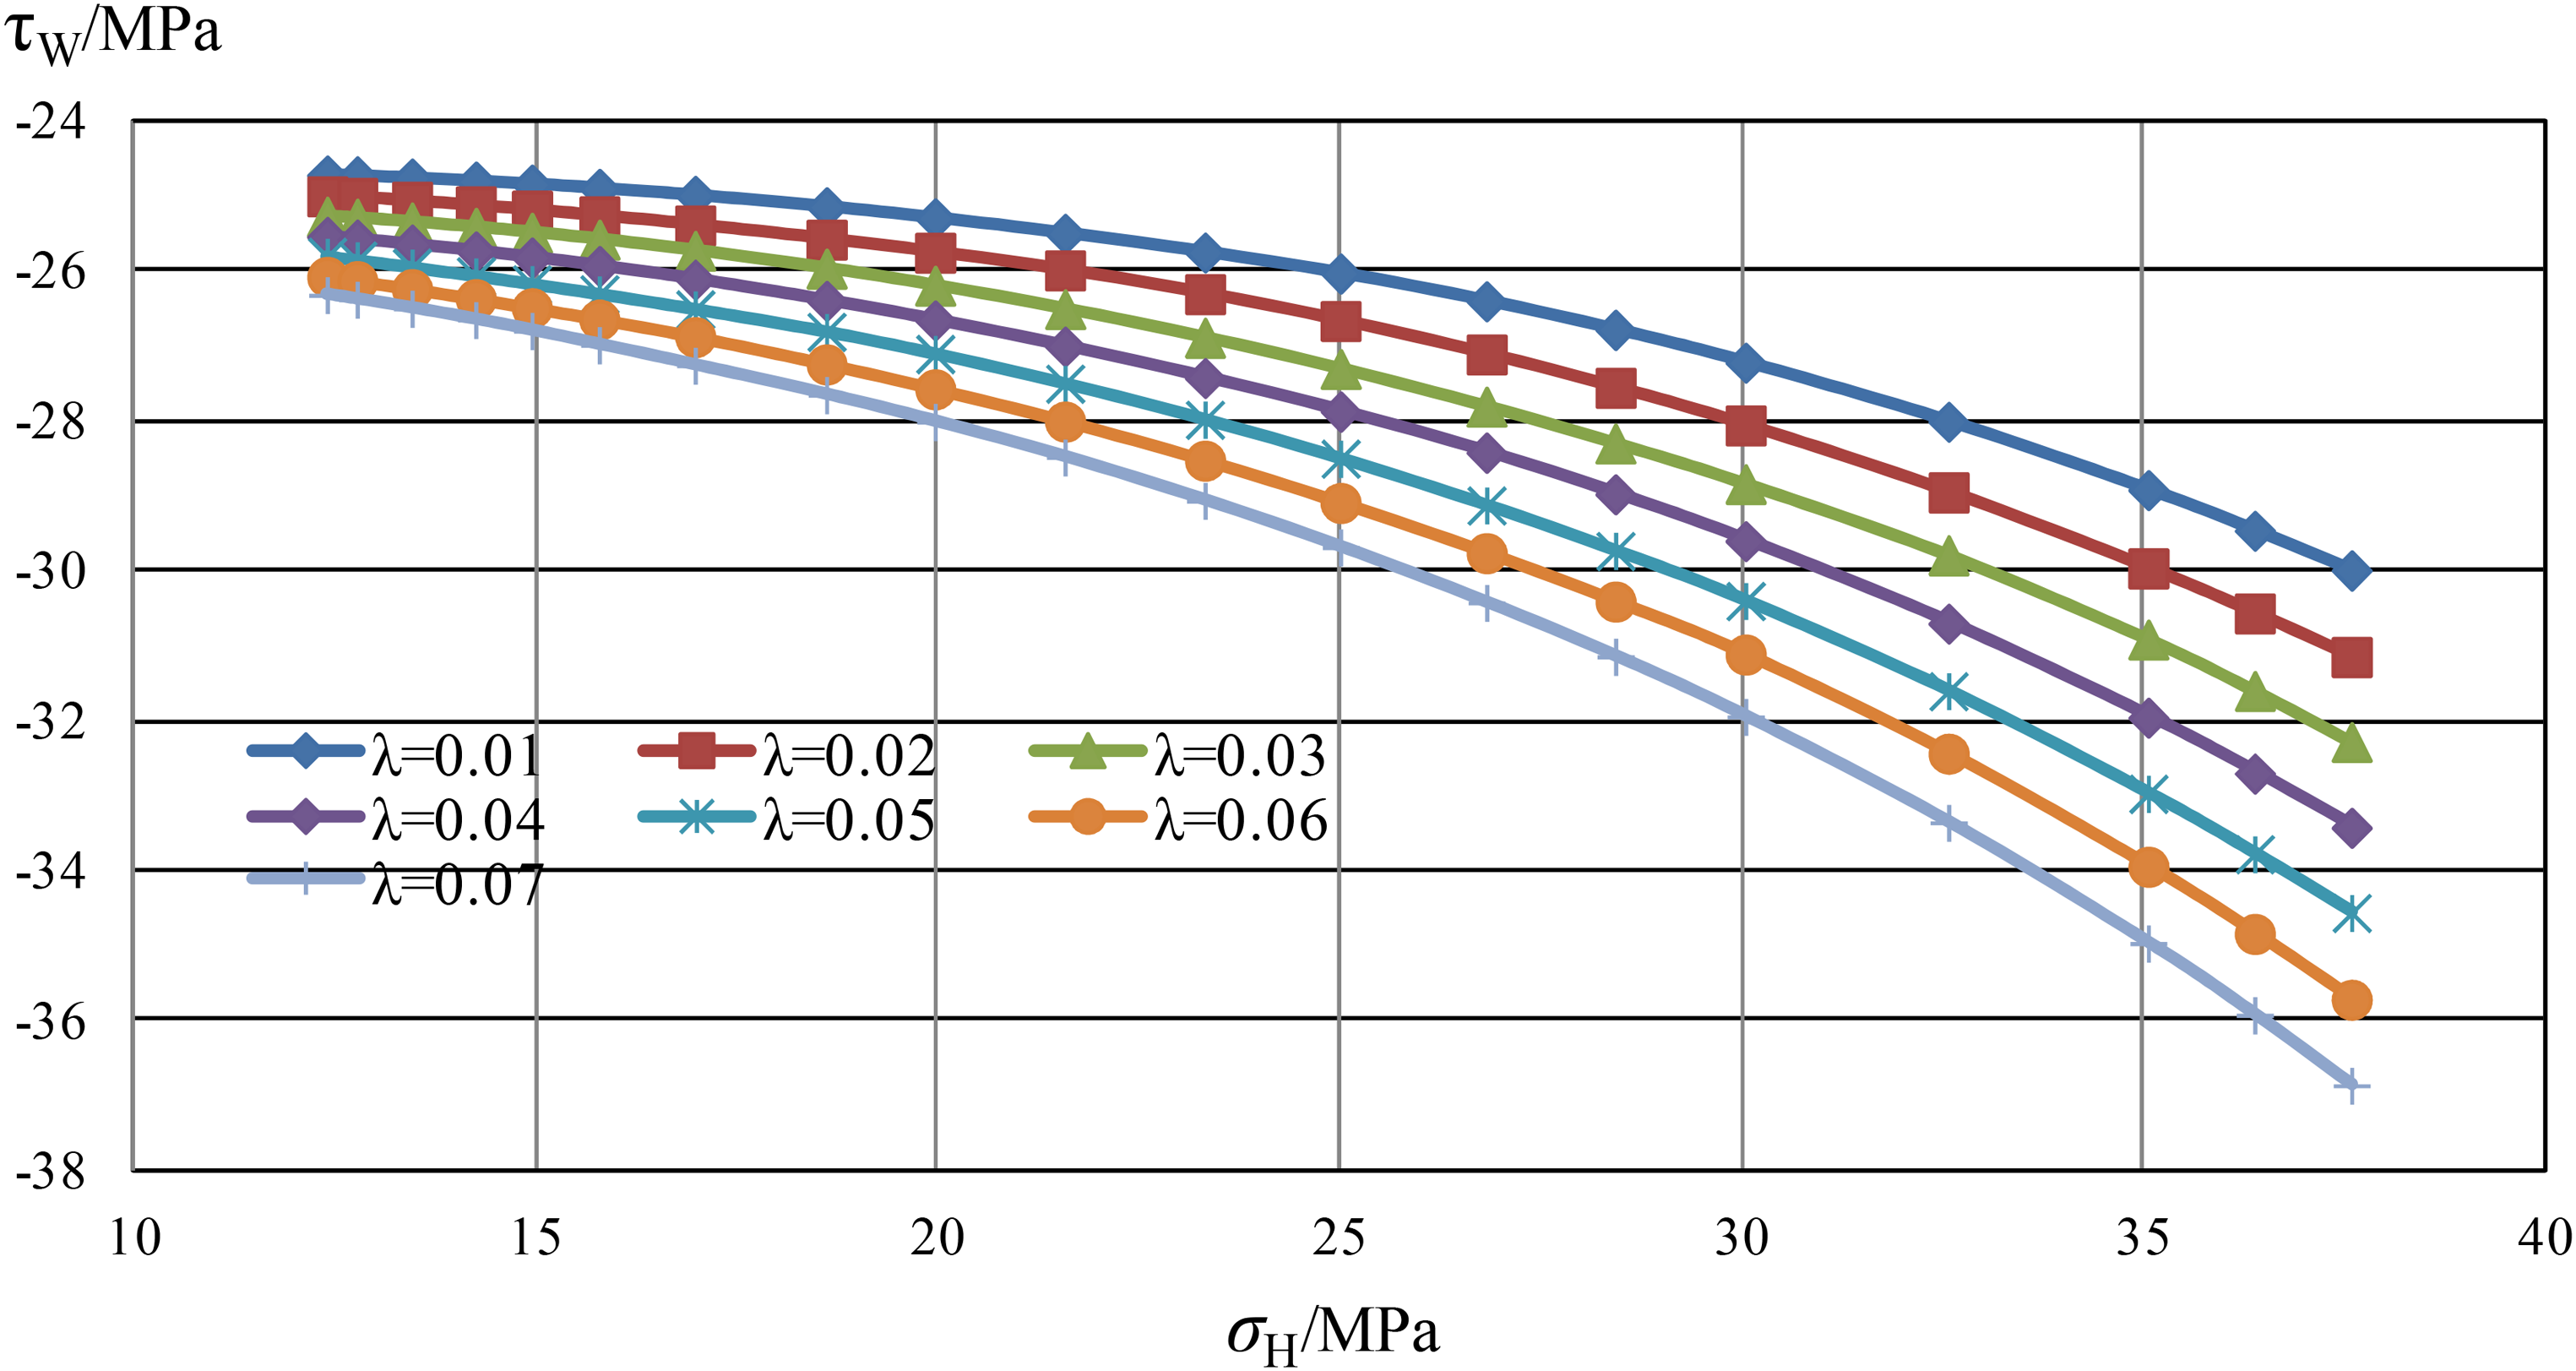
Well bore compression shear stress curve.
Through the above analysis, the magnitude of the compressive shear stress of the well bore is related to the load factor λ and the maximum compressive principal stress σH which is in an increasing relationship.
General idea of numerical simulation
To obtain the dynamic evolution of surface vertical wells in the area near a reverse fault (Li et al., 2011; Zaheri et al., 2020), a numerical simulation scheme was designed to assess a horizontal section along the coal seam (Figure 7). All data were analyzed in the X direction opposite to the mining direction, while the Y direction pointed to and was perpendicular to the mining direction. In detail, taking the 7216 working face as the research object, the coal seam burial depth is 550 m, the dip length of working face is 220 m, and there is a DF1 reverse fault with a drop of 10 m and dip angle of 74° in the working face.
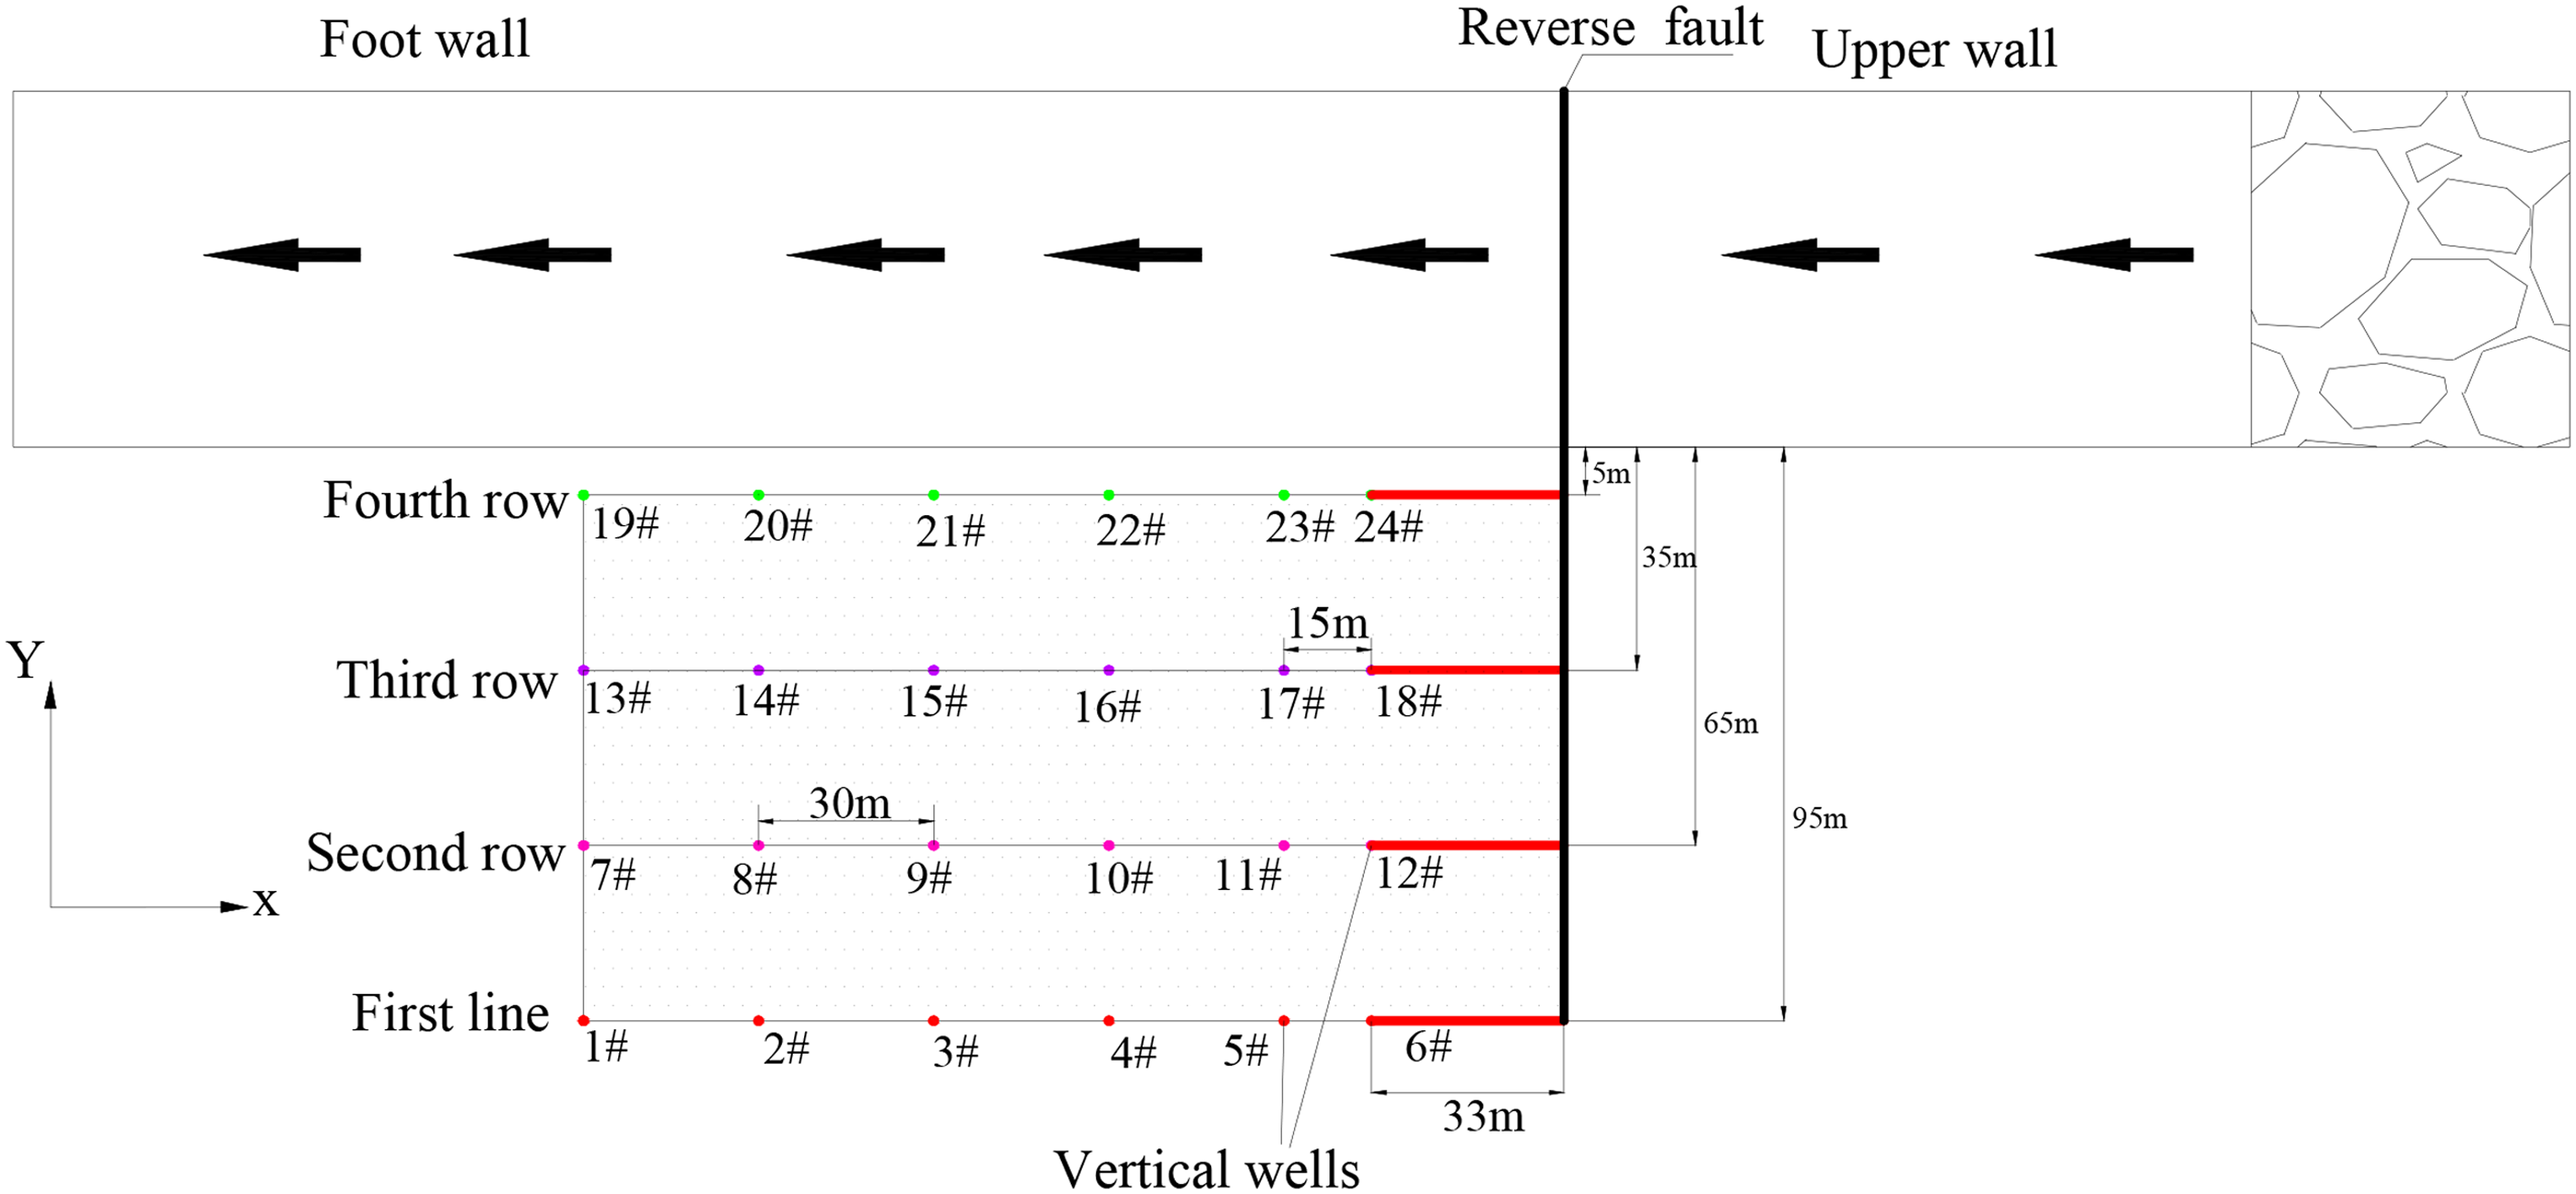
Layout plan of well site.
The horizontal section is made along the contours of floor for the coal seam of the foot-wall of the reverse fault. There are four rows of drilling fields on one side of the working face, and each row of drilling fields has a total of six holes, the distance between the 24#, 18#, 12#, and 6# vertical wells and the fault was 33 m, 17#, 11#, and 5# and holes 24#, 18#, 12#, and 6# was set to 15 m, and the remaining distance was 30 m.
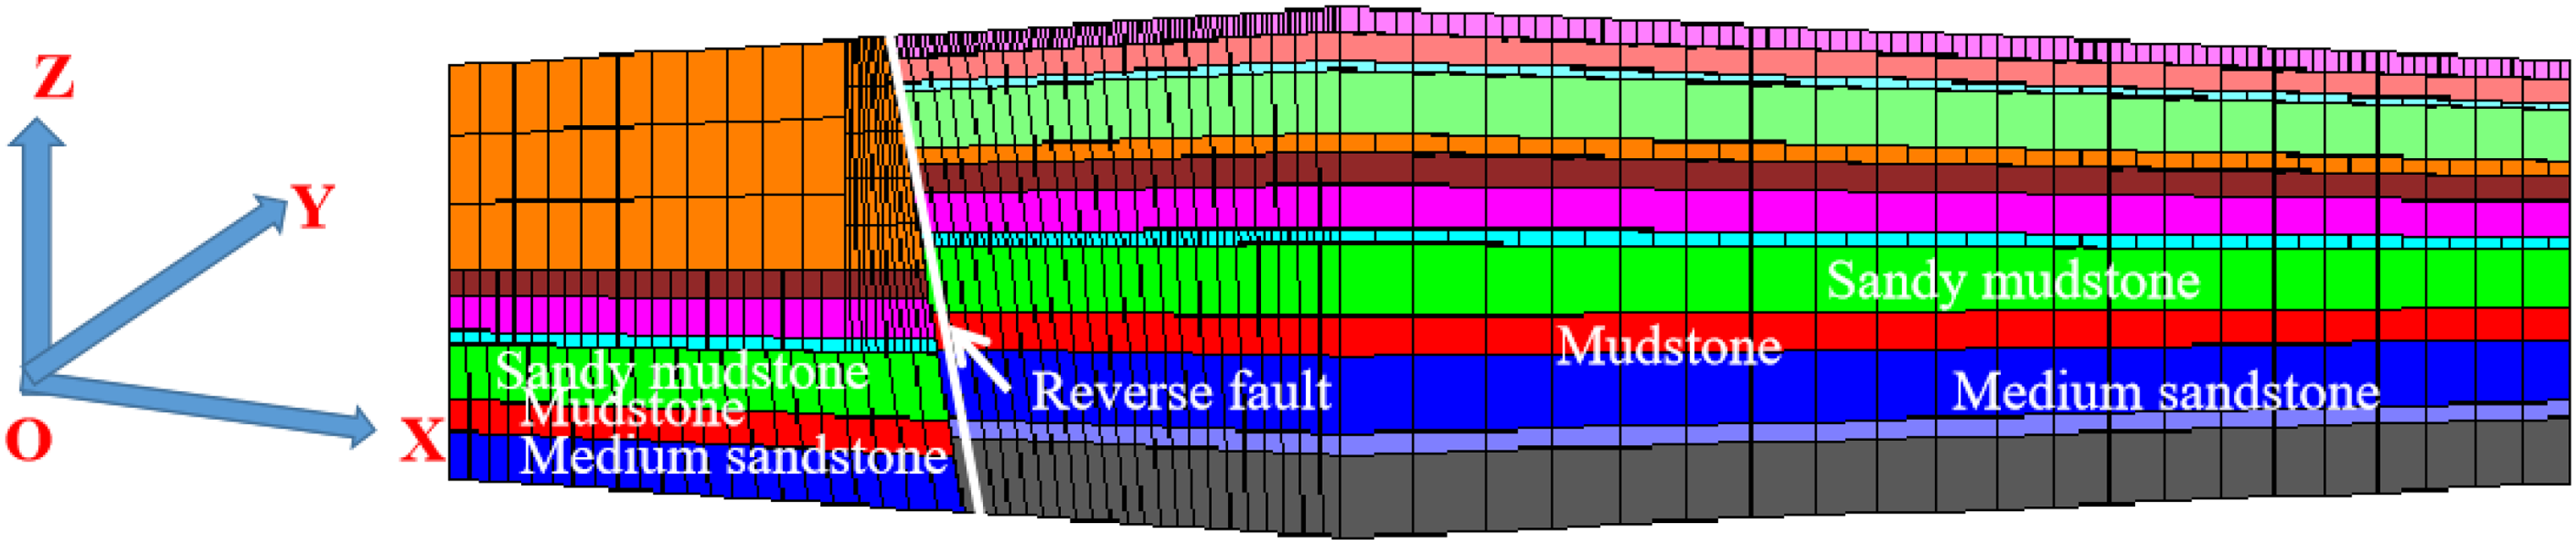
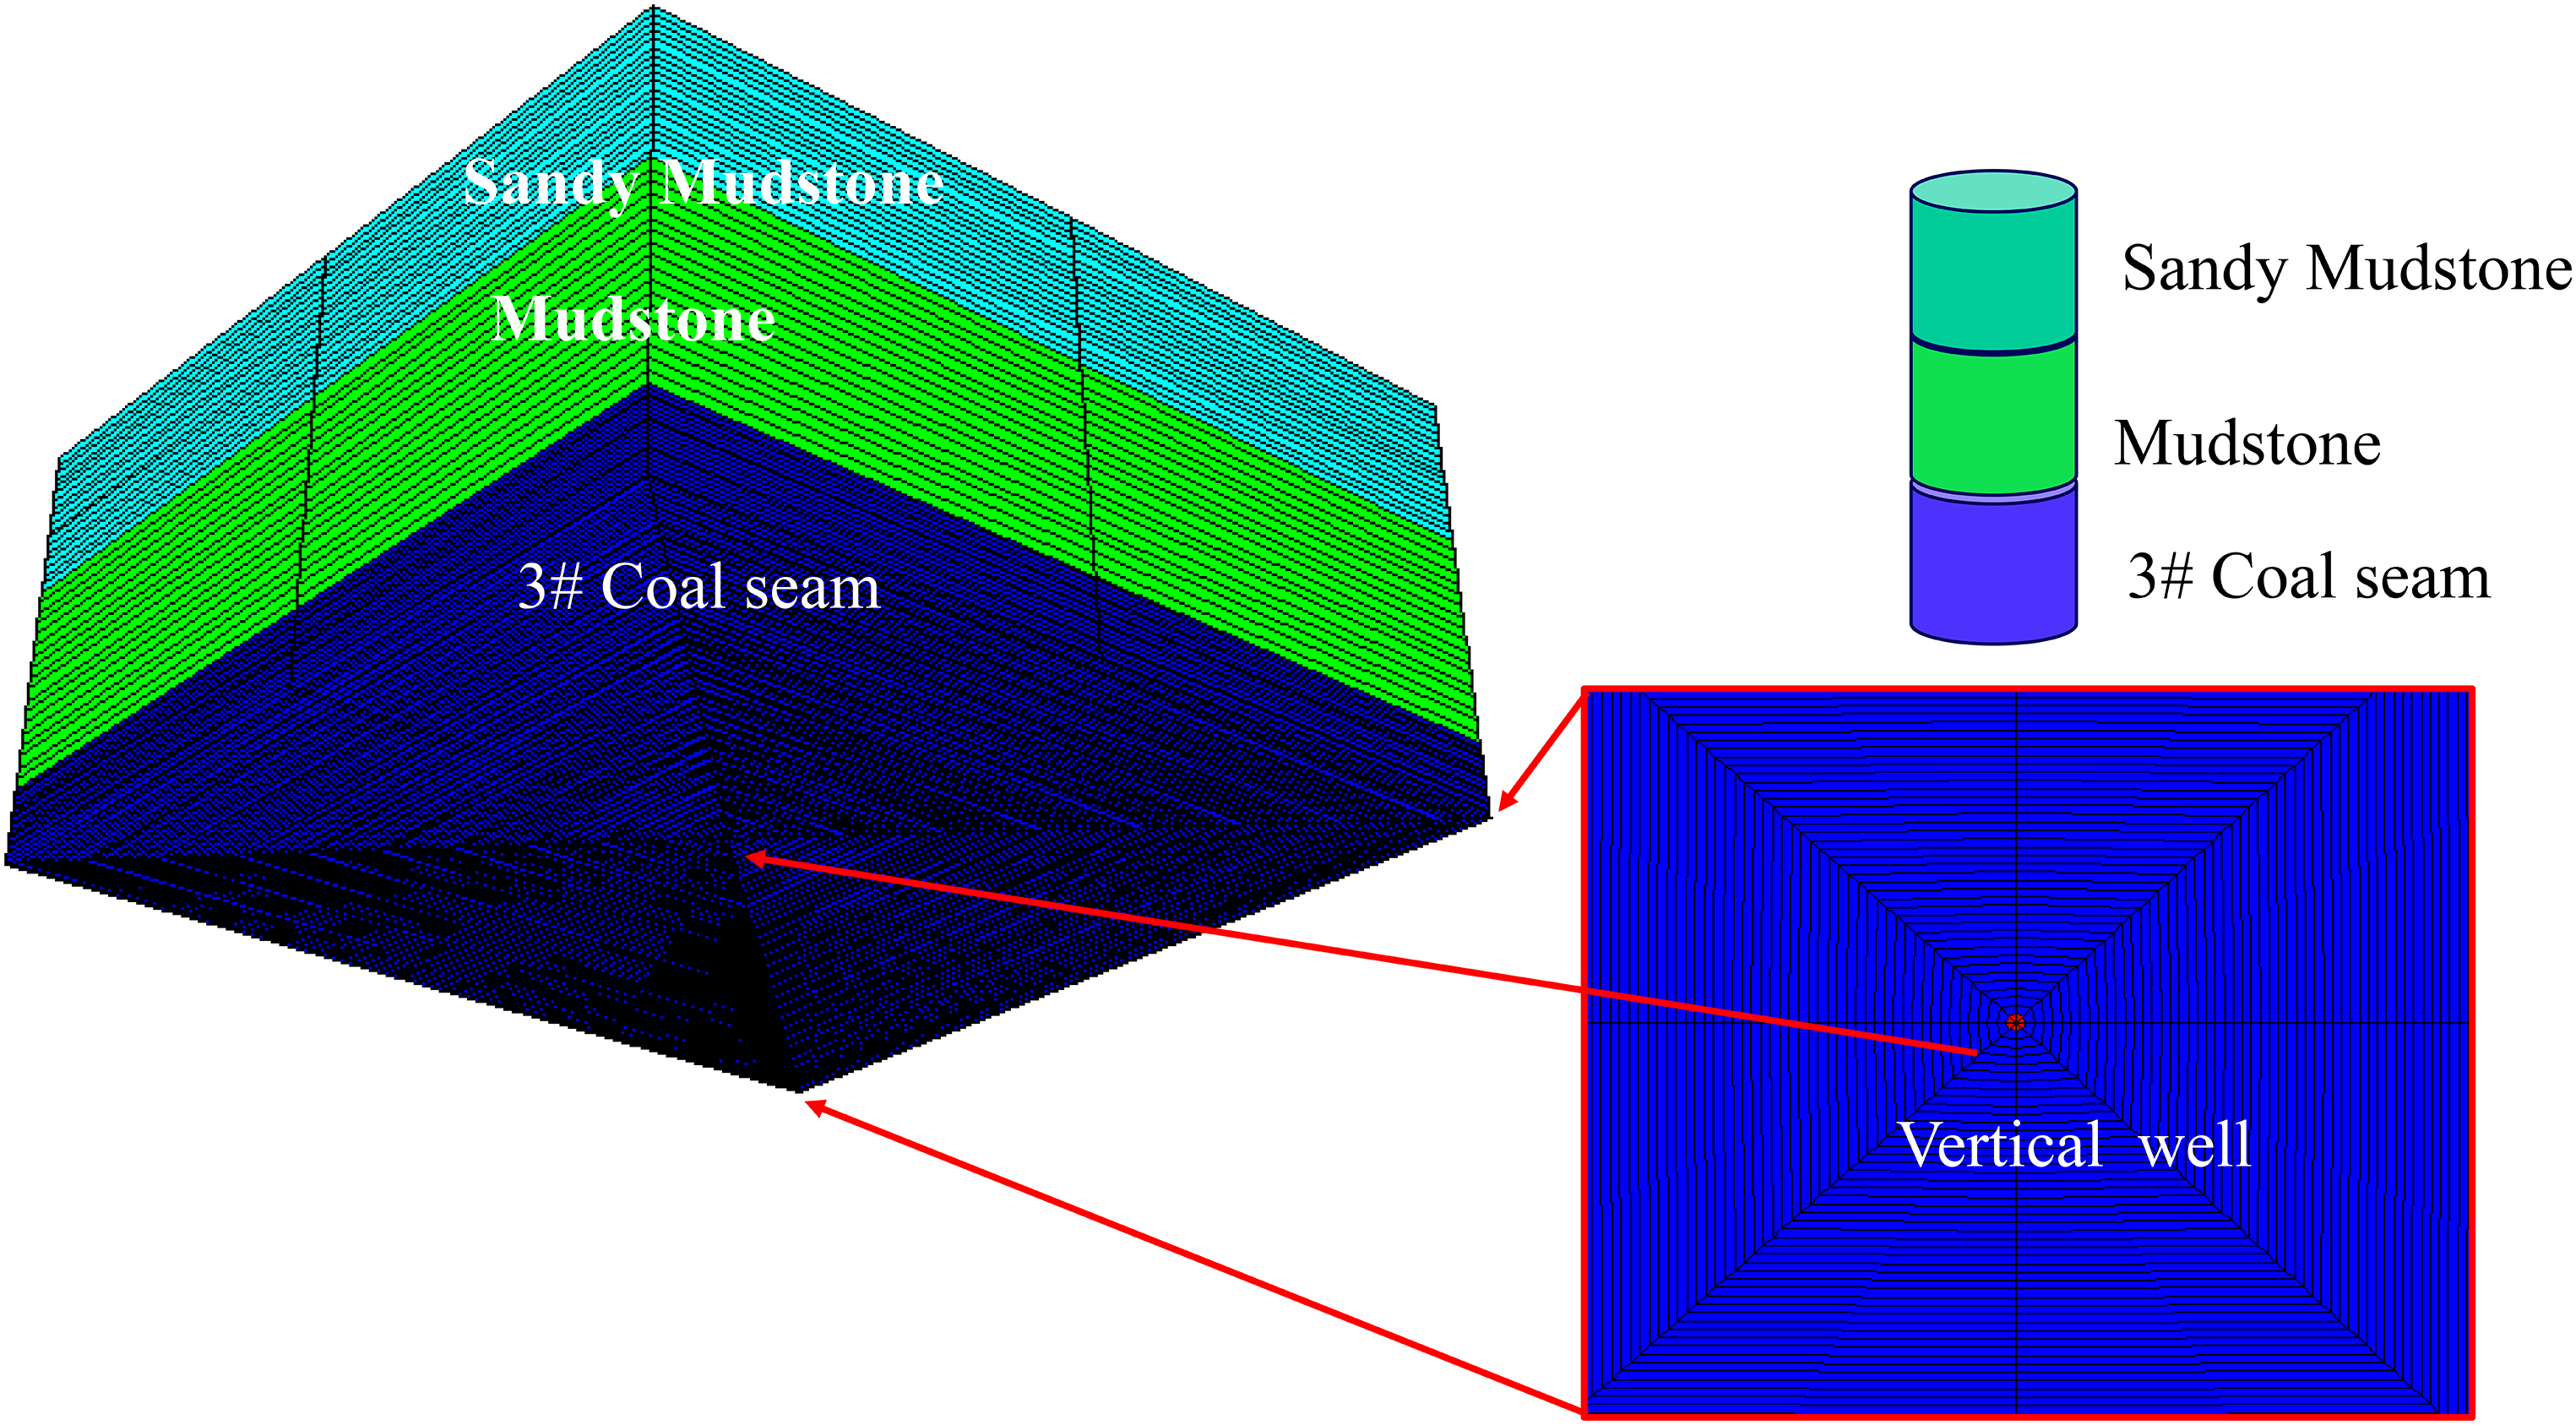
In view of the layout plan of the well site, a three-dimensional numerical calculation model was established with the help of FLAC3D software and combined with the actual geological data on site (Figure 8). Also, vertical well unit was taken for lithological analysis (Figure 9).
Numerical calculation model.
Lithology in borehole unit.
The horizontal displacement of the left and right boundaries of the model was set to 0, and the vertical displacement of the bottom boundary was set to 0. The initial value of the overlying strata at the top of the model was set to −11.82 MPa according to the actual burial depth of the coal seam, and the Mohr-Coulomb criterion was adopted to model the yielding of coal and rock mass materials.
To analyze the borehole dynamics under slip shear condition of reverse fault, an interface command must be used to simulate the contact surface.
The numerical calculation steps are as follows: (1) To conduct the drilling and cementing process of vertical wells 19# to 24#, the diameter of each well hole is 320 mm. In addition, to ensure the consistency of drilling and cementing with the actual situation on site, the lining shooting was implemented immediately after the excavation of the borehole unit in the model shown in Figure 9. The lining shooting was realized by way of the Shell ID command in FLAC3D; (2) Mining the working face of the DF1 fault at 57.97 m; (3) 171.2 m of working face was mined after crossing the fault until it was 15.71 m from the left model boundary; (4) To avoid the influence of the six holes in the front row on the rear holes, the drilling and cementing procedures of 13# to 18#, 7# to 12#, and 1# to 6# wells were conducted, respectively, for the original model, and steps (1) to (3) were repeated.
Analysis of numerical calculation results
Distribution of superimposed stress σa
In Figure 2, the superimposed stress σA is equal to the lateral supporting stress and SZZ superimposed (Xu et al., 2012; Zhu, 2011), which is crucial to the solution of well bore compressive-shear stress fields in the mechanical model. The mechanical analysis model was further established as shown in Figure 10, taking vertical wells 19# to 24# as an example for analysis (taking Y = 95 m as a section). The linear segment 30 m from the fault side was used as the monitoring line, and the numerical fitting analysis of superimposed stress σA was conducted within 150 m of working face mining and 650 m from the fault.
Superimposed σA stress analysis model on a monitoring line.
Taking the 3# coal seam along the strike center line (Figure 11), we take the 150-m mining face as an example for trend-line analysis. The trend-line equation is similar to the logarithmic equation, and the shape is as follows: within 200 m of the mining face, the distance increases with the increase of the distance from the fault. After 200 m of mining, it gradually tends to 15.25 MPa.
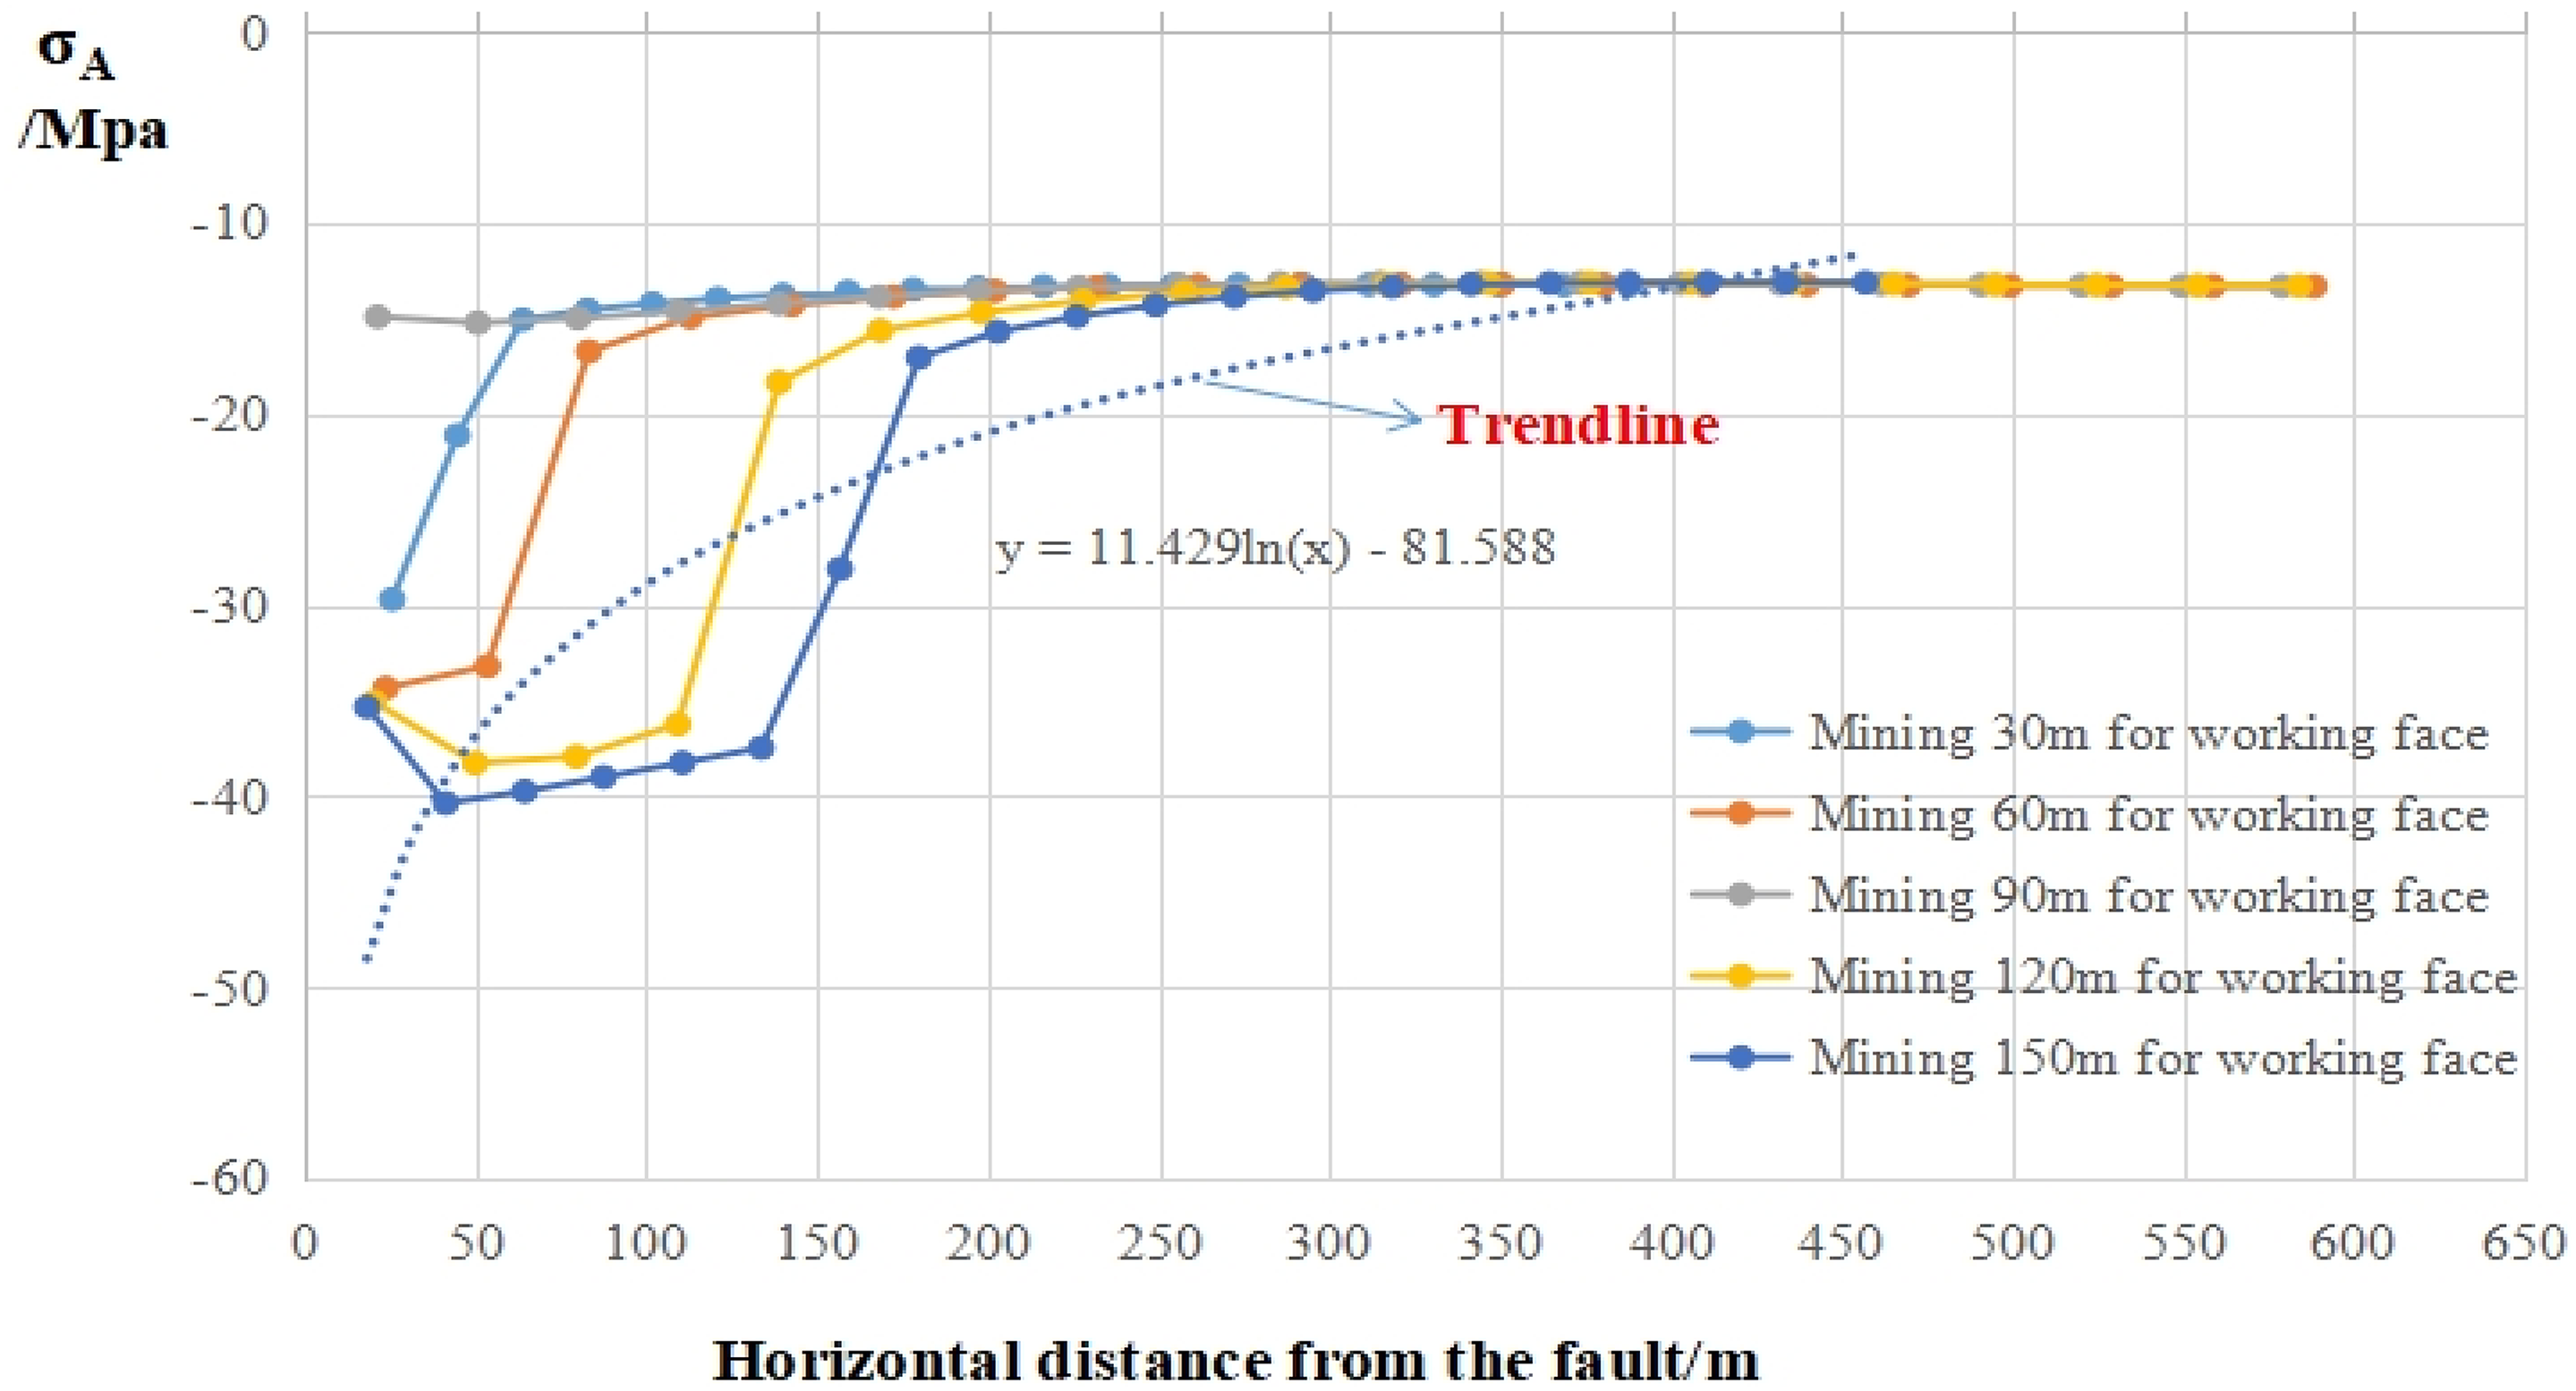
Relationship between σA and horizontal distance from reverse fault.
In summary, the value of superimposed stress σA is an expression that has a logarithmic relationship with the distance between faults.
Vertical well displacement variation curve of fault slip shear
Fault slippage occurs under the disturbance of working face mining (Wang et al., 2022; Yu et al., 2018; Zhang et al., 2021). It is set to mine 30 and 57.97 m from the hanging wall of the fault first, and then mining through the fault, with 30 m as the mining step and 171.2 m as the stopping line of the foot-wall working face. At the same time, to make the study more representative, the burial depth of the coal seam is set to 1500 m, which increases the original rock stress and superimposed vertical stress σA. Also, the data analysis of the displacement field at the coal-mud stone boundary (Z = 31.8 m) is selected.
Vertical well displacement curves are shown in Figures 12–14, respectively: XDISP, YDISP, and ZDISP data were analyzed, respectively.
Analysis of XDISP data
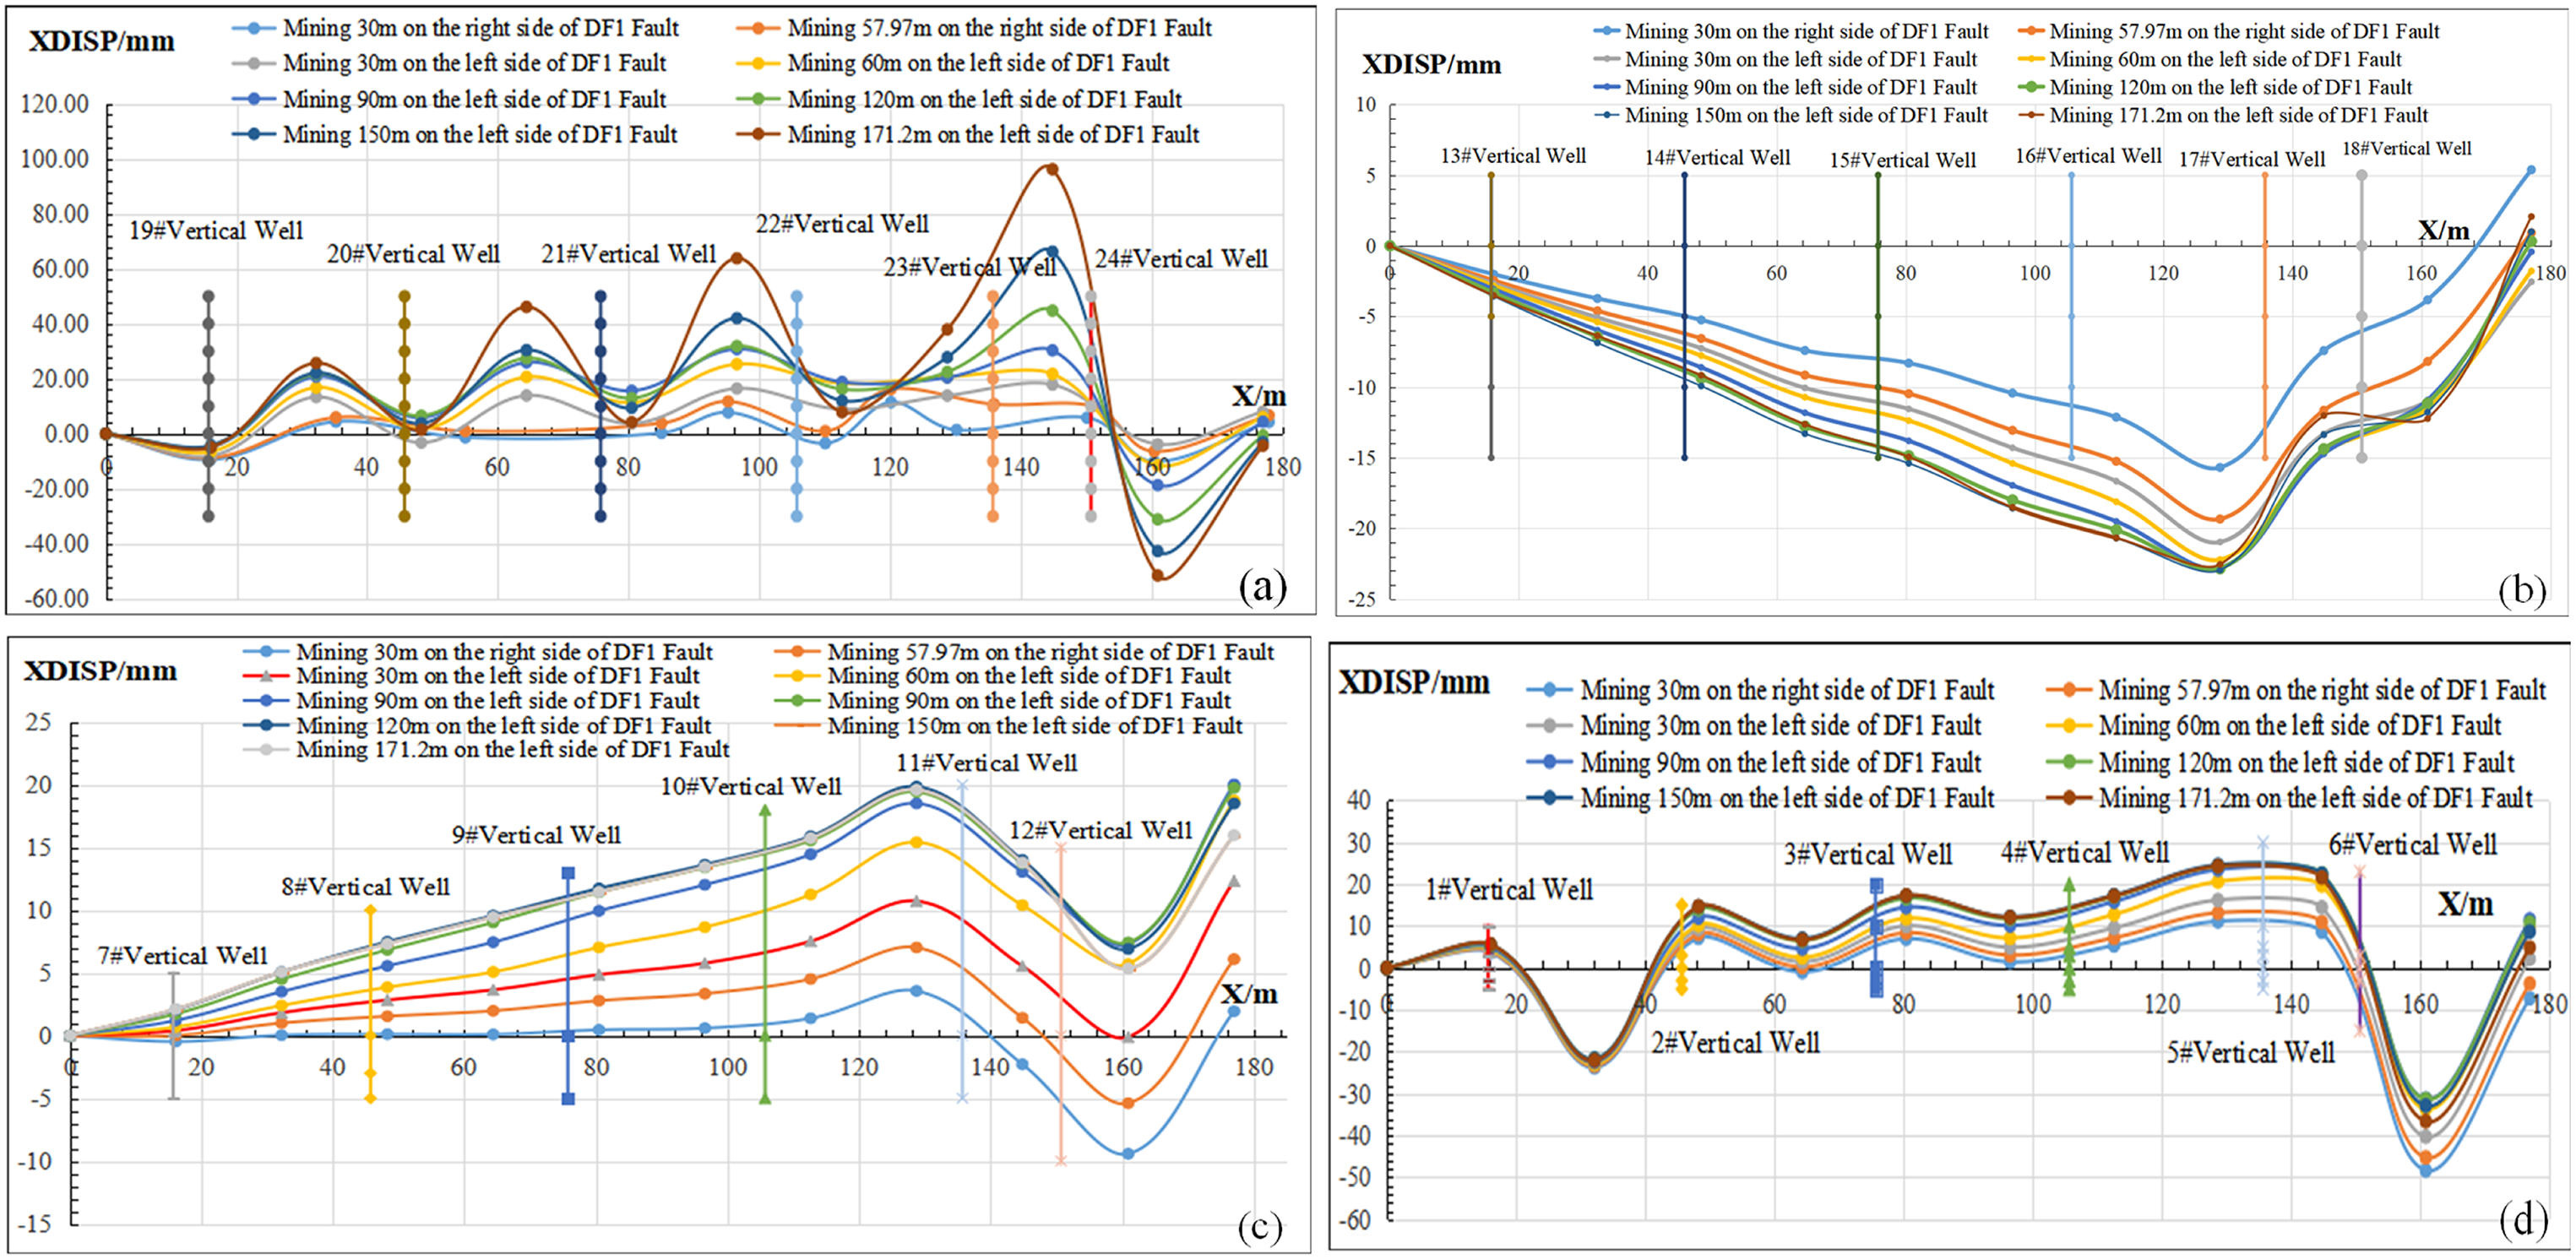
Variation curve of XDISP. (a) Variation rule of XDISP in vertical well 19# to 24#. (b) Variation rule of XDISP in vertical well 13# to 18#. (c) Variation rule of XDISP in vertical well 7# to 12#. (d) Variation rule of XDISP in vertical well 1# to 6#.
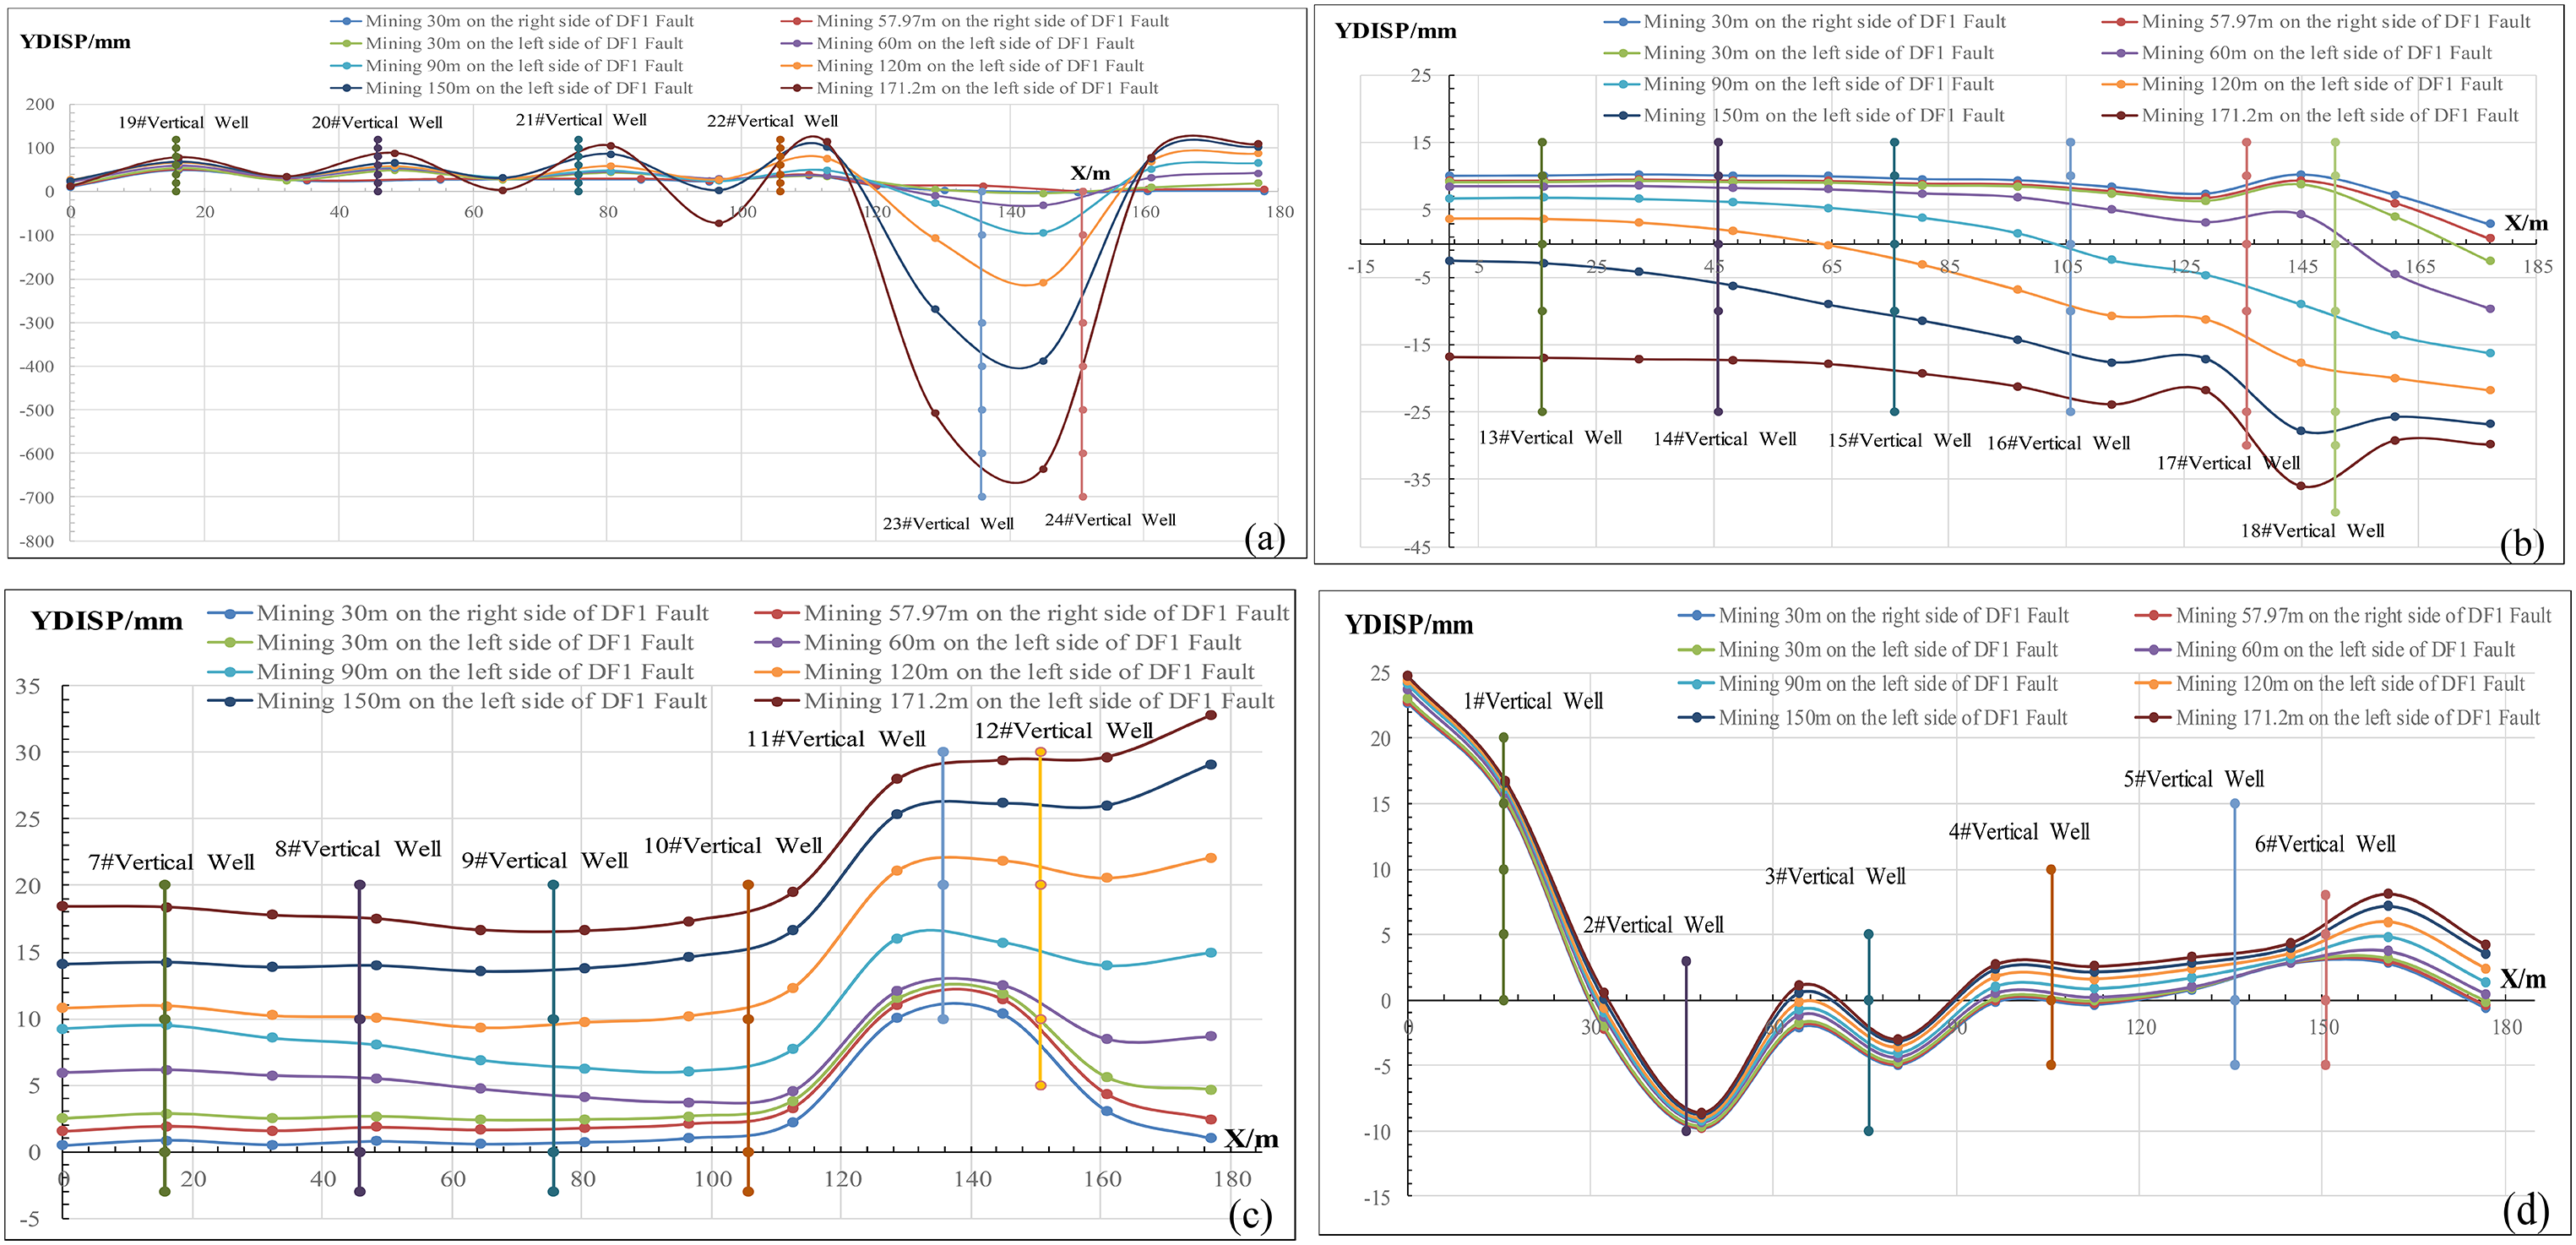
Variation curve of YDISP. (a) Variation rule of YDISP in vertical well 19# to 24#. (b) Variation rule of YDISP in vertical well 13# to 18#. (c) Variation rule of YDISP in vertical well 7# to 12#. (d) Variation rule of YDISP in vertical well 1# to 6#.
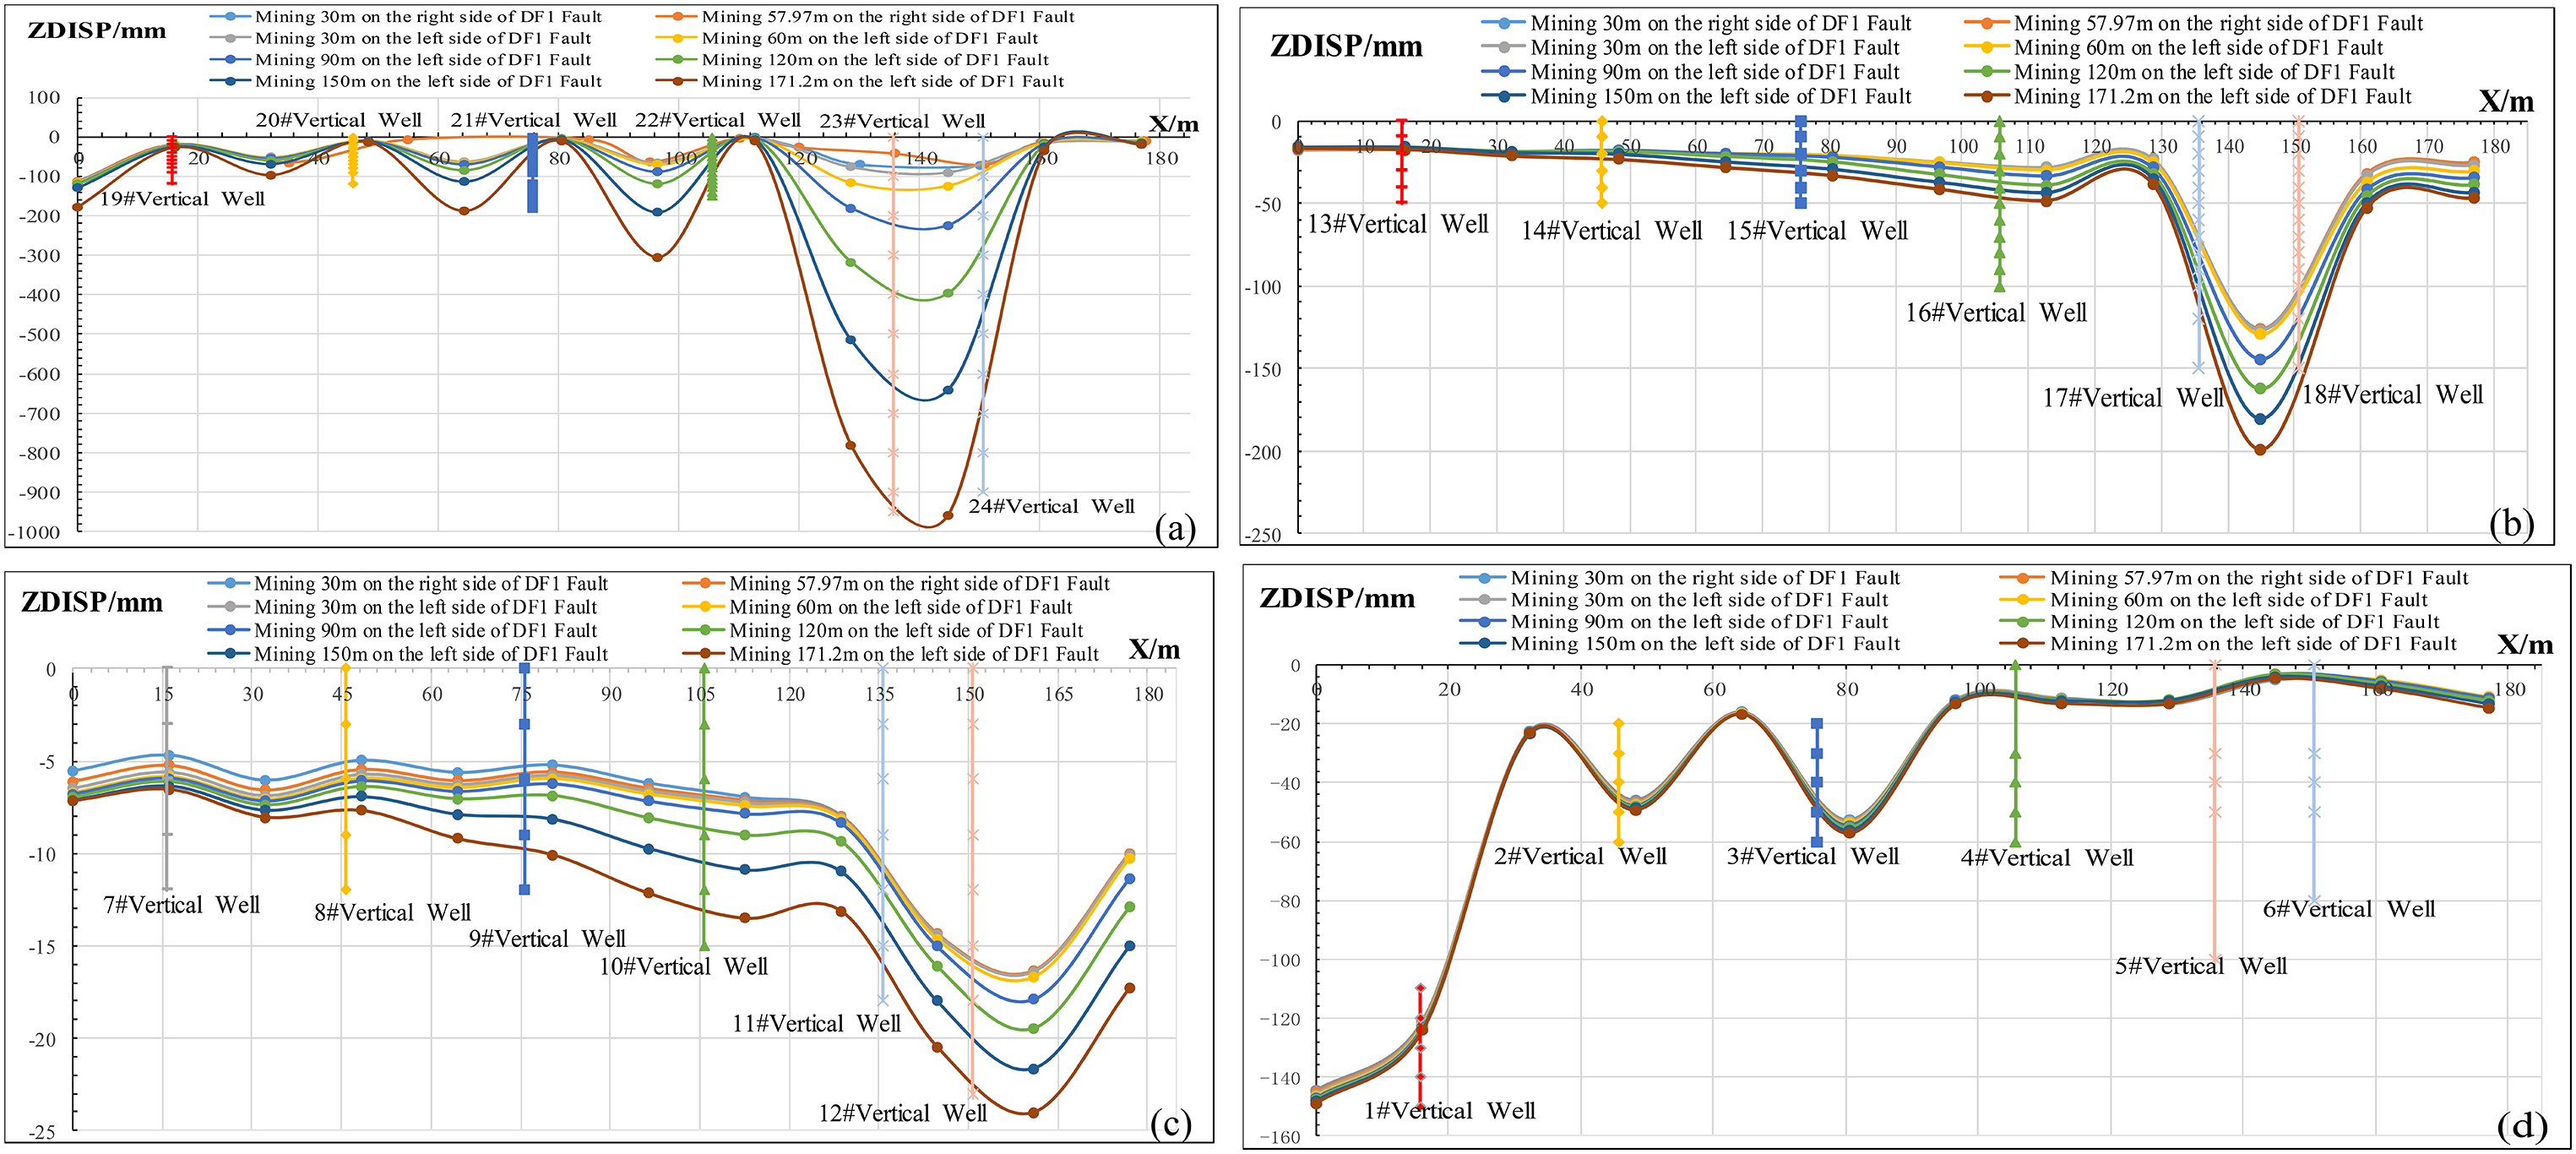
Variation curve of ZDISP. (a) Variation rule of ZDISP in vertical well 19# to 24#. (b) Variation rule of ZDISP in vertical well 13# to 18#. (c) Variation rule of ZDISP in vertical well 7# to 12#. (d)Variation rule of ZDISP in vertical well 1# to 6#.
The vertical well XDISP is larger when approaching the reverse fault, and the peak values are −51.546, −22.547, −9.420, and −48.310 mm, respectively. XDISP increases gradually as the advance length of the working face increases. The peak deformations of the vertical wells closest to the thrust fault are 96.200, −22.547, 19.594, and 21.600 mm, respectively, which are higher than those of the other holes. In addition, the displacements of the 1# to 6# vertical wells which are 95 m from the working face change slowly, indicating they are unaffected by fault slip and mining.
Analysis of YDISP data Analysis of ZDISP data
According to Figures 15(a) to (d), the smaller the distance between vertical well and fault, the larger the value of YDIS. With the increase of recommended length of working face, YDISP increases, and the peak value tends to form between two holes adjacent to the fault, with the peak values of −636.599, −36.000, and 29.453 mm, respectively. The range of variation of YDISP values with distance from fault is smaller than that of XDISP.
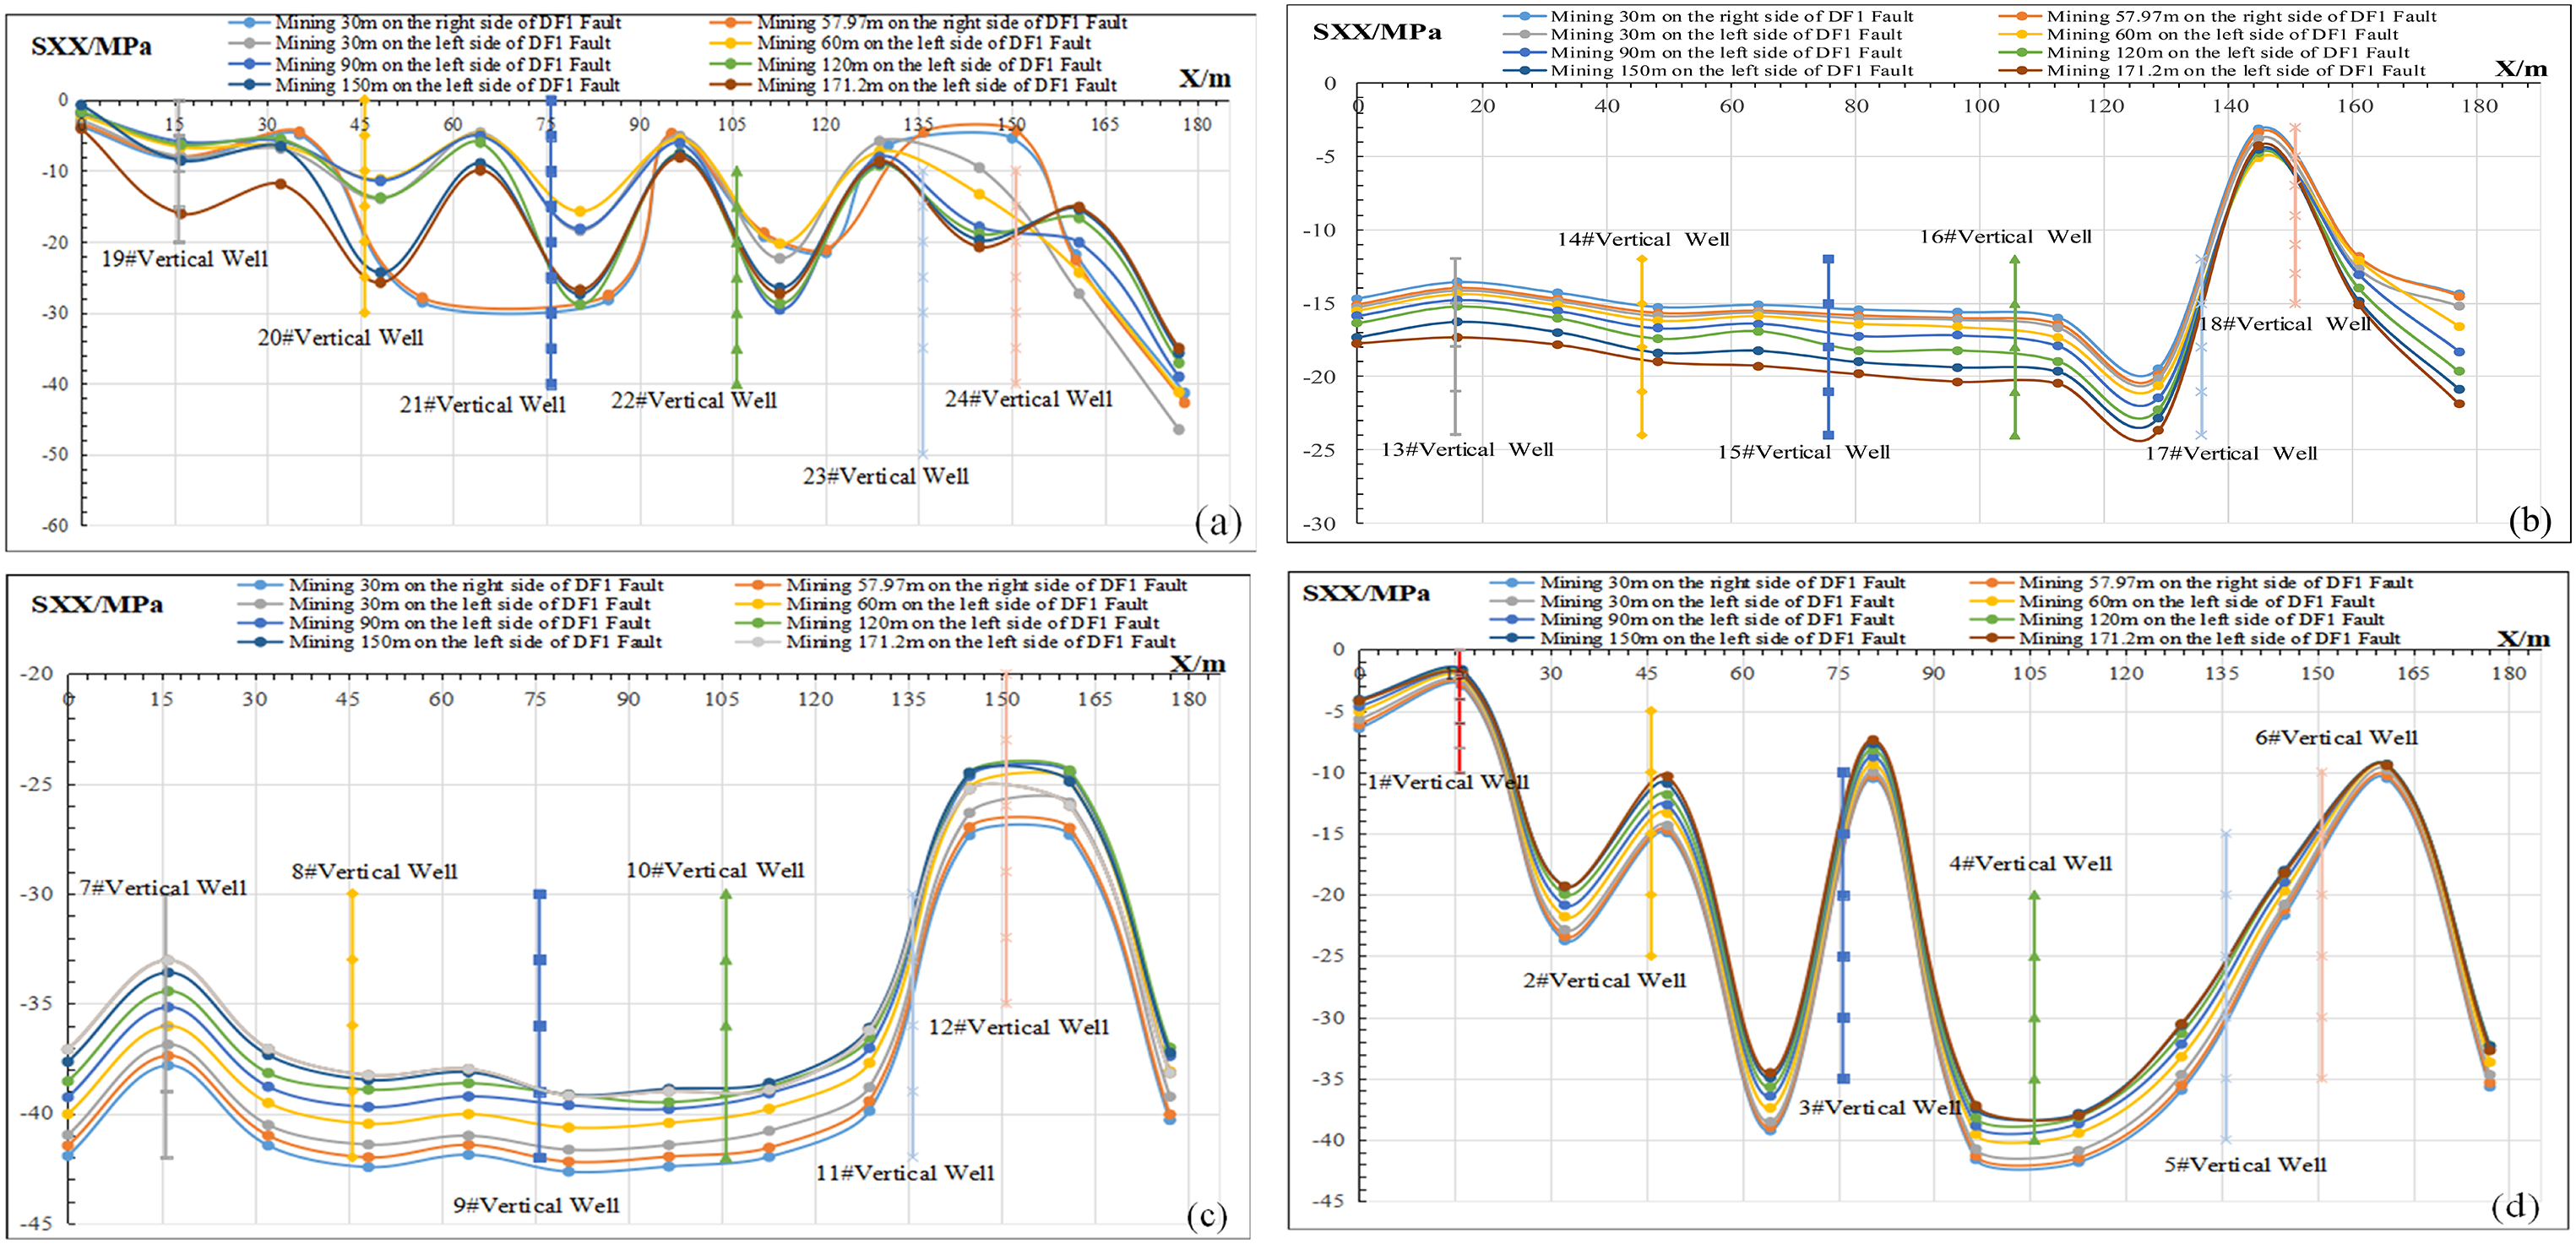
Variation curve of SXX. (a) Variation rule of SXX in vertical well 19# to 24#.(b) Variation rule of SXX in vertical well 13# to 18#. (c) Variation rule of SXX in vertical well 7# to 12#. (d) Variation rule of SXX in vertical well 1# to 6#.
The variation pattern of ZDISP is similar to that of YDISP, but the peak value between the two holes adjacent to the fault is larger at −958.289, −199.262, and −23 mm, respectively, and the direction of these deformations changes gradually.
In conclusion, the range of variation of borehole displacements influenced by reverse fault and mining is 114.24–129.24 m in the X-direction and 80–95 m in the Y-direction, and the sensitivity is such that XDISP > ZDISP > YDISP.
Normal stress changes along the vertical well in fault slip shear
With the data collection method in section “Vertical well displacement variation curve of fault slip shear,” further analysis of the changes in SXX, SYY, and SZZ was undertaken as shown in Figures 15–17.
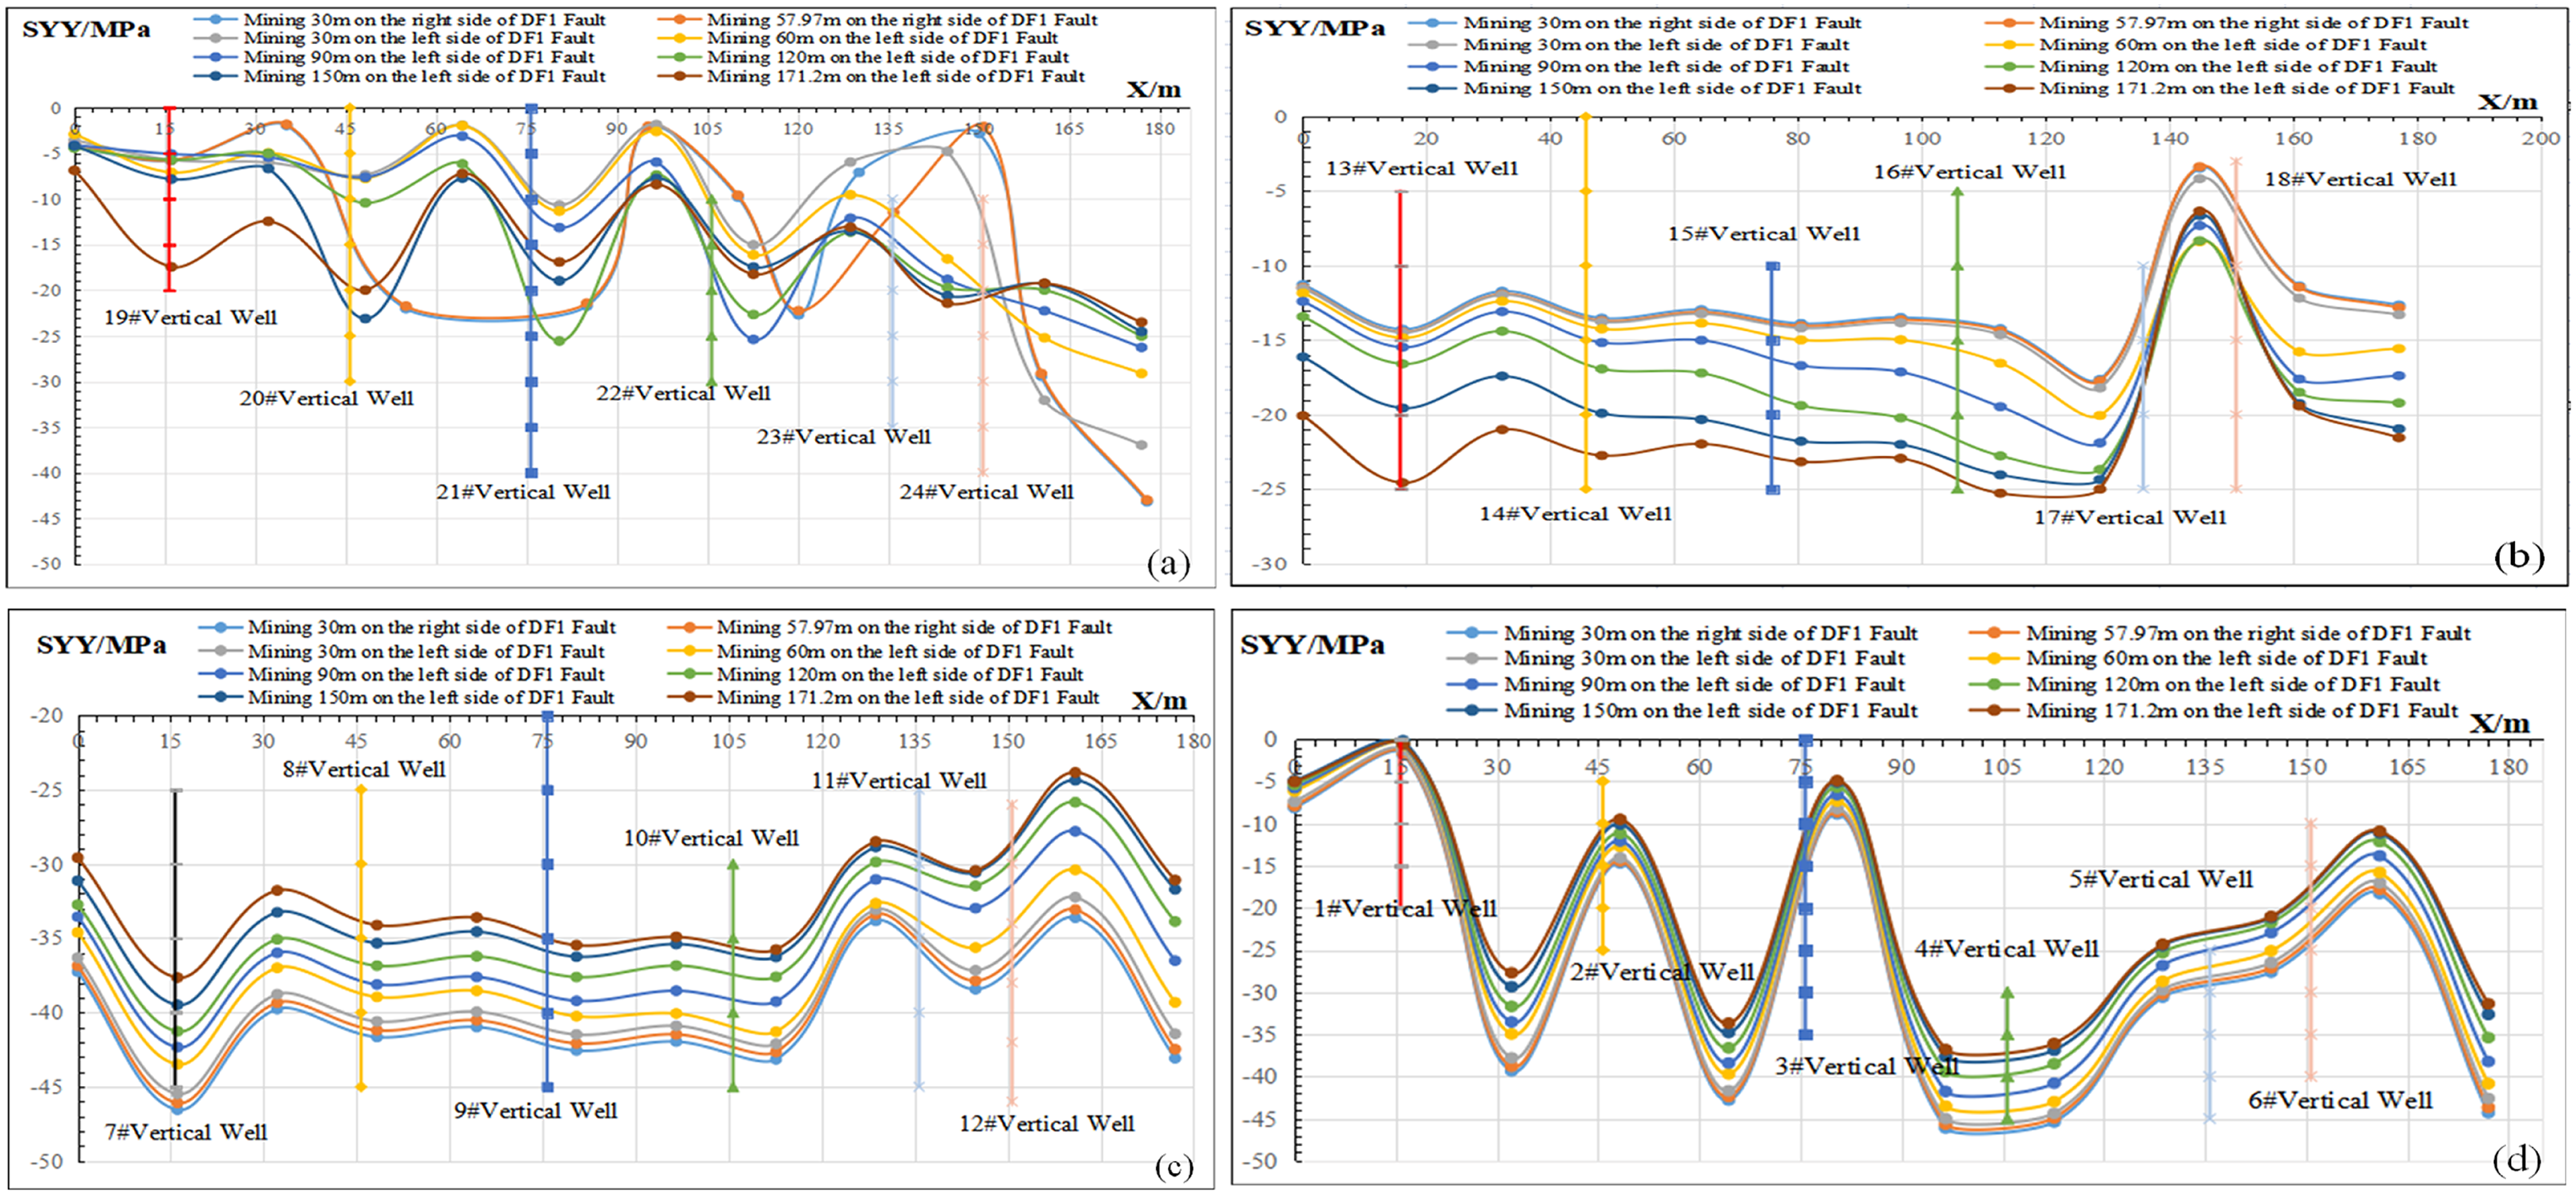
Variation curve of SYY. (a) Variation rule of SYY in vertical well 19# to 24#. (b) Variation rule of SYY in vertical well 13# to 18#. (c) Variation rule of SYY in vertical well 7# to 12#. (d) Variation rule of SYY in vertical well 1# to 6#.
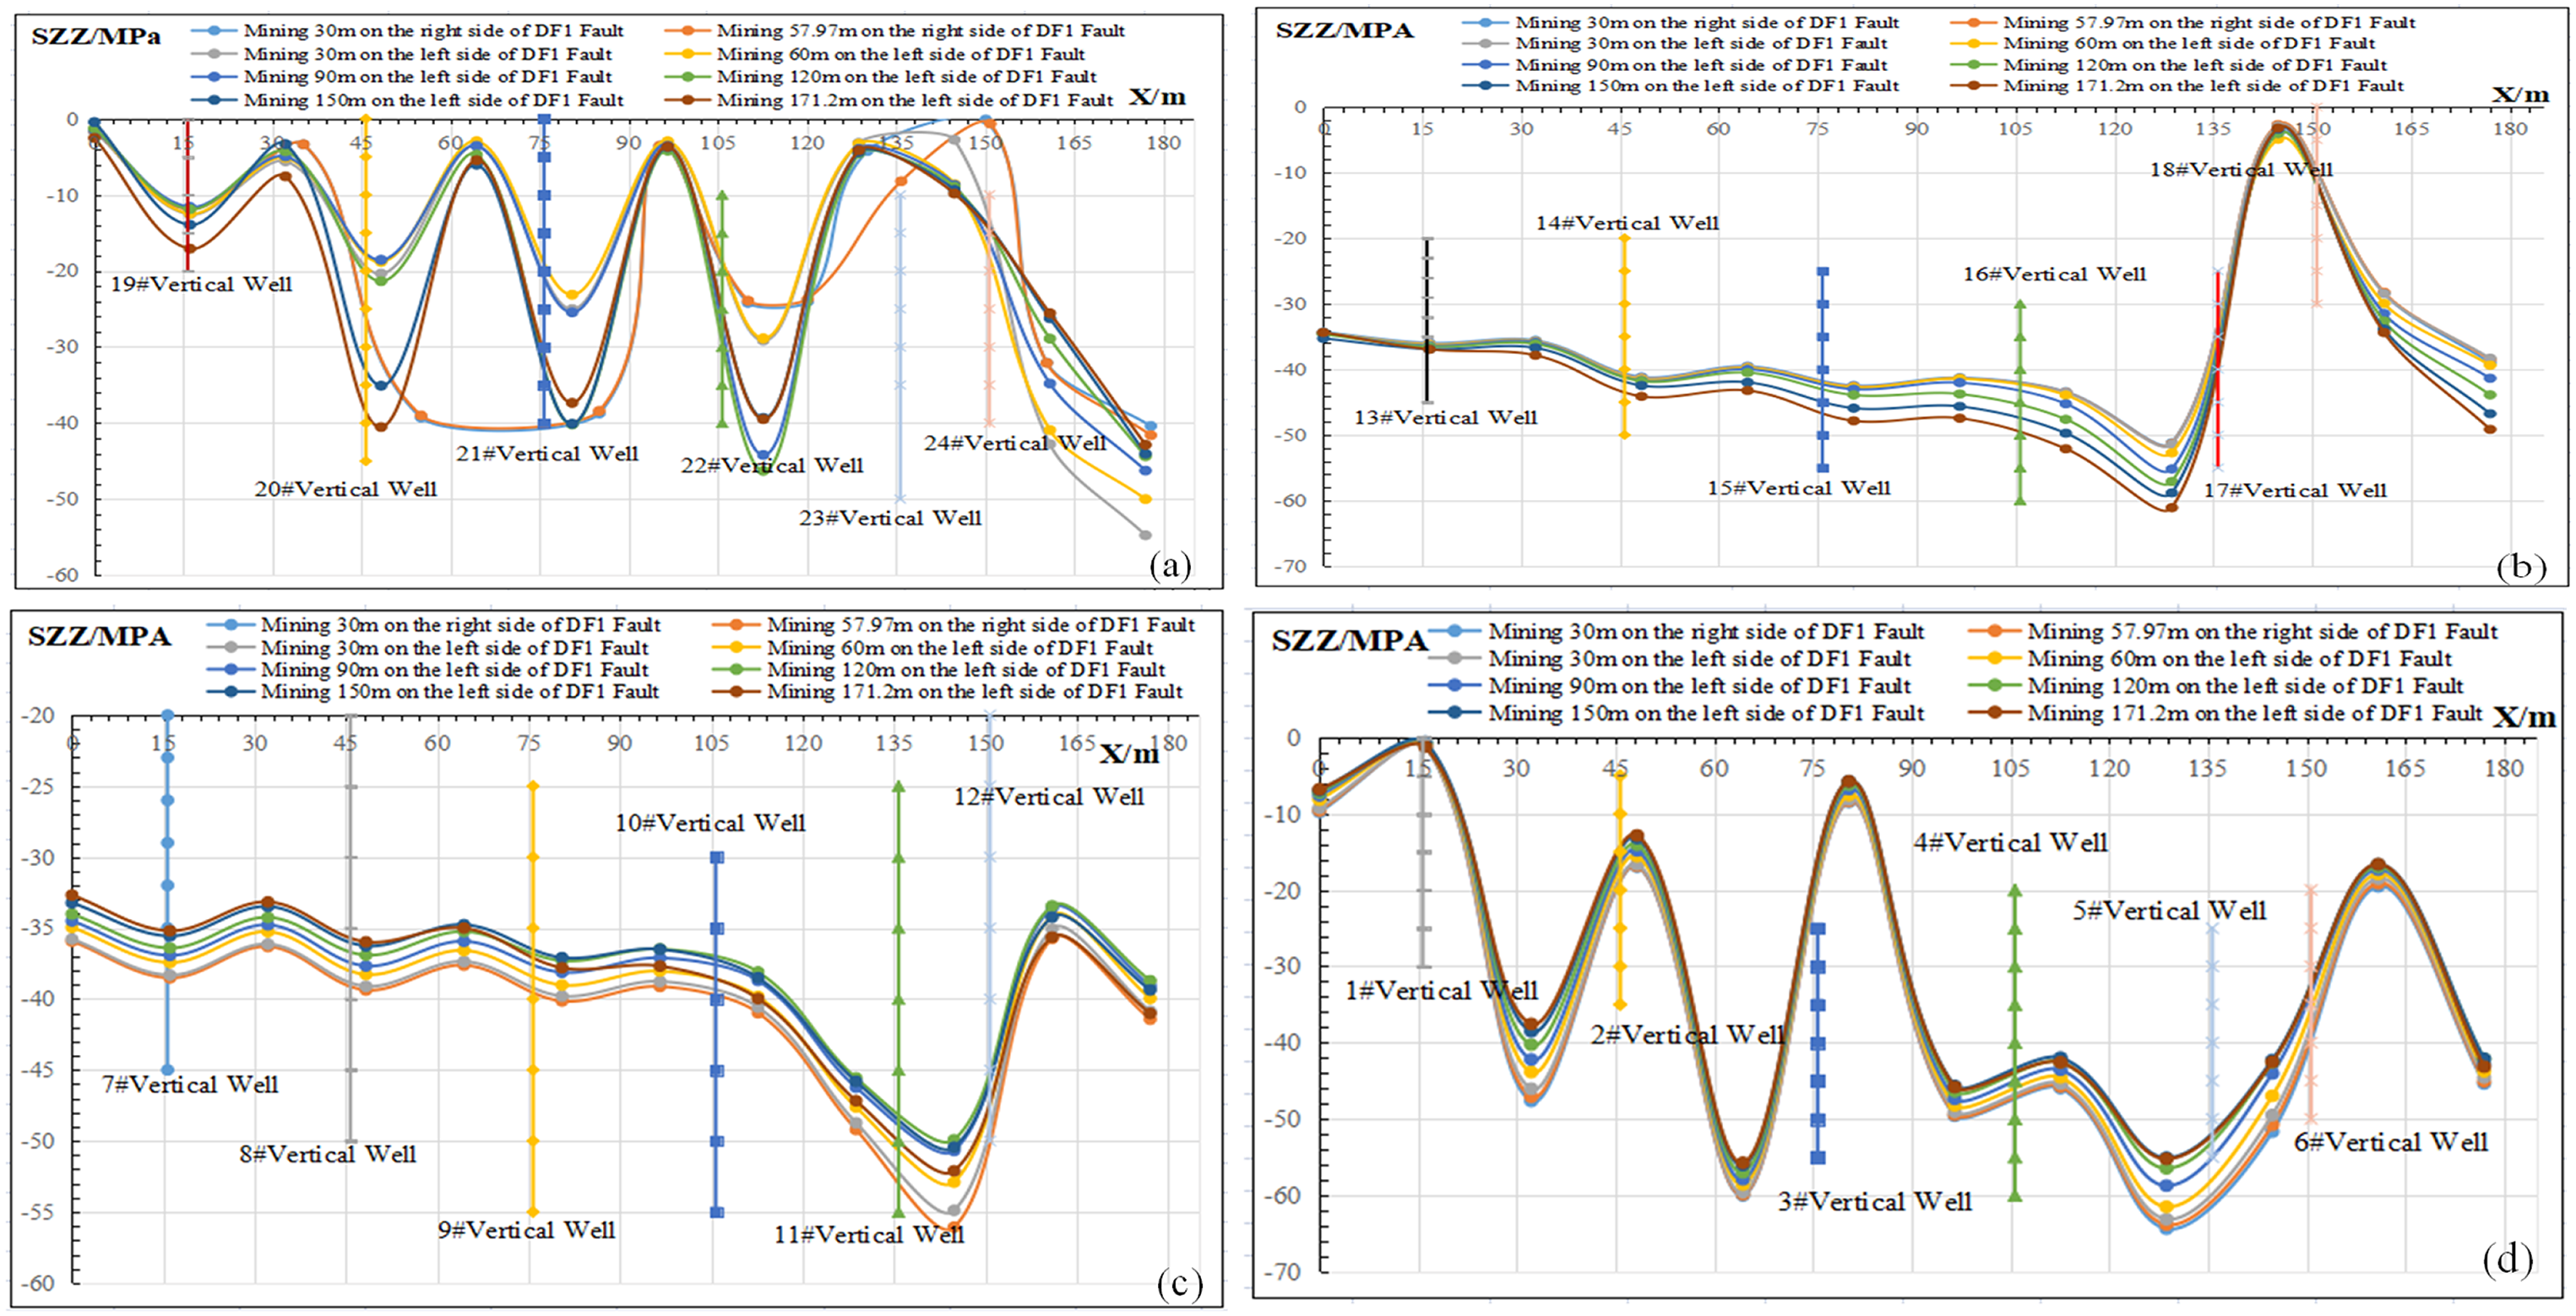
Variation curve of SZZ. (a) Variation rule of SZZ in vertical well 19# to 24#. (b) Variation rule of SZZ in vertical well 13# to 18#. (c) Variation rule of SZZ in vertical well 7# to 12#. (d) Variation rule of SZZ in vertical well 1# to 6#.
The SXX value in the area close to the fault is larger, the maximum value is −46.493 MPa; as the lateral distance from the working surface increases, the overall well-bore SXX gradually becomes larger, but the SXX stress reduction point appears in the well-bore closest to the fault, with the lowest value being −4.338 MPa, the maximum stress is −46.493 MPa within 30 m of the mining face of the foot-wall of the fault; at the same time, the maximum and minimum values of the SXX occur around the two vertical well bores at the same time.
The behavior is similar to the SXX curve, and the peak value of −46.542 MPa is reached when the working face of the fault hanging wall is mined from 30 to 57.97 m.
The behavior is similar to SXX and SYY curves. The maximum peak value of well bore is −63.834 MPa when the fault hanging wall working face is exploited from 30 to 57.97 m.
In conclusion, the variation of normal stress is less affected by a fault than by mining.
Shear force variation along a vertical well in fault slip shear
Taking well-bores 19# to 24# as an example, a schematic diagram of well-bore and shear block distribution around the hole was plotted (Zhang et al., 2019); it was concluded that there was an obvious shear-p zone in the well bore (Zhang et al., 2017), while large shear-n and shear-p zones appeared around the hole simultaneously, as shown in Figure 18.
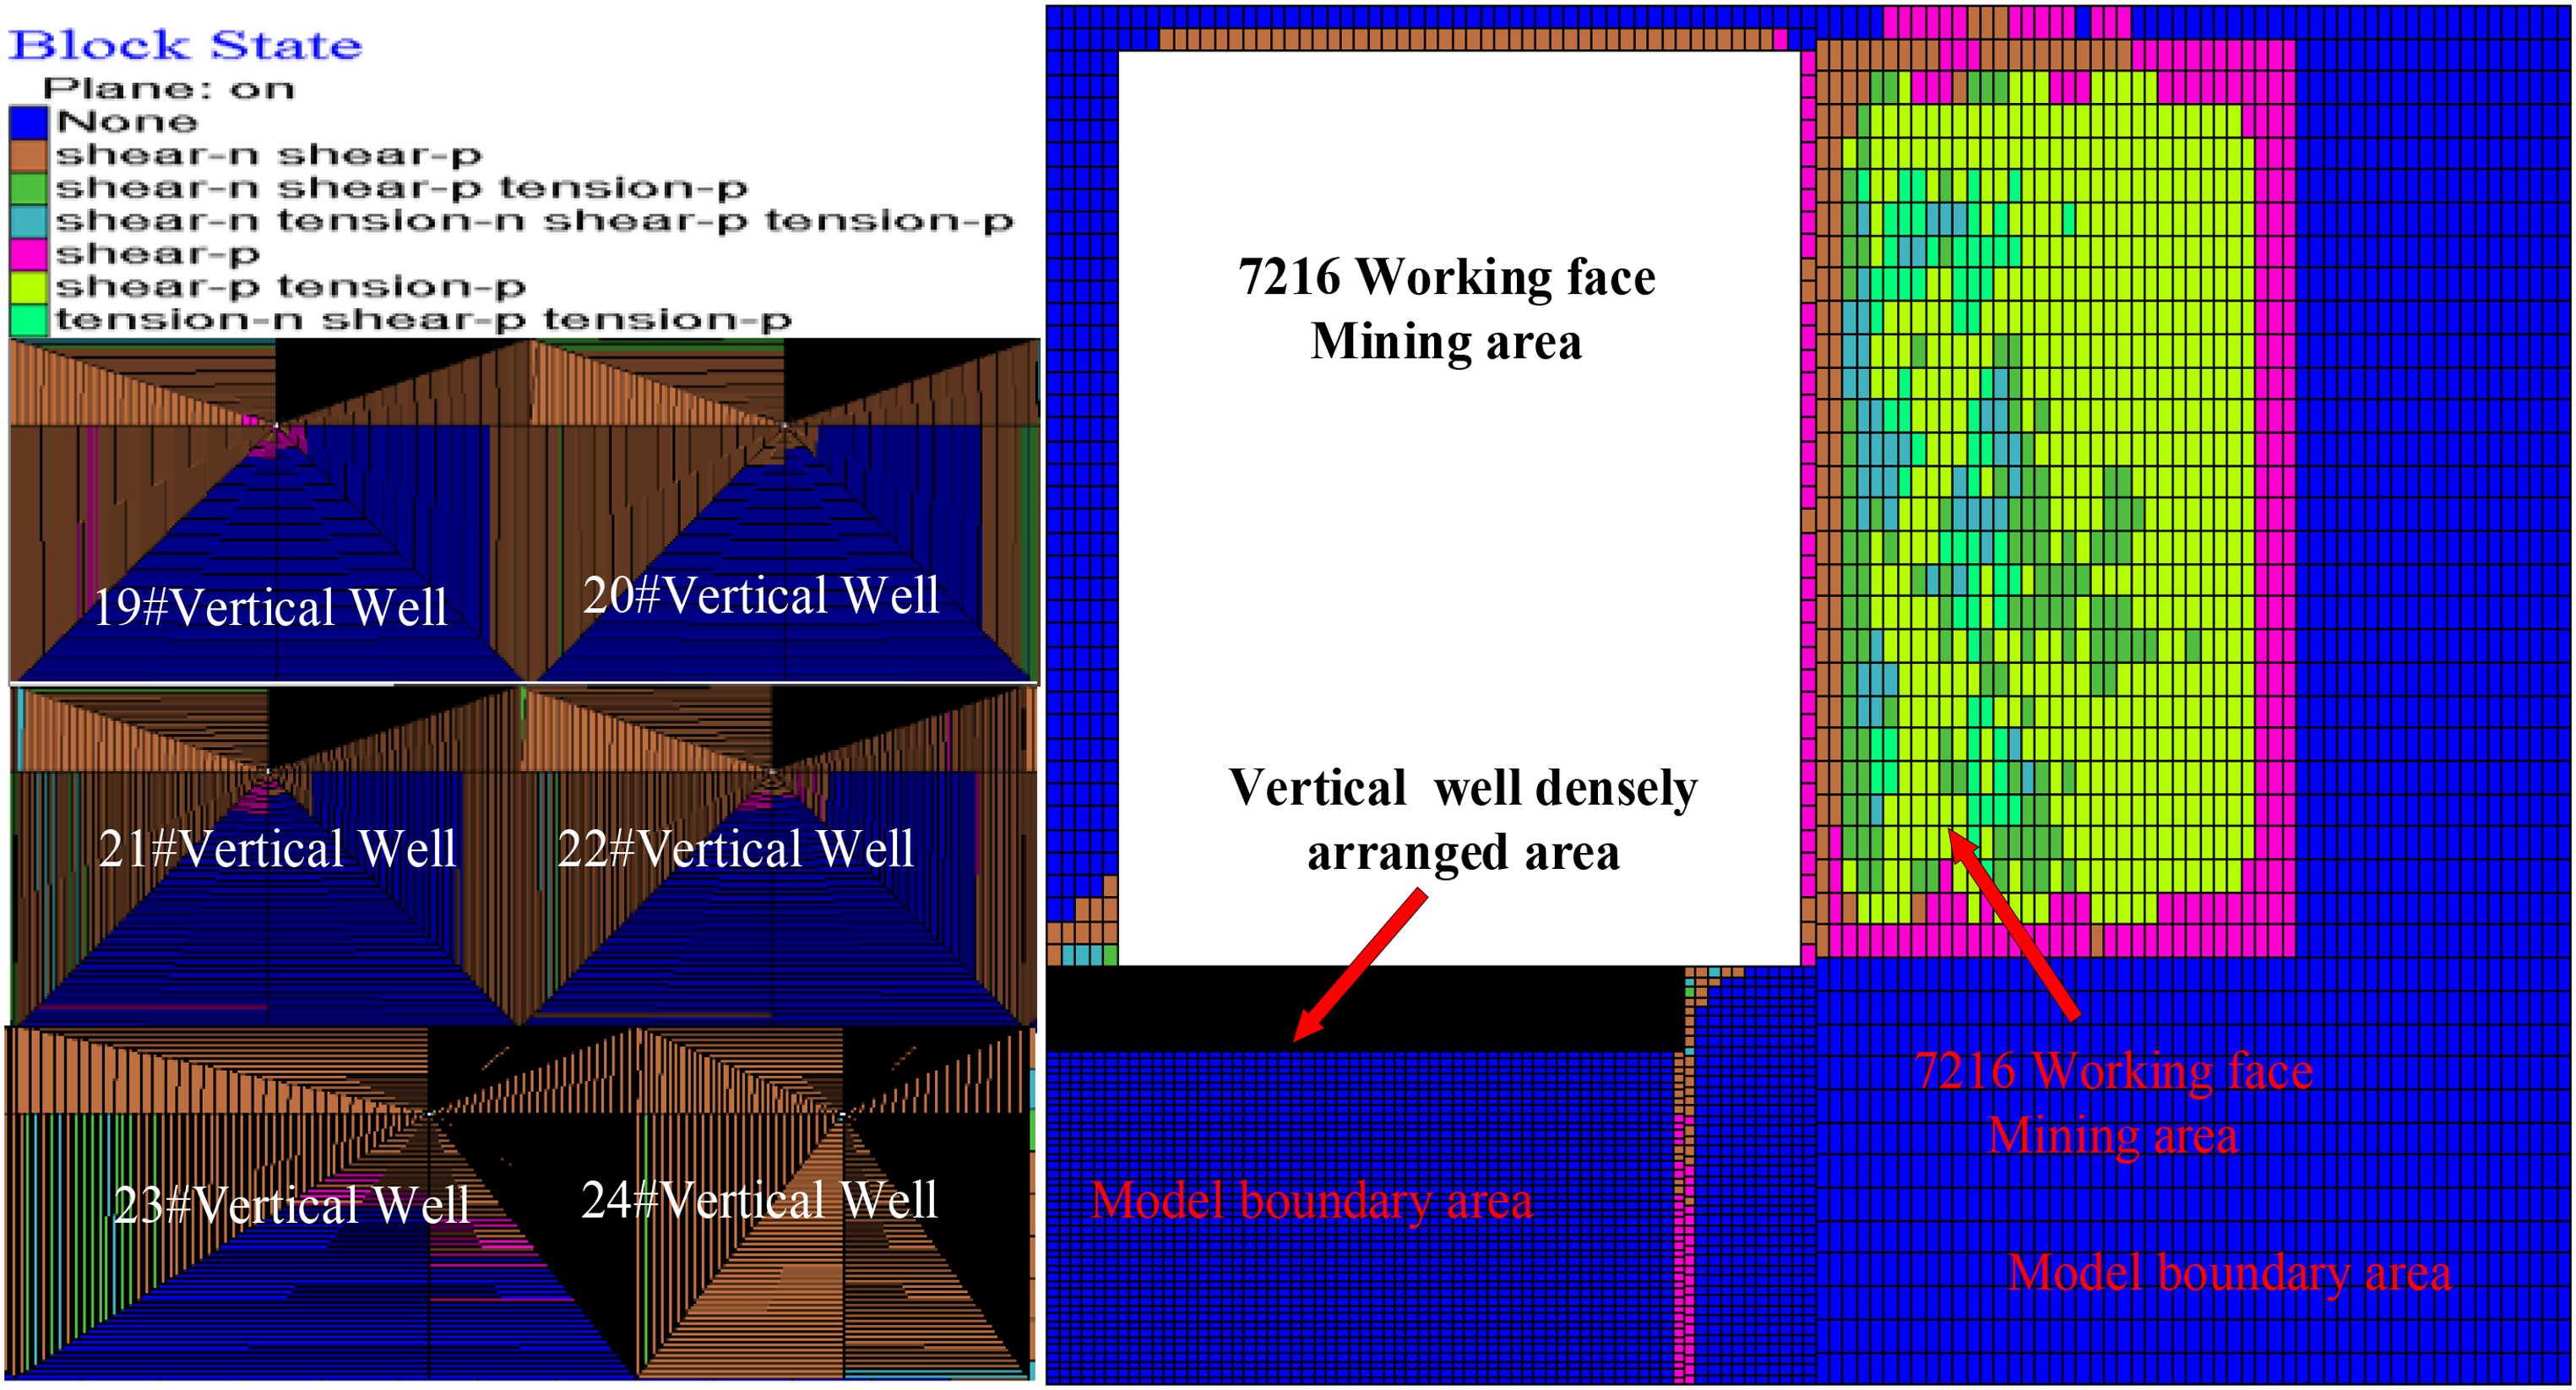
Schematic diagram of the shear-n and shear-p zones.
Based on the data acquisition methods in sections “Vertical well displacement variation curve of fault slip shear” and “Normal stress changes along the vertical well in fault slip shear,” the variations in SXY which stands for shear force in the XOY plane, SXZ which represents shear force in the XOZ plane, and SYZ standing for shear force in the YOZ plane were further analyzed.
In Figure 19, the SXY stress on the well bore is concentrated between −5 and 4 MPa, and the peak value of SXY between the hole circumferences is concentrated between −4.331 and 5.388 MPa.
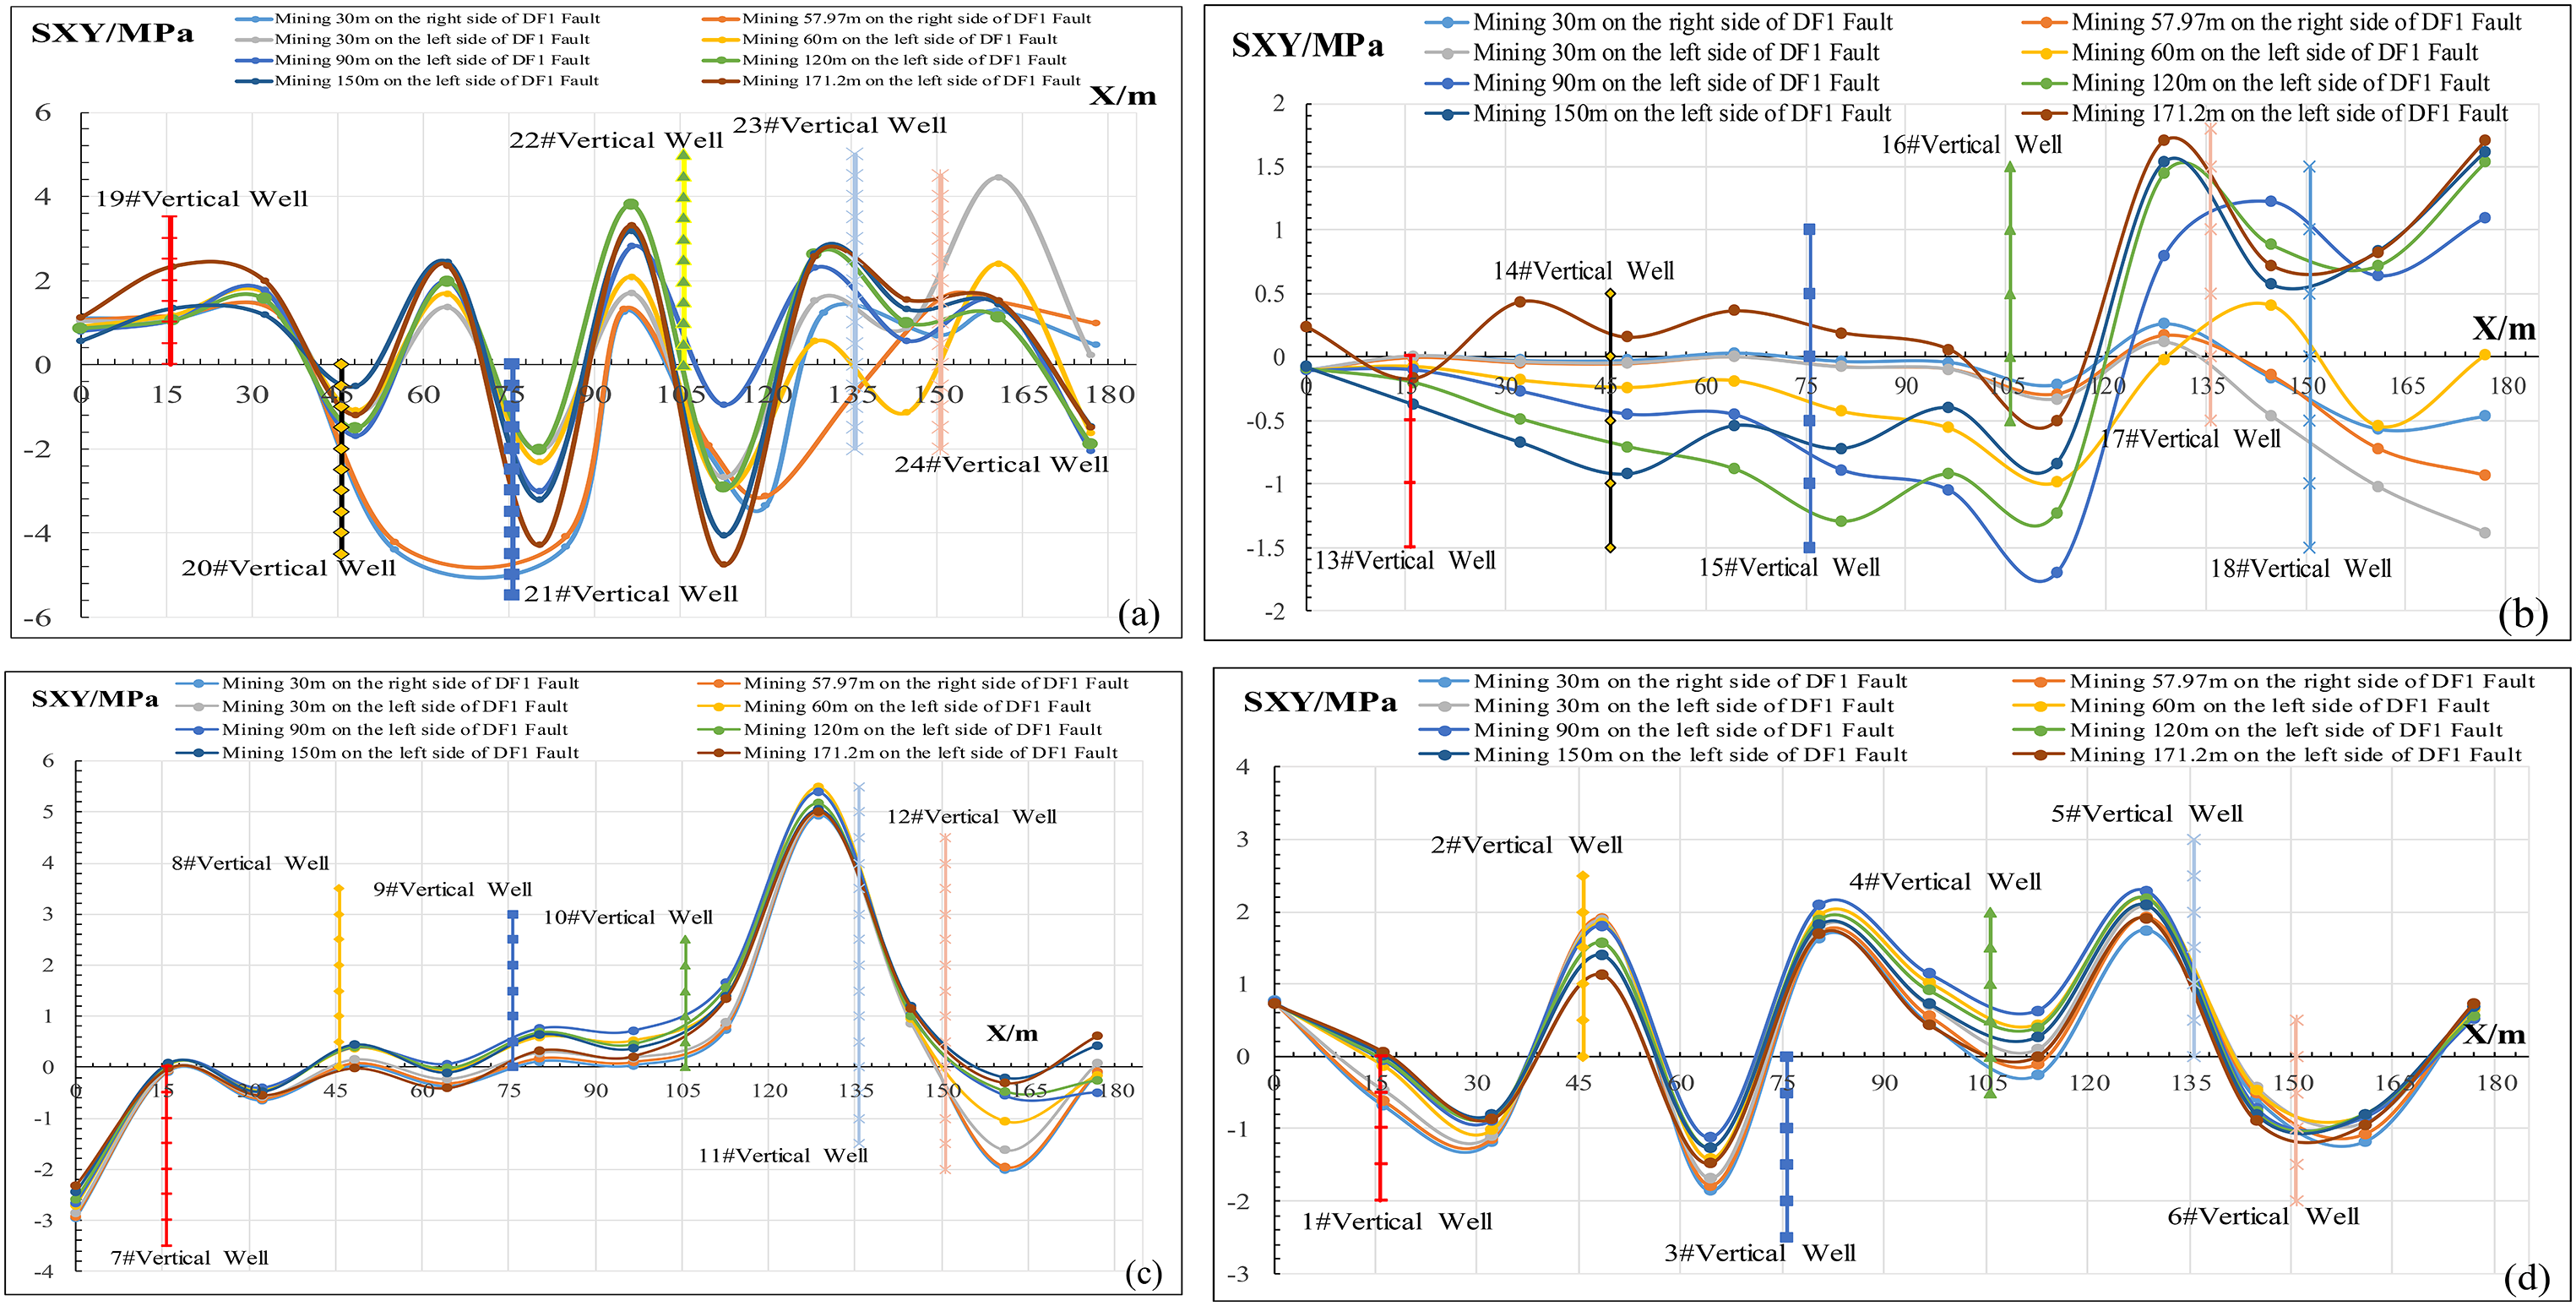
Variation curve of SXY. (a) Variation rule of SXY in vertical well 19# to 24#.(b) Variation rule of SXY in vertical well 13# to 18#. (c) Variation rule of SXY in vertical well 7# to 12#. (d) Variation rule of SXY in vertical well 1# to 6#.
In Figure 20, the sensitivity of SXZ and fault spacing is higher than that of working face lateral spacing, and the SXZ value of 12# vertical well closest to the fault reaches 10 MPa. In addition, the peak value of SXZ between holes is −9.771 to 11.121 MPa.
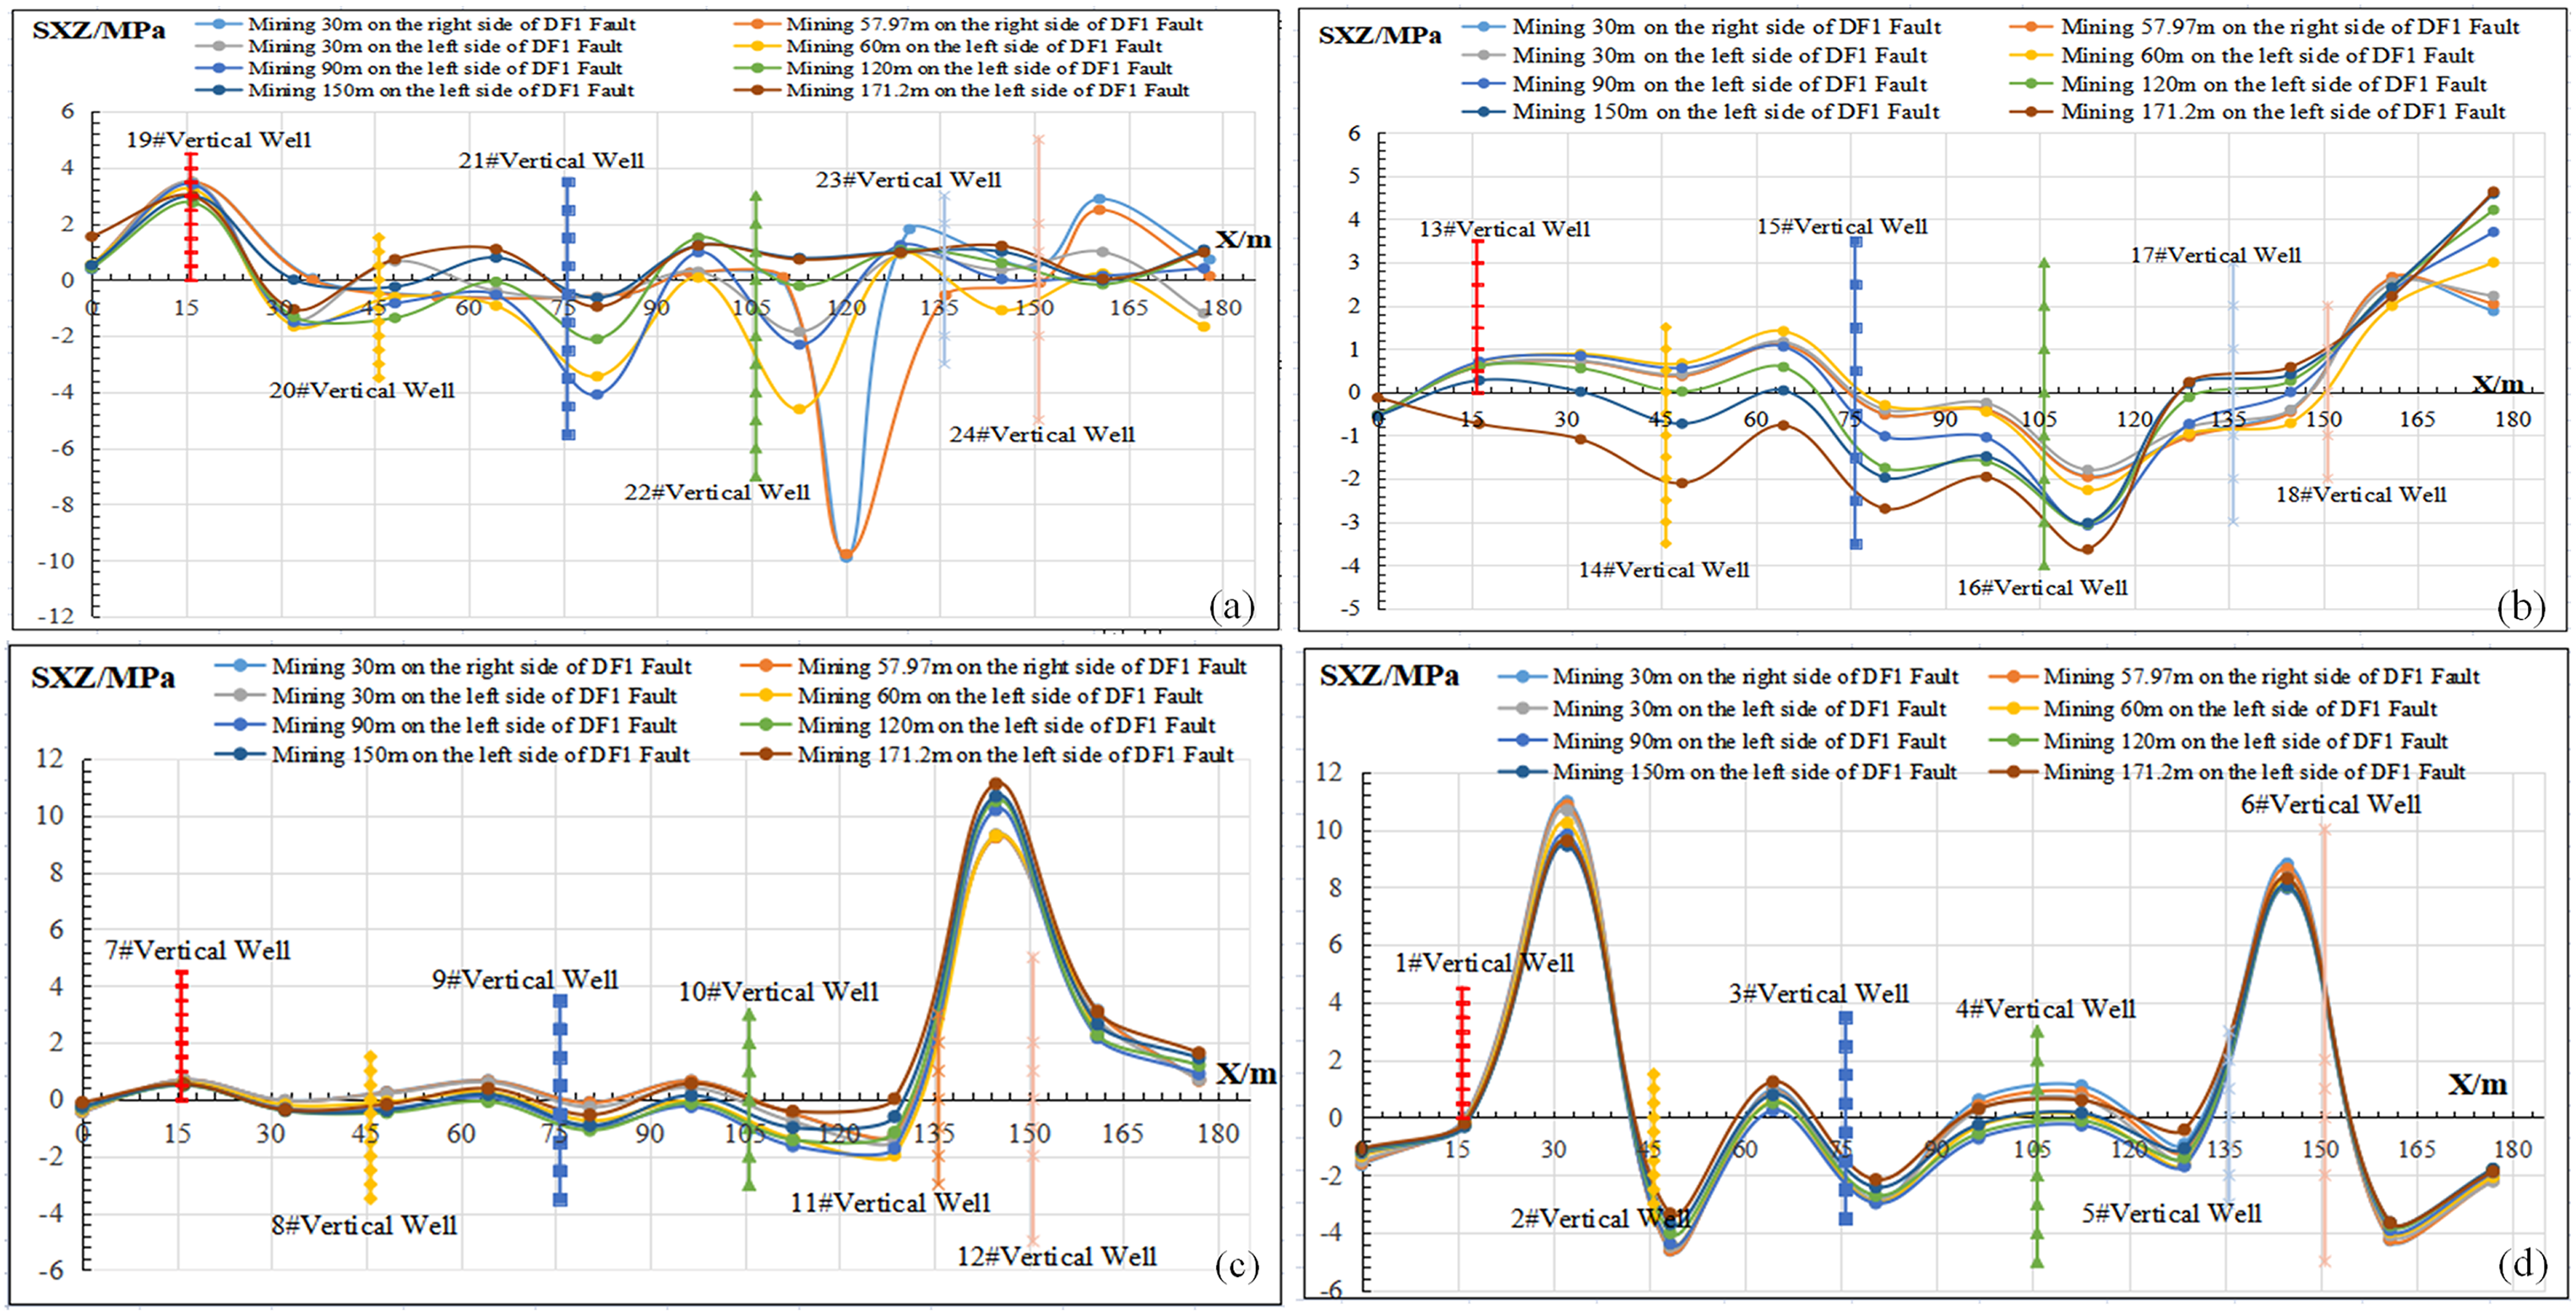
Variation curve of SXZ. (a) Variation rule of SXZ in vertical well 19# to 24#. (b) Variation rule of SXZ in vertical well 13# to 18#. (c) Variation rule of SXZ in vertical well 7# to 12#. (d) Variation rule of SXZ in vertical well 1# to 6#.
In Figure 21, the sensitivity of shaft SYZ and working face mining position is higher than the distance between fault and working face. The peak value is mainly concentrated within the range of 30 to 57.97 m on the hanging wall of fault and 30 m on the footer of fault working face, and the peak value is concentrated between −10.000 and 7 MPa. In addition, the peak value of SYZ between pore circumferences is concentrated between −10.390 and 7.145 MPa.
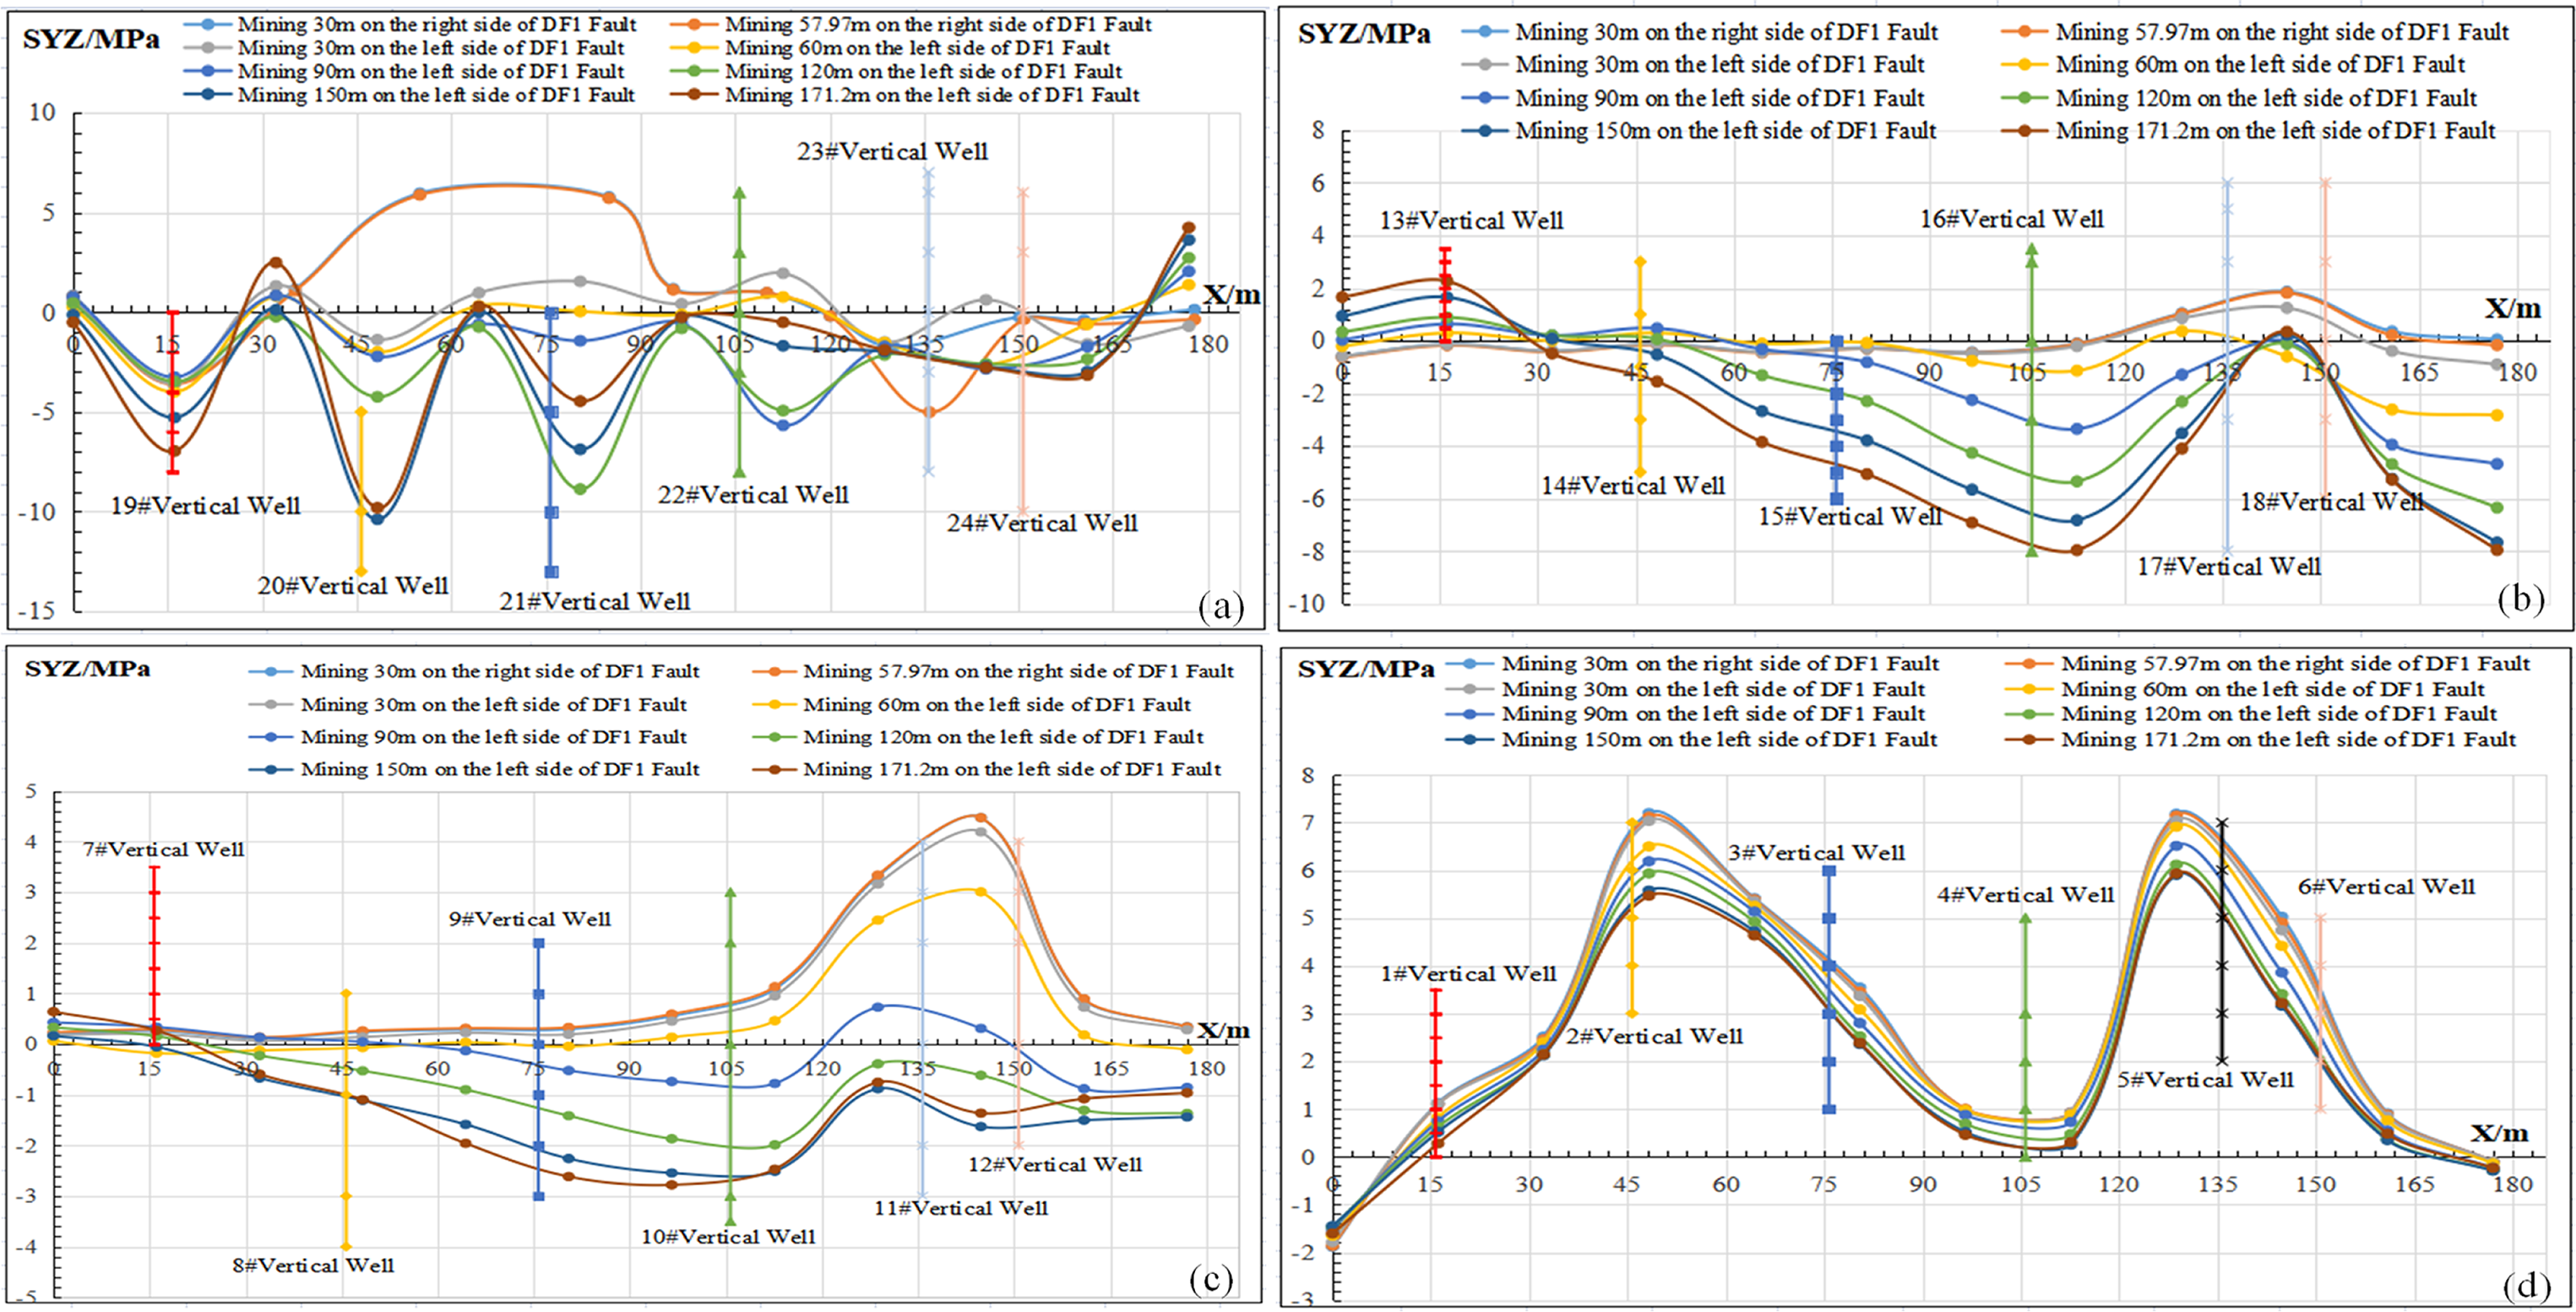
Variation curve of SYZ. (a) Variation rule of SYZ in vertical well 19# to 24#. (b) Variation rule of SYZ in vertical well 13# to 18#. (c) Variation rule of SYZ in vertical well 7# to 12#. (d) Variation rule of SYZ in vertical well 1# to 6#.
In summary, considering the working face mining, the sensitivity of shear force on well bore and bore circumference affected by reverse fault is such that SXZ > SYZ > SXY.
Analysis of density of strain energy for vertical well
As in the calculation model in section “Vertical well displacement variation curve of fault slip shear,” the density of strain energy monitoring line of the well-bore was formed by vertical line perpendicular to the direction of foot-wall working face (Feng et al., 2020; Gong et al., 2019; Hong et al., 2009; Zhou et al., 2020), and the density of strain energy for the well-bore was extracted when the foot-wall working face was exploited at 57.97, 30, and 171.2 m, respectively. The secondary development of density of strain energy parameters Q was carried out from formula (13) by using Fish language: energy labels of 19# to 24# vertical wells were set as energy-1, energy-5, and energy-9, and those representing the 13# to 18# vertical wells were energy-2, energy-6, and energy-10. The energy of vertical wells 7# to 12# was identified as energy-3, energy-7, and energy-11, and finally, Figure 22 was plotted.

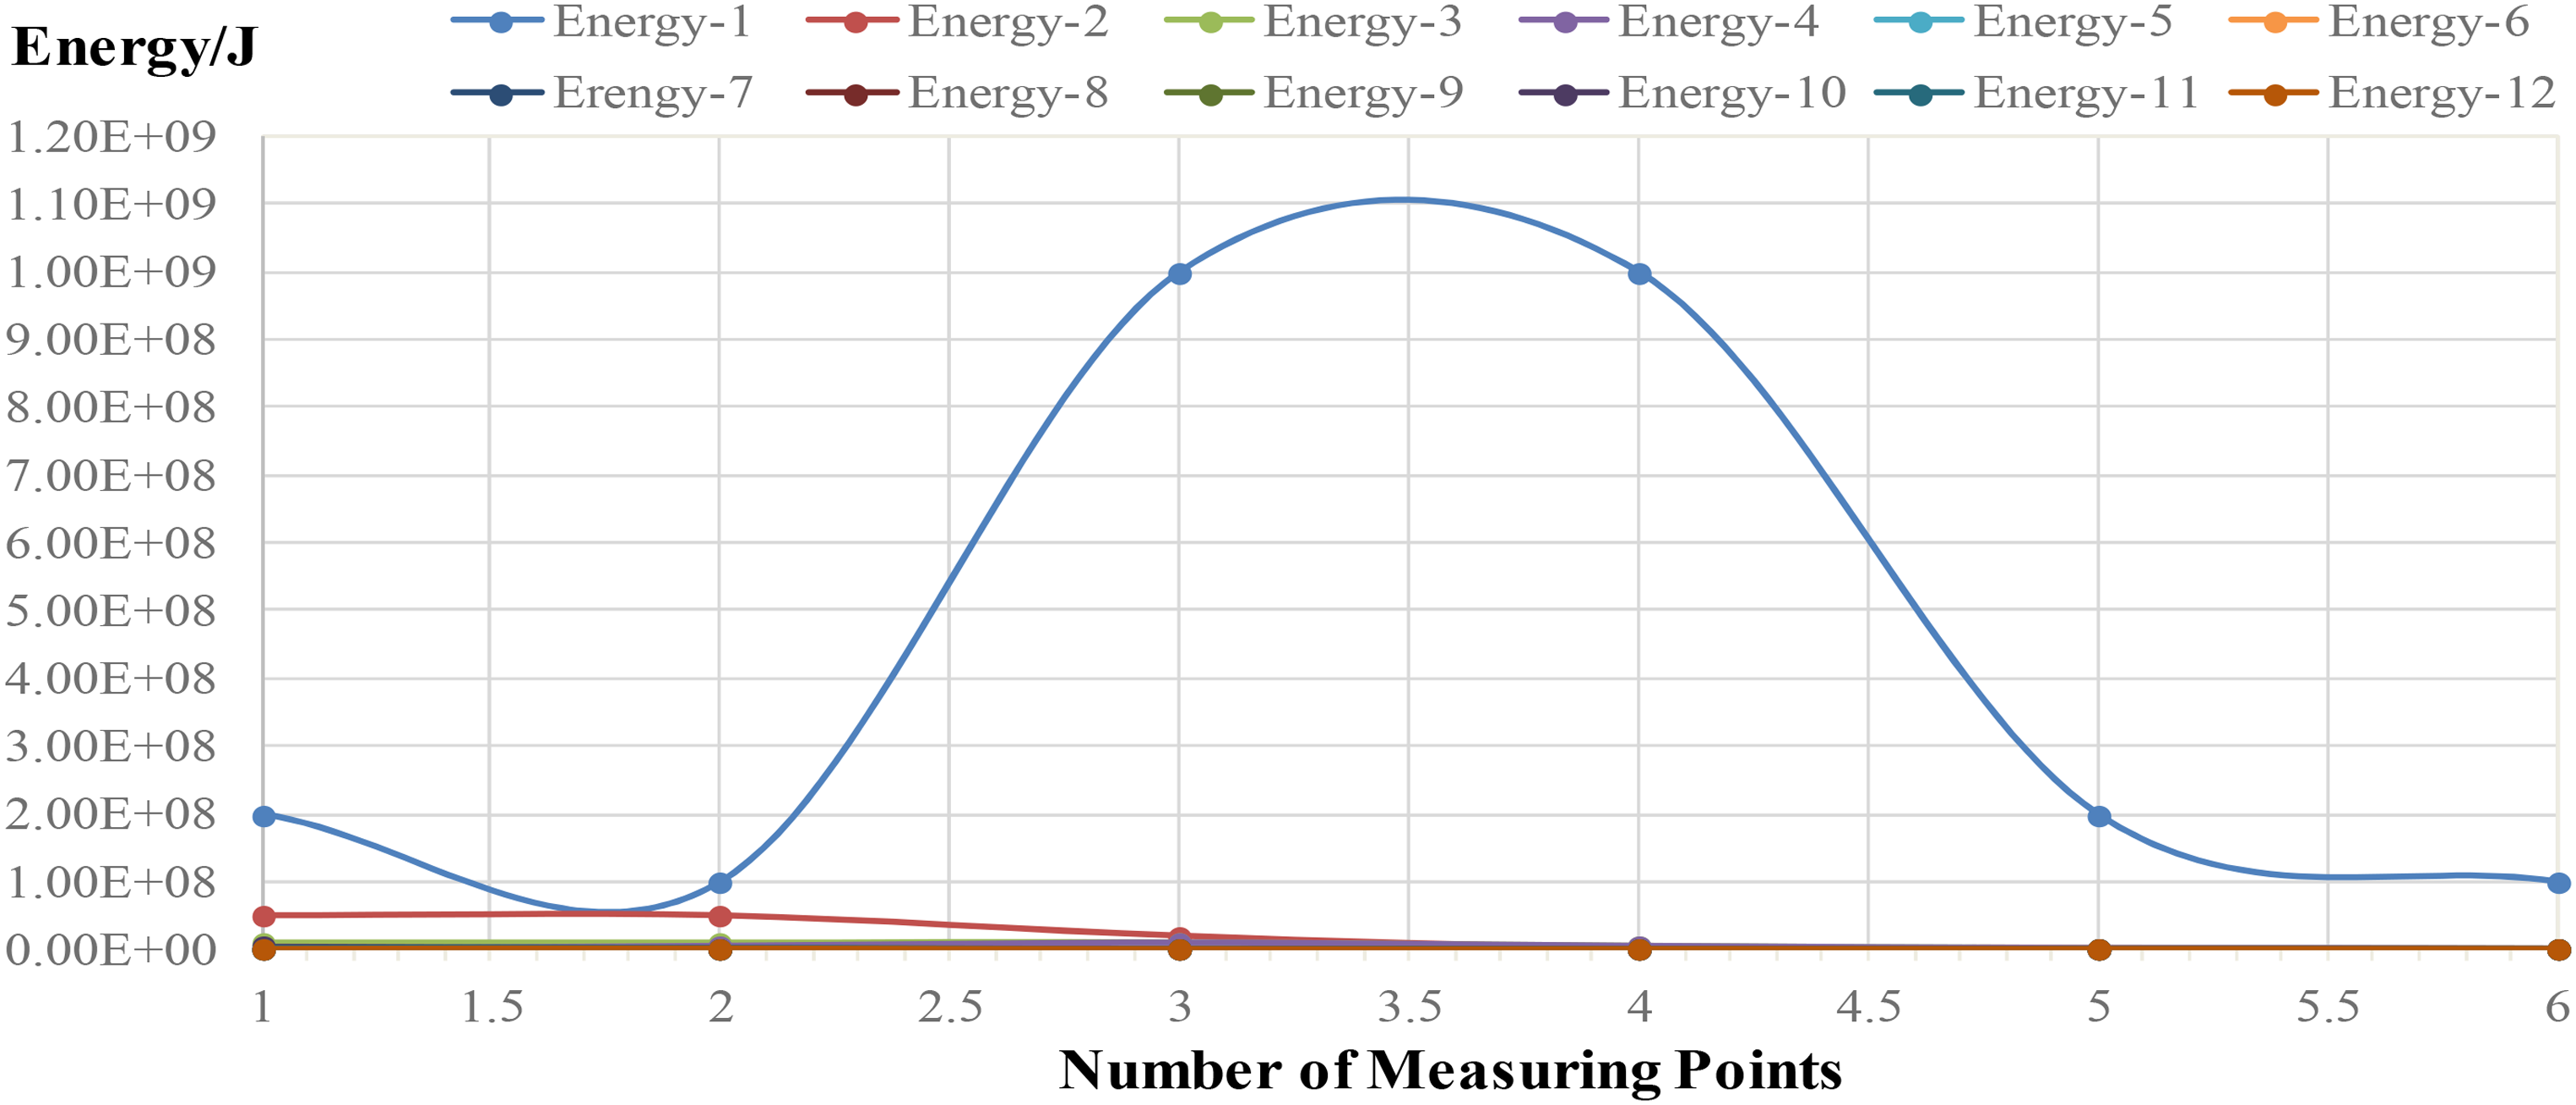
Shear energy curve.
In formula: ΔXDISP, ΔYDISP, ΔZDISP represent the increment of XDISP, YDISP, and ZDISP, respectively.
The maximum density of strain energy curve of the well-bore is a quasi-symmetric parabola. The closer to the fault and the working face, the vertical wells 19# to 24#, which are 171.2 m from the working face, have the maximum density of strain energy aggregation, and the maximum peak energy is 1 GJ. Meanwhile, the average density of strain energy at other measured points is concentrated around 30 MJ.
Verification of the range of β angles
As per the calculation model in section “Vertical well displacement variation curve of fault slip shear,” to verify the correctness of the mechanical model in section “Stress analysis of a fault-vertical well overall model,” taking the shafts of bores 19# to 24# in the XOZ-plane as an example, the extracted data curve of shear range angle β under compression is plotted, as shown in Figure 23 when the working face is excavated to 57.97 m on the right side of DF1 Fault and the working face is excavated to 30 m, 60 m, 90 m and 171.2 m on the left side of DF1 Fault.
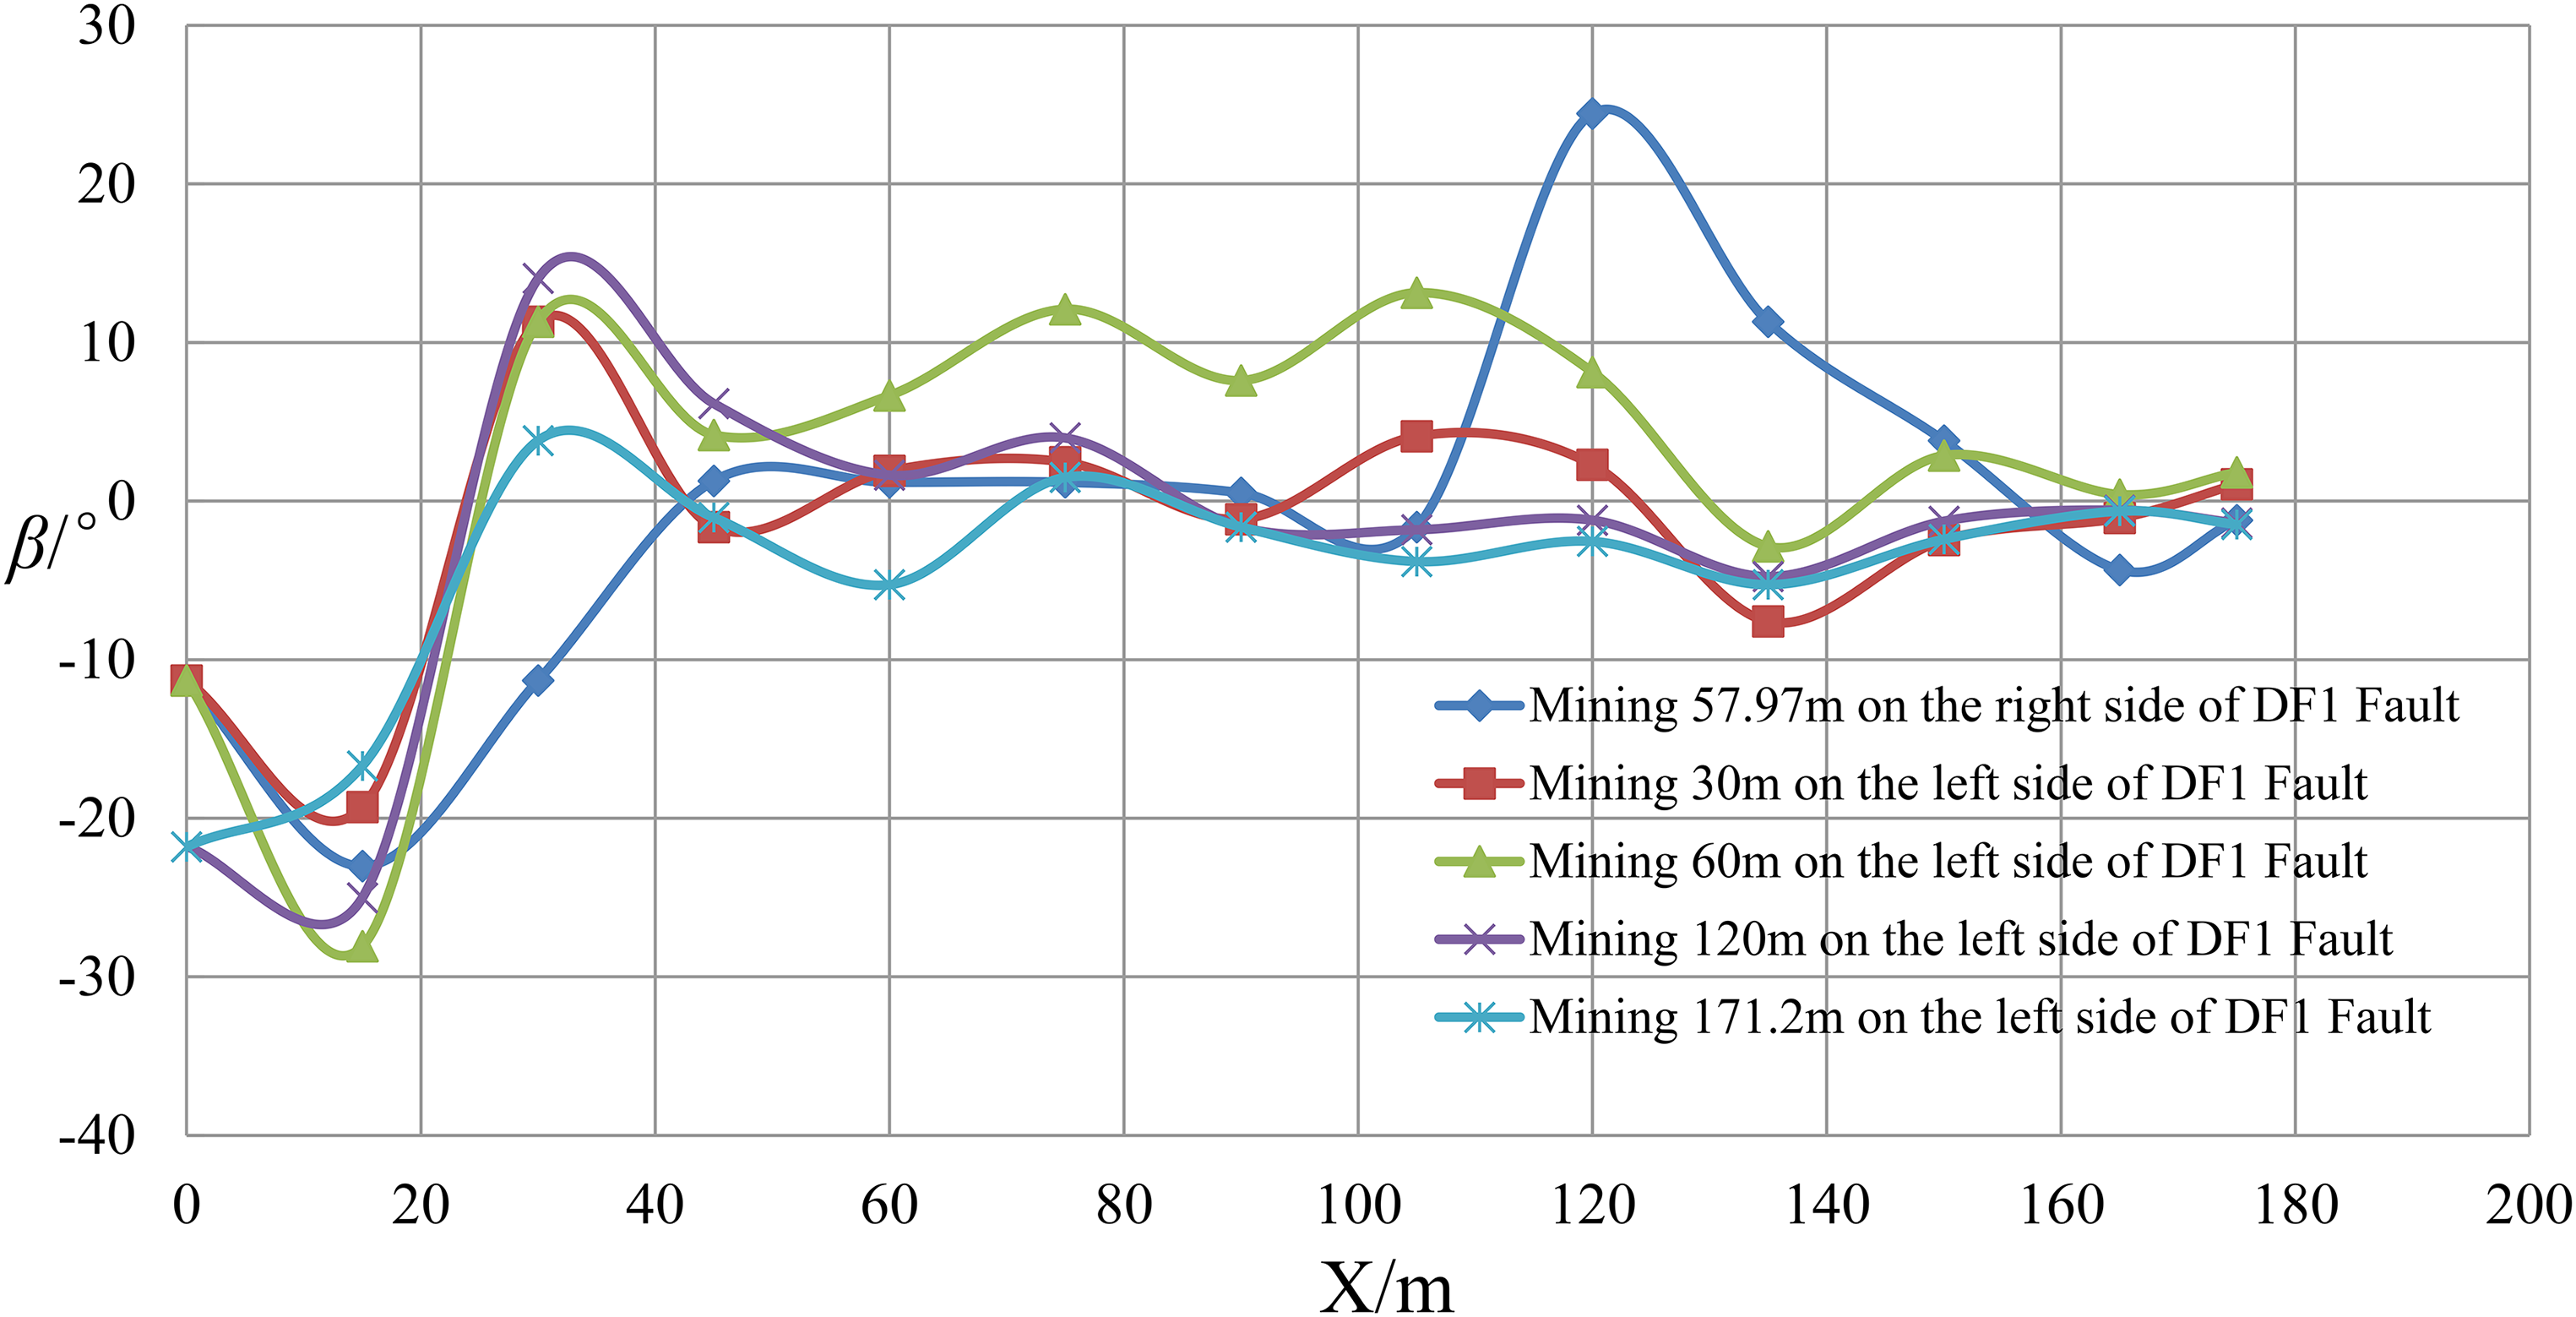
Change curve of β.
As shown in Figure 23, the numerical simulation results match the range shown in Figure 3. When the dip angle of the fault is 74°, the range in Figure 3 is −27.33 to 23.09°, with an error of 4.15%.
Case study
The 3# coal seam, which was mainly mined in 7216 working face, had a robustness coefficient f of 0.35–0.42, an average permeability coefficient of 0.097 m2/(MPa2·d) (Huang et al., 2018), an average gas content of 11.22 m3/t, and an average gas pressure of 1.17 MPa (Shi et al., 2022). In order to eliminate the risk of coal and gas outburst in the coal seam, the 8# vertical well was set 65 m away from the return air side of the working face and 138 m from the fault plane that was analyzed and selected according to the above conclusions to carry out pre-pumping before the mining of the working face and pressure relief pumping starting from 200 m behind the borehole during mining the working face. After 150 days of pumping under the same conditions, as shown in Figure 24, the average daily output of gas pure volume during pre-pumping was 1134.5 m3/d, and the average daily output of pressure relief pumping was 3930.1 m3/d, thus ensuring the safe mining of the working face.
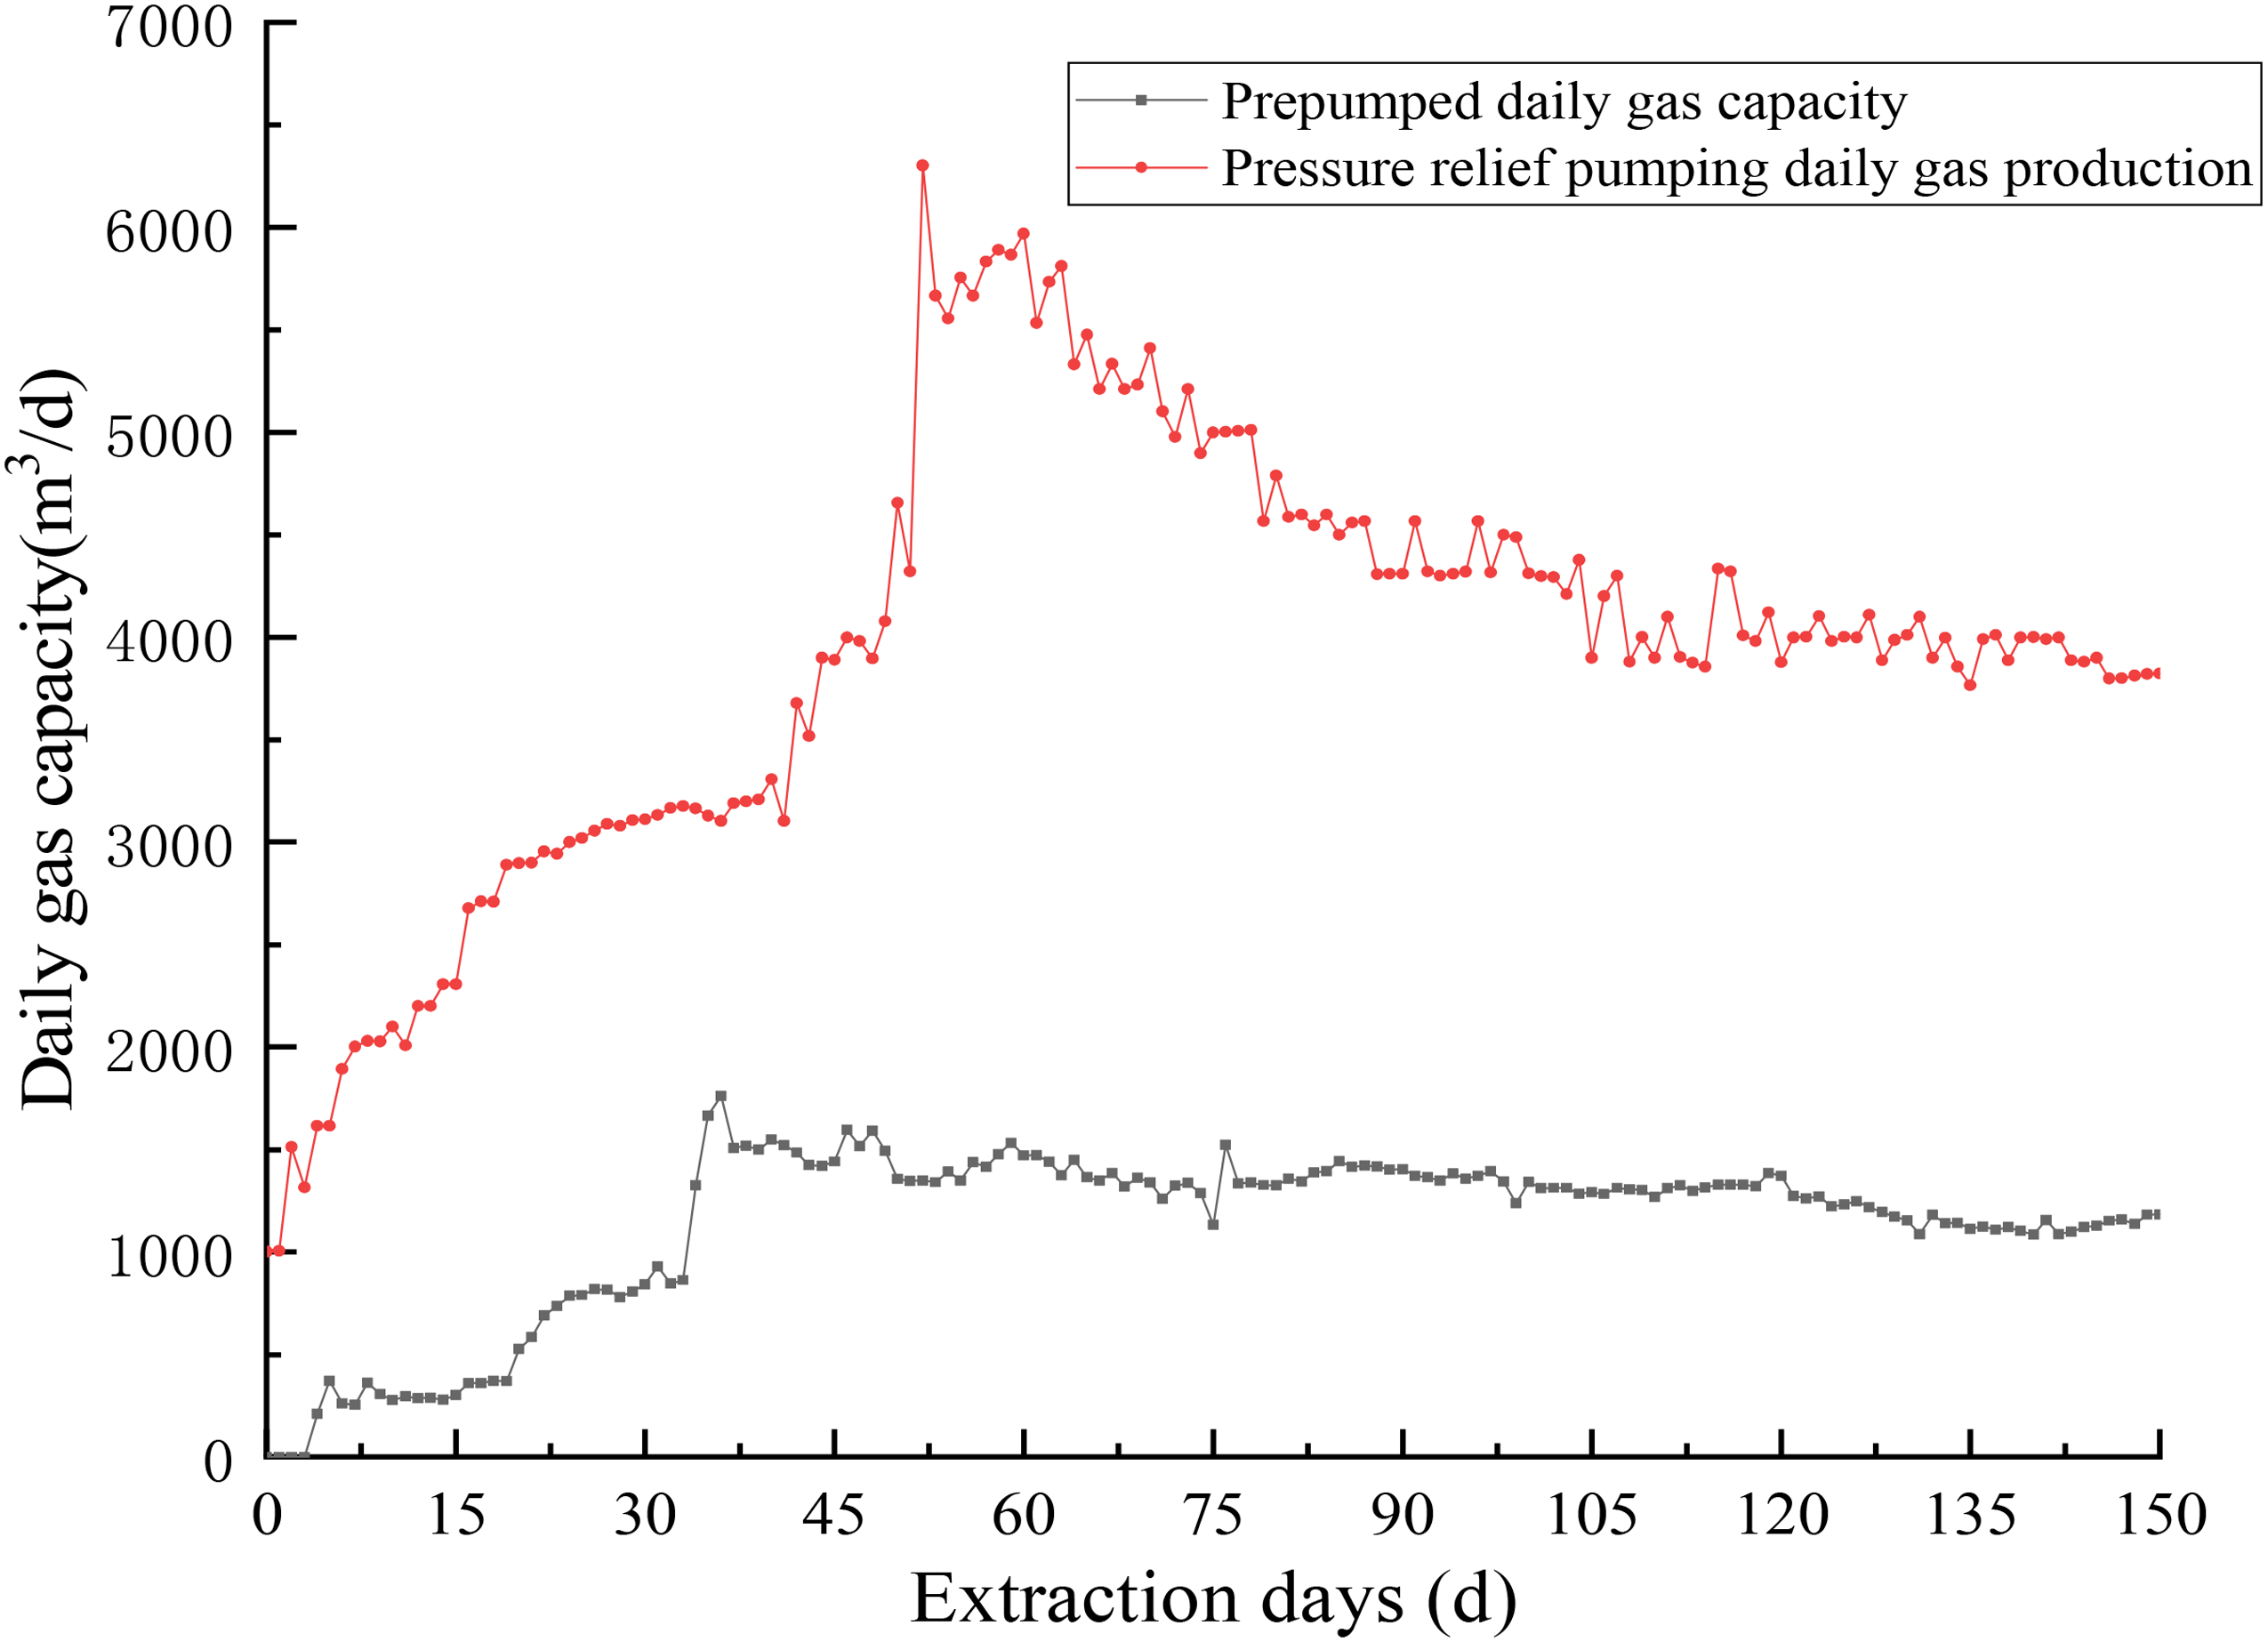
Gas extraction curve of 8# borehole.
Conclusions
Based on theoretical analysis, the range of influence of the compressive shear stress in well-bores with different dip angles of reverse fault, the relationship between compressive shear stress in vertical wells and maximum compressive principal stress and load coefficient were studied.
The evolution of the stress, displacement, and energy fields in and around a well-bore at different mining distances from the working face were studied by FLAC3D numerical simulation software.
The dynamic analysis and numerical simulation of the borehole were implemented, thus providing an effective numerical simulation method able to realize the excavation of cylindrical straight wells in different rock strata; on the other hand, to make the numerical simulation closer to in-situ data, a shell command was adopted to implement the shaft lining directly after the surface well drilling and cementing.
The research results provide important theoretical support for “multi-purpose in one hole” in surface wells, as follows:
① To avoid stress concentration in surface wells, large-diameter pressure relief holes can be arranged between 10 and 15 m to achieve stress transfer; ② To avoid the concentration of density of strain energy for well-bore, the minimum lateral distance from the working face strike mining line is 45 m. ③ For the 3# coal seam with low permeability, 8# surface vertical well pre-pumping has been carried out on site, and good pumping effect has been achieved, so as to ensure the safe mining of the subsequent working face.
Footnotes
Acknowledgements
We gratefully acknowledge the financial support for this work provided by the National Natural Science Foundation of China (52174207, 51874236), and Shaanxi Outstanding Youth Fund Project (2020JC-48).
Declaration of conflicting interests
The author(s) declared no potential conflicts of interest with respect to the research, authorship, and/or publication of this article.
Funding
The author(s) disclosed receipt of the following financial support for the research, authorship, and/or publication of this article: This work was supported by the Shaanxi Outstanding Youth Fund Project (grant numbers 2020JC-48), National Natural Science Foundation of China (grant numbers 51874236).