
Abstract
Sugar is a natural high-calorie sweetener. Its excessive consumption is associated with health problems such as obesity, diabetes, heart disease, and degenerative issues. The stevia plant is a great natural substitute. It provides no calories and has medicinal properties such as oral antibacterial, hypoglycemic, and anti-hypertensive with a high nutritional value. In this work, the effects of temperature and air velocity in drying kinetics of stevia leaves were studied using a convective drier operating with air velocities (2, 3, and 4 m/s) and temperatures controlled (45 °C, 55 °C, and 65 °C). The highest drying rate was obtained at 65 °C and 4 m/s air velocity at 0.05 kg water/kg dry matter min. The experimental data were fitted to theoretical drying models to determine the best approach. It is found that the Page model gives a good fit for all experiments, with correlation coefficients (R2) > 0.9994. The equations to correlate this model's variables with air and temperature were determined. The results show that ΔE and glucoside values increase when temperature and air velocity increase.
Practical applications
Due to modern-day, foods of high nutritional value are required. However, drying foods requires long processes or high temperatures to eliminate water, loosening important desirable properties such as nutrients, flavors, color, or texture; thus, it is necessary to analyze methods that conserve these properties economically. This work results can help us to define the best process to preserve the desirable stevia leaf properties during drying.
Introduction
Sugar now enjoys an unprecedented proportion of the human diet (Westover and Marangell, 2002); unfortunately, it is a natural high-calorie sweetener. Therefore, excessive consumption is related to obesity, triglyceride elevation, high-fat body percentage, cardiovascular disease, and diabetes. Moreover, it leads to hyperactivity and nutritional deficiencies by decreasing interest in healthy foods (Billich et al., 2018; Johnson et al., 2009).
An alternative is natural sweeteners, such as Stevia Rebaudiana, an endemic plant from southeastern Paraguay, used for many years. The leaves are 300 to 400 times sweeter than sucrose (Lemus-Mondaca et al., 2016; Tiefenbacher, 2019); they provide no calories, with medicinal properties such as oral antibacterial, hypoglycemic, and anti-hypertensive. Because of increasing healthier diet requirements, its demand has been rising worldwide (Periche et al., 2015; Ramos-Tovar et al., 2019; Ren et al., 2011). However, stevia leaves are commonly consumed as infusions, making it possible to obtain high levels of flavonoids and phenolics; accordingly, drying is necessary.
Food dehydration is a significant accomplishment for humanity and is the leading food preservation (Chen and Putranto, 2010; Khan et al., 2020). Drying aims to reduce water activity, preserve foods, and avoid microbial growth and harmful chemical reactions. Likewise, it reduces the volume making the logistics of its storage and transports more economical and accessible (Lin et al., 2011). However, the drying method selection can improve the food's characteristics preservation and is essential to minimize any nutrient, cellular, or structural changes (Kumar et al., 2019).
Drying can be carried out with different methods (Ahmed et al., 2013; Khalfaoui et al., 2021; Periche et al., 2015; Shivanna and Subban, 2014), but it is an energy-demanding process (Zohrabi et al., 2020), representing around 12% of industrial energy consumption (Raghavan et al., 2005). The importance of process optimization is evident because it can save fossil fuels that are both expensive and polluting and allows them to obtain quality dry products. Therefore, developing energy-efficient methods is vital to solving environment complex problems (Castillo-Téllez et al., 2020).
Color pigments, Maillard reactions, and enzymatic browning play an essential role in the product's color variation. In addition, during the herb drying processes, the photodegradation of chlorophyll can occur due to solar radiation and oxygen during heating, implying the degradation of its properties. Also, color is a fundamental attribute in drying because the product's appearance determines the level of acceptance by consumers.
The mathematical modeling of drying kinetics is a suitable instrument to optimize the process, but only thin-layer models are used for dryer designs (Radhika et al., 2011).
Due to the importance of the food drying process, kinetics and modeling applied to vegetable and medicinal plants have been reported (Akpinar and Bicer, 2007; Corzo et al., 2008; Falade and Solademi, 2010; Koua et al., 2009; Radhika et al., 2011; Singh et al., 2014; Tunde-Akintunde, 2011).
Different studies on stevia leaf drying have been carried out: nutritional and medicinal effects (Ameer et al., 2020; Bueno-Hernández et al., 2019; Lemus-Mondaca et al., 2012; Park and Cha, 2010; Periche et al., 2014; Zaidan et al., 2019) and different drying technics (Castillo Téllez et al., 2018; Darchan et al., 2012; García, 2014; Lemus-Mondaca et al., 2015). However, stevia leaves drying at different air temperatures and velocities have not been reported. Therefore, in most cases, only the effects of temperature and air velocity on drying kinetics are considered independently.
The aim of this work is:
Evaluate the effect of the air temperature and velocity on stevia leaves’ drying kinetics, Fit existing mathematical models to the drying experimental results, Evaluate the effective diffusivity and the activation energy, Define the correlation of moisture ratio concerning air-drying temperature and velocity and Analyze the water activity aw, color change, and steviol glycoside content for each air-drying condition as product quality parameters. This information is helpful in dryer design and optimization, pursuing to obtain quality dried products.
Materials and methods
Figure 1 shows the research methodology diagram.
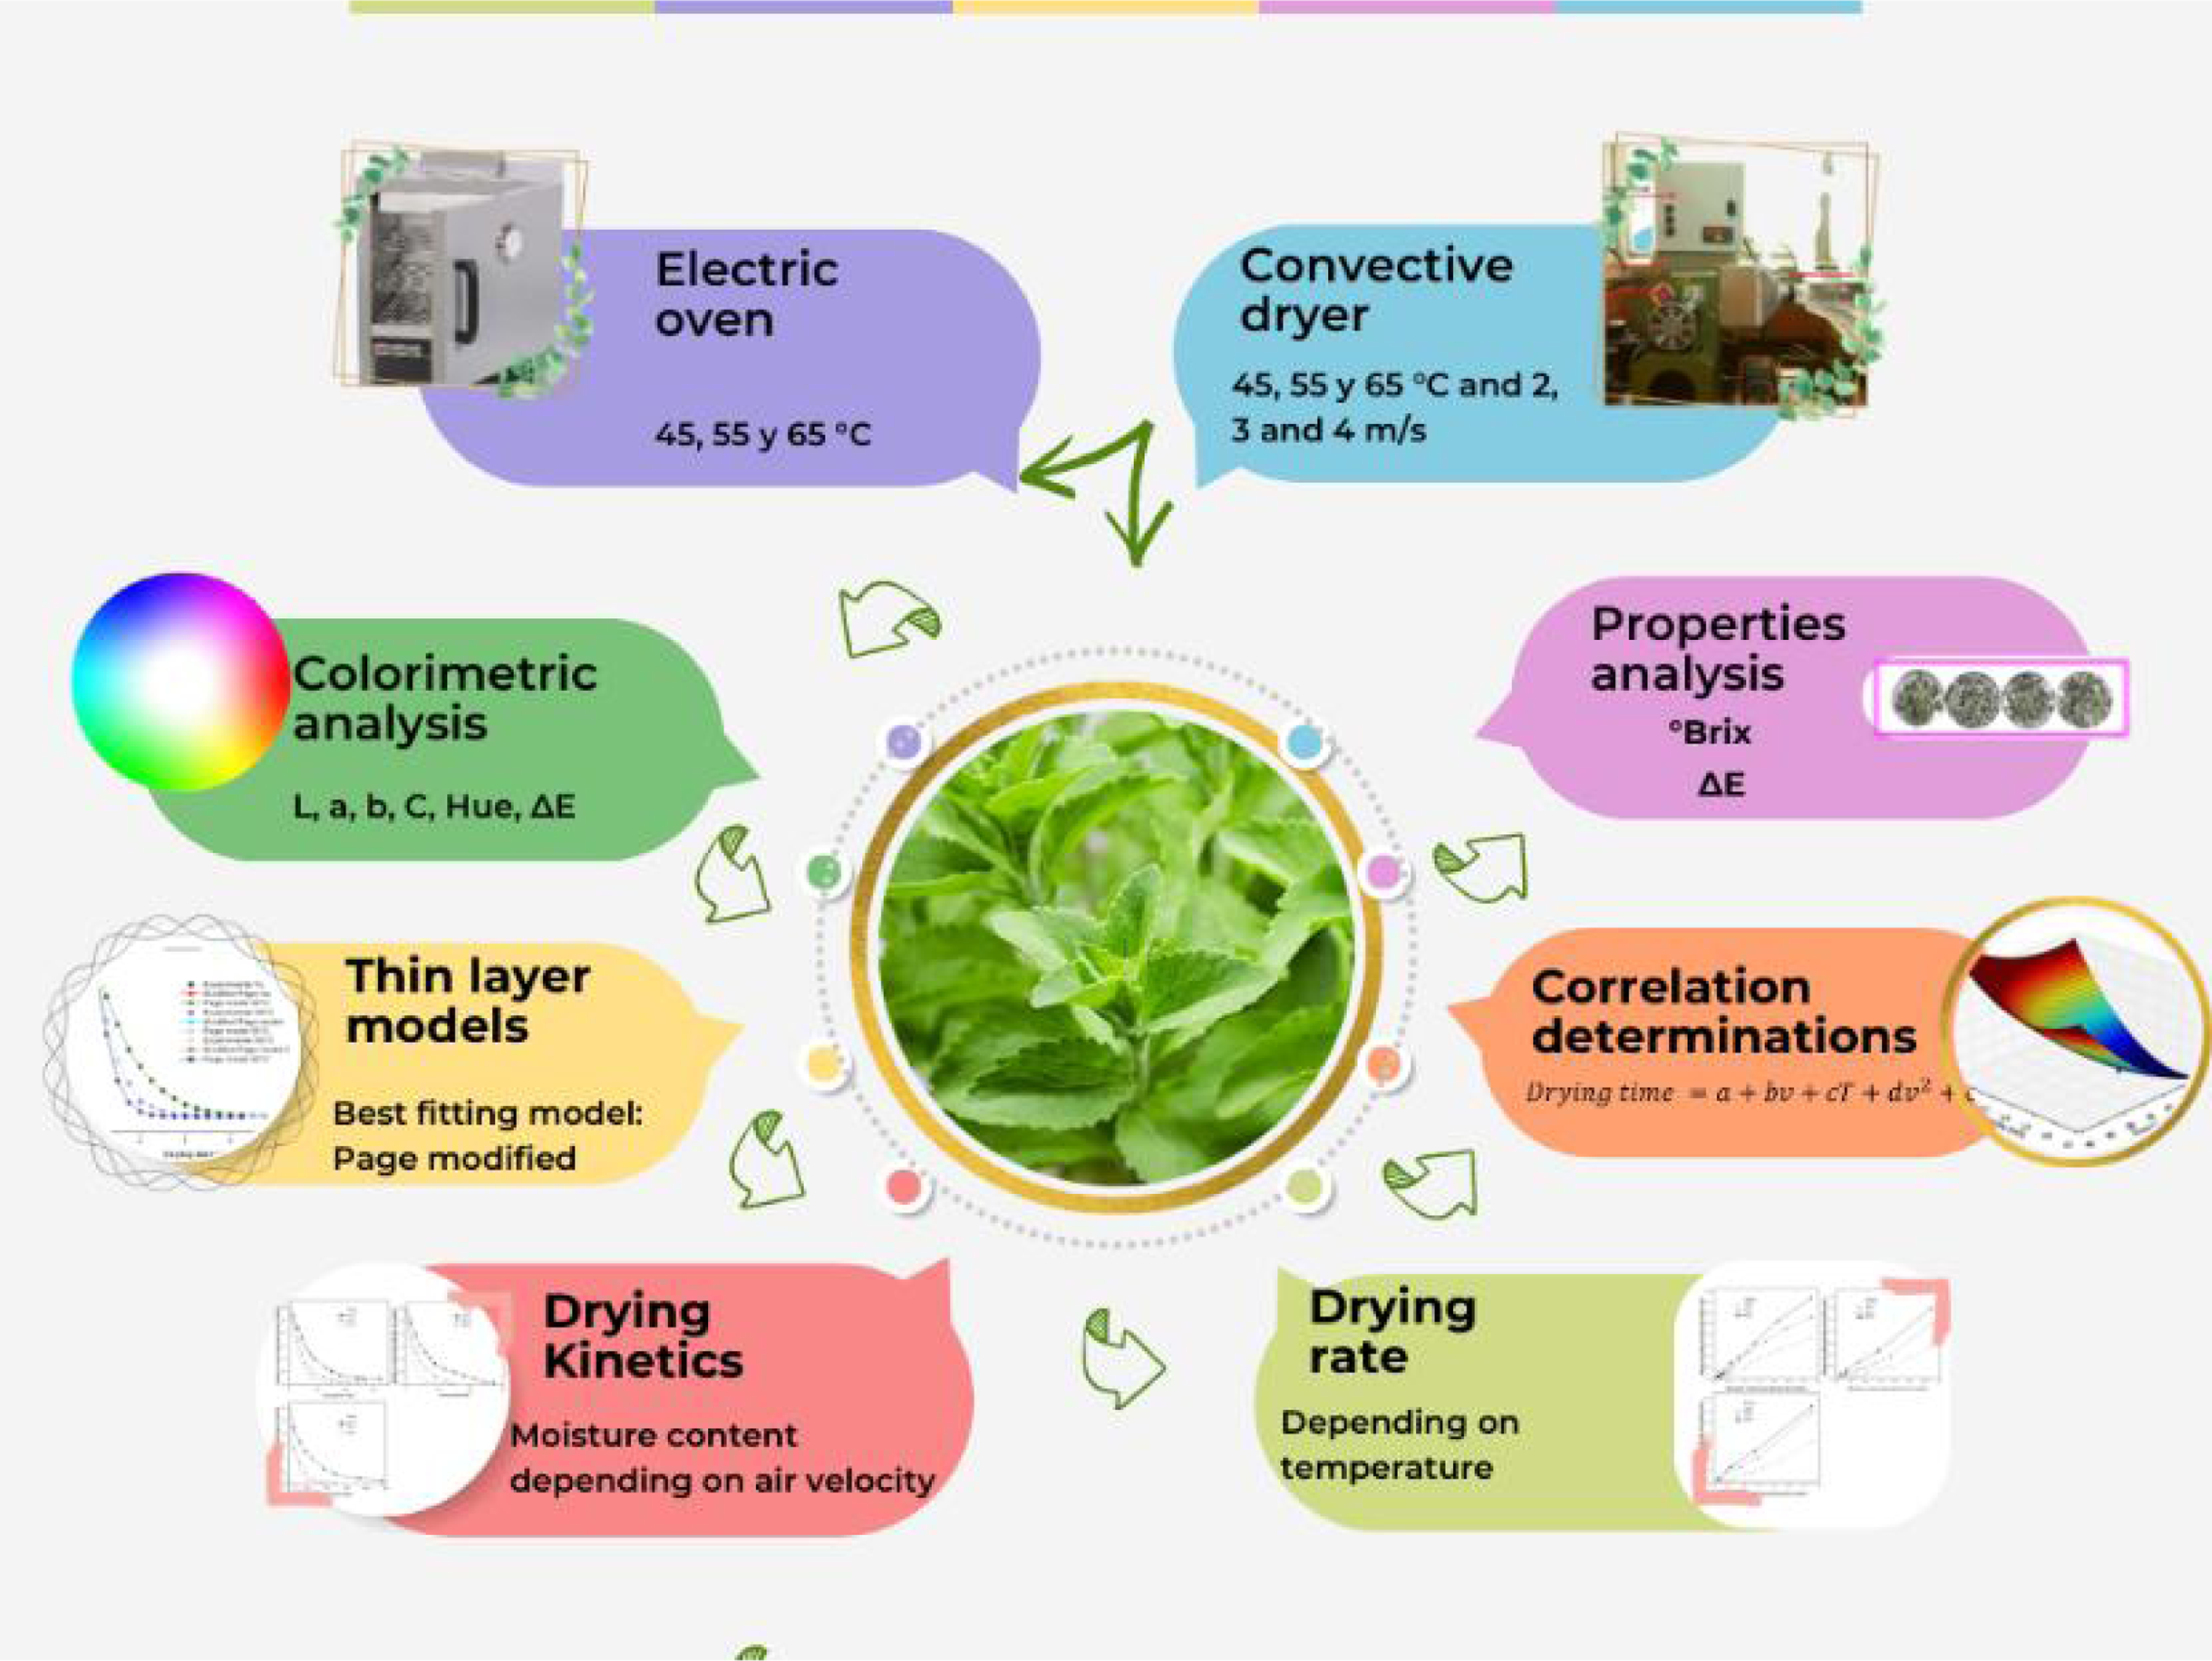
Methodology diagram.
Raw material
Stevia leaves of the variety Morita II cultivated in Morelos, Mexico, were selected, and the sample leaves were chosen based on maturity, color, and freshness. There were no significant differences in size between the two cultures, and each leaf's weight varied between 0.32 ± 0.02 g.
Dryer description
The dry equipment consists of a chamber of transparent plastic, a motor-centrifugal fan, a bank of electrical resistances, a control panel, and a perforated tray with an area of 0.35 m2 placed in the chamber drying. The air circulates longitudinally through the upper and lower of the drying tray and continues outside. The air is driven by a 1/20 hp motor coupled with the centrifugal fan with a maximum volumetric flow of 570 m3/h. The fan takes ambient air, circulates it through the electrical resistance bank, and then to the drying chamber. The air velocity is controlled by a variable current transformer connected to the motor fan, and it was measured at three points to verify the velocity values.
The heating system consists of three finned resistances of 1.5 kW, each one (4.5 kW of total power). Each resistance operates independently, and the temperature is controlled by a PID (proportional–integral–derivative) controller, using PT 1000 thermocouple located in the air diffuser between the drying chamber and the resistances bank. Figure 2 shows the schematic diagram of the dryer with temperature and air velocity control.
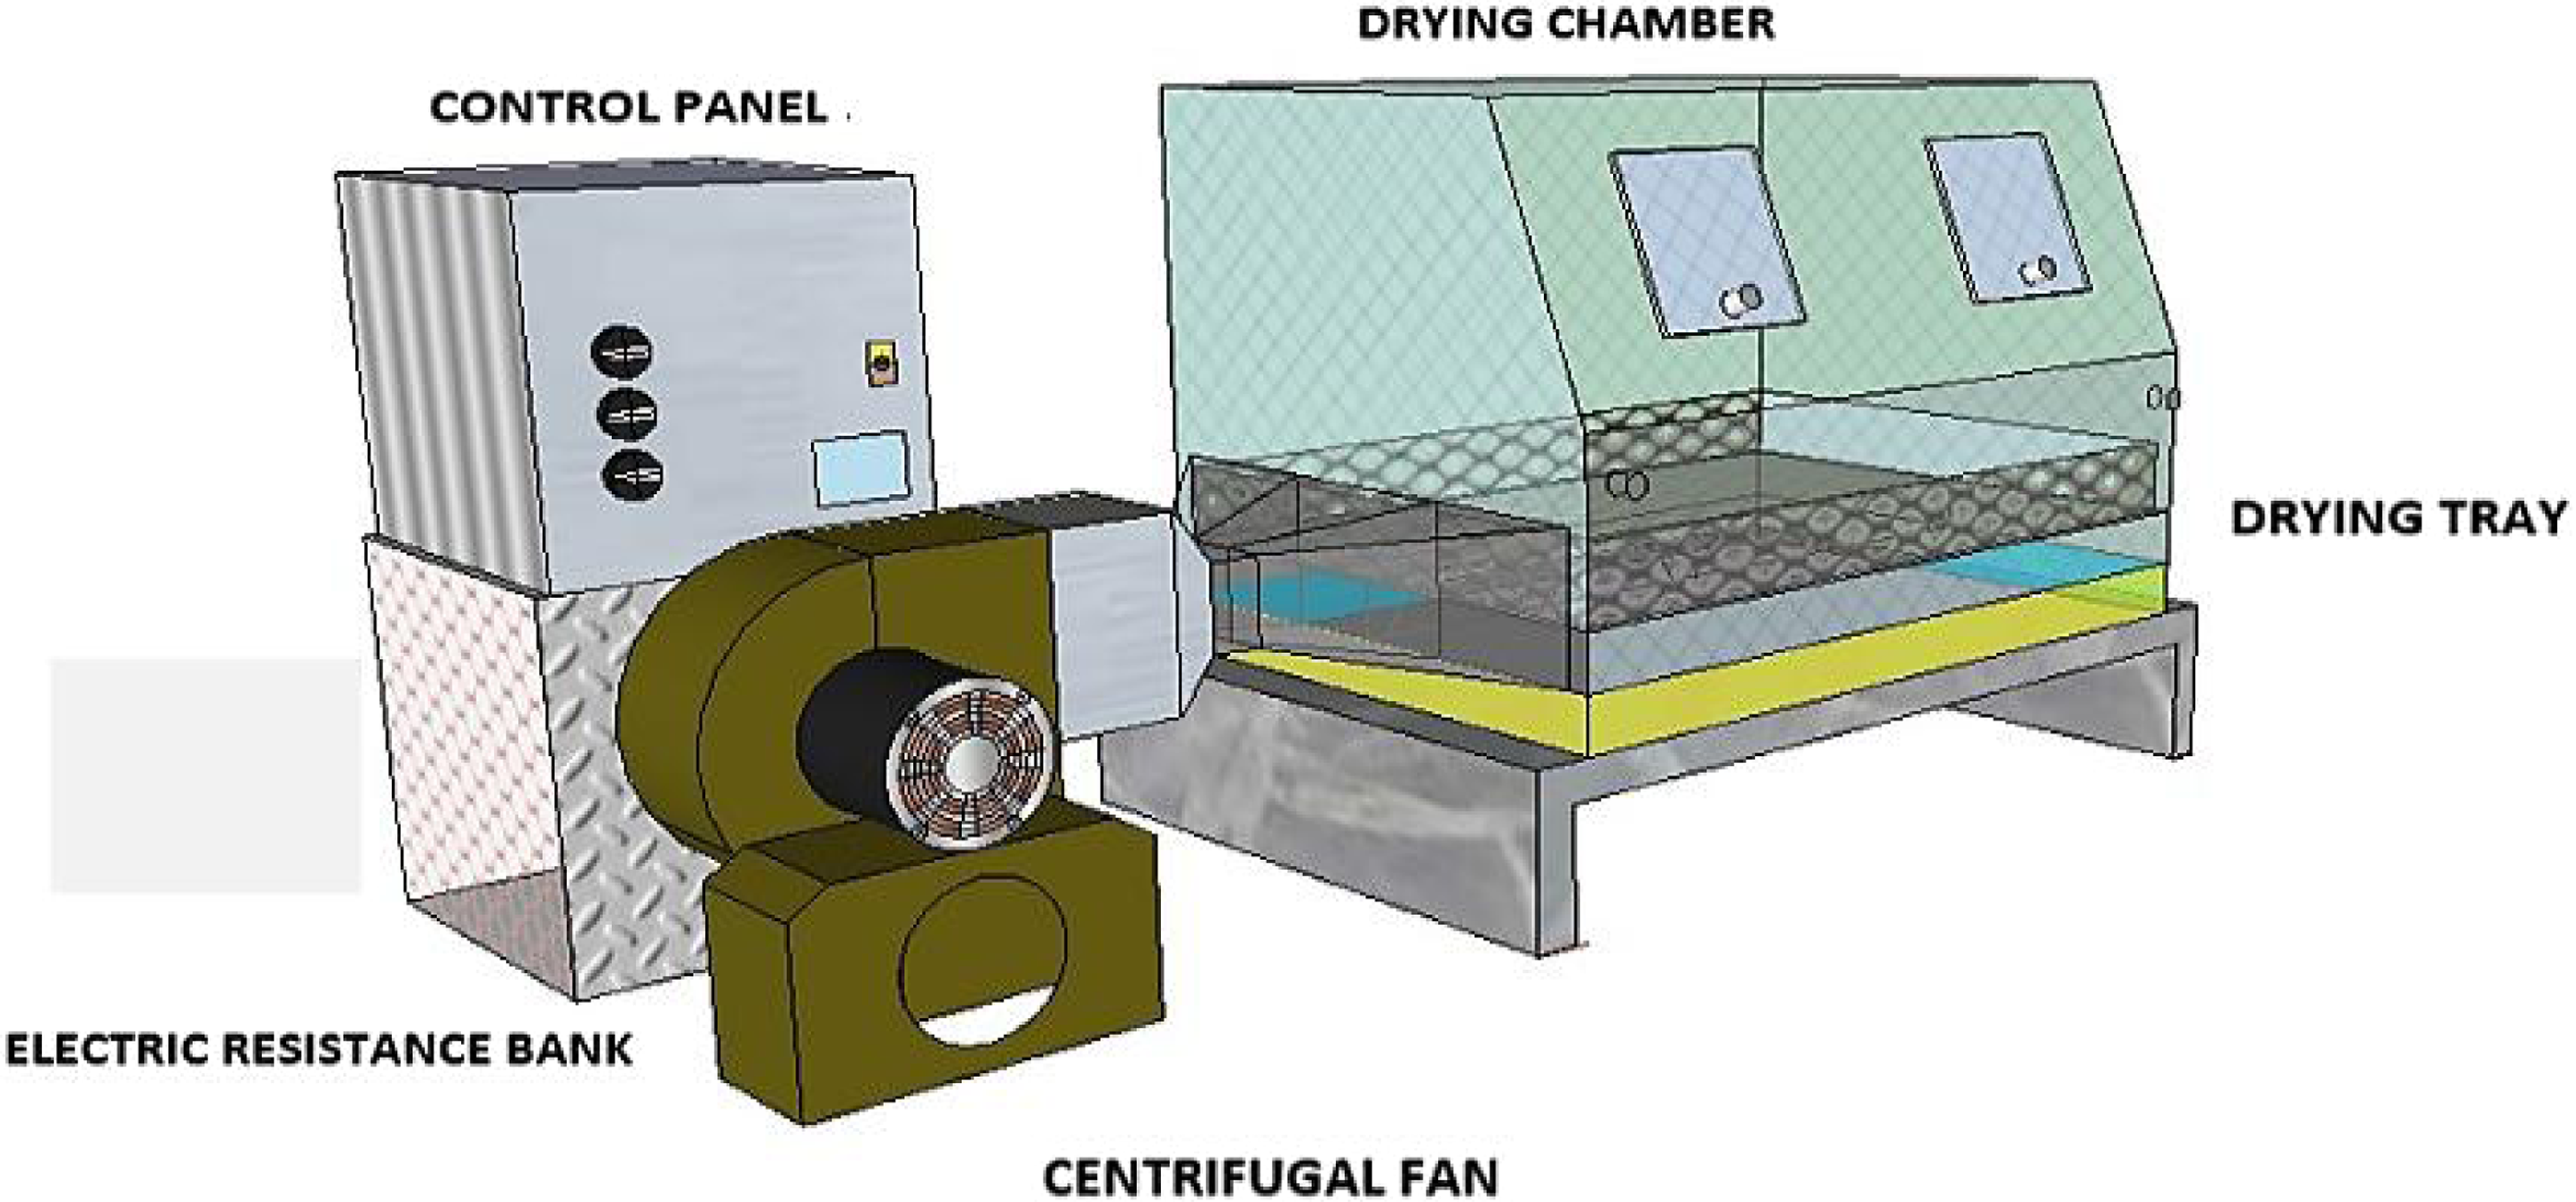
Dryer with temperature and air velocity controlled.
Experimental procedure
Non-convective dryer. For the drying treatment of stevia leaves under controlled temperature, an electric stove non-convective with a PID controller was used to establish the different drying temperatures of 45 °C, 55 °C, and 65 °C. Weight loss was automatically recorded by the precision balance using specific software, conducting three experiences for each. The leaves treated had an average weight of 1.2 g; 20 g were placed in the perforated tray.
Drying under controlled temperature and air velocity
The equipment used to dry the stevia leaves under controlled temperature and air velocity conditions was designed, constructed, and evaluated at the Solar Drying Laboratory of the Instituto de Energías Renovables of the Universidad Autónoma de México.
Each experiment was performed in each technology and evaluated three times to obtain reliable data.
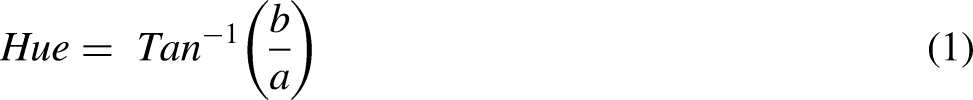
A portable colorimeter was employed to measure the color parameters of the stevia leaf samples. The equipment was calibrated with white and black tiles. The color was expressed in terms of the parameters L (brightness-darkness), a (redness-greenness), b (yellowness-blueness), H (hue angle) property of color, and C (Chroma) saturation or intensity. Hue and chroma were calculated using the equations:

The color difference ΔE between the dried and fresh samples was calculated using the equation (Luna-Solano et al., 2019).

Where ΔL = L of the dried sample − L of the raw sample, Δa = a of a dried sample − a of the raw sample, Δb = b of the dried sample − b of the raw sample.
The total soluble solids or sugar content in Stevia leaves was assessed by measuring the degrees Brix, according to the method reported by Dadzie and Orchard, which consists of measuring the refractive extract index.
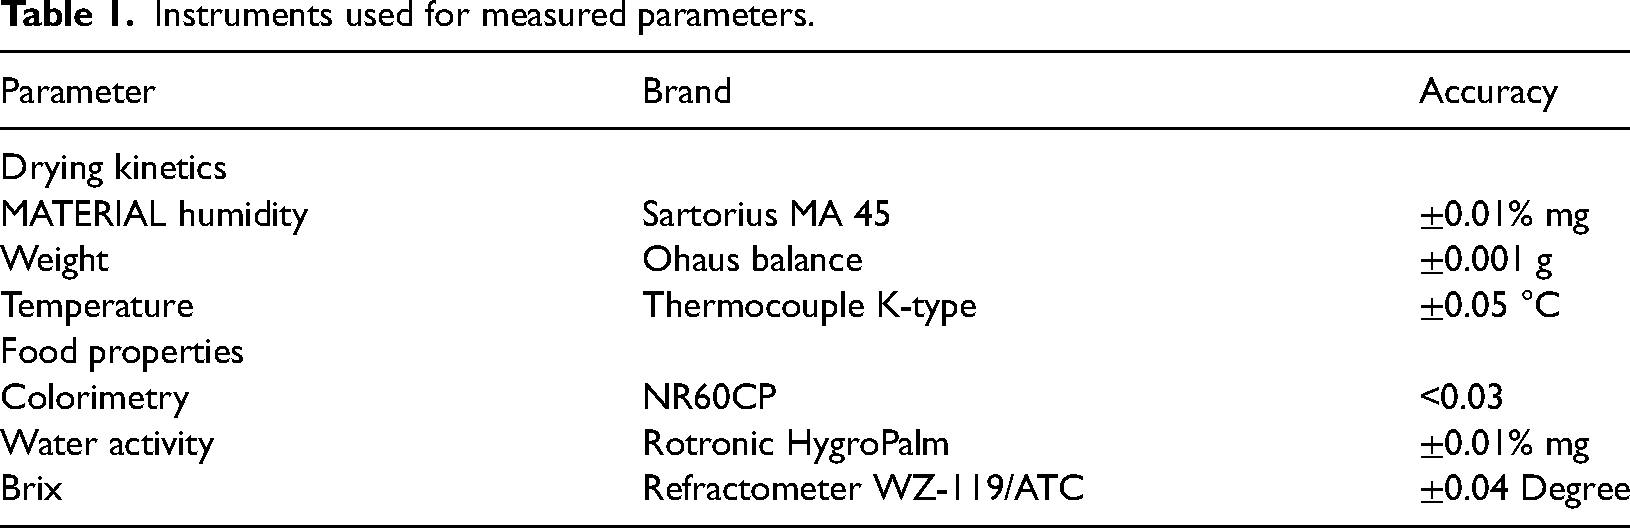
Table 1 shows the experimental parameters, the equipment used, and accuracy.
Instruments used for measured parameters.
Modeling
Thin layer modeling
The models analyzed in this study are shown in Table 2. The moisture ratio MR is a function of the drying time and is calculated according to (Toĝrul and Pehlivan, 2004):
Thin-layer drying models based on moisture ratio applied to the drying kinetics.
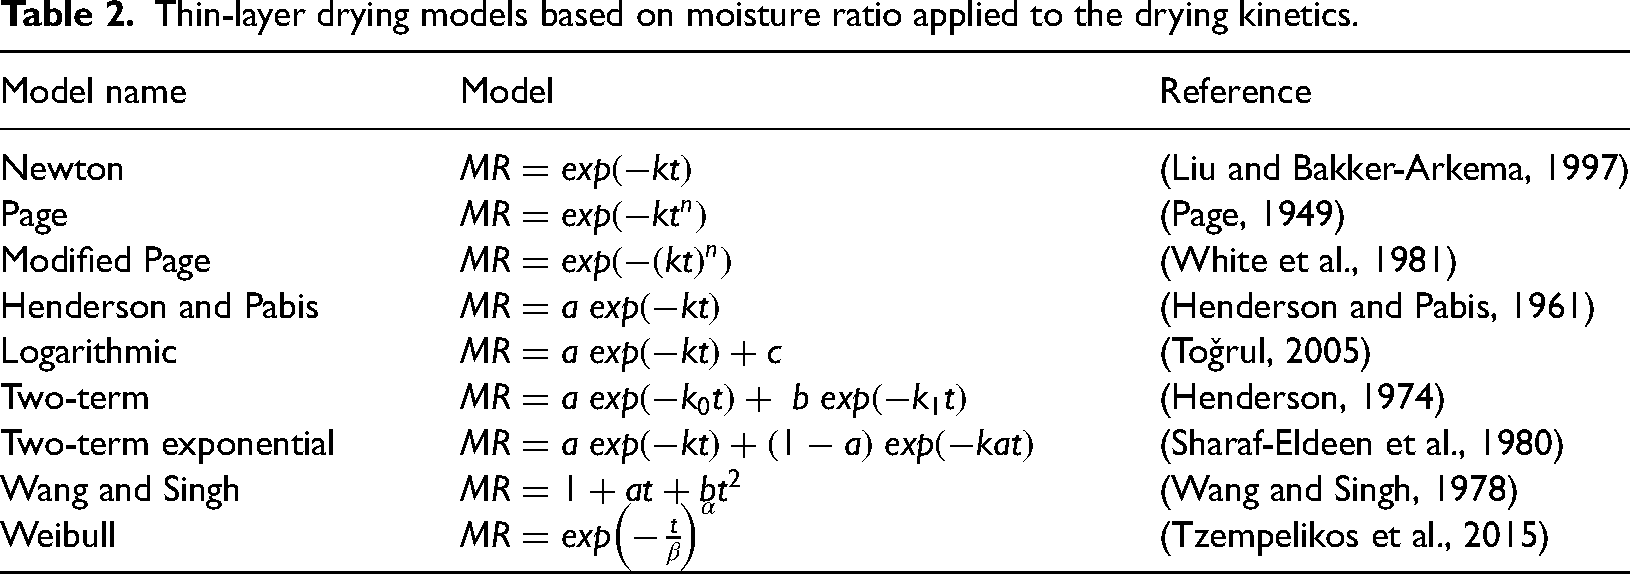
Where Mc is the moisture content, Me is the equilibrium moisture, and Mo is the initial moisture.
Modeling the drying kinetics of different foods requires statistical methods of regression and correlation analysis. Models with linear and nonlinear regression are essential to determine the relationship between different variables. This work found the constants and coefficients of the best-fitting model involving stevia drying air temperature and velocity. Also, multiple linear regression analyses examined the correlation of these variables on the coefficients. All these statistical analyses were calculated using DataFit 9.1 from Oakdale Engineering software.
Statistical parameters such as the coefficient of determination (R2) were used as the primary criteria for selecting the experimental results’ best-fitting model. In addition, the reduced chi-square, χ2 (mean square of the deviations among test information and projected data from the models), root mean square error analysis, and RMSE (difference among experimental and predicted data). For the best fit of the experimental data, the coefficient of determination should be higher, and the χ2 and RMSE should be lower (Kavak Akpinar et al., 2006).
Results and discussion
No convective drying
Table 3 shows the initial and final water activity and fresh and dry leaf humidity at the established drying temperatures. Final humidity was lower than those obtained (10%) in commercial products (Jeria and Pozo, 2011).
Humidity and water activity (aw) at three temperatures.
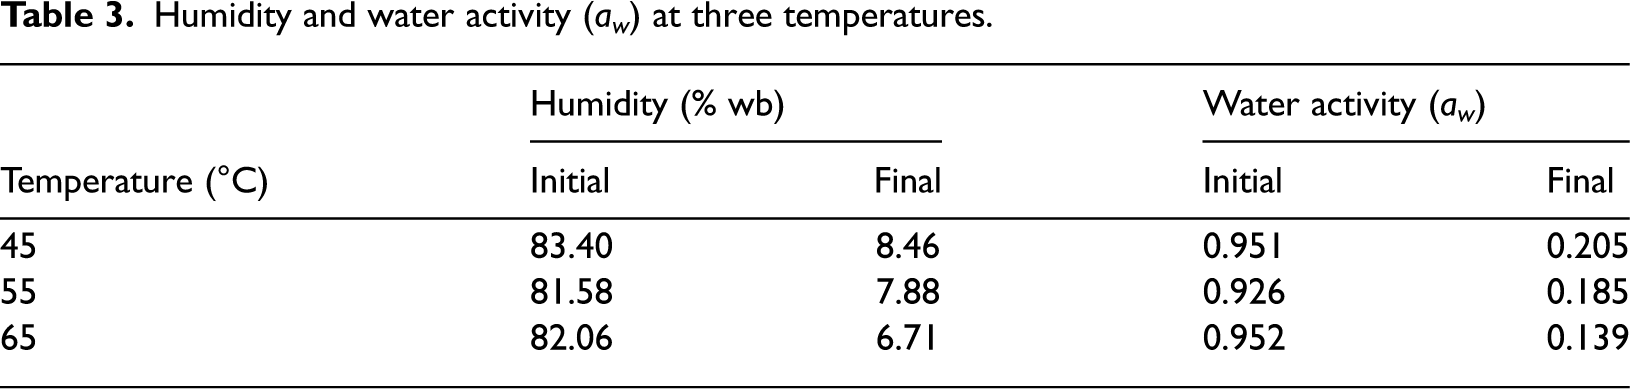
From Table 3, it can be observed that moisture and water activity at the end of the drying process are lower than those at the beginning, which reduces the spoilage or food safety problems by reducing a variety of chemical, biochemical, and physical changes.
Kinetics drying at temperature controlled
Figure 3(a) and (b) represents the MC as a drying time function and the drying rate at 45 °C, 55 °C, and 65 °C obtained in the non-convective.
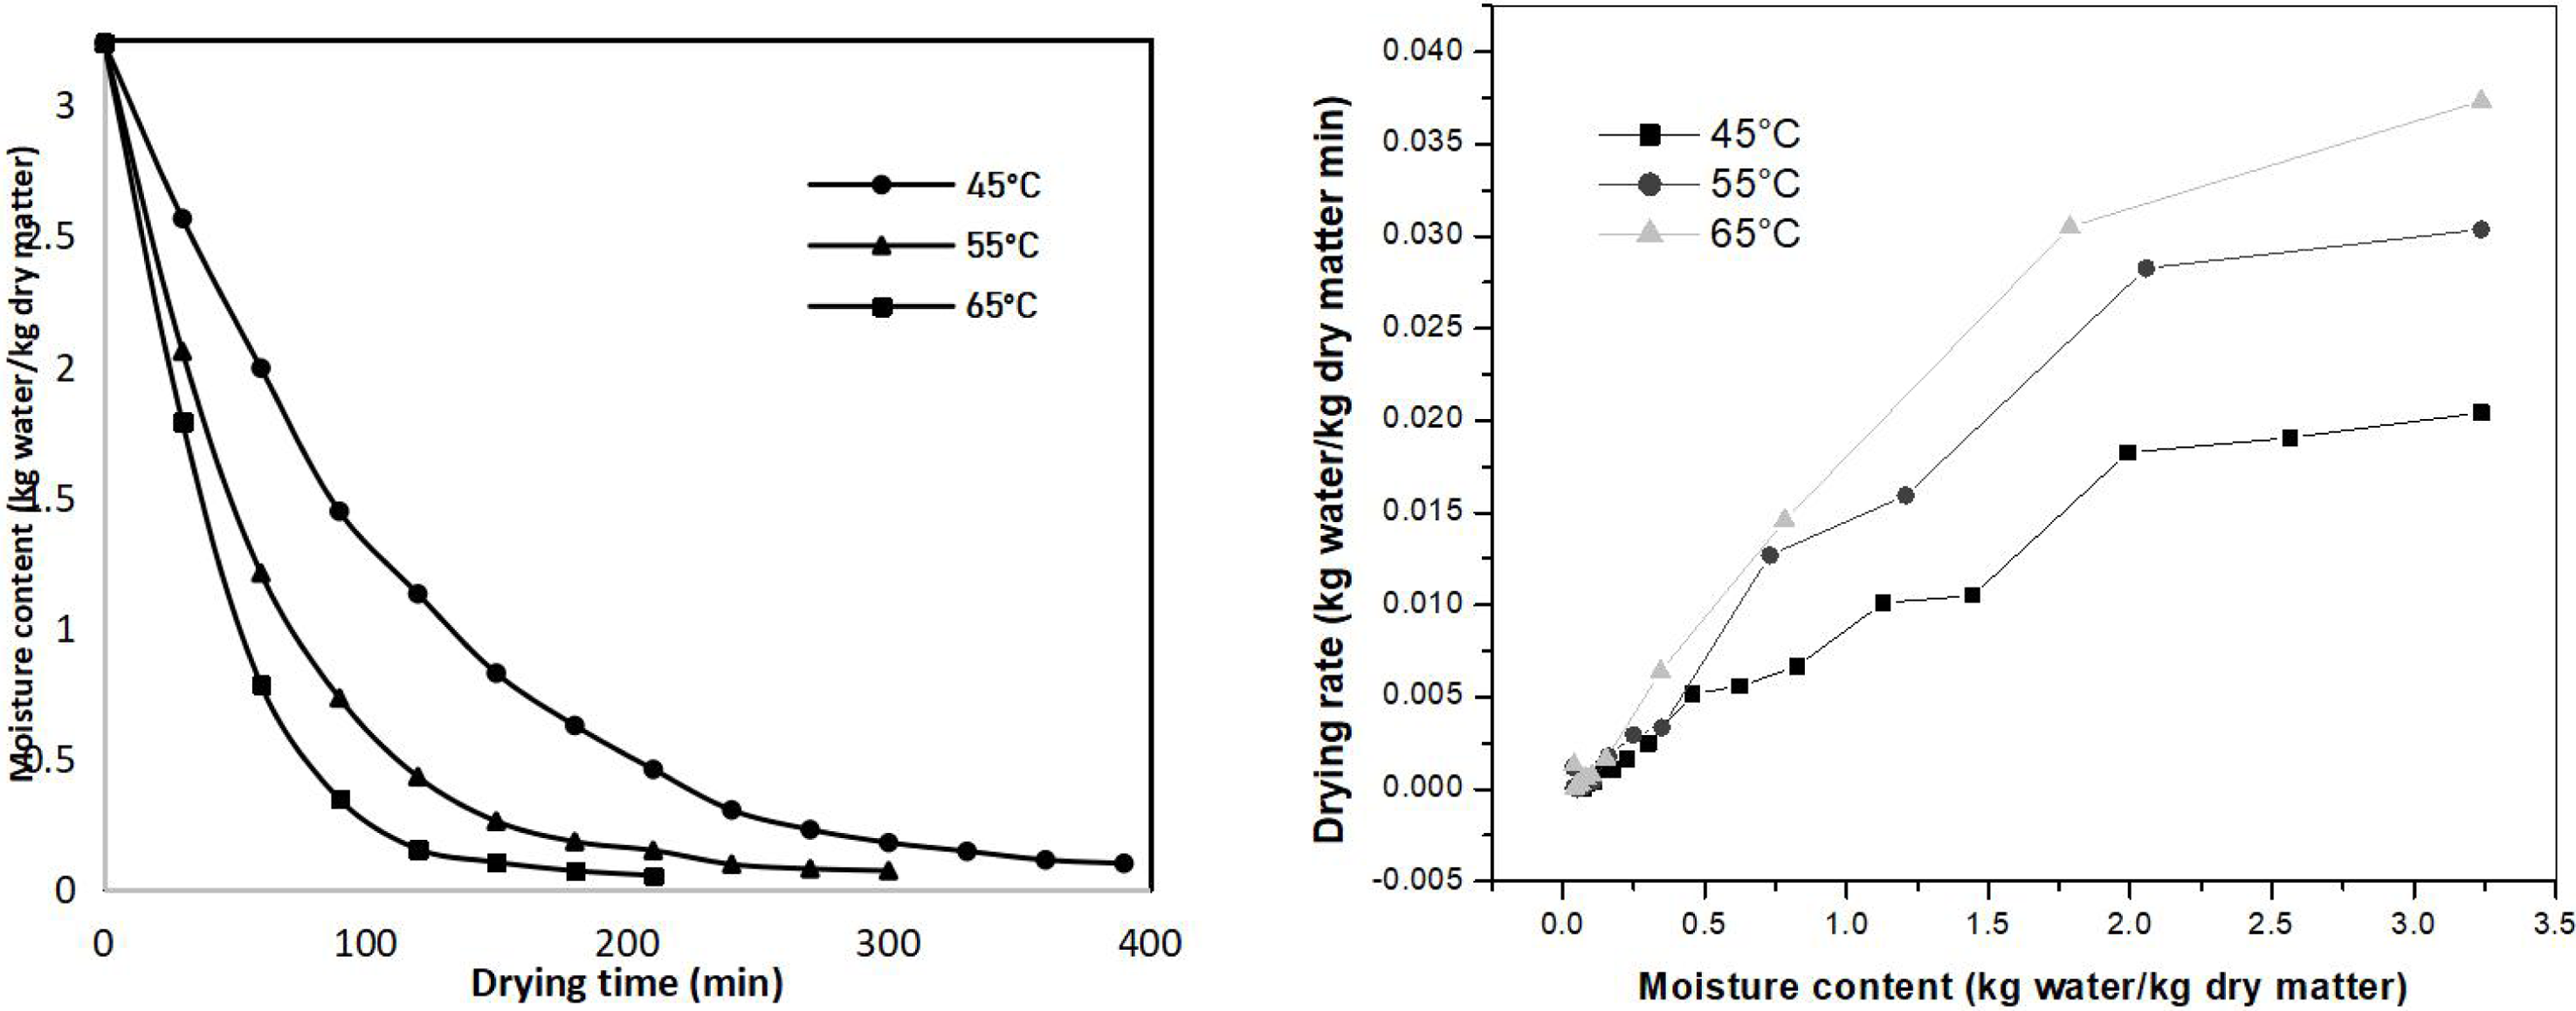
(a) MC as a function of the drying time and (b) drying rate under controlled temperature conditions in the non-convective electric oven.
As shown in Figure 3(a), the MC at the three selected temperatures stabilized in the following drying times: 240 min at 65 °C, 330 min for 55 °C, and finally at 450 min for 45 °C.
Figure 3(b) shows the drying rate evolutions depending on the MC for each drying established temperature. First, it is observed for 65 °C kinetics; the highest drying rate is obtained with an MC of 3. 23 and 0.037 kg water/kg dry matter min; the highest drying rate at 55 °C was found with an MC of 3.23 and 0.030 kg water/kg dry matter min.
There is a lack of a constant drying period; the drying process was performed in the falling rate period, indicating that the process was controlled mainly by an internal physical diffusional moisture transport mechanism. These results agree with those obtained by Doymaz et al. and Lemus-Mondaca et al., (2015) concerning drying leaves and vegetables.
A decreasing velocity period indicates an internal resistance (between 1.2 and 1.5 kg water/kg dry matter for 45 °C). The MC in the leaves is enough to keep the pores saturated; hence, it decreases the diffusivity of water, and, therefore, a diminution in the drying rate was observed.


The coefficient of determination for the correlation is 0.9749. Figure 4 represents the drying time depending on temperature and air velocity.
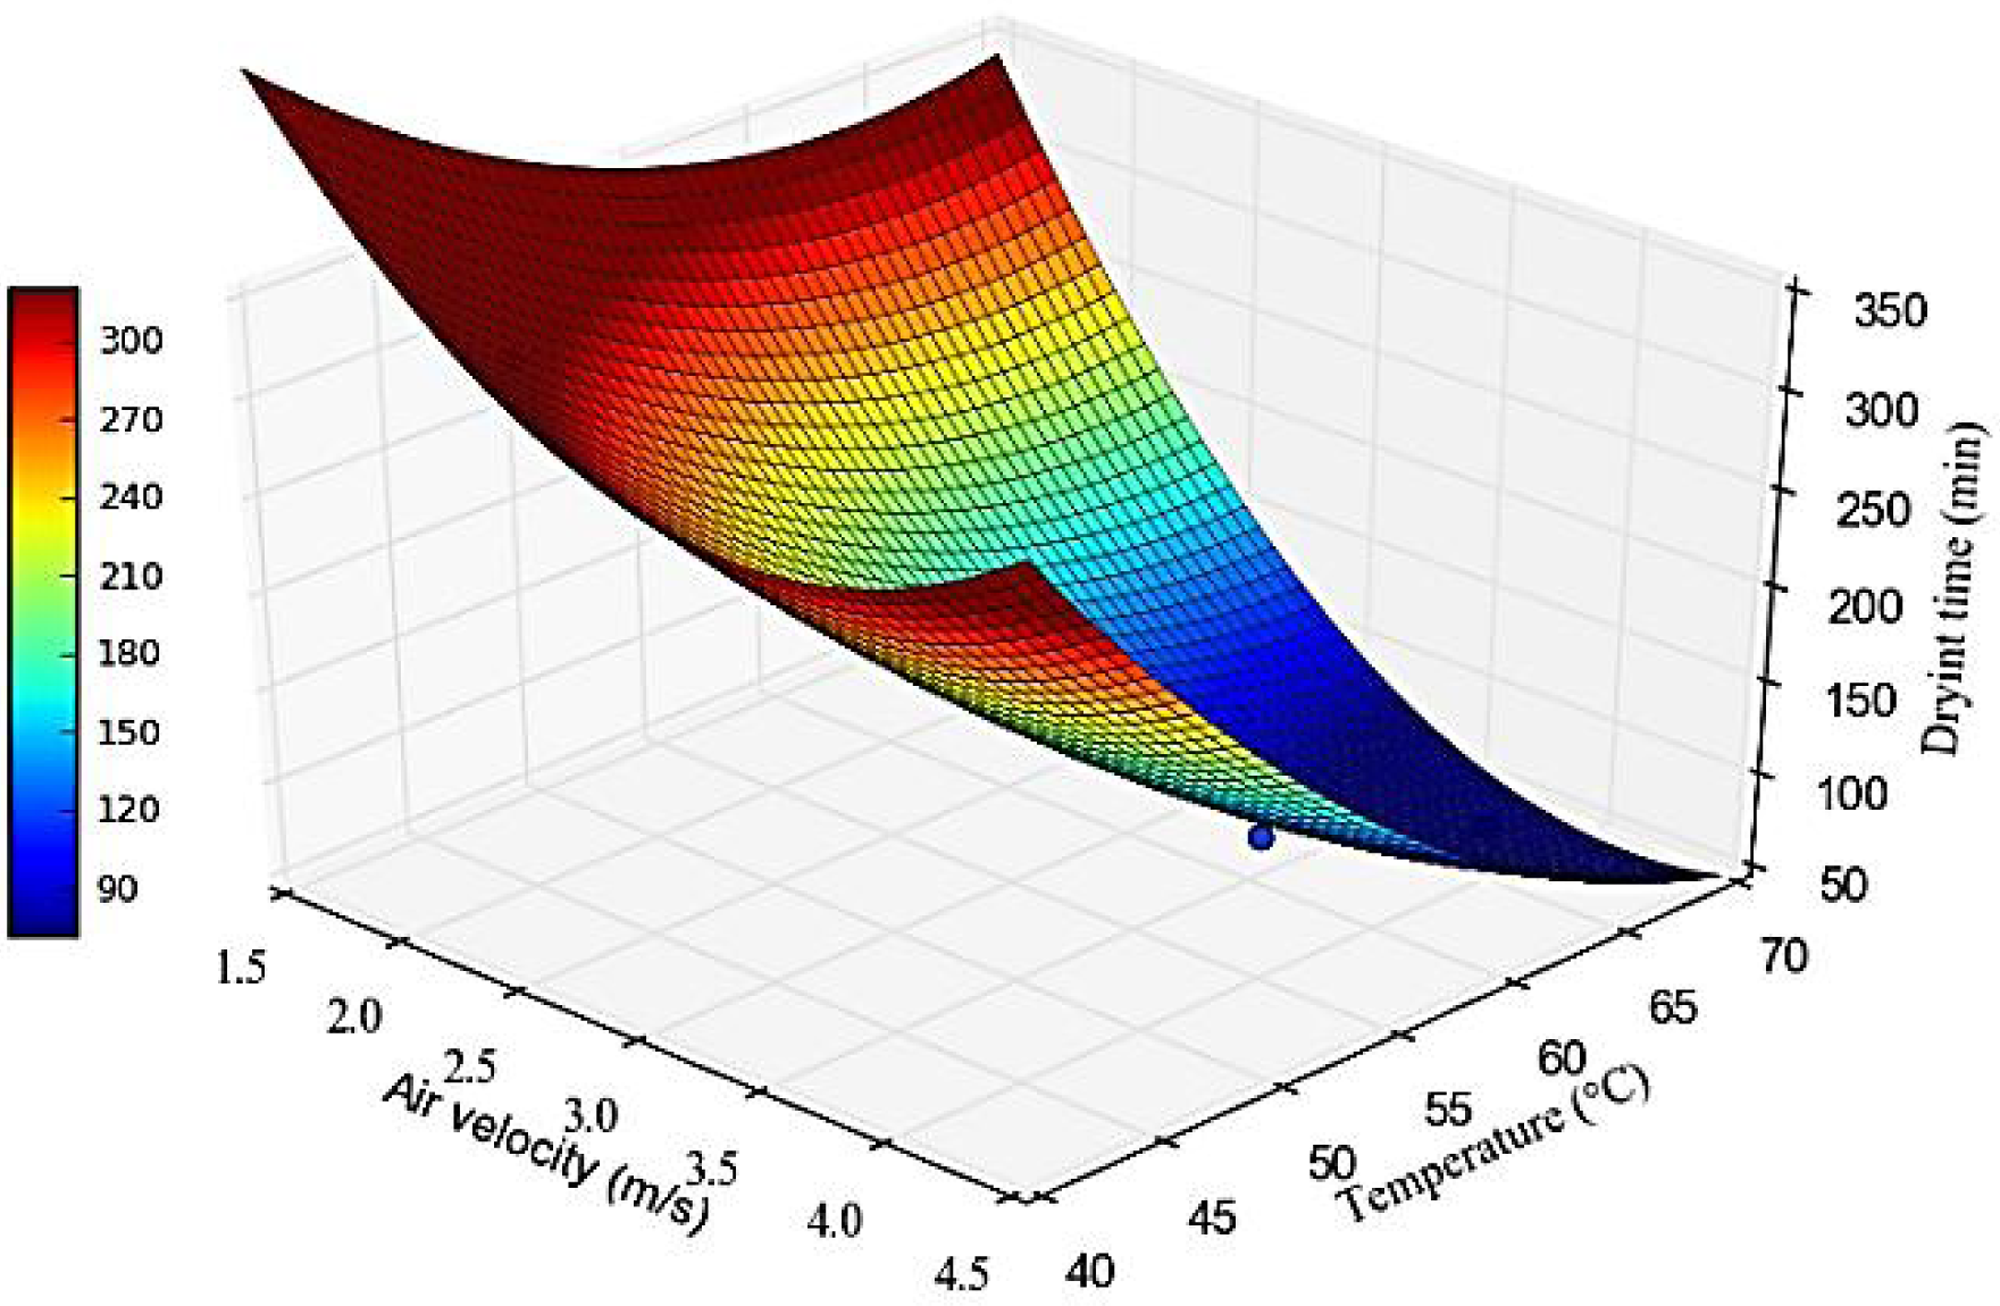
Drying time depending on temperature and air velocity.
Mathematical modeling
Table 4 presents the mathematical modeling for drying kinetics in the electric oven under controlled conditions at natural convection. It shows the values of the constants’ best adjustments of the different thin-layer drying models analyzed.
Fitting models for non-convective drying in the electric oven.
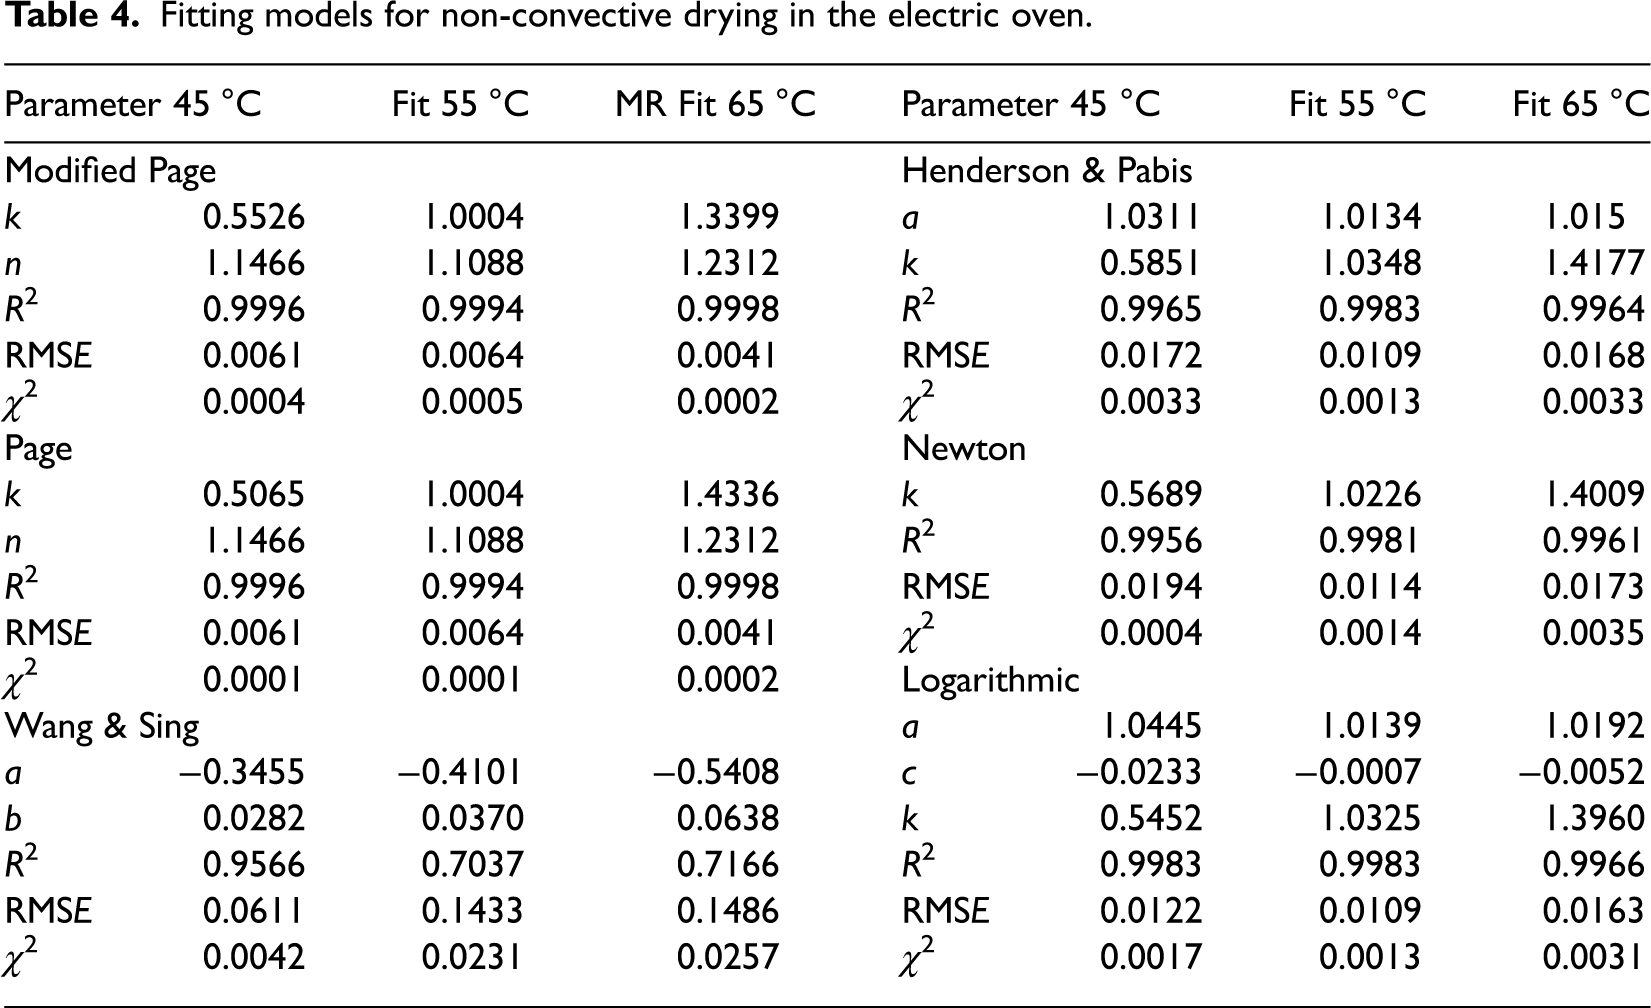
There is a good agreement between experimental data and the mathematical models, verified with high values of the R2 (0.9996–0.9962). Nevertheless, the Page model was the best-fitting model with the highest R2 and the lower RMSE and χ2.
Figure 5 shows the three best adjustments for each temperature, evaluated in the electric oven without forced convection and experimental kinetics drying.
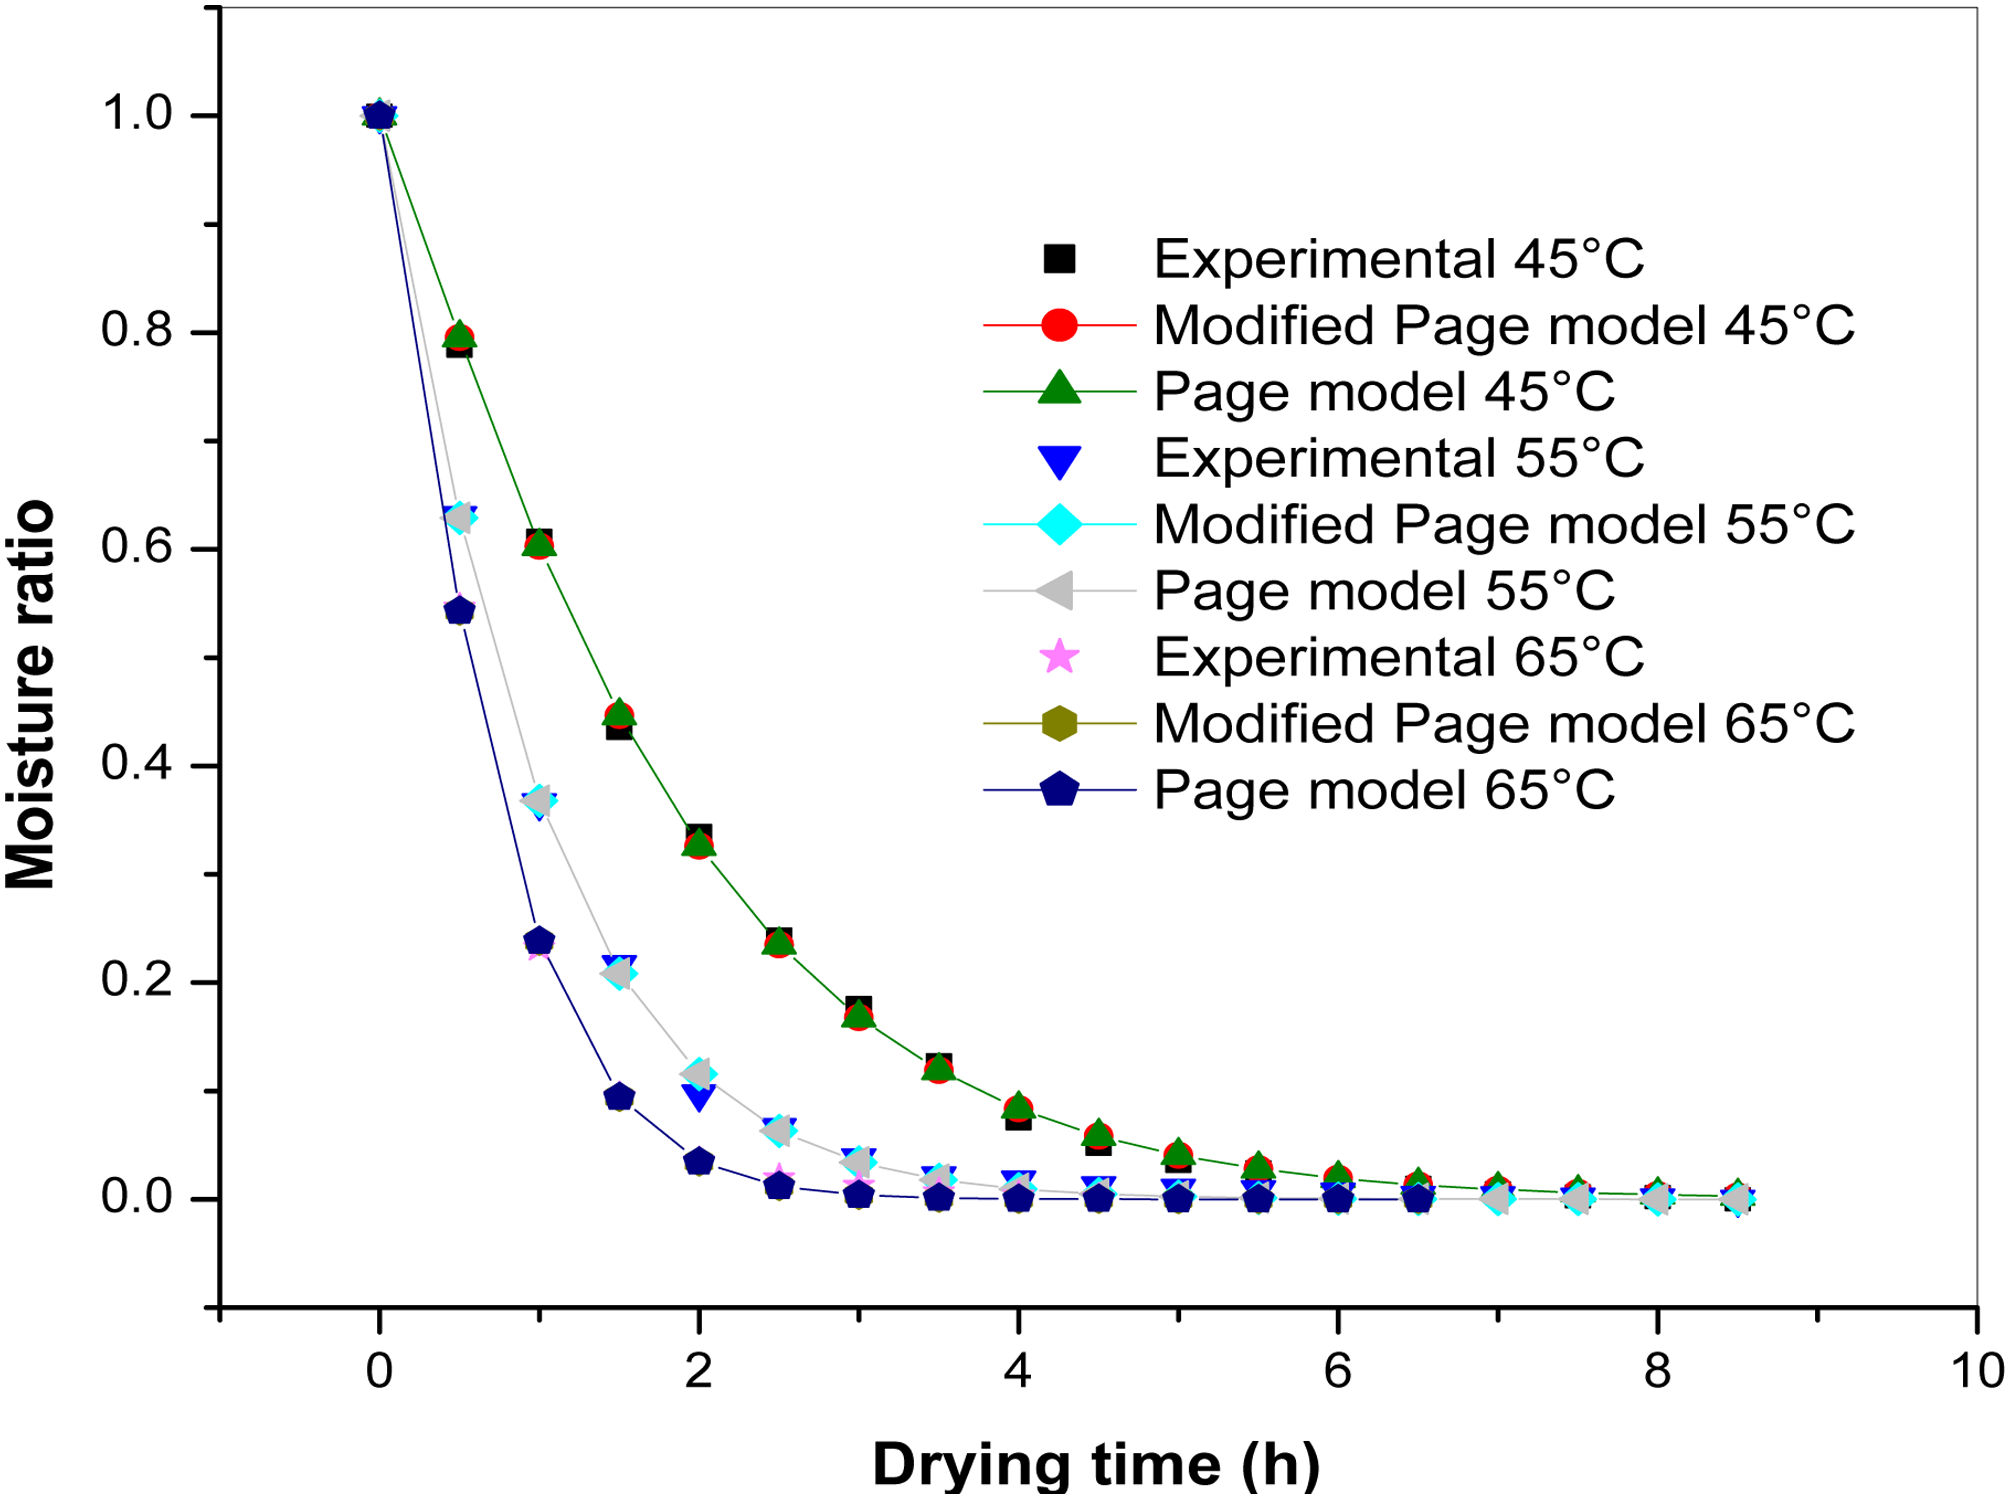
Fixed models in natural convection.
Figure 5 and Table 4 show that the best-fit adjustments were obtained with Modified Page, Page, and Logarithmic models. The R2 were: In the case of 45 °C, Modified Page and Page 0.9996, and Logarithmic with 0.9986; on the other hand, for 55 °C, Modified Page and Page 0.9994 and Logarithmic with 0.9983; finally, at 65 °C, Modified Page and Page with 0.9998, and Logarithmic with 0.9966.
Convective drying
Kinetics drying at controlled temperature and air velocity
Figure 6 shows the MC's variation during drying, with different air velocities (2, 3, and 4 m/s) and the temperatures selected (45 °C, 55 °C, and 65 °C) in the designed dryer. It is essential to mention that the 0.5% error for the scale in the graphics is considered according to the manufacturer's technical specifications.
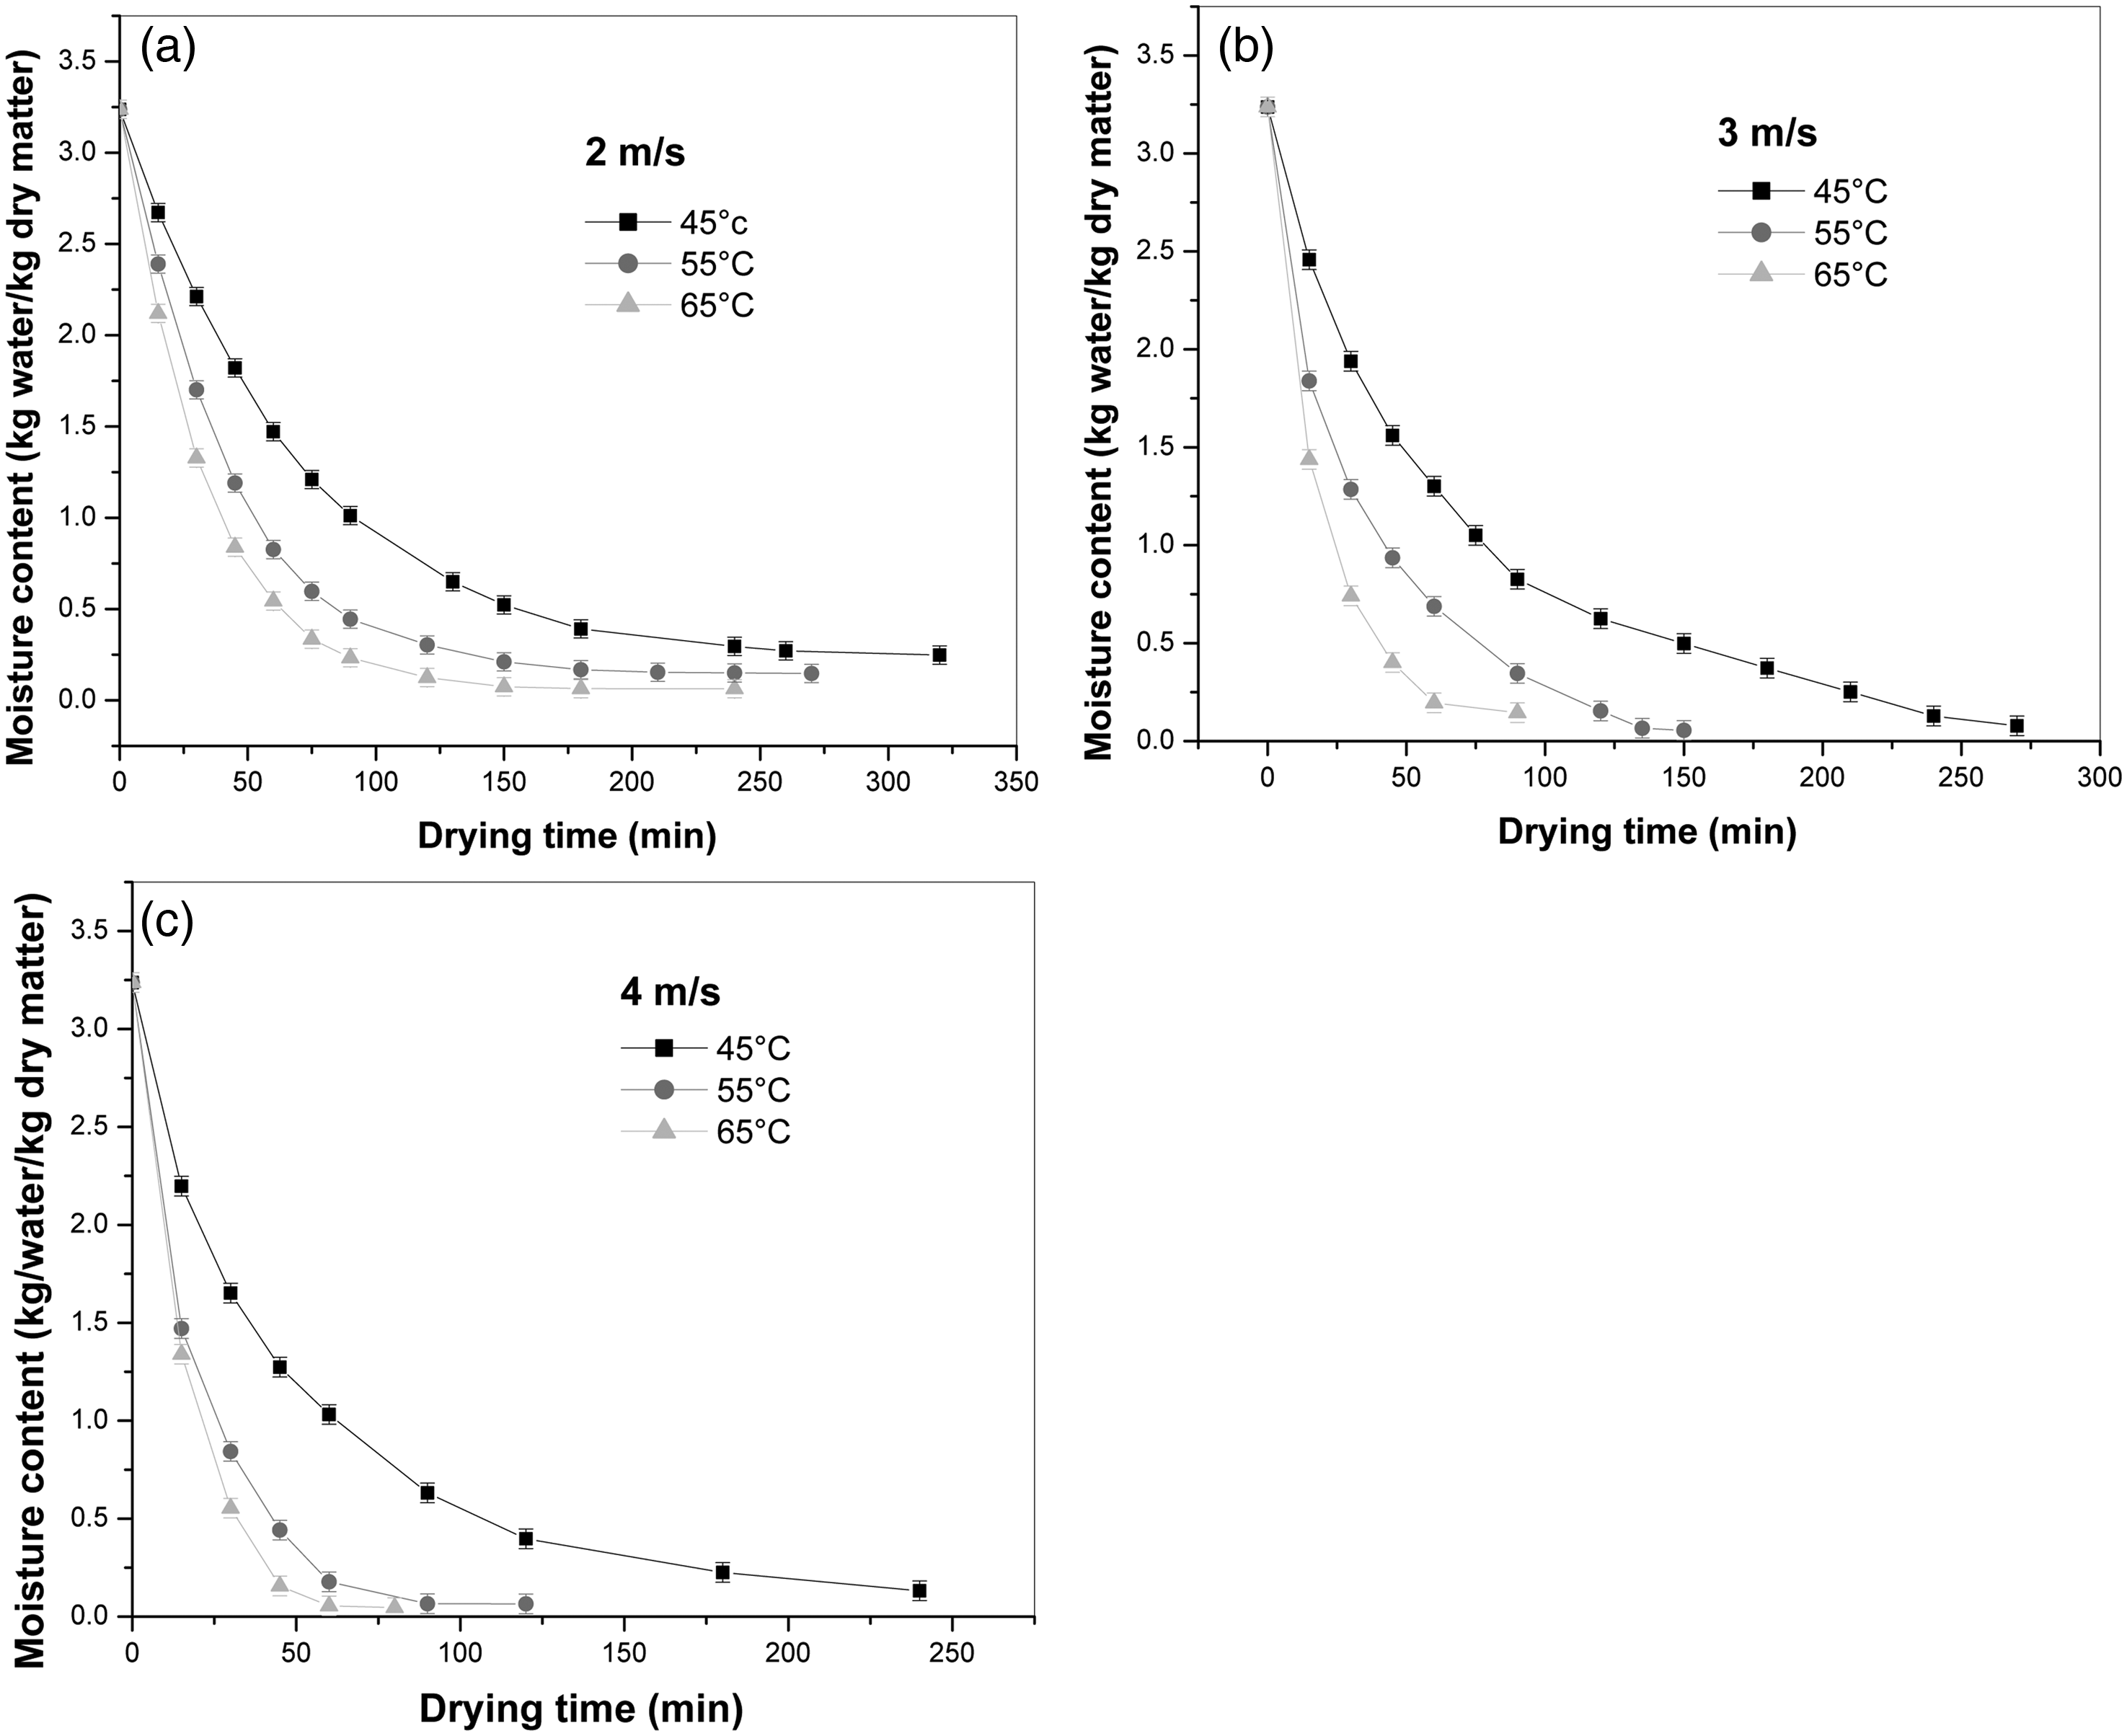
MC at (a) 2 m/s, (b) 3 m/s, and (c) 4 m/s air velocity.
Results show a significant effect of air velocities on the drying rates of stevia leaves. The increase in these variables causes a higher evaporation rate, and the MC decreases faster when the air velocity increases, keeping a constant temperature.
Moreover, for the temperature at 65 °C and 2 m/s, MC decreased significantly, stabilizing at 180 min, very close to 55 °C, which stabilized at 240 min. Drying kinetics at 45 min finalized at 320 min (Figure 4(a)).
The evolution of MC at 3 m/s can be observed in Figure 4(b). The slower drying kinetics was at 45 °C, with a final MC of 0.11 at 270 min. For 55 and 65 °C, kinetics was much shorter, concluding the drying time at 150 and 90 min, respectively.
Figure 6(c) illustrates the MC's analysis at 4 m/s, where drying kinetics were finalized in less time than in the lower air velocities. For 45 °C, 55 °C, and 65 °C, it stabilized at 240, 120, and 80 min, respectively.
Drying rate
Figure 7 shows the drying rate as an MC (db) function for the established temperatures and air velocity ranges.

Drying rate (a) 2 m/s, (b) 3 m/s, and (c) 4 m/s air velocity.
For air velocity at 2 m/s and 65 °C, MC decreased from 3.23 to 0.06 kg water/kg·dry matter, with an initial and final drying rate of 0.07 and 0.001 kg water/kg·dry matter min. This result is similar for 55 °C, with initial and final MC of 3.23 and 0.14 kg water/kg·dry·matter. The highest drying rate at 45 °C was 0.04 kg water/kg·dry matter min and initial and final MC 3.23 and 0.23 kg water/kg dry·matter. One constant drying rate period between the MC of 1.66 and 1.40 kg water/kg·dry matter was observed.
For air velocity at 3 m/s, the slower drying kinetics was at 45 °C, with MC and final drying rate of 0.11 and 0.002 kg water/kg of dry matter min, respectively. Only one period of constant drying rate was observed between 1.66 and 1.40 kg water/kg of dry matter of MC. At both 55 °C and 65 °C, the drying rate decreased. The highest drying rate occurs at 65 °C at 0.12 kg water/kg of dry matter and the final of 0.005 with an MC of 3.23 and 0.15 kg water/kg of dry matter.
Colorimetric analysis
The herbs and vegetables’ color is crucial for their commercial acceptability. Initial values of stevia leaves color parameters were L = 40.42, a = −10.94, b = 18.45, chroma = 21.45, and Hue = 120.68. These results showed that the stevia leaves have a characteristic green color defined by the Hue angle (120.68) and the low luminosity (40.42); such parameters indicated a tendency from yellow to green in the raw stevia leaves. During drying processes, photodegradation of chlorophyll was observed due to the combination of light and oxygen during heating, causing the loss of green color and the tendency of green toward yellowness (Luna-Solano et al., 2019). In Table 5, it was observed that there is an increase in luminosity at different drying conditions and a decrease in the Hue angle, causing a visual degradation of the green to opaque green-yellow color. The most significant color difference was presented in the dry stevia leaves at 65 °C and a drying air rate of 4 m/s. Obtained colors in extreme air conditions applied are shown in Figure 8.
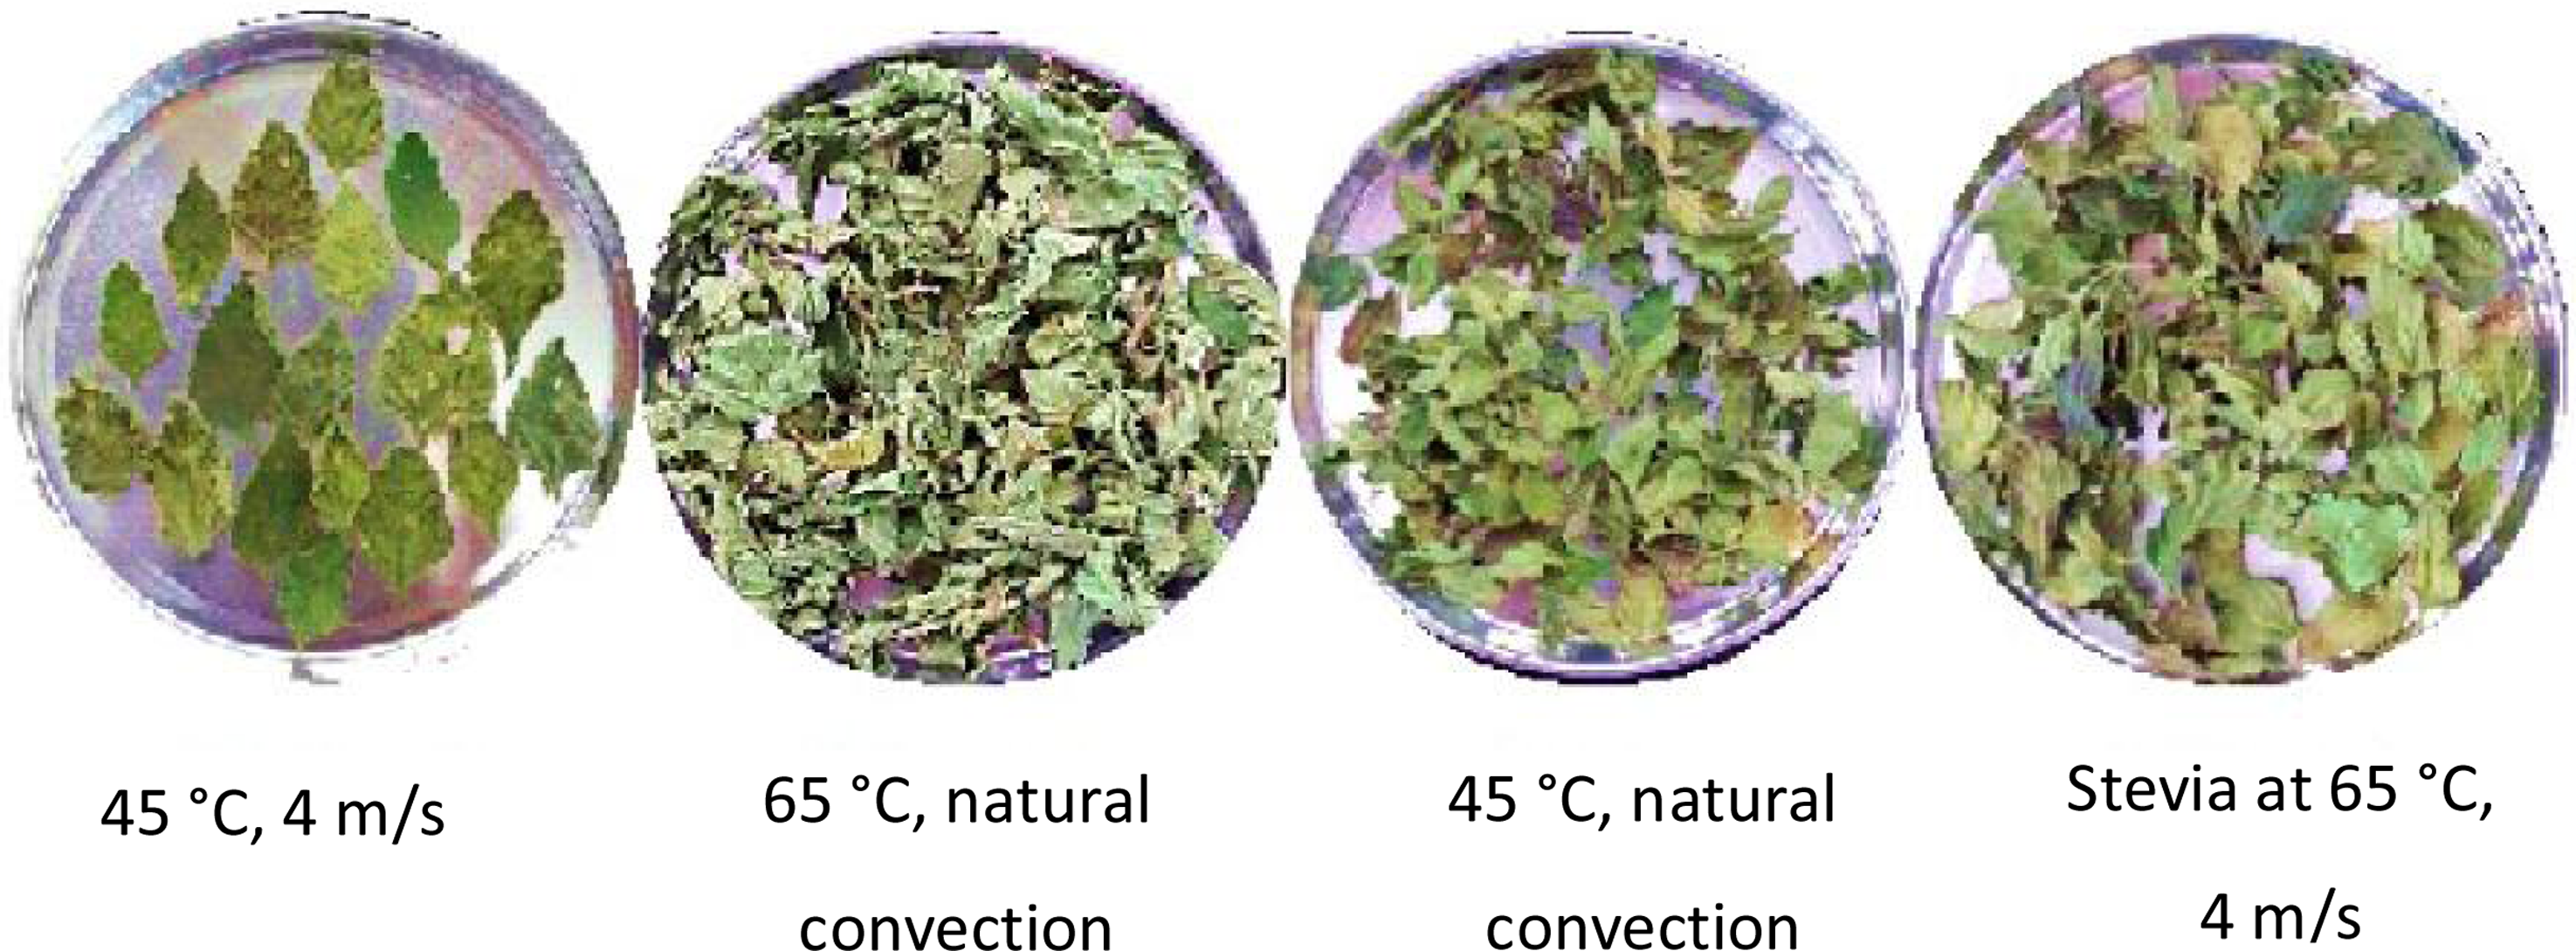
Dehydrated leaves at extreme conditions used.
Colorimetric and steviol glycoside analysis at initial and final characteristic samples.
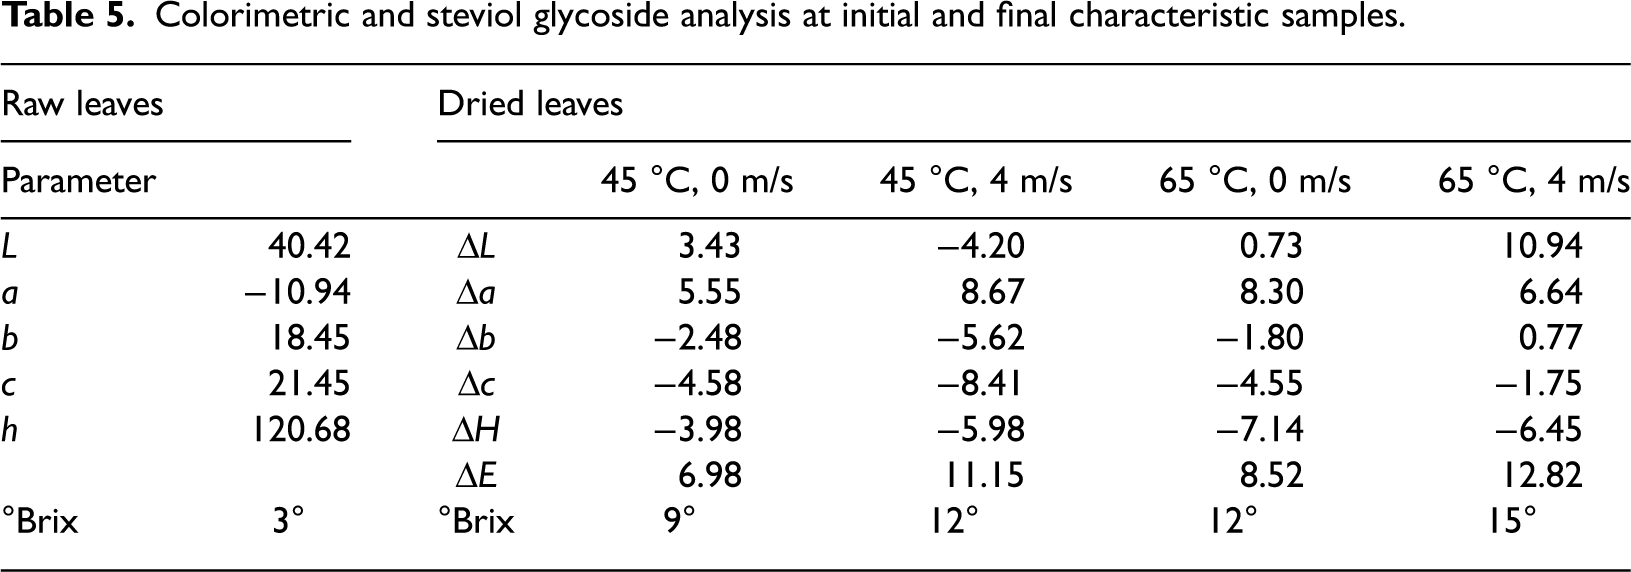
The total color change in all experiments was strongly positively correlated, r(20) = 0.8954, p < 0.01. Similarly, ΔE increases when air velocity increases, with an r(20) = 0.94, p < 0.01.
The slightest color difference was observed at a drying temperature of 45 °C at natural convection. Color difference values ranged from 6.98 to maximum values of 12.82. According to Lim-Law and Mujumdar (2010), there is a perceptive color difference when the values are between 2 and 12 units. The values between 0 and 2 in color difference results are unnoticeable.
The total soluble solids (steviol glycoside) were evaluated by measuring the degrees Brix in a refractometer WZ-119/ATC. This procedure was according to the method reported by Dadzie and Orchard (1997), measuring the refractive extract index.
Mathematical fitting to experimental data
The most suitable mathematical models for experimental results with variations in temperatures and air velocities are presented in Figure 9.
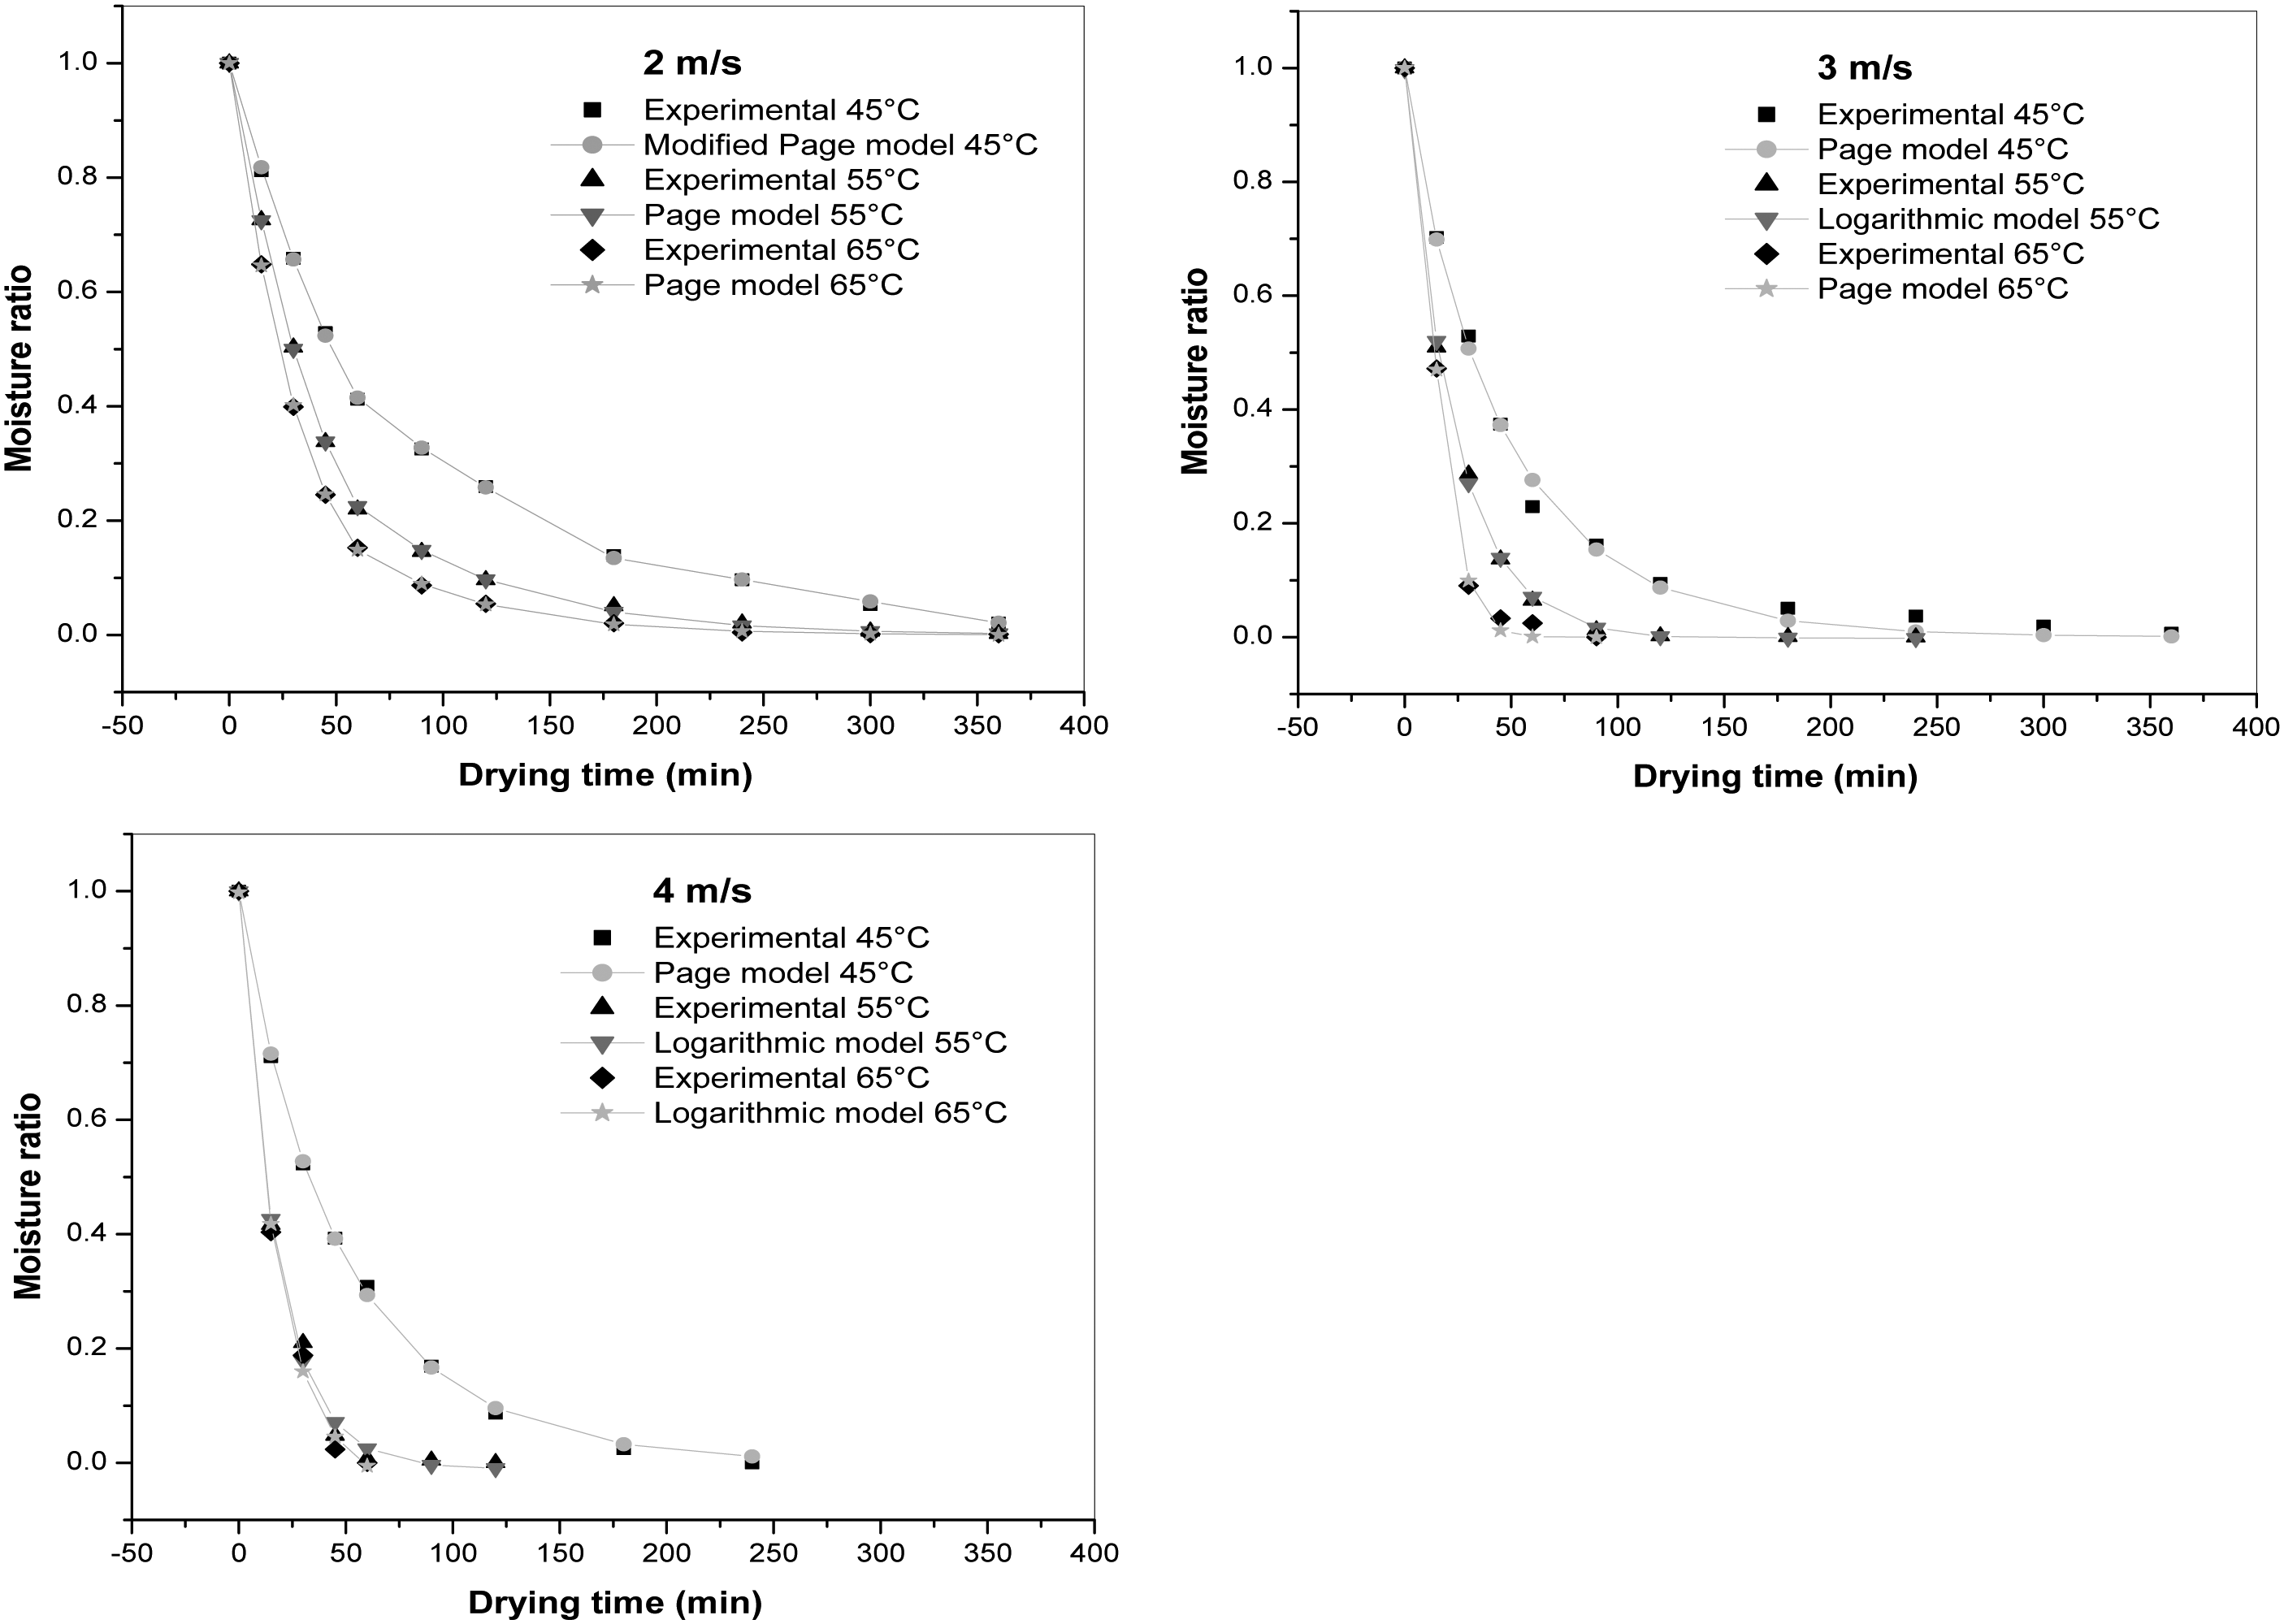
Three best models adjusted for each drying air velocity.
The Page model generally shows the best performance in predicting the drying of stevia leaves according to designed experiments for all experiments. The metrics used to evaluate the models are shown in Table 6, with an R2 range of 0.999 to 0.9741, maximum RMSE 0.0173, and χ2 0.0474.
Fixed experimental data to Page Model.
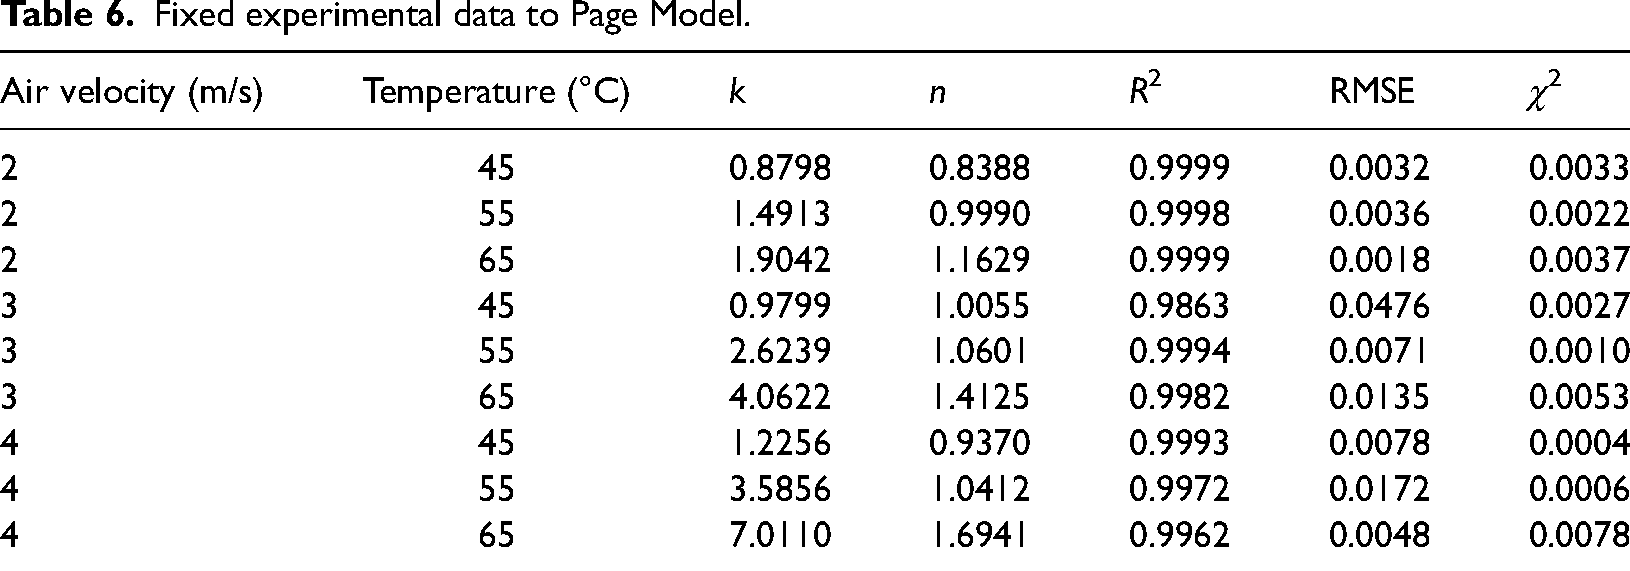
A multiple linear regression test on the model parameters resulted in equations (10) and (11), which shows the interaction of moisture ratio concerning air-drying temperature and velocity. According to these equations with a high coefficient of determination, R2 > 0.99, the air-drying velocity (v) seems to be a more relevant factor compared to air-drying temperature (T). These results showed that forced convection increases accelerated the drying rate.


R2 = 0. 9457
Then, substituting in the Page model (the most suitable), 
Conclusions
In the present work, a comparative study of the drying kinetics of stevia leaves in an electric oven at different temperatures of 45 °C, 55 °C, and 65 °C, with natural and forced air velocities at 2, 3, and 4 m/s, has been carried out.
The air temperature–velocity correlations and their influence on drying kinetics were proposed. A shorter drying time was achieved for all experiments at 65 °C with an air velocity of 4 m/s (80 min). However, 65 °C and 3 m/s require only ten more minutes to dry the stevia leaves, with a drying rate interval of 0.12–0.005 g water/g dry·matters and MC between 3.23 and 0.15 g water/g dry·matter. These conditions allow for saving energy costs and ambient contamination. Concerning the colorimetric analysis, the most significant color difference was presented in the dry stevia leaves at 65 °C and drying air rate of 4 m/s, and according to the results, it can be affirmed that ΔE is higher when the temperature and air velocity increase.
Likewise, mathematical models were used, verifying that all the experimental results fit significantly using the Page model with an average R2 of 0.9973. This model has a high linear correlation between temperature, air velocity, and parameters in the different experimental settings. It was also verified that when temperature and air velocity increase, the drying rate and the effective diffusivity of water molecules increase, improving the process's efficiency. This work provides the necessary information to develop methods to conserve stevia leaves’ properties economically.
Footnotes
Author contributions
Beatriz Castillo-Téllez and Margarita Castillo Téllez: Research methodology, experimental design, writing of results, and writing of the manuscript. Erick César López Vidaña: Analysis of the state of the art of the subject, calibration of the experimental equipment, writing of the manuscript. Alfredo Domínguez Niño: Biochemical studies of the stevia leaf, writing of the manuscript. Gerardo A. Mejía: Mathematical modeling, writing of the manuscript. All authors reviewed the manuscript.
Declaration of conflicting interests
The authors declared no potential conflicts of interest with respect to the research, authorship, and/or publication of this article.
Funding
The authors received no financial support for the research, authorship, and/or publication of this article.
Consent to participate
Informed consent was obtained from all participants included in the study.
Consent for publication
All authors approved this manuscript for publication of results.