
Abstract
The Turonian-Maastrichtian bituminous sands resource in the Dahomey (Benin) Basin, Southwestern Nigeria, is a potentially economically viable hydrocarbon reserve, which has recently attracted renewed attention. An integrated study involving the use of elemental composition, and geochemical analyses (gas chromatography flame ionisation detector (GC-FID), Fourier transform infrared (FTIR), and gas chromatography mass spectrometry (GC-MS)) were carried out to provide an improved understanding of this resource using geochemical signatures and evaluate the n-alkane distribution of bituminous sands to determine its aliphatic hydrocarbon distribution and the prevailing depositional conditions. Elemental composition shows the dominance of carbon (Av. 79.8%). The atomic ratios of H/C and O/C, respectively, range from 0.05 to 0.11, and 0.04 to 0.08. SiO2 is the dominant oxide, with concentrations ranging between 73.15 and 80.50 wt. %, while Zn is the dominant trace element. Twenty-three aliphatic hydrocarbons: C10, C13, C15, C17–C37, were identified on GC-FID, with distribution showing predominance of long-chain n-aliphatics, with a Carbon Preference Index (CPI) value range of 1.01 to 1.02. A bimodal n-alkane fingerprint envelope is visible on GC, with maxima between nC16–nC18 and nC27, indicating varied contributions from both terrigenous and non-terrigenous (possibly marine algae) organic matter. Despite the biodegradation of n-alkanes, GC-MS chromatograms (m/z 256) show evidence of bicyclic sesquiterpenes (BSs) in the bituminous sands investigated. Infrared (IR) spectra show the dominance of the hydroxyl functional group, while 2922.2cm-1 and 2855.1cm−1 are common in all the samples, revealing the presence of residual organics. This study revealed that the bituminous sands are highly waxy in nature and derived from higher plants of both marine and terrestrial source input with more influence from land-dwelling biogenic sources under oxic conditions.
Introduction
Due to declining conventional world oil reserves, the demand for alternative energy sources is rising, and bituminous sands, which are rich and mostly untapped, are viable alternatives and a hydrocarbon (HC) raw material for the petrochemical industry (Adedimila, 1987; De Almeida et al., 2016; Spirov et al., 2013; Ukwuoma, 1999; Victor-Oji et al., 2017). Bituminous sands are oil-impregnated sands consisting mainly of heavy oils, and clays rich in minerals and water (Victor-Oji et al., 2017). They are naturally occurring mixtures, containing about 10% bitumen, 5% water and 85% solids, with a minute concentration of heavy metals and other contaminants (Victor-Oji et al., 2017). Extra-heavy crude oil or crude bitumen are trapped in unconsolidated sandstones, and they are highly dense, and viscous with a specific gravity (density) that is comparable to or even exceeds that of water (Adegoke et al., 1980, 1989). The Nigerian bituminous sand deposits are found on the eastern margin of the Dahomey Basin, within a geographical belt that cuts through Ondo, Ogun, Edo, and parts of Lagos State, and are estimated to be about 30–40 billion barrels in commercial quantities, with a potential recovery of 3654 × 106 barrels (bbls) (Adegoke et al., 1991; Akinyemi et al., 2013; Victor-Oji et al., 2017).
Aliphatic HCs (n-alkanes) are derived from natural and anthropogenic sources and have odd and even carbon numbers up to 64 carbons with no alkyl branch. Biogenic n-alkanes are produced by micro-organisms, insects, plankton and land-dwelling plants, whereas anthropogenic n-alkanes emanate from anthropogenic activities such as urbanisation, fishing and HC production operations (Sakari et al., 2008a; Vaezzadeh et al., 2015). n-Alkanes with odd carbon numbers emanate from biogenic sources, while those with even carbon number results from anthropogenic sources (Eguvbe et al., 2015). Previous studies have shown that marine biogenic sources create n-C15, C17 and C19 HCs, while terrestrial vascular plants produce n-C25 to n-C33 HCs (Del Brio et al., 2018; Sakari et al., 2008b; Yang et al., 2011). Most n-alkanes below C20 come from deep-sea planktons, which is marked by the prevalence of even carbon-numbered n-alkanes, suggesting input from microbial components. Low molecular weight (LMW)/high molecular weight (HMW) ratio, total odd number HCs, total even number HCs, C31/C19 ratio, Carbon Preference Index (CPI), major HC (MH), average chain length (ACL) and long chain HC (LCH)/short chain HC (SCH) ratio have all been utilised as diagnostic indices to ascertain and assess the provenance of these n-alkanes in the environment (Beard, 2007).
Geochemical signatures and n-alkane distribution of bituminous sands from selected locations across the eastern Dahomey Basin in Ondo State were investigated in this study to determine its aliphatic HC distribution, with diagnostic parameters/ratios used to assess maturity levels, source/origin and the prevailing condition of the depositional environment of these bituminous sands. This study used an integrated approach that included elemental composition, inorganic geochemical analyses, fourier transform infrared (FTIR), gas chromatography flame ionisation detector (GC-FID), and gas chromatography mass spectrometry (GC-MS).
Geological setting
The study area is located in the Nigerian section of the Dahomey (Benin) Basin, Ondo State, South-West Nigeria, between Latitudes 6° 20.0′ and 6°37.3′N and Longitudes 40 50.0′ and 5° 5.0′E and is regarded one of the frontier basins in oil exploration (Figure 1). The basin has witnessed renewed exploration activity because of the Nigerian government's renewed interest in boosting its oil reserves through frontier basin development (Oladele et al., 2014).
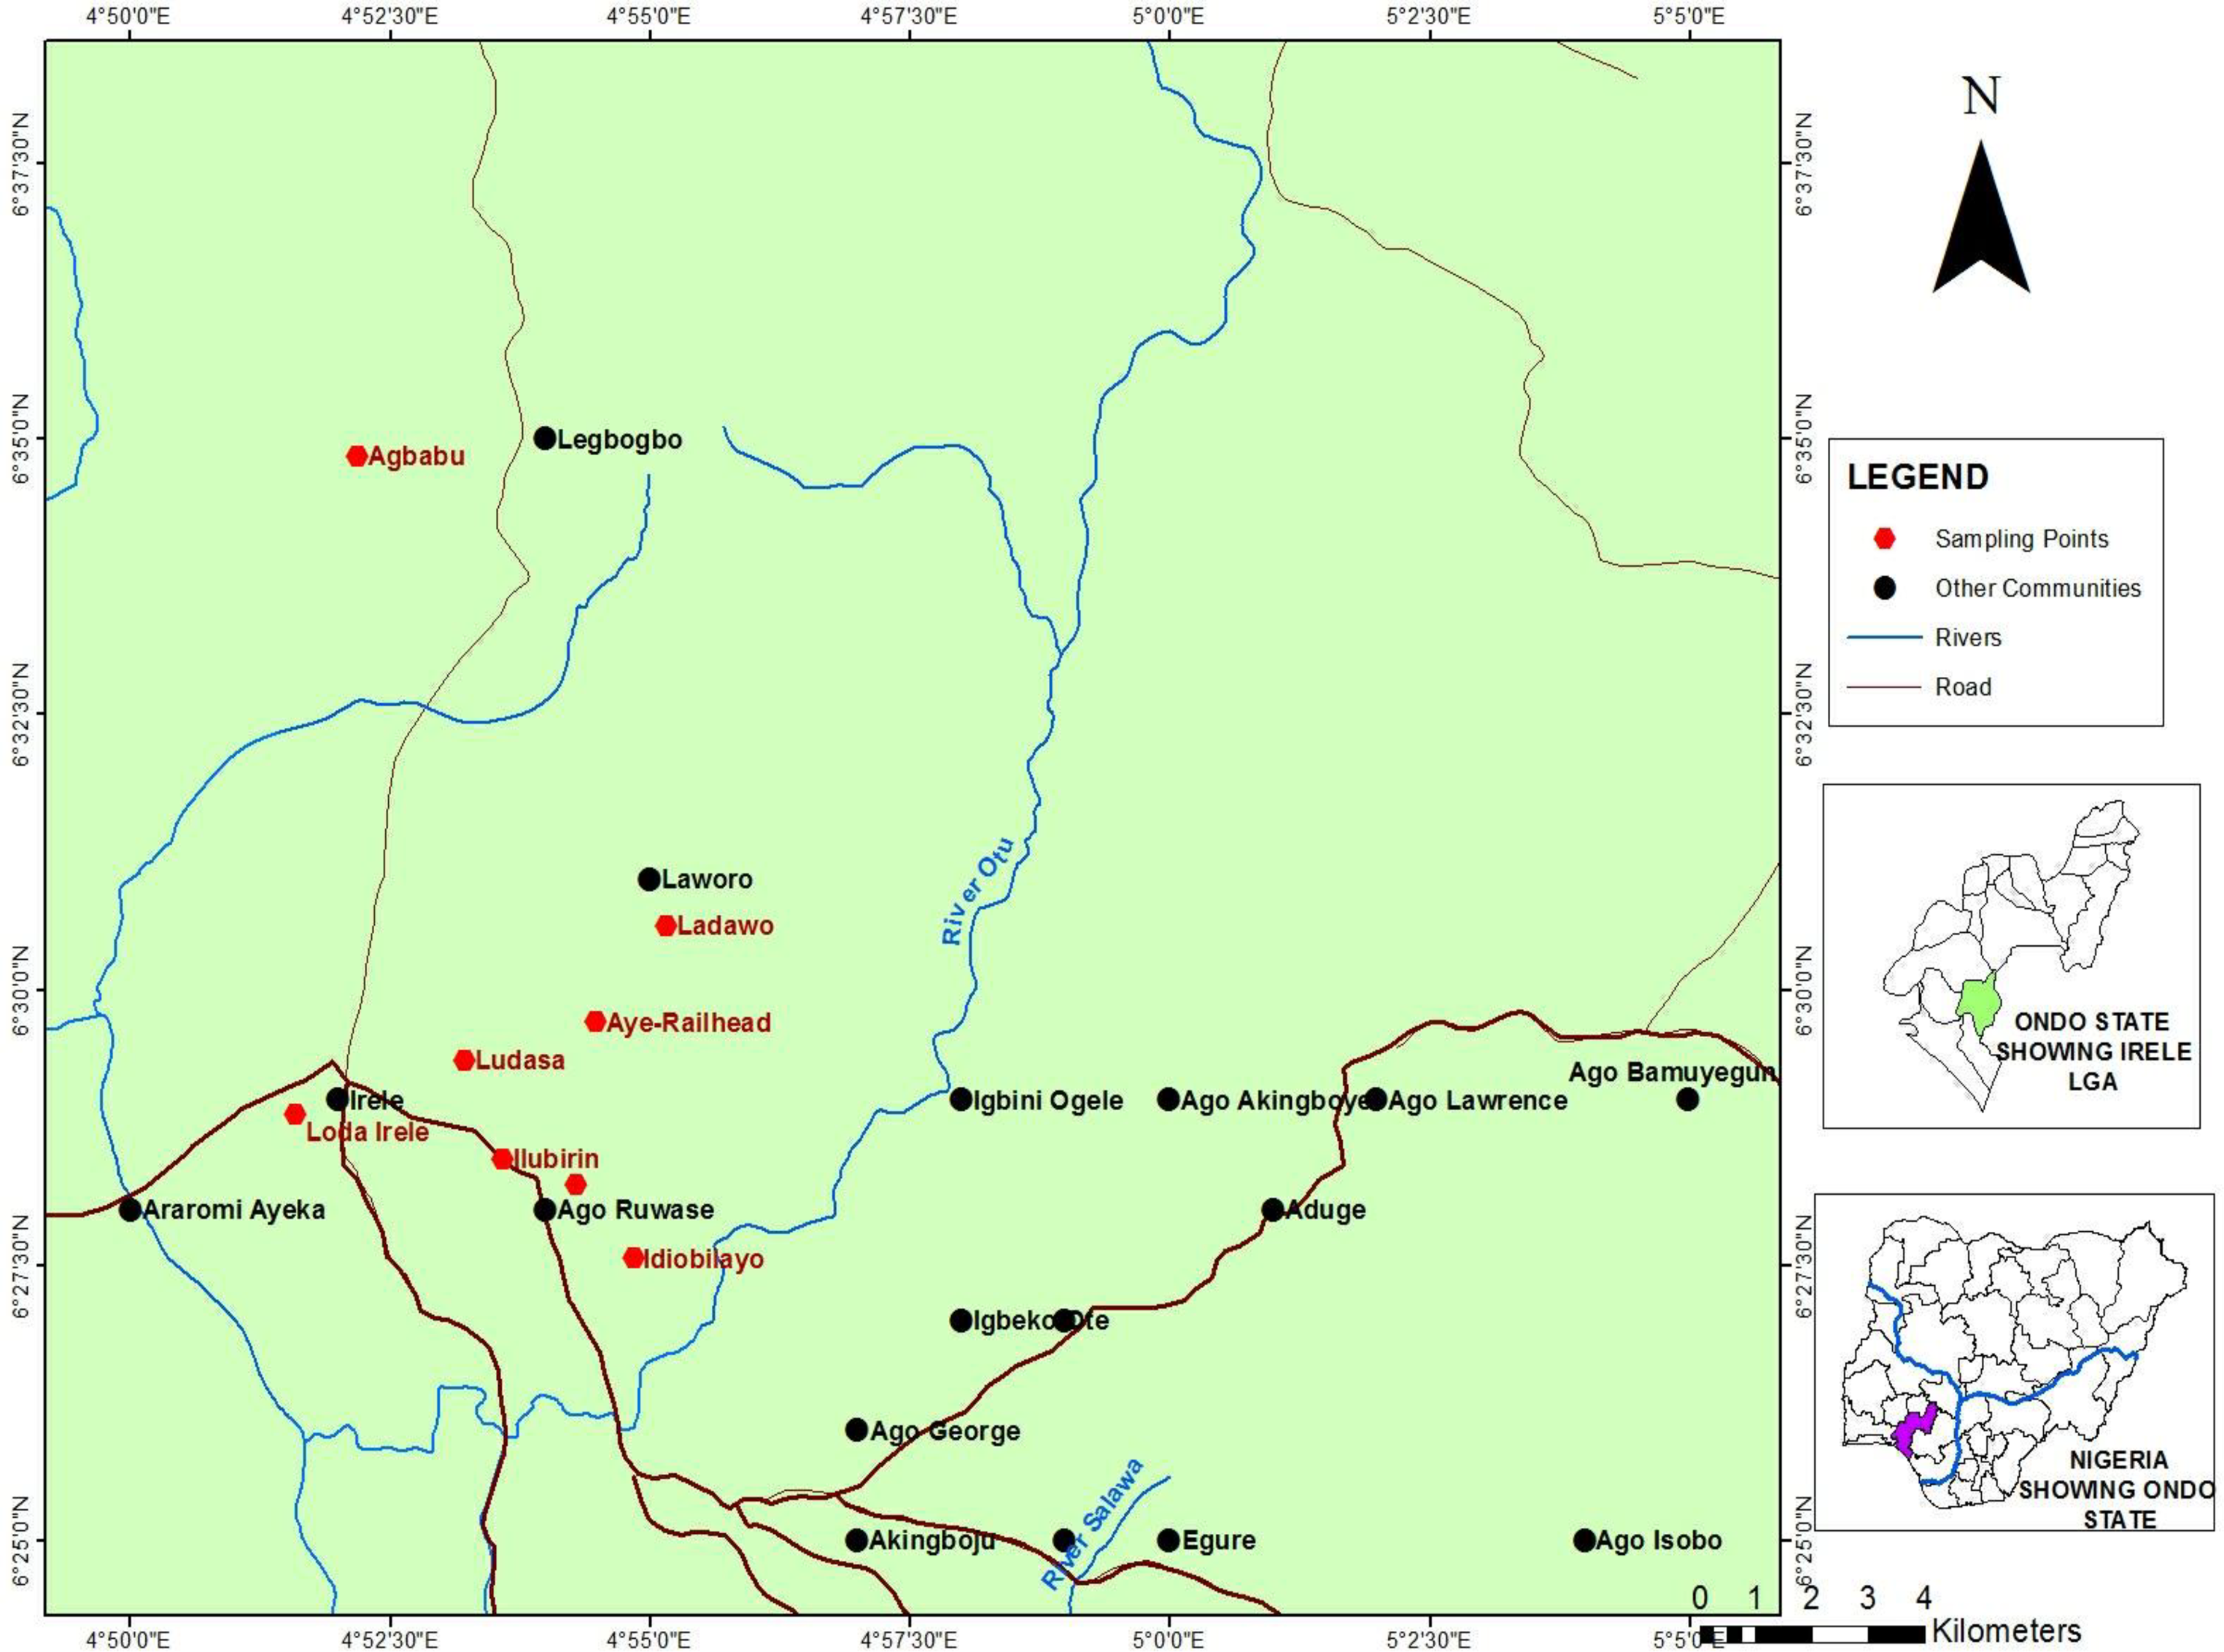
Topographic map showing sample locations and study area.
The Dahomey (Benin) Basin is an active basin, with eroding sub-aerial and active deposition at its distal parts. It stretches about 500 km from the western part of the Niger Delta through the Benin Republic and Togo to the southeastern part of Ghana. The Okitipupa Ridge, a high subsurface basement separates the basin's onshore portion from the Niger Delta eastern limit of the basin within Nigeria. The basin's offshore extent is not well defined, but according to Billman (1984), it reaches about 20 km basin-ward on the continental shelf. Whiteman (1982) referred to the basin as a miogeocline, which means it is a basin where volcanism has not been linked to sedimentation. It is a component of the West African pericratonic (marginal sag) basin (Kingston et al., 1983; Klemme, 1975), the development of which is linked to the rifting that occurred following the opening of the South Atlantic in the Late Jurassic to the Early Cretaceous (Burke et al., 1971; Whiteman, 1982). The crustal separation, typically preceded by crustal thinning, was accompanied by an extended period of thermally induced basin subsidence through the Middle-Upper Cretaceous to Tertiary times as the South American and the African Plates entered a drift phase to accommodate the emerging Atlantic Ocean (Akinmosin and Imo, 2016; Mpanda, 1997; Storey, 1995).
The Dahomey Basin was described by Whiteman (1982), as a massive wedge of Cretaceous to Recent sediments that lies unconformably on the basement. Its tectonic evolution allows the stratigraphic sequence to be divided into three sequences: (1) Precambrian to Triassic intra-cratonic rocks and Jurassic to lower Cretaceous, Continental to marginal marine rocks representing the pre-transform stage; (2) Lower Cretaceous to late Albian rocks representing the syn-transform stage and (3) Cenomanian to Holocene rocks representing the post-transform stage (Boboye and Nzegwu, 2014; Boboye and Omotosho, 2017). Several works of literature documented the different aspects of the geology of the basin, some of which include Murat (1972), Adediran and Adegoke (1987), Omatsola and Adegoke (1981), Onuoha and Ofoegbu (1988), Nton et al. (2006), Bolaji et al. (2020) and Okoro et al. (2021).
The Dahomey Basin fill (Figure 2) can be categorised into two groups: the Cretaceous Abeokuta Group, which includes the Ise, Afowo, and Araromi formations; and the Paleogene-Neogene sediments, which include the Ewekoro, Akinbo, Oshosun and Ilaro formations (Bolaji et al., 2020; Ogbe, 1972; Omatsola and Adegoke, 1981), which are overlain by the Benin Formation. The Ise Formation (Lower Cretaceous) is made up of a succession of conglomeratic rocks, grits and mud rocks that lie unconformably on top of the Precambrian Basement Complex. The formation is predominantly non-marine. The Afowo formation (Upper Cretaceous) lies above the Ise Formation and is composed of coarse to medium-grained transitional to marine sands and sandstone, with thin to thick interbeds of shales, siltstones and claystone (Oladele et al., 2014; Olatinsu et al., 2017). The Araromi formation (Maastrichtian to Paleocene) is the uppermost formation, which overlies the Afowo Formation. It is composed of fine to medium-grained sandstone, shales and siltstone with interbedded limestone, marl and lignite (Oladele et al., 2014; Omatsola and Adegoke, 1981). In the Cenozoic group, the Ewekoro formation (Paleocene), which is made up of fossiliferous well-bedded limestone overlies the Araromi formation (Bolaji et al., 2020; Nton and Elueze, 2005). The Akinbo formation (Paleocene to Lower Eocene) is the shale interval above the Ewekoro formation, which is characterised by clay interbeds and a laterally persistent greenish glauconitic horizon which defines the boundary between the marine deposits of the Ewekoro and Akinbo formations. Overlying the Akinbo formation is the Oshosun formation (Paleocene to Eocene), which are predominantly greenish-grey clay and shale with local interbeds of sandstones, thought to have been formed in a marine-dominated transitional environment (Idowu et al., 1993). The Ilaro formation (Eocene) is a thick, yellowish, poorly consolidated, cross-bedded sandstone with intercalation of shales and clays which conformably overly the Oshosun formation. At the topmost part of the Cenozoic sequence lies the Benin formation (Oligocene to Plio-Pleistocene), which consists of poorly sorted sandstone with clay lenses.
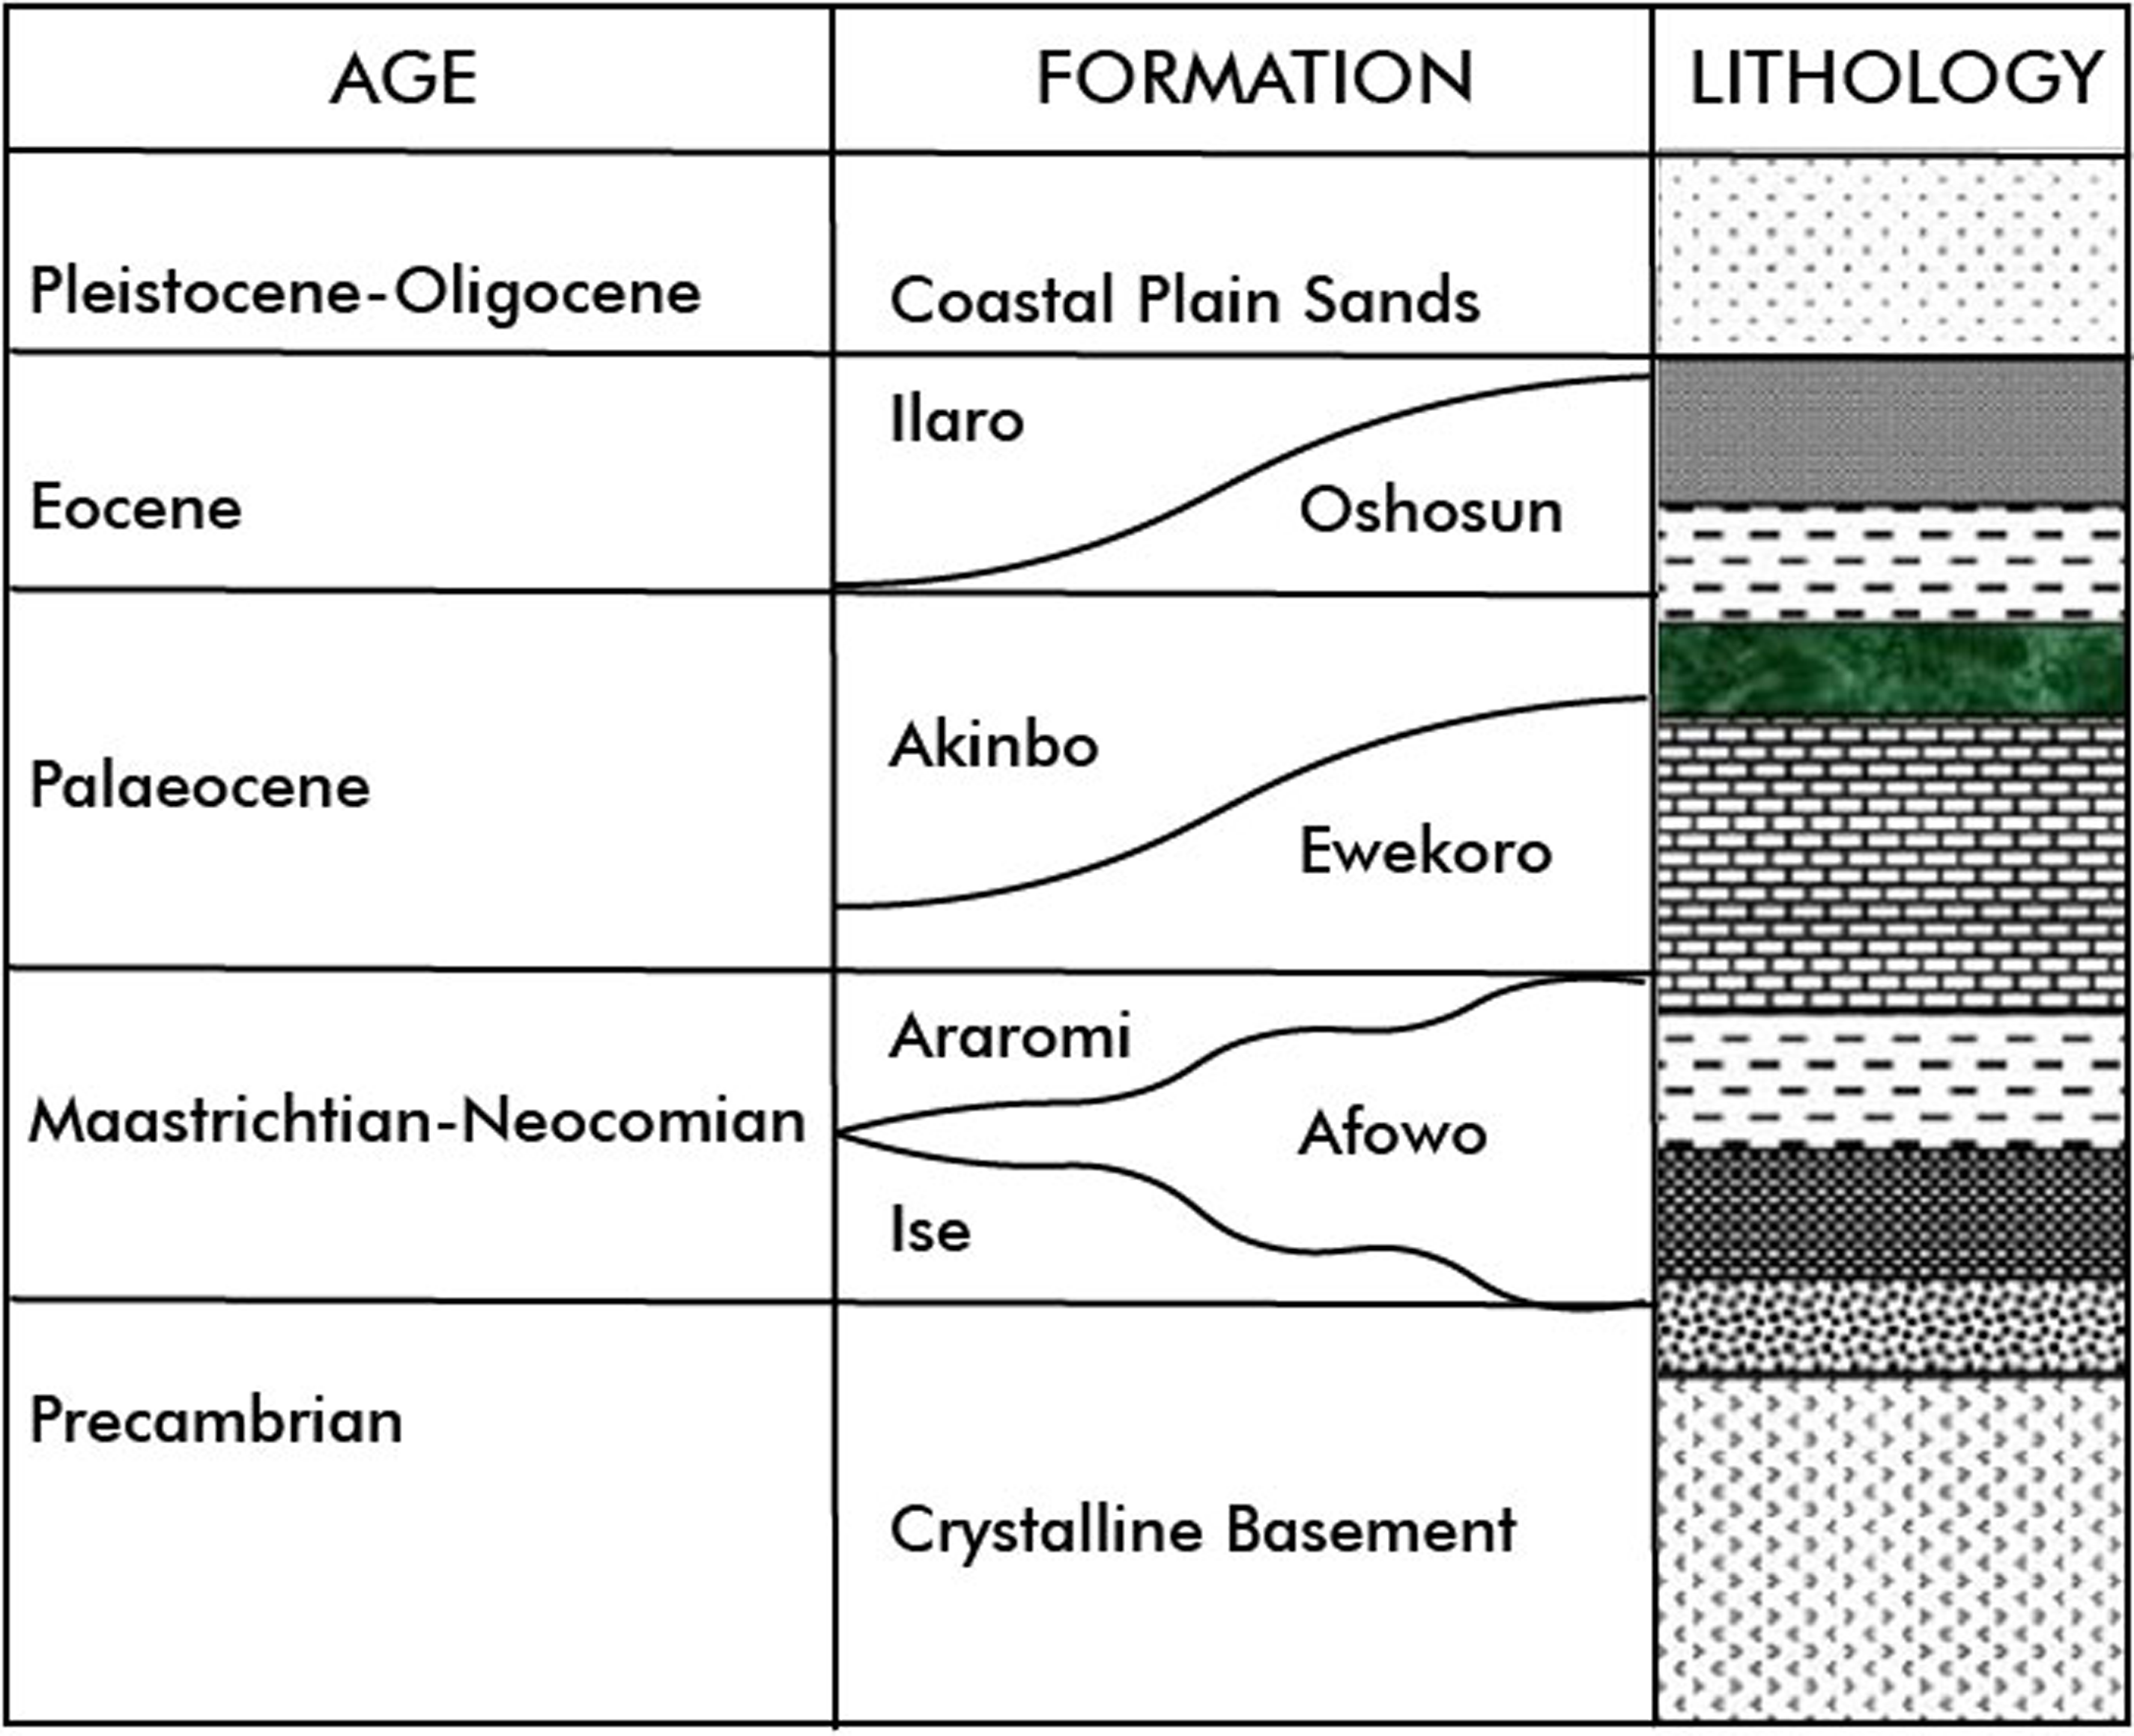
Stratigraphy of Nigerian Eastern Sector of Dahomey Basin (modified after Omatsola and Adegoke, 1981).
Sampling and analytical procedures
Sample collection
Fieldwork was carried out in various parts of the Benin (Dahomey) Basin, with samples collected primarily at shallow depths (0–10 m). The sediments were crumbly and sticky in appearance due to the presence of bitumen, with colour ranging from dark grey to black (Figure 3). The lithological units encountered were measured and described using standard geological field procedures in a typical sedimentary area. Bituminous sands samples (n = 15) were obtained from the following locations – Agbabu (AB), Aye-Railhead (AY), Akindolu-Emaye (AE), Egbe (EG), Idiobilayo (ID), Ilubirin (IL), Ladawo (LA), Ludasa (LU) and Oyi River (OR). Samples were collected by scooping, stored in air-tight bags, and labelled appropriately for laboratory analysis.
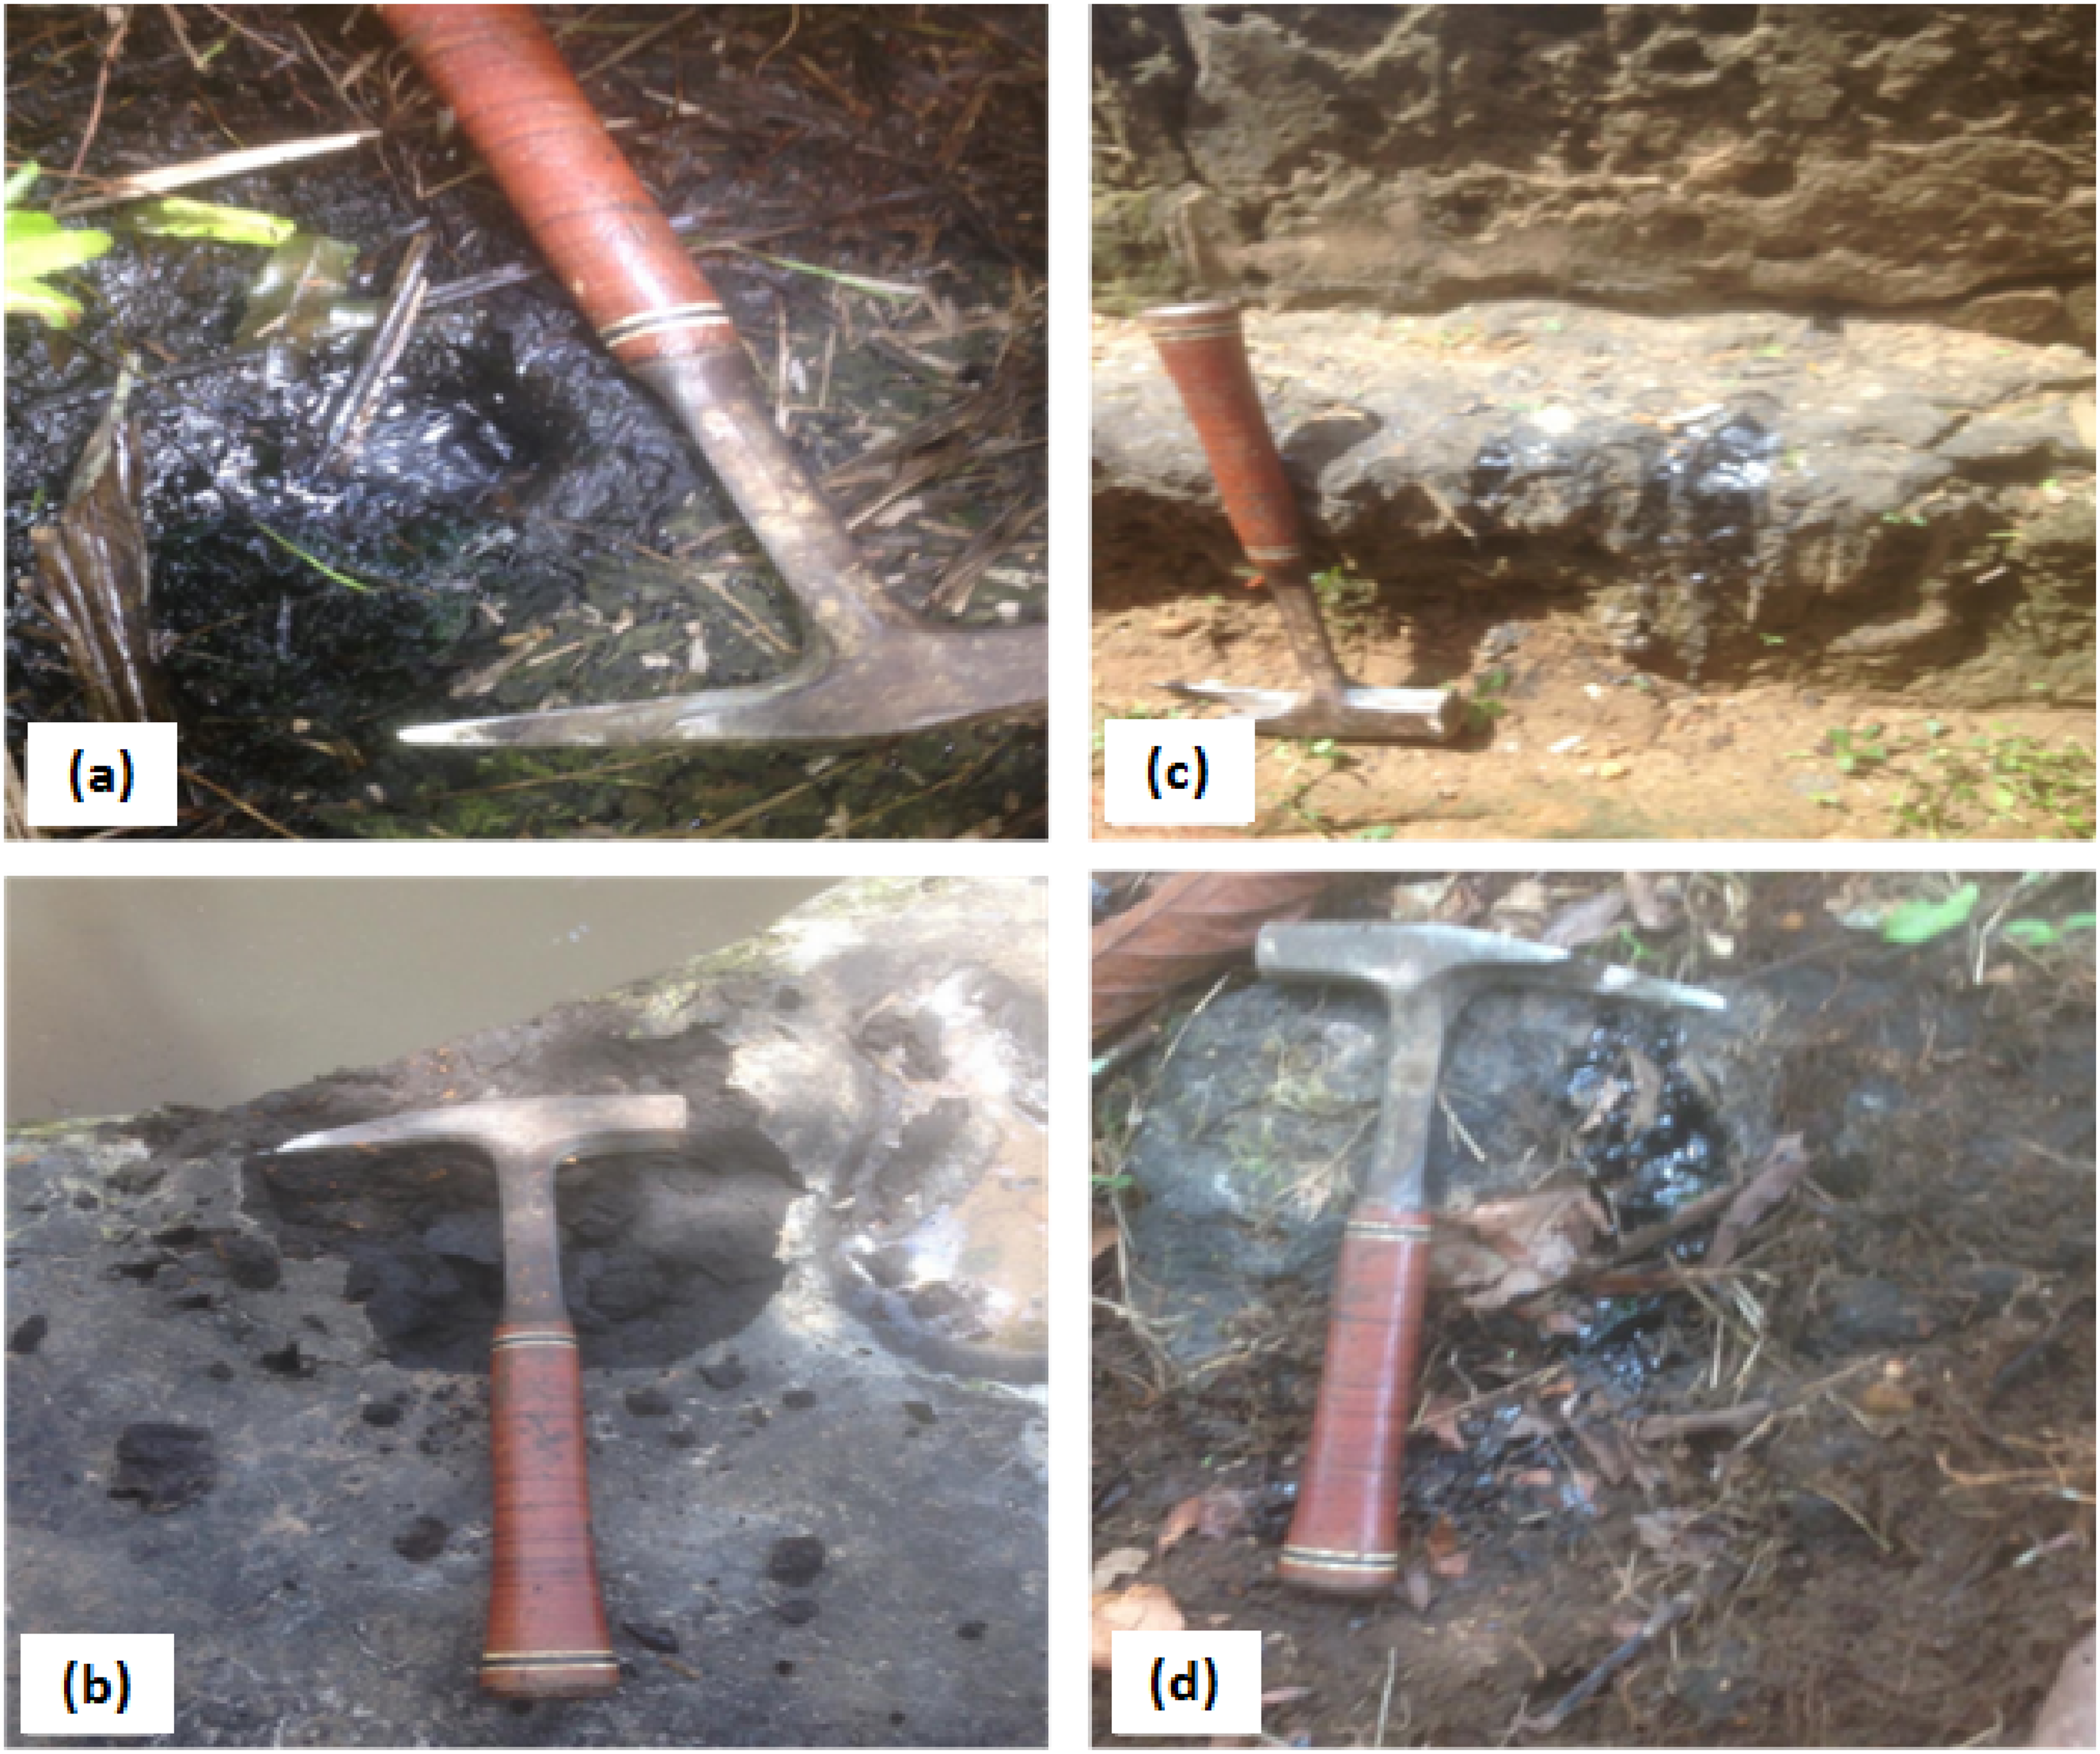
Field photographs of outcrops (a) Agbabu, (b) Mile-2, (c) Egbe, sampling location and (d) Ilubirin (Akindolu Emaye).
Elemental analyses and inorganic geochemistry
About 10 g of the sample was mixed with 10 mL of pentane, and the resultant solution was filtered. The filtrate was analysed for elemental (C, N, O, H and S) composition using CHNS-O Analyzer (FlashEA®1112). Sand fractions of these samples were air-dried and pulverised. To prevent the escape of silicon tetrafluoride (SiF4) gas, 10 g of each sample was treated in a tightly sealed digestion bottle with a mixture of 15 mL of 40% hydrochloric (HCl) acid and 10 mL of hydrofluoric (HF) acid. The bottle used for digestion was placed in a water bath and heated to 70°C for about 2h, then cooled down to about 25°C. And 100 mL of saturated boric acid was added to the solution in a tightly cocked bottle and heated up to 70°C until the milky solution became clear. The solution was filtered, and distilled water was added to the filtrate to make a solution of 250 mL, a portion of which was analysed with a dilution factor of 25 for the major and trace elements using an Atomic Absorption Spectrophotometer (UNICAM 969 model).
Geochemical analyses
Sample preparation
Soxhlet extraction was performed on bituminous sand samples using toluene as a solvent to separate organic fractions from their mineral part. And 20 g of the extract was thereafter separated into maltene and asphaltene fractions by the gradual addition of a 1:1 mixture of dichloromethane and n-hexane with constant stirring. The precipitated component (asphaltene) was filtered off and the residue was further purified by Soxhlet extraction with n-hexane and asphaltene recovery with dichloromethane. The maltene fractions were recovered from the n-hexane and dichloromethane solutions using a rotary evaporator.
Maltene fractionation
The concentrated maltene extract was fractionated in a chromatographic column (60 m×32 mm×1.8 µm) pre-conditioned with n-heptane and well-packed with activated silica-alumina (100–200 mesh; pore size of 150 Å) baked in a fume hood at 105°C overnight for 12 h, into aliphatic and aromatic fractions by successive elution with n-heptane, respectively. The aliphatic fraction was delineated using GC-FID (Adebiyi and Omode, 2007).
Gas chromatography–flame ionization detector
An HP-5890 GC interfaced with a FID with an HP-7673 autosampler was used for the GC-FID analysis. Components separation was accomplished on a 30 m×0.32 mm internal diameter by 0.25 μm thickness DB-5 fused silica capillary column with helium as the carrier gas at a volumetric flow rate of 2.5 mL/min, an oven programmed at 50°C to 300°C at 6°C/min with injector and detector temperatures set at 290°C and 300°C, respectively (El Nemr et al., 2016; Laakia, 2017). The identification of compounds was based on a comparison of GC retention data with authentic standards (Wang et al., 1964). Quantitation of n-alkane compounds was accomplished by use of internal standards and n-alkane concentration in mg/kg, was quantified considering the peak concentration, response factor and final volume of the extracted sample thus:

Gas chromatography–mass spectrometer
The GC-MS analysis was carried out as described by Nam et al. (2019), using a Varian 3800/4000 GC fitted with an Agilent MS capillary column (30 m × 0.25 mm) connected to a Varian 4000 mass spectrometer (source temperature 230°C and a quadruple temperature 150°C). At a split ratio of 10:1, 1.0 μL of a derivatised sample was injected into a GC-MS (Varian 3800/4000 GC-MS) at a constant flow of 1.2 mL min−1. The oven temperature was kept at 600C for 2 min, and then ramped to 320°C at a rate of 5°C min−1 for 11 min. Mass spectra were collected in the electron impact mode with 70-eV ionisation energy at 0.15 scans per second and a scanning range of 44 to 620 m/z. Chemstation software was used to process the resulting data. Peaks were compared with retention indices and mass spectra from customised reference standards (NIST, Gaithersburg, MD, USA). The peak area ratio of the analyte to an internal standard, Ribitol, was used to estimate relative quantification. All chemicals and reagents were of analytical grade and had not been purified further.
Fourier transform infrared spectrometry
Samples were crushed into a very fine particle size for FTIR analysis. And 2.0 g of each sample was dissolved using 5 mL of silver nitrate (AgNO3). Reflectance spectra were acquired with a Cary 630 FTIR instrument operated in transmission mode and processed with Micro lab Software (version 7.1). The spectral coverage was set between 4000 and 400 cm−1 with 8 cm−1 spectral resolution. The solvent AgNO3 background for all spectra was created by averaging 32 consecutive scans to provide each measurement. After a sample was placed within the sample compartment and before the spectrum was acquired, the bench was purged continuously with dry N2 and allowed to re-establish the purge for 3 min (Scott et al., 2008). FTIR quantification of selected bituminous sand samples (AE-03, LD-01, EG-01 and IL-01) was carried out at the Central Science Laboratory, Obafemi Awolowo University, Nigeria.
Results and discussion
Elemental composition
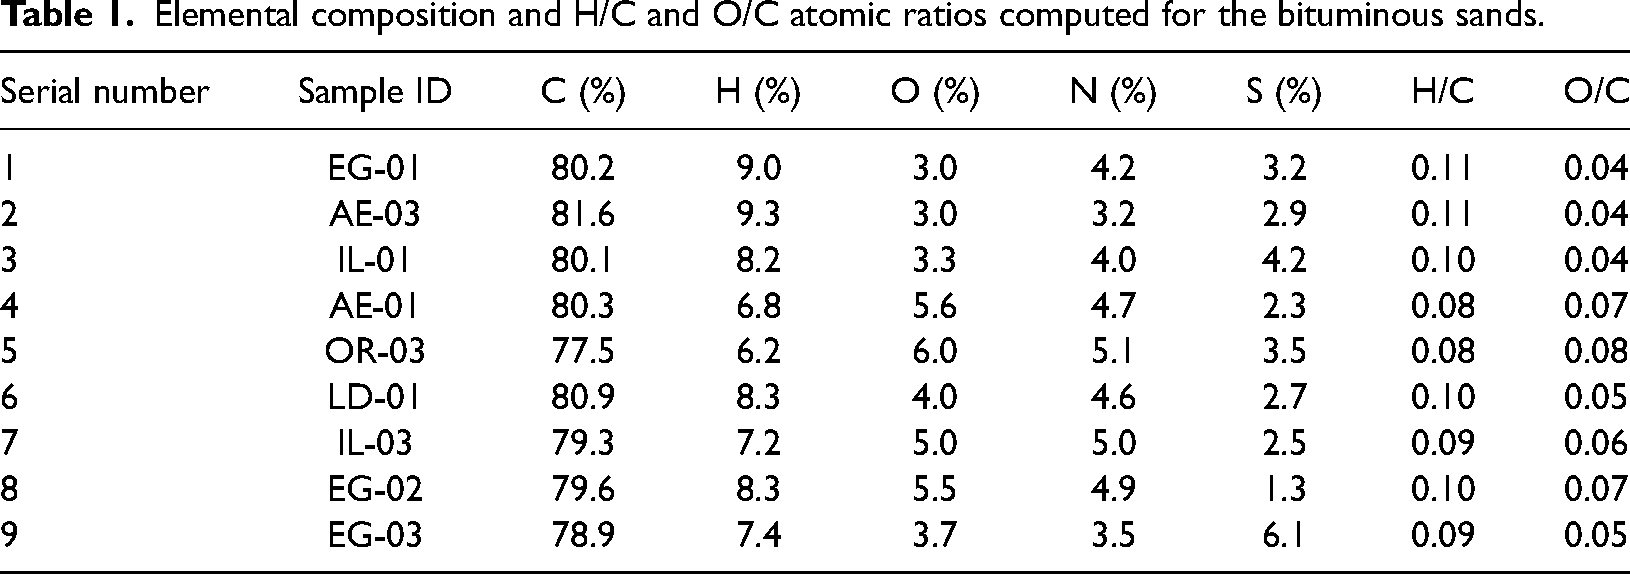
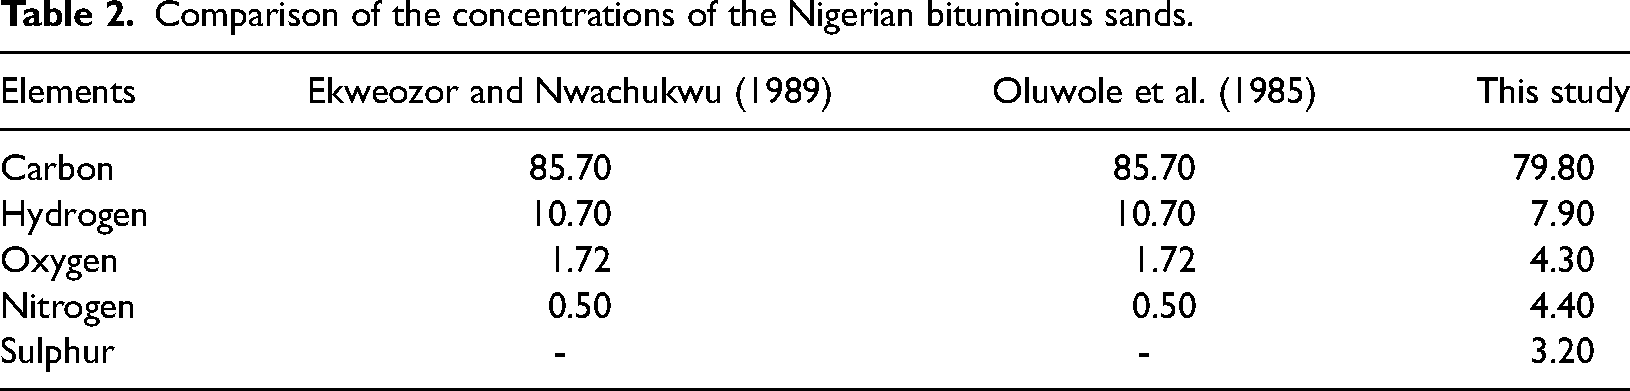
The elemental composition of the bituminous sands is shown in Table 1. The data obtained revealed that; carbon, hydrogen, oxygen, nitrogen and sulphur have typical compositions of 79.8%, 7.9%, 4.3%, 4.4% and 3.2%, respectively (Table 1). Carbon is the dominant constituent of the sands. The HC content indicates the biogenic materials are immature, and we can deduce that the HC constituent of heavy oil determines its grade, that is, the higher the HC content, the higher the quality. Comparing the result shown in Table 2 with literature, we observed a significant and continuous decrease in the C and H content while N and O show appreciable enrichment (Ekweozor and Nwachukwu, 1989; Oladele et al., 2014; Oluwole et al., 1985). This is typical of the biodegradation effect, as this fraction of crude oil most unequivocally provides evidence of microbiological transformation (Ekweozor and Nwachukwu, 1989). The presence of sulphur in these samples distinguishes them from those samples of the Imeri area of Ogun State (Odunaike et al., 2013). The carbon and hydrogen content of the studied samples are similar, suggesting the same geological source rock as confirmed by the GC-MS result (Section FTIR and GC-MS signature). The H/C and O/C atomic ratios (Table 1) show that the bituminous sand samples are generally derived from land-dwelling plants as samples are projected close to the anthracite coal area (Figure 4). The O/C ratios obtained show greater input from land-dwelling plants, reflecting contamination via epigenetic roots of nearby plants.
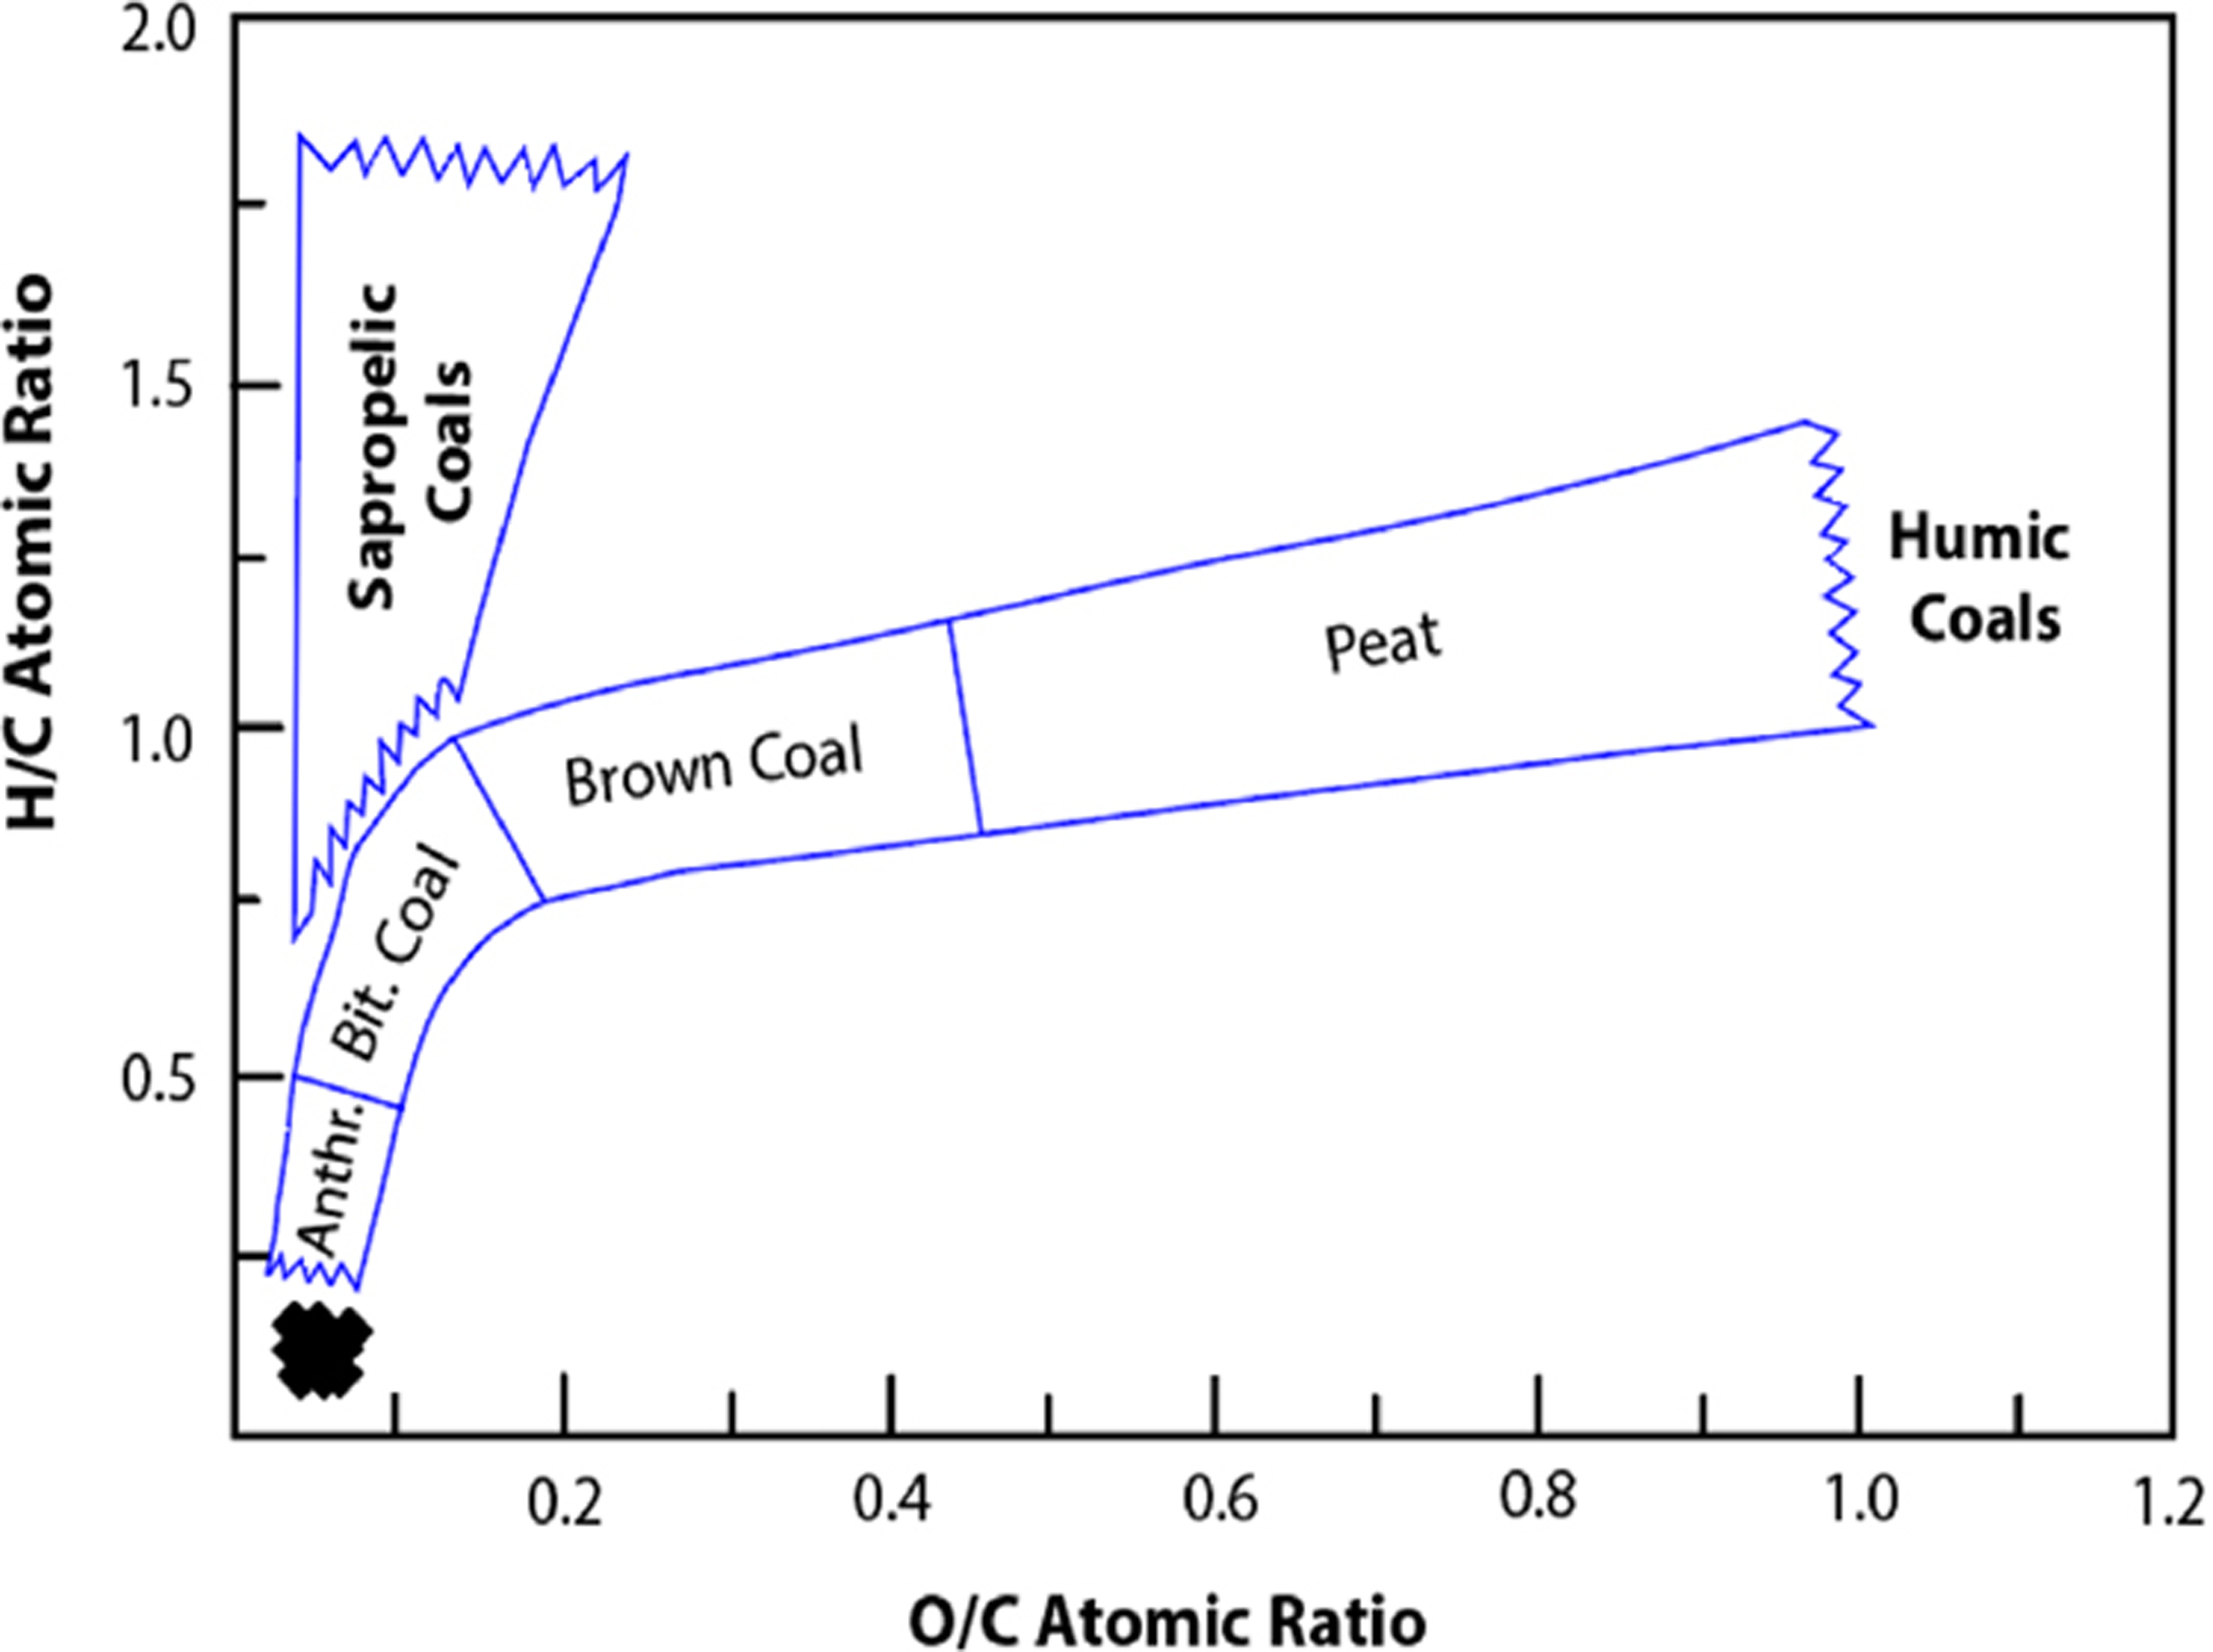
The Van Krevelen diagram for the studied bituminous sands (maturity fields after Killops and Killops, 1993).
Elemental composition and H/C and O/C atomic ratios computed for the bituminous sands.
Comparison of the concentrations of the Nigerian bituminous sands.
Distribution of major and trace elements
The inorganic geochemical study (Table 3) reveals that SiO2 is the most abundant oxide, with concentrations ranging from 73.15% to 80.50%, while Zn and Sr are the dominant trace elements. The concentrations of Fe2O3, Na2O and Al2O3 are slightly higher compared to CaO, MgO, MnO, K2O and CuO. The CaO values reported in this study area are in good agreement with those found in a previous study around Imeri (Odunaike et al., 2013), but K2O and MnO concentrations were higher. MnO depletion could be attributed to dissimilatory manganese reduction by bacteria, an indication of biodegradation.
Major oxides and trace elements composition of the studied bituminous sands.
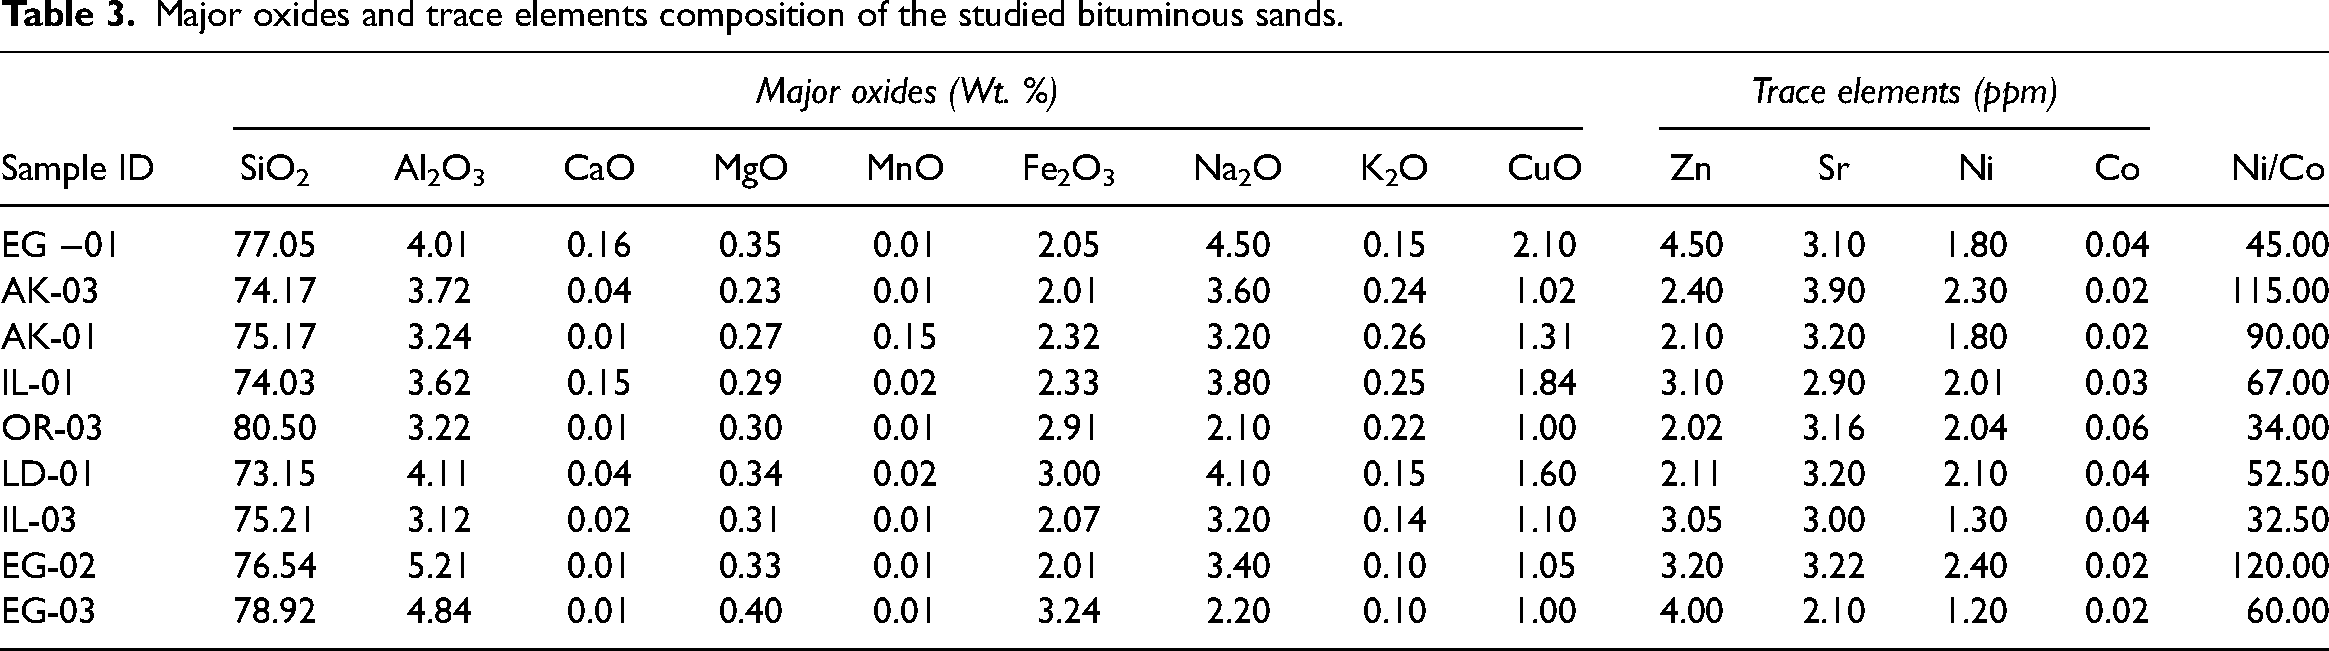
Samples are plotted in the Fe-sand field on the geochemical diagram (Herron, 1988), suggesting that they are Ferruginised (Figure 5). The relationship between Co and Sr in the analysed samples is statistically significant (r = 0.74), which indicates related geological origin. It was observed that the samples contain lower concentrations of Ni and Co, compared to Zn and Sr. The Ni/Co ratio can be used as a proxy for paleo-redox conditions during the deposition (Jones and Manning, 1994). The Ni/Co ratio in the examined samples ranged from 34 to 120 (Table 3), showing that the materials were in an anoxic environment (> 5), which favours organism attack, leading to biodegradation.
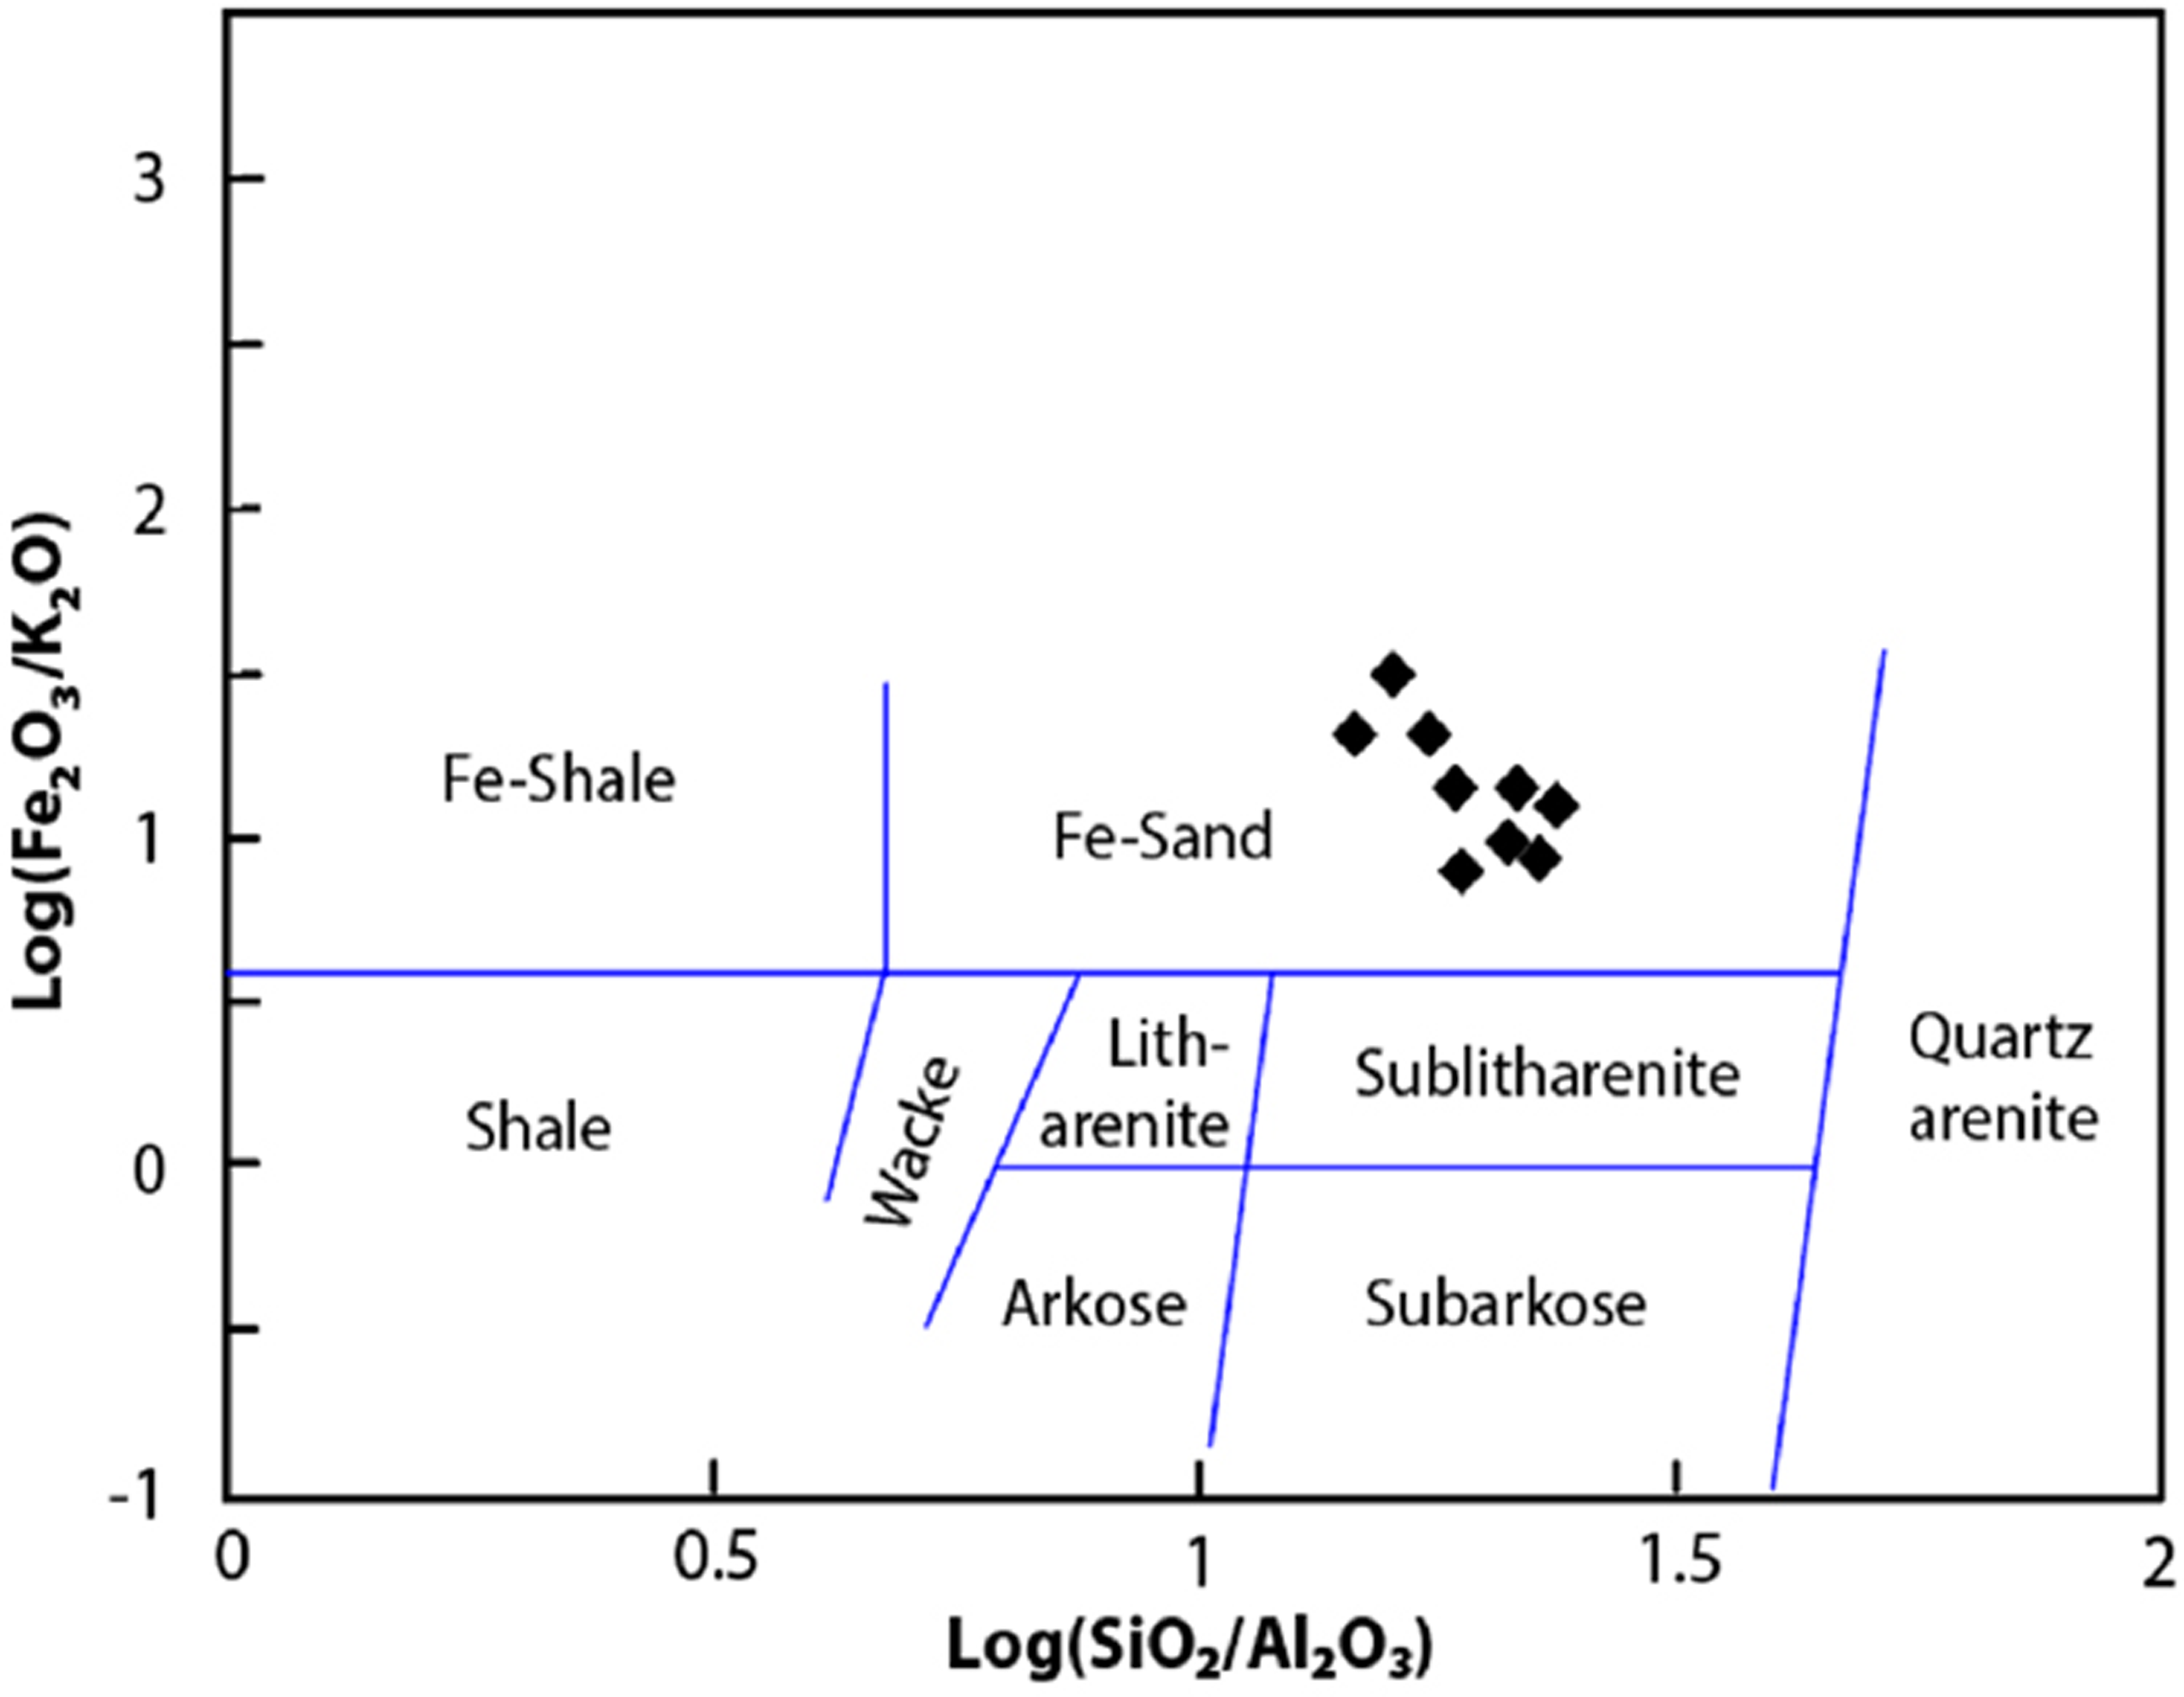
Geochemical classification of studied bituminous sands using Log(Fe2O3/K2O) vs. Log(SiO2/Al2O3) diagram (after Herron, 1988).
Aliphatic hydrocarbon distributions
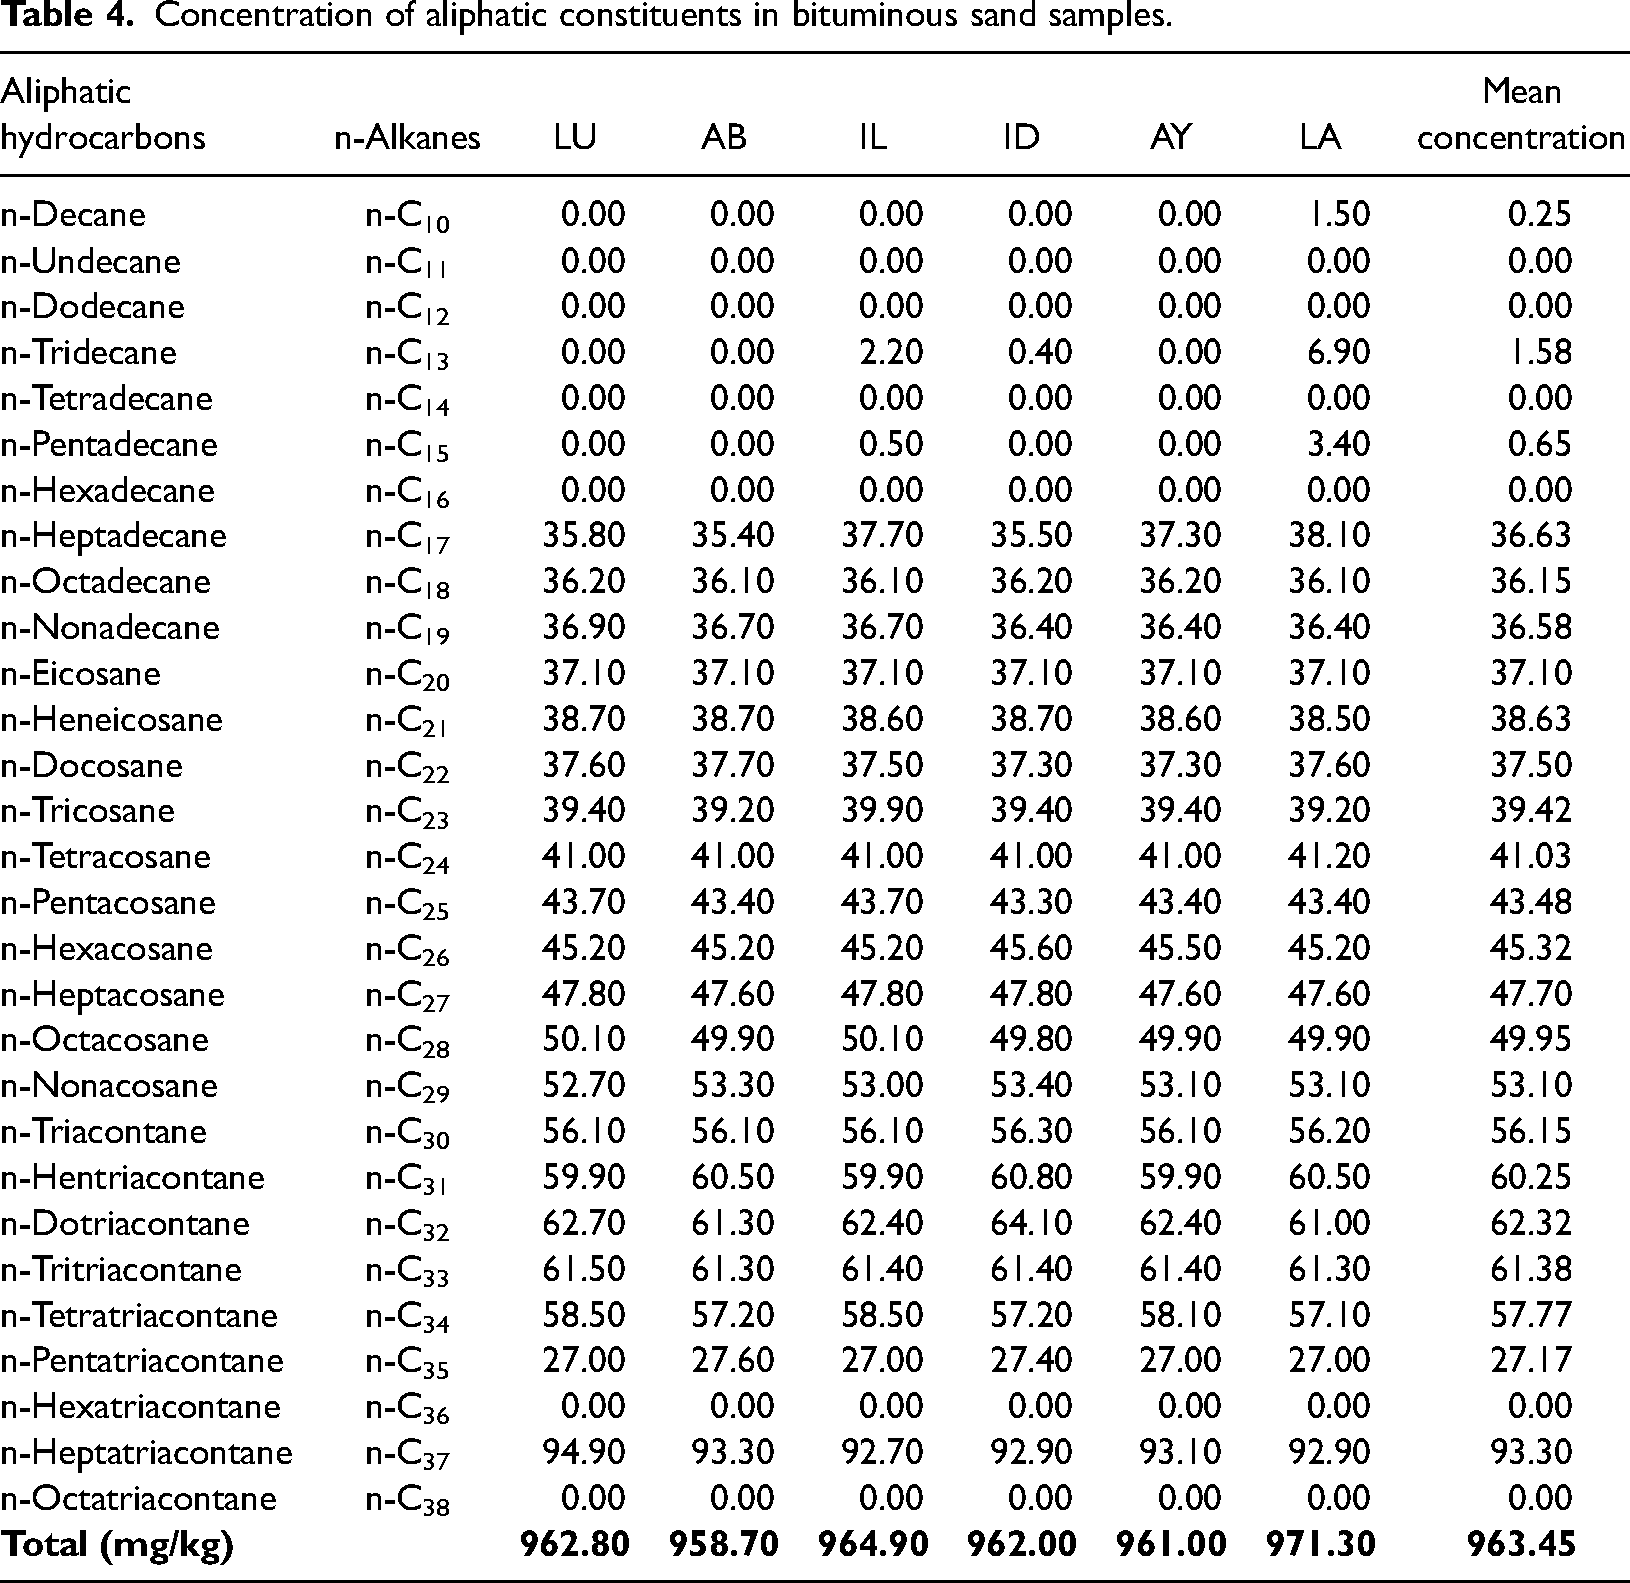
Twenty-three aliphatic (n-alkane) HCs (C10, C13, C15, C17–C37) were identified and characterised by the GC-FID analysis (Table 4). The aliphatic HC fraction of the bituminous sand extract was dominated by the n-alkane series in the range C17 to C37 (maximising at C32 and C37) with a relatively slight increase in concentration as the HC chain increases.
Concentration of aliphatic constituents in bituminous sand samples.
Geochemical and source diagnosis of the n-alkanes
The bulk of n-alkane distributions revealed odd over even-numbered carbon long-chain n-alkanes, with CPI values ranging from 1.01 to 1.02 (Table 5). Except for Ilubirin (IL), Idiobilayo (ID), and Ladawo (LA) bituminous sand samples, where low concentrations were observed for n-C10, n-C13 and n-C15, n-alkanes from n-C10 through n-C16, n-C36 and n-C38 were not detected. A probable explanation is that the bituminous sands might not have undergone weathering or alteration (Yasser and Rania, 2012). For the bituminous sand samples, the highest concentrations of aliphatic fractions were found between n-C27 to n-C34 and n-C37 (Table 4), indicating that land-dwelling vascular plants contributed to the high n-alkane distribution (Fagbote and Olanipekun, 2012). We also observed a preponderance of odd over even carbon-numbered alkanes in n-alkanes within the range of n-C17 to n-C33, giving a CPI >1. The geo-source and depositional environment diagnostic ratios of the n-alkanes identified from the GC-FID analysis of the bituminous sands are also presented (Table 5) and are discussed below.
Geo-source and depositional environment diagnostic ratios of the aliphatic hydrocarbons.
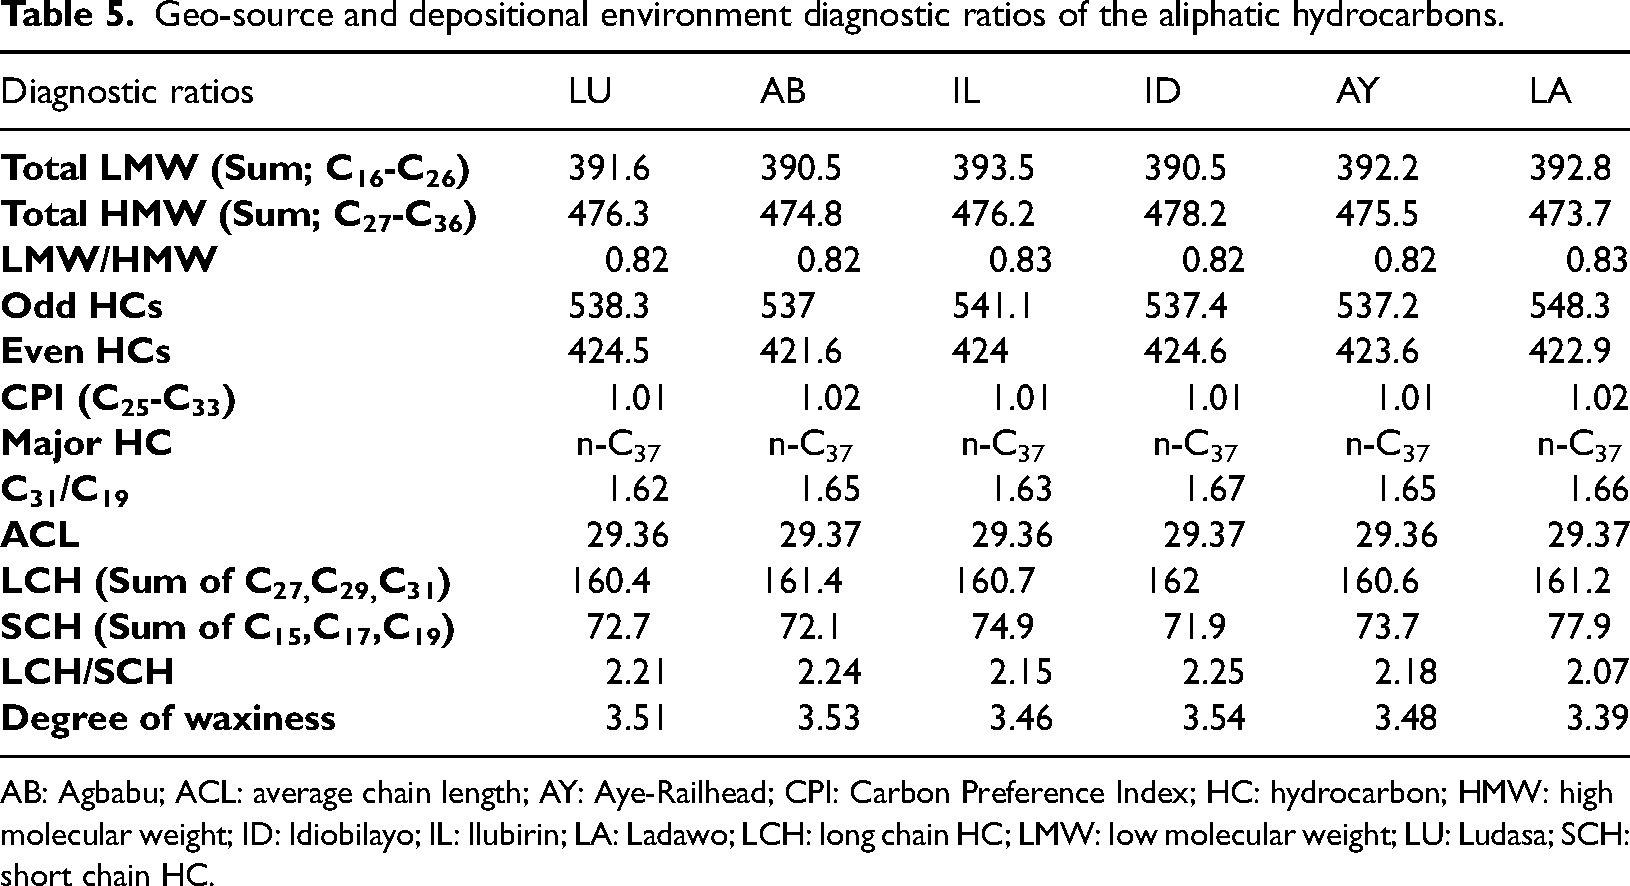
AB: Agbabu; ACL: average chain length; AY: Aye-Railhead; CPI: Carbon Preference Index; HC: hydrocarbon; HMW: high molecular weight; ID: Idiobilayo; IL: Ilubirin; LA: Ladawo; LCH: long chain HC; LMW: low molecular weight; LU: Ludasa; SCH: short chain HC.
Carbon Preference Index
This index focuses on the C22 to C30 range n-alkanes. The CPI from n-alkanes distribution is a summation of odd to even carbon-numbered n-alkanes, used to evaluate biogenic and anthropogenic contributions (Fagbote and Olanipekun, 2012). This index can give an indication of the source material, hence the environment of deposition, however, studies have shown that the predominance of odd carbon-numbered n-alkanes tends to decrease with greater sample maturity (Brocks and Summons, 2003). The CPI in this study was calculated over a range; of n-C22 to n-C30 and was found to lie between 1.01 and 1.02 indicating thermally matured bituminous sands.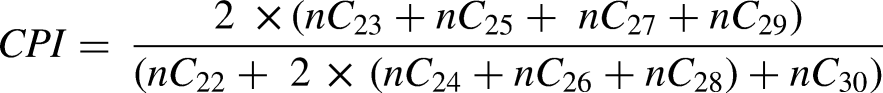
Low molecular weight/high molecular weight ratio
LMW n-alkanes originate from marine biogenic sources, while HMW n-alkanes originate from land-dwelling vascular plants (Fagbote and Olanipekun, 2012). This ratio sums up n-alkanes ranging from C17 to C26 and that ranging from C27 to C37 (Jeng, 2006). Predominant LMW n-alkanes are existent in freshly matured oils, while sediment bacteria and higher plant marine animals are in HMW n-alkanes. This ratio differentiates macrophytes from land-dwelling plants in soil. LMW/HMW values <1 indicate land-dwelling biogenic source input, while values >1 indicate marine biogenic source input (Jeng, 2006). The LMW/HMW ratio for the bituminous sand samples lies between 0.82 and 0.83, suggesting land-dwelling biogenic sources.
C31/C19 ratio
The C31/C19 ratio identifies the predominance of HC input from land or aquatic sources (Yang et al., 2011). Carbon number 31 (C31) shows the presence of land-dwelling biogenic HCs, while carbon number 19 (C19) represents marine biogenic sources (Jeng, 2006). C31/C19 values <0.4 shows a predominance of aquatic biogenic sources, while values >0.4 shows terrestrially derived HCs (Fagbote and Olanipekun, 2012; Jeng, 2006). Results for C31/C19 ratio range from 1.62 to 1.67 for the bituminous sand samples studied, suggesting the predominance of terrestrial biogenic sources.
Average carbon length
The ACL estimates odd-numbered carbon predominance in a sample. It defines the average number of carbon atoms per molecule based on odd carbon-numbered abundance in higher plant n-alkanes (Bakhtiari et al., 2010; Fagbote and Olanipekun, 2012). High ACL values are typically consistent with high plant input, while lower values are probably due to pollutant exposure (Jeng, 2006). The ACL value for the studied bituminous sands lies between 29.36 and 29.37, which implies an abundance of odd carbon-numbered higher plant n-alkanes in agreement with the findings of Fagbote and Olanipekun, (2012).
Degree of waxiness
This ratio can be expressed as the summation of C21-C31 (ΣC21-C31) to C15-C20 (ΣC15-C20) n-alkanes. The level of waxiness of the bituminous sands ranged from 3.39 to 3.54, which reveals a very high waxy nature of the samples and suggests terrestrial organic sources mainly of higher plants under oxidising conditions (Peters et al., 2005). The samples were characterised by a substantial quantity of n-C21 to n-C31 n-alkanes found in the samples, indicating a high degree of waxiness.
Long chain HC/short chain HC ratio
LCH and SCH are made up of n-alkanes, n-C26 and above. LCH/SCH ratio assesses the macrophytes and phytoplankton dominant trends (Beard, 2007; Fagbote and Olanipekun, 2012). Low values between 0.21 and 0.80 are predominantly derived from phytoplankton. Intermediary values ranging from 2.03 to 4.33 indicate a combination of both input sources (macrophytes and phytoplankton). Land-dwelling plant waxes dominate higher LCH/SCH ratios above 4.0 (Fagbote and Olanipekun, 2012). The LCH/SCH ratio of the samples ranged from 2.07 to 2.25 suggesting a combination of marine and terrestrial plant input sources.
Major HC index
The major HC (MH) index across the bituminous sand samples is n-C37. The MH index is used to identify the highest concentration of n-alkane with respect to its number of carbons. It differs from one location to another and contributes significantly to total n-alkane concentrations.
FTIR and GC-MS signatures
The FTIR spectrum was obtained for four (4) representative bituminous sand samples to determine the hydrocarbon group (aliphatic and aromatic) present (Figure 6). The peak chosen in AE-03 and EG-01, IL-01 and LD-01, are both related at 2922.2 and 2855.1 cm−1, respectively, based on the C-H medium stretching vibration of an alkane. The IR transmittance spectra of AE-03, LD-01, EG-01 and IL-01 (Figures 6(a) to (c)) show absorptions bands between 2855.1 and 2922.2 cm−1, which is due to the C-H medium stretching vibration related to alkanes. On the IR transmittance spectra of EG-01 (Figure 6(b)), the bands at 3697cm−1 show evidence of kaolinite (Solomon and Carangelo, 1988). A broad and strong peak observed around 3347.1 cm−1 is due to the –OH absorption band (intermolecular bonded) suggesting adsorbed water on clay. The absorption bands observed at 2113.4 to 1636.3 cm−1was caused by the C = C stretching vibration of aromatic HCs. The IR transmittance spectra of IL-01 (Figure 6(c)) shows a stretching vibration between 3619.2 and 3693.8 cm−1which is due to a medium sharp –OH vibration of an alcohol likely related to kaolinite (Solomon and Carangelo, 1988). The absorption band observed at 1625.1 cm−1 is due to the C = C stretching vibration of aromatic HCs. In the IR transmittance spectra of AE-03 (Figure 6(a)), the stretch that occurs between 3623.0 and 3693.8 cm−1 is assigned medium sharp –OH alcohol and shows vibration related to kaolinite. Generally, hydroxyl (OH) functional groups are most dominant in the analysed samples. All C-H absorption stretch below 3000cm−1 is due to aliphatic/saturated HCs. All the samples were found to have C-H absorption bands at 2922.2 and 2855.1 cm−1 (Figures 6). In the EG-01 sample, the absorption bands between 1636.3 and 2113.4cm−1 are caused by the C = C stretching vibration of aromatic HCs. The absorption peak at 1028.7 cm−1 may be related to the Si-O chemical bond of the clay minerals. The absorption bands between 3693.8 and 3697.5 cm−1 also show evidence of kaolinite Al2(Si2O5)(OH)4 (Solomon and Carangelo, 1988). Bands at 3693.8, 1703.4 and 3652.8 cm−1 are common in both IL-01 and AE-03. The absorption bands at 1636.3 and 1625 cm−1 in EG-01 and IL-01, respectively, are due to the distortion vibration of adsorbed water molecules by kaolin.
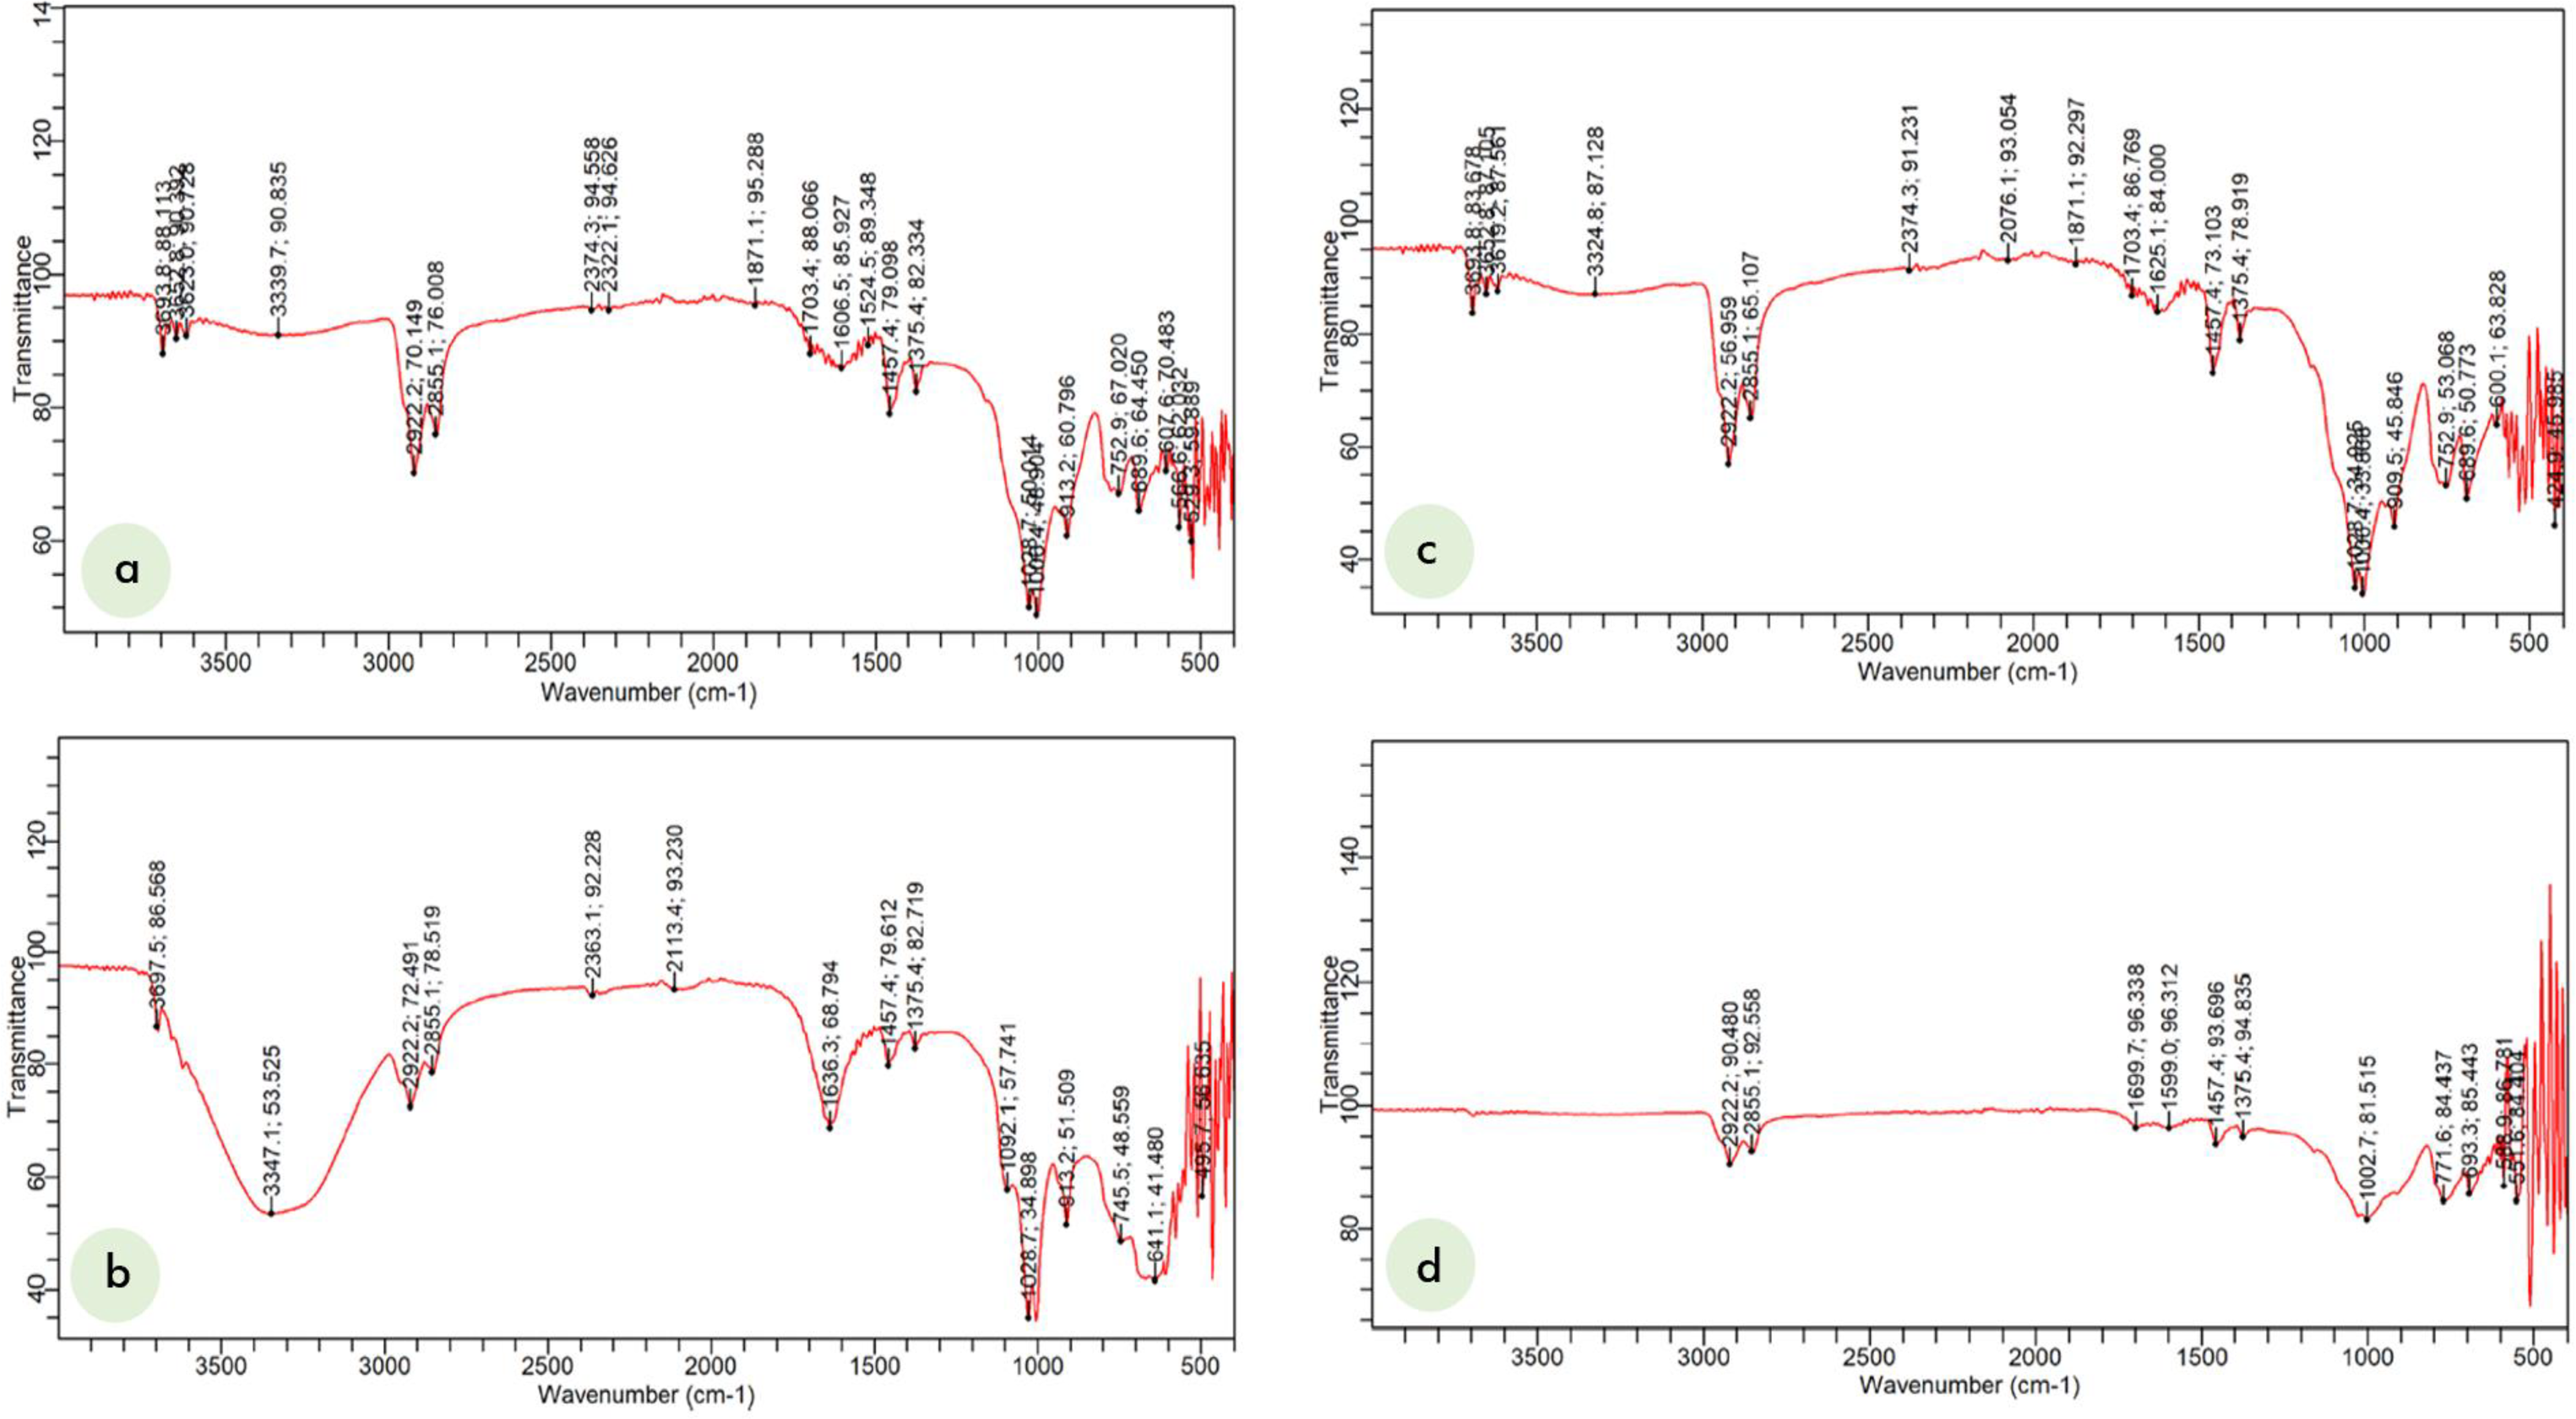
IR transmittance spectra for bituminous sand samples (a) AE-03, (b) EG-01, (c) IL-01 and (d) LD-01.
The chromatogram fingerprints of selected bituminous sand samples (EG-01 and AE-03) are shown in Figure 7, where the relative abundance is plotted against the retention time, which is pointed at the peak areas. Figure 7 shows a bimodal n-alkane GC fingerprint envelope with maxima between nC16 – nC18 and nC27 like the results obtained by Adekeye et al. (2019), indicating varied inputs from both terrigenous and non-terrigenous (presumably marine algae type) organic matter (OM). Both bituminous sand samples have similar HC distributions, with the same amount of the < n-C10 (which is the lightest proportion) and n-C16 and n-C27 (representing the heavy HCs). GC-MS chromatograms (m/z 256) indicate the existence of bicyclic sesquiterpenes (BSs) in the bituminous sands investigated. These are saturated HCs with a low boiling point, that commonly elute between n-C12 and n-C16. Terpenes’ (m/z 117) profile in the bituminous sands is strikingly comparable, whereas all molecular predictive ratios are indistinguishable, implying that they have the same provenance. Also, at m/z 119, m/z 278, m/z 368, m/z 256 and m/z 180, nearly comparable biomarker and chromatographic properties were observed in these sands, which is indicative of similar levels of biodegradation. This was confirmed by the absence of 25-norhopanes in these sands, suggestive of biodegradation of the samples at shallow depths. The FTIR spectra show large C = C absorption and aromatic peaks for the samples, indicating heavy degradation in the oil sample in agreement with the GC data.
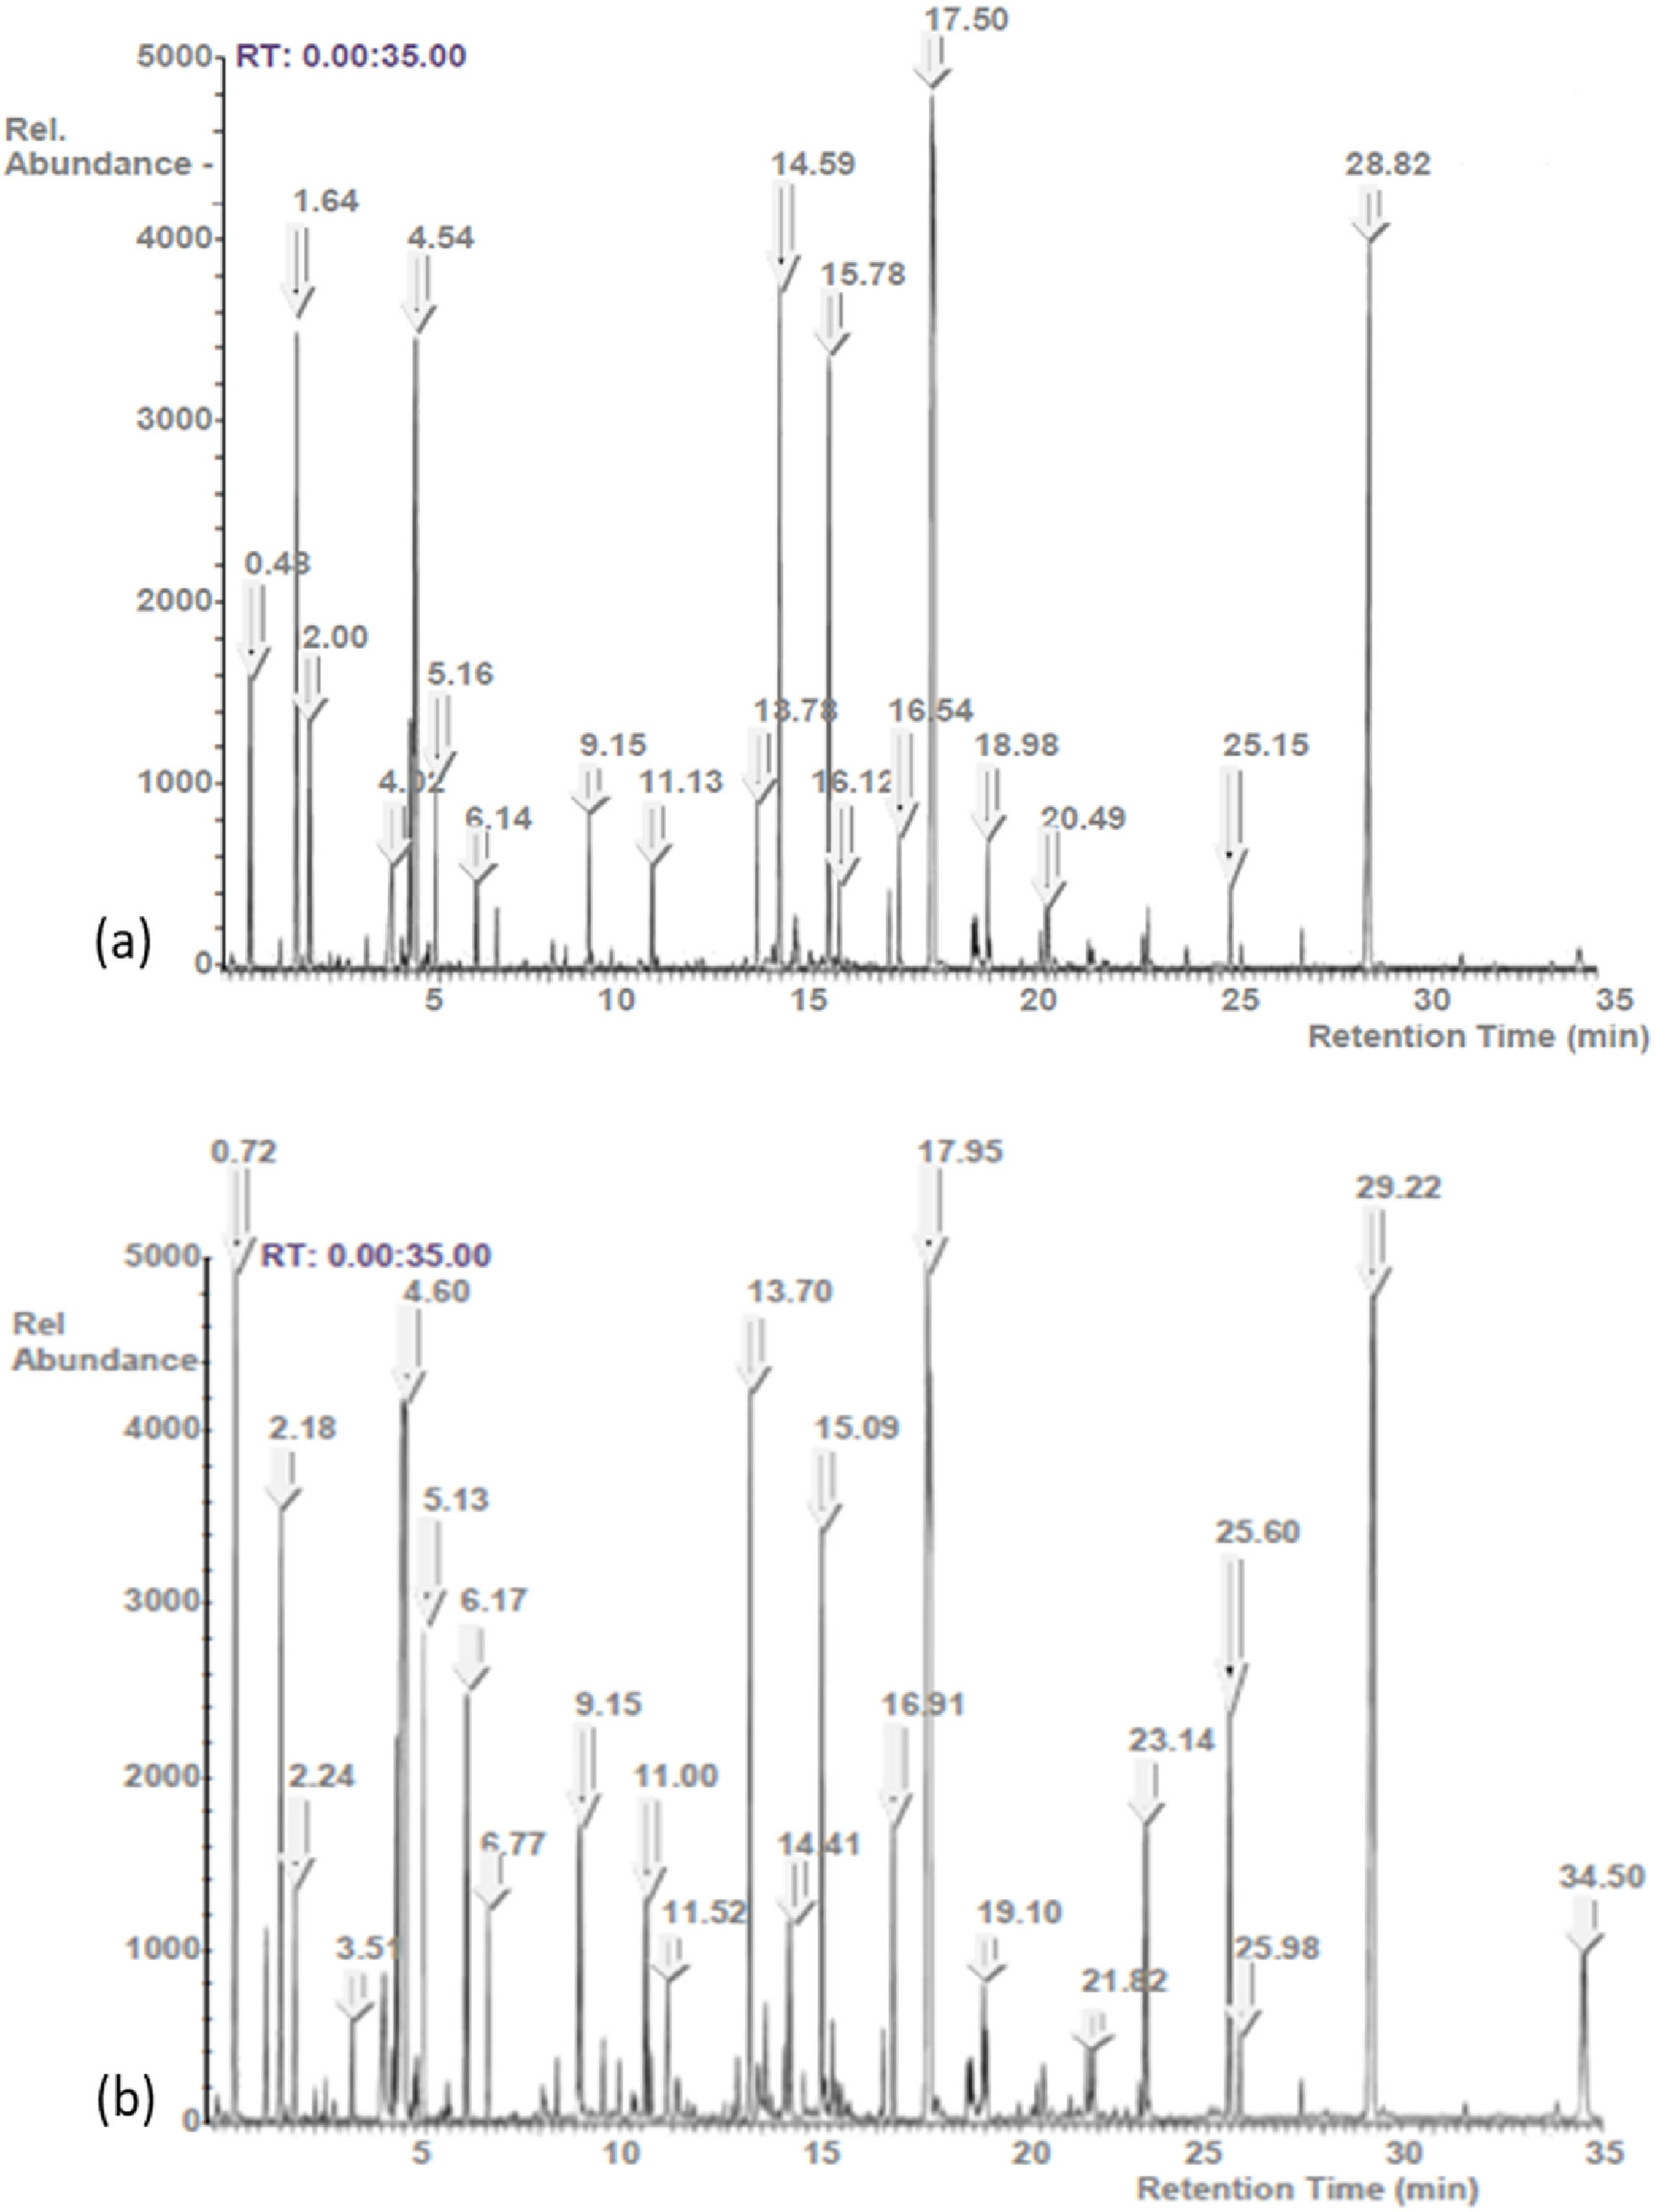
Chromatogram fingerprints of bituminous sand samples (a) EG-01 and (b) AE-03.
Conclusions
The bituminous sands exhibit a typical biodegradation effect, as evidenced by MnO depletion, which was most likely caused by dissimilatory manganese reduction by microbes. This is consistent with the paleo-redox conditions during deposition as determined by the Ni/Co ratio, which indicates a predominantly oxic environment favourable to organism attack and biodegradation. This is corroborated by the same level of biodegradation revealed by the GC-MS. A comparison of the results of analyses shows the degree of multifunctionality to be high with the heteroatoms being concentrated in the HMW molecules of the bituminous sands.
The samples are generally silica-rich, ferruginized, and plots in the Fe-sand field on Herron's diagram. The H/C and O/C ratios suggest these samples are derived from terrestrial plants with probable contributions from the epigenetic roots of plants. The bituminous sand samples have a high waxy nature and are derived from higher plants of both marine and terrestrial source input with predominance from terrestrial biogenic sources under oxic conditions. IR spectra show the dominance of the hydroxyl functional group, while 2922.2 and 2855.1 cm−1 are common in all the samples, showing vibrations related to aliphatic HCs. The occurrence of CH-stretching alkane bands (2922.2–2855.1cm−1) in the IR spectra of the bituminous sands revealed the presence of residual organics, which is compatible with the elemental analysis results.
Variable inputs from both terrigenous and non-terrigenous OM (presumably marine algae) are suggested by the bimodal n-alkane fingerprint envelope observed, with peaks between nC16 – nC18 and nC27. The HC distribution of the samples shows similar light end fractions (<nC10) and heavier HC (nC16–nC27). Despite the biodegradation of n-alkanes, GC-MS chromatograms (m/z 256) indicated the presence of BSs in the studied bituminous sands.
Our results reveal that IR spectroscopy is indeed a viable tool for characterising the groups of HC present in the bituminous sands, which could substitute present traditional fractionation procedures. A detailed analysis of bituminous sands has been done and compared with available literature to elucidate differences and similarities between representative oil sand bitumen content. The FTIR analysis of the bituminous sands and fractions revealed that, like other bituminous sands from around the world, the studied samples contain a mixture of aliphatic and aromatic compounds. The producibility of these sands is more dependent on the HC content, such as: the higher the HC content, the higher its producibility; bituminous sands have high producibility due to the high concentration of carbon and hydrogen inferred from elemental analysis.
Footnotes
Acknowledgements
The authors appreciate the technical assistance provided by the laboratory staff of the Department of Geology, Federal University Oye-Ekiti, and Jawora Laboratory, Port Harcourt. The assistance of Dr O. A. Oluwajana, Kehinde Egunjobi, and Rachael Alamu during the fieldwork is greatly appreciated. We also appreciate the anonymous reviewers’ critical and helpful remarks, which helped to improve the manuscript's quality.
Declaration of conflicting interests
The author(s) declared no potential conflicts of interest with respect to the research, authorship, and/or publication of this article.
Funding
The author(s) received no financial support for the research, authorship, and/or publication of this article.