
Abstract
In the present research, we have proposed a new adaptive kernel density estimation method formulated on the theory of linear diffusion processes. By examining the calculation results we have found that in the tail region, our proposed new adaptive kernel density estimation distribution curve becomes very smooth and fits quite well with the histogram of the measured ocean wave dataset at the US National Data Buoy Center station 46026. Carefully studying the calculation results also reveals that the 50-year extreme Power-Take-Off heaving force value forecasted based on the environmental contour derived using the new method is 3021700N, which is much larger than the value 2458700N forecasted via the Rosenblatt-inverse second-order reliability method contour method. Consequently, our proposed new adaptive kernel density estimation method formulated on the theory of linear diffusion processes can forecast well and efficiently forecast the 50-year extreme design force values for offshore sustainable energy systems.
Keywords
Introduction
Designing, installing, and operating offshore sustainable energy systems need the vital information provided by statistically describing the sea severity. Typically, a measured data set of significant wave heights (
Currently, the most frequently used probability distribution model for Hs is the 3-parameter Weibull distribution (also called the translated Weibull distribution in some literature). Having obtained the fitted marginal distributions of the significant wave height and a specific wave period together with their correlation structures, a 50-year environmental contour line can subsequently be derived by conducting a proper transformation between the Gaussian space and the physical parameter space. Having obtained an environmental contour line by using the inverse first-order reliability method (IFORM) and utilizing the information on the obtained contour line as a basis, Clarindo et al. (2021) further studied to reduce the variance on the probability of failure estimates by applying the Monte Carlo Importance Sampling technique. In this study, the marginal probability distribution of Hs was described by using a 3-parameter Weibull distribution model fitted to a large set of simulated ocean wave data. In the study of Haselsteiner et al. (2021) for deriving highest density environmental contour lines, the Hs was also assumed to follows a 3-parameter Weibull distribution. Mackay and Haselsteiner (2021) used a sea state model in which the Hs is modeled using a 3-parameter Weibull distribution and subsequently obtained environmental contour lines by using a Rosenblatt transformation based on the IFORM method. Wrang et al. (2021) applied the IFORM method to generate 50-year environmental contours based on observed and hindcast data at several sea locations in the Baltic Sea, North Sea, and Skagerrak. For implementing the IFORM analysis, Wrang et al. (2021) assumed that the marginal distribution of Hs follows a 3-parameter Weibull distribution. In order to study the system reliability of an offshore platform, Zhao and Dong (2022a) calculated environmental contour lines using the IFORM method in which the marginal distribution of Hs was fitted using the 3-parameter Weibull model. Zhao and Dong (2022b) extended the alternative contour line approach based on the IFORM method in a three-dimensional model that accounting for uncertainties for the short-term extreme responses. In Zhao and Dong (2022b), the marginal distribution of Hs was fitted to a 3-parameter Weibull model in order to construct the environmental contour lines. Chai and Leira (2018) estimated inverse second-order reliability method (ISORM) environmental contour lines by extending the traditional IFORM method. Nevertheless, when performing the Rosenblatt transformation in the ISORM method the marginal distribution of Hs is still assumed to follow the 3-parameter Weibull model.
All the aforementioned studies applied the 3-parameter Weibull model for fitting the Hs during the process of calculating the environmental contour lines. Unfortunately, the suitability of the 3-parameter Weibull model for fitting the Hs distribution tails has not been investigated in these studies. To investigate this suitability, Haselsteiner and Thoben (2020) analyzed three wave datasets measured at the US Atlantic Coast and another three hindcast-simulated wave datasets covering the North Sea. They derived the concluding remarks that for all six datasets the 3-parameter Weibull model seriously underestimated the probability density values at the tail region.
We can notice that the parametric method for fitting the Hs probability distribution had been used by all the above-mentioned publications. In the literature, a nonparametric ordinary kernel density estimation (KDE) method was used in Haselsteiner et al. (2017) for calculating the Hs probability distributions in order to predict environmental contour lines of extreme sea states. However, it was stated in Ross et al. (2020) that the ordinary KDE method behaves poorly in predicting the probability density values at the tail region. To overcome the deficiencies of the ordinary KDE method and improve the performance of capturing the probability distribution tails, Eckert-Gallup and Martin (2016) adopted an adaptive bandwidth selection procedure in their bivariate KDE method for estimating the environmental contour lines of extreme sea states. Nevertheless, it is usually very difficult and time-consuming to implement Abramson's adaptive bandwidth selection procedure proposed in Eckert-Gallup and Martin (2016). After reviewing all the aforementioned literature in its current form, it is obvious that there is a knowledge gap that all the existing methods (parametric or nonparametric) can’t predict accurately and efficiently the sea state parameter probability distribution tails. Therefore, finding a highly efficient adaptive bandwidth selection procedure is imperative so that people can predict the probability distribution tails and environmental contour lines more efficiently and accurately.
With the expectation to overcome the disadvantages of all the above-mentioned nonparametric and parametric methods, a new adaptive KDE methodology based on linear diffusion processes will be proposed to help researchers and engineers to predict the probability density values in the tail region more efficiently and accurately. This new adaptive KDE methodology will subsequently be applied to calculate the Hs probability density values in the tail region based on a measured dataset at the US National Data Buoy Center (NDBC) Station 46026. The efficiency and accuracy of the proposed new adaptive KDE methodology will be validated by comparing its prediction results with those forecasted by using a parametric method, an ordinary KDE method and Abramson's adaptive KDE method. Subsequently, 50-year environmental contours will be respectively forecasted by the new adaptive KDE methodology and the ISORM method with Rosenblatt transformation based on the aforementioned measured dataset at the US NDBC Station 46026. The obtained 50-year environmental contours will then be used for the offshore sustainable analysis (i.e., predicting the 50-year dynamic response values for a typical offshore sustainable energy system (in this case, a floating point absorber wave energy converter (WEC))). By carrying out the aforementioned procedures we have succeeded to bridge the offshore sustainable analysis and our objective of utilizing the proposed new adaptive KDE method based on significant wave height and sea state prediction. By carefully investigating the prediction results, the benefits of utilizing our proposed new adaptive KDE methodology for safety analysis of offshore sustainable energy systems will be demonstrated.
The theories corresponding to various analysis methods
The theoretical backgrounds of the IFORM and ISORM environmental contour line approaches
For the performance analysis of a specific offshore sustainable energy system, the long-term (e.g., 50 years) dynamic response extremes of the sustainable energy system can be predicted by carrying out a short-term (e.g., 3 h) analysis based on the environmental contour line method as specified in, e.g., Haver and Winterstein (2009). The environmental contour lines at a specific ocean site can be calculated when the
In order to derive an environmental contour line, one should first transform the marginal


The radius r (also call the reliability index and denoted by


The theories for the ordinary and Abramson's adaptive KDE methods
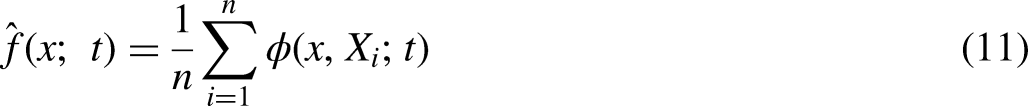
The IFORM and ISORM approaches for deriving environmental contour lines are both parametric methods. For implementing these two methods, some specific probability distribution models regarding the sea state parameters should be predefined. However, the parametric modeling approach has a serious drawback, i.e., the predefined probability model might be too rigid and restrictive to accurately estimate the true underlying function. In order to overcome the rigidity of the parametric models of the sea state parameter probability distributions, one can utilize the non-parametric KDE method. In probability and statistics, KDE is the application of kernel smoothing for probability density estimation, i.e., a non-parametric method to estimate the probability density function of a random variable based on kernels as weights. The ordinary univariate KDE is carried out as follows (Silverman (1986)):

The bivariate KDE can be carried out through extending the aforementioned univariate KDE process by using two bandwidths (h1 in one coordinate's direction and h2 in another coordinate's direction). Suppose


Adaptive KDE method formulated on the theory of linear diffusion processes
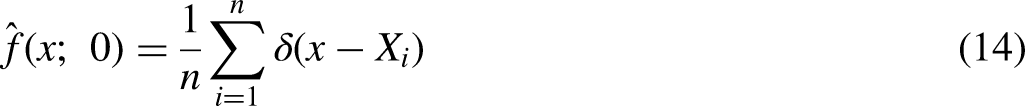
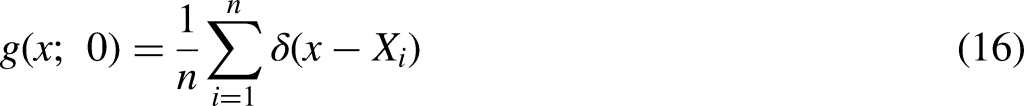
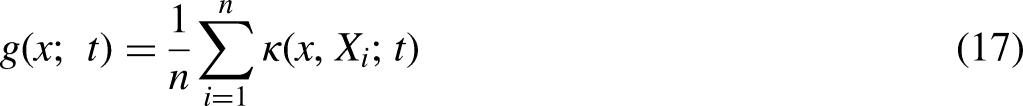
Suppose once again that (

the Gaussian kernel density estimator as expressed in equation (12) can be uniquely derived:


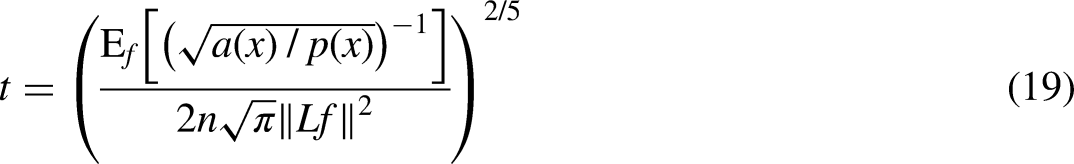
The following Figure 1 shows a flowchart describing procedures for obtaining f by the proposed new adaptive KDE method.
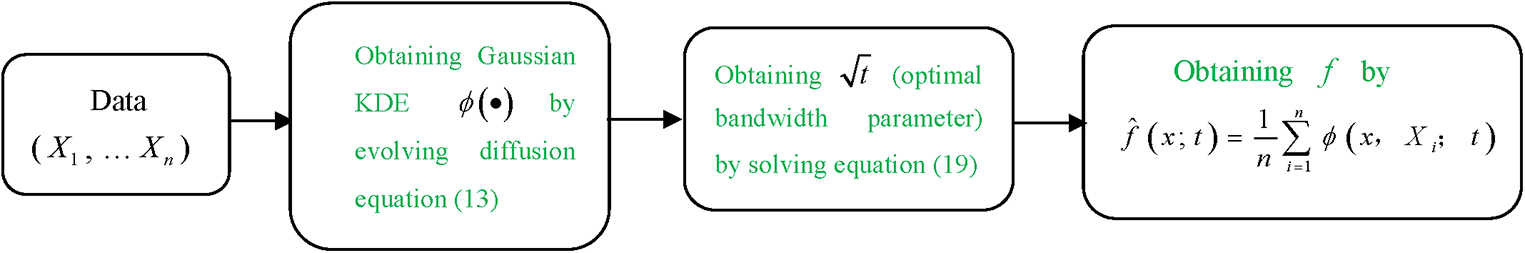
A flowchart describing procedures for obtaining f by the proposed new adaptive kernel density estimation method.
Theories for the dynamic analysis of an offshore sustainable energy system
WEC SIMulator (WEC-Sim), an open-source software for simulating WECs has been utilized in this study. WEC-Sim is developed in MATLAB/SIMULINK using the multi-body dynamics solver Simscape Multibody. WEC-Sim has the ability to model devices that are comprised of hydrodynamic bodies, joints and constraints, power take-of systems, and mooring systems. Simulations are performed in the time-domain by solving the governing WEC equations of motion in the six rigid Cartesian degrees-of-freedom. For the dynamic analysis of a specific offshore sustainable energy system (a point-absorber WEC), the following equations of motion can be utilized (Wang (2018, 2019, 2020)):


Calculation examples regarding the
probability distribution tails
In the following, we provide our calculation examples regarding the
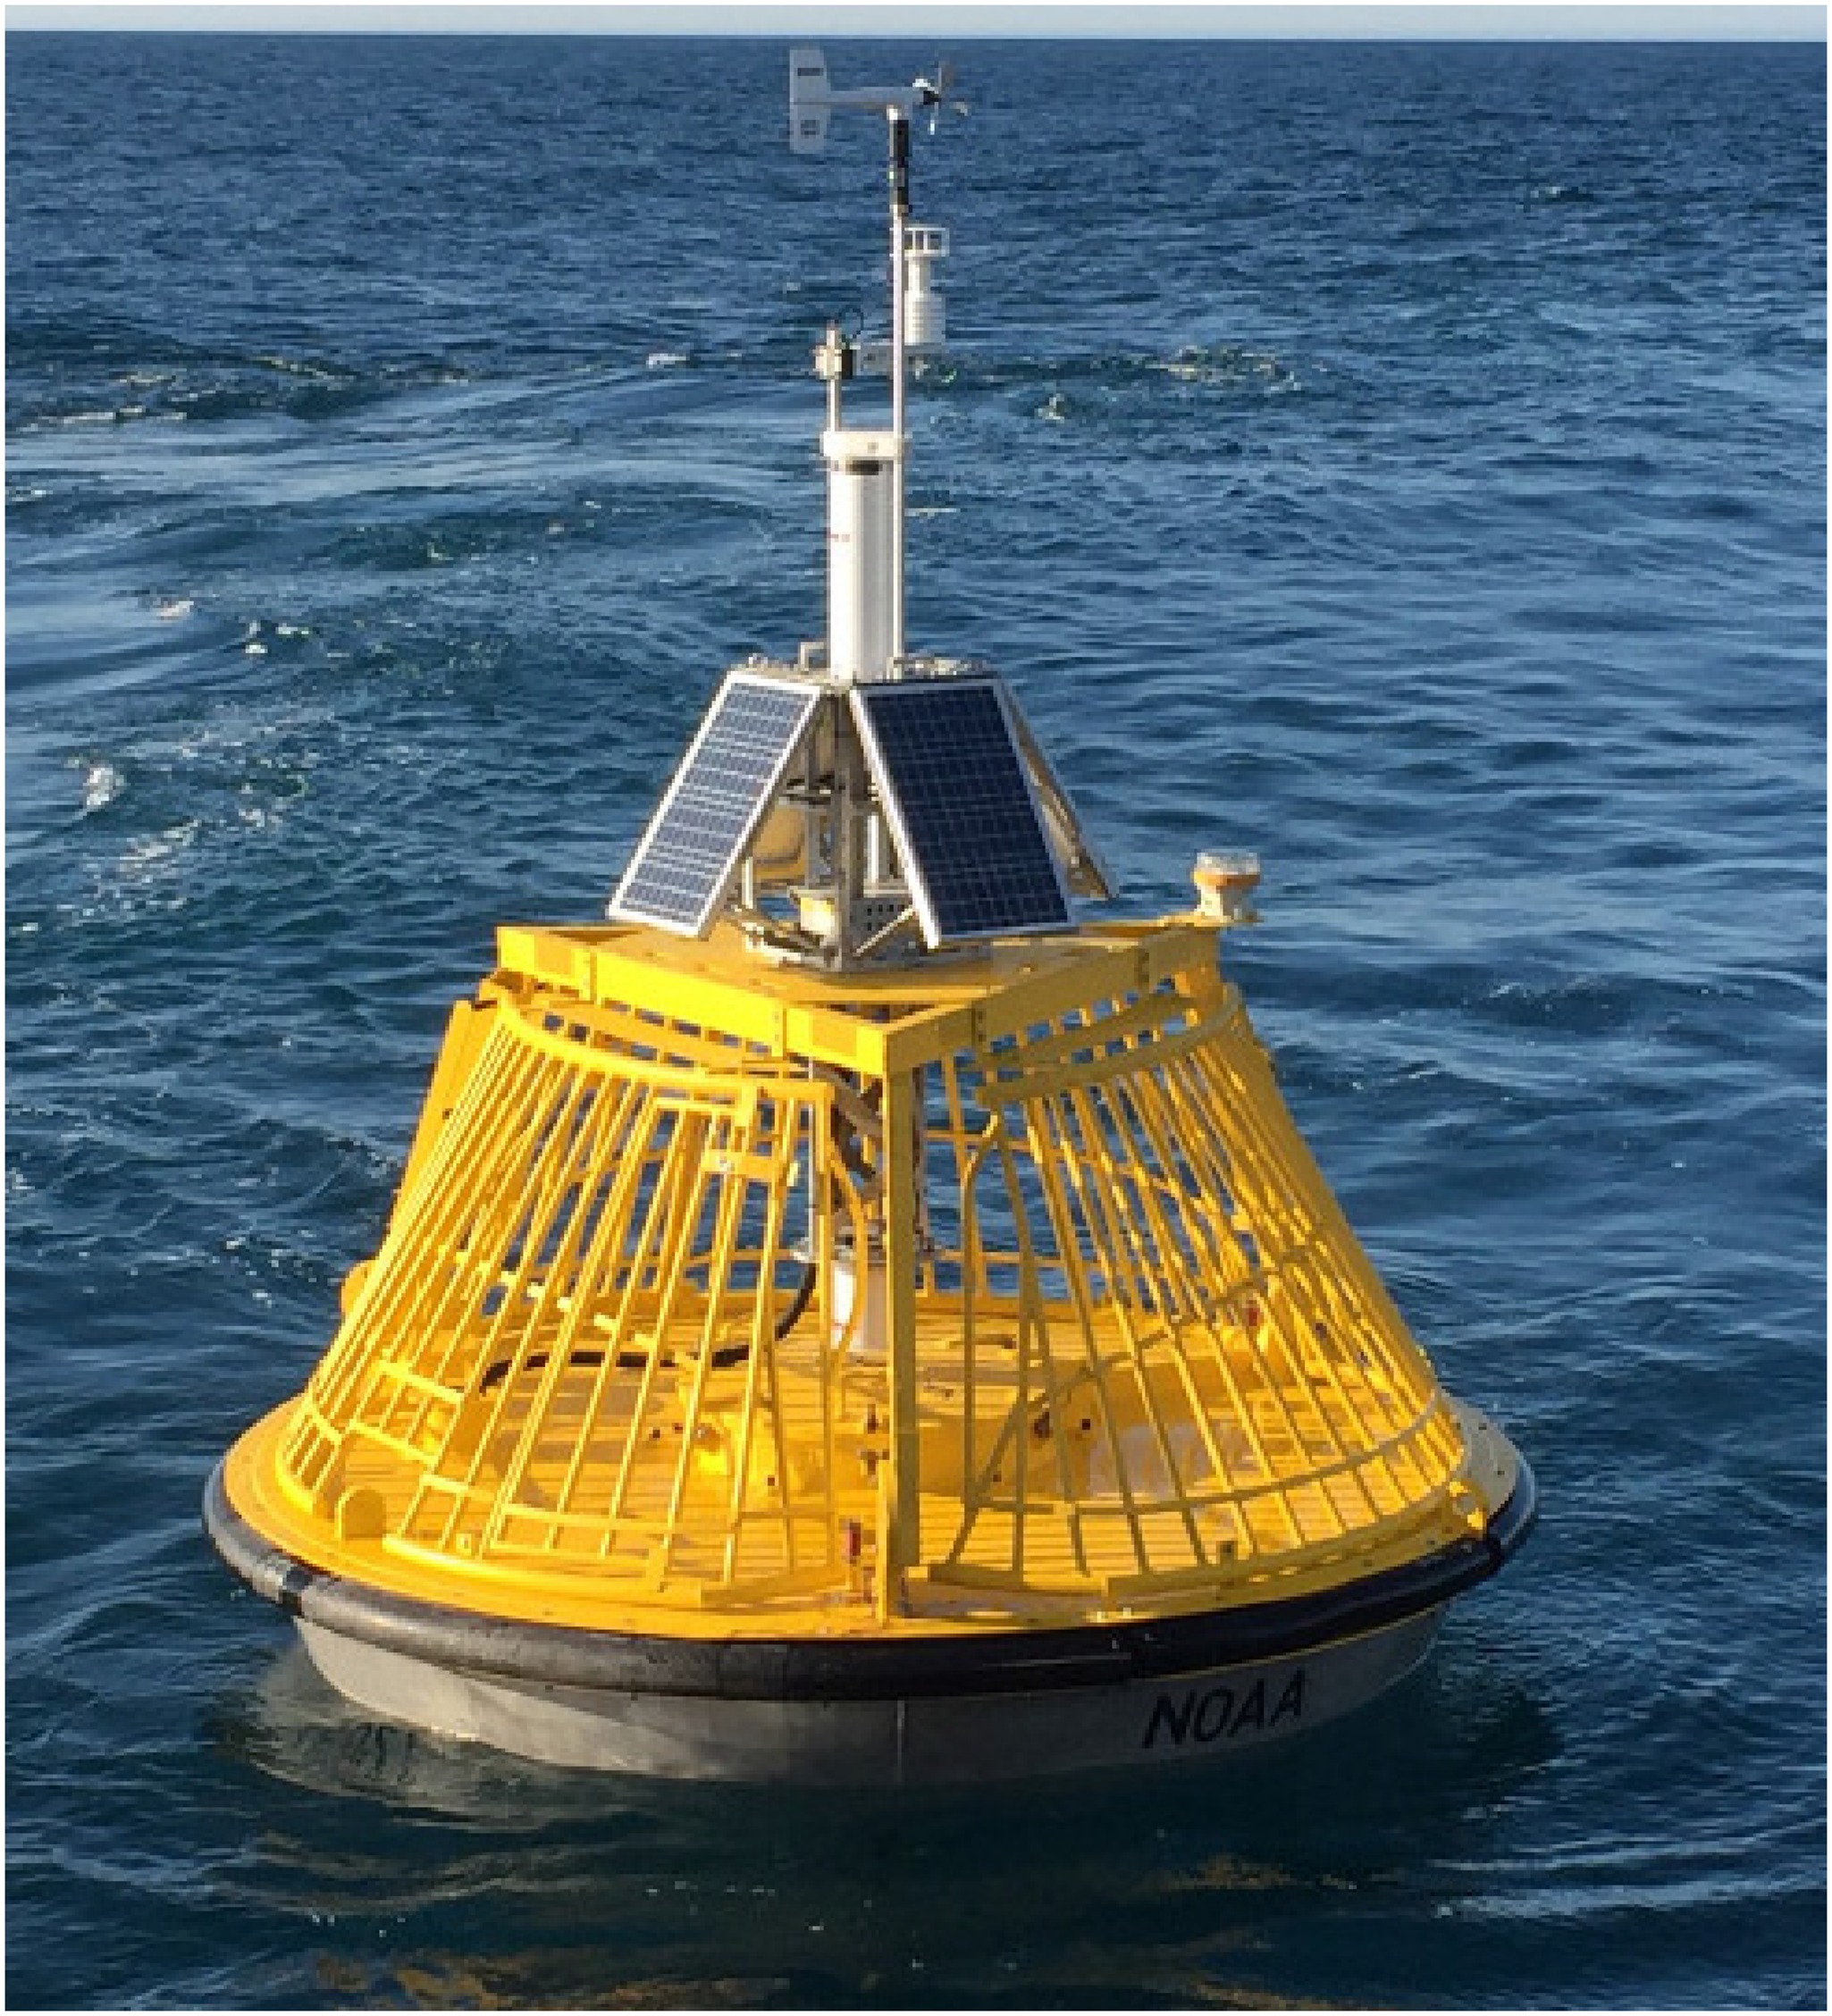
The picture of the US National Data Buoy Cente (NDBC) 46026 station data buoy (https://www.ndbc.noaa.gov/station_page.php?station=46026).
This wave dataset was measured hourly during the time span of January 1, 1996 to December 31, 2021 and contains 210240
The probability density distributions calculated based on the aforementioned

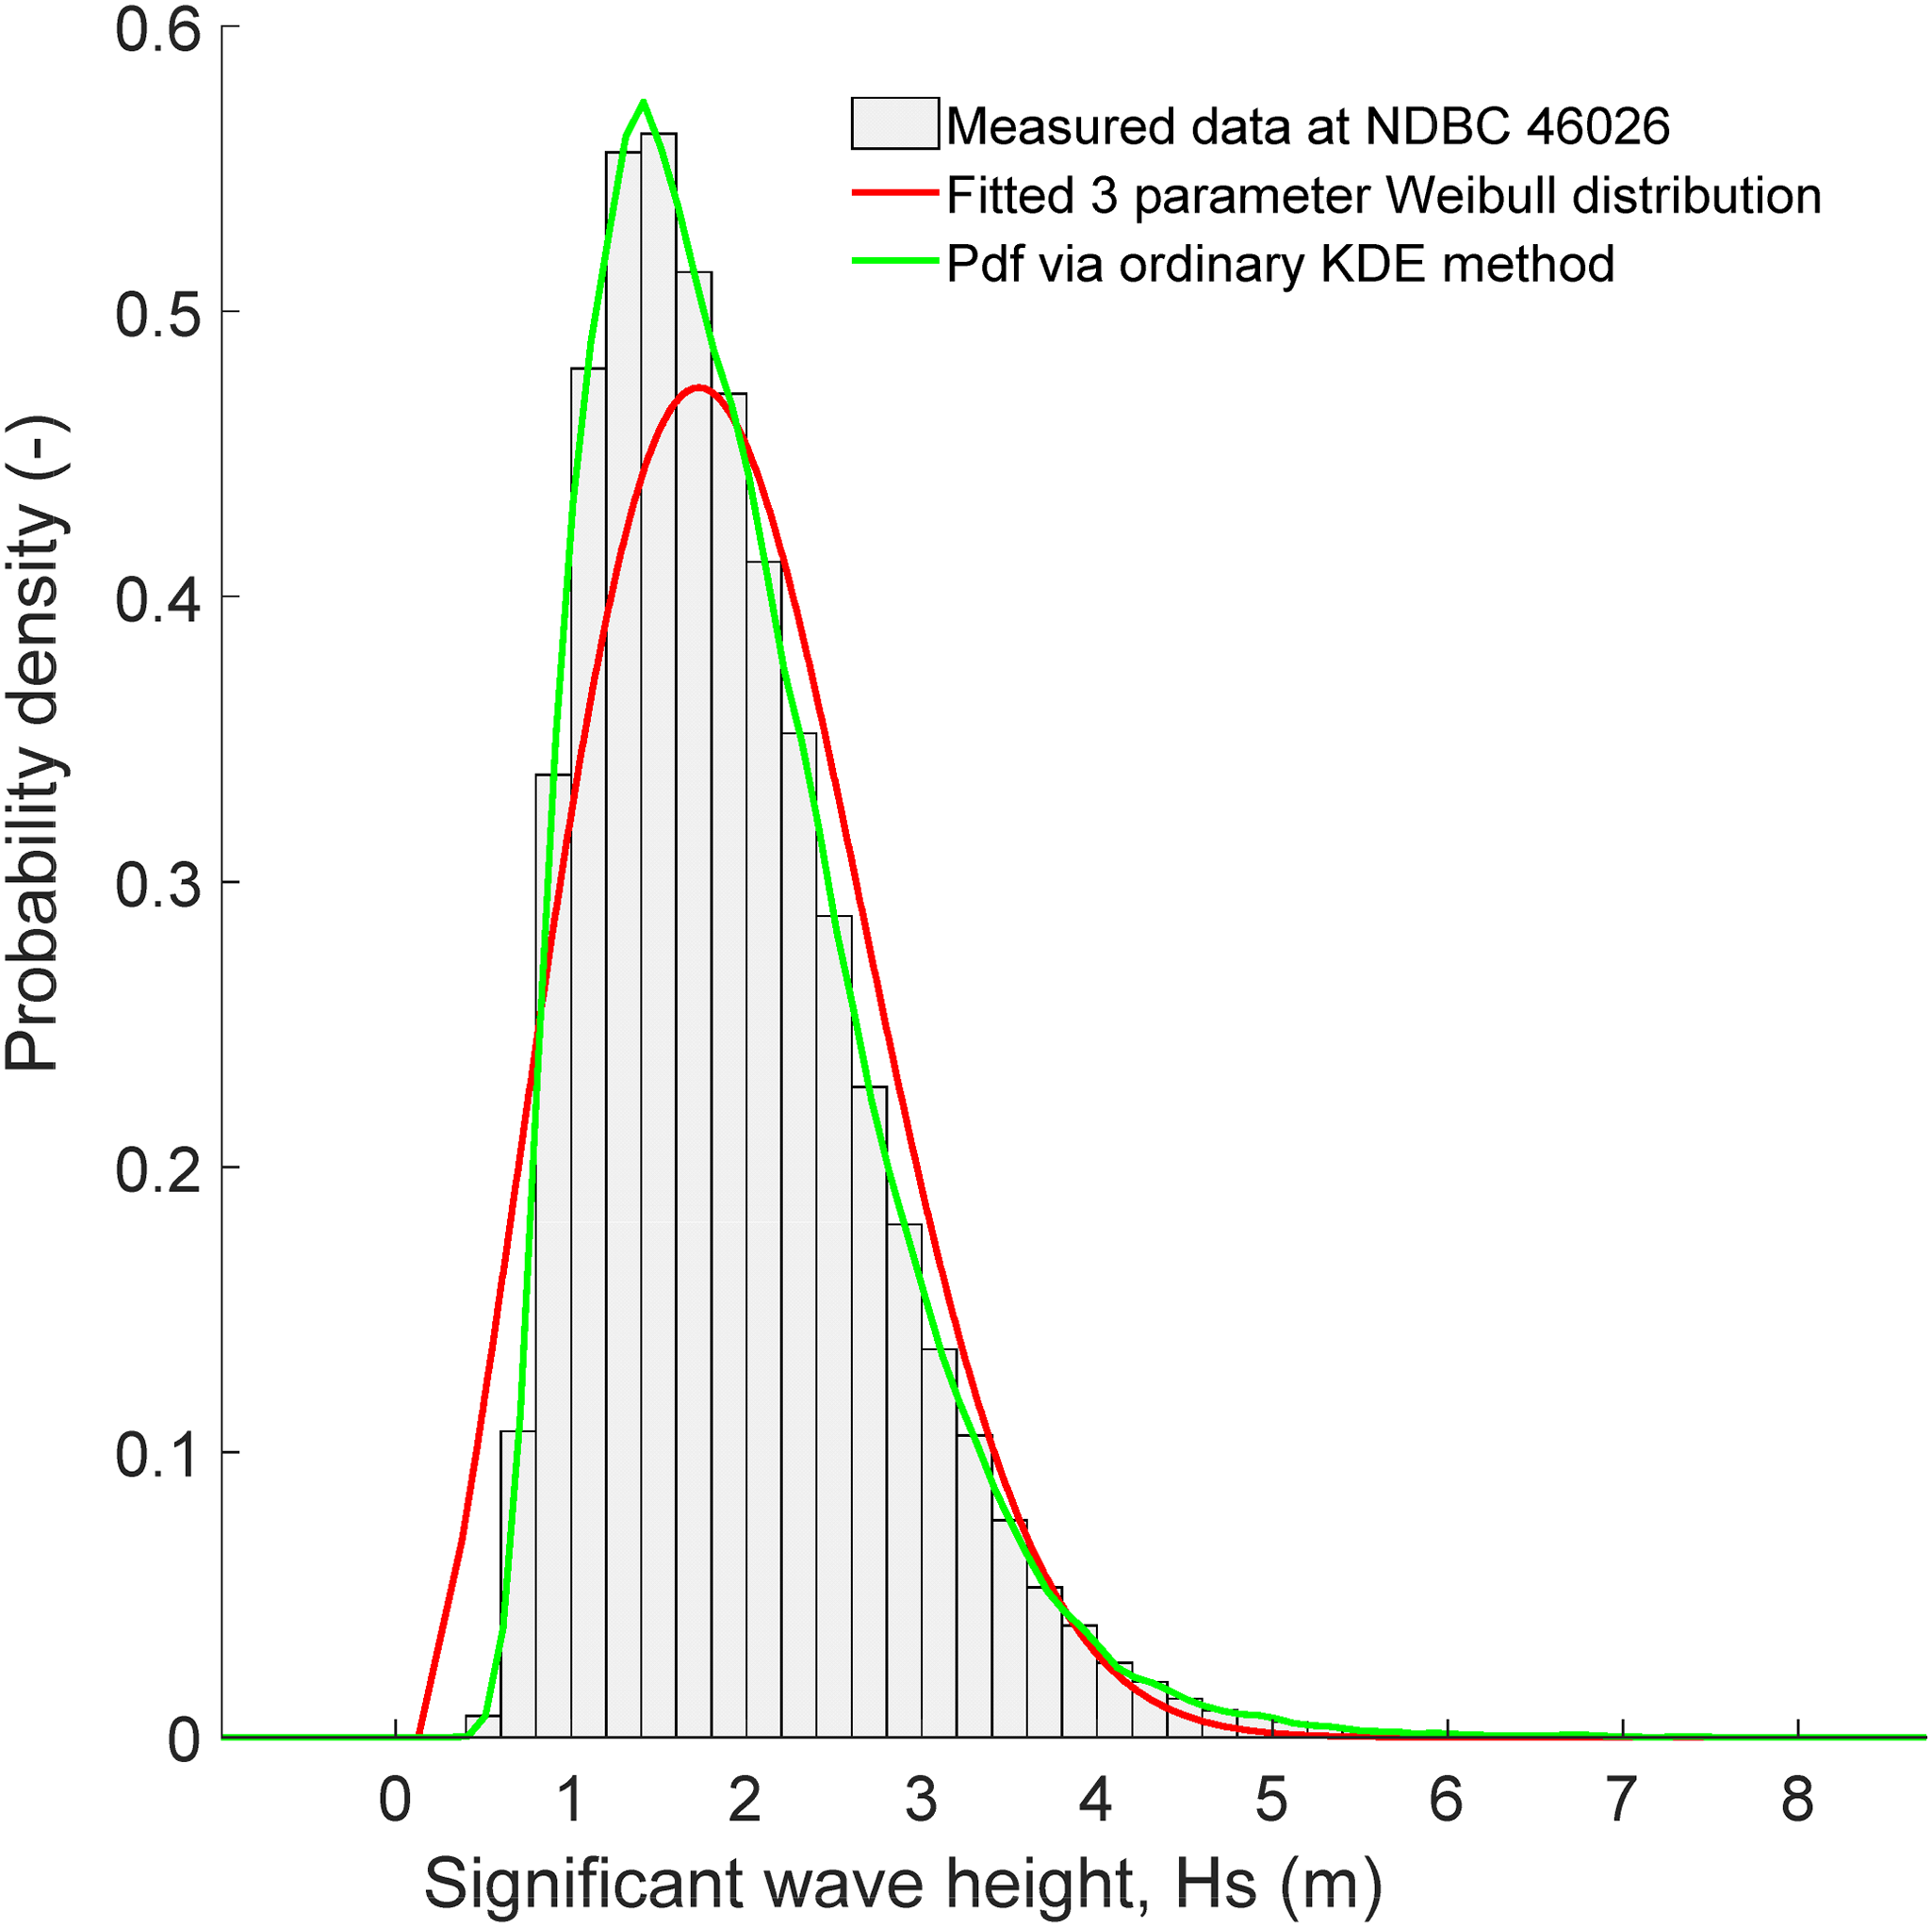
Model fit between the measured data at US National Data Buoy Cente (NDBC) 46026 and the two considered models respectively.
The values of the parameters in the above model had been obtained by utilizing a maximum likely method as follows:
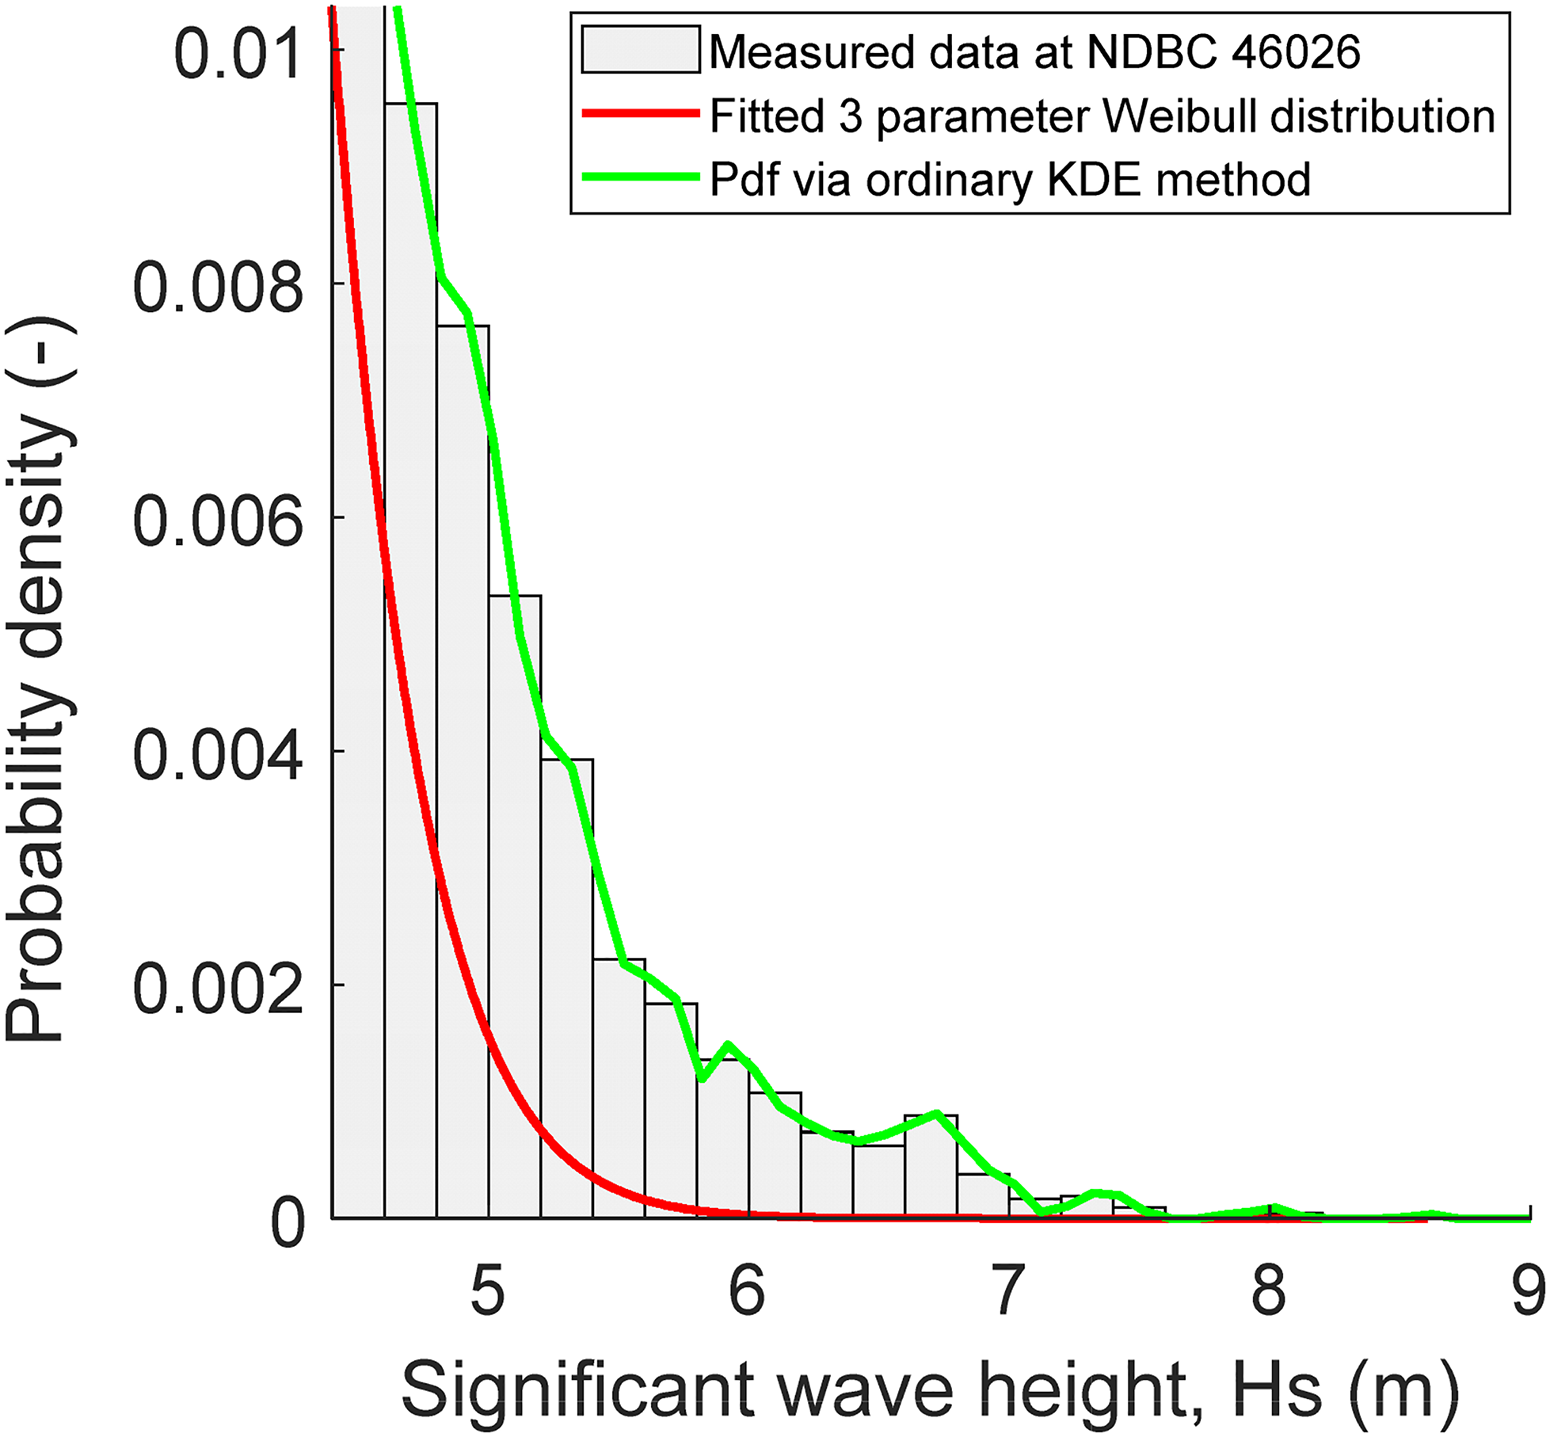
Model fit at the tail region between the measured data at US National Data Buoy Cente (NDBC) 46026 and the two considered models respectively.
The green distribution curve in Figure 3 is the calculation results obtained by fitting the aforementioned wave dataset using the ordinary KDE method.
By examining the calculation results in Figure 3 we can find that the mode of the ordinary KDE probability density distribution almost coincides with that of the histogram of the measured ocean wave dataset. In order to investigate the performances of the ordinary KDE method for fitting the probability density distribution tails, the aforesaid zoom-in plot in Figure 4 was once again utilized. This time, by examining the calculation results in Figure 4 we can find that in the tail region the ordinary KDE distribution curve is zigzagged. These calculation results clearly demonstrate that the ordinary KDE method is also a poor choice for fitting the
Realizing that accurate results of the distribution tails cannot be predicted by using the ordinary KDE method, Abramson's adaptive KDE method had subsequently been used in this study in order to obtain better results for the probability density values at the tail region. The corresponding calculation results have been obtained by running a MATLAB program and summarized in Figures 5 and 6. By examining the calculation results in Figure 5 we can find that the mode of Abramson's adaptive KDE probability density distribution (the green curve) almost coincides with that of the histogram of the measured ocean wave dataset. In order to investigate the performances of Abramson's adaptive KDE method for fitting the probability density distribution tails, the zoom-in plot in Figure 6 was utilized. This time, by examining the calculation results in Figure 6 we can find that in the tail region Abramson's adaptive KDE distribution curve becomes very smooth and fits well with the histogram of the measured ocean wave dataset. However, it had been very computationally expensive (costing more than 2128 s) to run the MATLAB program to obtain the green curve in Figure 5 on a Dell Precision 5820 high-performance tower desktop workstation. This clearly indicates that Abramson's adaptive KDE method is not a good choice when being used for some time-constrained real-world practical engineering projects. With the expectation of further improving the computational accuracy and efficiency, we have resorted to our proposed new adaptive KDE method formulated on the theory of linear diffusion processes to predict the
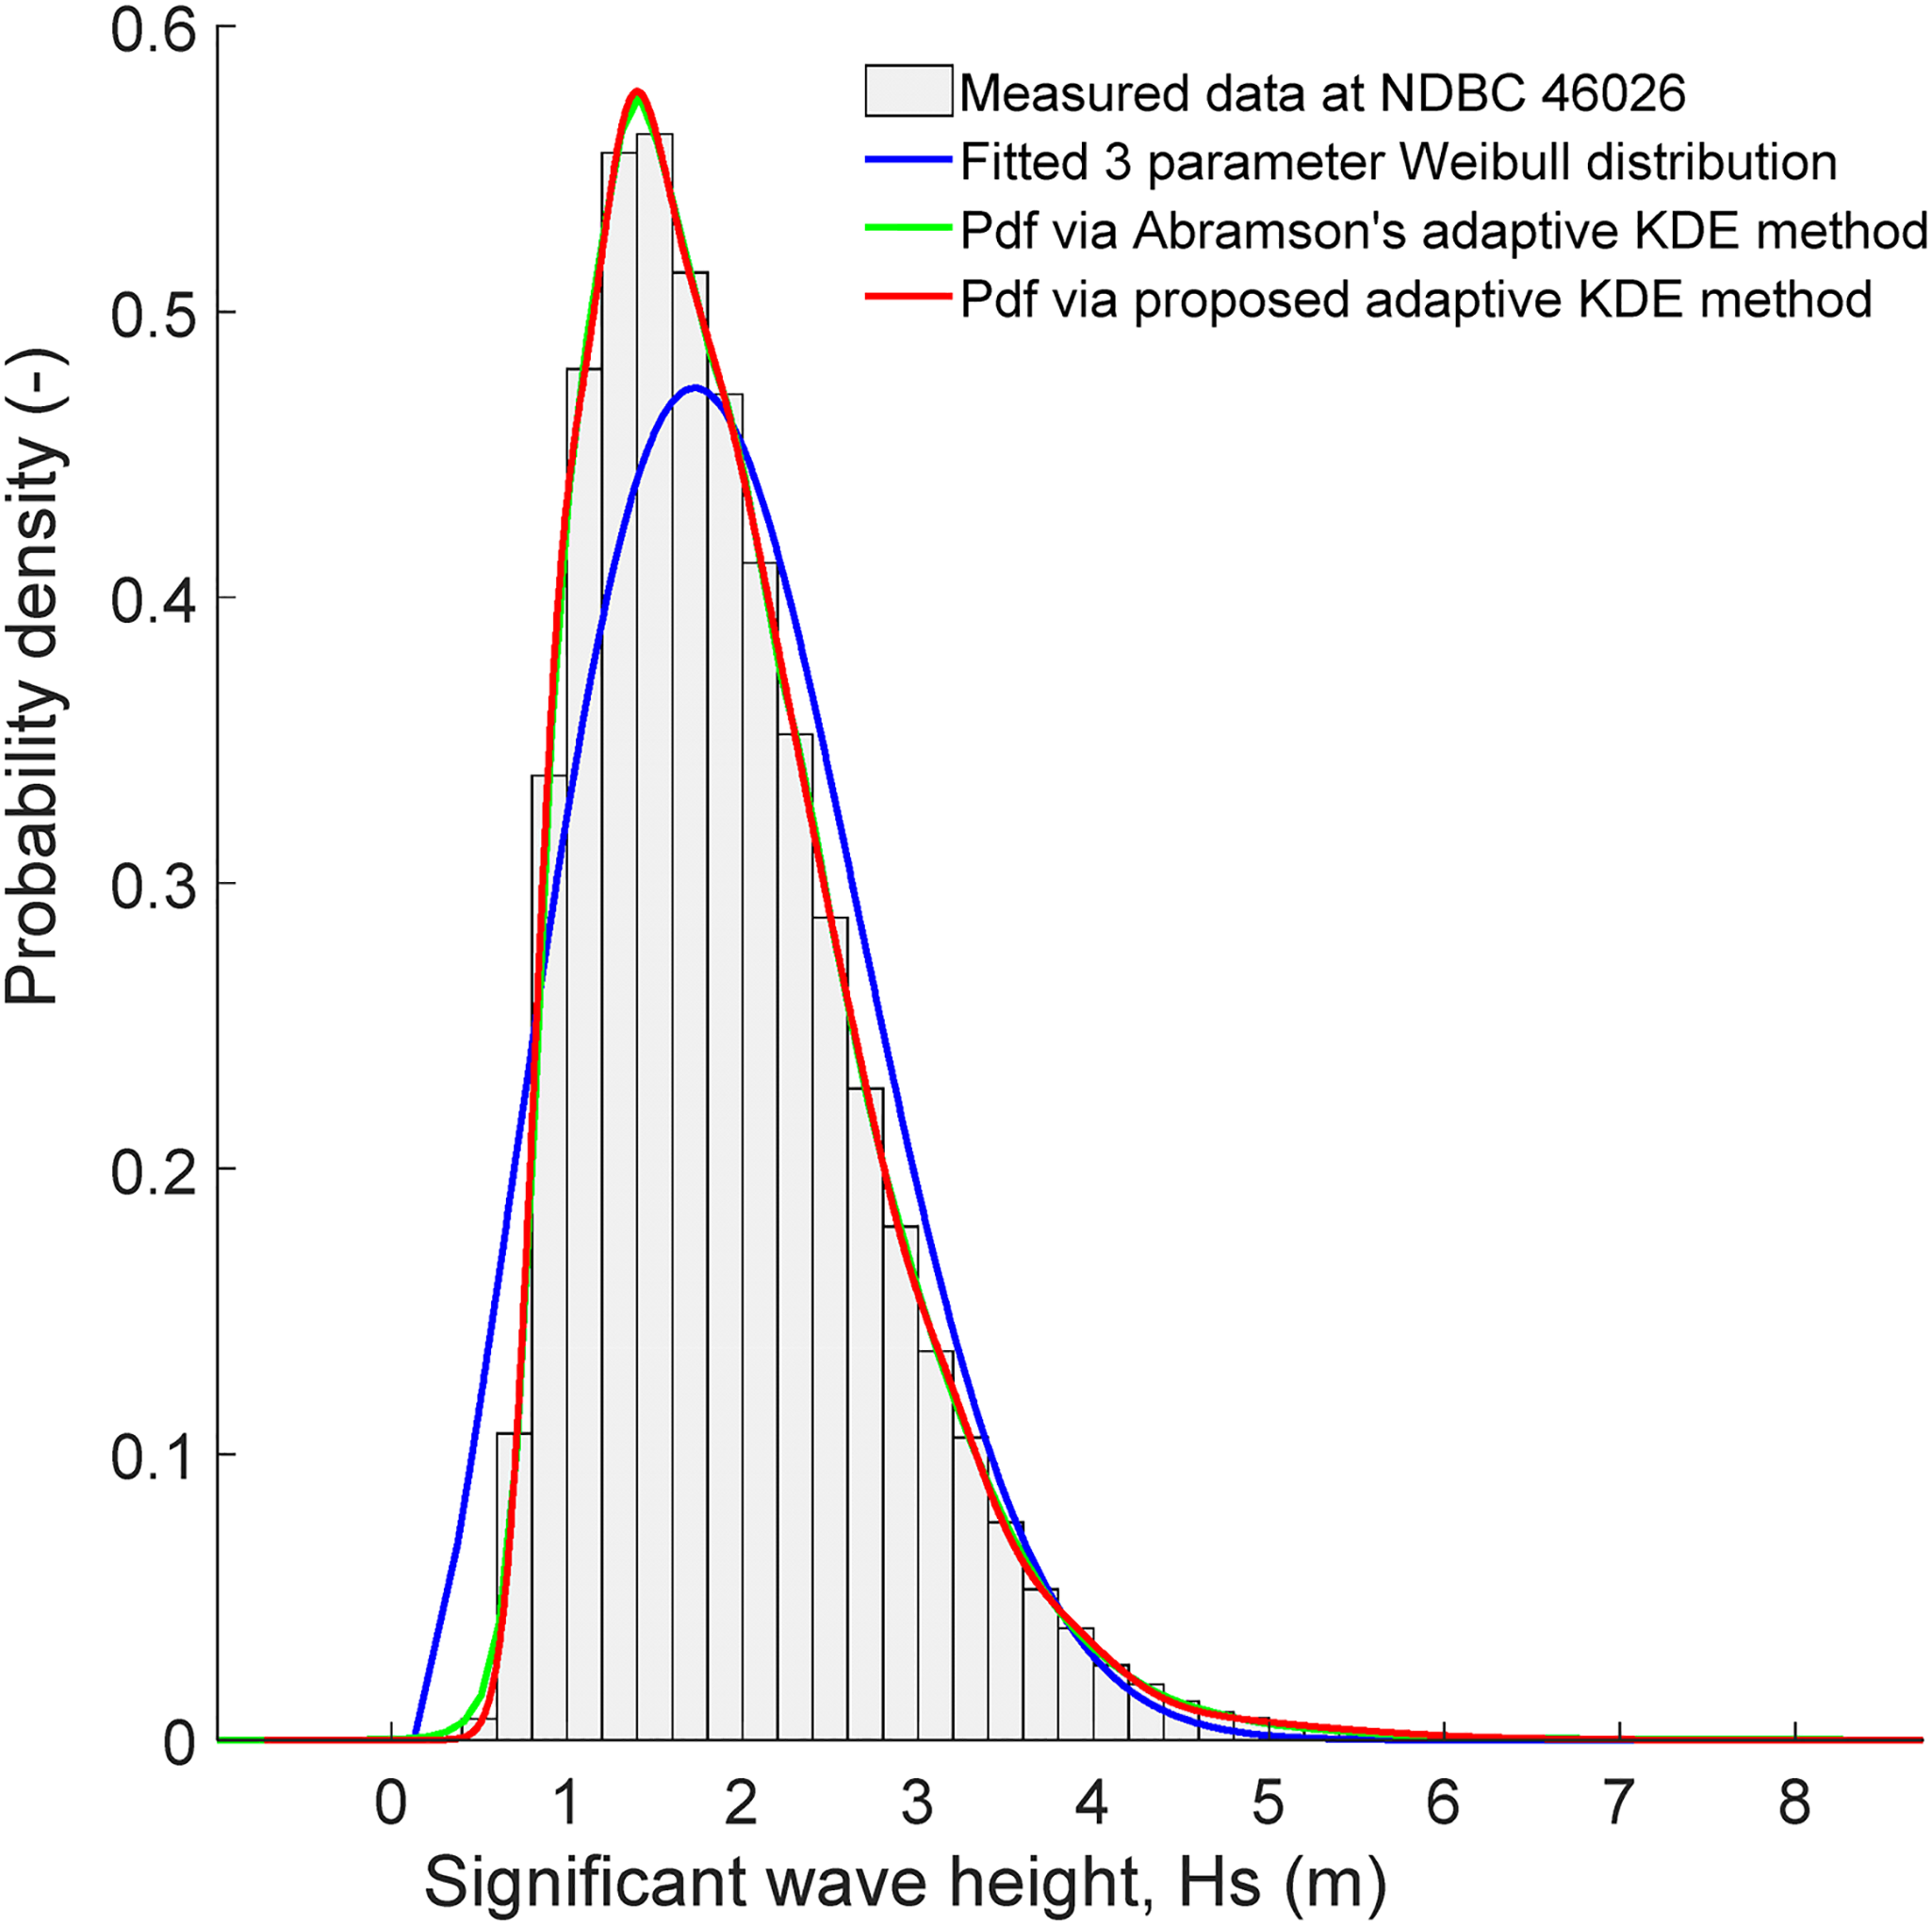
Model fit between the measured data at US National Data Buoy Cente (NDBC) 46026 and the three considered models respectively.
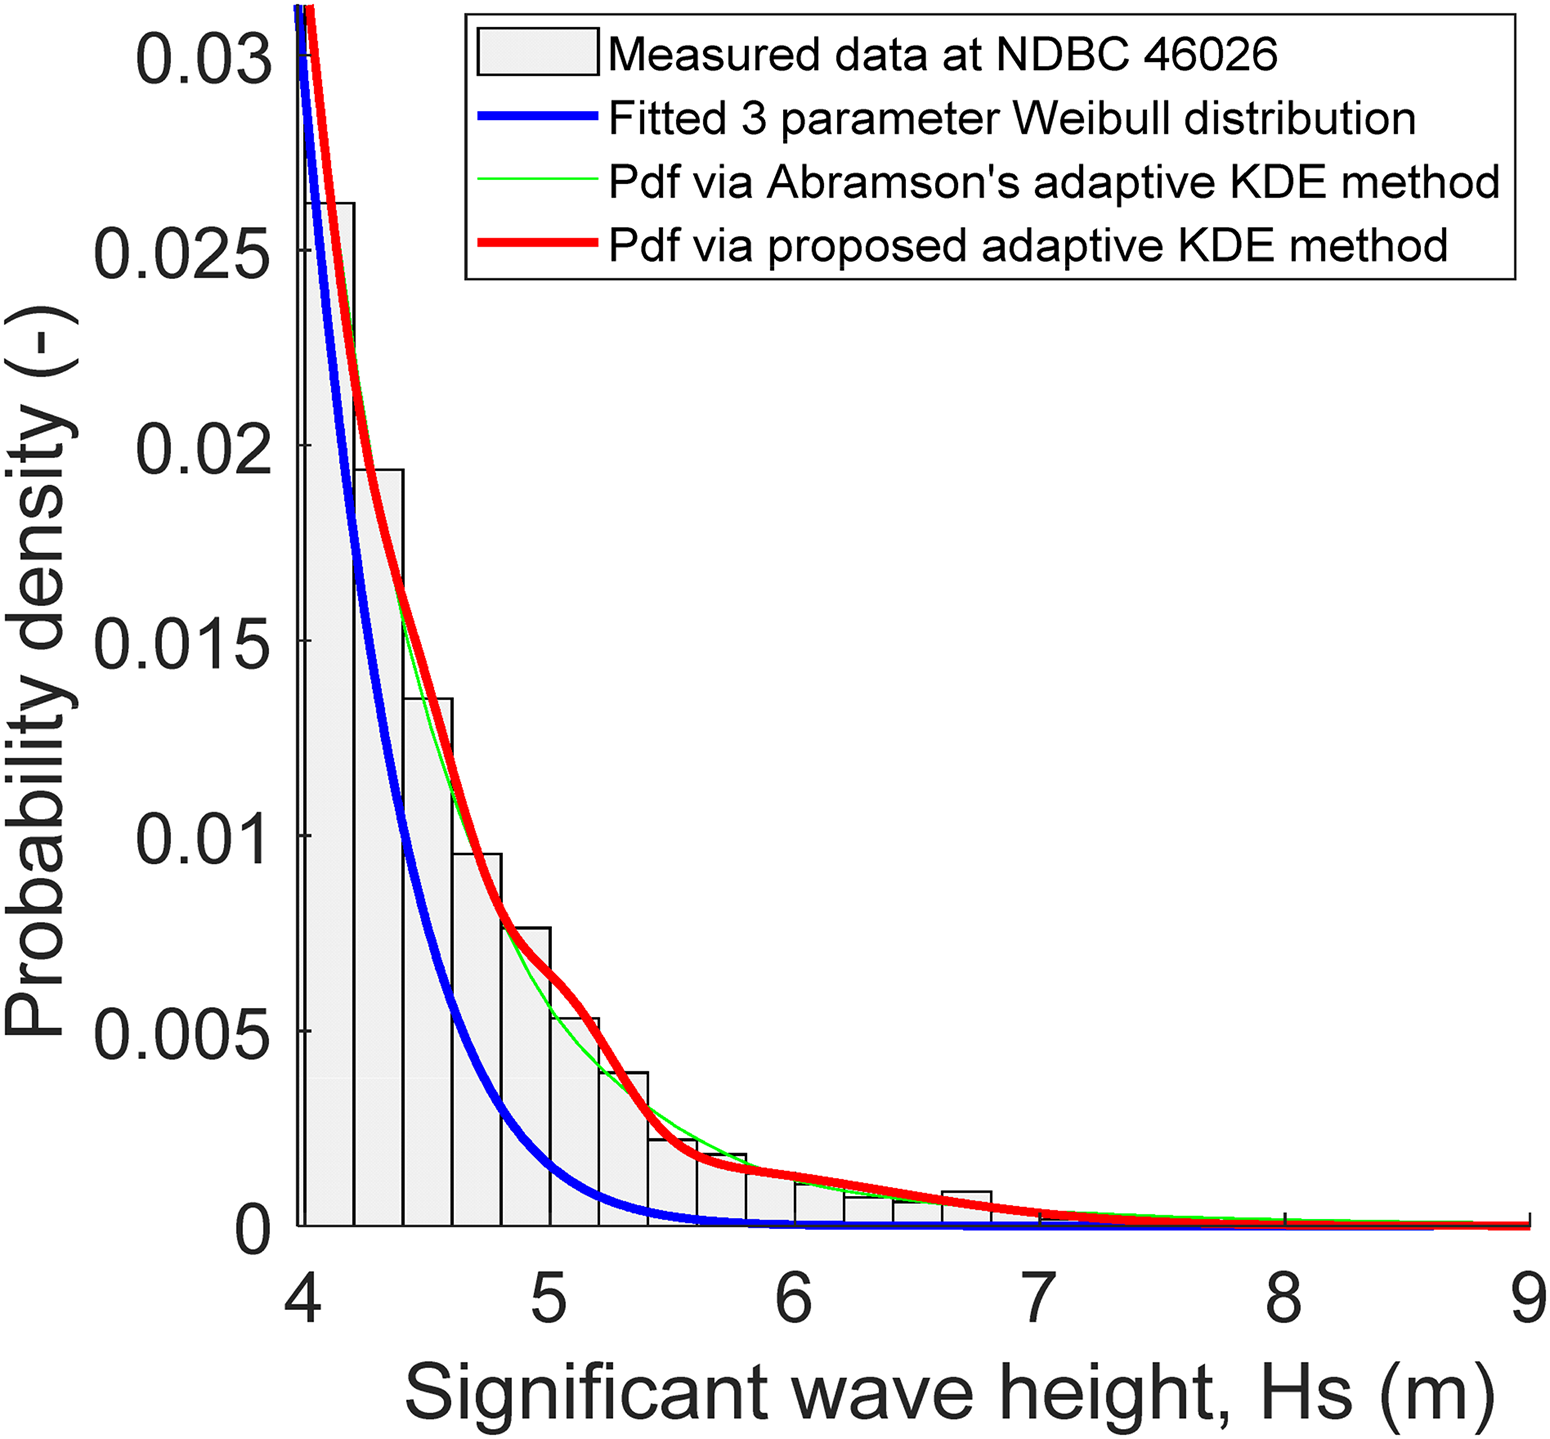
Model fit at the tail region between the measured data at US National Data Buoy Cente (NDBC) 46026 and the three considered models respectively.
By examining the calculation results in Figure 5 we can find that the mode of our proposed new adaptive KDE probability density distribution (the red curve) almost coincides with that of the histogram of the measured ocean wave dataset. In order to investigate the performances of our proposed new adaptive KDE method for fitting the probability density distribution tails, the zoom-in plot in Figure 6 was utilized. This time, by examining the calculation results in Figure 6 we can find that in the tail region, our proposed new adaptive KDE distribution curve becomes very smooth and fits quite well with the histogram of the measured ocean wave dataset. If we take a closer look at the zoom-in plot in Figure 6, we can also find that the red curve also fits the histogram of the measured ocean wave dataset slightly better than the green distribution curve. Furthermore, it had been very computationally efficient (costing only about 40 s) to run the MATLAB program to obtain the red curve in Figure 5 on the same Dell Precision 5820 high-performance tower desktop workstation mentioned before. Comparing to Abramson's adaptive KDE method, our proposed new adaptive KDE method is about 53 times faster, indicating it is a better choice to capture the sea state parameter distribution tails when being utilized in some time-constrained real-world practical engineering projects.
Up until the present, we have graphically proven the accuracy and effectiveness of our proposed new adaptive KDE method based on linear diffusion processes. Despite the clarity about the accuracy and efficiency of this new method graphically, we continue to prove the accuracy of this new method by using goodness of fit tests such as the Crámer-von Mises statistic. The Crámer-von Mises statistic could be used to assess and compare the fits. In statistics, the Crámer-von Mises is a criterion used for judging the goodness of fit of a cumulative distribution function


Calculation examples regarding the 50-year environmental contour lines
In this section, we present the computational results for the 50-year environmental contour lines based on the measured ocean wave data at NDBC 46026.
There are 210240 red “dots” in Figure 7, and each red dot represents a measured
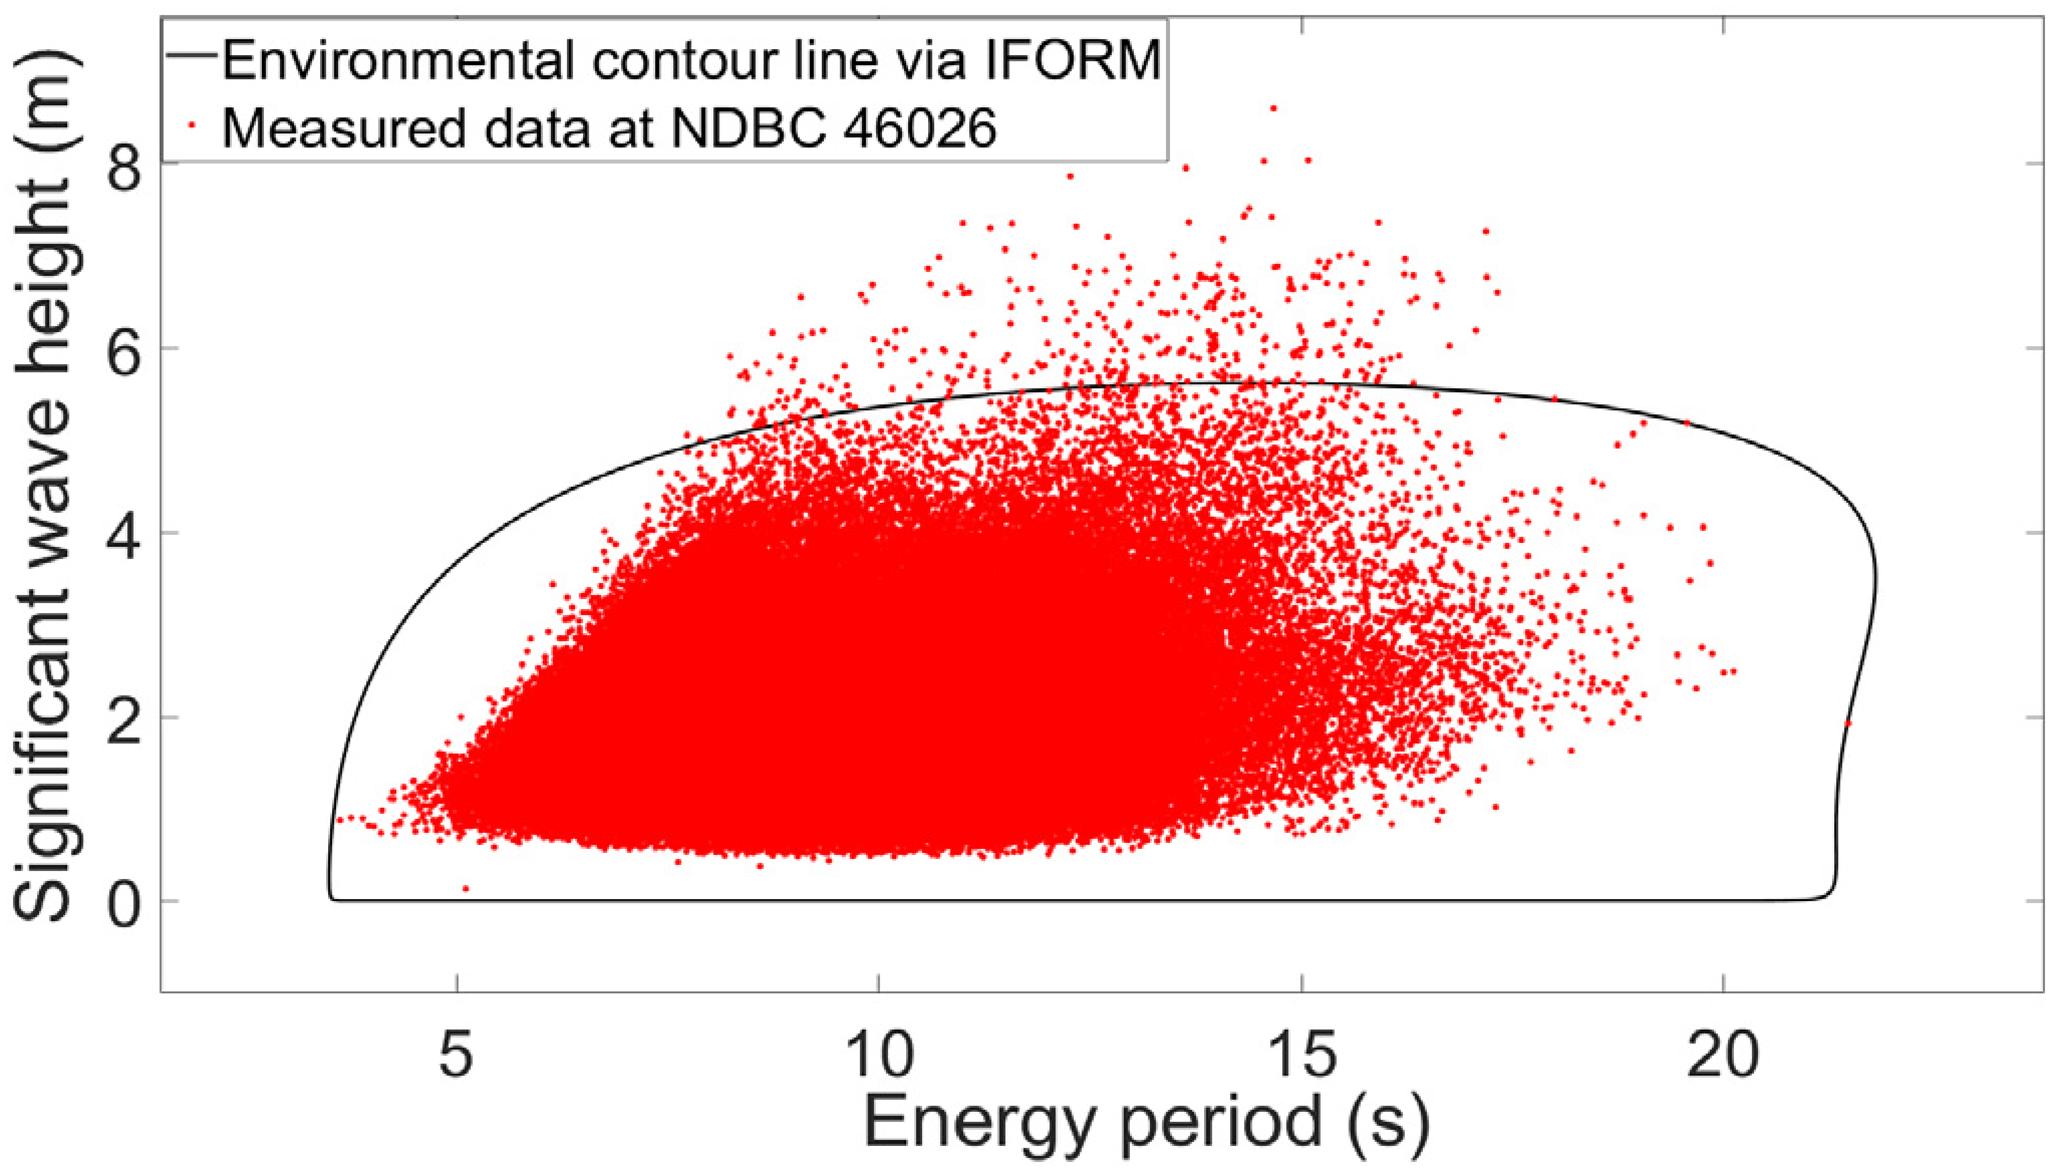
The 50-year environmental contour line created by the traditional IFORM method for NDBC 46026.
Common sense would be that a 50-year environmental contour should contain most of the measured 26-year wave data at the NDBC station 46026 mentioned previously. However, the black Rosenblatt-IFORM environmental contour line is unexpectedly exceeded by a large quantity of measured data points having high
Similarly, there are 210240 red “dots” in Figure 8, and each red dot represents a measured
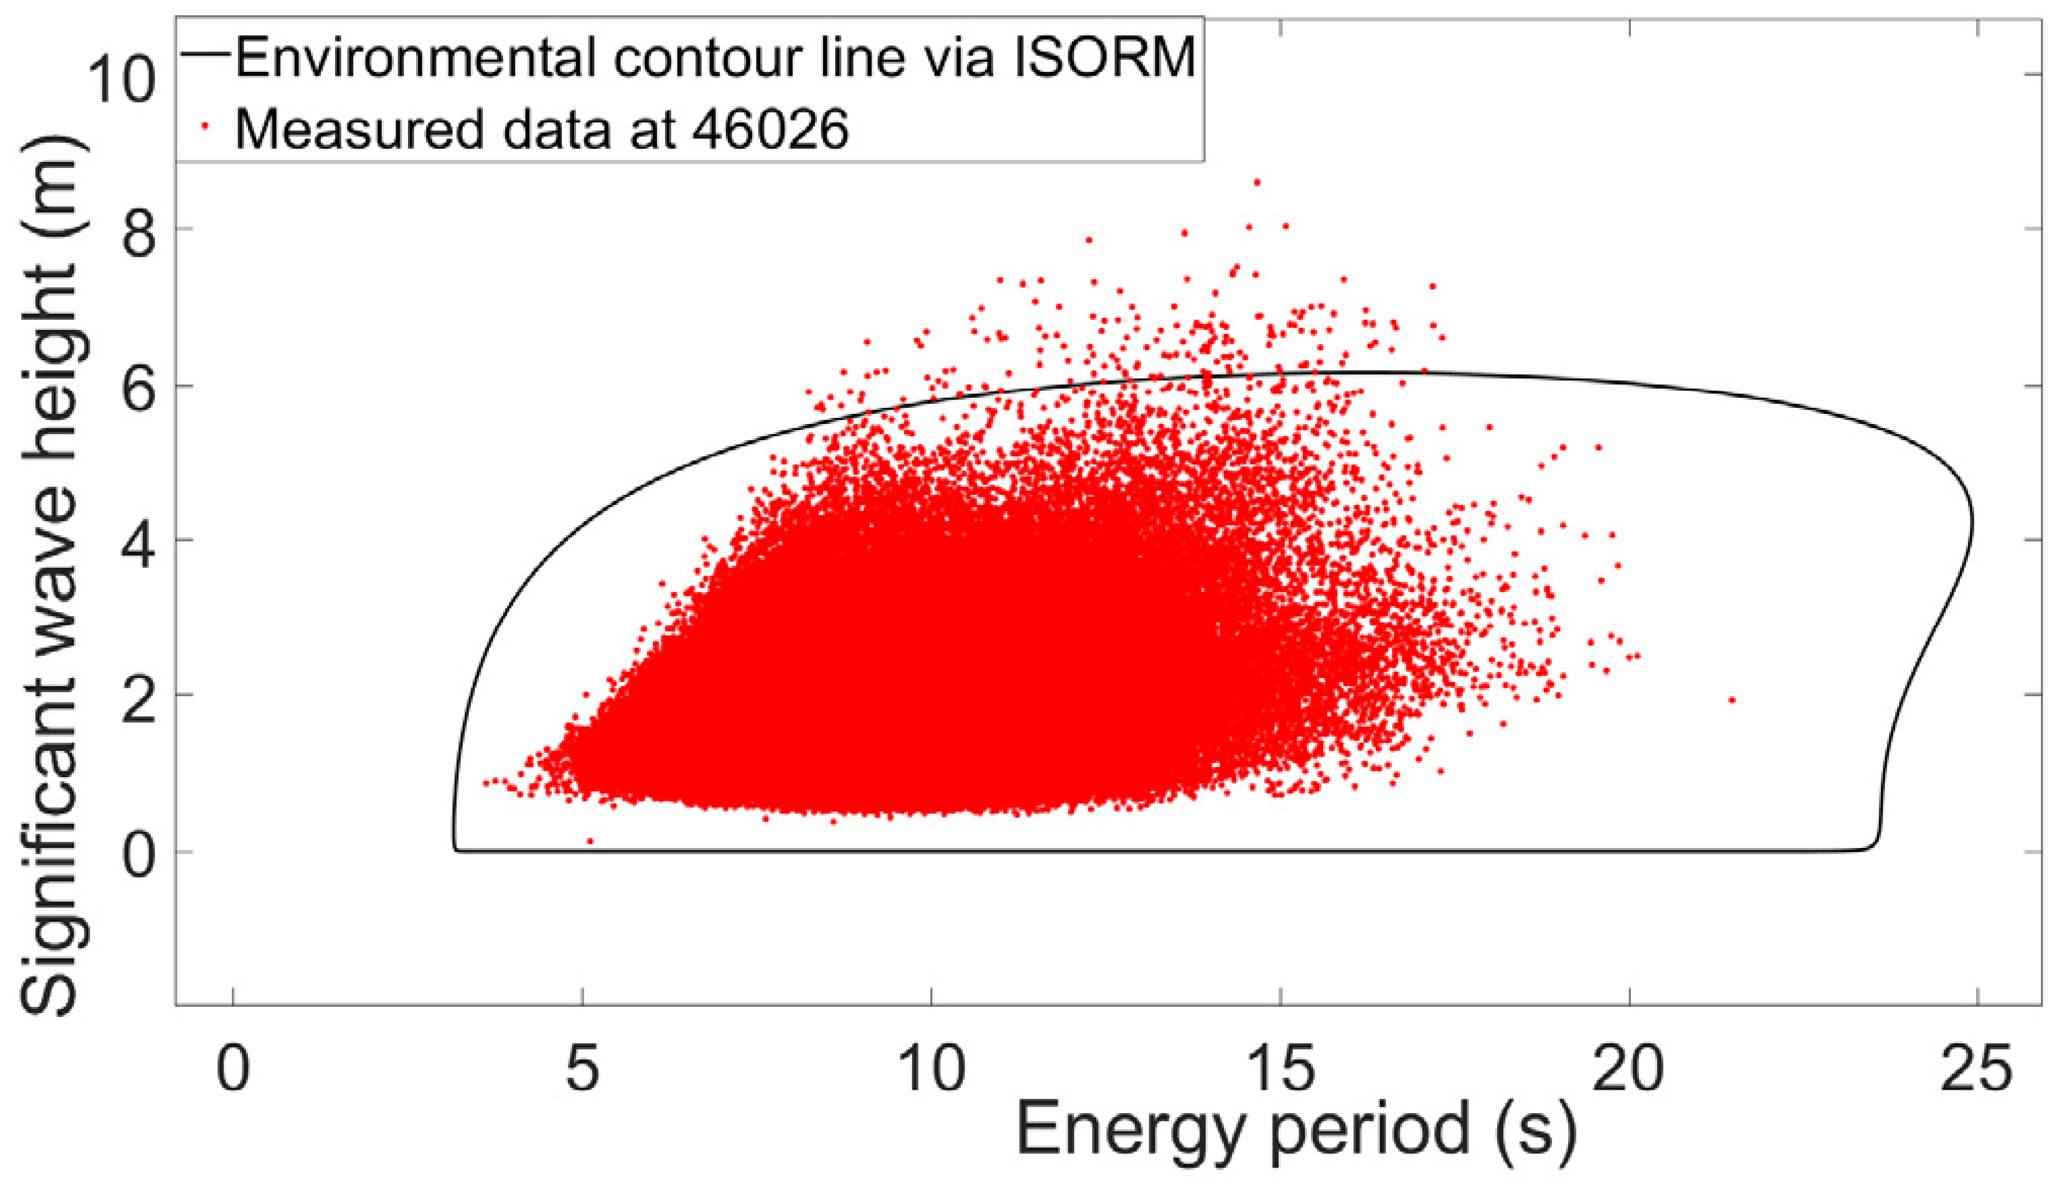
The 50-year environmental contour line created by the traditional ISORM method for NDBC 46026.
Realizing that accurate results of the environmental contour lines cannot be predicted by using the Rosenblatt-IFORM method and the Rosenblatt-ISORM method based on fitted parametric distributions, our proposed new adaptive KDE method had subsequently been resorted to in this study in order to obtain better results for the 50-year environmental contour lines. The corresponding calculation results have been obtained by running a MATLAB program and presented in Figure 9 as the blue environmental contour line.
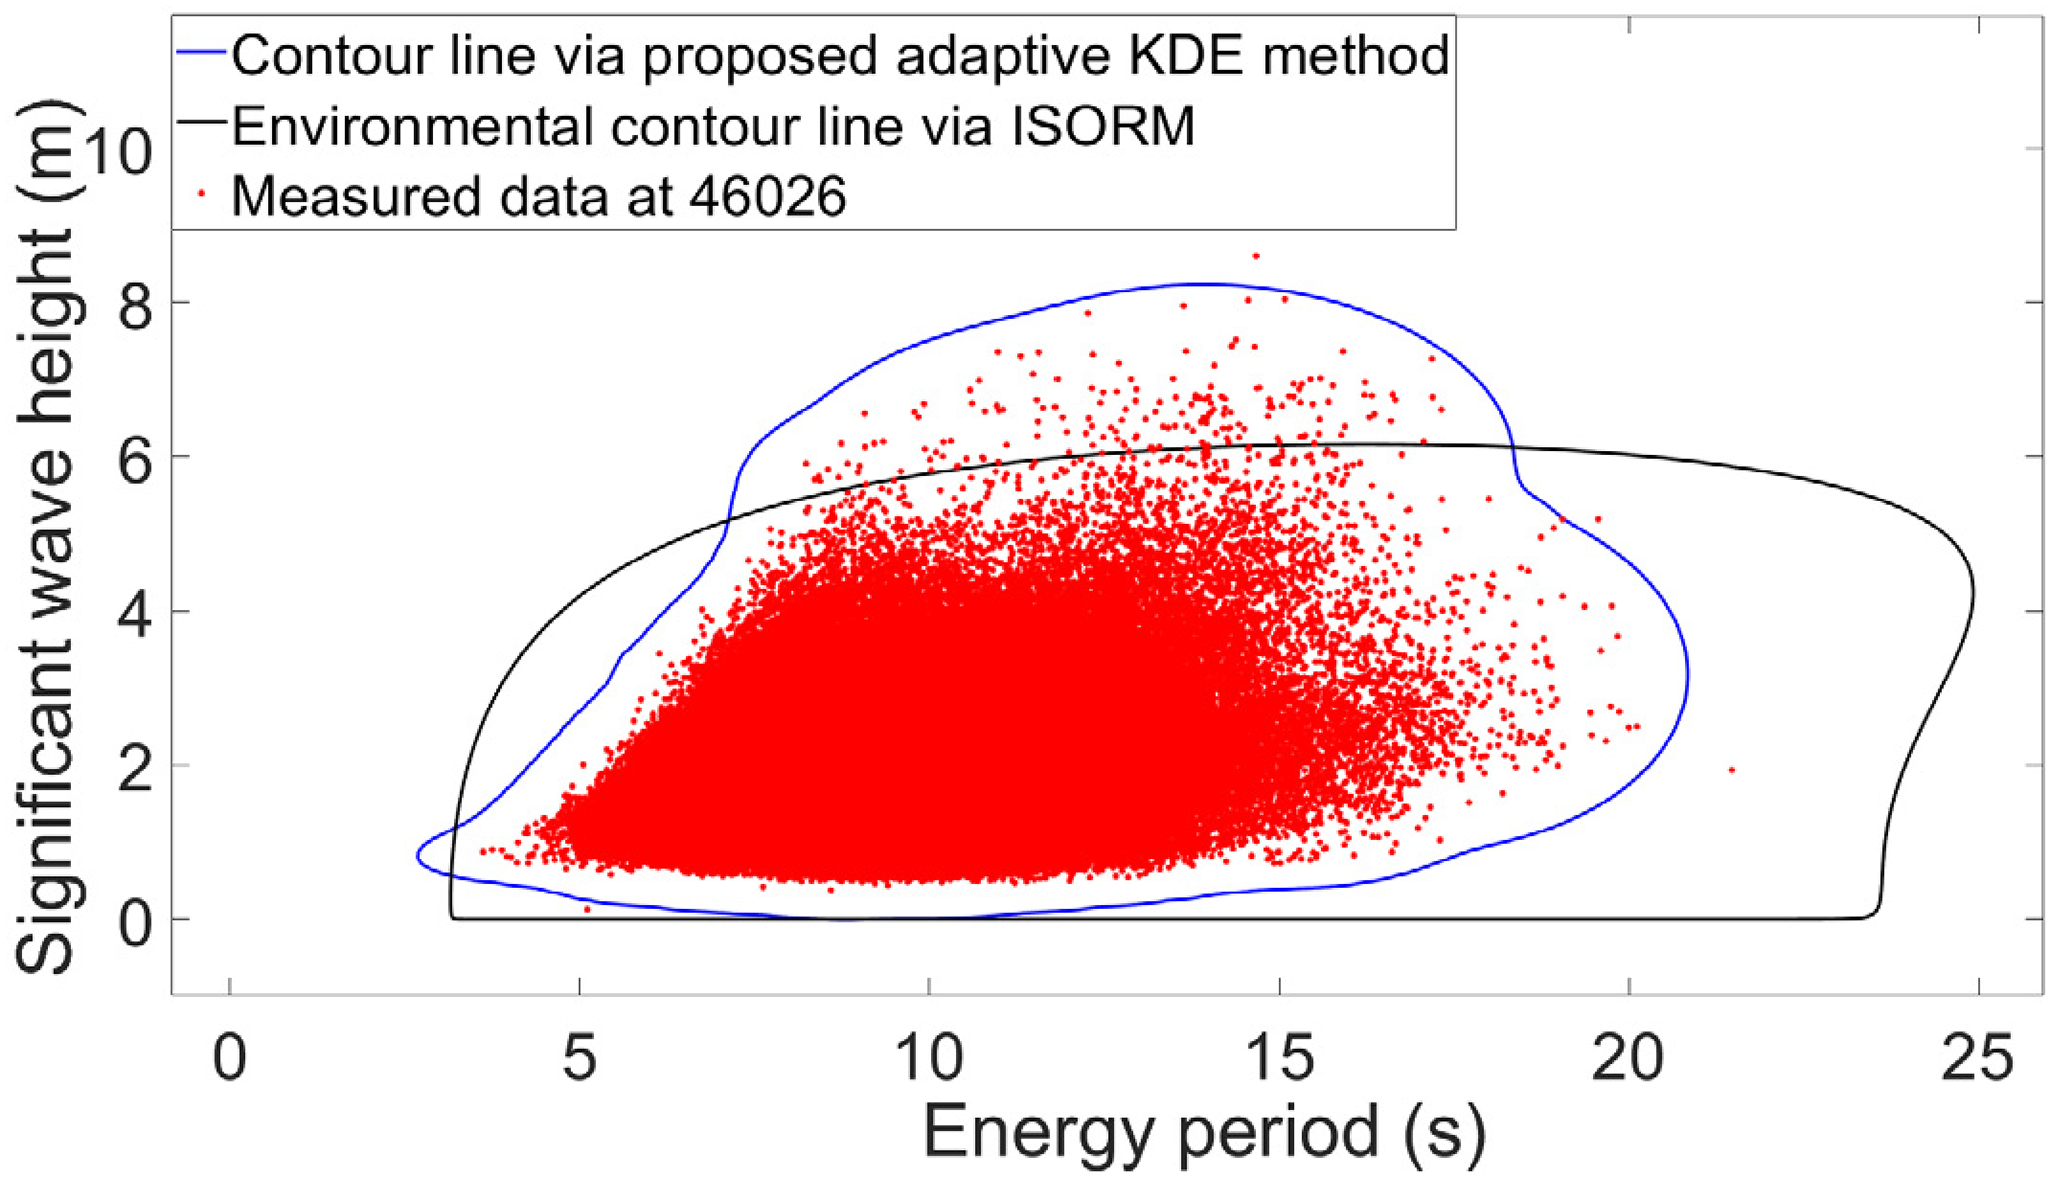
50-year extreme sea state contours created by the traditional method and the proposed new method presented in this paper for US National Data Buoy Center (NDBC) 46026.
We recall that in Figures 5 and 6 we have already shown that our proposed new adaptive KDE method formulated on the theory of linear diffusion processes can forecast well the
This indicates that the blue environmental contour directly derived based on our proposed new adaptive KDE method formulated on the theory of linear diffusion processes would be superior to the black Rosenblatt-ISORM contour Rosenblatt-ISORM and lead to the design of safe and reliable offshore sustainable energy systems.
The extreme dynamic responses of a specific offshore sustainable energy system
The selected offshore sustainable energy system
A specific offshore sustainable energy system (a two-body floating point absorber WEC) was chosen in this study. We have created the WEC simulation model using the open-source software WEC-Sim (https://wec-sim.github.io/WEC-Sim/master/introduction/overview.html) and have shown the picture of this model in Figure 10. WEC-Sim (WEC-Sim) is an open-source software for simulating WECs. It is developed in MATLAB/SIMULINK using the multi-body dynamics solver Simscape Multibody. WEC-Sim has the ability to model devices that are comprised of hydrodynamic bodies, joints, and constraints, power take-of systems, and mooring systems. Simulations are performed in the time domain by solving the governing WEC equations of motion in the six rigid Cartesian degrees-of-freedom.
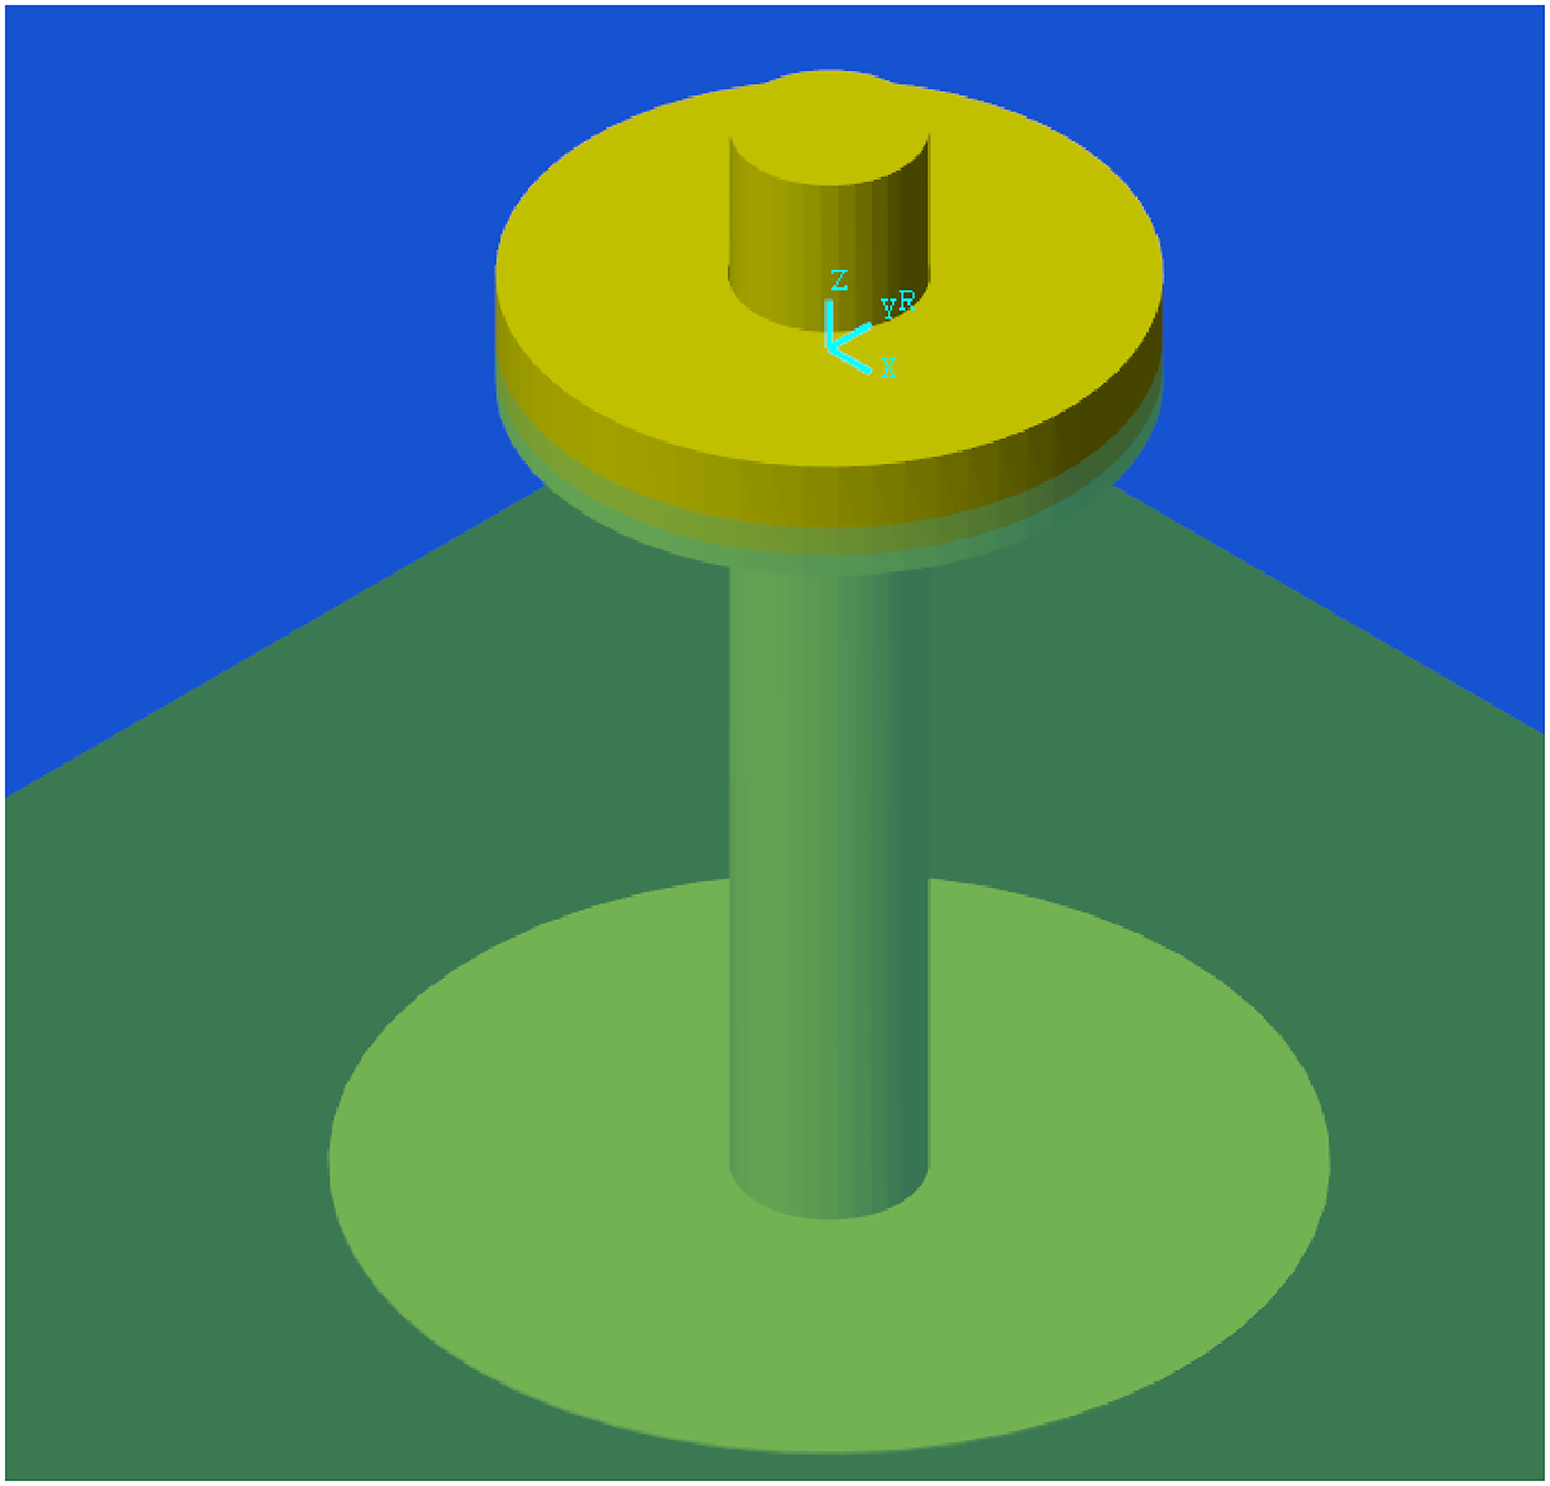
The WEC-Sim simulation model of the selected WEC.
This specific offshore sustainable energy system contains a spar possessing a diameter of 6 m and a float having a diameter of 20 m. The spar has been designed with a height of 38 m and a mass of 878.3 t. The float has been designed with a thickness of 5 m and a mass of 727.01 t. This specific offshore sustainable energy system is installed at an ocean site with a draft of 82 m. WEC-Sim dynamic simulations have been executed so that we could forecast the 50-year extreme PTO heaving forces of this floating WEC in six chosen fully developed sea states characterized with a Pierson-Moskowitz ocean wave spectrum. Six
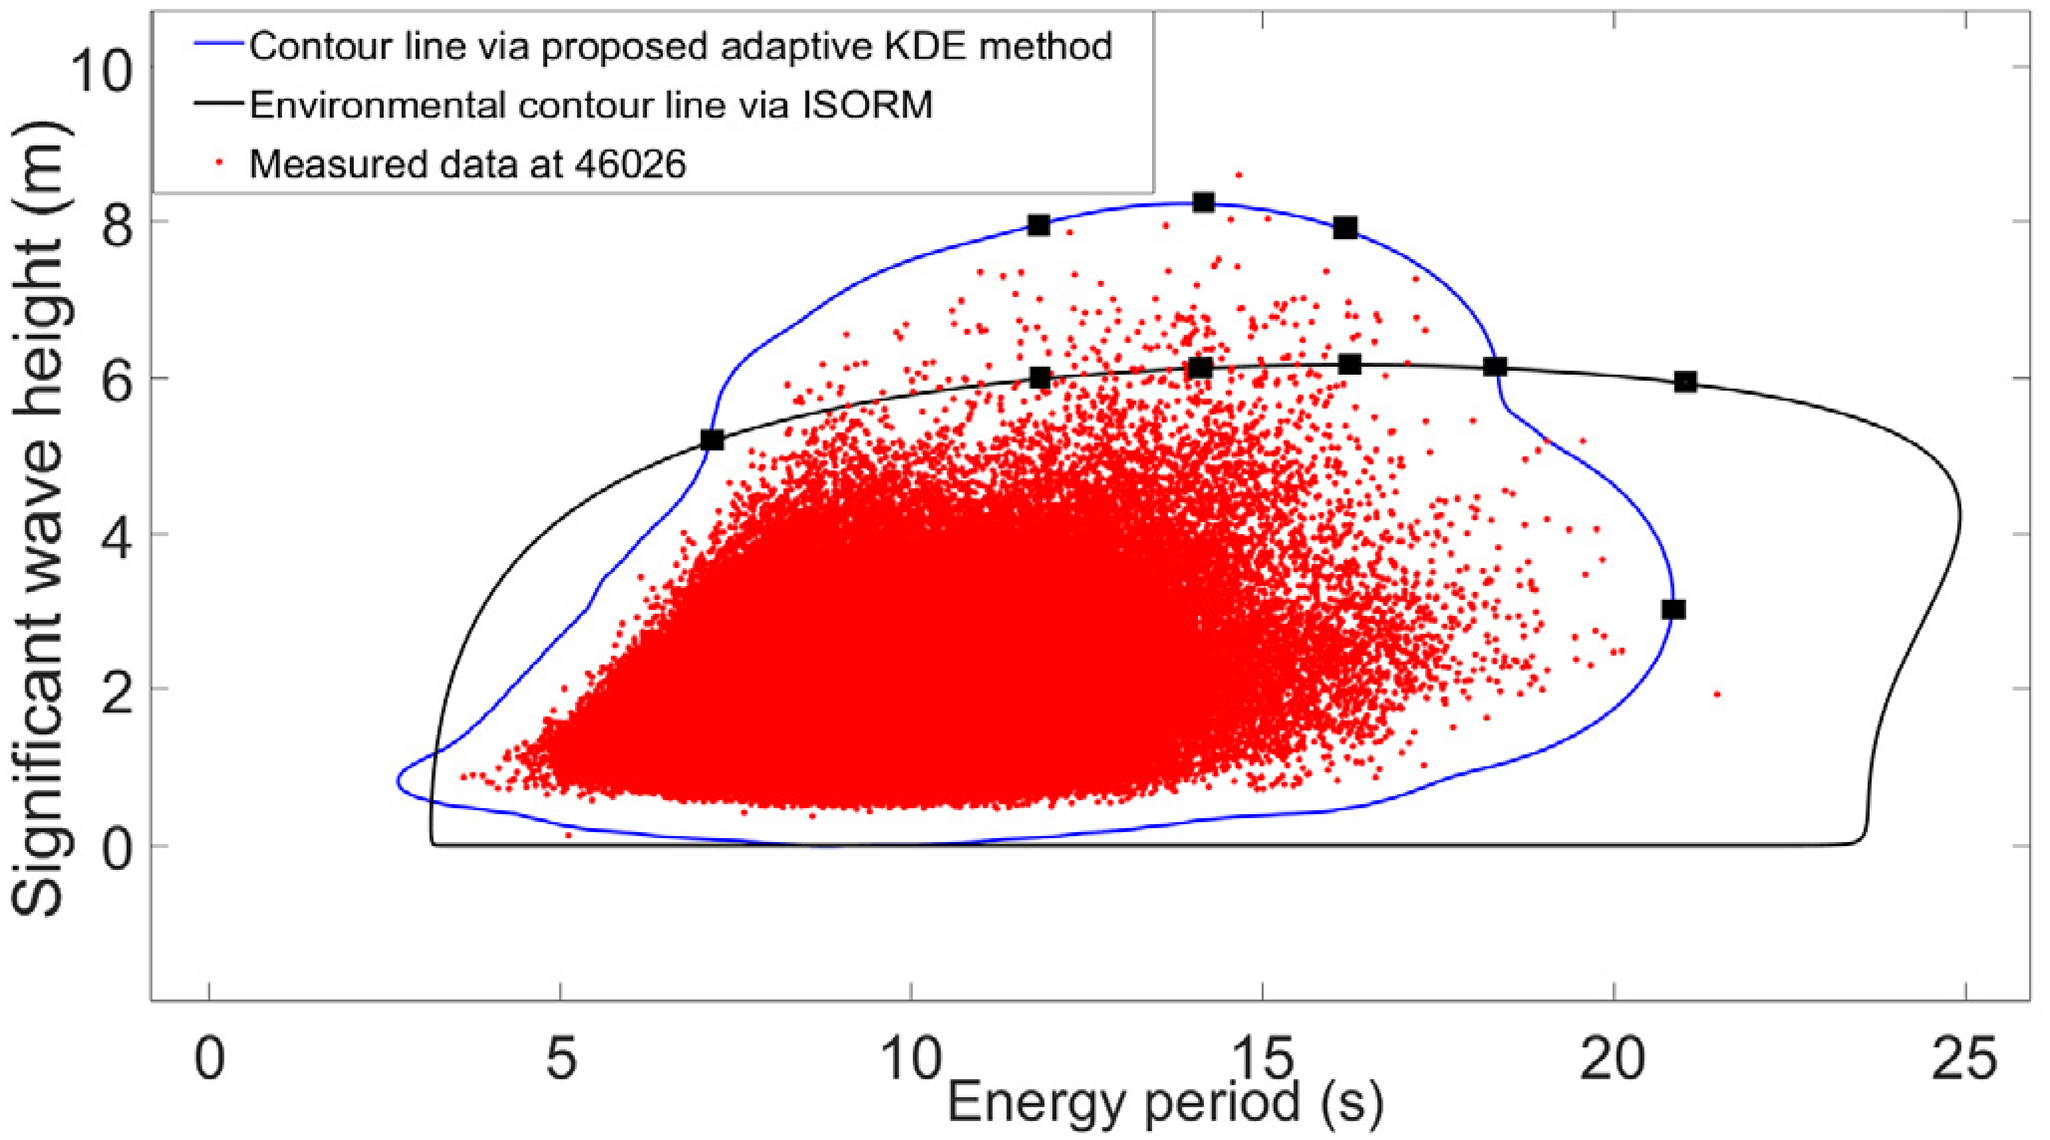
50-year extreme sea state contours created by the traditional method and the proposed new method presented in this paper for US National Data Buoy Center (NDBC) 46026.
Values of significant wave heights from each contour line method as shown in Figure 11.
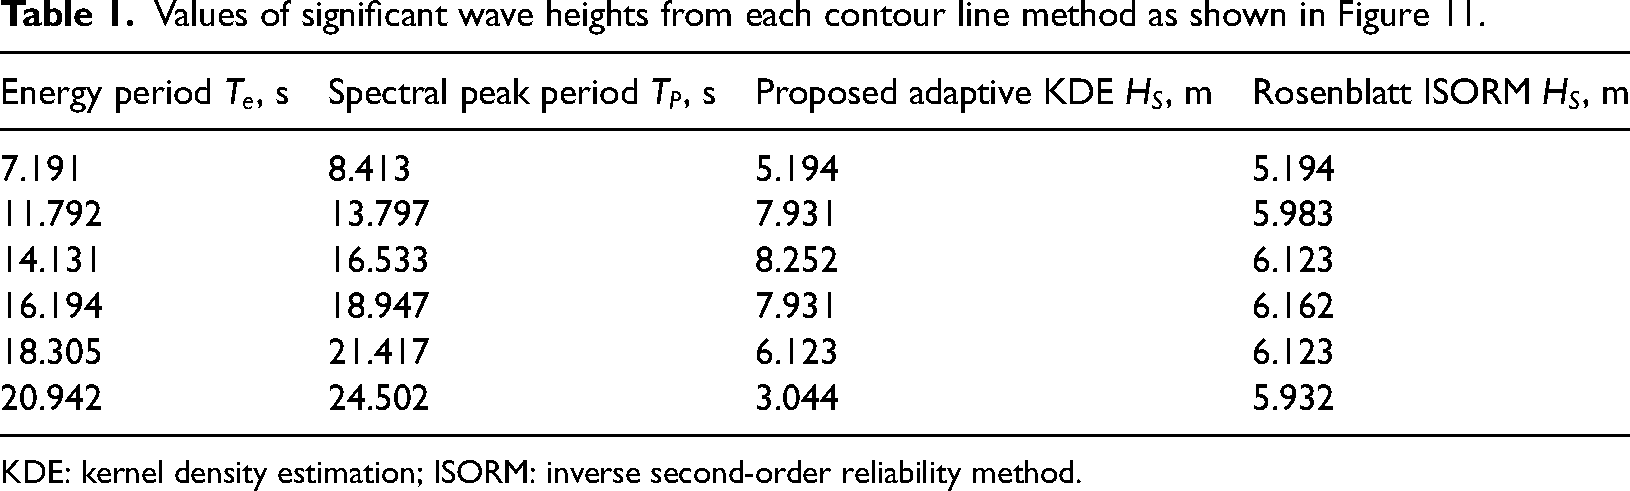
KDE: kernel density estimation; ISORM: inverse second-order reliability method.
These selected fully developed sea states characterized by different Pierson-Moskowitz ocean wave spectra were inputted to the WEC-Sim time-domain simulations for obtaining the WEC dynamic responses based on the theories specified in the “Theories for the dynamic analysis of an offshore sustainable energy system” section. A specific type of dynamic responses, i. e., the 3-h time series of the Power-Take-Off heaving forces have been acquired. These PTO heaving forces are critical for designing the floating WEC. A most probable maximum value corresponding to each 3-h time series of the Power-Take-Off heaving forces was then calculated utilizing the theories elucidated in Edwards and Coe (2019). Repeating this procedure for all the above-mentioned 6
Most probable maximum PTO force values based on the two contour methods.
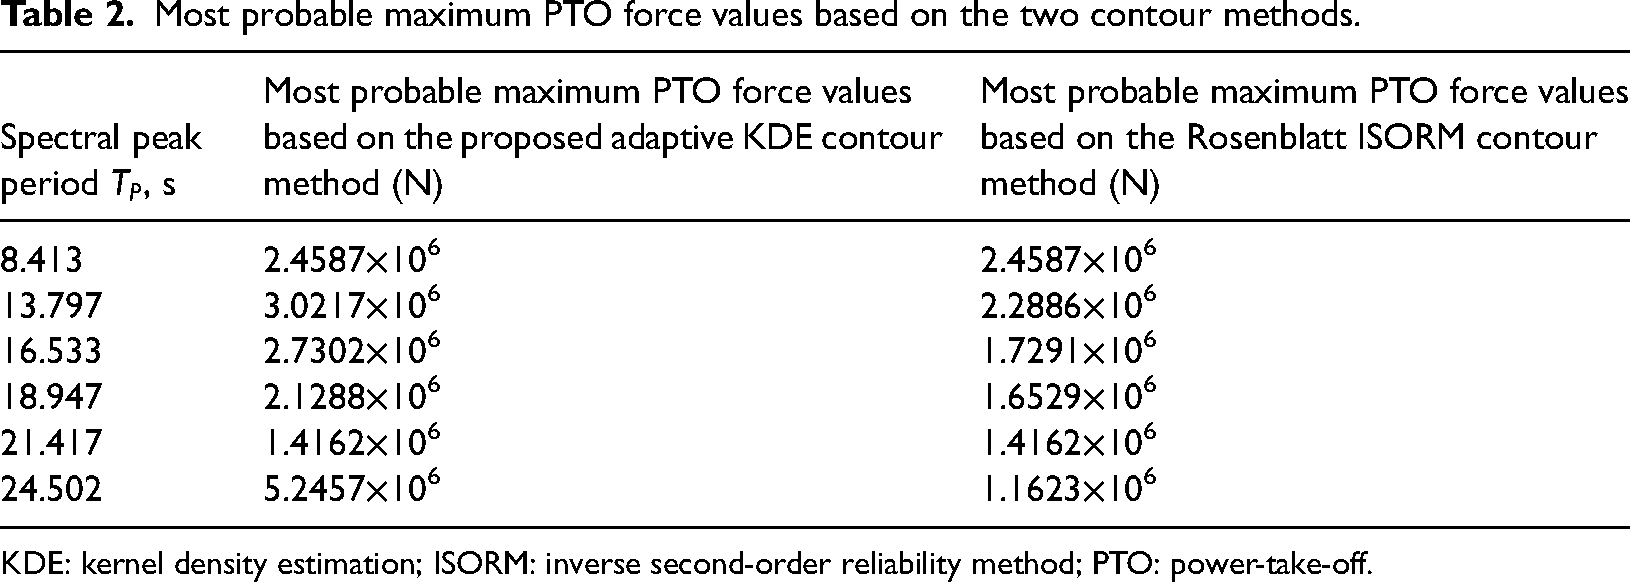
KDE: kernel density estimation; ISORM: inverse second-order reliability method; PTO: power-take-off.
Conclusions
In the present research, we have proposed a new adaptive KDE method formulated on the theory of linear diffusion processes. By examining the calculation results we have found that in the tail region, our proposed new adaptive KDE distribution curve becomes very smooth and fits quite well with the histogram of the measured ocean wave dataset at the NDBC station 46026. Carefully studying the calculation results also reveals that the 50-year extreme power-take-off heaving force value forecasted based on the environmental contour derived using the new method is 3021700N, which is much larger than the value 2458700N forecasted via the Rosenblatt-ISORM contour method. Consequently, our proposed new adaptive KDE method formulated on the theory of linear diffusion processes can forecast well and efficiently forecast the 50-year extreme design force values for offshore sustainable energy systems in renewable energy devices development.
Footnotes
Declaration of conflicting interests
The author declared no potential conflicts of interest with respect to the research, authorship, and/or publication of this article.
Funding
The author disclosed receipt of the following financial support for the research, authorship, and/or publication of this article: This work was supported by the National Natural Science Foundation of China (grant number 51979165).