
Abstract
Water inrush from coal floor is a gradual process from generation, and development to disaster. In this process, the geophysical information received by the rock mass will show measurable characteristics of the sudden, and the occurrence of water inrush is the inevitable reflection of various characteristics of the sudden in the limit state. In order to study the early warning information before water inrush in working face, based on the fluid-solid coupling theory, similar simulation test and FLAC3D simulation were used to reproduce the water inrush process of the floor fracture structure, to clarify the difference of response characteristics of each physical quantity before and after water inrush, and to calculate the weight value of different physical quantities in the water inrush process combined with entropy method. The results show that when the working face is gradually approaching the penetrating fault, the stress at the water inrush position of the floor rock layer decreases sharply, and the step jump change occurs after reaching the minimum peak value. The water flow shows a stable increase–sudden increase process. Water inrush through fault location water flow presents increasing—stability—the changing process of surge, water pressure appears cliff-like drop. In the sub-emergent stage when water inrush is about to occur in the working face, the variation range of stress and water pressure at the position of water inrush is more intense. The increase rate of stress at the position of water inrush in the floor rock layer increases sharply and reaches the peak value in a short time, while the increase rate of water pressure at the position of water inrush through the fault decreases.
Introduction
Nearly 60% of coal mines in China are affected by different degrees of confined water damage. Taking the Carboniferous—Permian coalfield in North China as an example, the Ordovician limestone aquifer is widely distributed at the bottom (Zhao and Liu, 2019; Wang, 2020; Hu et al., 2009). Because the deep coal seam is mainly mined at this stage, the thickness of the effective aquiclude between it and the underlying aquifer is relatively small (Bian and Yang, 2016; Wang and Wang, 2020). The existence of fault structure usually reduces the effective water isolation performance of rock strata and even becomes water conduction channel. According to relevant data, about 70% of water inrush accidents in the process of mine mining are caused by fracture structures (Bian et al. 2022; Zhang and Yang, 2021; Zhang et al., 2021). Therefore, how to ensure the safety of mine production threatened by floor water inrush is one of the important scientific problems to be solved urgently.
Coal seam floor water inrush warning mainly selects factors with different degrees of impact on water inrush to build an index system, combined with multivariate information statistical methods for analysis (Gai et al., 2021; Liu et al., 2019; Wang et al., 2015). In recent years, many scholars at home and abroad have established an early warning system for water inrush based on geological indicators that have an impact on floor water inrush or the change law of stope physical quantities in the process of working face mining (Wei et al., 1995; Wang et al., 2021; Shi et al., 2020). Xu et al. (2018) selected geological structure conditions and thickness of the waterproof layer as evaluation indicators and used principal component analysis to calculate the weight ratio of each indicator in the process of floor water inrush. Liu et al. (2020) selected mining depth and inclination angle of coal seam as the main influencing factors of floor water inrush and established a vulnerability index evaluation model based on the data itself by using principal component analysis and entropy method. Hu (2020) selected the indexes that have the main influence on the water inrush process of the floor, and based on the BP neural network method, the nonlinear prediction analysis of the water inrush risk was carried out. Wang (2020) selected salinity and pH value as indicators to construct a real-time early warning model of mine floor water inrush based on BP neural network method. Wang et al. (2019) summarized the change rule of microseismic information before and after water inrush based on the on-site microseismic monitoring data and combined with the actual situation of geological boreholes, comprehensively predicted the location of mine water inrush points. Ren (2016) monitored the changes in acoustic and electrical information caused by rock mass failure at different scales and combined with Logistic regression analysis method, conducted an early warning study on the occurrence of rock burst.
In the study of early warning information of water inrush, most scholars usually analyze the change rule of single physical characteristics on the basis of water inrush coefficient (Yang et al., 2017; Wu et al., 2009; Yin et al., 2021). However, due to the differences in the geological environment of different mines, single physical characteristics may not show sensitivity, and it is difficult to make an accurate prediction of floor water inrush only by relying on the theoretical study of fracture structure water inrush. Therefore, a similar material simulation test combined with FLAC3D numerical simulation method is used to accurately reproduce the process of surrounding rock failure and fault activation water inrush under mining conditions. Based on the monitoring data of stress, displacement, water flow and water pressure, the response characteristics of each physical quantity before and after water inrush are analyzed, and the effective water inrush warning information is proposed.
Simulation test of similar materials
Overview of the study area
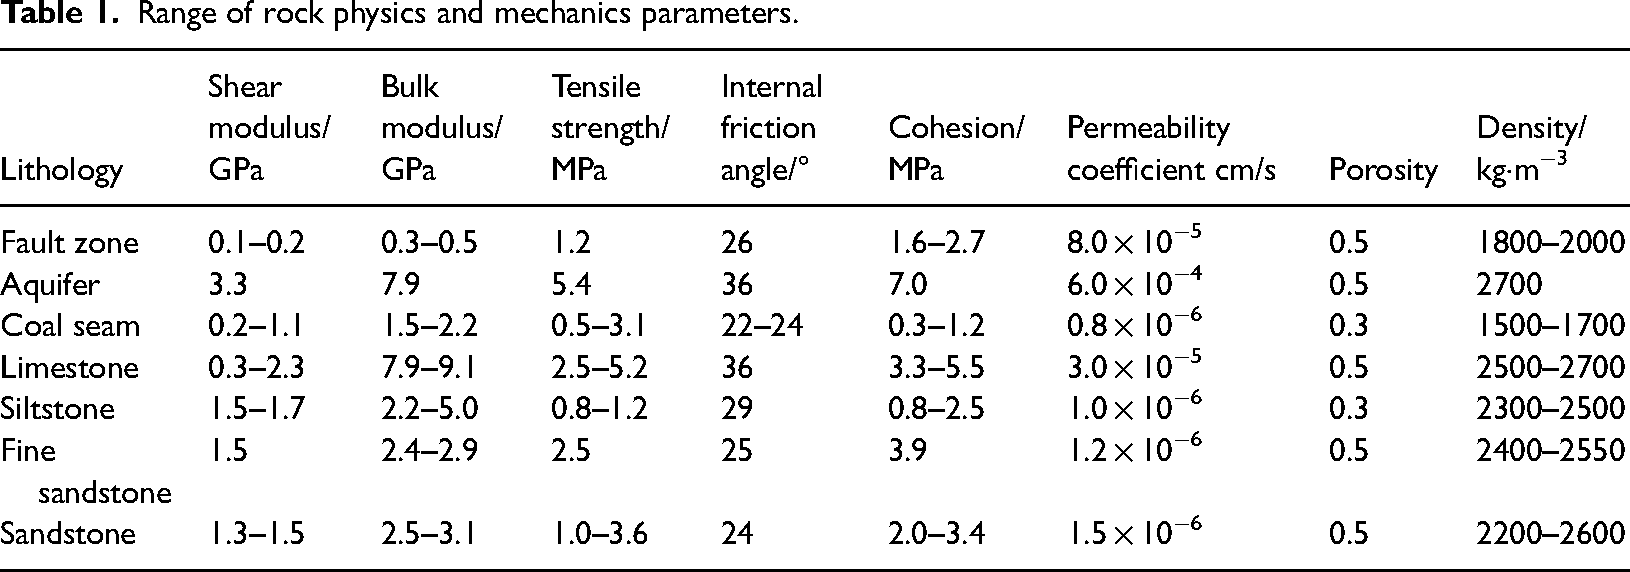
In this paper, Wutongzhuang Mine in Fengfeng Mining area is taken as the study area. According to the mine water inrush accident data, the 182201 working face has three times of floor water inrush in the process of mining, and the water inrush channels are all small faults, two from Ordovician limestone aquifer and one from Yeqing limestone aquifer. The wellhead elevation of the main shaft in Wutongzhuang mine is +196m, and the 182201 working face is located at the level of −469.2 to −511.7 m. The working face is mining 2# coal seam, and the average thickness of the coal seam is about 4.5 m, with an inclination level and no inclination angle. The water level elevation of the Ordovician ash aquifer underlying the coal seam floor is +120 m (Wang, 2014; Dong and Li, 2010). It is calculated that the average buried depth of coal seam is about 686.45 m, and the average water pressure of Ordovician ash aquifer on the floor is about 6.25 MPa. The range of physical and mechanical parameters of rock core test around the working face is shown in Table 1.
Range of rock physics and mechanics parameters.
Establishment of the model
Determination of similarity ratio: The simulation system used in this experiment is composed of test bench, hydraulic servo system, liquid constant pressure supercharger, water flow monitoring equipment and data acquisition system. The size of the test bench is 1.20 m × 0.40 m × 0.80 m (length × width × height), and the maximum load can be applied by the stress loading unit is 300 kN, which can meet the requirements of the test on the whole. According to the principle of similar simulation, combined with a similar material simulation system and the actual situation of working face, the similarity of this test is calculated: Geometric similarity ratio
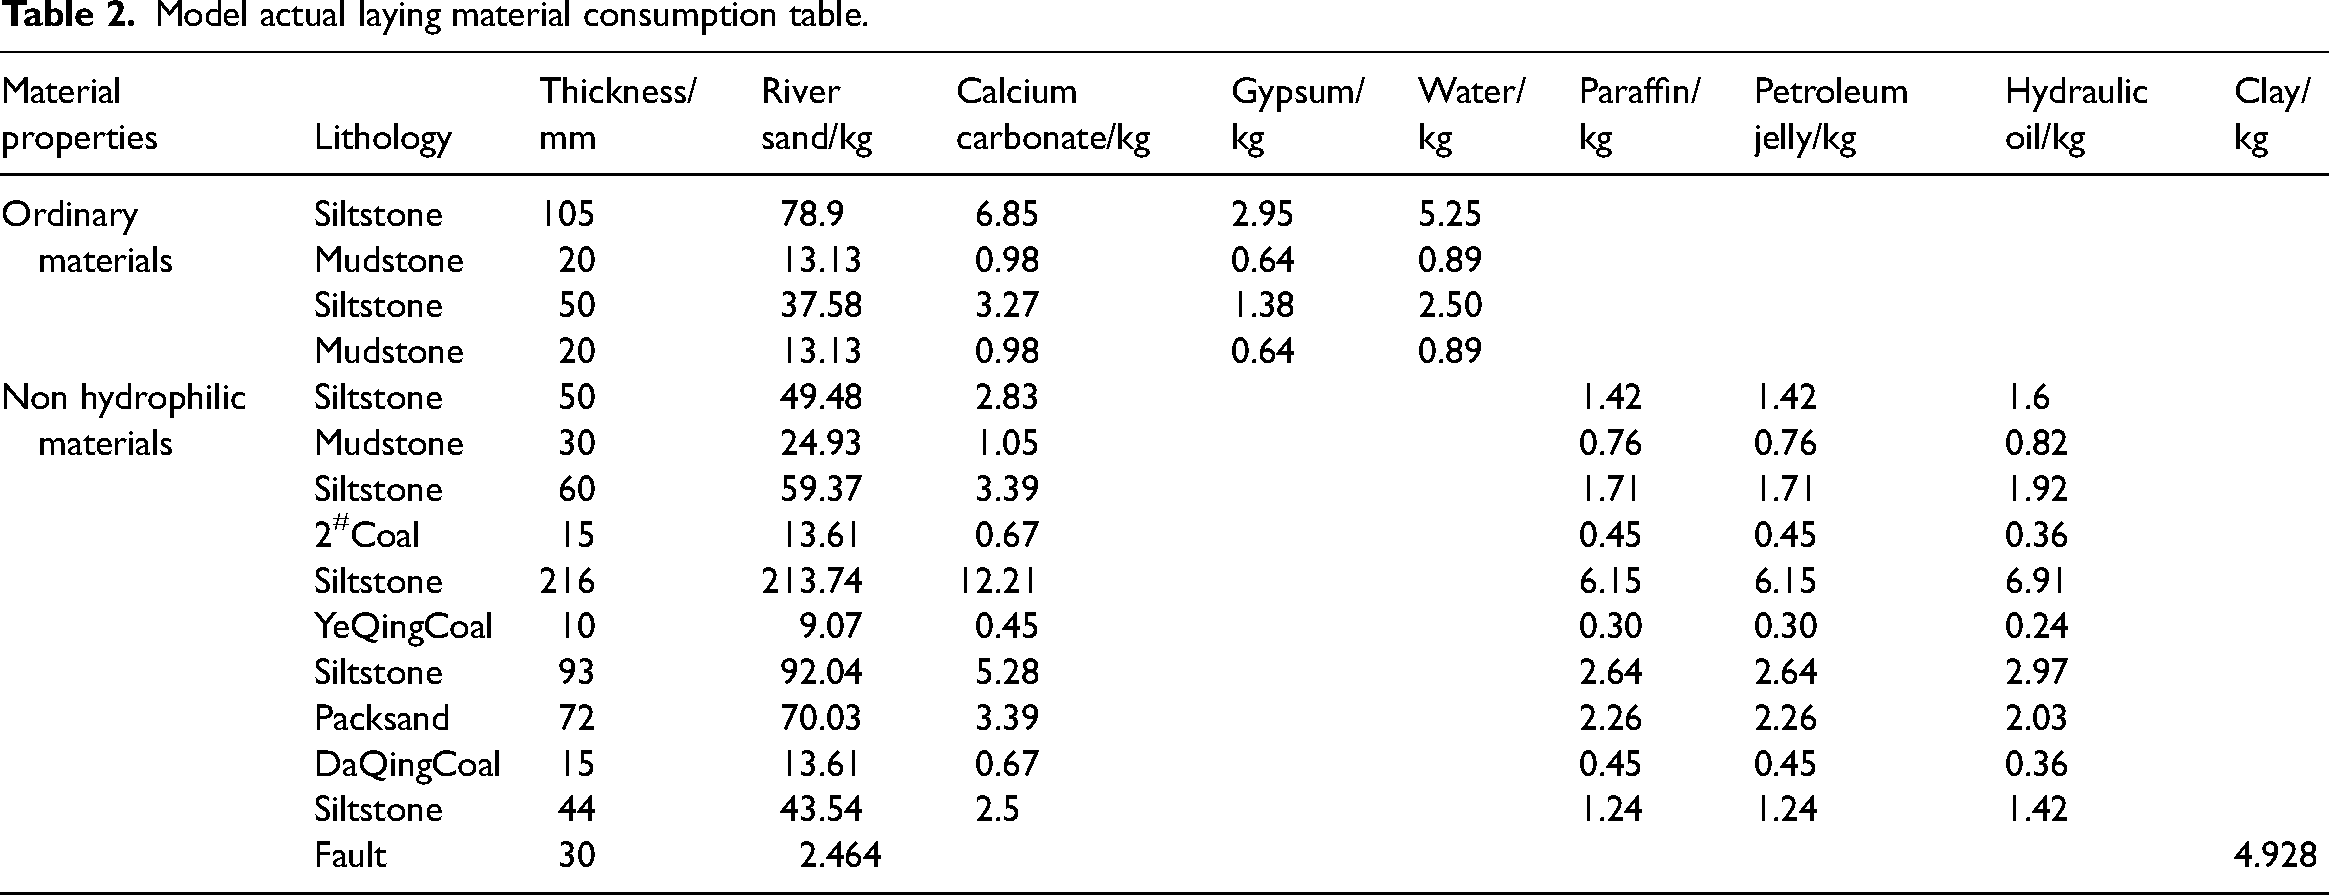
Material ratio selection: Similar materials including river sand and light calcium carbonate as aggregate, paraffin and petroleum jelly as binder, and hydraulic oil as a regulator were selected in this experiment. According to the previous research results (Sun et al., 2015), the material ratio of each simulated rock layer is determined by combining the calculated similarity ratio, equipment parameters and mechanical parameters of simulated rock layer. No water inrush occurred in the roof strata during the test. Therefore, regardless of the hydrologic properties of similar materials in roof strata. In order to reduce the test cost, ordinary simulation materials are used. The selection and dosage of materials used in the actual laying of the model are shown in Table 2.
Setting of mining scheme: According to the actual engineering geological conditions such as burial position and stratum information of 182201 working face in Wutongzhuang Coal Mine, the similar material simulation model of concealed normal fault F1 and penetrating normal fault F2 is designed. Among them, the parameters of the hidden fault are as follows: the dip angle of the fault is 60°, the width is 25 m and the fault is exposed when the working face is mined to 350 m. The parameters through the fault are as follows: the dip angle of the fault is 45°, the width is 40 m and the footwall Ordovician ash aquifer is uplifted.
Combined with the determined similarity ratio, it is calculated that the thickness of the waterproof rock layer of the simulated working face floor is 45 cm, the thickness of the coal seam is 1.5 cm, the thickness of the simulated working face roof is 33.5 cm, the hydraulic pressure of the Ordovician limestone aquifer is 33 kPa and the dead weight load of the rock layer is 48 kPa, which is the simulation of the in-situ stress environment of the working face. Loads of 46 kPa, 48 kPa and 51 kPa were applied from top to bottom in the horizontal direction on both sides of the model. There are 16 sensor positions in the model, which are used to monitor the changes in stress, water pressure and flow rate of floor rock and fault during the test. The layout positions of model and sensor are shown in Figure 1.
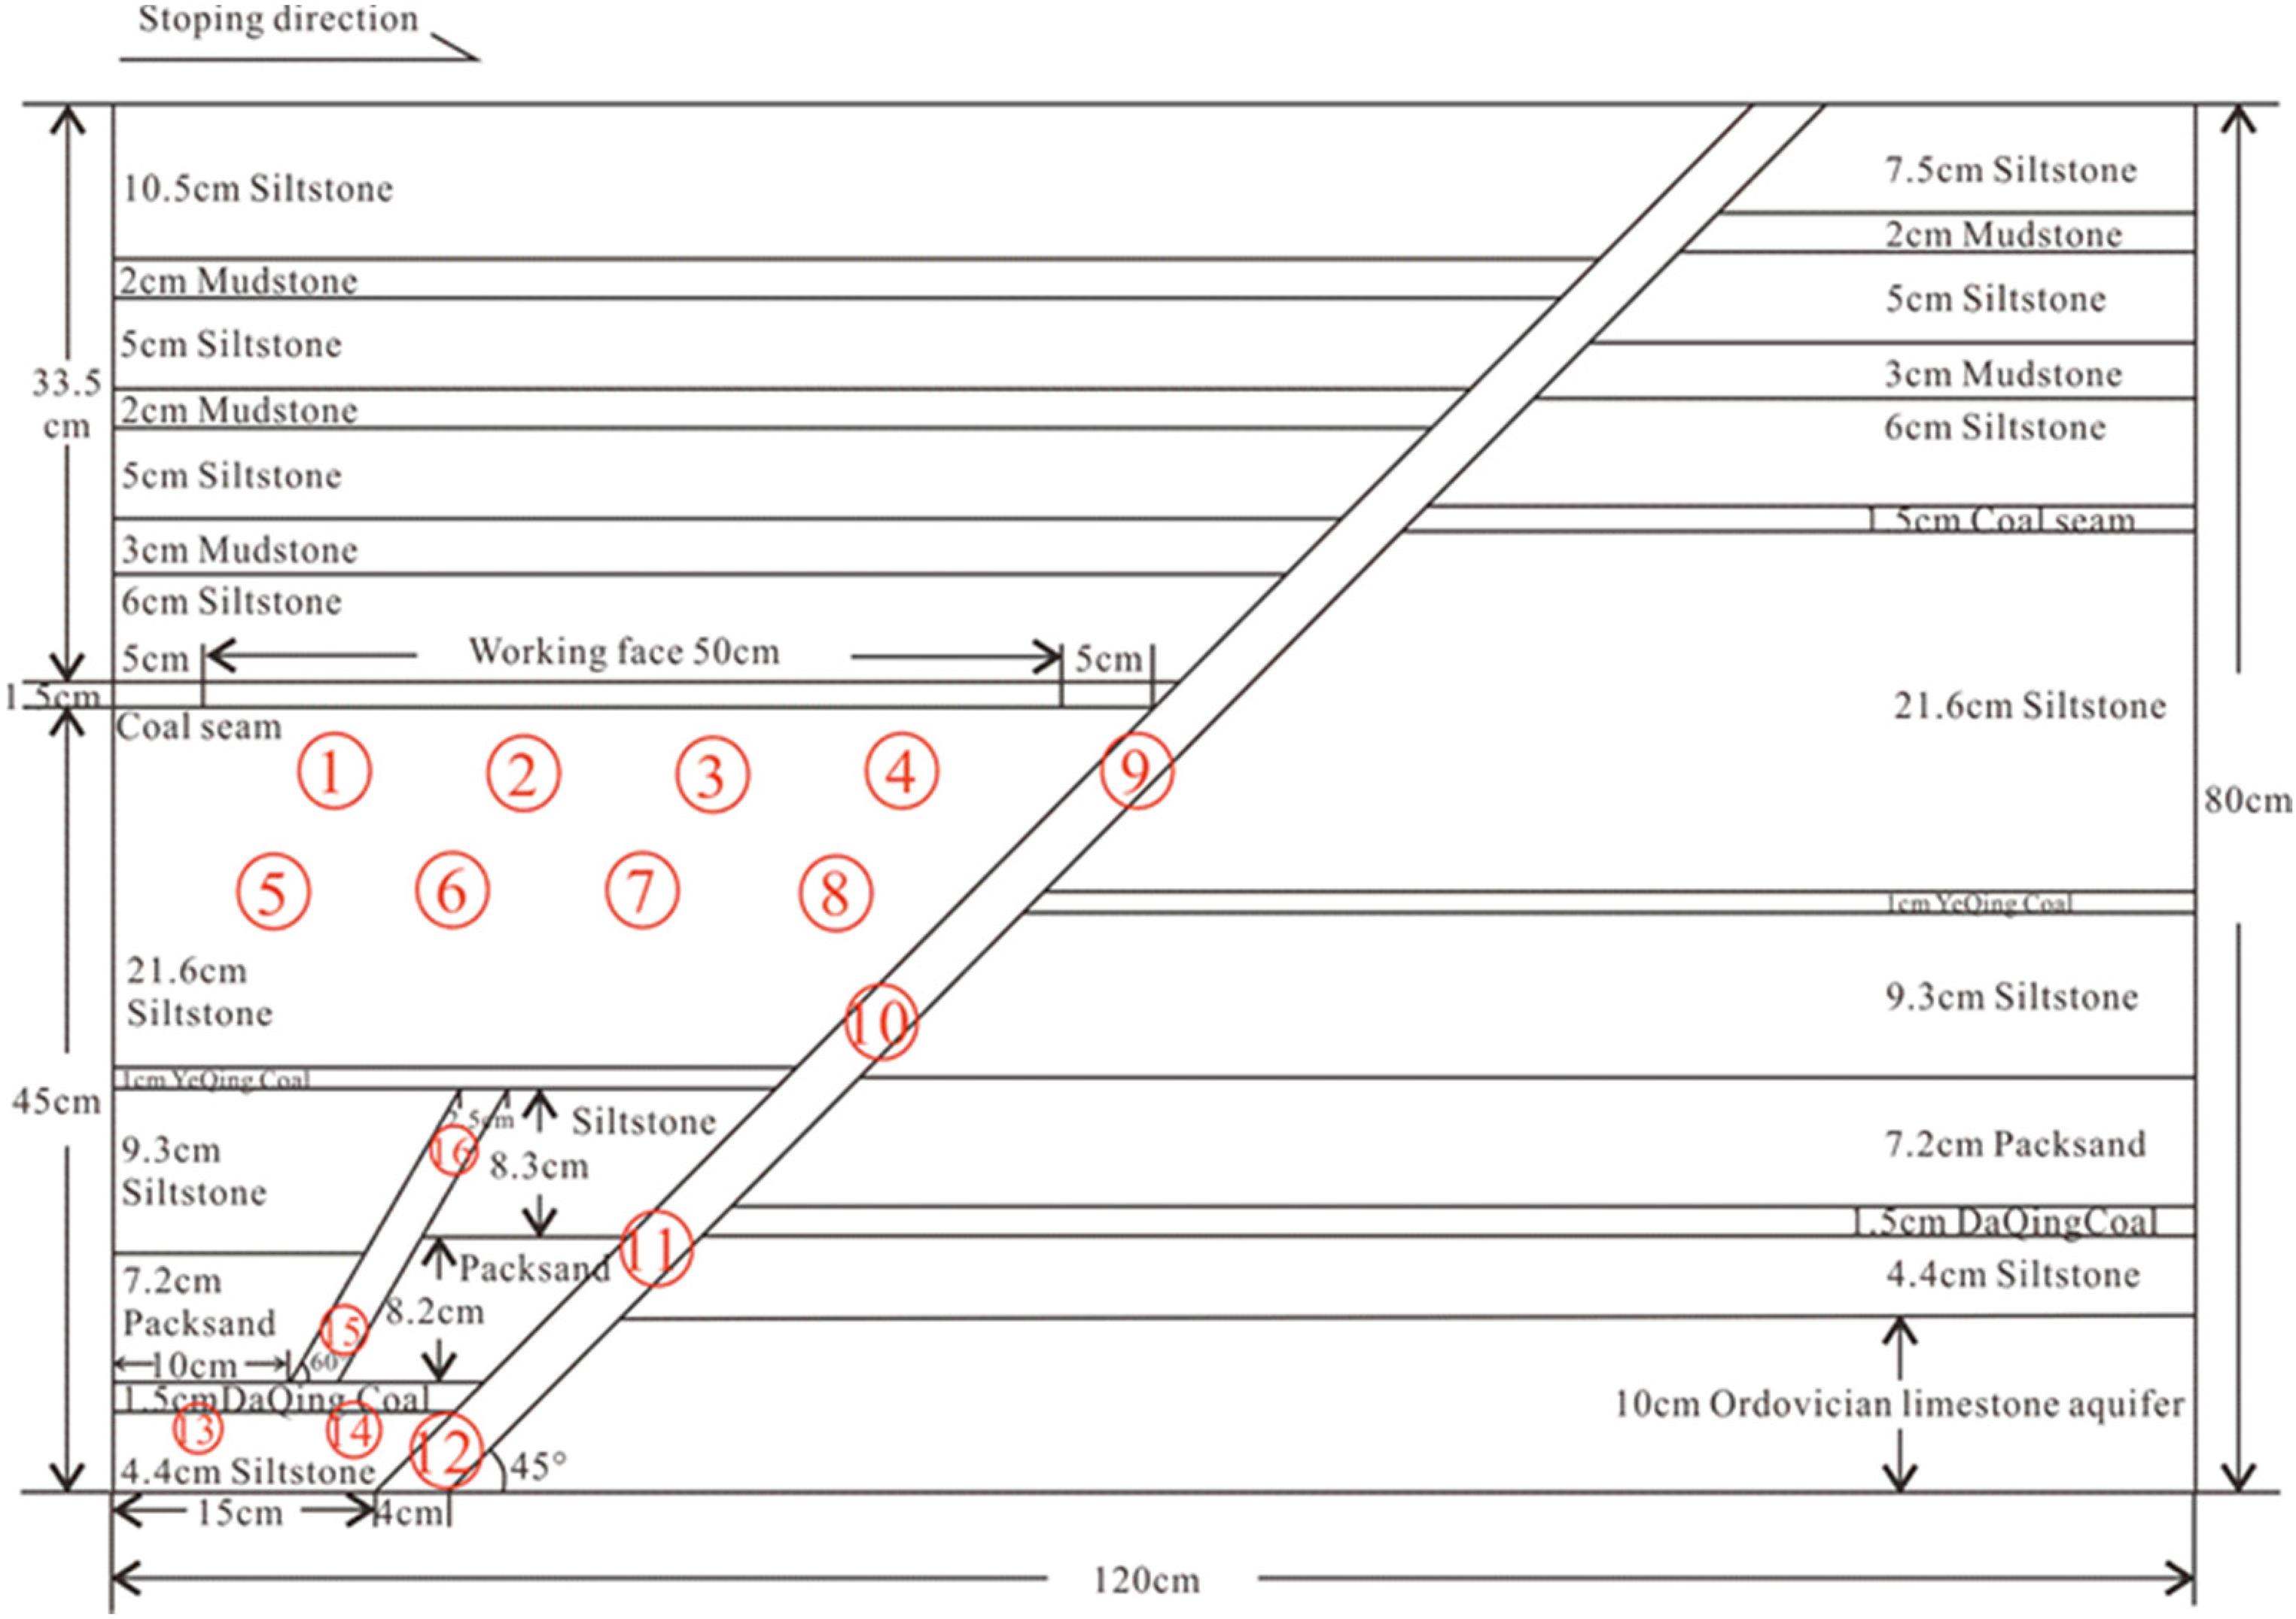
Water inrush model and sensor layout of floor fault structure.
Model actual laying material consumption table.
During the test, the length of simulated working face is 500 mm, each stoping distance is 50 mm, a total of 10 stopings. In order to ensure the similarity of the mining time of the working face, the interval after each mining is about 15 min, and the test is expected to be completed in 2 h and 15 min. At the same time, in order to reduce the influence of boundary effect on the results, the working face started mining 50 mm away from the boundary of the test rig and stopped mining 50 mm away from the through fault.
Simulation test process
Before simulating the working face mining, hydraulic servo system and liquid constant pressure supercharger are used to apply preset vertical load, horizontal load and water pressure values to the model, respectively. When the data are stable, the working face mining is simulated, and the simulated mining mode is in the form of manual drilling. After applying water pressure to the model, the process of water progressive lifting under pressure can be observed in the upper rock layer of the water tank before the mining of the simulated working face, and the lifting height near the fault is much higher than that of the complete water-resisting rock layer of the floor. At this time, the whole model is in stress equilibrium state.
The open-cut distance of the working face is 5 cm, the rock mass in the stope does not change significantly and the water flow at each monitoring point is zero. When the working face is mined to 10 cm, water invades the goaf upward along with the cracks between the model and the floor rock strata. When the working face is mined to 15 cm, the amount of water in the goaf becomes larger and the distribution of rock mass and water pressure in the stope does not change significantly. After standing for 5 min, the roof strata appear to be separated, and the first pressure comes. When the working face is mined to 20 cm, the separation and caving of roof strata occur, and the influence area gradually increases, cracks are generated near the bottom of the fault, and the water flow increases. When the working face is mined to 25 cm, and the fissures around the fault developed upward. When the working face is mined to 30 cm, the roof rock stratum bends and sinks and the water flow in the fault increases. When the working face is mined to 35 cm, cracks appear between the floor rock failure zone and the fault activation zone in front of the working face. When the working face is mined to 40 cm, the mining fissures are continuously expanding, and many tiny fissures are derived around them, and the water flow in the fault increases. When the working face is mined to 45 cm, the mining-induced fissure is connected with the surrounding micro-fissure, and the width of the fissure is up to 2 mm, the water volume increases, and large water inrush holes appear in the fault. When the mining of the working face reaches 50 cm, the mining-induced fissure of the floor does not increase further, the water inrush channel is completely formed. Simulated working face mining is completed. The simulation test process is shown in Figure 2.
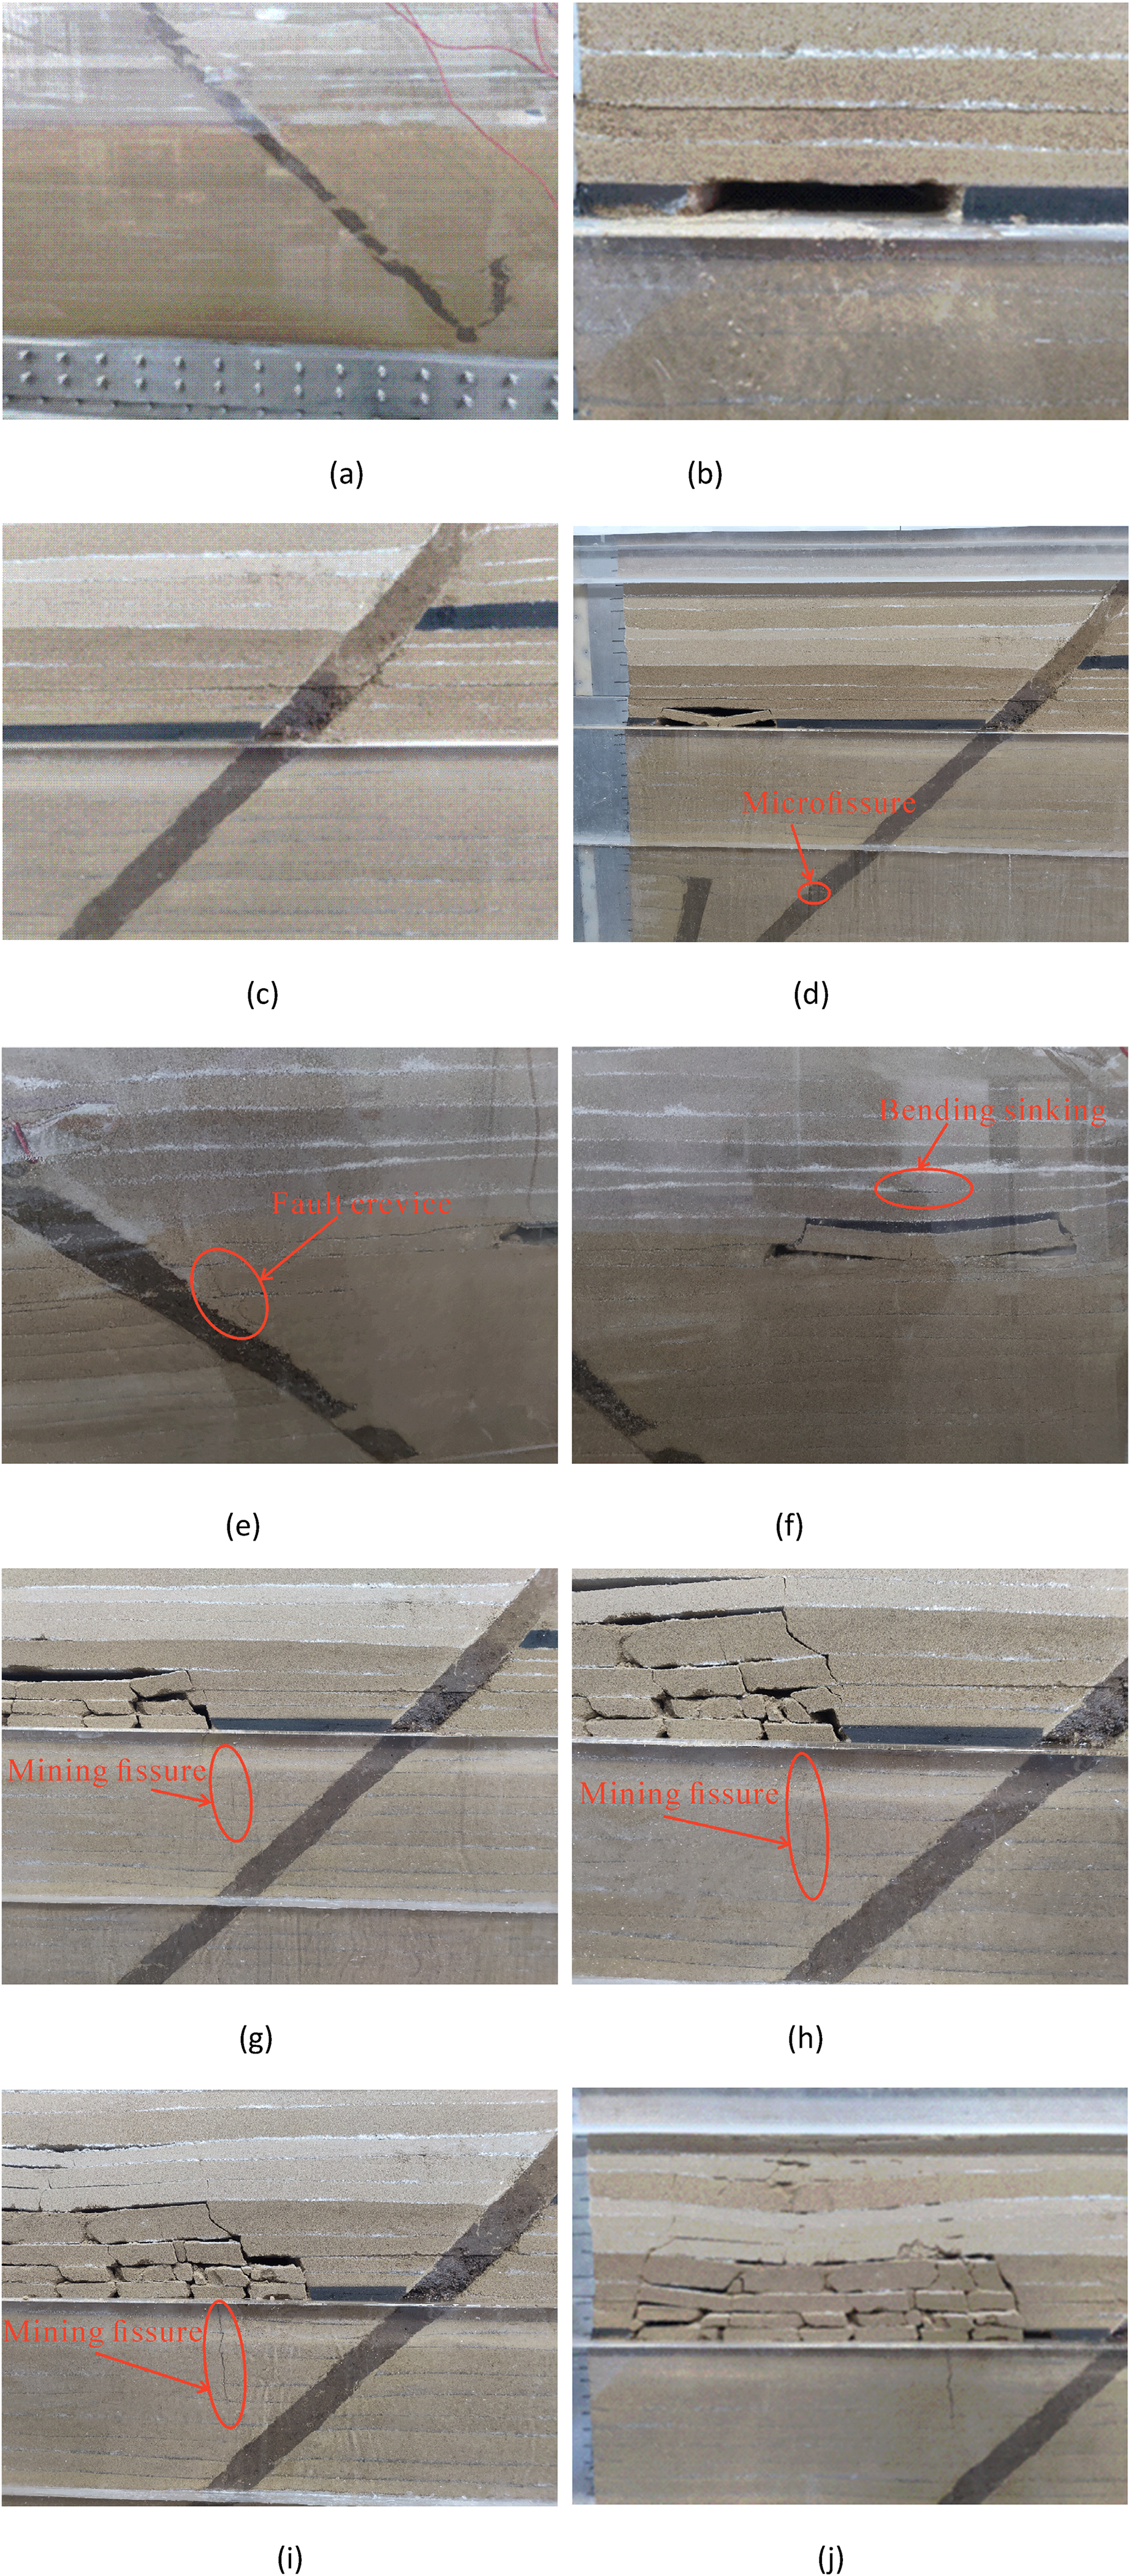
Schematic diagram of simulation test process of similar materials. (a) Open cut 5 cm (b) Working face advancing to 10 cm. (c) Working face advancing to 15 cm (d) Working face advancing to 20 cm, (e) Working face advancing to 25 cm, (f) Working face advancing to 30 cm, (g) Working face advancing to 35 cm, (h) Working face advancing to 40 cm, (i) Working face advancing to 45 cm and (j) Working face advancing to 50 cm.
Numerical simulation study
Setting of simulation scheme
According to the model established by a similar material simulation test, considering the calculation time and accuracy of the model, the formation lithology conditions of 182201 working face are reasonably generalized and the three-dimensional numerical model is constructed. The model size is 1100 m × 240 m × 400 m (length × width × height). The quadrilateral isoparametric element with four nodes is used for subdivision, and the mesh density of the key area was increased, with a total of 15311 units and 19054 nodes. The positive direction of X axis is set as the mining direction of working face, the positive direction of Y axis is set as the stratum dip direction and the positive direction of Z axis is set as the vertical upward direction. In order to counteract the influence of boundary effect, 100 m and 60 m are set on both sides of the model along X and Y axes. The model is shown in Figure 3. The front and back, left and right, and the lower part of the model are set as fixed boundaries without displacement. The top is set as the free boundary. Due to the large buried depth of the simulated working face, the overlying strata on the working face cannot be presented in the model. Therefore, a downward uniform load (P = γh) is applied at the top of the model to replace the self-gravity of the rock mass between it and the surface. Among them, the average bulk density of rock mass is γ = 2500 kg/m3, h is the distance between the top boundary of the model and the surface, and the applied load is calculated to be 7.16 MPa. The physical and mechanical parameters of the rock are assigned according to the actual parameter range of the core test taken by the borehole, and adjusted according to similar simulation test results. In this simulation, the mining distance of the working face is 500 m and the inclination length is 120 m. The working face adopts the method of step-by-step mining. Each mining step is 25 m, a total of 20 steps are mined, and the roof is managed by natural subsidence method. The location of monitoring points in the model is consistent with that in the similar material simulation test Different mining stages of the working face (50 m, 200 m, 350 m, 375 m, 450 m and 500 m) are selected for the study.

FLAC3D numerical model diagram.
Numerical simulation results
During the mining process of the working face, under the combined action of mining disturbance and confined water pressure of the underlying aquifer, all physical quantities in the stope change to different degrees. When the stress on the rock mass reaches the flow limit, the rock mass is broken. The process of floor rock fragmentation and fault activation water inrush is shown in Figure 4.
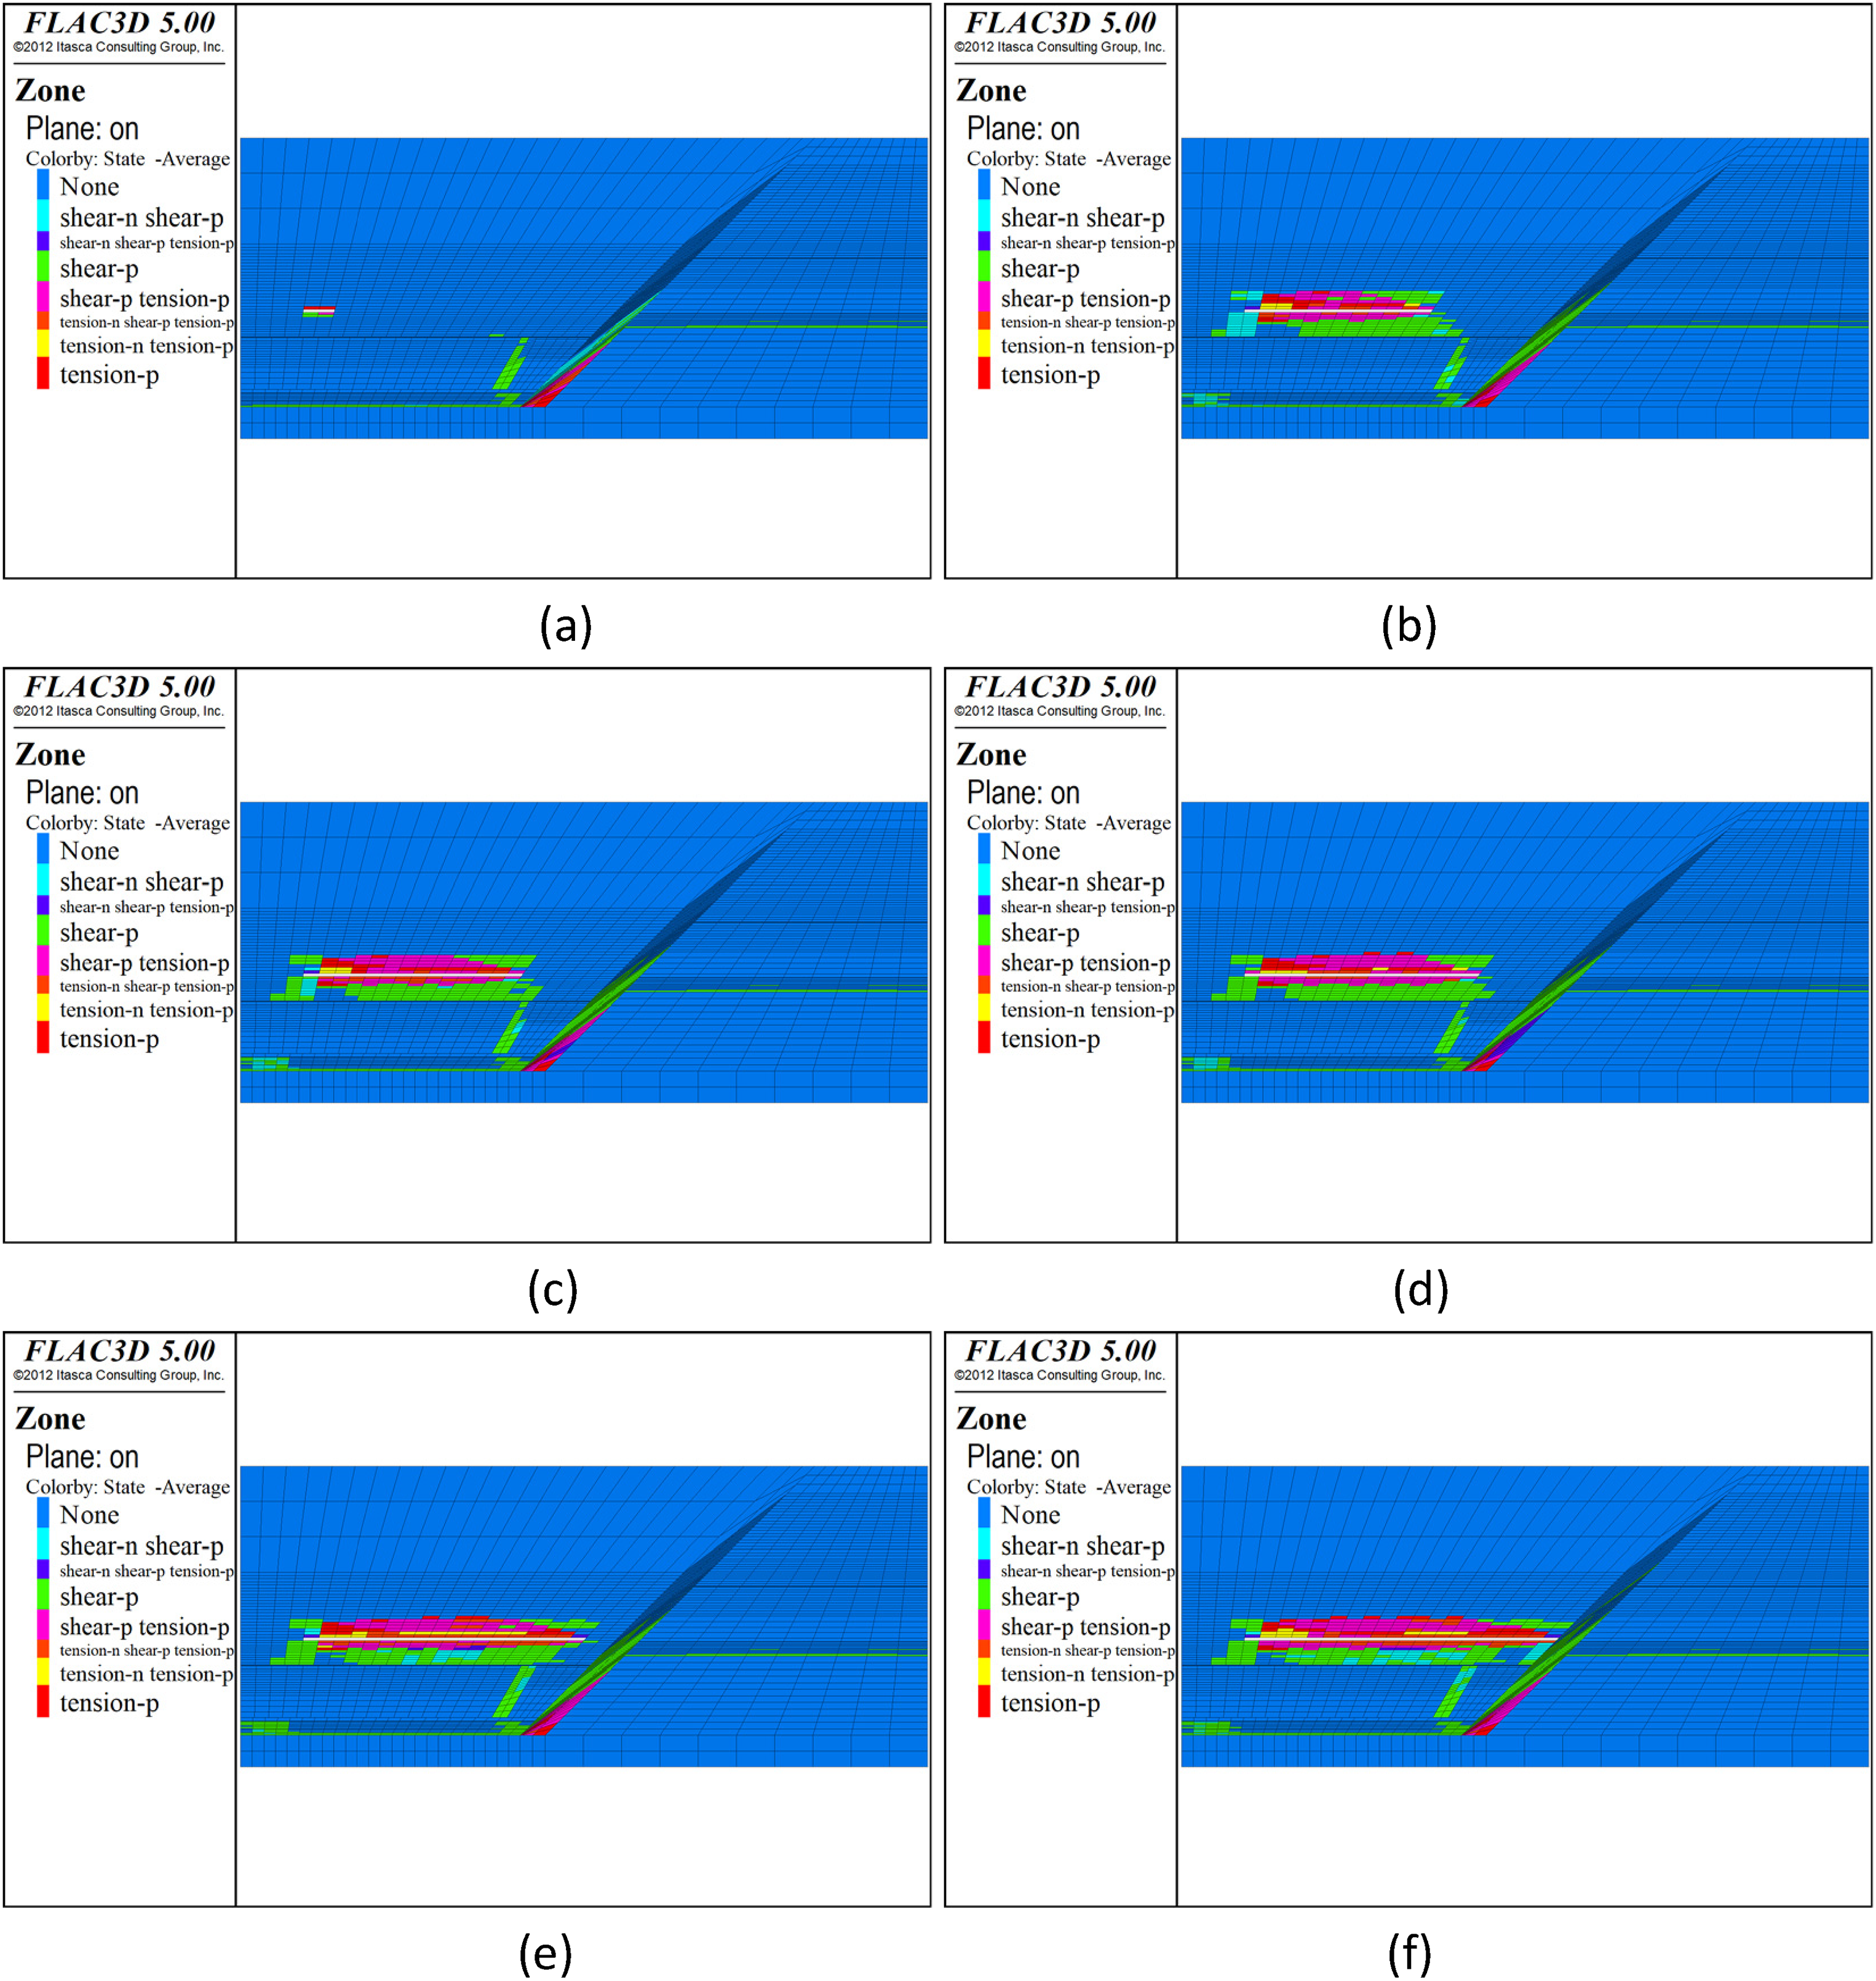
Failure diagram of plastic zone in working face mining. (a) Working face advancing to 50 m (b) Working face advancing to 50 m, (c) Working face advancing to 350 m, (d) Working face advancing to 50 m, (e) Working face advancing to 450 m and (f) Working face advancing to 500 m.
It can be seen from Figure 4 that when the working face begins to mining, the roof strata are mainly subjected to tension failure, and the floor strata are mainly subjected to shear failure. Moreover, due to the mining disturbance, the stress field of surrounding rock is redistributed, and the rock mass in the concealed fault and the through-fault both undergo plastic failure. Among them, the hidden fault is mainly affected by the mining stress, and the rock mass shear failure occurs. The rock mass near the aquifer in the fault occurs tensile failure and shear failure under the combined action of mining stress and aquifer water pressure. The rock mass near the complete rock layer of the floor mainly occurs in shear failure. With the continuous forward mining of the working face, the plastic failure range of the roof and floor strata increases continuously. When the roof strata is damaged to sandstone 2, and the floor strata is damaged to siltstone 3, the failure range of the roof and floor strata no longer increases with the mining of the working face, and the rock mass is dominated by shear failure. Under the action of high confined water pressure at the bottom of the fault, the rock mass breaks first, and the water pressure suffered by the rock mass is approximately equal to the water pressure in the aquifer. As the working face continues to be mined forward, the physical quantities of the rock mass in the through faults from bottom to top have similar changing trends, reaching the peak successively, and the extreme values of each physical quantity gradually decrease. Due to the continuous increase in fault activation degree, confined water in the aquifer flows upward along with the fault failure zone, the strength of the rock mass inside the fault decreases continuously, the weakening range expands continuously, and some areas of the upper rock mass appear tensile failure. The failure zone of floor strata in the working face is connected with the through-fault failure zone, and there is a hydraulic connection between them, resulting in water inrush.
Study on water inrush warning information of floor fault structure
Study on characteristics of water inrush based on similar material simulation test results
According to the simulation test results of similar materials and the location of sensor layout, the monitoring points No. 4 and No. 9 are selected as the water inrush location of floor strata and the through fault, respectively, which are used to monitor the formation process of water inrush channel. In the process of working face mining, the variation law of physical quantities at No. 4 and No. 9 monitoring points is shown in Figure 5. It can be seen from the monitoring results:
When the working face begins to mining, the stress of No. 4 monitoring point fluctuates and changes due to the mining disturbance. The water in the aquifer is flowing upward, and the water flow of the monitoring point is 0. When the working face is mined to about 10–30 cm, the stress of No. 4 monitoring point increases rapidly and tends to be stable, indicating that the influence range of mining disturbance gradually increases with the forward mining of the working face. When the advanced compression zone acts on the No. 4 monitoring point, the stress tends to be stable. When the working face is mined to 15–20 cm, the water flow is relatively stable, basically maintained at about 0.035 L/min. When the working face is mined to 20–25 cm, the water flow shows a change process of increasing-decreasing. When the working face mining to about 30–40 cm, the stress of No. 4 monitoring point shows a small increase, and in a state of constant fluctuation, indicating that the place gradually developed mining cracks, water flow showed the same change process as the previous stage; When the working face is mined to about 40–45 cm, the stress of the No. 4 monitoring point is greatly reduced. When the working face is mined to about 43 cm, the minimum peak value appears, and the water flow increases and remains stable. The change process shows that the mining fissures between the fault activation zone and the floor failure zone are continuously expanding, and many tiny fissures are derived around them, and the risk of water inrush increases. When the working face continues to forward mining, rock stress increased slightly, working face mining to 47 cm or so, a sudden surge in water flow, resulting in the maximum peak, and water inrush phenomenon appears. When the working face begins mining, the water pressure value of No. 9 monitoring point is 2.96 kPa, and the water flow is 0. When the working face is mined to about 10–20 cm, the water pressure of No. 9 monitoring point remains unchanged, and the water flow shows a sudden increase-relatively stable change process, with a flow rate of about 0.03 L/min. When the working face is mined to 20–25 cm, the water pressure of No. 9 monitoring point has two minimum peaks, which indicates that the fault is affected by confined water, micro-cracks are generated at the bottom and gradually develop upward, and the water flow in the fault is increasing. When the working face is mined to about 25–35 cm, the water pressure of No. 9 monitoring point remains unchanged, and the water flow fluctuates slightly, which is relatively stable on the whole. When the working face is mined to about 35–40 cm, the water flow of No. 9 monitoring point decreases slightly, and then the maximum and minimum extreme values appear in turn, and the water pressure also peaks one after another, indicating that the fault at No. 9 monitoring point is activated in this process. The internal rock mass is broken. The hydraulic connection is generated between the floor failure area. The risk of water inrush increases. When the working face continues to move forward, the water pressure of No. 9 monitoring point changes first, and the water pressure value suddenly decreases to 0. When the working face is mined to about 47 cm, the water flow in the fault rises sharply and produces the maximum peak value. It shows that the mining fissures between the floor failure zone and the fault of the working face gradually develop, and the formation of water inrush channel, water inrush occurs.
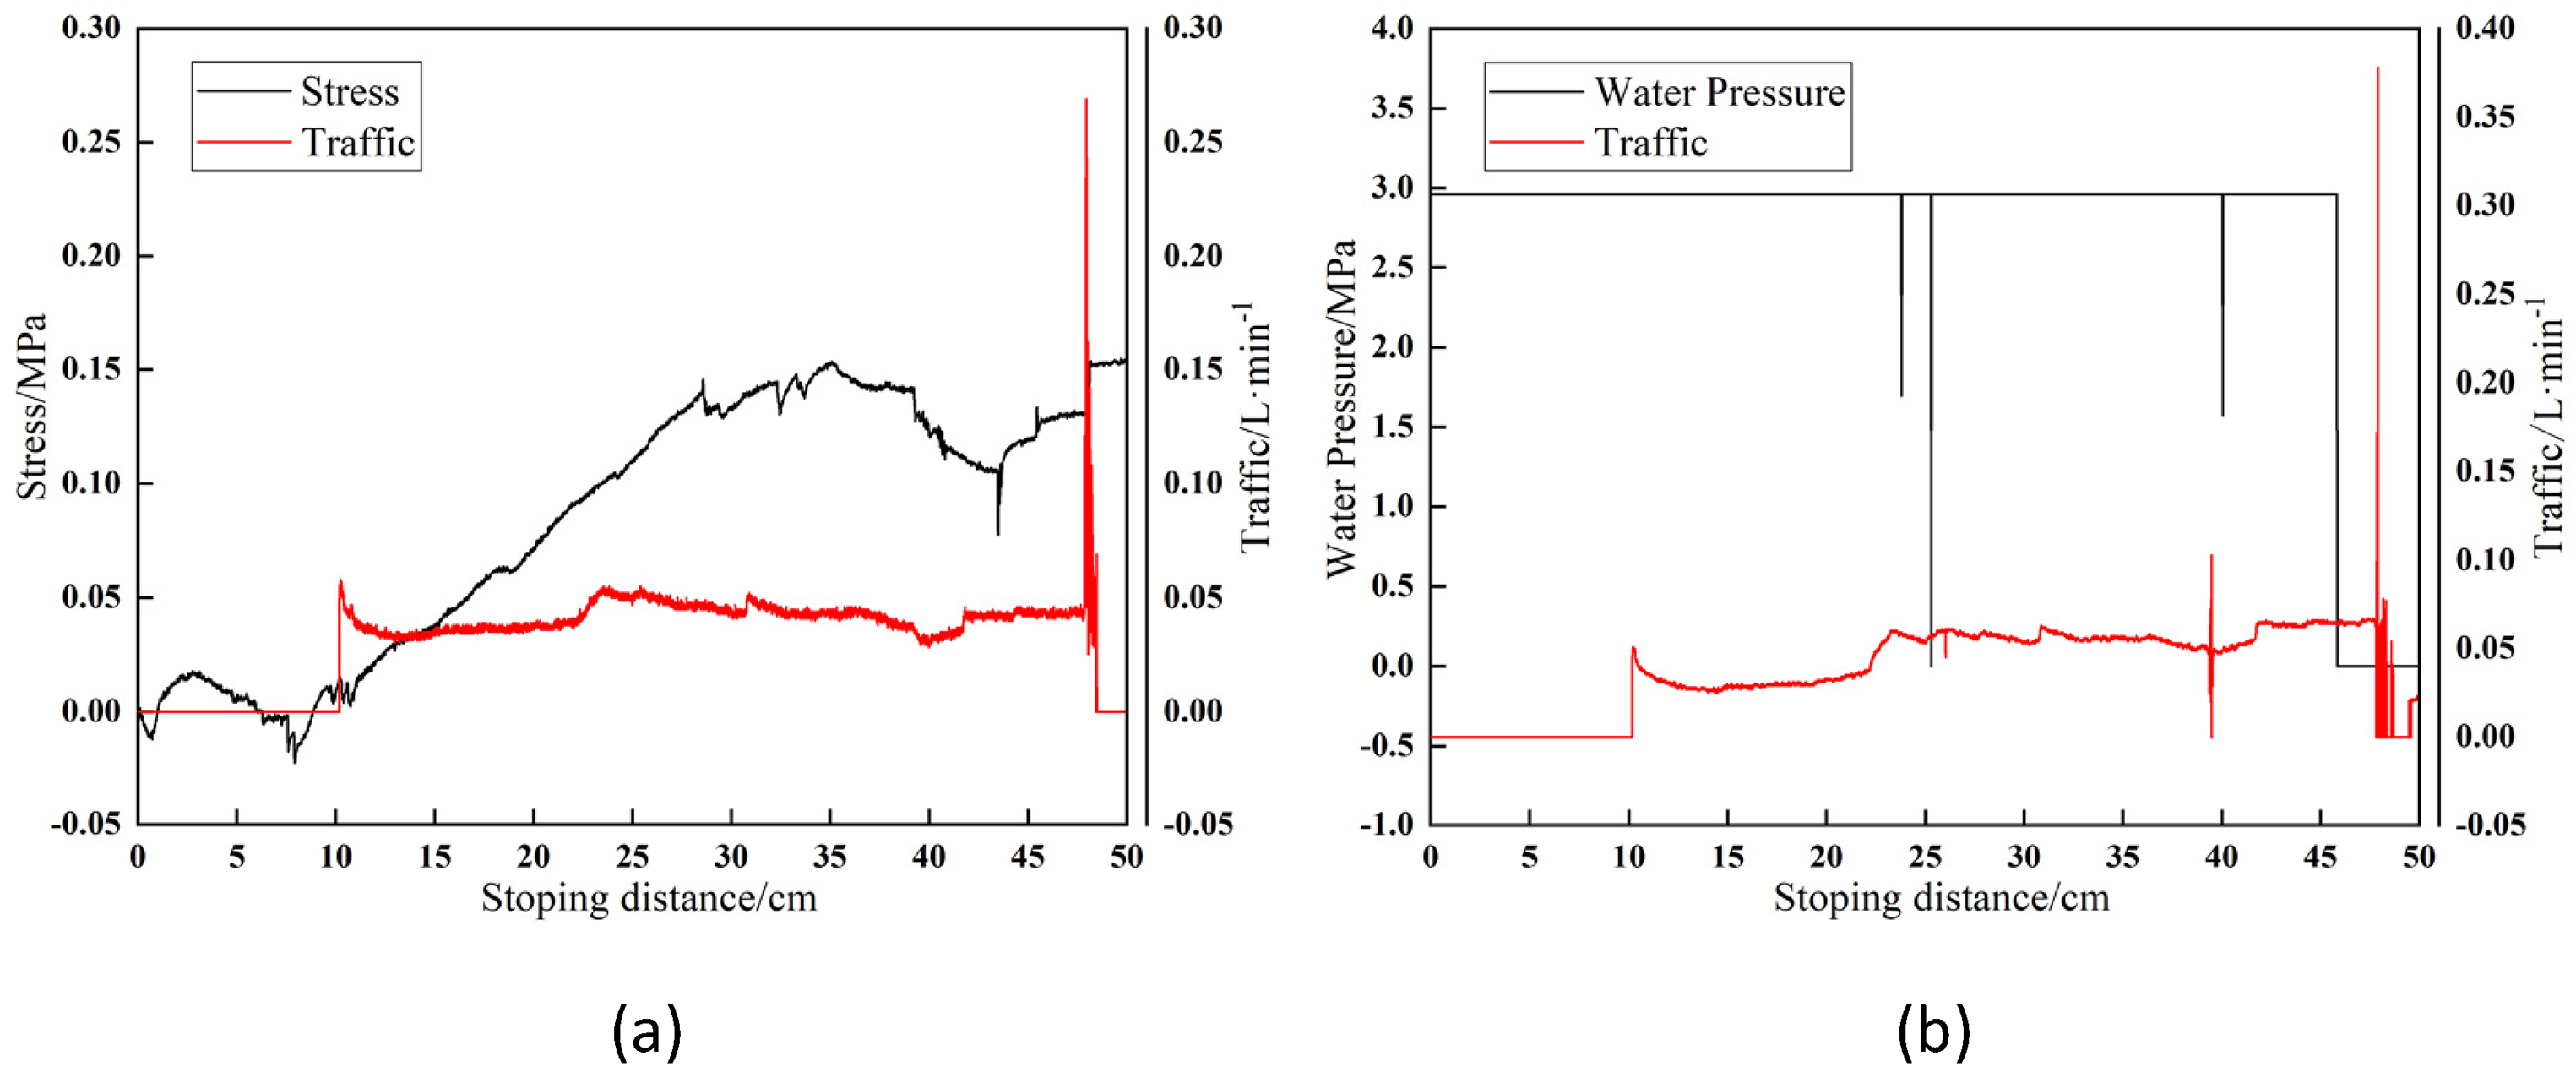
Distribution diagram of physical quantity data of water inrush location. (a) Monitor station 4 (b) Monitor station 9.
In summary, for a long period of time before the water inrush of the fault structure occurs, the physical quantities in the floor strata and faults have abnormal fluctuation changes with precursory characteristics. Among them, the floor rock stress showed a sharp decrease in the process of change, and suddenly there is a minimum peak, water flow showed a steady increase—a sudden increase in the process of change; When it is on the verge of water inrush, the stress of floor rock presents a stepwise jump change. When the fault is activated to the vicinity of the floor strata, as the working face continues to advance, the water flow at the fault water inrush position increases and then remains stable, and the water pressure falls in a cliff-like manner, and then the flow increases, resulting in water inrush. Compared with the through fault water inrush position, the abnormal change of the physical quantity of the water inrush position of the floor rock layer occurs earlier.
Study on critical water inrush characteristics based on numerical simulation results
FLAC3D numerical simulation software is used to reproduce the water inrush process of the fracture structure of the coal seam floor. Combined with the results of similar material simulation tests, the monitoring points No. 4 and No. 9 are also selected as the water inrush position of the floor strata and the through fault water inrush position, respectively. Monitoring the value of stress in the process of mining face, water pressure value and the displacement. The changes of physical quantities at each monitoring point are shown in Figure 6.
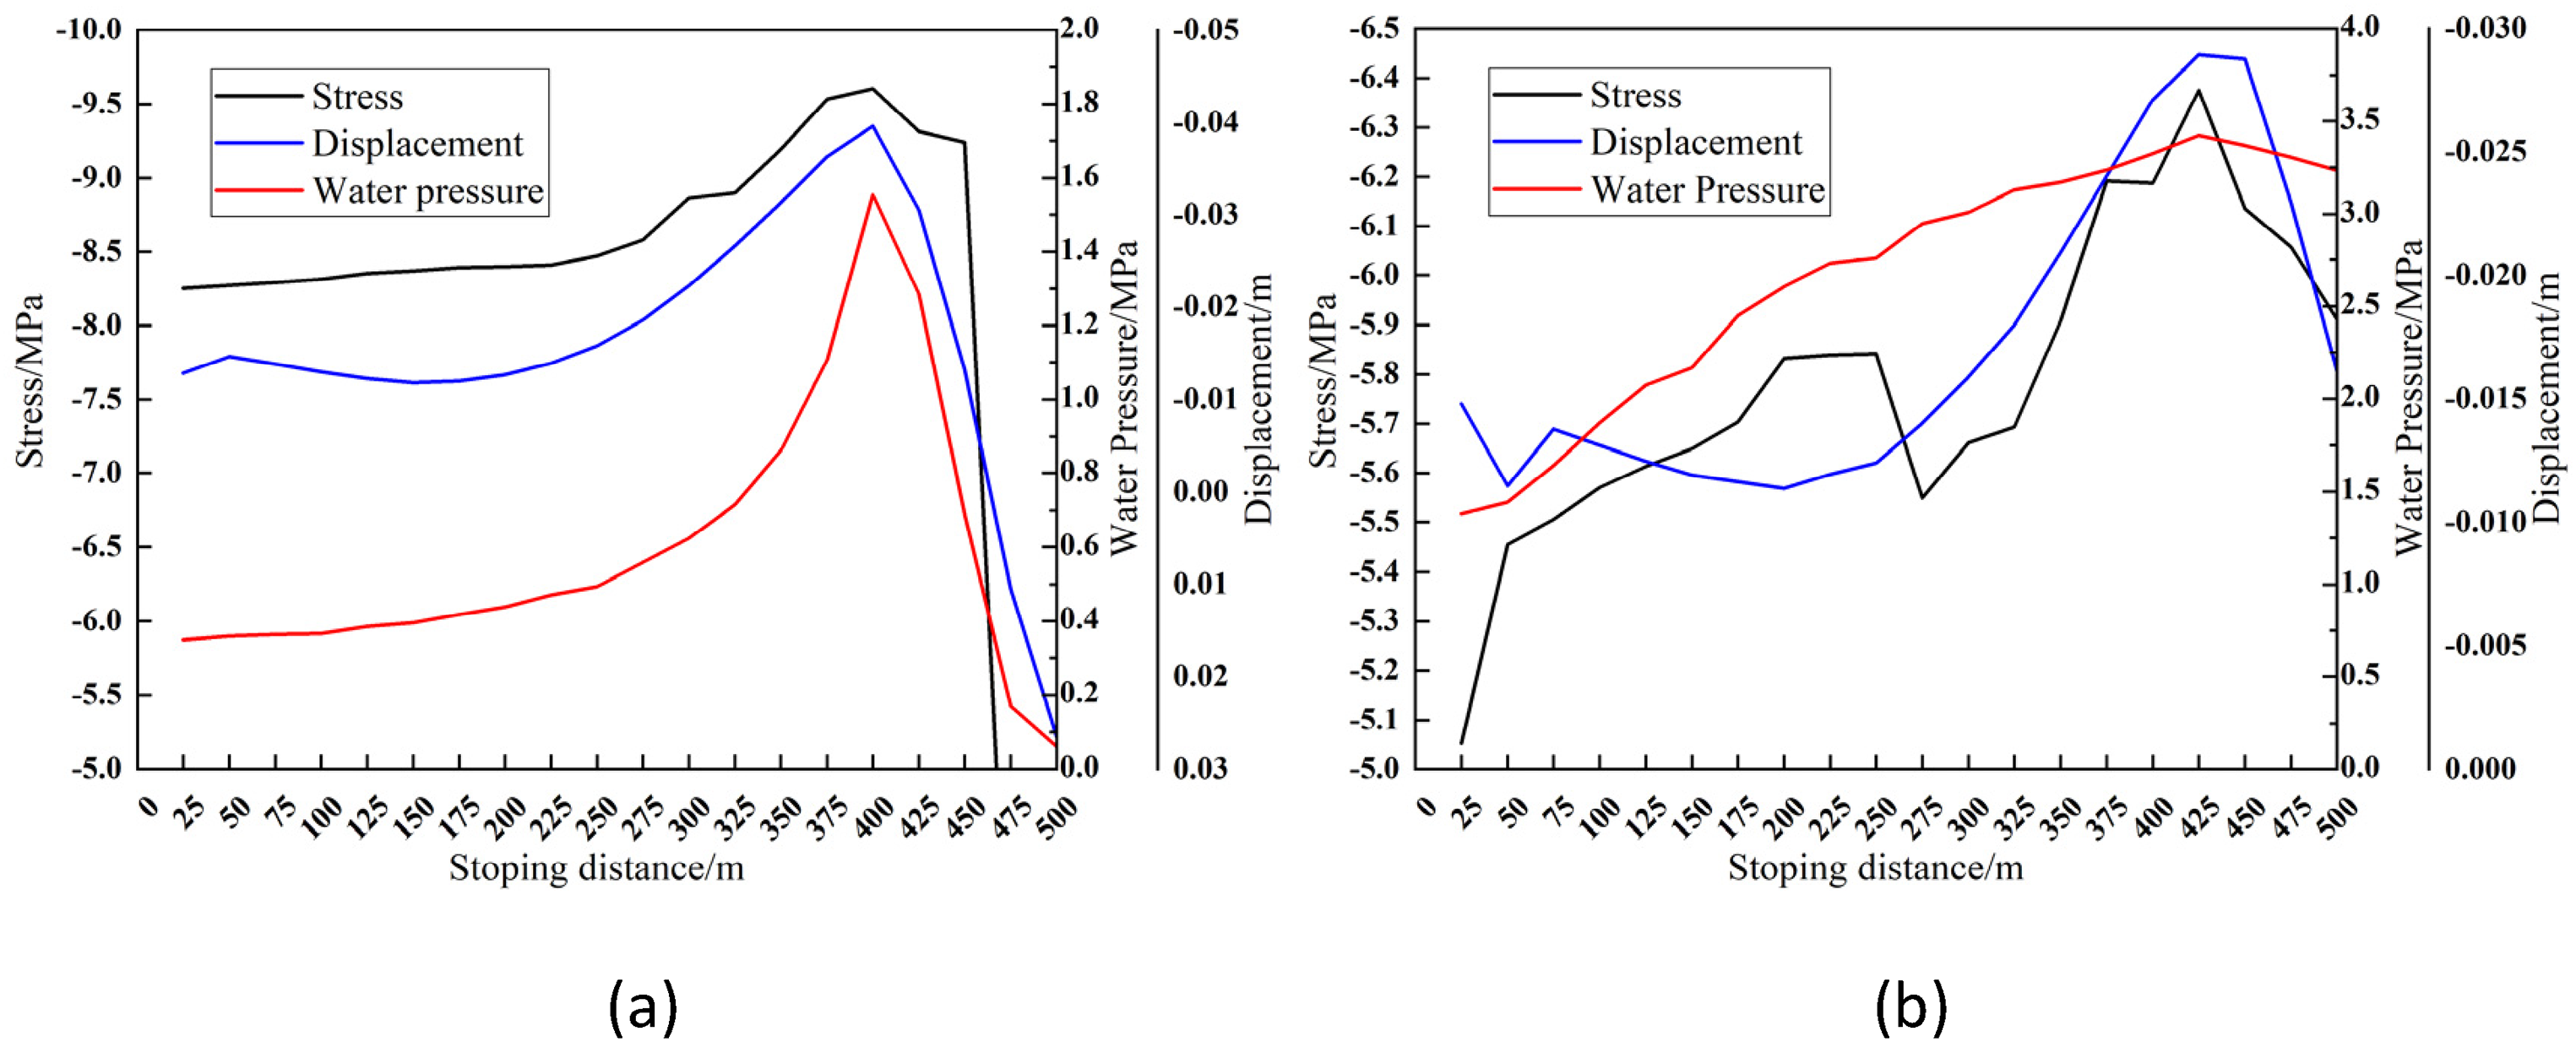
Distribution diagram of physical quantity data of water inrush location. (a) Monitor station 4 (b) Monitor station 9.
According to the monitored data change process, we can know that:
When the working face mining to about 25–250 m, affected by coal mining disturbance, the stress and water pressure of No. 4 monitoring point shows a stable increase in the process of change, the rock mass downward displacement, displacement of about 0.012 m. When the working face is mined to about 250–375 m, the stress, water pressure and displacement of No. 4 monitoring point show a continuous increasing trend. Compared with the previous stage, the increase in each physical quantity becomes larger. Among them, the change rate of stress is the largest, indicating that the water inrush position of floor rock is obviously affected by the advance pressure. When the working face is mined to about 375–400 m, the water pressure of No. 4 monitoring point increases sharply, and the increase rate of stress and displacement decreases slightly. When the working face is mined to about 400 m, the physical quantities reach the peak, indicating that as the working face continues to be mined forward, the range of floor strata affected by mining gradually increases. When the working face is constantly close to the through fault, under the combined action of mining stress and water pressure, the complete rock layer between the floor failure zone and the fault-confined water conduction zone is gradually destroyed, forming mining fissures, and the hydraulic connection between the two is generated. The risk of water inrush from the floor of the working face rises sharply. As the working face continues to move forward, the mining-induced fissures between the floor failure zone and the fault-confined water conduction zone gradually develop, forming a stable water inrush channel, the fault water inrush occurs, and the physical quantities decrease. When the working face is mined to 25–50 m or so, the stress of the mining site is changed by the mining of the coal seam, and the confined water pressure of the underlying aquifer is large. The rock mass at the bottom of the fault is completely broken, and the confined water conduction zone is formed upward along the fault. The stress of No. 9 monitoring point increased sharply, resulting in a small downward displacement, and the water pressure showed an increasing trend. When the working face is mined to about 50–200 m, the stress and water pressure of No. 9 monitoring point continue to increase, and the displacement decreases to about 0.012 m and then remains stable. When the working face is mined to about 200–400 m, the water pressure and displacement of No. 9 monitoring point show a trend of continuous increase, and the stress of No. 9 monitoring point shows a change process of decreasing first and then increasing. When the working face mining exceeds 325 m, the increasing rate of water pressure gradually decreases. When the working face is mined beyond 375 m, the increase rate of displacement starts to gradually decrease. This is because when the working face is mined to about 250 m, the fault is gradually activated upward and the rock mass at No. 9 monitoring point is broken. When the working face is mined to about 325 m, the advance compression zone of the floor gradually acts on the fault, resulting in a continuous increase in the stress on the fault. When the working face is mined to about 425 m, all physical quantities of No. 9 monitoring point reach the peak value, and mining cracks are generated between the fault and the floor failure zone. As the working face continues to move forward, the stress and displacement of No. 9 monitoring point decrease sharply, and the water pressure remains basically unchanged, indicating that the mining fissures between the fault and the floor failure zone gradually develop, forming water inrush channels, fault pressure relief and hydraulic connection between the two.
In summary, by comparing the stress, water pressure and displacement response characteristics of the floor rock water inrush position and the fault water inrush position before and after the water inrush, it can be seen that: In the emergent stage before water inrush in working face, the physical quantities in water inrush position change sharply and have a peak value. When the working face water inrush occurs, the stress and displacement are greatly reduced. Since the underlying aquifer is highly water-rich and the water pressure is high, the water pressure on the fault water inrush position after water inrush basically remains unchanged, and the water flow flows into the goaf along with the floor failure area, and the water pressure at the floor rock water inrush position decreases. Compared with the location of fault water inrush, the peak time of each physical quantity in the water inrush location of floor rock stratum is earlier, and the variation range of stress and water pressure is more obvious, which indicates that the response characteristics of stress and water pressure in floor rock stratum to water inrush are more intense, and it is more suitable as the early warning information of water inrush in fault structure.
Verification and analysis of similar material simulation test and numerical simulation results
According to the physical quantity information monitored by each monitoring point in the process of similar material simulation test and numerical simulation, the stress data of some monitoring points of floor rock stratum are selected as the representative to verify and analyze the simulation results of the two methods. Because FLAC3D software uses the finite continuous element algorithm to calculate, it cannot simulate the compaction phenomenon of floor strata after the collapse of roof strata. After the working face is mined, it shows the change law that the stress on floor strata tends to 0. Therefore, the mining range of stress fluctuation in the process of numerical simulation is selected for this verification analysis. The stress changes at each monitoring point are shown in Figure 7 (In the stress data of floor strata monitoring points obtained by numerical simulation, the negative sign represents the downward direction of the stress). It can be seen from the stress changes in the figure:
Based on the data of similar material simulation test results, when the working face is mined to about 5–25cm, the stress of No. 2 monitoring point shows a dynamic change process of rapid increase-slow increase-decrease and reaches the extreme value when the working face is mined to about 20 cm. The average increase rate of stress is about 0.004, and the decrease rate is about 0.004. Based on the data of numerical simulation results, when the working face is mined to about 50–250 m, the stress of No. 2 monitoring point shows a dynamic change process of slow increase-sudden increase-decrease and reaches the extreme value when the working face is mined to about 200 m. The average increase rate of stress is about 0.005, and the decrease rate is about 0.006. Based on the data of similar material simulation test results, when the working face is mined to about 15–35 cm, the stress of No. 3 monitoring point shows a dynamic change process of gradual increase-decrease and reaches the extreme value when the working face is mined to about 30 cm. The increase rate of stress is about 0.003, and the decrease rate is about 0.002; Based on the data of numerical simulation results, when the working face is mined to about 150–350 m, the stress of No. 3 monitoring point shows a dynamic change process of slow increase-rapid increase-gradually decrease and reaches the extreme value when the working face is mined to about 300m. The average increase rate of stress is about 0.006, and the decrease rate is about 0.007. Based on the data of similar material simulation test results, when the working face is mined to about 25 cm−45 cm, the stress of No. 4 monitoring point shows a dynamic change process of gradual increase-rapid decrease-slow decrease and reaches the extreme value when the working face is mined to about 35 cm. The increase rate of stress is about 0.004, and the average decrease rate is about 0.003. Based on the data of numerical simulation results, when the working face is mined to about 250–450 m, the stress of No. 4 monitoring point shows a dynamic change process of slow increase-rapid increase-gradually decrease and reaches the extreme value when the working face is mined to about 400 m. The average increase rate of stress is about 0.006, and the decrease rate is about 0.007. Based on the data of similar material simulation test results, when the working face is mined to about 25–45 cm, the stress of No. 8 monitoring point shows a dynamic change process of gradual increase-decrease and reaches the extreme value when the working face is mined to about 35 cm. The increase rate of stress is about 0.008, and the decrease rate is about 0.002; Based on the data of numerical simulation results, when the working face is mined to about 250–450 m, the stress of No. 8 monitoring point shows a dynamic change process of gradual increase-decrease-rapid decrease and reaches the extreme value when the working face is mined to about 400 m. The increase rate of stress is about 0.007, and the average decrease rate is about 0.005.
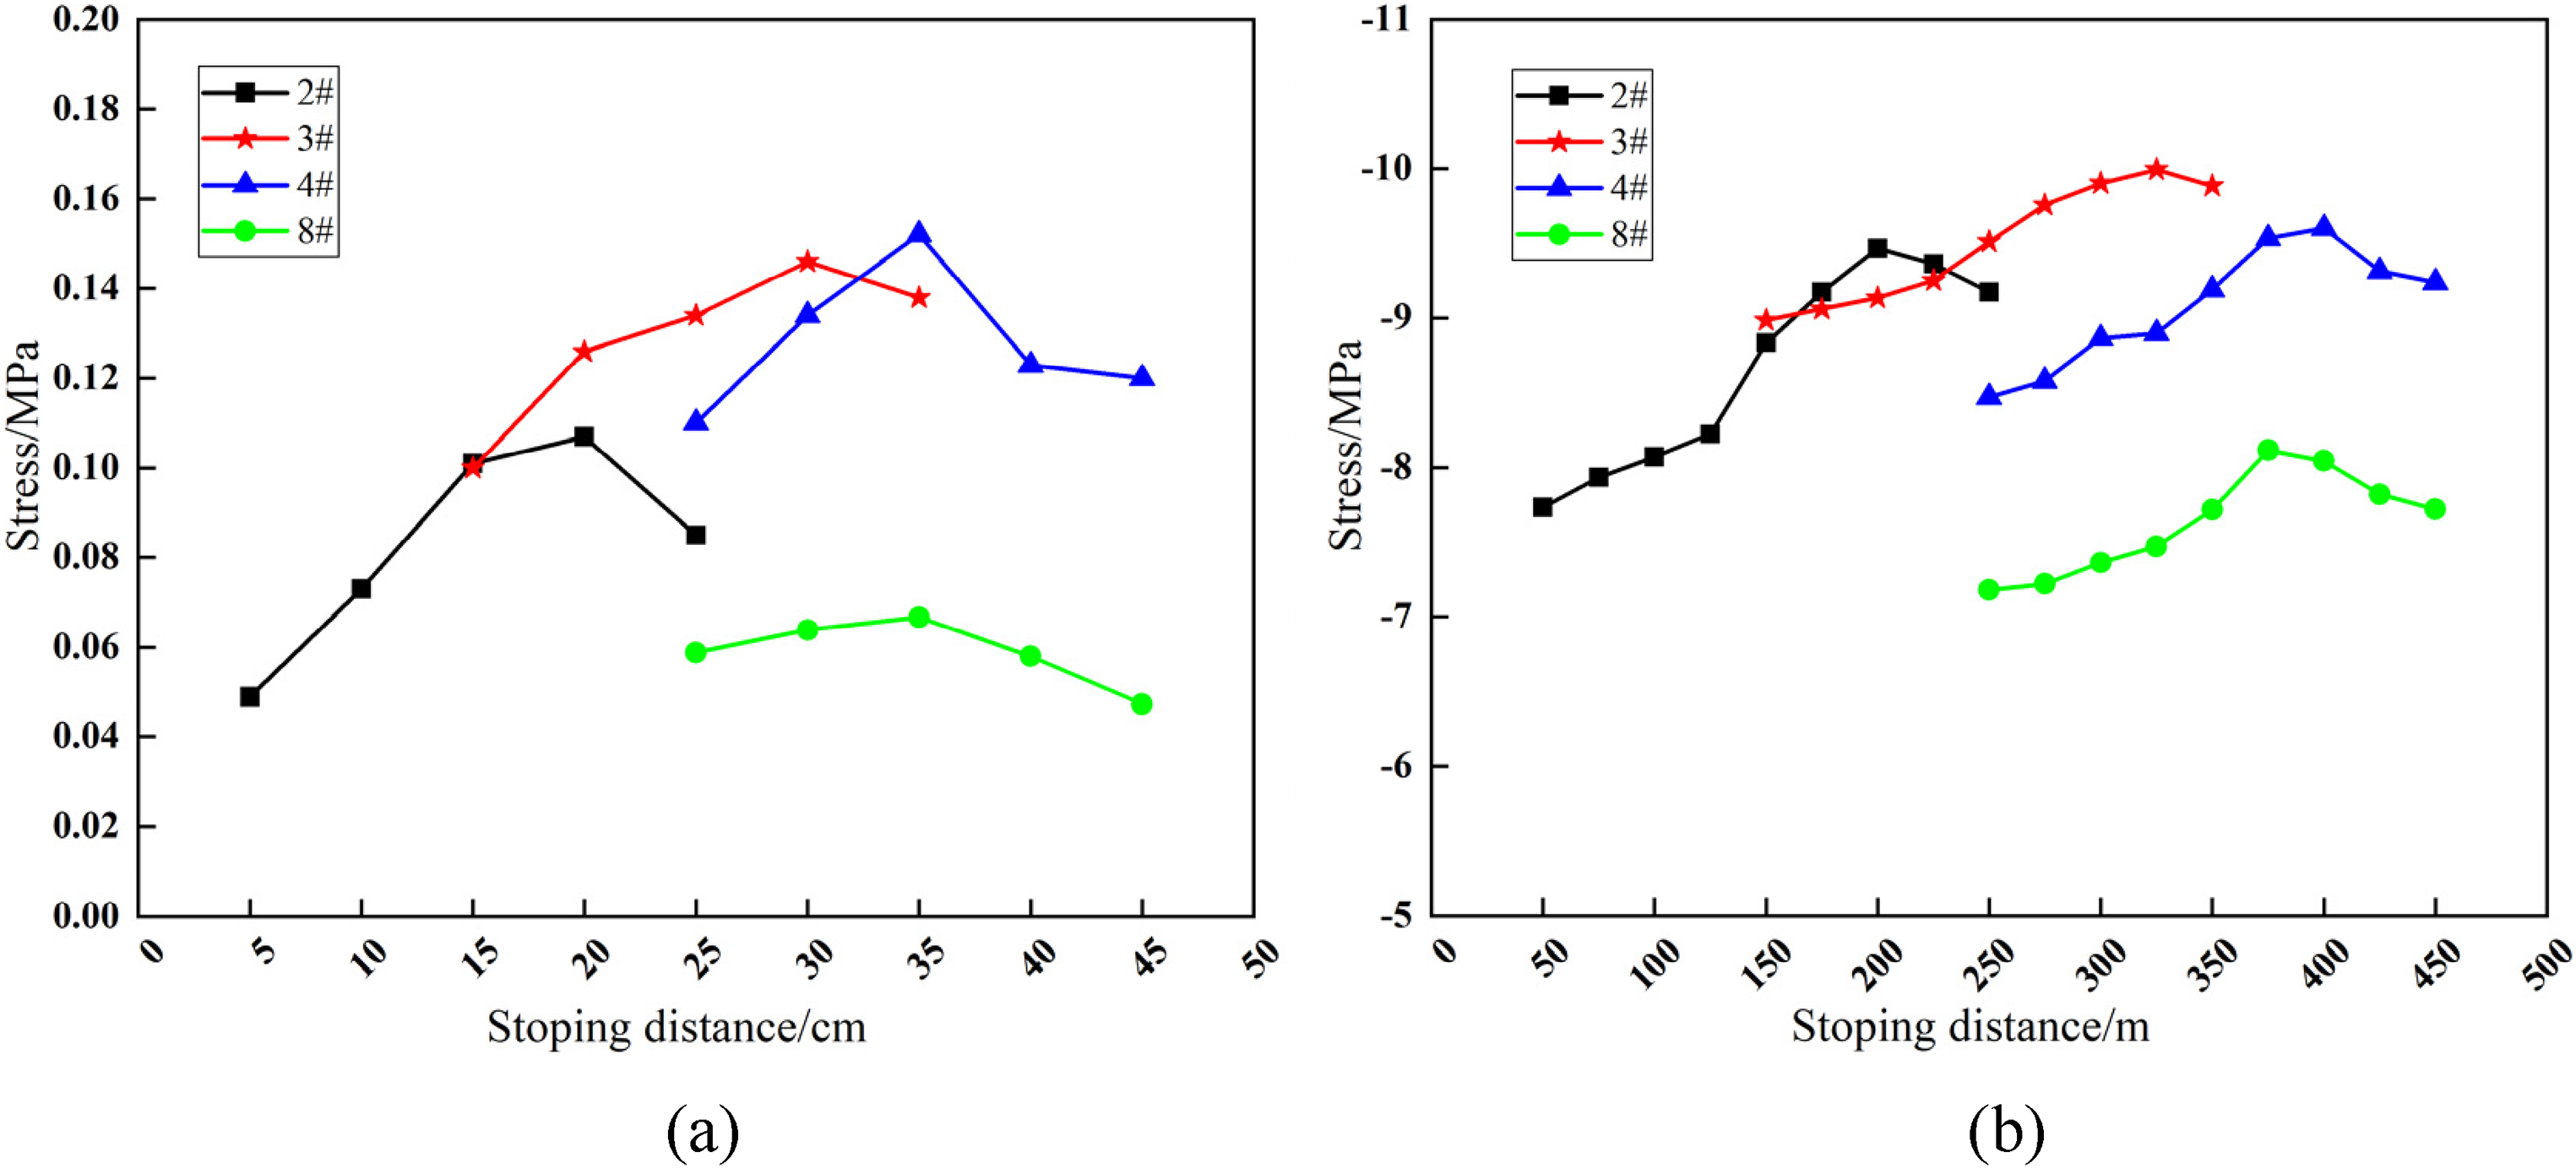
Schematic diagram of stress variation at different monitoring points. (a) Monitor station 4 (b) Monitor station 9.
To sum up, in the process of similar material simulation test and numerical simulation, the stress variation trend of all stress monitoring points in floor strata is similar, and the dynamic rate of stress variation of a few monitoring points is different due to the influence of test error. But on the whole, the stress increase or decrease rate of each monitoring point is basically the same, and the position of the extreme point is roughly the same. It shows that the two methods are used to reproduce the water inrush process of floor fracture structure, and the results are basically the same.
Research on early warning information of each physical field
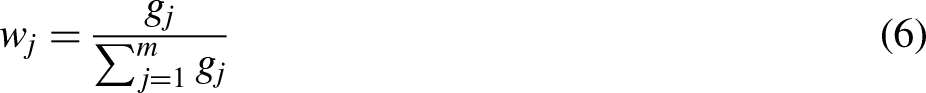
Based on the simulation test and numerical simulation results of similar materials, it can be concluded that: Affected by the disturbance of coal seam mining, physical quantities such as stress, water pressure and displacement of intact rock strata and faults in stope will change with the mining of working face. When the hydraulic connection is generated between the floor mining failure zone and the fault-confined water rising zone, the water inrush channel is formed and the water inrush accident occurs in the working face. Therefore, based on the experimental data obtained by numerical simulation, the weight value of each physical quantity of floor rock water inrush position and fault water inrush position in the process of working face mining is calculated, and the early warning information of floor fracture structure water inrush is put forward. Due to subjective factors that may lead to various index weighting errors occurring in the process of operation, compared with other multivariate information analysis method, the entropy method does not consider the number and practical significance of the index and uses the correlation and volatility between the internal data. Calculate the indicators that represent data confusion and determine the impact of each amount of information on the target. Therefore, in this study, the entropy method is used to calculate the weight value of each physical quantity in the working face mining process. The analysis and calculation process is as follows:
Due to the different unit dimensions of each physical quantity, the size of different index data is different, resulting in a deviation between the calculated weight value and the actual value. Before the analysis, according to the change trend of the index, the data are dimensionlessly processed by positive or negative.
Since the use of entropy method to calculate the weight of the data cannot be less than or equal to zero number. Therefore, the data after dimensionless processing are translated, that is, 0.00001 is added to all data values to ensure that the operation process of entropy method is continued. At the same time, it will not have a significant impact on the calculation results, as shown in Formula (1) and Formula (2).
Suppose that there are m schemes and n indexes in the expected target, and xij represents the jth index value in the ith scheme:

In the formula, Tij—the index value after dimensionless processing; max(xij)—The maximum value in the original index value; min(xij)—The minimum value in the original index value.
According to Formula (3), the degree of variation Pij of the jth index in the ith scheme is calculated, that is, the frequency of each index in different schemes is calculated:


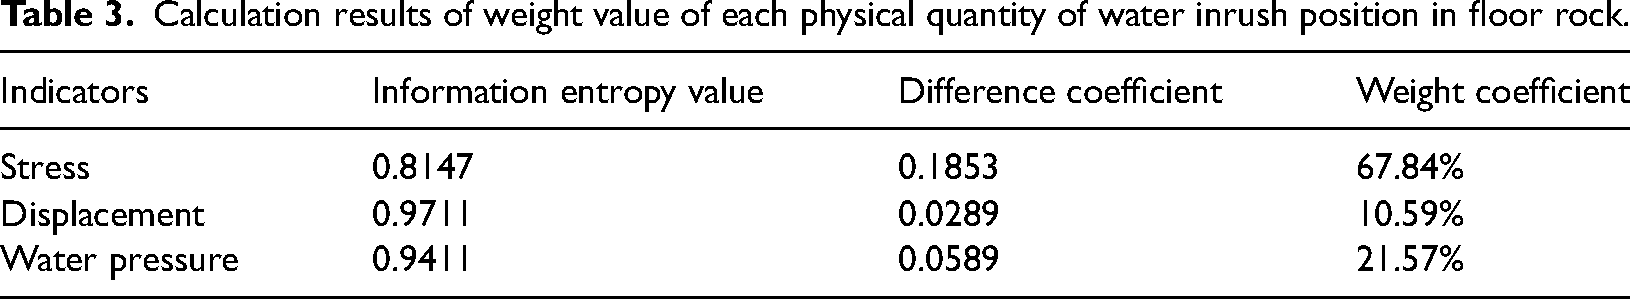
Calculation results of weight value of each physical quantity of water inrush position in floor rock.
Calculation results of weight value of each physical quantity of the through fault water inrush location.
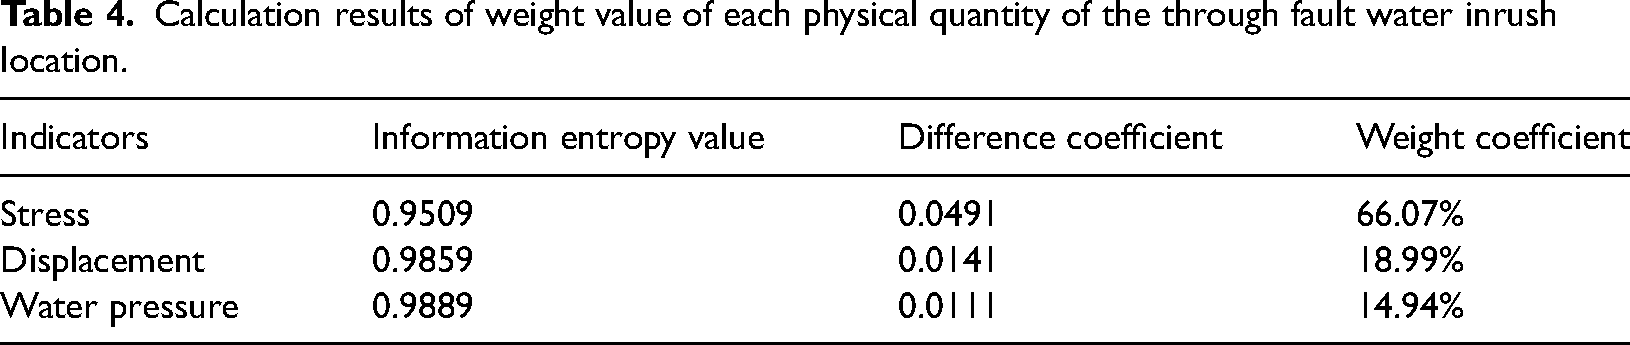
From the above calculation results and the variation law of each physical quantity of water inrush position, it can be seen that:
(1) In the process of water inrush from the working face to the floor fracture structure, the weight value of the stress proportion of the water inrush position of the floor rock stratum is the largest, and the weight value of the displacement generated by the rock mass is the smallest.
The stress on the location of water inrush is analyzed: when the working face is mined to 25–200 m, the stress of water inrush position increases gradually due to the influence of mining stress, and the increase rate is 0.0009. When the working face is mined to 200–325 m, the stress of the water inrush position increases rapidly, and the increase rate is 0.0045, indicating that with the advance of the working face, the complete rock layer of the floor is continuously damaged under the action of advanced compression. The damage area is at the front end of the working face, and the damage depth remains basically unchanged. When the working face is mined to 325–400 m, the stress value of the water inrush position continues to increase, and the increase rate is 0.0098. It shows that when the working face is mined to 325 m, the advanced compression zone of the floor begins to act on the water inrush position, the rock mass is gradually destroyed, and the increase rate of the stress is increased by 2.17 times.
The displacement generated by the water inrush position is analyzed: when the working face is mined to 25–200 m, the water inrush position will produce a small downward displacement under the action of mining stress, ground stress and its own gravity, and the displacement is kept at about 0.012 m. When the working face mining to 200–325 m, due to the water inrush position by the slow increase in stress, the displacement also gradually increased, the rate of increase is 0.0001. When the working face is mined to 325–400 m, because the advance compression zone begins to act on the water inrush position, the rock mass is gradually destroyed, and the displacement generated also increases. The increase rate is 0.0002, and the increase rate of displacement increases by two times. At the same time, the displacement of rock mass provides space for water flow.
Analyze the water pressure at the location of water inrush: When the working face is mined to 25–225 m, the water pressure value at the water inrush position increases slowly with an increase rate of 0.0006, indicating that due to the stress redistribution in the stope, the through fault is gradually activated. The complete rock layer above the aquifer also gradually develops a confined water lift zone, and the water gradually flows upward along with the cracks generated by the rock mass. When the working face is mined to 225–325 m, the increasing rate of water pressure at the water bursting position also increases to 0.0025 because of the increasing displacement of rock mass. When the working face mining reaches 350–400 m, due to the gradual failure of rock mass, the water inrush channel is generated, and the water pressure at the water inrush location increases rapidly with an increase rate of 0.011, and the increase rate of the water pressure increases by 4.4 times.
(2) In the process from the beginning of mining in the working face to the water inrush in the floor fault structure, the weight value of the stress proportion of the through fault water inrush position is the largest, and the weight value of the water pressure proportion is the smallest.
The stress on the location of water inrush is analyzed: when the working face is mined to 25–250 m, the stress value on the location of water inrush increases slowly with an increase rate of 0.0029, indicating that under the influence of the disturbance of coal seam mining, the fault is gradually activated from the bottom to the top, and the stress on the fault of coal seam floor increases. When the working face mining reaches 250–425 m, the stress on the water inrush location increases rapidly with an increase rate of 0.0057, indicating that as the working face mining approaches the fault, the advanced compression zone of the floor will also gradually act on the fault, resulting in a sharp increase in the stress on the fault.
The displacement generated by the water inrush position is analyzed: when the working face is mined to 25–250 m, the water inrush position produces a downward displacement, and the increase in the displacement is relatively slow, showing a fluctuation change, and basically keeps at about 0.012 m. When the working face is mined to 250–425 m, the displacement generated by the water inrush position increases rapidly, and the increase rate is 0.0001, indicating that the fault activation rate increases and continues to be damaged due to the influence of mining stress and aquifer water pressure.
The water pressure of the water inrush position is analyzed: when the working face is mined to 25–300 m, the water pressure value of the water inrush position increases rapidly, and the increase rate is 0.0064, indicating that with the continuous forward mining of the working face, under the combined action of mining stress and water pressure, the fault continues to activate upward, and the confined water gradually flows upward along with the fault. When the working face is mined to 325–425 m, the increase rate of water pressure value at the water inrush position is reduced to 0.003, indicating that the complete rock strata around the fault gradually produce cracks, resulting in hydraulic connection between the fault confined water conduction zone and the complete rock strata failure zone of the floor, and gradually form a water inrush channel.
To sum up, in the process from the beginning of mining in the working face to the water inrush in the fault structure when the stress of the rock mass reaches the flow limit, the rock mass is destroyed, and the displacement of the rock mass provides space for the flow of water. Under the action of confined water pressure, the water in the aquifer flows upward along with the fracture of the rock mass, and the mining fracture is generated between the fault and the floor failure zone. After the hydraulic connection between the two, the water flows into the working face and the water inrush accident occurs. Before the water inrush accident occurs, the water inrush position of floor rock strata and the water inrush position of through fault are pregnant with the characteristics of early warning information: When the working face is mined to about 325–400 m, the stress, water pressure and displacement at the water-inrush position of floor strata increase abruptly. The stress increase rate increases by 2–3 times, the water pressure increase rate increases by 4–5 times, and the displacement increase rate increases by two times. All physical quantities reach the peak in a short time. When the working face is mined to 250–425 m, the stress and displacement of the through-fault water inrush position increase rapidly, and the growth rate of the water pressure decreases. At this time, the through fault is gradually activated, and the complete rock strata around the fault gradually produce cracks.
The fluctuation of stress in each water inrush position dominates, and the weight values of stress are basically consistent. Compared with the water inrush position of the floor strata, the through fault water inrush position has a longer time to pregnant the early warning information, which is easier to capture during the mining process of the working face. The through-fault water inrush position is affected by the fault activation, and the weight value of the proportion of water pressure is lower. However, when the increase rate of water pressure decreases, it indicates that the complete rock strata around the fault begin to produce cracks and gradually form water inrush channels.
Conclusions
Monitoring data of physical quantities at each water bursting position based on similar material simulation test: When the working face is mined to 35–45 cm, the abnormal fluctuation of the precursor characteristics appears in each water inrush position. Among them, the stress on the water inrush position of the floor rock layer decreases sharply, and there is a sudden minimum peak value, followed by a step jump change, and the water flow shows a stable increase-sudden increase.
Based on the monitoring data of the physical quantities of each water inrush location in the numerical simulation process: In the stage of impending water inrush at the working face, the physical quantities at the position of water inrush reach the peak value, and the stress and water pressure at the position of water inrush in floor rock strata change more strongly. It shows that the response characteristics of each physical quantity in the floor rock layer to water inrush are more obvious, and it is more suitable as the early warning information of water inrush in fracture structure.
The entropy method is used to calculate the weight value of the physical quantities at each water inrush position during the mining process of the working face, and the fluctuation of the stress at each water inrush position dominates. When the working face is mined to about 325–400 m, the increase rate of stress in the water inrush position of the floor rock layer increases by 2–3 times and reaches the peak in a short time. When the working face is mined to 250–425 m, the growth rate of water pressure on the through-fault water inrush position decreases. At this time, the complete rock strata around the fault begin to produce cracks and gradually form water inrush channels.
Footnotes
Acknowledgements
The project was supported by the National Natural Science Foundation of China (41902254), the Ecological Wisdom Mine Joint Fund of the Natural Science Foundation of Hebei province (D2020402013) and the key R & D project of Hebei Province (21373901D).
Declaration of conflicting interests
The author(s) declared no potential conflicts of interest with respect to the research, authorship, and/or publication of this article.
Funding
The author(s) received no financial support for the research, authorship, and/or publication of this article.