
Abstract
Ensuring shaft safety is critical in the process of coal mining. During coal mining in the Guotun coal mine, Shandong Province, China, issues, such as shaft deflection, tank channel and shaft deformation, and tank jamming, which did not appear in the shaft before, brought huge hidden dangers to safety. In this study, a set of three-dimensional analog simulation systems for assessing the influence of mining on shaft deflection was designed by using penetration force simulations of gravity fields. In this system, electromagnetic displacement meter is used to collect surface settlement data, which verifies the feasibility of using hydraulic pillow to simulate formation disturbance caused by coal mining. the strain of the shaft is measured by optical fibers and strain gauges, and the amount that mining influenced the deflection of the shaft is obtained. The results show that there is an approximately positive linear correlation between the horizontal displacement of the shaft caused by mining and the mining thickness of the coal. The horizontal displacement of shaft caused by coal mining is inversely proportional to the moving Angle within a reasonable range. The horizontal displacement of shaft is affected by mining mode, and symmetrical mining can significantly reduce the horizontal displacement of shaft. The horizontal displacement of the shaft at different depths caused by mining decreases with increasing shaft depth, which is the main cause of shaft deflection.
Keywords
Introduction
Coal mining is advancing to the deep gradually, and the shaft in deep soil plays an important role in coal mine production (Chen et al., 2012; Diering, 1997; He, 2006, He and Qian, 2006; He et al., 2005; Luo et al., 2022; Wang, 2010; Xie, 2019; Yu, 2012). In recent years, a new form of failure, called shaft deflection, has appeared in the shaft of deep soil mining areas in China. The main shaft and auxiliary shaft of the Guotun coal mine which have crossed 600 m of soil in the Juye mining coalfield are used as a case study to find the maximum deflection of the main shaft and auxiliary shaft reach 359 mm and 322 mm respectively, which has led to the danger of mine production. Therefore, it is urgent to study the deflection law of shafts in deep soil strata.
To study the problem of shaft deflection in deep soil. Han et al. (2019a, 2019b) established a three-dimensional dynamic prediction model for predicting shaft movement using the probability integral method and time function, based on the mining subsidence theory. According to the prediction model, it is analyzed that the main cause of shaft deflection in deep soil is coal mining. Based on the mining subsidence theory and soil consolidation theory, Cheng et al. (2022) give the calculation formula of overburden movement and deformation under the joint action of coal mining and bottom water drainage in deep soil according to the superposition principle, revealing the shaft deflection mechanism under the joint action of asymmetric mining of thick loose layer and thin bedrock and bottom water drainage, and indicates that the bottom water drainage caused by coal mining is the main cause of the shaft deflection. The above theories are based on the probability integral method to explain the deflection mechanism of asymmetric mining of shafts in deep soil. However, the probability integral method assumes that the stratum is an isotropic, mean, and discontinuous medium. However, the actual stratum situation is more complex. Therefore, there will be errors in the shaft deflection law obtained by the probability integral method.
Han (2021) used ANSYS to study the process of coal seam mining affecting stratum movement. and obtained the variation law of shaft deformation with main influencing parameters such as rock pillar size, coal mining thickness, soil layer thickness, and elastic modulus. Because it is difficult to obtain the deep formation parameters and the deep environment is complex, the numerical simulation results may be far from the actual situation.
Compared with analytical analysis and numerical simulation, similarity simulation is an effective research method for rock mass engineering problems. Peng (2019) used the plane strain similarity model to study the surface subsidence law under the joint action of coal mining and bottom water drainage and predicted the shaft deflection law of vertical shaft by preset survey lines; Han (2021) completed a similar simulation of shaft deformation under the condition of asymmetric mining of thick soil with a similarity ratio of 1: 1,200 based on the method of seepage hydraulic simulation gravity field and obtained the shaft deformation law under the condition of Asymmetric mining of coal. Summarily, some achievements have been obtained in the deflection mechanism of shafts in deep soil, which have significantly promoted our recognition of the deflection mechanism of shafts in deep soil. However, there is no similar simulation study on the shaft deformation law of shafts in deep soil under the condition of symmetrical mining, and the law of shafts in deep soil affected by symmetrical mining is still unclear.
Although the seepage hydraulic simulation can realize the similarity test with a large similarity ratio, the larger the similarity ratio also means the rougher results. Using the seepage hydraulic simulation method to study the shaft deformation law of the whole geological background accurately under the condition of symmetrical mining means that a larger test device is needed to carry out the test. In this paper, based on the engineering background of the shaft in deep soil in the Zhaolou coal mine, Juye coalfield, using the “Kilometer Topsoil Freezing Method Sinking Simulation Test System” of the China University of Mining and Technology, the 1: 1,000 similarity simulation based on seepage hydraulic simulation method was realized, a more precise similar simulated surface displacement measurement system was designed; the influence of different mining methods on the surface settlement was obtained, and the influence law of symmetrical mining on shaft deformation in deep soil was obtained. The influence of different mining methods on shaft deflection was quantitatively analyzed, which is related to the design of shaft protective coal pillars.
The experiment design
Basic principle of permeability method
Hydraulic permeability model tests can simulate a multifold gravity field by providing volume force through water seepage to increase the effective gravity stress in soil (Yuan et al., 2016; Zelikson, 1969).
The size of the seepage force is proportional to the hydraulic gradient, and the direction is parallel to the streamline direction, consistent with the direction of gravity. The seepage force is volumetric, and its magnitude can be expressed as follows:

Figure 1 shows the principle of the seepage force model test. i is the vertical hydraulic gradient of downward seepage, and

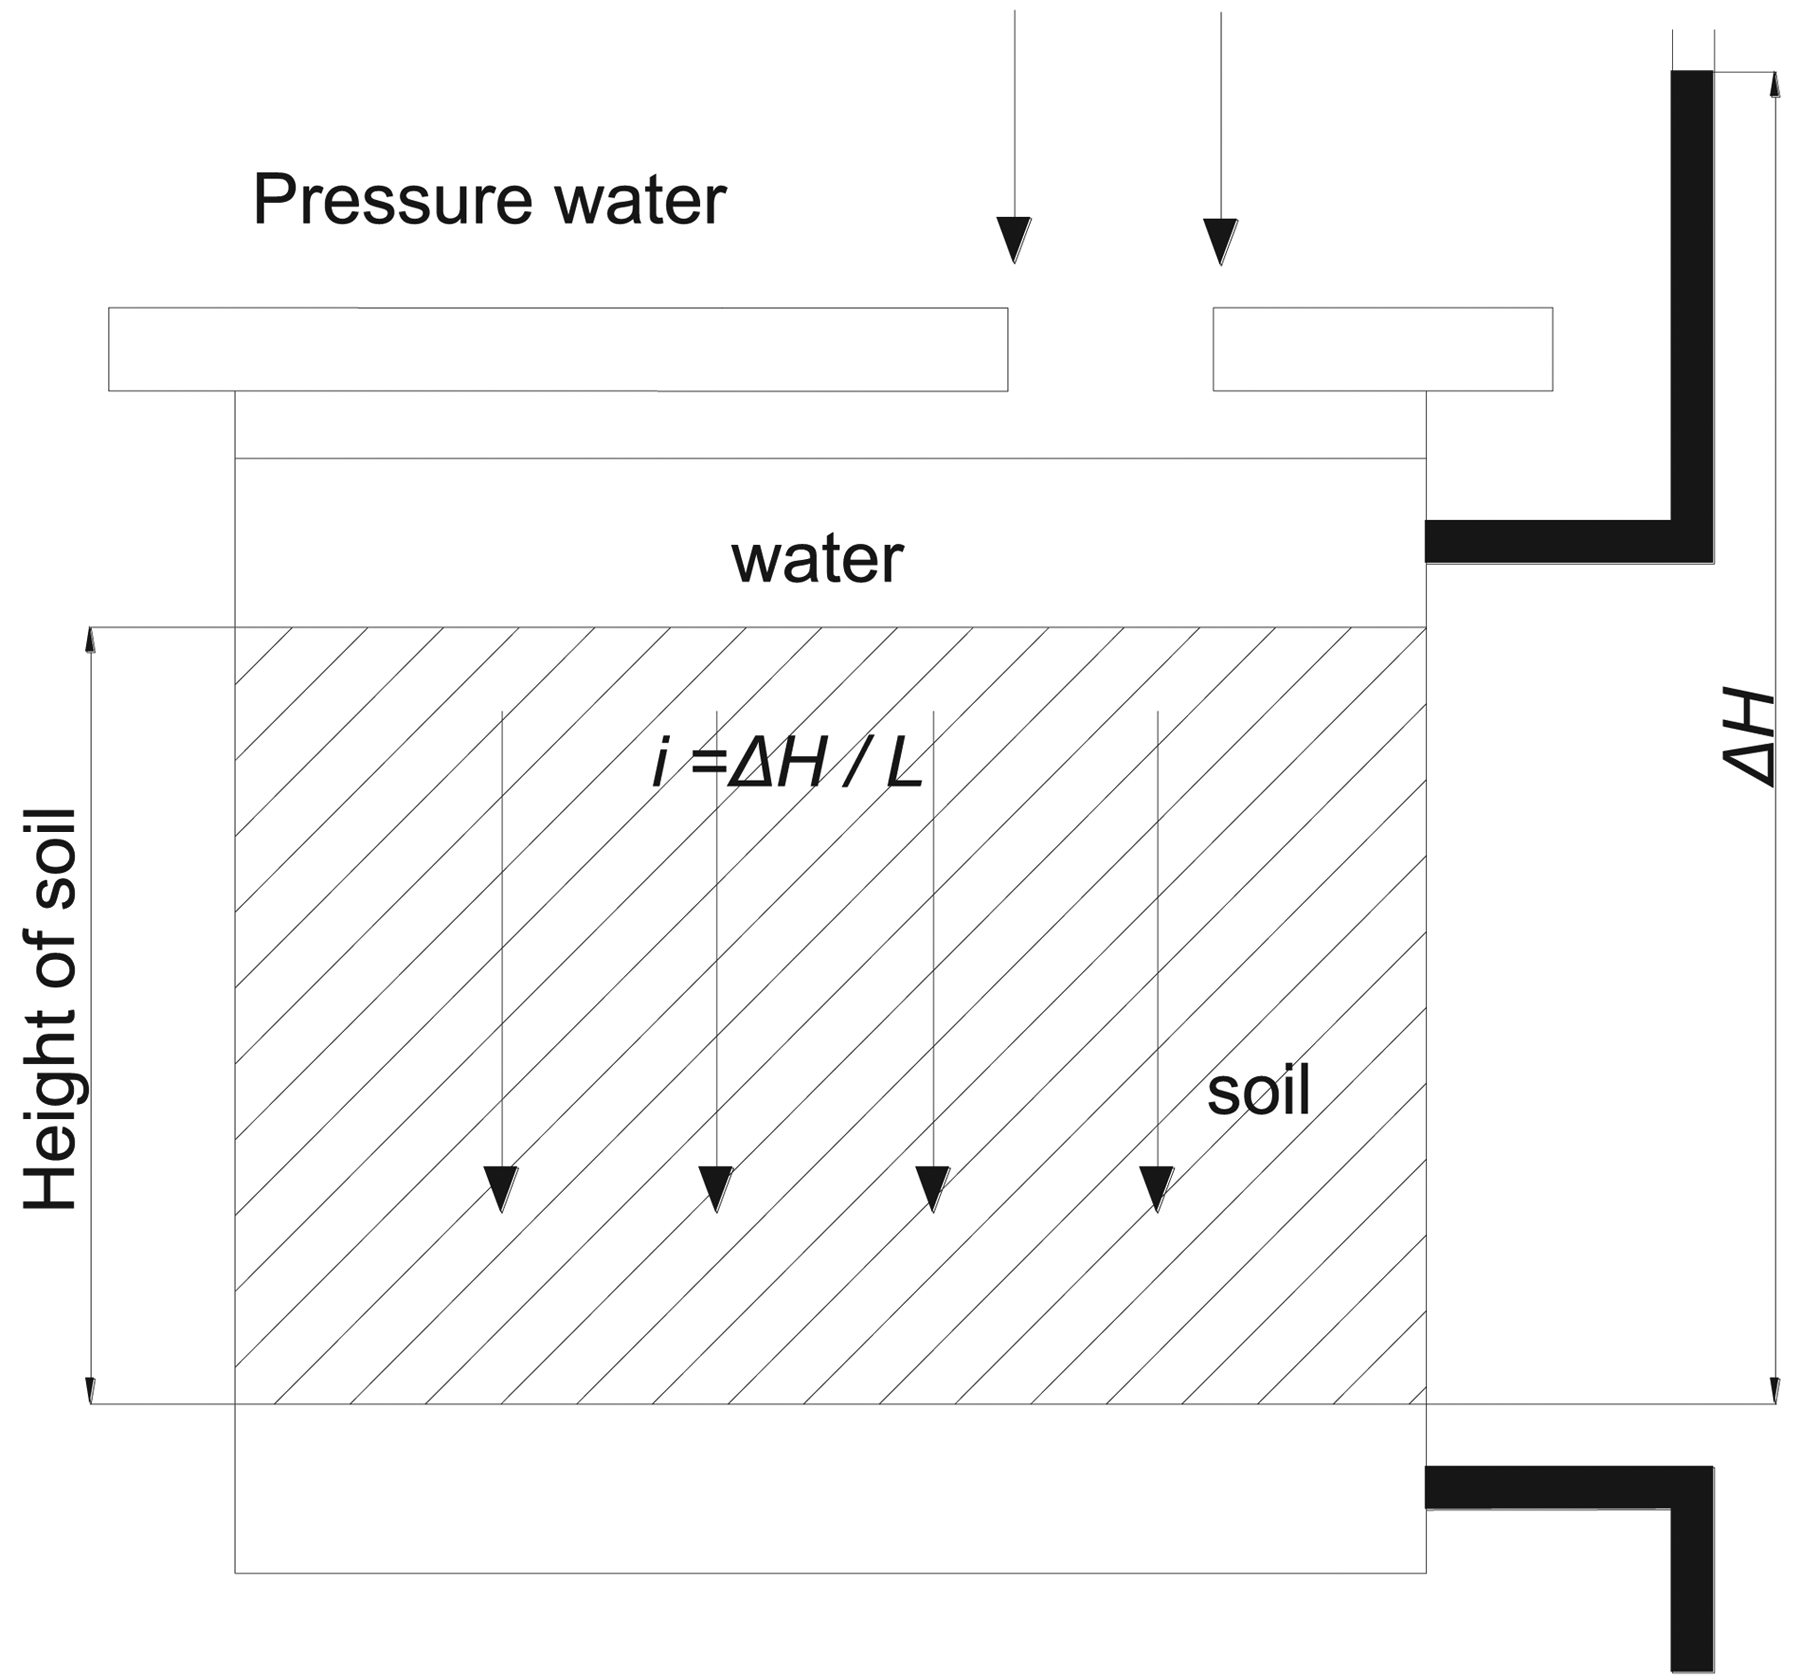
Schematic of the hydraulic gradient model test.
The gravity stress at depth


Hydraulic gradient calculation
According to the effective space of the testbed and the actual situation of the Zhaolou Coal mine, the similarity ratio of the model is determined as 1: 1,000. Seepage hydraulic model tests can simulate a multifold gravity field by providing volume force through water seepage to increase the effective gravity stress in soil. When the prototype material is used as the model stratum in the test, the dimensionless criterion is always satisfied.

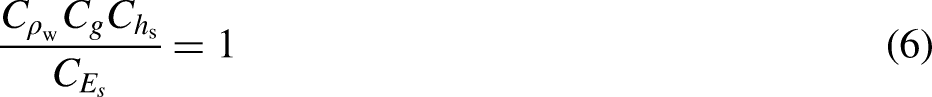
Substitute equation (5) into (6)
The vertical effective stress of the model stratum at depth

The value of

Introduction of similarity simulation test system
Seepage pressurization system
The pressurizing system adopted in the test is “eight-channel ultra-high pressure servo pressurizing and stabilizing system”, and its working principle is shown in Figure 4. The output pressure of the system is 0∼80 MPa, and the pressure control precision is ± 0.5% in the process of loading and unloading, and ± 0.25% in the stage of stabilizing. The system can use computer servo control to continuously pressure, pressure relief and pressure stabilization in the pressure output range, which can meet the test requirements (Figure 2).
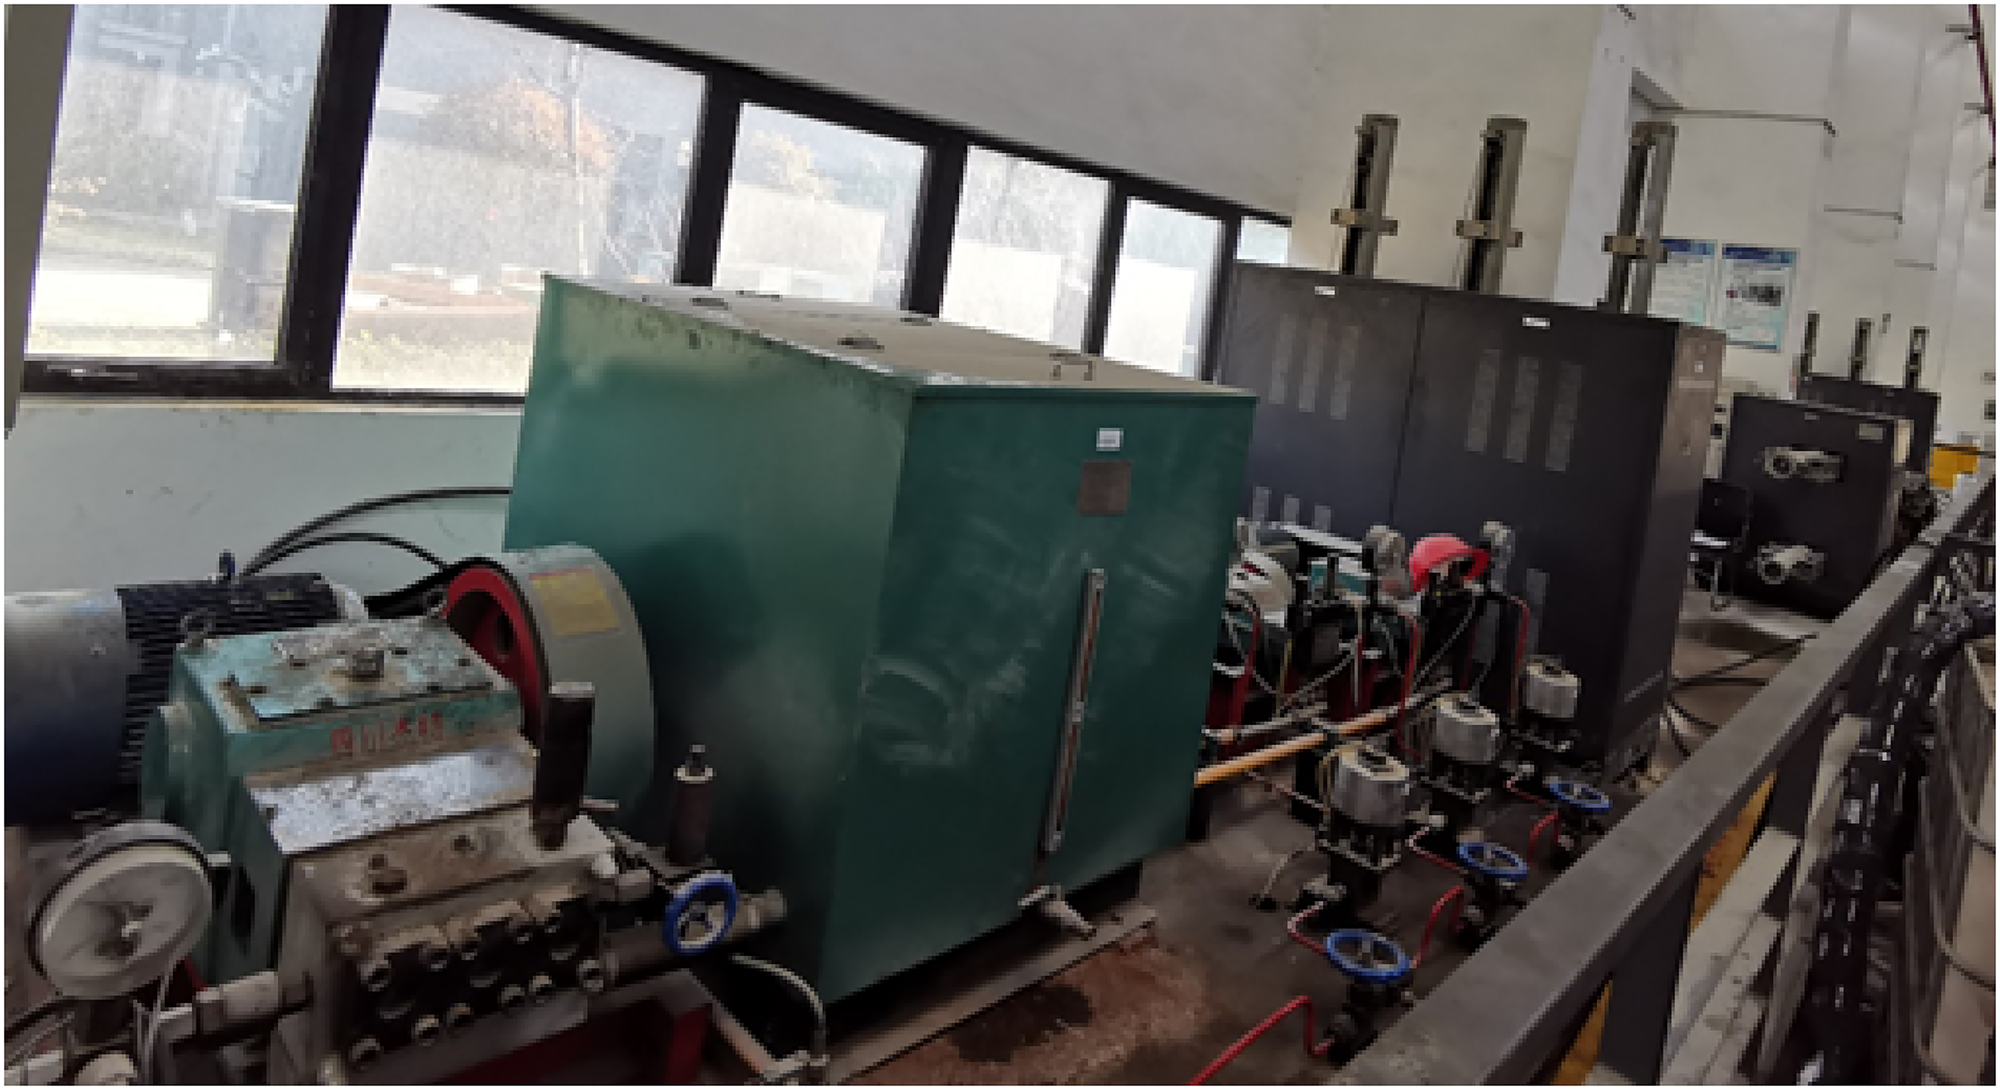
Compressing and stablizing system under computerized control.
Hydraulic pillow.
Test bed
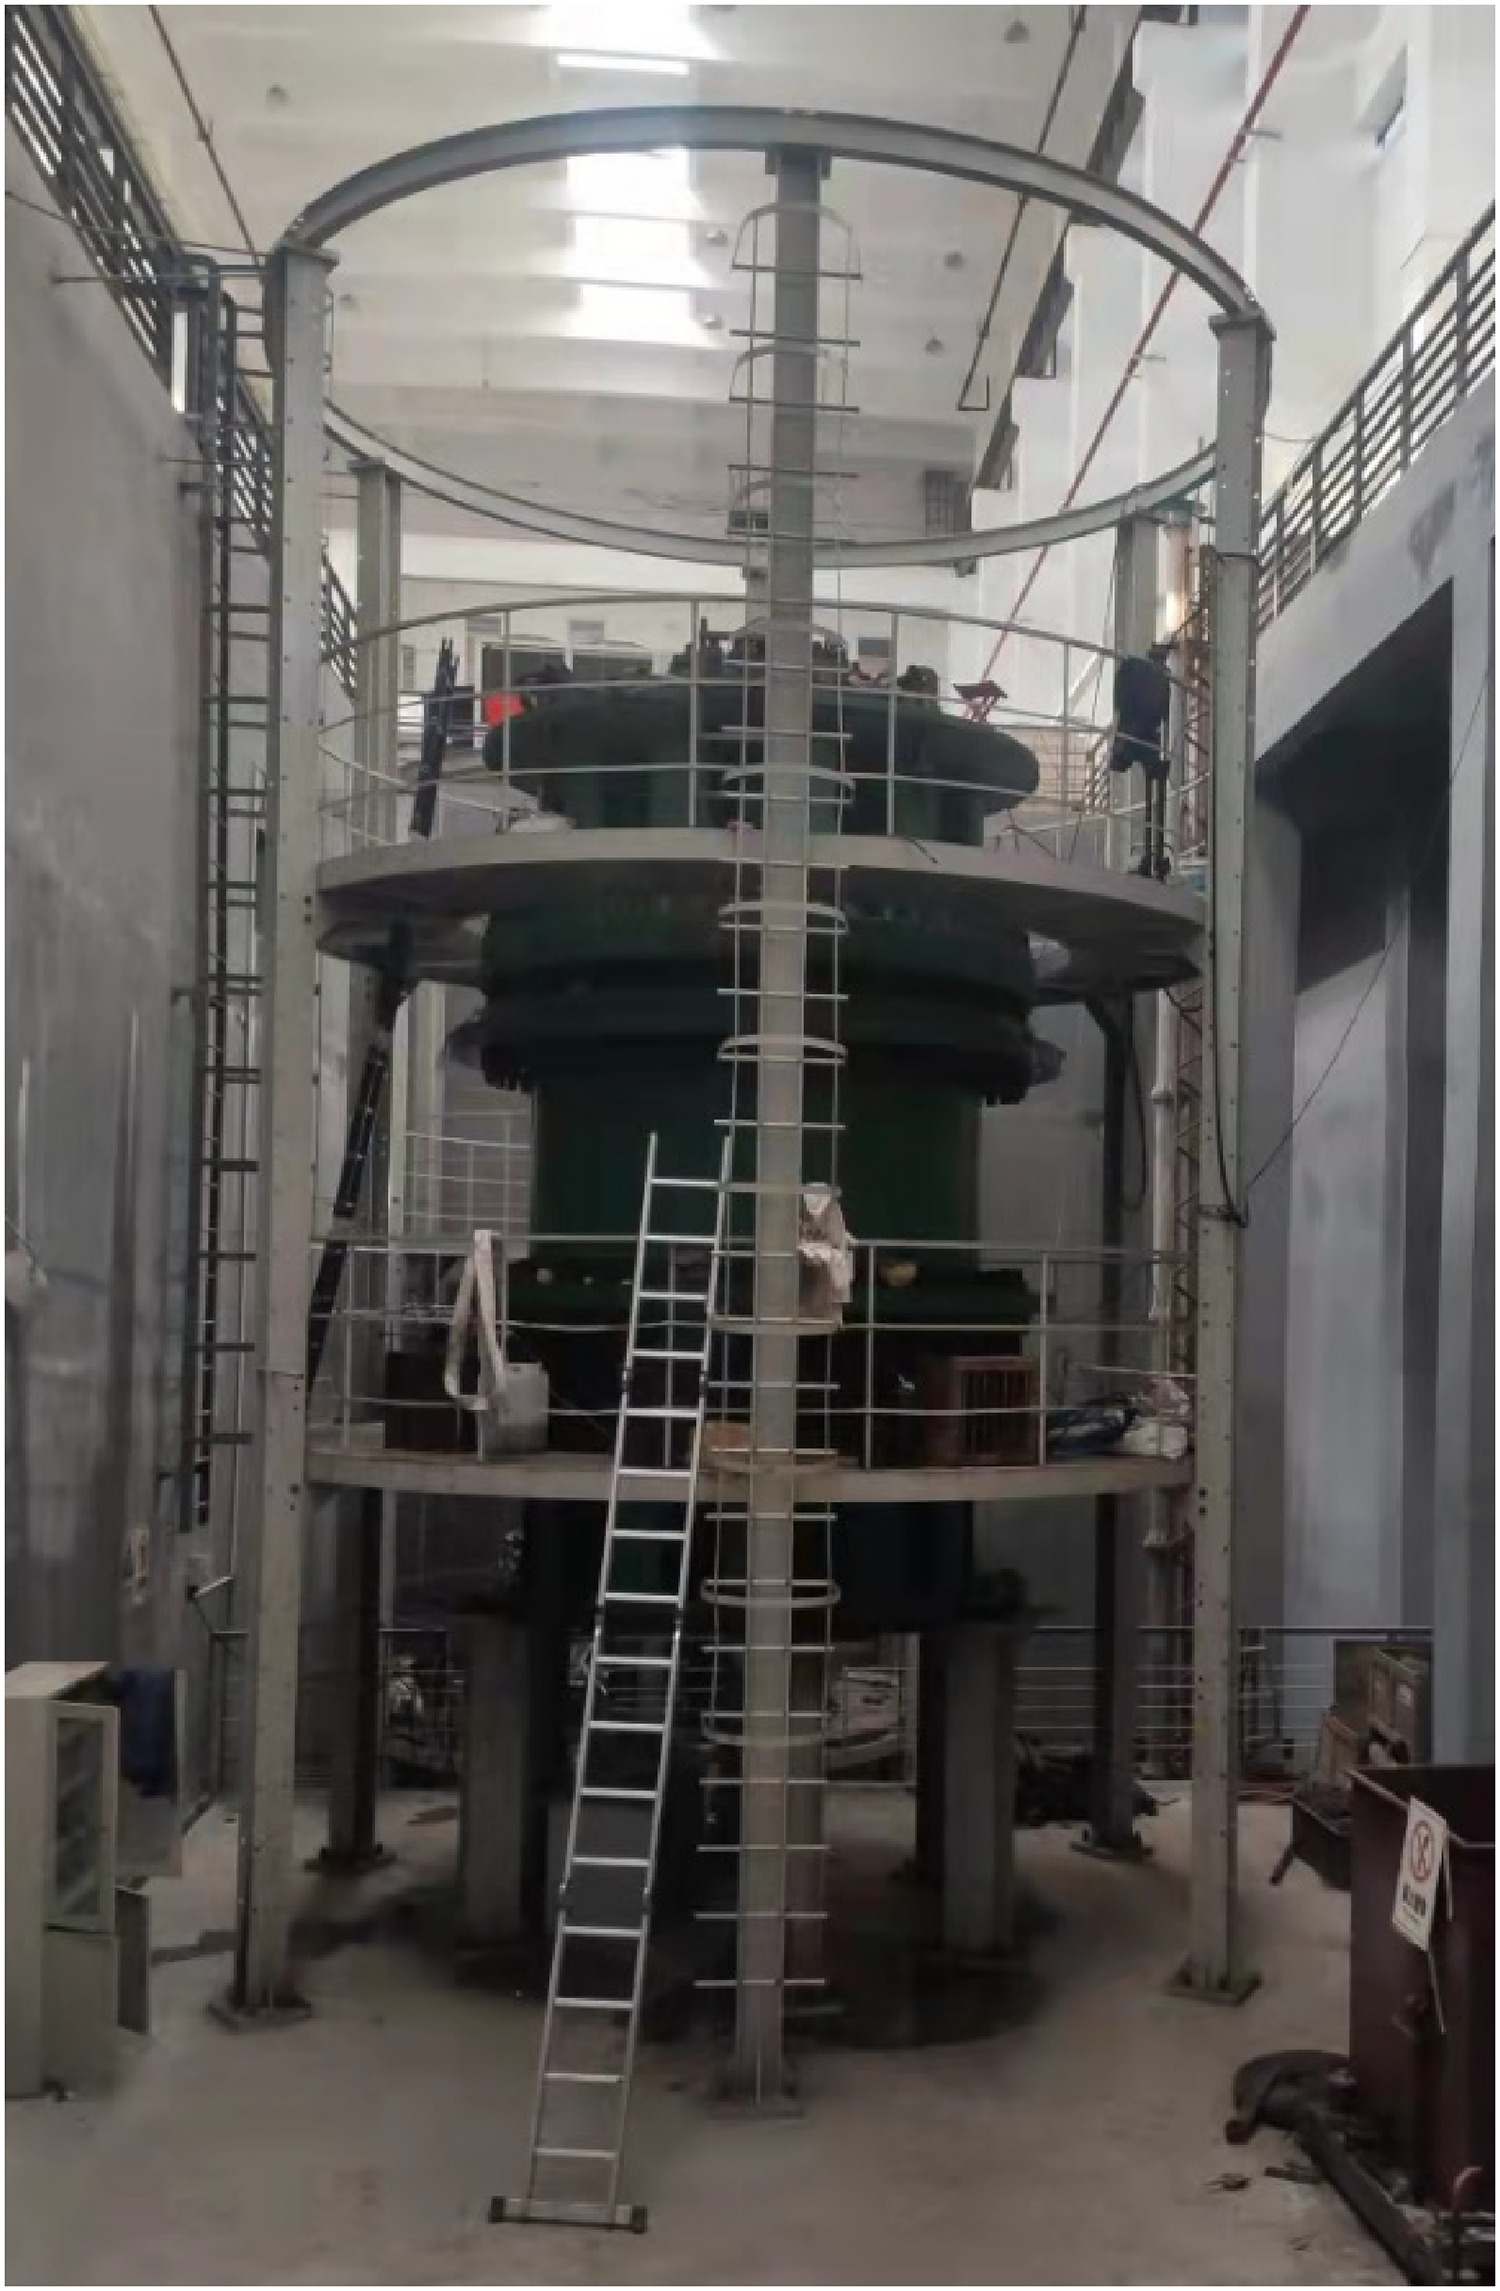
The model test was carried out with the “ Simulation test system for shaft sinking with kilometer scale-topsoil freezing method “ of state Key Laboratory of Deep Geomechanics and Underground Engineering, China University of Mining and Technology. The test bed is shown in Figure 3.
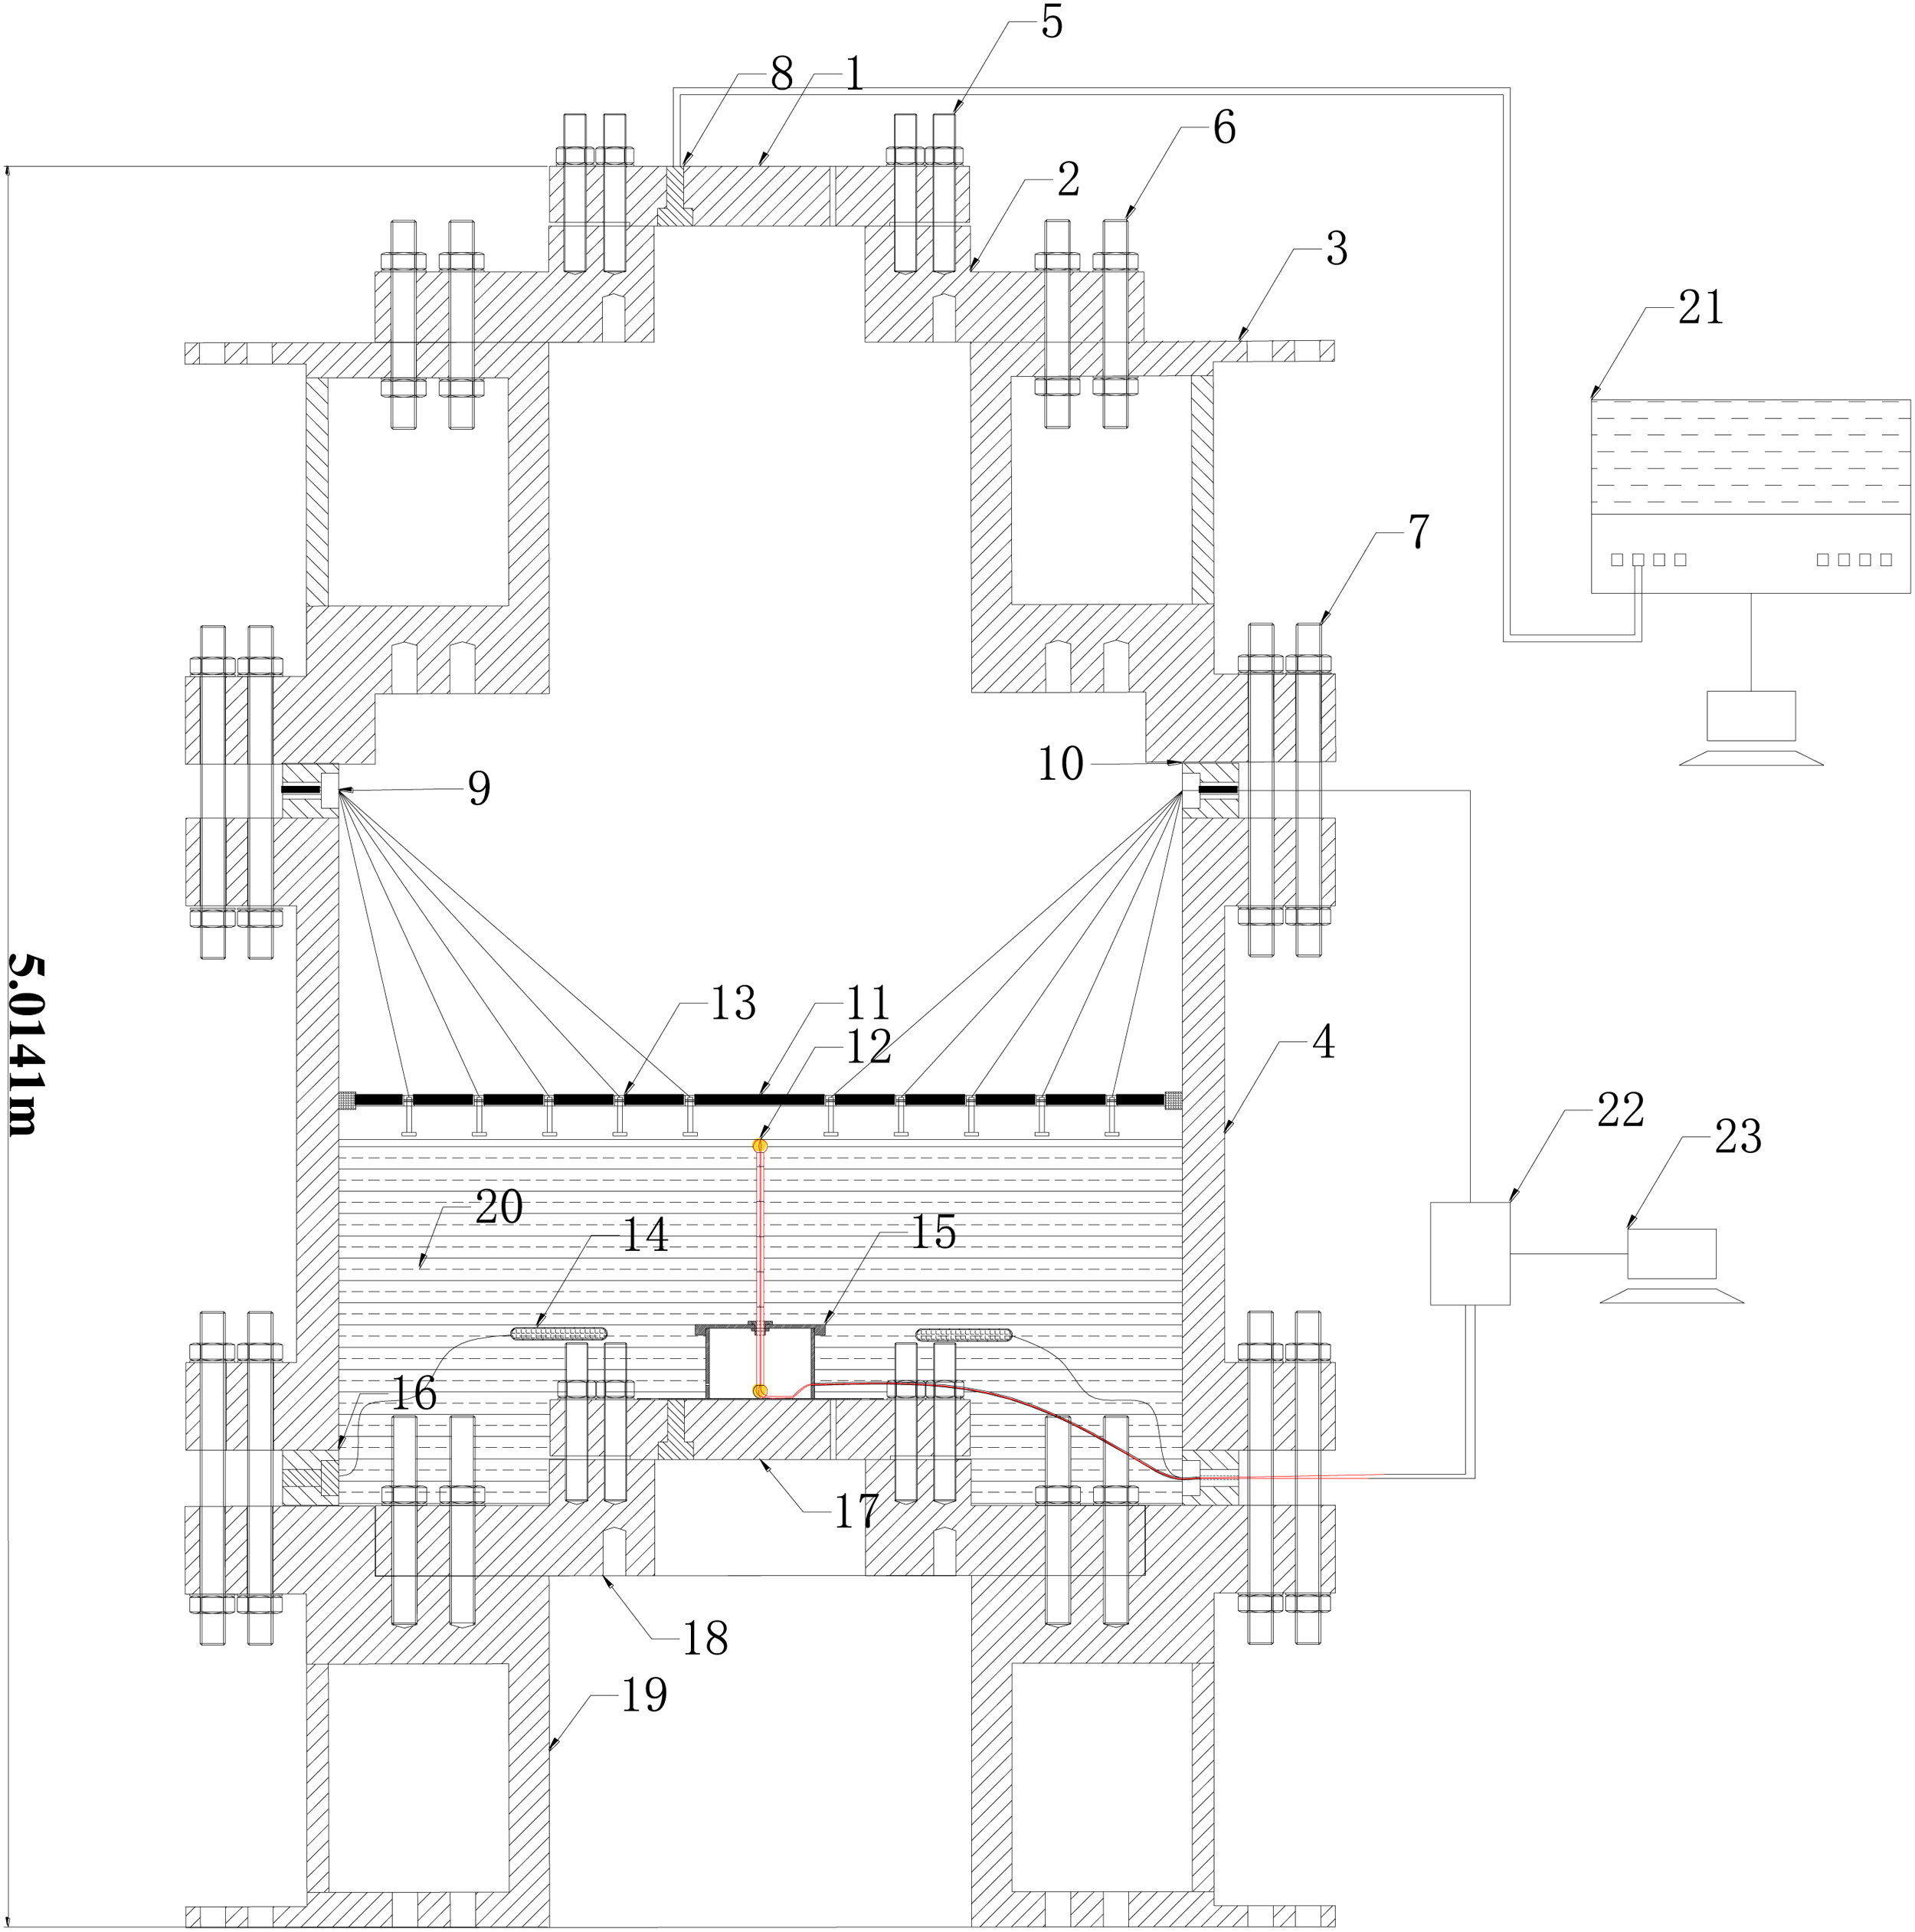
The schematic diagram of the equipment of physical simulation experiment. 1- Upper closure cap; 2- Upper reducing ring; 3- Upper cover plate; 4- Test cylinder; 5-M64 Stud bolt; 6- 72*590 Stud bolt; 7-M72*950 Stud bolt; 8- Plug bolt; 9- Routing bolt; 10- Upper backing plate; 11- isplacement sensor holder; 12- Model shaft; 13- Displacement sensor; 14- Hydraulic pillow; 15- Model haft protection device; 16- Lower backing plate;17- Lower closure cap; 18- Lower reducing ring; 19- Lower over plate; 20- Simulated soil layer; 21- loading system; 22- Acquisition instrument; 23- Computer.
Mining loading device
Hydraulic pillows were used to simulate bedrock disturbance cause by coal mining. First, we installed the hydraulic pillow to the testbed set position, inputted oil into its cavity body to its its cavity to the design height, and finally closed the oil valve. Seepage pressure was applied using a pressurizing system after filling. Then, we opened the oil transfer valve and recorded the oil transfer volume when the seepage field was stable. Therefore, the model test of strata mining subsidence is realized by oil return (Figure 4).
Monitoring system
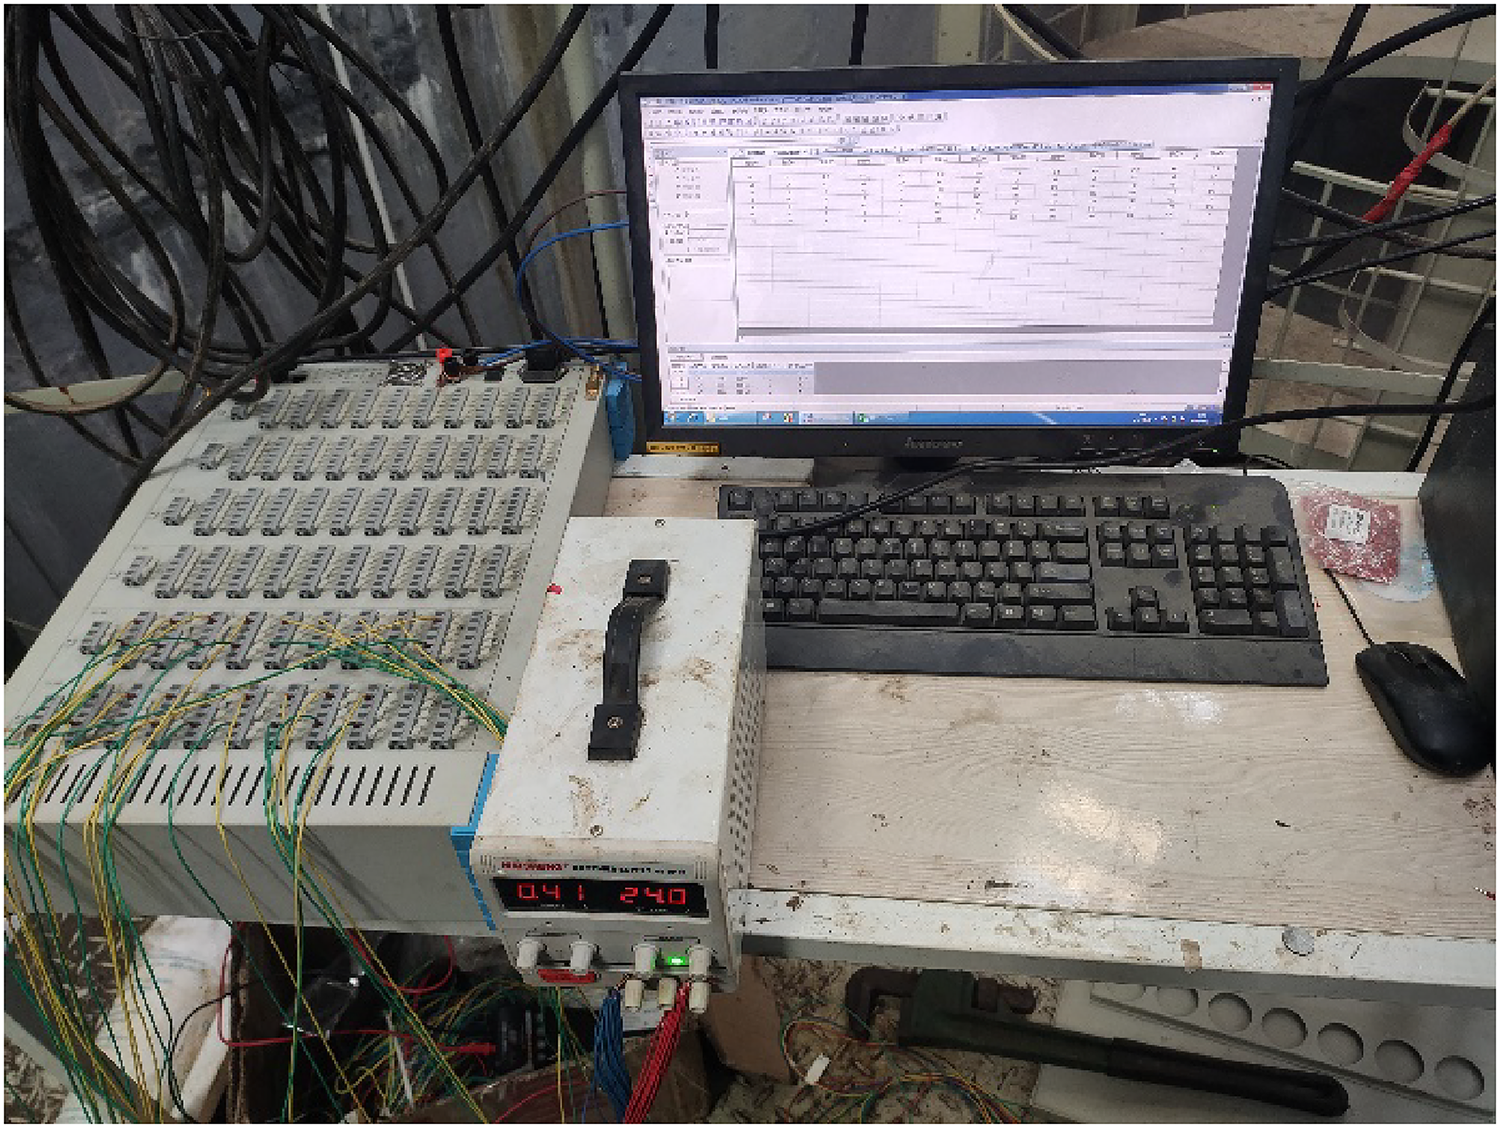
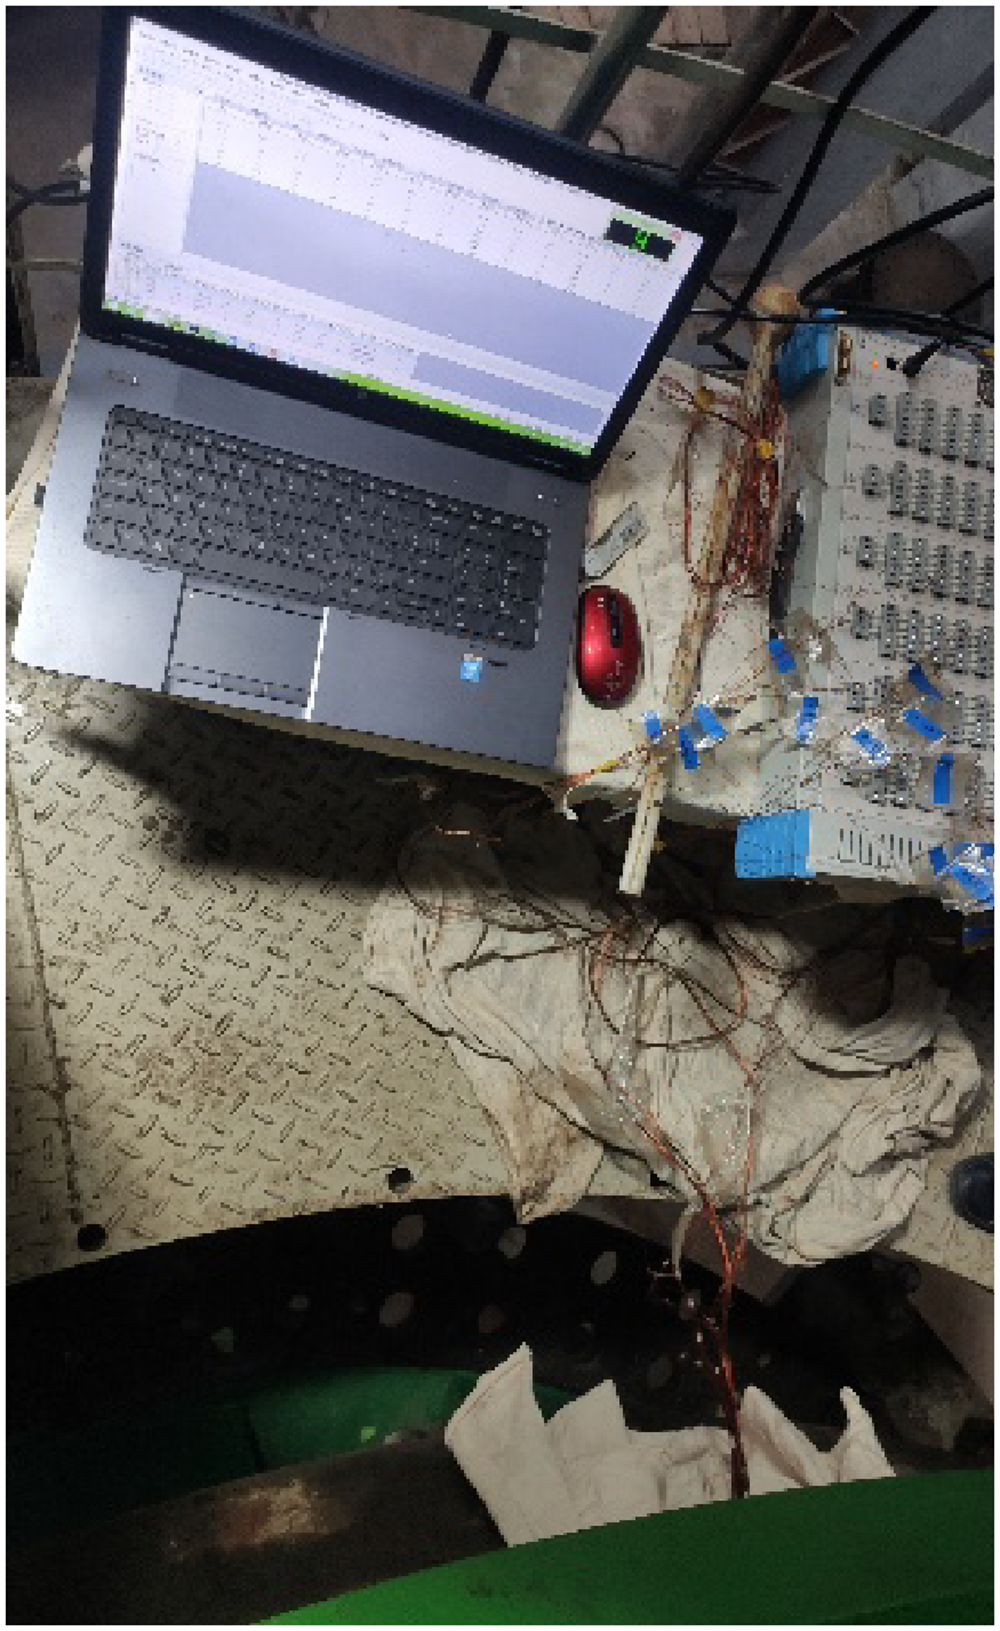
The test system is mainly divided into two parts: the surface subsidence monitoring and the horizontal movement monitoring of the model shaft. 16 displacement sensors were used for surface subsidence monitoring, and the output is voltage signal. The strain of each point in the model shaft were monitored by resistive strain gauge and distributed optical fiber, and the horizontal movement of each point were calculated by strain. Static strain collector was used to collect voltage and resistance signals, and optical fiber strain data was collected by ODISi-A optical fiber acquisition instrument (Figures 5 and 6).
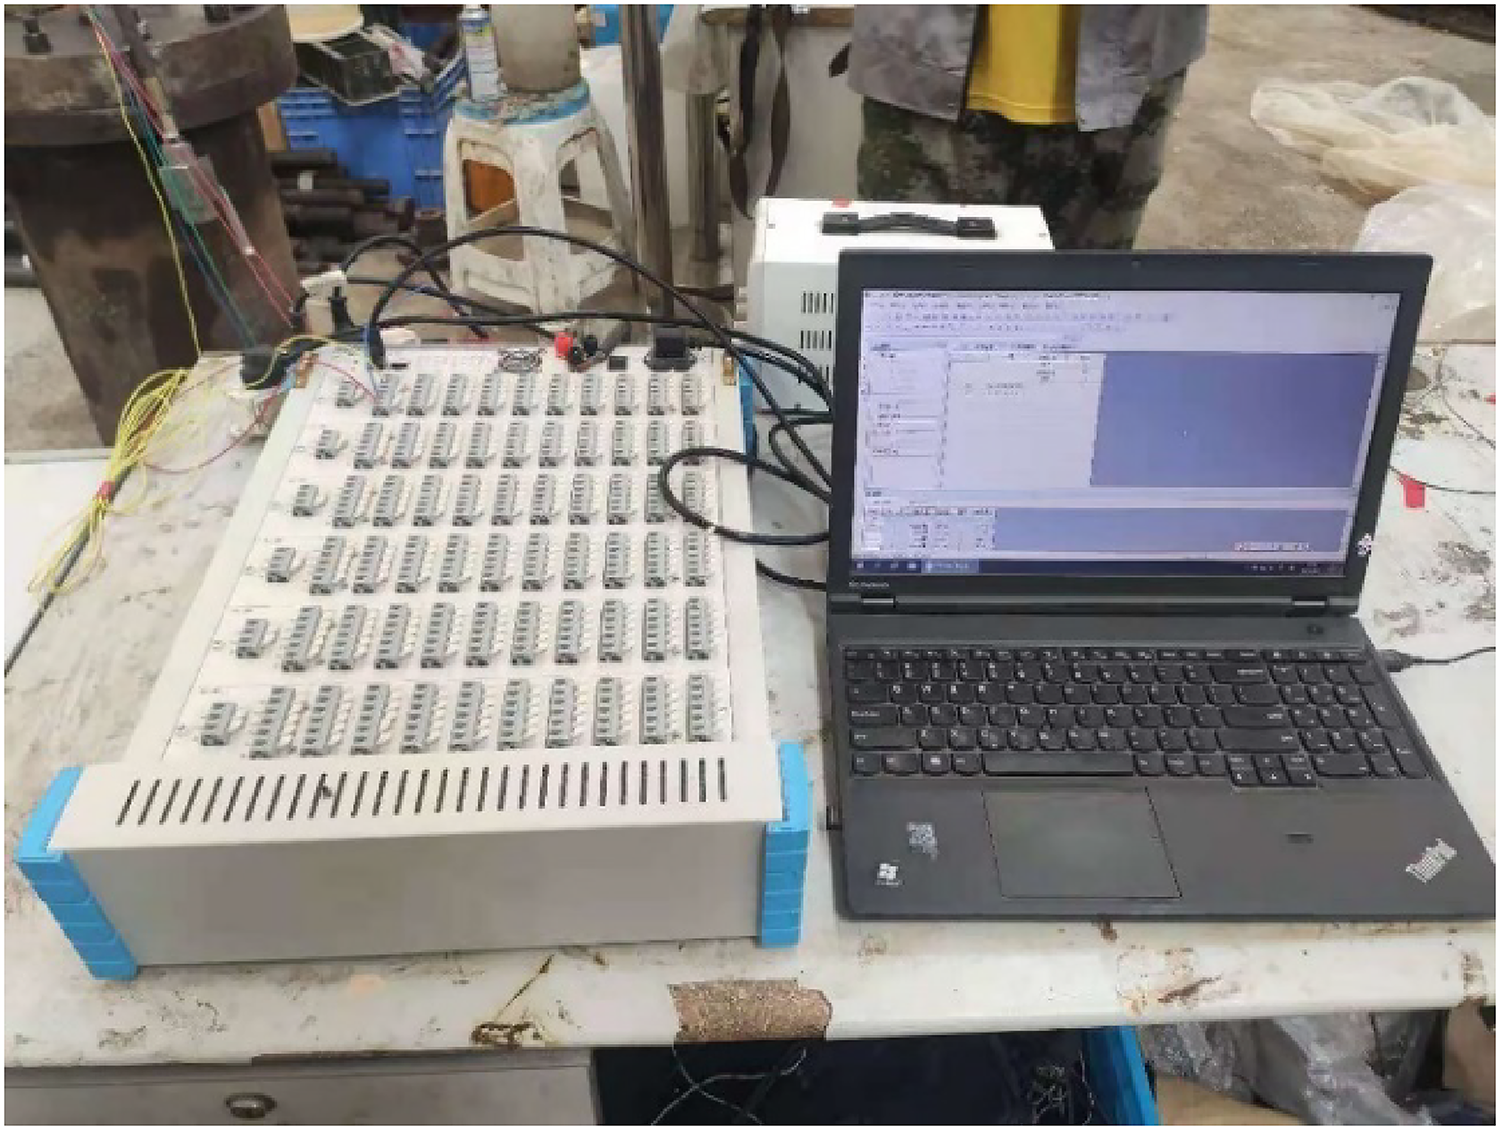
Static strain acquisition instrument.
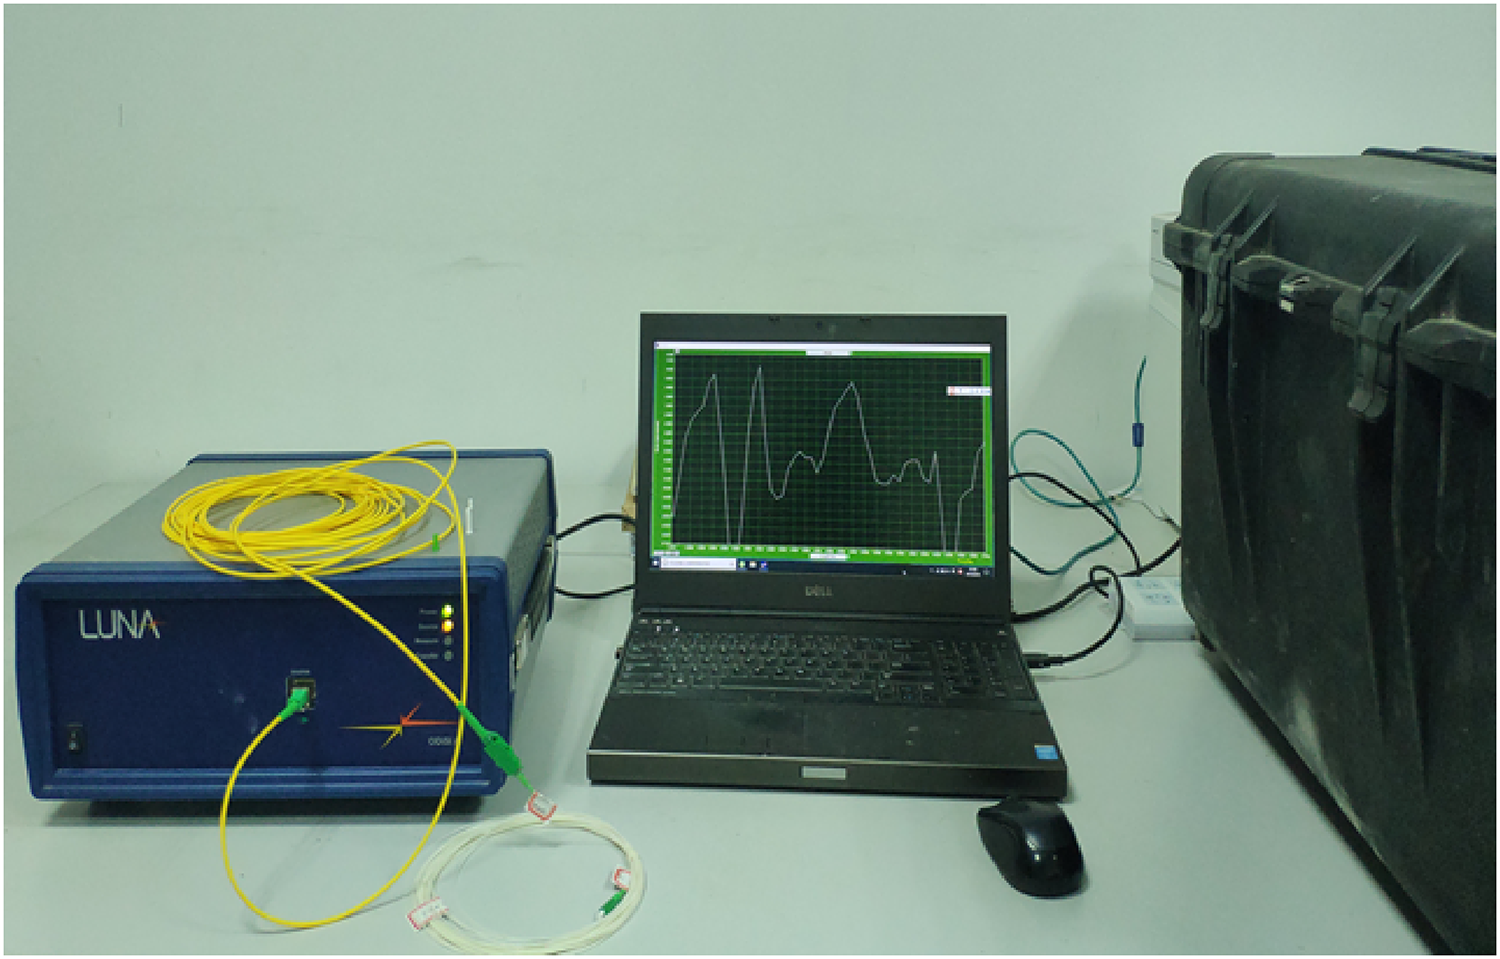
ODISi-A optical fiber acquisition instrument.
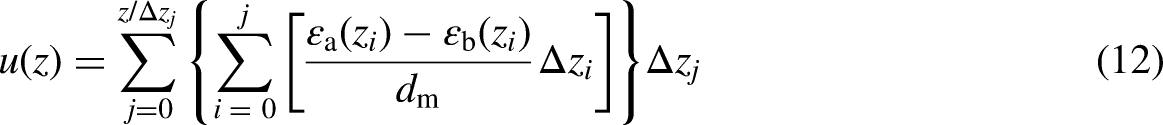
When the bottom end of the effective test section of the model shaft is taken as the origin of the vertical Axis Z, the strains of the model shaft at the same horizontal symmetrical position are

Since the model shaft can be equivalent to a cantilever beam structure with horizontal constraints at the bottom,
Model test preparation
Similar material
The model stratum is made up of clay and fine sand, and the permeability of fine sand is better than that of clay. Clay is impermeable and is generally used as an aquifuge. Therefore, it is necessary to select a suitable mixture of clay and fine sand to ensure that the seepage pressure difference between the upper and lower surfaces of the model stratum meets the design requirements and that the hydraulic gradient inside the stratum is constant. Therefore, measuring the permeability coefficient of clay and fine sand at different mass ratios is necessary to ensure the pressure stability of large-scale seepage tests.
According to Han's study (2021), when the mass ratio of clay and sand is 1:1 and the upper and lower pressure difference of the formation is 5 MPa, the hydraulic gradient of the stratum in this experiment can be guaranteed to be 1,000, and then the gravity field of 1,000 g can be simulated by water seepage force.
Model shaft preparation
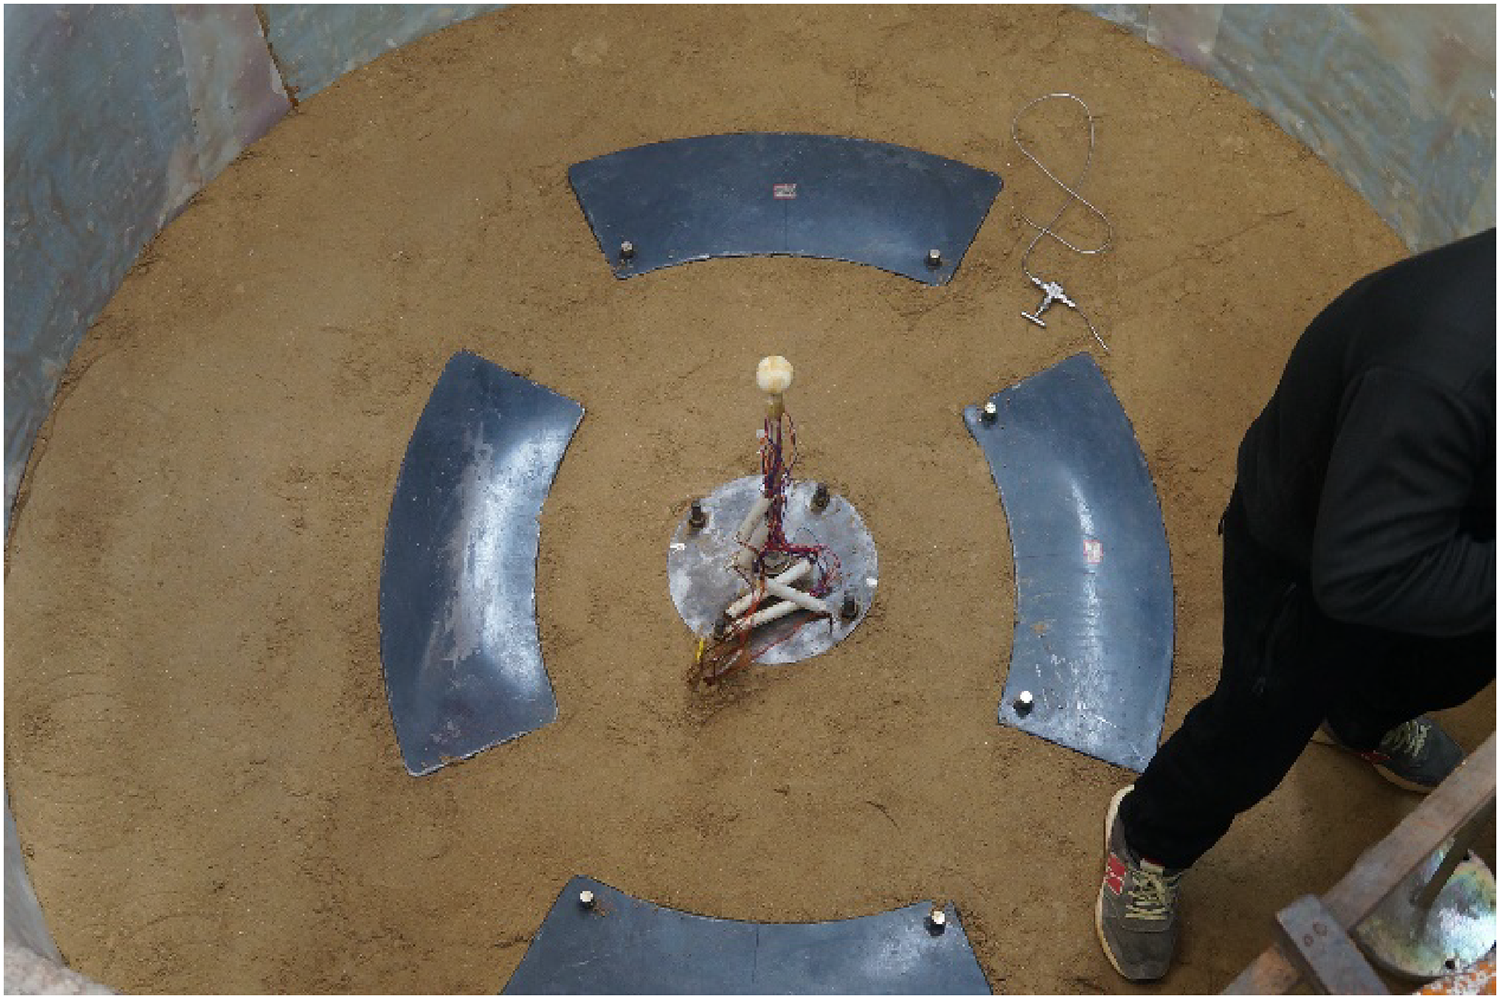
The purpose of this test is to study the influence law of formation disturbance caused by mining on shaft deformation, POM material was selected as the model material of model shaft according to the similarity ratio. Because the test-bed is closed, it is impossible to directly measure the change process of the model shaft displacement, so the displacement change is inversed by monitoring the shaft strain change. The test adopts two monitoring methods: resistance strain gauge and distributed optical fiber. The layout of model shaft test system is shown in Figure below (Figures 7–9):
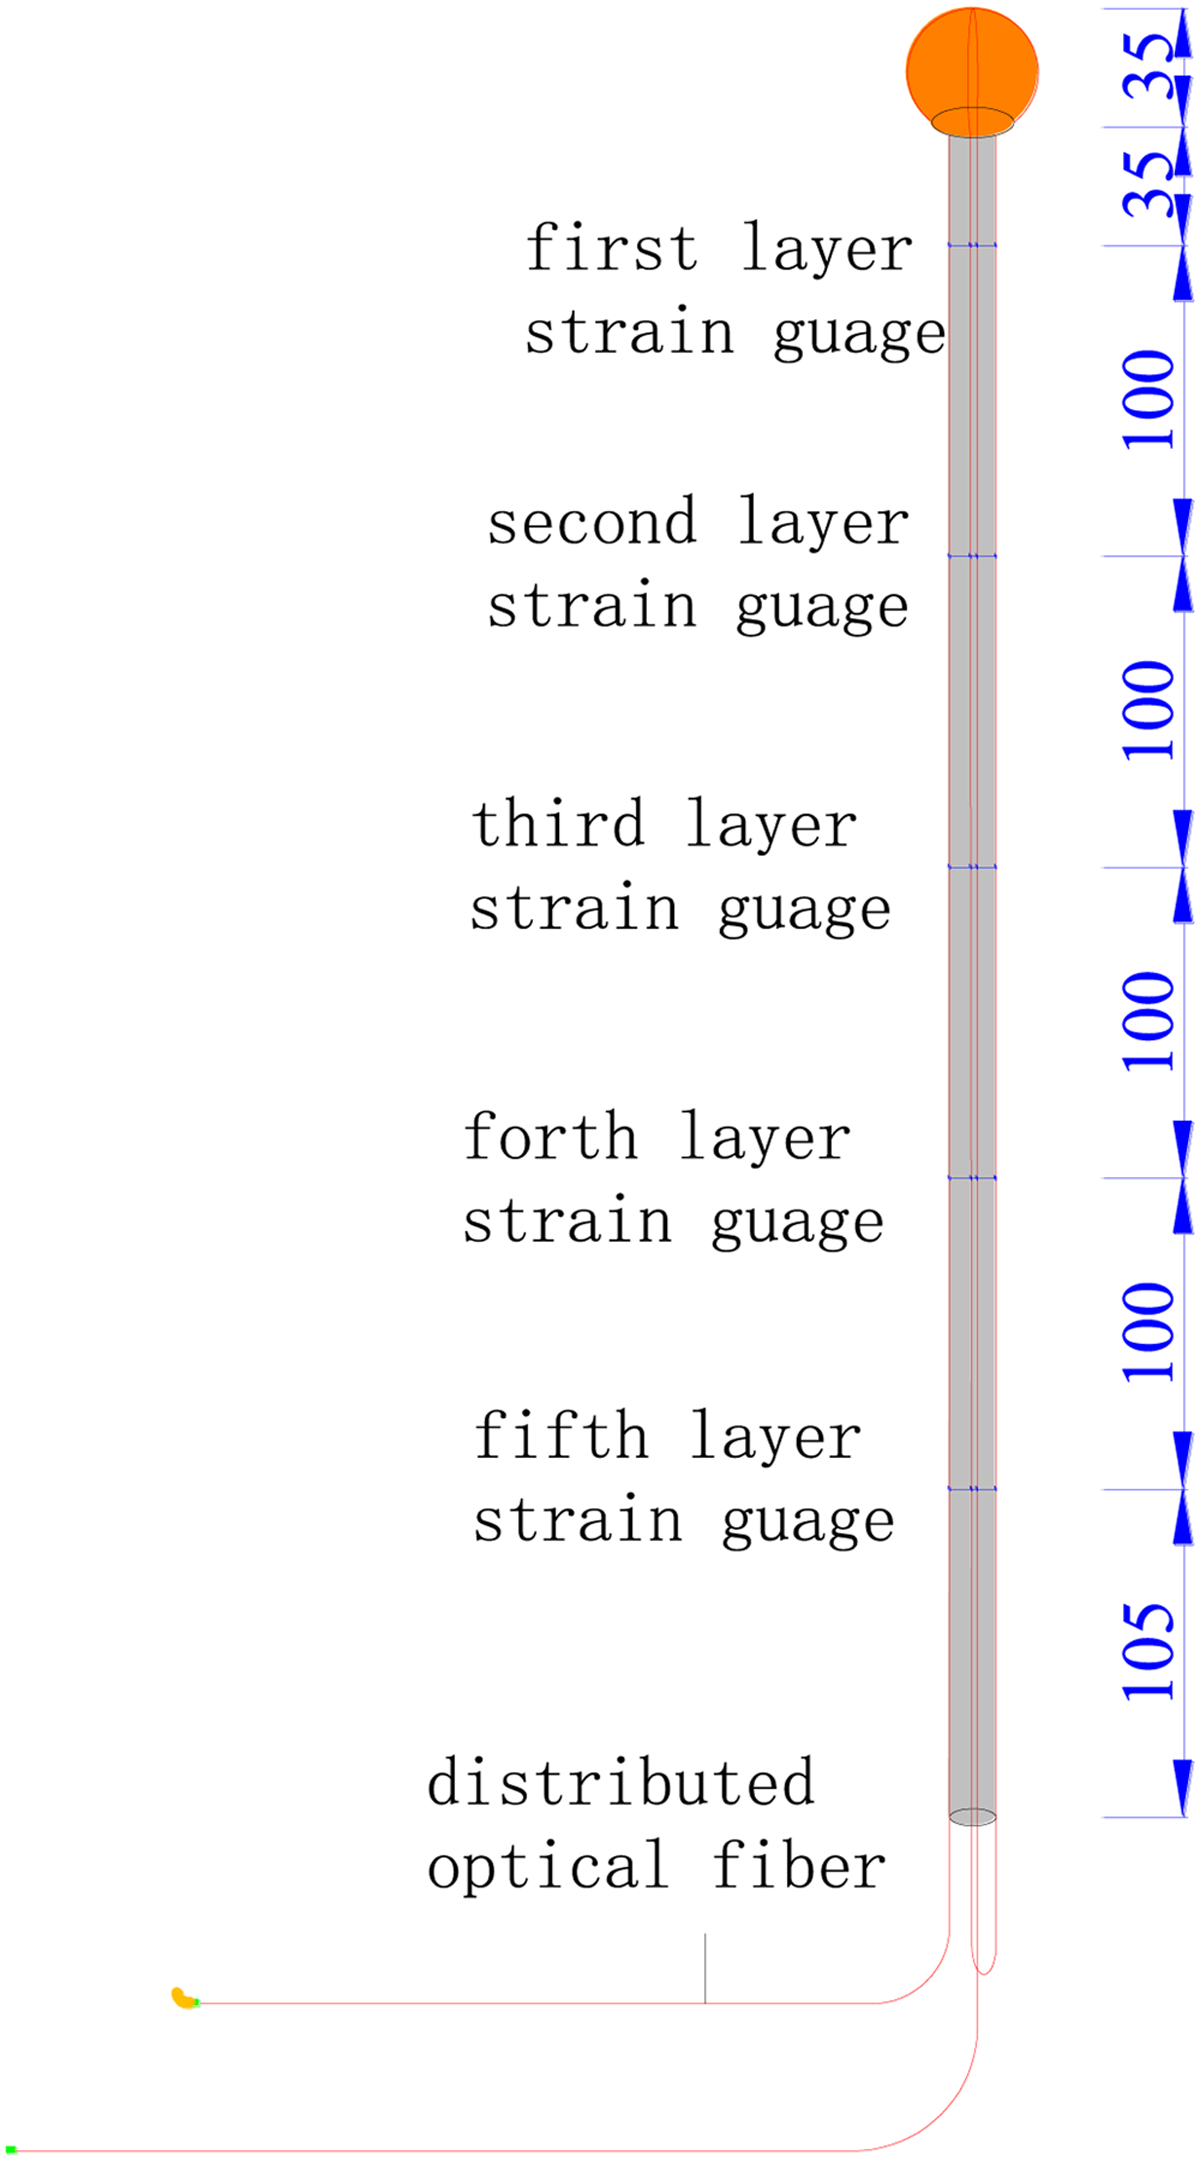
Layout of model shaft test system.
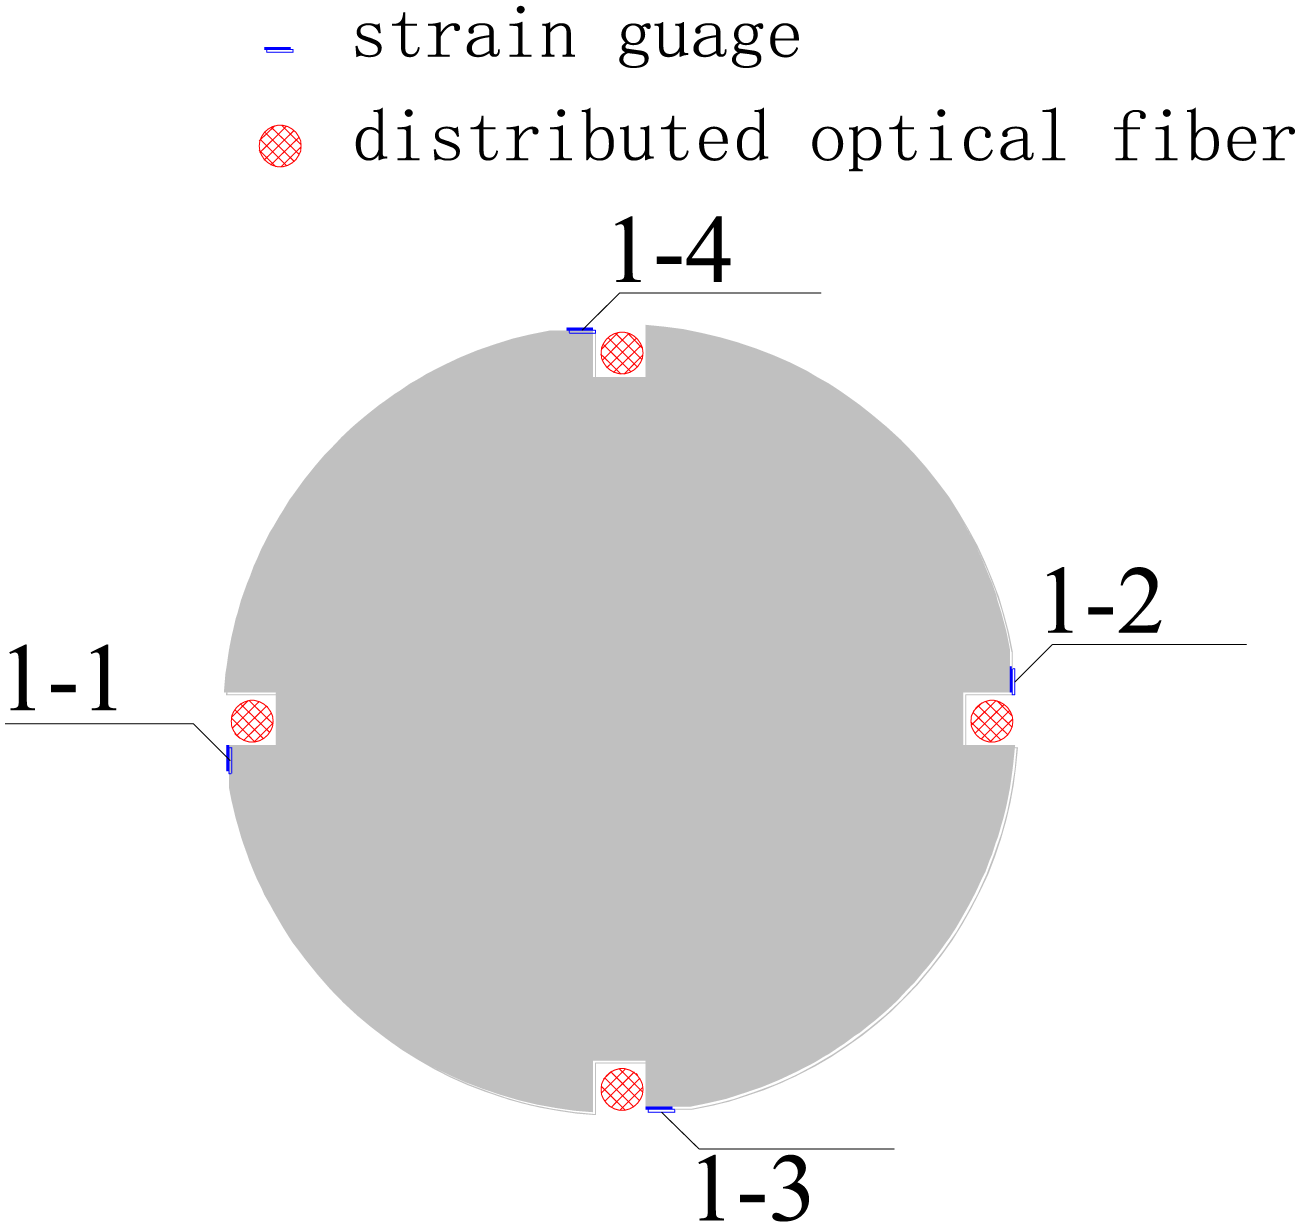
Layout section of model shaft test system.
Model shaft.
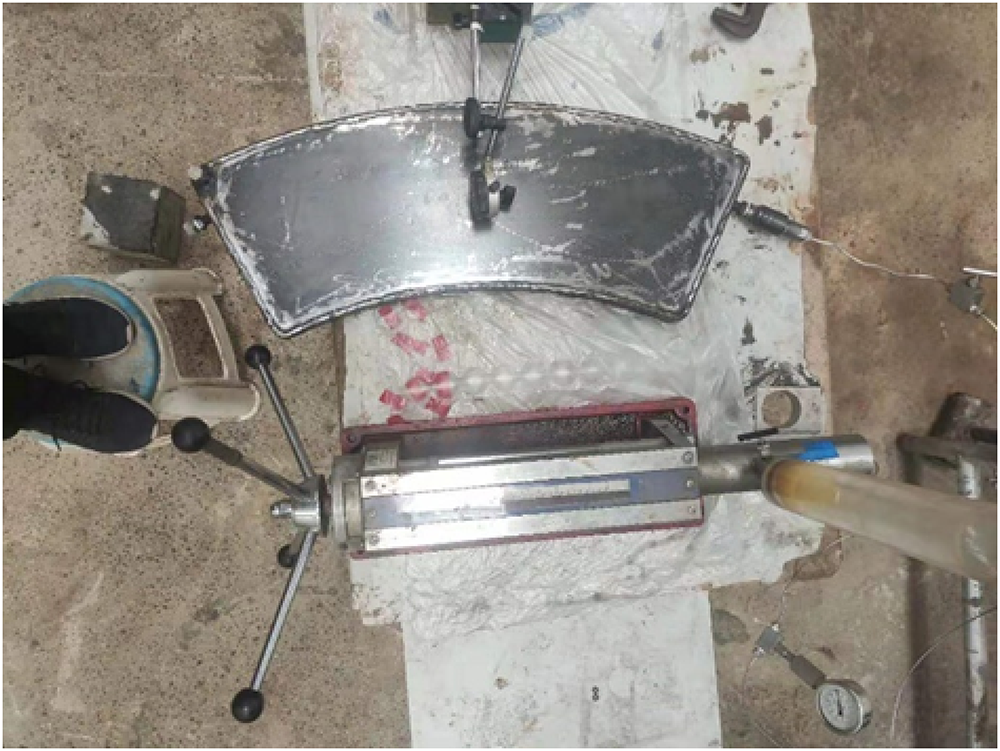
Calibration of sector hydraulic pillow
To ensure the tightness and good deformation characteristics of the hydraulic pillow, the performance of the hydraulic pillow should be quantitatively tested before the test, and the displacement sensor should be used to calibrate the deformation displacement of the hydraulic pillow. The specific test steps are as follows:
Hydraulic pillow connection
The hydraulic pillows were placed on the ground according to the layout of the hydraulic pillow in the actual test bench. A shunt joint was used to connect the east and west hydraulic pillows and ensure that the center of the hydraulic pillows is 800 mm away from the center of the test bed. A shunt joint was used to connect the east and west hydraulic pillows and ensure that the center of the hydraulic pillows is 600 mm away from the center of the experimental platform.
Connection of loading device
During the test, the manual pump was used to provide pressure source, and the hydraulic medium is 46# hydraulic oil with small compression coefficient. We filled the hydraulic pillows with hydraulic oil, closed the the North-South hydraulic pillow valve, and connected the manual pump to the East-West shunt joint.
Installation of displacement sensor
The midpoint of four hydraulic pillows were selected as the measuring point, and the displacement meter was used to measure the deformation and displacement of the hydraulic pillow.
Calibration process
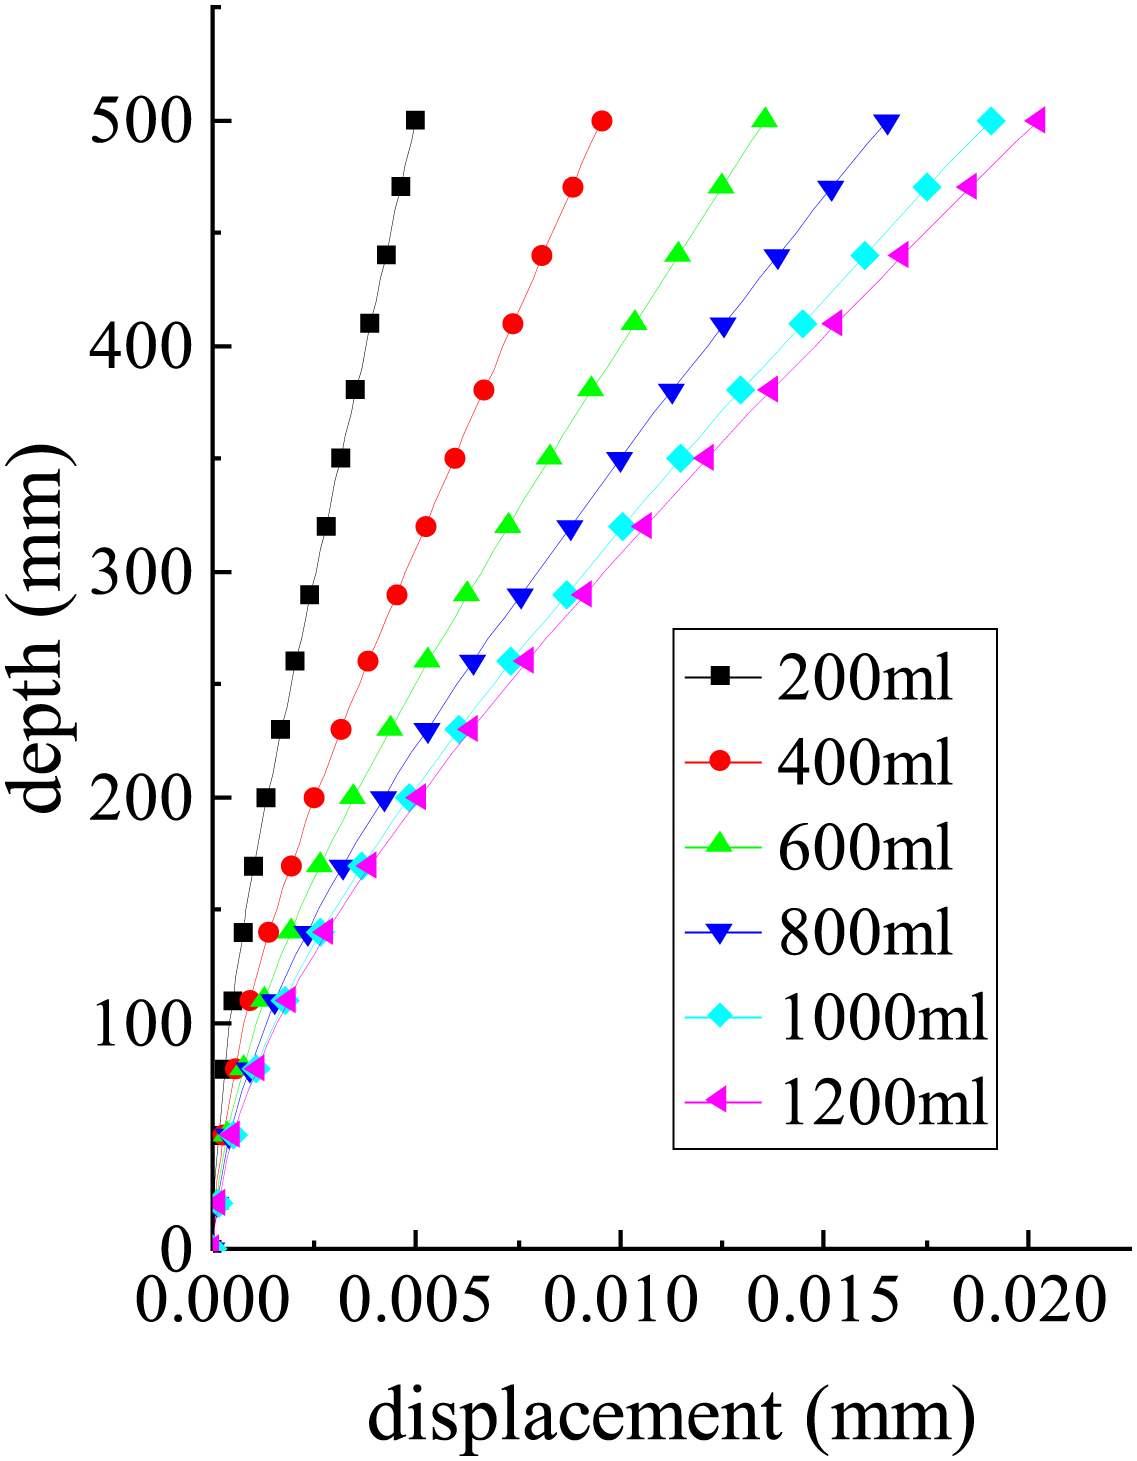
We opened the south hydraulic pillow valve, opened the data acquisition system, and rotated the handle of the manual pump at uniform speed for pressurization. Each refueling amount is 200 mL. After a single refueling, we closed the valve and keep the hydraulic pillow pressure stabilized for 3 min. and recorded the displacement of the center point of the hydraulic pillow. The total oil filling volume is 1,200 mL. We closed the South sub valve, opened the North sub valve, repeated the above process, and completed the calibration of the North Hydraulic pillow. We completed the calibration of the East and the West hydraulic pillows in the same way. The curves of the displacement of the four hydraulic pillows with time during the pressurization process measured in the test are shown in Figures 10–12.
Pipeline connection for hydraulic pillow calibration.
Installation of displacement gauge for hydraulic pillow calibration.
Calibration results of hydraulic pillow.
The test results show that at the initial stage of pressurization of the hydraulic pillow, the displacement of the measuring point changes greatly with the oil delivery. When the oil delivery reaches 400 mL, the displacement of the measuring point changes little with the oil delivery. The displacement of the hydraulic pillow generally shows a linear increasing trend, and the deformation trend of the four hydraulic pillows is basically the same.
Test process
Test system assembly
We first assembled the lower part of the test bed, and then prepared for the test. The test process is as follows:
Installation of model shaft
We first installed the shaft protection device in the center of the bottom of the test bench. Then, installed the model shaft arranged by the test system on the protection device and checked its tightness. Finally, led all test lines out of the test bed.
Fill in similar materials
We configured similar materials according to the measured proportion, and buried four hydraulic pillows into the bottom of the formation to ensure that the centers of the East and West hydraulic pillows are 800 mm away from the model shaft, and the centers of the South and North Hydraulic pillows are 600 mm away from the model shaft. After that, the similar materials were paved into the test bed layer by layer and compacted until the model shaft is completely covered. In order to prevent the formation of hydraulic channel during the test, a 50 mm clay layer was paved above the model formation (Figures 13 and 14).
Installation of hydraulic pillow.
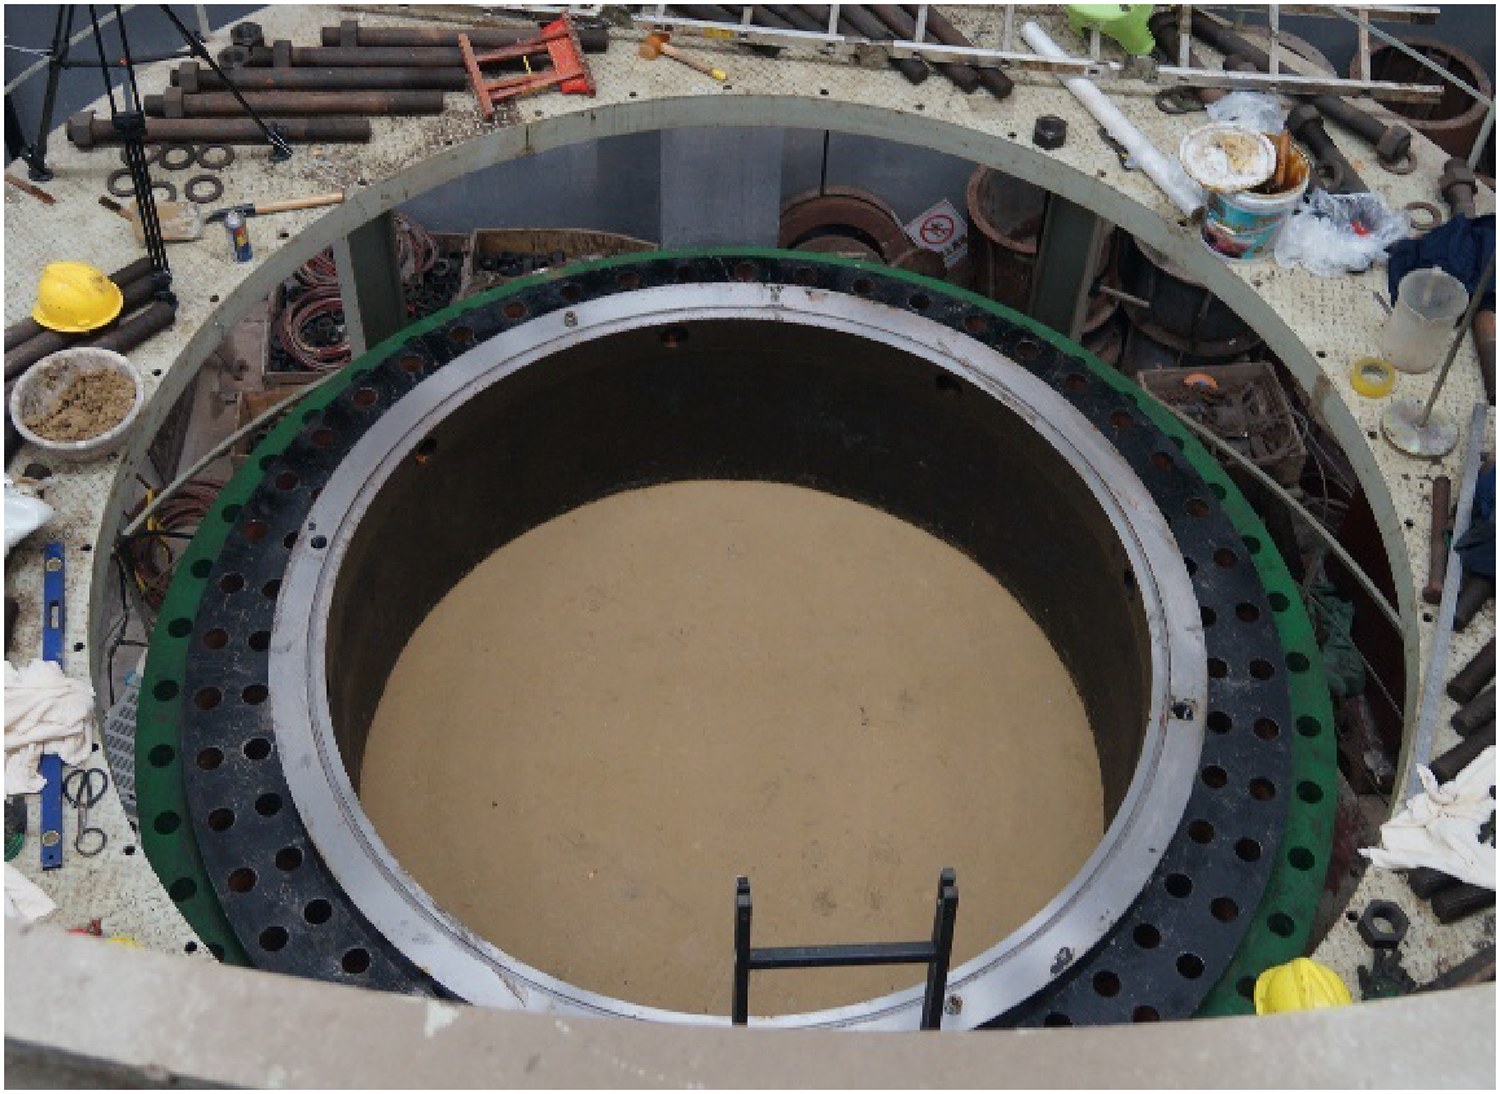
Fill in similar materials.
Layout settlement test system
We installed the fixed frame of displacement sensor in the test bed. In order to obtain detailed settlement data, two measuring lines are arranged directly above the four hydraulic pillows, and the distance between each measuring point is 200 mm. The installation of displacement sensor is shown in the figure below (Figures 15 and 16).
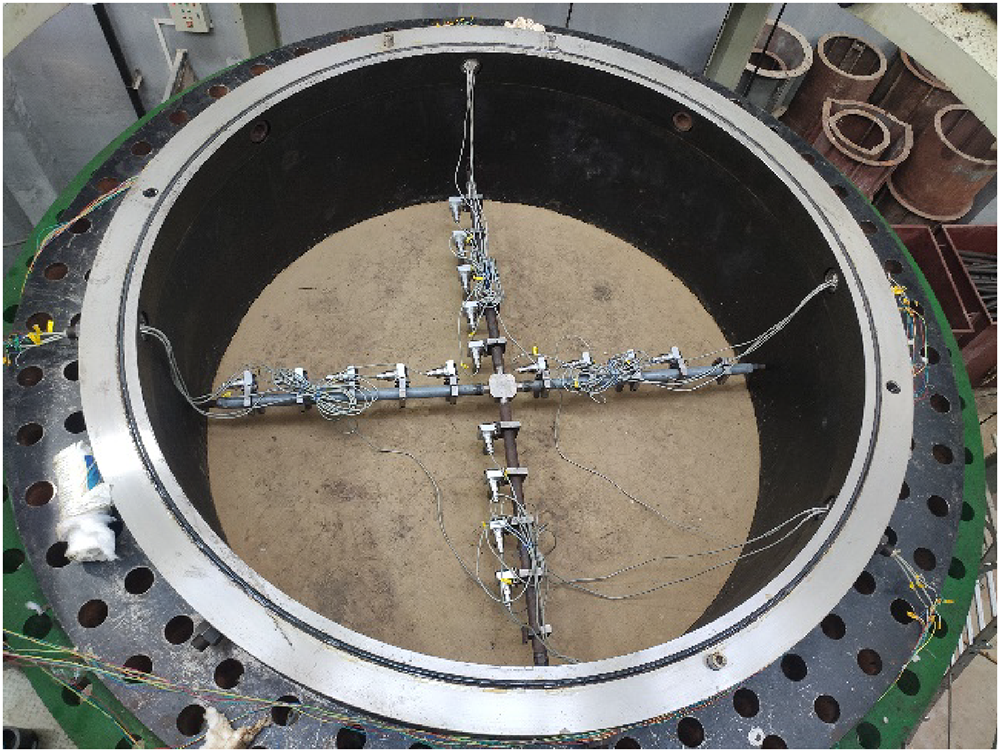
Installation of displacement sensor.
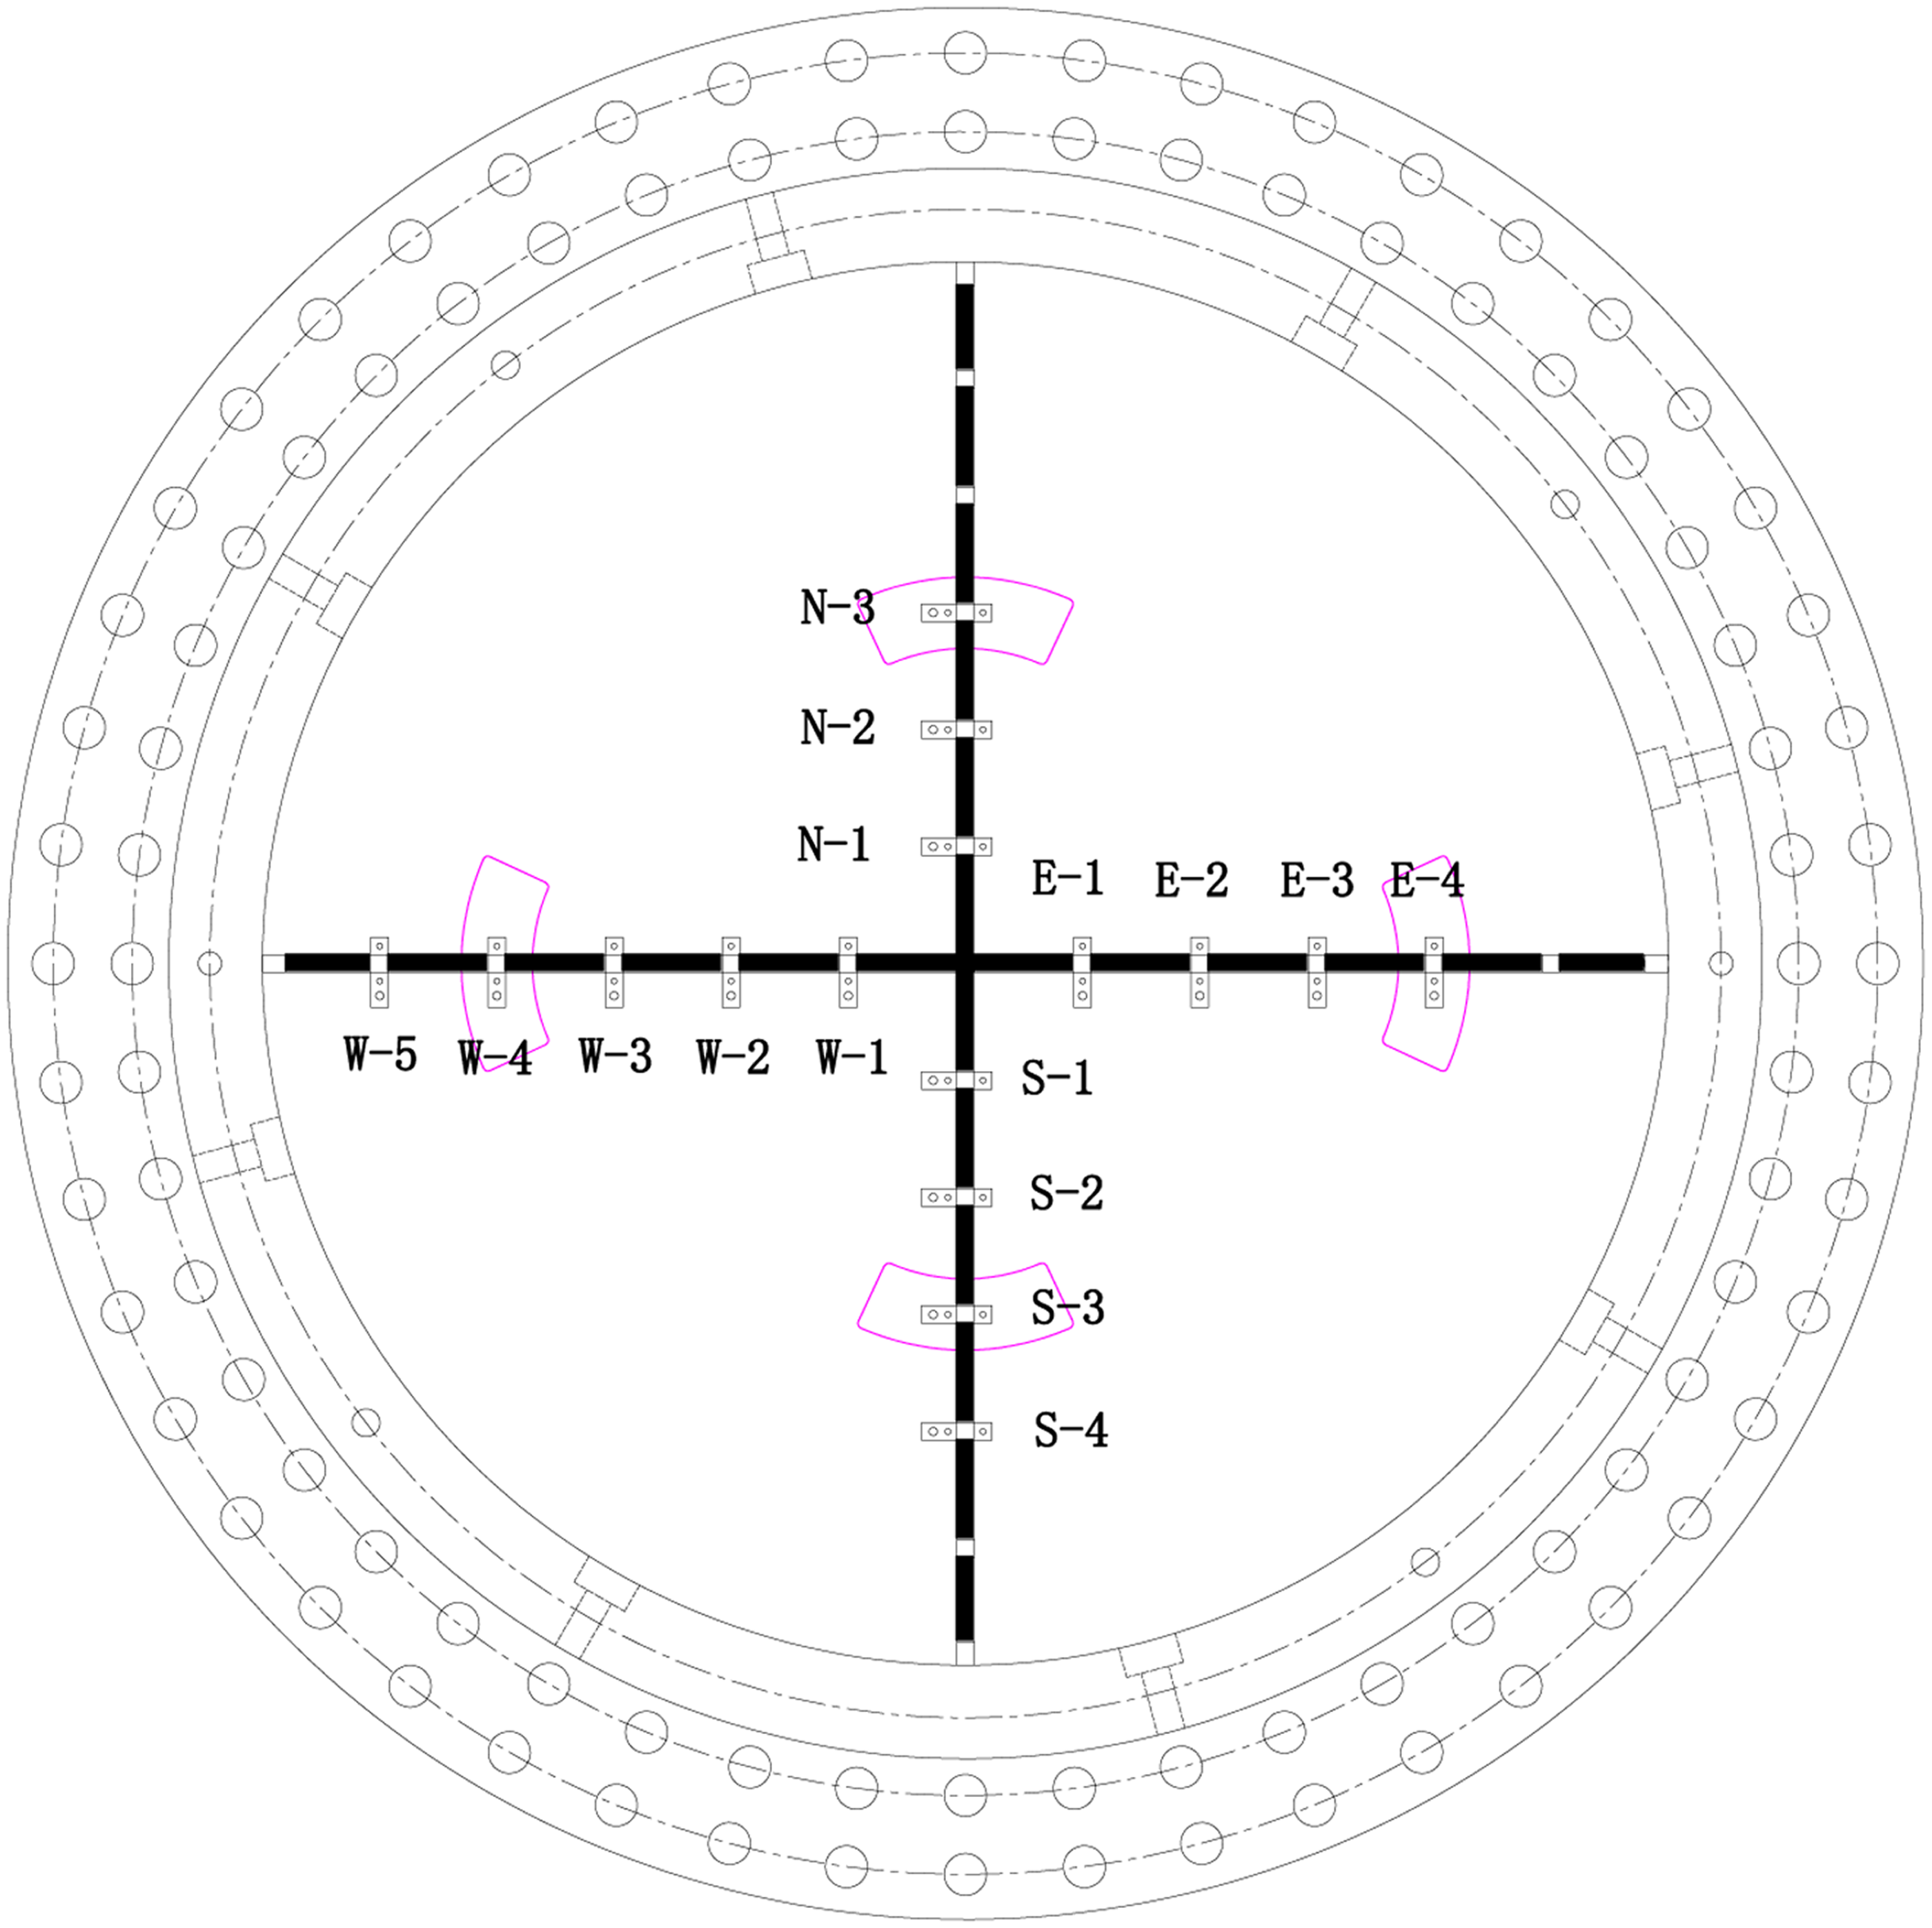
Layout of displacement sensor.
Test bed installation
We led all displacement sensor lines out of the test bed and connected them to the acquisition device. We used the crane to install the cover plate, and injected water into the test bed through the upper cover water inlet until the test bed is filled. The servo pressure stabilizing system was connected through the upper cover plate (Figures 17 and 18).
Test bed assembly.
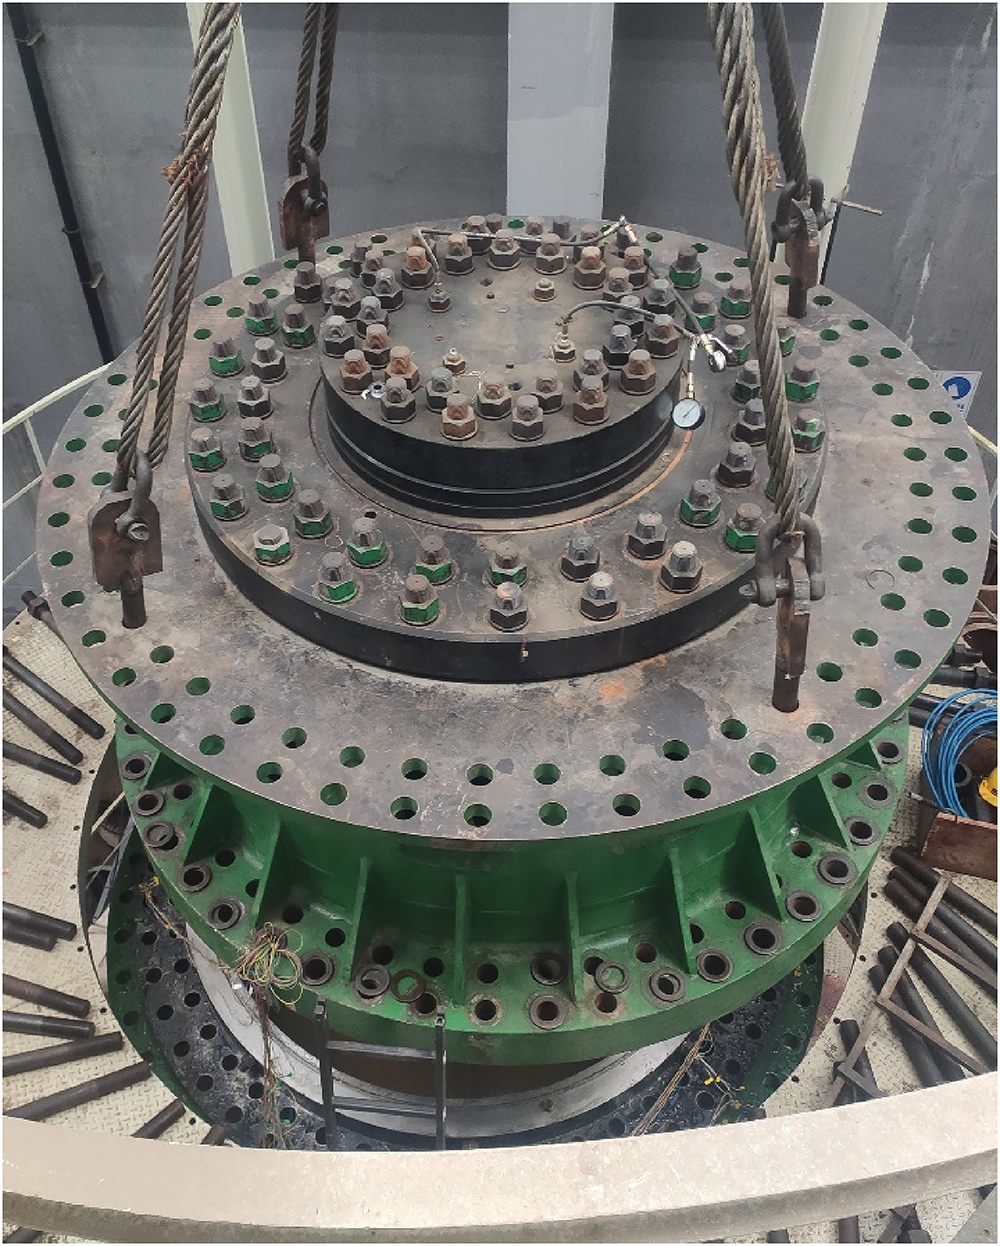
Lifting of cover plate on test bench.
Applied seepage field
The hydraulic seepage was applied through the servo pressure stabilizing system to ensure that the upper and lower pressure difference of the formation was 5 MPa. Then, the similar simulation test of shaft deflection of deep soil caused by mining disturbance can be officially started.
Mining test process
The first stage mining process
The diversion joints of the East Hydraulic pillow and the West hydraulic pillow were connected to the manual pump, when the seepage pressure was stabilized at 5 MPa for 10 min. We opened the valve of the East Hydraulic pillow and rotated the manual pump at a constant speed to start the oil return of the hydraulic pillow. The single oil return volume of the hydraulic pillow is 200 mL, and the next oil return would be carried out after the hydraulic pillow was stabilized for 10 min. We closed the East Hydraulic pillow valve when the total oil return was 1,200 mL. We opened the valve of the West hydraulic pillow and repeated the above process after stabilizing the pressure of the East Hydraulic pillow for 10 min. The diversion joints of the South Hydraulic pillow and the North Hydraulic pillow were connected to the manual pump, the valves of the South Hydraulic pillow and the North Hydraulic pillow were opened at the same time, and the manual pump was rotated at a uniform speed to start the oil return of the hydraulic pillows. The single oil return volume of the manual pump was 400 mL. The next oil return will be carried out after stabilizing for 10 min. We closed the valve when the total oil return is 2,400 mL.
Hydraulic pillow refueling
According to the above oil return sequence, 1,200 mL hydraulic oil was injected into the four hydraulic pillows respectively. The hydraulic pillows were restored to its initial state.
The second stage mining process
The diversion joints of the South Hydraulic pillow and the North hydraulic pillow were connected to the manual pump. We opened the valve of the South Hydraulic pillow and rotated the manual pump at a constant speed to start the oil return of the hydraulic pillow. The single oil return volume of the hydraulic pillow is 200 mL, and the next oil return would be carried out after the hydraulic pillow was stabilized for 10 min. We closed the South Hydraulic pillow valve when the total oil return was 1,200 mL. We opened the valve of the North hydraulic pillow and repeated the above process after stabilizing the pressure of the South Hydraulic pillow for 10 min. The diversion joints of the East Hydraulic pillow and the West Hydraulic pillow were connected to the manual pump, the valves of the East Hydraulic pillow and the West Hydraulic pillow were opened at the same time, and the manual pump was rotated at a uniform speed to start the oil return of the hydraulic pillows. The single oil return volume of the manual pump was 400 mL. The next oil return will be carried out after stabilizing for 10 min. We closed the valve when the total oil return is 2,400 mL.
Data acquisition
There were three test systems in this test, namely model shaft strain gauge test system, model shaft optical fiber test system and surface settlement test system. The output of strain gauge test system was resistance and the output of surface settlement system was voltage. The two test systems use TST-3828-H strain acquisition instrument for data acquisition. The model shaft optical fiber testing system uses ODISI-A acquisition instrument to collect data. We turned on all acquisition instruments when the seepage field was stabilized at 5 MPa pressure, and then started the oil return of hydraulic pillows (Figures 19–21).
Collecting settlement monitoring data.
Collecting strain gauge data.
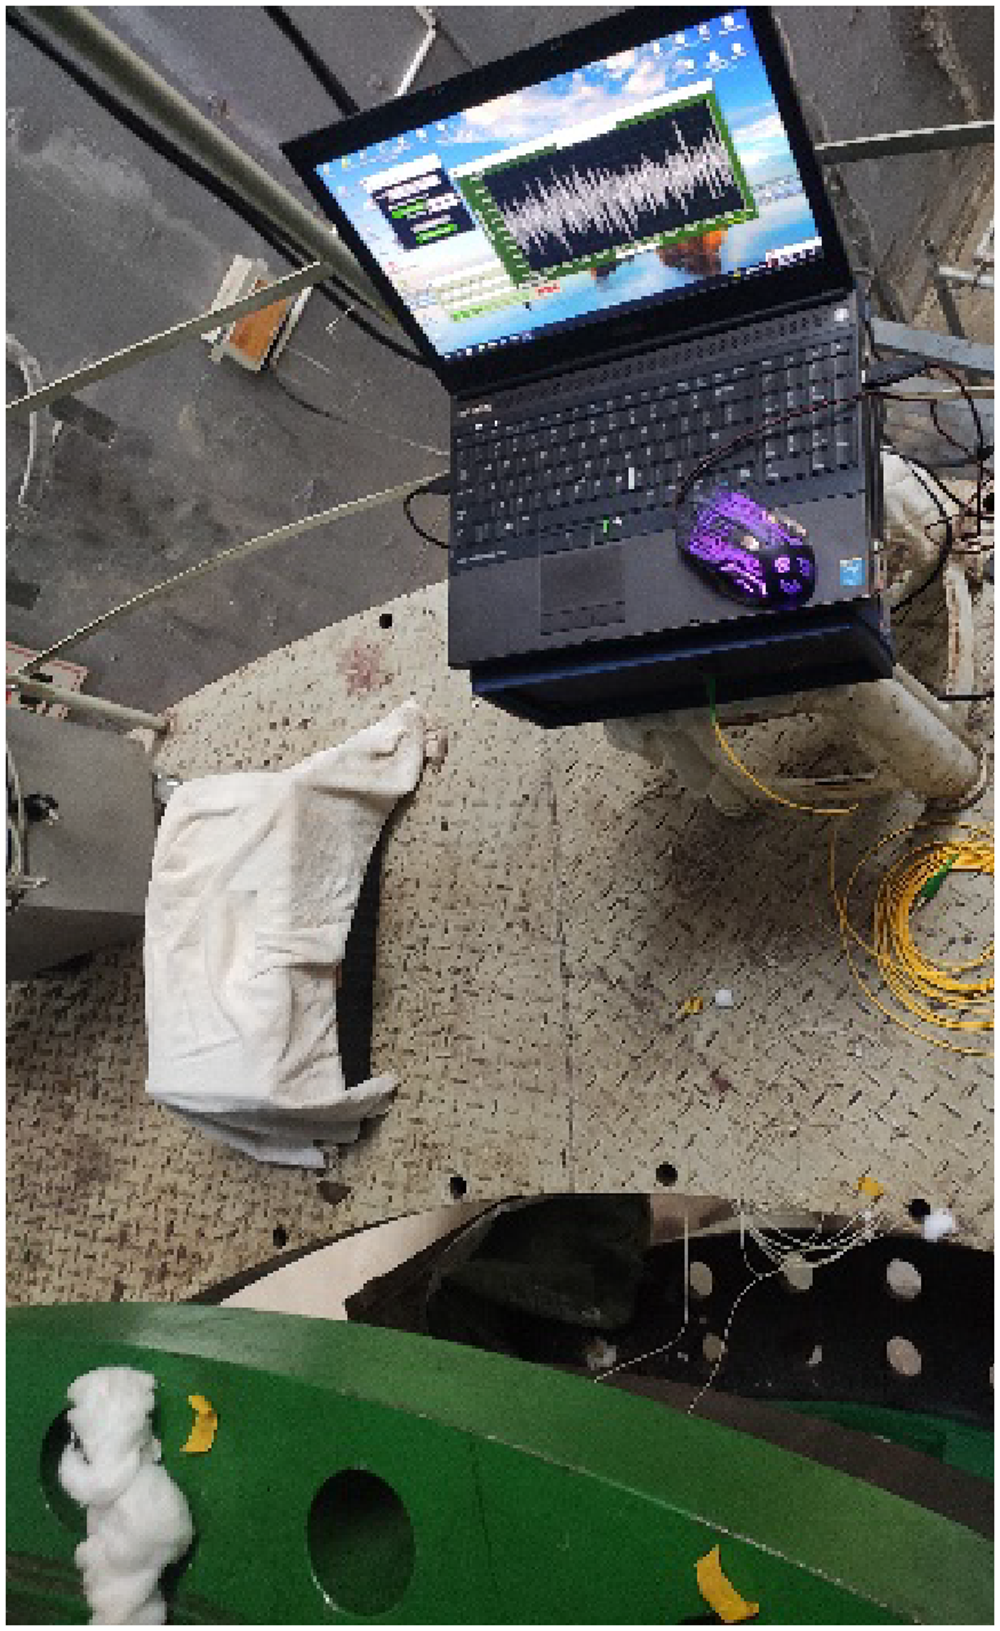
Collecting optical fiber data.
Test results and analysis
Analysis of test process
Two channel hydrostatic pressure combined loading method was adopted in the seepage and mining model test stage. The strain monitoring data of model shaft which was collected by resistance strain gauge was similar to the strain monitoring data of the model shaft which was collected by optical fiber, and the variation law of strain with time is basically the same. The strain data of each point on the strain gauge on the optical fiber was selected as the result output, and the strain duration curve of each point is shown in Figure 22. The output voltage of the displacement meter is selected as the result output, and the duration curve of each measuring point is shown in Figure 23.
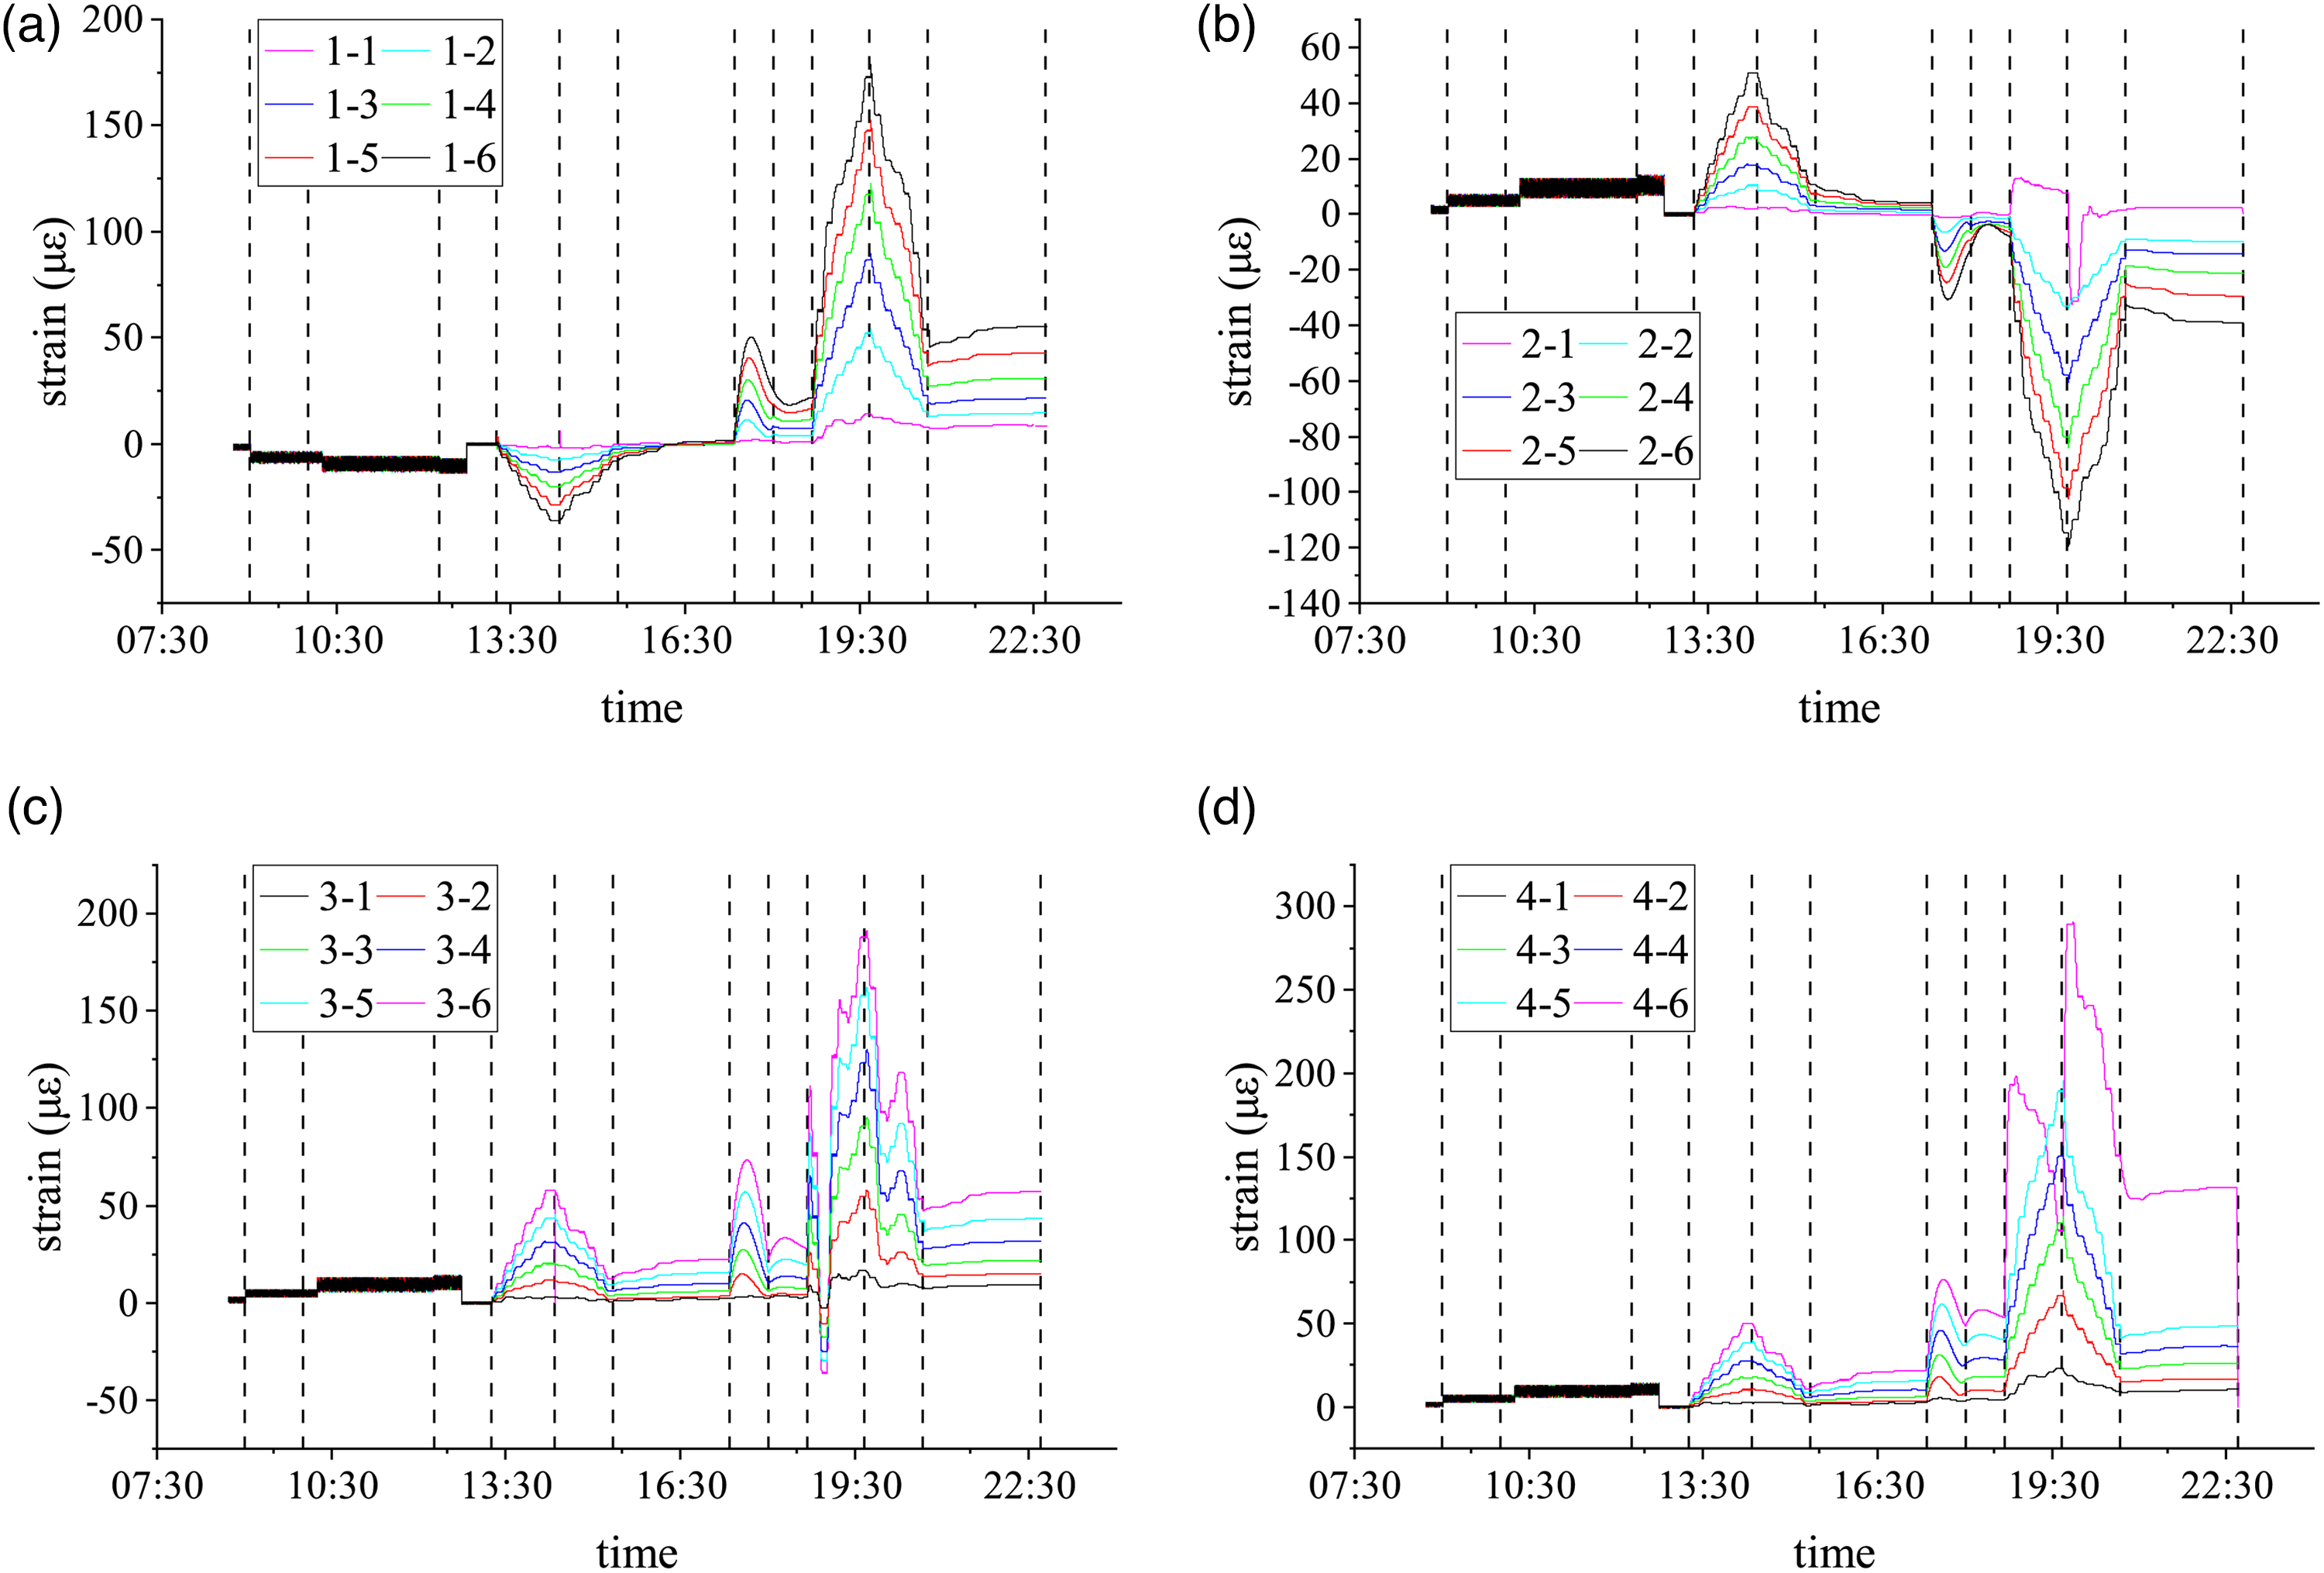
Optical fiber monitoring data duration curve. (a) Optical fiber 1# line data duration curve. (b) Optical fiber 2# line data duration curve. (c) Optical fiber 3# line data duration curve. (d) Optical fiber 3# line data duration curve.
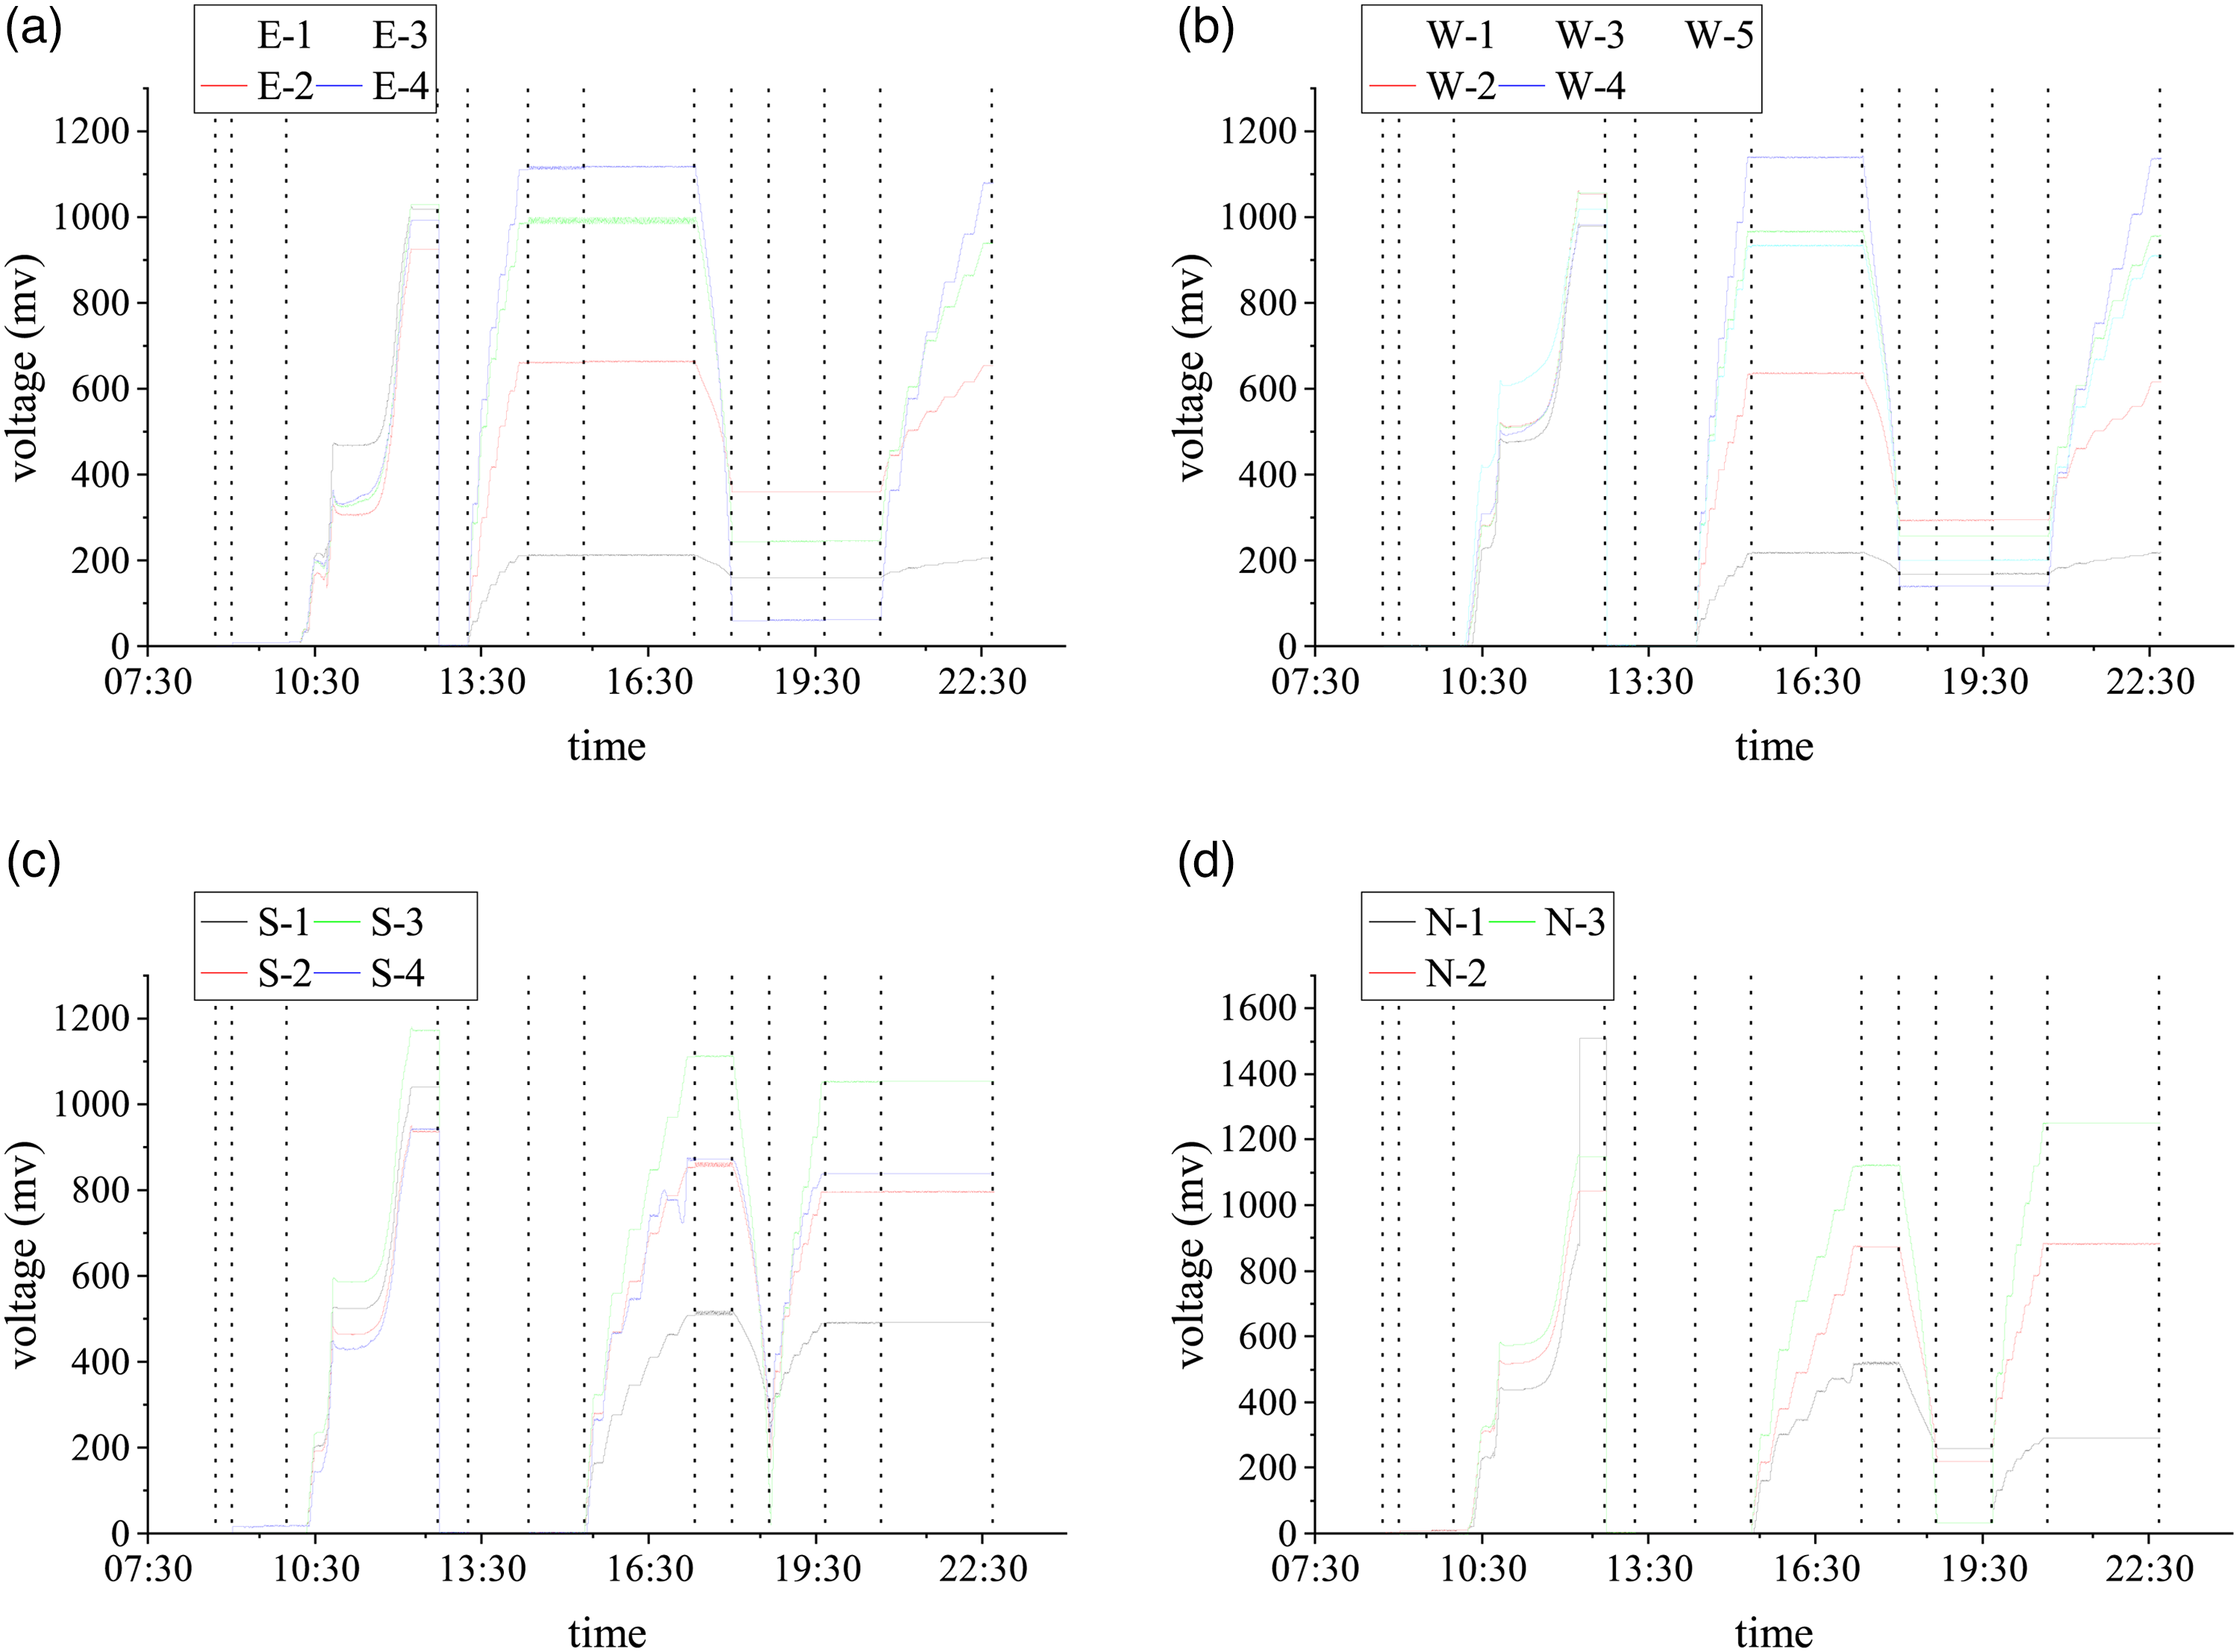
Settlement monitoring data duration curve. (a) Settlement output data duration curve of East Hydraulic pillow. (b) Settlement output data duration curve of West Hydraulic pillow. (c) Settlement output data duration curve of South Hydraulic pillow. (d) Settlement output data duration curve of North Hydraulic pillow.
According to the pressure change in the test bed and the loading and unloading process of each hydraulic pillow, the whole test process was divided into the following stages. Stage 0: test bed exhaust; Stage 1: initial pressure rise; Stage 2: Soil compression; Stage 3: seepage stabilization process; Stage 4: East Hydraulic pillow oil return; Stage 5: West hydraulic pillow oil return; Stage 6: South Hydraulic pillow and North Hydraulic pillow return oil at the same time; Stage 7: East Hydraulic pillow and West hydraulic pillow refueling; Stage 8: South Hydraulic pillow and North Hydraulic pillow refueling; Stage 9: South Hydraulic pillow oil return; Stage 10: North Hydraulic pillow oil return; Stage 11: East Hydraulic pillow and West hydraulic pillow return oil at the same time.
Settlement result analysis
We selected the monitoring point data of surface settlement caused by the first oil return of each hydraulic pillow, that is, the data of stage 3 East displacement sensor, stage 4 West displacement sensor, stage 5 South displacement sensor and North displacement sensor. The change of settlement with time is shown in Figure 24. According to the rock movement law of the bending zone under the condition of deep soil, the maximum settlement displacement of the center point of the hydraulic pillow can reflect the maximum deflection of the rock stratum in the bending zone, and the deflection value is approximately equal to the mining thickness of the coal. Therefore, it is reasonable to use the maximum settlement displacement of the hydraulic pillow to inverse the mining thickness of the prototype coal. According to the settlement data after the first oil return of each hydraulic pillow, the relationship between the displacement of each displacement monitoring point and the center of the hydraulic pillow is shown in Figure 25. It can be found that a settlement basin is formed in the center of the hydraulic pillow, which is consistent with the actual situation. Therefore, it is feasible to simulate the formation disturbance caused by coal excavation with hydraulic pillow oil return.
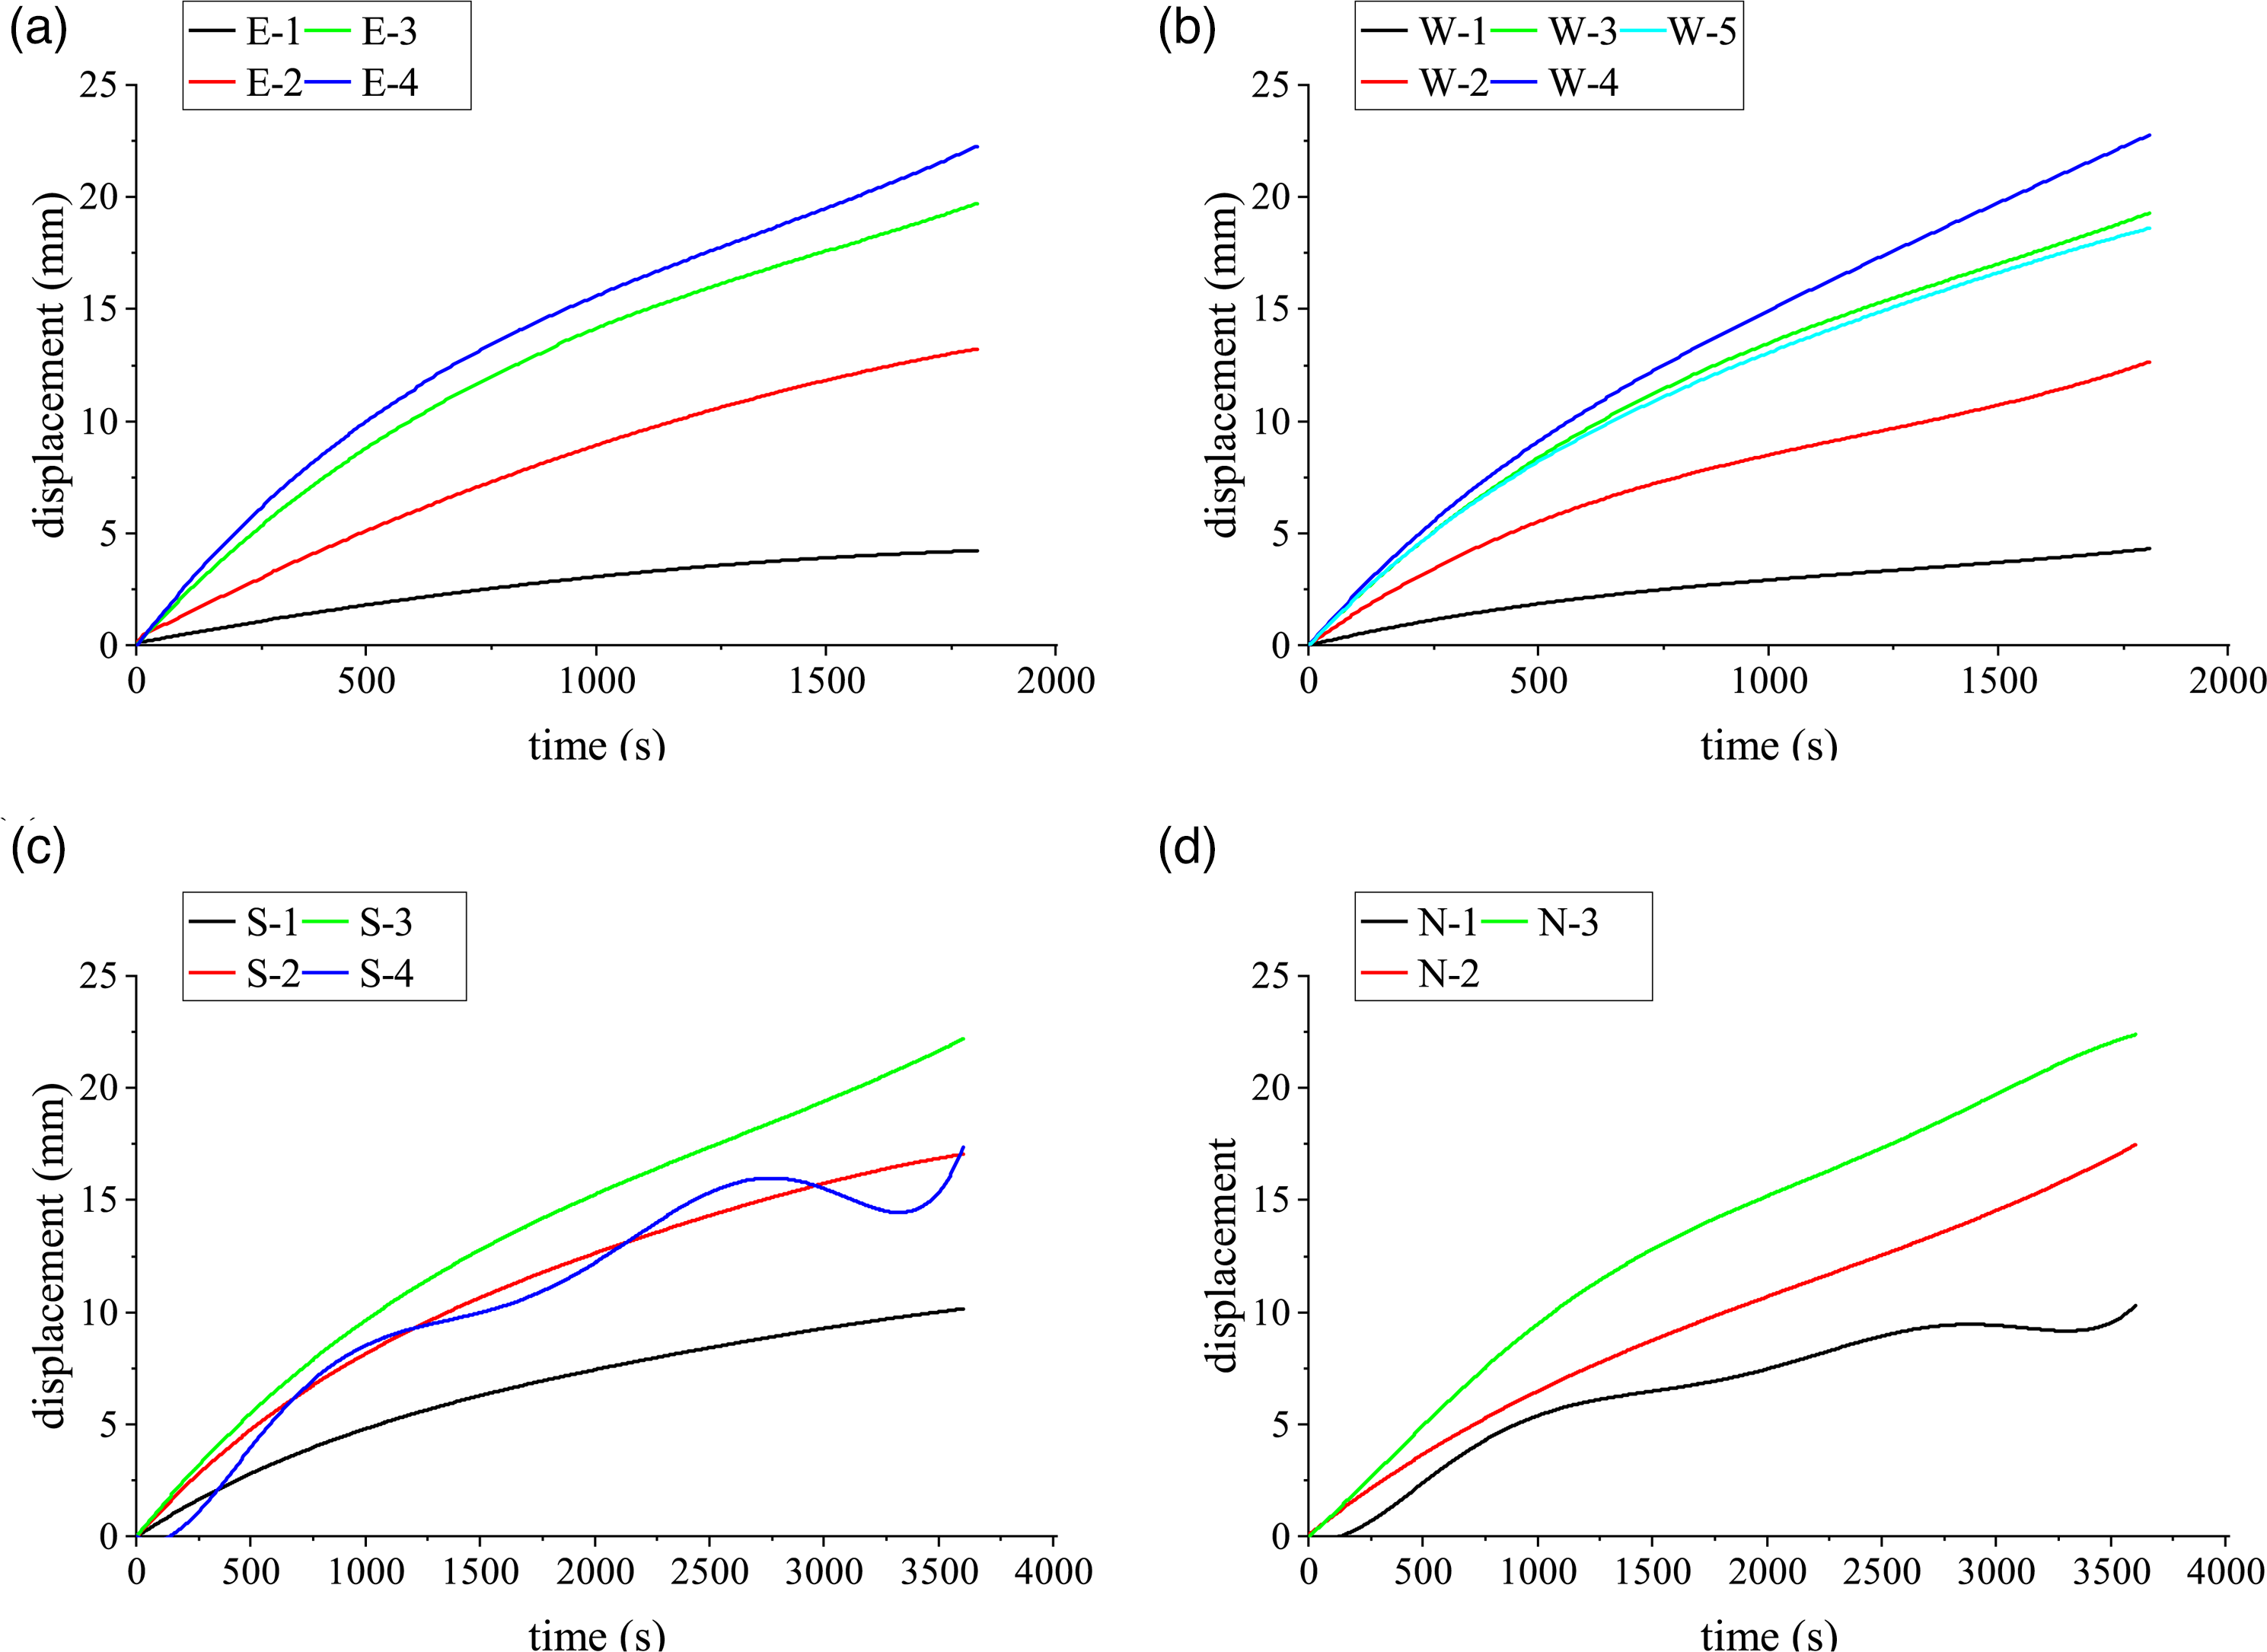
Settlement change curve of each measuring point. (a) Settlement variation curve on the east side of stage 4. (b) Settlement variation curve on the west side of stage 5. (c) Settlement change curve on the south side of stage 6. (d) Settlement change curve on the North side of stage 6.
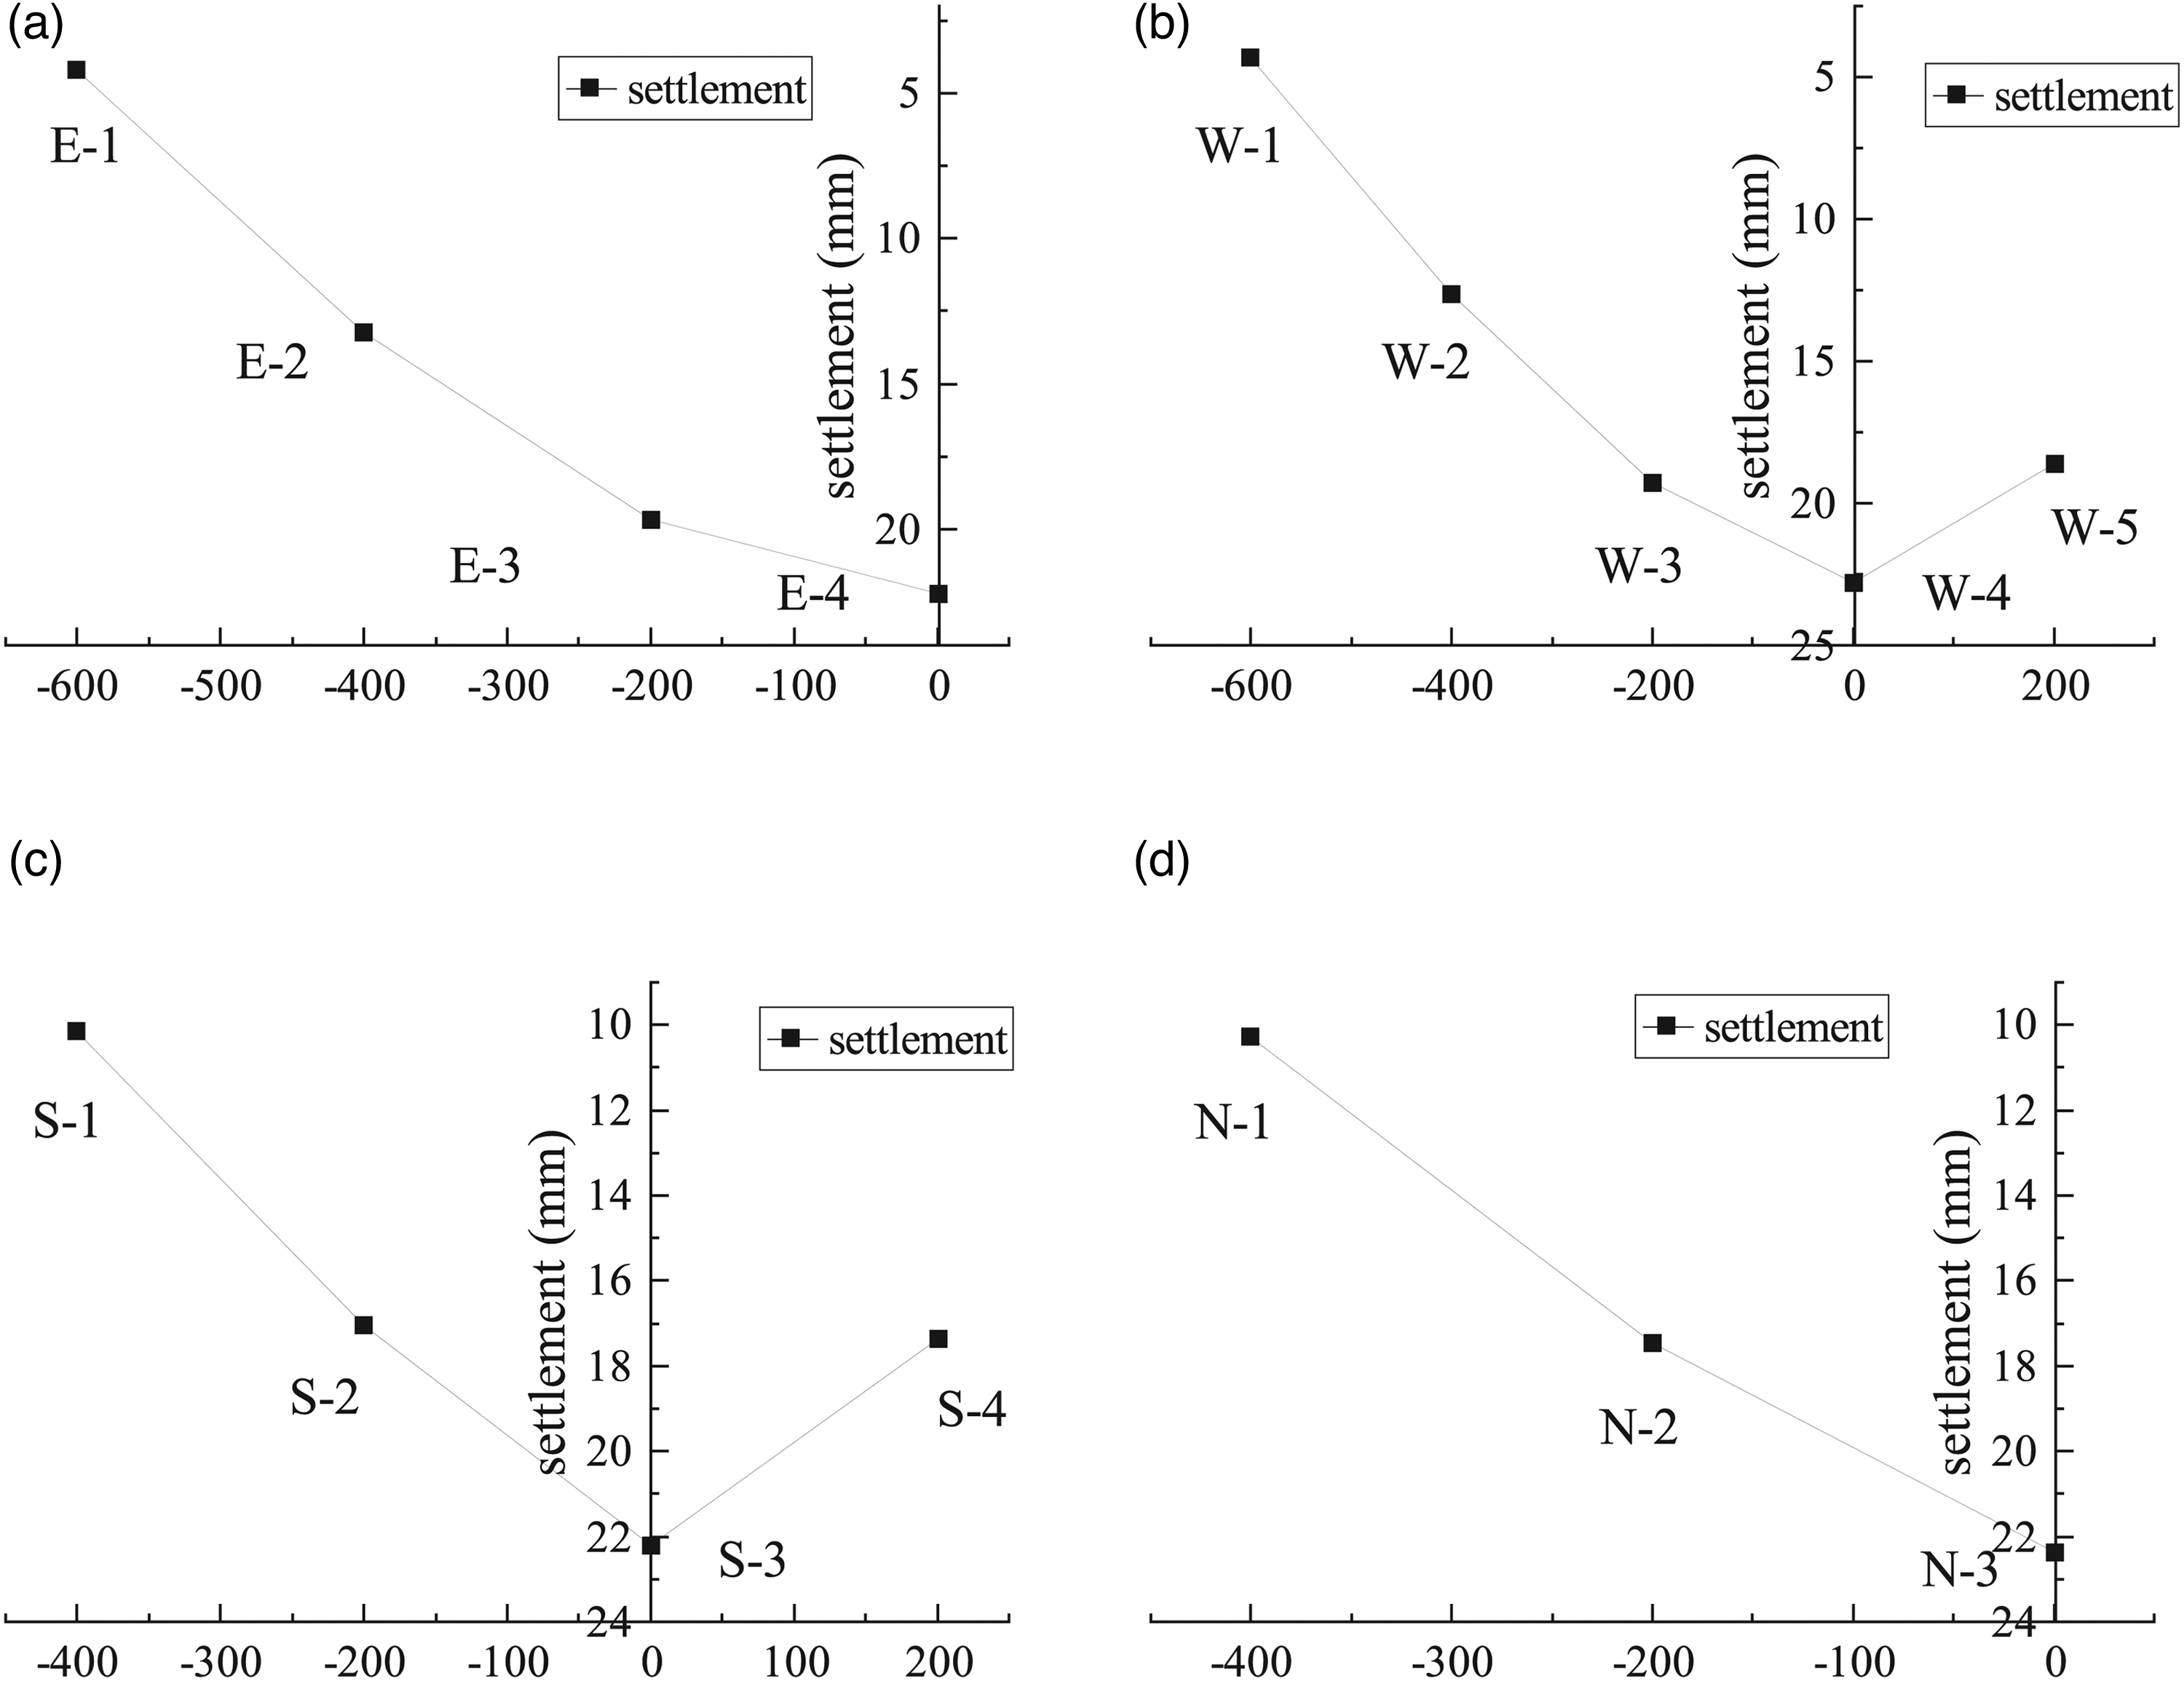
Surface settlement curve. (a) East surface settlement curve. (b) west surface settlement curve. (c) south surface settlement curve. (d) north surface settlement curve.
Analysis of horizontal displacement results of model shaft
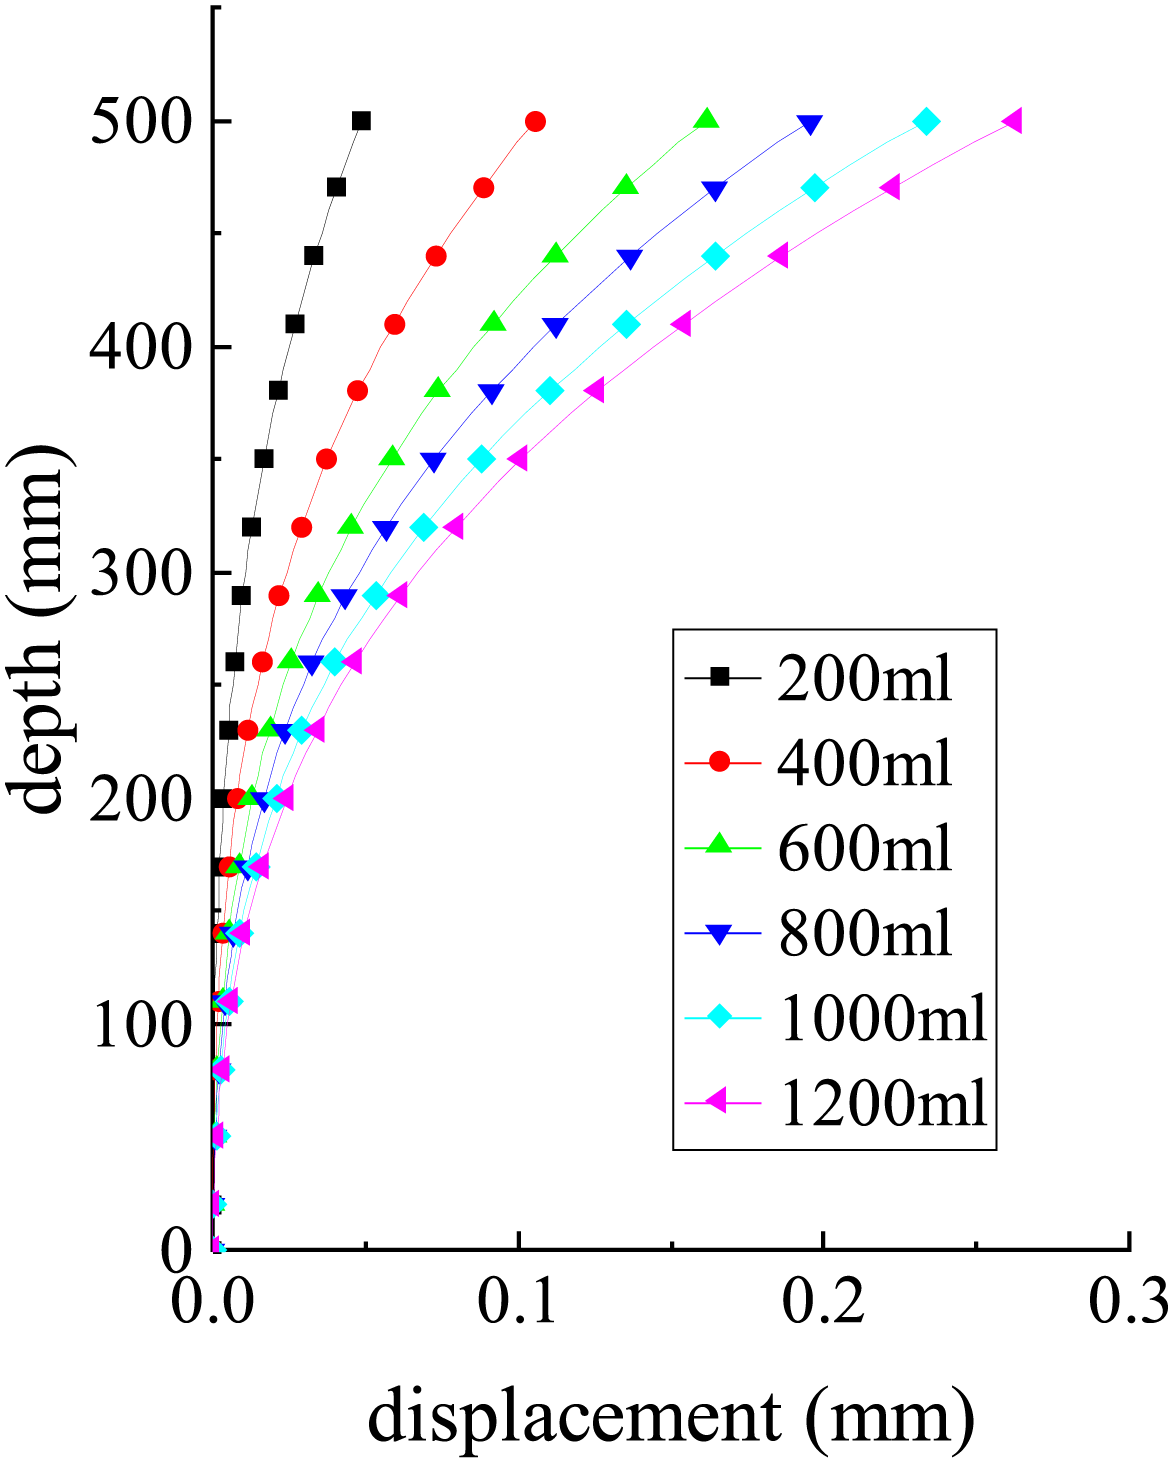
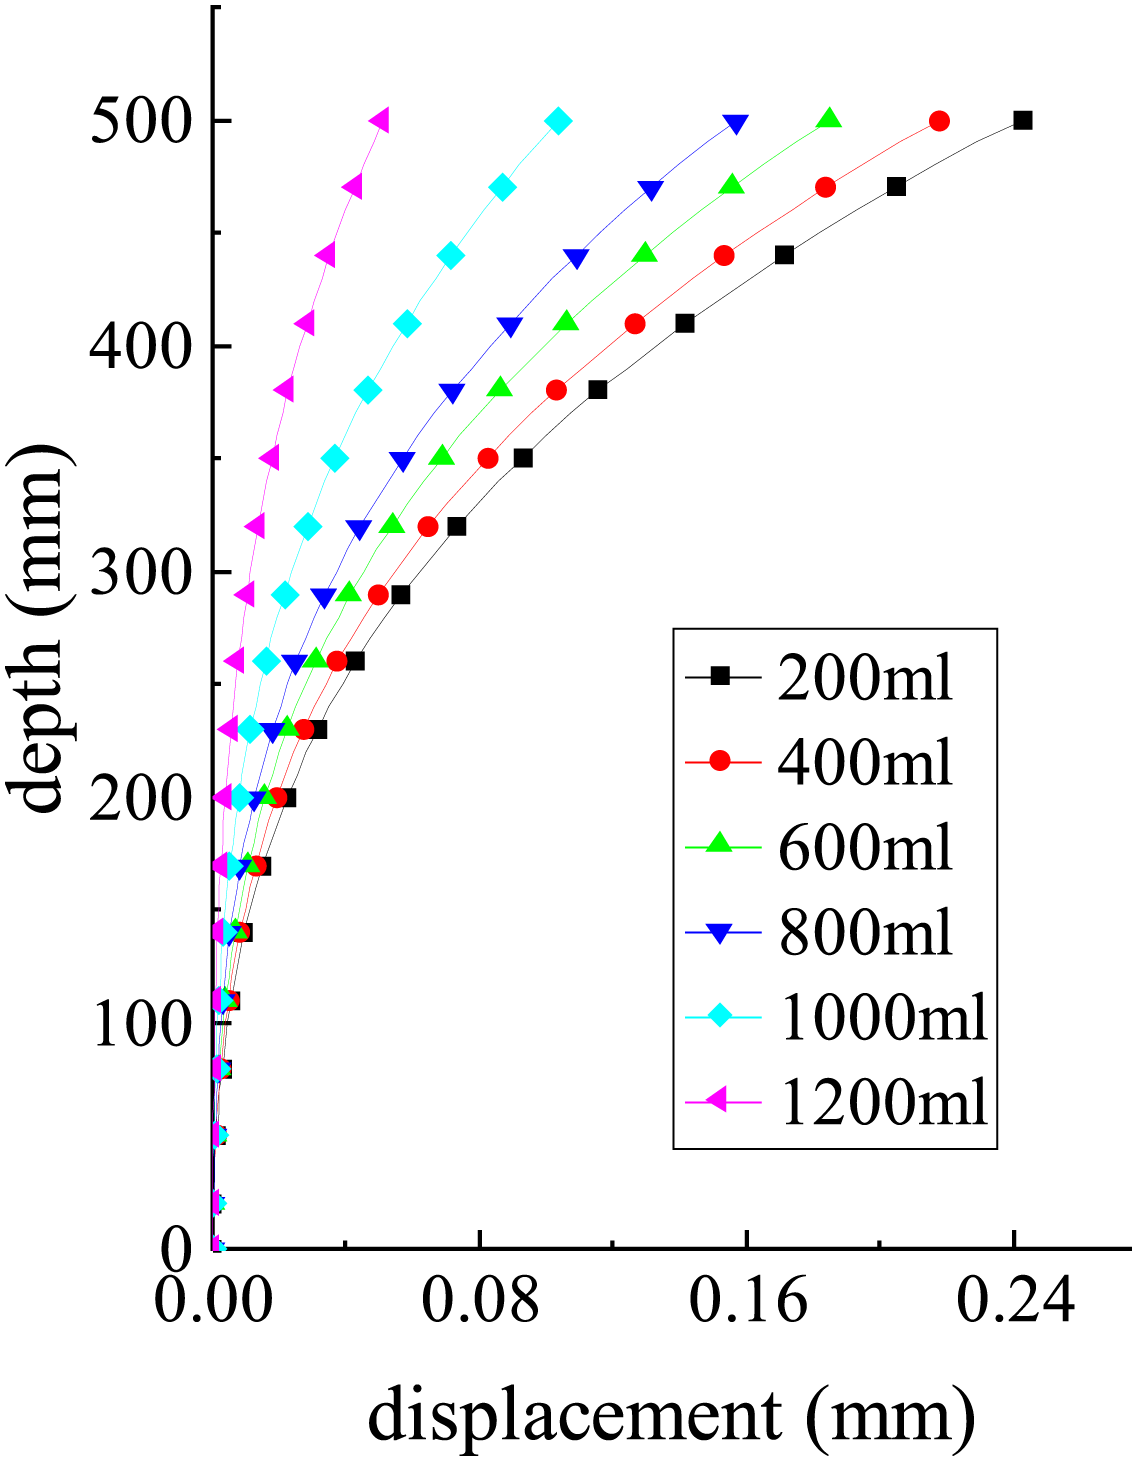
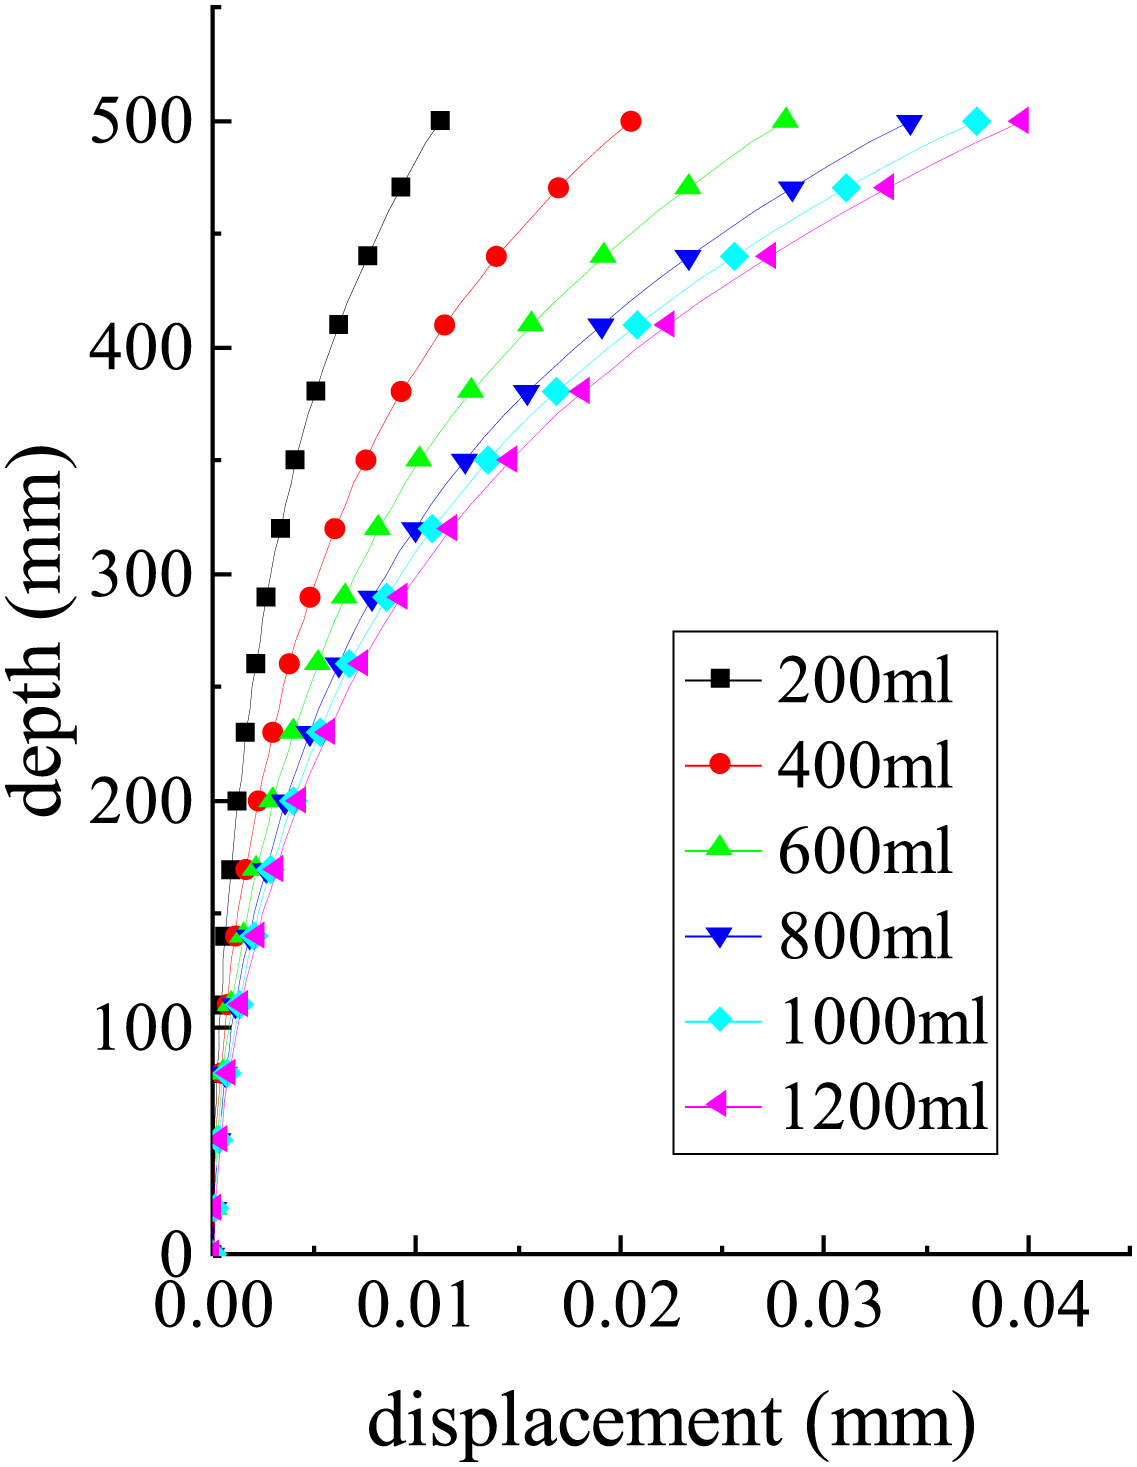
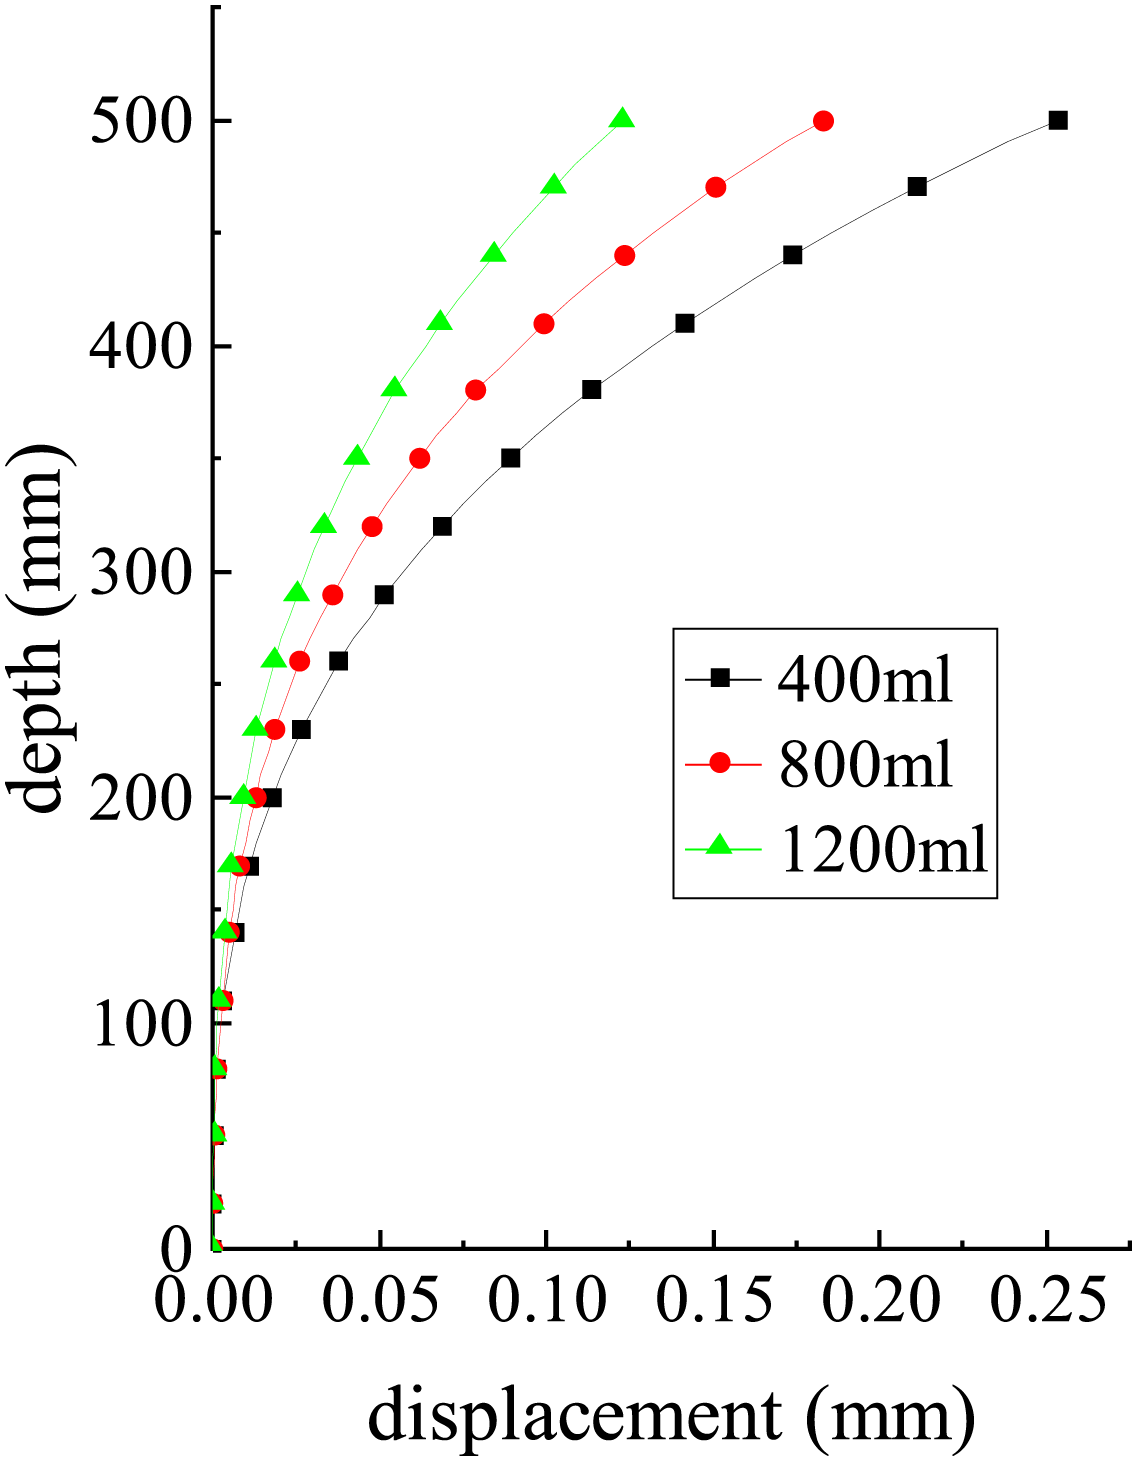
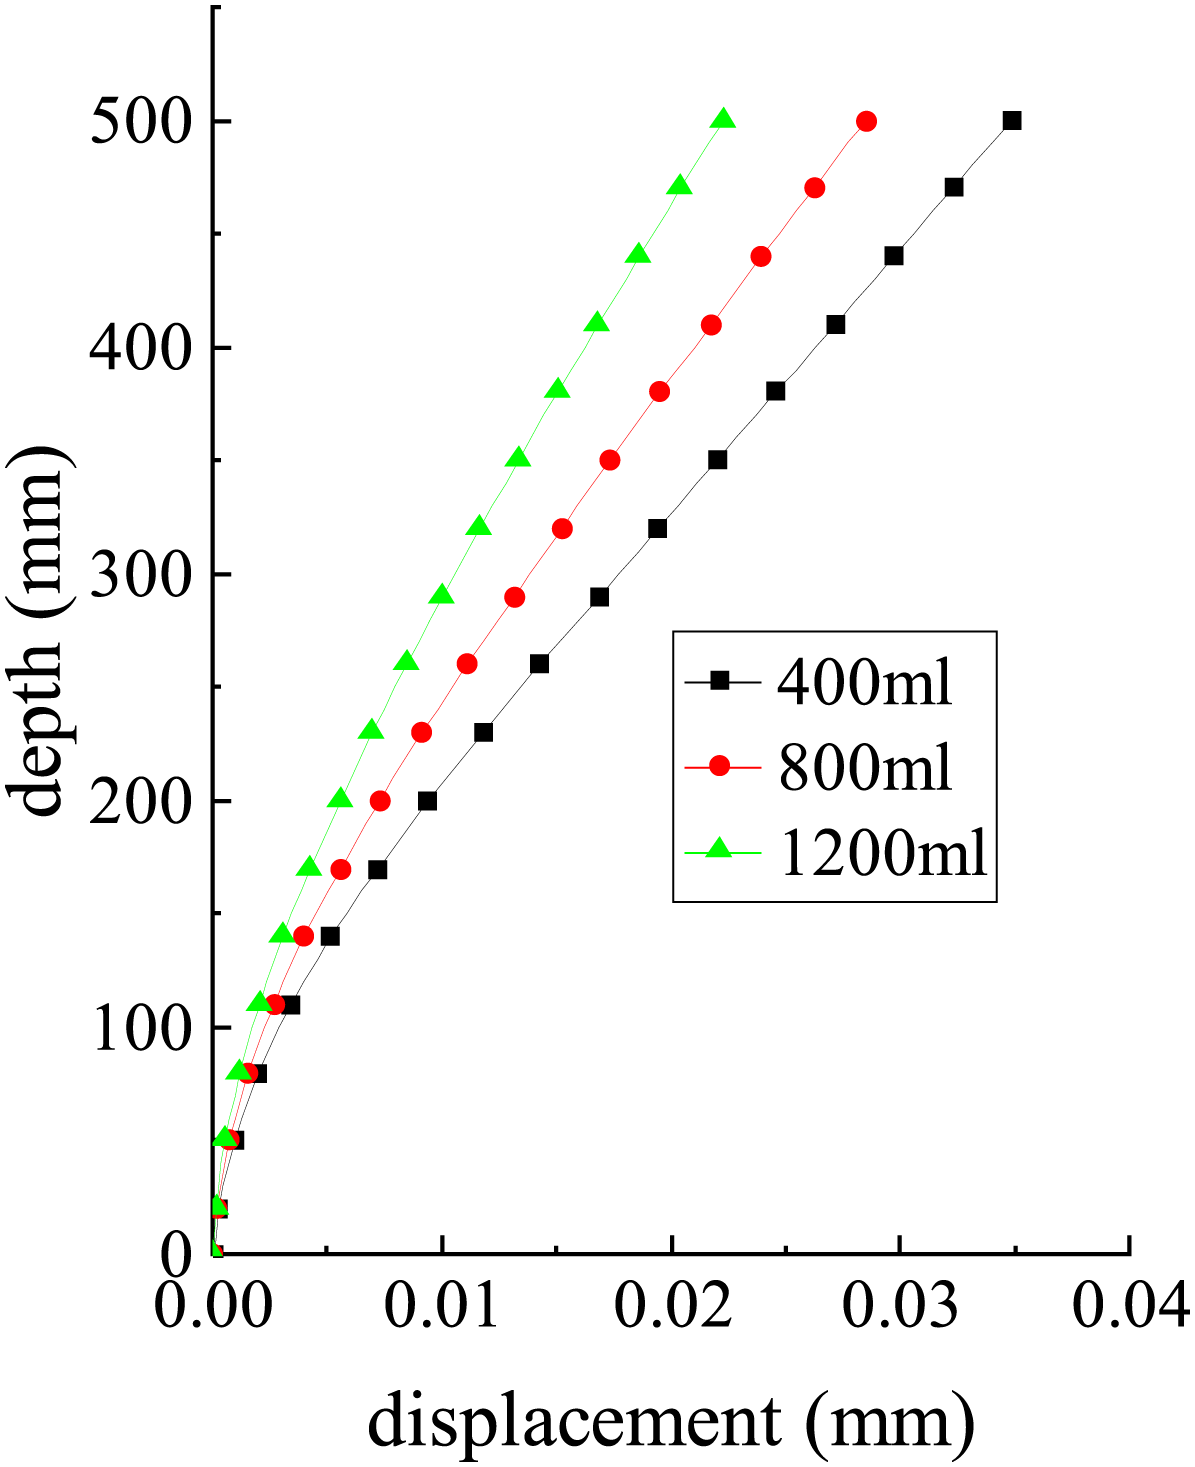
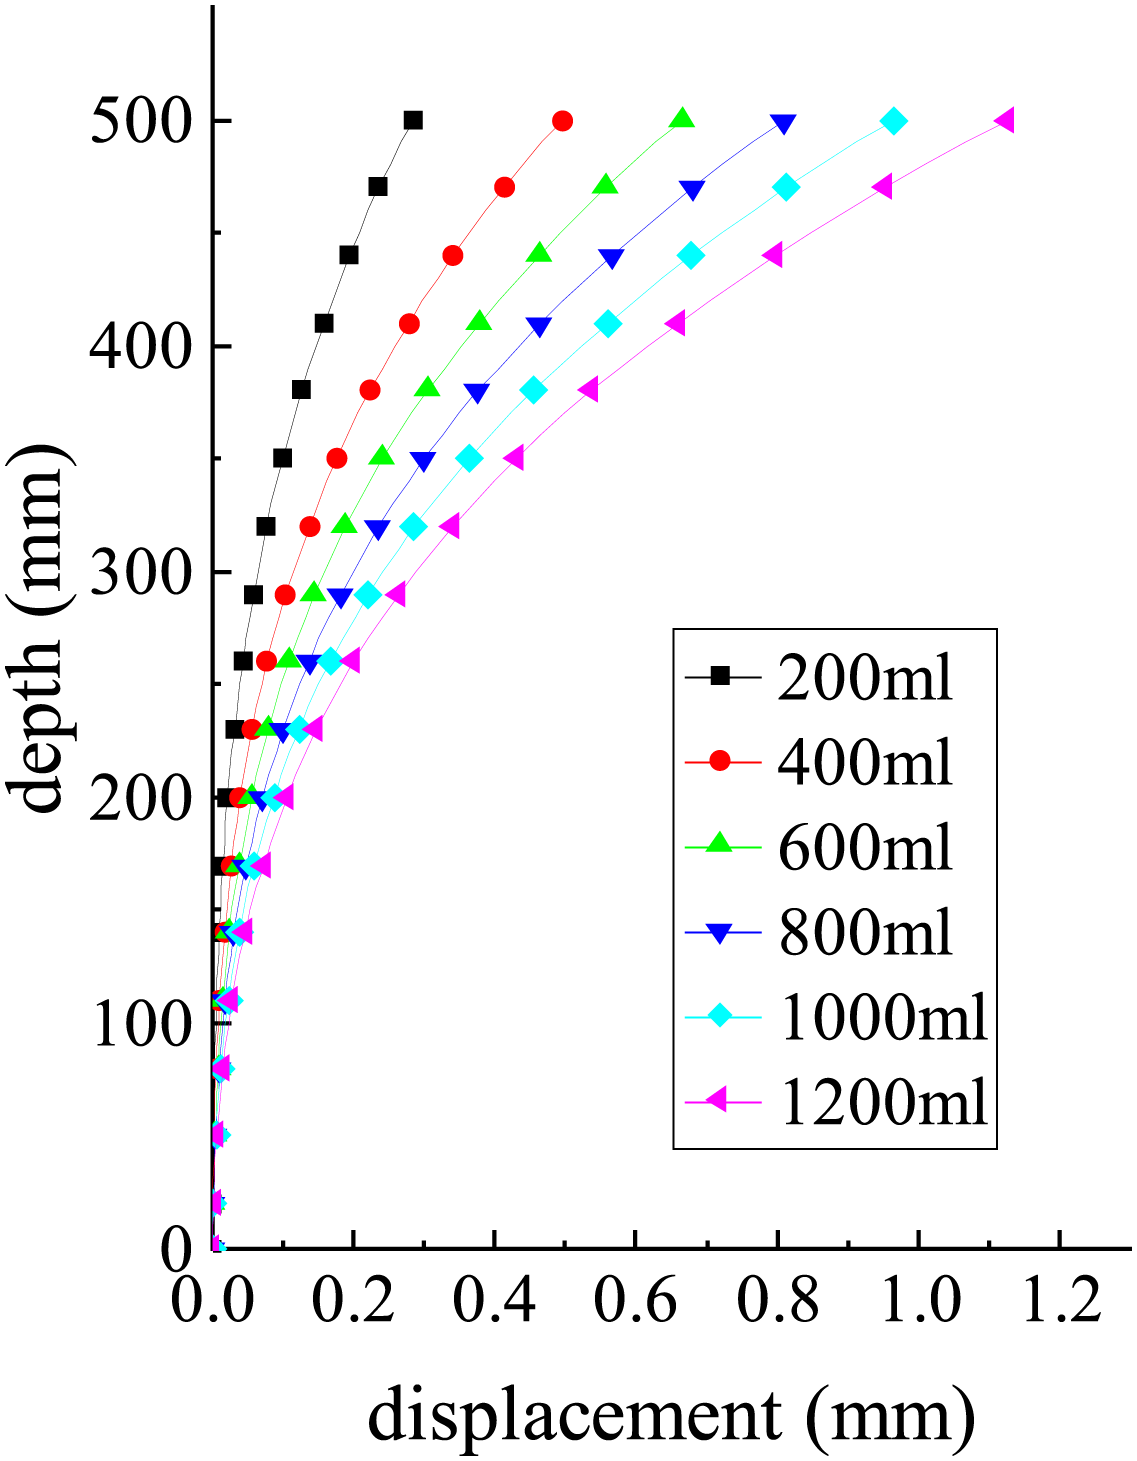
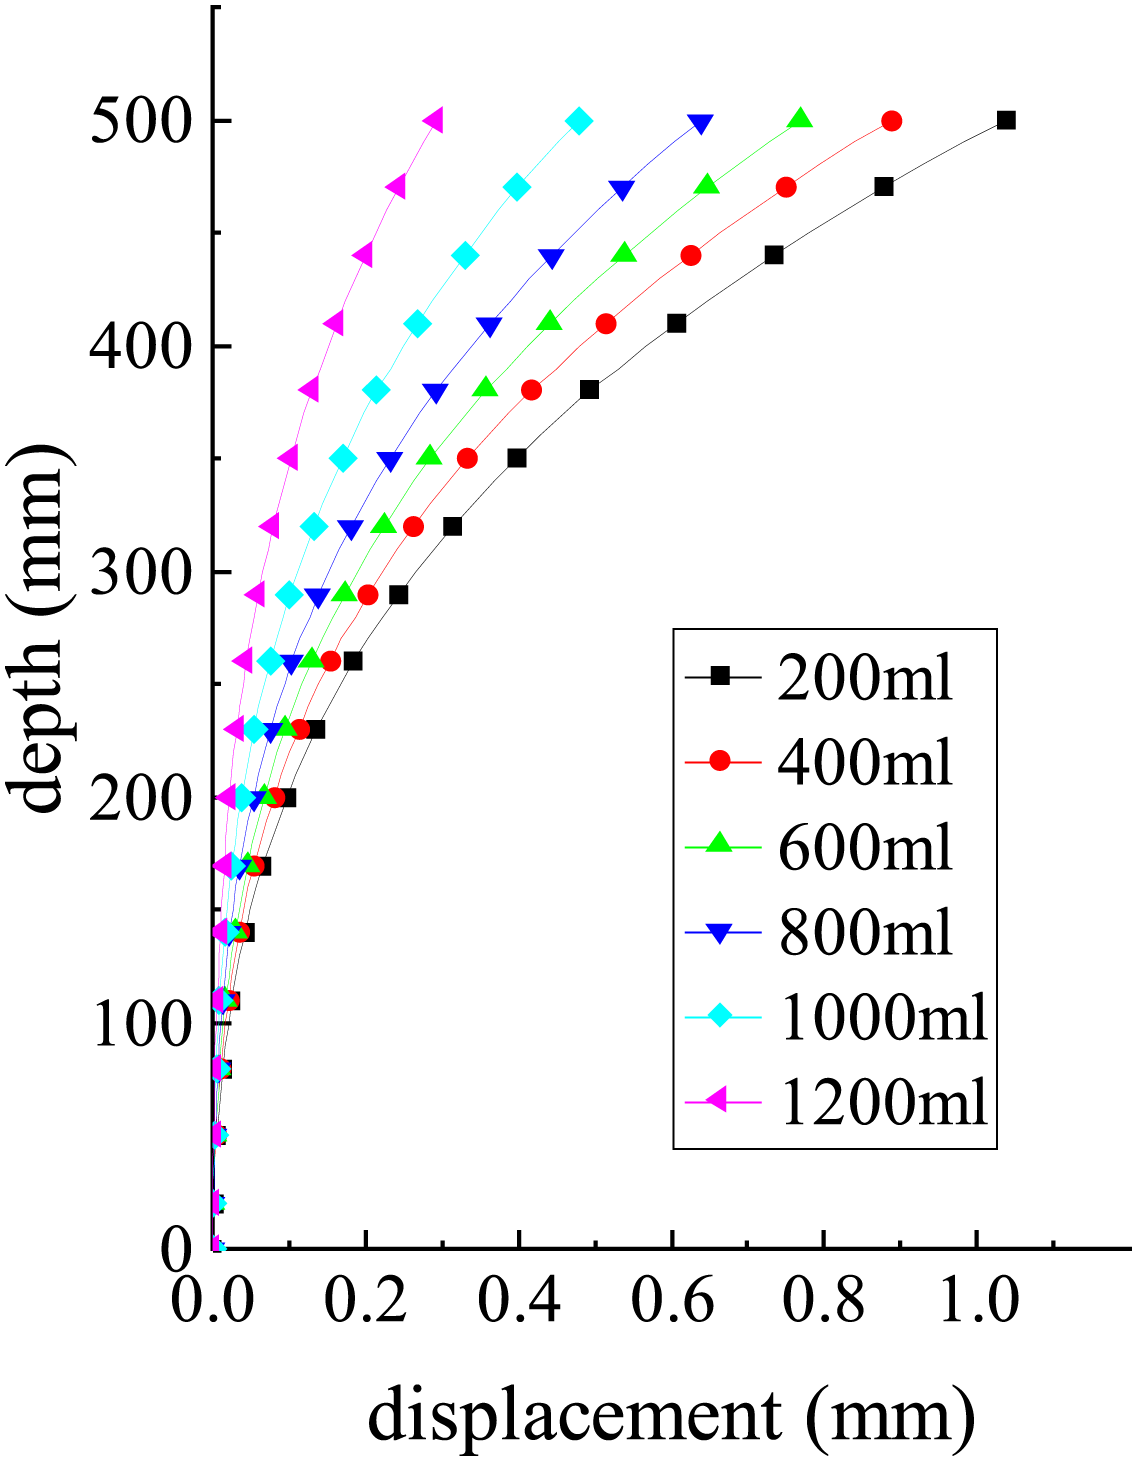
The upper surface of the hydraulic pillow was regarded as the geotechnical interface, the position is set as z = 0, and the position of the model shaft at z = 500 mm was regarded as the ground surface. The optical fiber monitoring data of 0∼500 mm section on the four survey lines of the model shaft were selected to calculate the horizontal movement value in the mining direction of each position of the model shaft (Figures 26–33).
Stage 4 horizontal displacement of model shaft in east-west direction.
Stage 5 horizontal displacement of model shaft in east-west direction.
Stage 6 horizontal displacement of model shaft in north-south direction.
Stage 7 horizontal displacement of model shaft in east-west direction.
Stage 8 model shaft East-West horizontal displacement.
Stage 9 horizontal displacement of model shaft in north-south direction.
Stage 10 horizontal displacement of model shaft from north to South.
Stage 11 horizontal displacement of model shaft in east-west direction.
The oil return of the East Hydraulic pillow and the West hydraulic pillow can be compared with the coal mining situation when the shaft protection rock pillar is designed according to the movement angle of 46.2°; The oil return of the South Hydraulic pillow and the North Hydraulic pillow can be compared with the coal mining when the shaft protection rock pillar is designed at 38.8°; Different oil return can simulate different coal seam mining heights. When the oil return volume of hydraulic pillow is 200 mL, 400 mL, 600 mL, 800 mL, 1,000 mL and 1,200 mL, that is, the excavation thickness of prototype coal seam is simulated as 6.3 m, 11.7 m, 14.14 m, 17.3 m, 20 m and 22.9 m.
By analyzing Figures 26 and 31, it can be found that under the condition of unilateral mining, the farther the mining distance is from the shaft, the smaller the horizontal displacement value of the shaft. When the excavation thickness of the simulated prototype coal is 6.3 m, 11.7 m, 14.14 m, 17.3 m, 20 m and 22.9 m, the horizontal movement caused by mining 800 m away from the shaft is 17%, 21.3%, 24.2%, 24.1%, 24.2% and 23.3% of that caused by mining 600 m away from the shaft, respectively.
By analyzing Figures 24, 27, 29 and 32, it can be found that mining areas of the same size at the symmetrical position of the shaft will significantly reduce the horizontal movement value of the shaft caused by unilateral mining. After 600 m symmetrical sequential mining, the horizontal displacement value becomes 22.9% of unilateral mining, and after 800 m symmetrical sequential mining, the horizontal displacement value becomes 19.1% of unilateral mining.
By analyzing Figures 26, 27, 28, 31, 32 and 33, it can be found that the horizontal movement of shaft caused by symmetrical mining and simultaneous mining is smaller than that caused by symmetrical sequential mining. The horizontal displacement of shaft caused by 600 m symmetrical simultaneous mining is 13.6% of symmetrical sequential mining, and the horizontal displacement of shaft caused by 800 m symmetrical simultaneous mining is 39.6% of symmetrical sequential mining.
In summary, the shaft deflection displacement caused by mining can be appropriately reduced by reducing the value of movement angle in the design of shaft protection rock pillar. Symmetrical mining can effectively reduce the deflection value of the shaft, and the effect of symmetrical simultaneous mining is better than symmetrical sequential mining.
Discussion and conclusions
In this paper, the deformation law of shafts in deep soil caused by different mining methods was studied by using the seepage hydraulic simulation method. The shaft deviates to the direction of coal mining, and when the distance between the coal and the shaft increases, the deflection of the shaft will increase. This law has been proved by Peng (2019) through a two-dimensional similar simulation test, which is consistent with this study, but he only obtains the influence of coal mining on the various characteristics of the shaft. Han (2021) only considered the influence of unilateral mining on shaft deformation in his study. In this paper, the quantitative results of shaft deflection caused by different mining distances and mining methods are obtained.
Based on the similarity theory, this paper studies the deformation law of shaft caused by mining under deep soil by using the “ Simulation test system for shaft sinking with kilometer scale-topsoil freezing method “ of the State Key Laboratory for geotechnics and deep underground engineering of China University of mining and technology. The following results have been achieved:
The displacement of the center point of the hydraulic pillow is slightly less than the settlement displacement of the model stratum surface directly above the center of the hydraulic pillow, and a settlement basin is formed directly above the center of the hydraulic pillow. Considering the consolidation settlement in seepage stage, it is feasible to use the oil return of hydraulic pillow to simulate the disturbance of coal mining. There is an approximate linear positive correlation between the horizontal displacement of the shaft caused by mining and the mining thickness of coal. Obviously, the influence of mining thickness of coal should be fully considered in the design of the shaft protection rock pillar. In a reasonable range, the larger the movement angle in the design of the shaft protection rock pillar, the smaller the horizontal displacement of shaft caused by coal mining. Compared with unilateral mining, symmetrical mining can reduce the horizontal movement value. And the horizontal movement value of shaft caused by symmetrical simultaneous mining is smaller than that caused by symmetrical sequential mining. The horizontal movement of shaft caused by coal seam mining decreases with the increase of shaft depth, which is the main reason for shaft deflection.
In summary, symmetrical mining can significantly reduce the horizontal displacement of shaft caused by coal mining. This method can increase the safety of the shaft and provide guarantee for the safe production of the mine.
Footnotes
Acknowledgements
We gratefully acknowledge the National Natural Science Foundation of China (41474122, 41974164, 51323004) for funding this study.
Declaration of conflicting interests
The author(s) declared no potential conflicts of interest with respect to the research, authorship, and/or publication of this article.
Funding
The author(s) disclosed receipt of the following financial support for the research, authorship, and/or publication of this article: This work was supported by the National Natural Science Foundation of China (grant number 41474122, 41974164, 51323004).