
Abstract
Carbonate reservoirs are highly heterogeneous. During waterflooding stage, the channeling phenomenon of displacing fluid in high-permeability layers easily leads to early water breakthrough and high water-cut with low recovery rate. To quantitatively characterize the inter-well connectivity parameters (including conductivity and connected volume), we developed an inter-well connectivity model based on the principle of inter-well connectivity and the geological data and development performance of carbonate reservoirs. Thus, the planar water injection allocation factors and water injection utilization rate of different layers can be obtained. In addition, when the proposed model is integrated with automatic history matching method and production optimization algorithm, the real-time oil and water production can be optimized and predicted. Field application demonstrates that adjusting injection parameters based on the model outputs results in a 1.5% increase in annual oil production, which offers significant guidance for the efficient development of similar oil reservoirs. In this study, the connectivity method was applied to multi-layer real reservoirs for the first time, and the injection and production volume of injection-production wells were repeatedly updated based on multiple iterations of water injection efficiency. The correctness of the method was verified by conceptual calculations and then applied to real reservoirs. So that the oil field can increase production in a short time, and has good application value.
Keywords
Introduction
Carbonate reservoir with wide distribution, uniform thickness and good physical properties plays a crucial role in the global oil and gas exploration and development. According to incomplete statistics, the oil and gas reserves in carbonate reservoirs account for about 50% of the global oil and gas reserves, and the oil and gas produced from carbonate reservoirs occupies approximately 60% of the total oil and gas production worldwide. Carbonate reservoirs are widely distributed in the Middle East, North America, Central Asia and other regions. The oil production in the Middle East accounts for about 2/3 of the global oil production, and 80% of which comes from carbonate rocks (Jin and Tian, 2013). And in North America, the oil recovered from carbonate reservoirs makes up about half of the regional oil production. It is obvious that carbonate reservoirs are important, but the efficient exploitation of the reserves is not easy. The main problems include (Li et al., 2018): (1) carbonate reservoir has multi-scale features with strong heterogeneity and anisotropy, which makes it difficult to accurately and effectively characterize the geological characteristic using current numerical simulation technologies; (2) The abundant pores, fractures and other high permeability channels in the reservoir space make the occurrence of injection water channeling quite normal. The formation of channeling-path significantly increases the possibility of burst water flood and rapid production decline; (3) It is difficult to conduct high-efficiency flooding; (4) The overall recovery is low, which is only 15.9%. Therefore, it is crucial to design rational development mode and well working system. The commonly applied methods to determine the reasonable productivity and thereafter to rationalize well working system are as following (Peng, 2012):
Systematic well testing method: Determine the maximum open flow rate use systematic well testing method and the value corresponds to one-third ∼ one-fourth of the open flow rate is defined as the reasonable productivity. It is worth noting that sufficient systematic well testing data is a preliminary for this method. Numerical simulation method: Establish a numerical model of the real reservoir and conduct multi factors are used to control the run of the simulation, therefore, the reasonable productivity is determined. This method fits better for homogeneous reservoir and may result in serious distortion for fractured-vuggy reservoirs with strong heterogeneity. Laboratory test method: Select and run the typical model under the fully consideration of the reservoir conditions and determine the reasonable productivities of different oil-bearing units. This method is more applicable for oil-bearing unit with simple reservoir conditions. Empirical statistical analysis method: Conduct a systematical study on the dynamic and static characteristics of the reservoir, analyze the well production features, classify the oil-bearing unit, screen out the main controlling factors that affect the well productivity, and then determine the reasonable productivities. This method is widely applicable.
Connectivity identification is the key to reservoir description and water injection development design. I It is also an important foundation for the establishment of well production system. Many scholars have done a lot of researches in this area. Heifer (1997) used Spearman rank correlation method to calculate the correlation coefficient between injection and production wells. They concluded that the change trend of correlation coefficient between wells is consistent with change of average maximum horizontal stress without considering the time lag of the input injection signal. Albertini and Lake established a cross-well connectivity inversion method (MLP) using dynamic data based on multiple linear regression by setting injection volume as the independent variable and fluid production as the dependent variable. Their research showed that the inverted inter-well connectivity coefficient was independent with the injection and production volume, and only changed with the geological characteristics and the wells locations. Inspired by the model of Albertoni and Lake (2003), capacitance-resistance model (CRM) was established by Yousef et al. (2006). Compared to previous correlation-based methods, CRM is developed based on physical law of material balance and hence is more accurate to predict the future performance of a reservoir. In CRM, two key parameters are defined along each injection-producer pair, namely, the time constant and the allocation factor, where the latter one can quantitatively indicate the fraction of water injected from one injector flowing to its associated producer. More works have been focused on extending the applicability of CRM. For example, Kaviani et al. (2012) developed an improved version of CRM, which can be used to address the situation that the bottom-hole pressures (BHP) of wells are unmeasured and fluctuating. Cao et al. (2015) used the Koval (1963) model to study the multi-phase flow behavior. Wang et al. (2017) focused on predicting the future waterflooding performance of low-permeability reservoirs with a slight modification to the original CRM formulation. However, one issue related to CRM is the empirical estimation of phase rate in a multiphase flow system.
In 2015, Zhao (Zhao et al., 2016b) taken inter-well connected units as the simulation object and first proposed the connectivity inversion model. He discretized the reservoir into connected units and characterized the units with parameters including inter-well conductivity and connected volume, and simulated oil-water dynamics based on material balance principle.
The model was solved by history matching algorithm, and the preferential seepage direction, the water injection allocation factors, and the water influx were quantified. This method has made the accurate calculation of the oil-water two-phase possible for the first time by using a connectivity model and was compatible with complicated environmental changes and other disturbances. Compared with traditional connectivity methods and numerical simulation methods, the calculation speed increased by nearly a hundred times and the accuracy could be guaranteed.
The artificial water injection schemes were generally design based on the results generated by reservoir engineering methods or numerical simulation techniques. However, this method is highly random, time-consuming and labor-intensive, and in some cases, fake “optimal scheme” might be given. As a result, reservoir dynamic real-time production optimization theory serves for automatic injection-production scheme design becomes a research hotspot for current oilfields. Combine reservoir numerical simulation technology with optimization theory, the procedure to determine the oil and water well injection and production parameters can be transformed to finding the solution of the optimal control model by maximizing the model functions using adjoint gradient, stochastic perturbation gradient algorithm, heuristic algorithm, etc. Thereafter, the optimal working system was automatically generated. Due to the great difficulty in solving gradient algorithm, the great calculation, and the high dimensionality of the actual case, the efficiency of the optimization algorithm is significantly reduced, it is necessary and urgent to find a simple, efficient and fast calculation method to guide the design of well work systems and on-site development programs.
Zhao et al. in 2016 (Zhao et al., 2016b) applied the history-matched inter-well connectivity model as the dynamic prediction basis and established a production optimization control model for a single-layer reservoir aiming at finding a new set of injection and production schemes to maximize the economic net present value. In their model, optimization algorithm was applied, the economic net present value considering the oil price, water injection cost, water production cost and economic factors in the development process is the objective function, the future oil-water well working system is the control parameter, the oilfield fluid production, water injection rate, the oil-water well production control range and other conditions are the constraint conditions. Based on similar method, Zhao and Xu (Hui et al., 2019) successfully established an injection-production optimization model for a real single-layer reservoir by calculating the single-well water injection efficiency, the overall water injection efficiency, and the water injection allocation factors. However, in these two cases, the INSIM-based injection-production optimization method both were targeting at single-layer reservoirs, and there are scarce information on the applications of IMSIM for multi-layer complex reservoirs.
In this paper, an INSIM-based longitudinal multi-layer connectivity model is constructed to better describe the multi-layer carbonate reservoirs in China. The inter-well injection-production connectivity parameters are obtained through automatic history matching inversion method and the inter-well connectivity of different layers is finely depicted. What’s more, the flowing characteristic parameters at different development stages are modified by tracer data, and the real-time distribution of the inter-well connectivity is obtained (Peaceman, 1977); it is the first time to try the optimization method for separate layer water injection in multi-layer reservoir with the intention of reducing invalid water circulation and improving water injection efficiency. Through iterative optimization, the real-time injection and production volumes are updated and adjusted, the preferential seepage channels in carbonate reservoirs are identified and the goals of decreasing water and increasing oil are achieved (Bhark et al., 2012).
Establishment of longitudinal multi-layer connectivity model
Model solution and parameter inversion
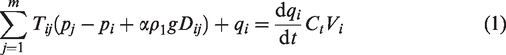
The connectivity model proposed by Zhao et al. (2014) is to discretized the reservoir into finite connected units according to the connectivity between oil and water wells. The fluid flow capacity and material basis of each connected unit were then characterized with two characteristic parameters, conductivity and connected volume (Hui et al., 2017). The material balance equation at reservoir conditions was shown in formula (1)
According to formula (1), the water saturation of each connected unit is calculated as following: (see references for the specific solution process)
Formula (2) was discretized using an implicit numerical scheme to solve the pressure
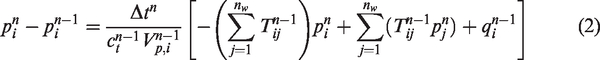
When i = 1, 2… 2. After the pressure of each well point was calculated, 3. Considering the edge water and bottom water of the reservoir, the water cut at x position 4. The derivative of the water cut ( 5. Through the linear difference of the water cut derivative

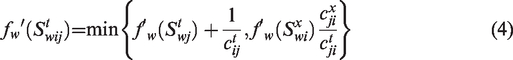
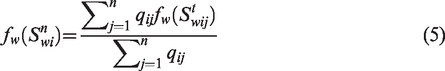
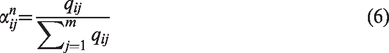
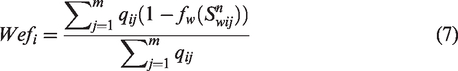
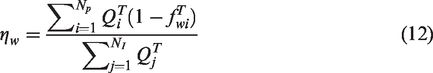
In formulas (2) and (3), 6. Assuming that well i is an injection well, the flow distribution coefficient 7. The water injection efficiency refers to the ratio between the total amount of crude oil displaced from the surrounding production wells by the water supplied by the injection well and the total distributed water in this direction. The accurate water injection efficiency is shown in formula (7)
After continuous optimization and adjustment of the characteristic parameters (conductivity and connected volume), the actual dynamic production data including water cut and daily oil production of a single well are matched. The complicate fitting process can be simply converted to find the characteristic parameter b to minimize the objective function O(b) in formula (8) (Kaoping, 2006)

where, b is the reservoir parameter (refer in particular to conductivity and connected volume in this paper);
The solution of this optimization problem is to minimize the objective function value while conforming to the constraints, then to obtain the corresponding control variable b. In this paper, gradient projection method is used to solve the constraints iteratively

where,
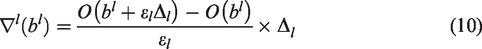
In formula (10),
Optimization of real time production and injection allocation
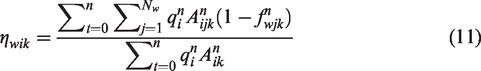
According to formula (5), the accurate water injection efficiency of each layer (Zhao et al., 2011) equals to, the amount of crude oil being displaced from the surrounding oil wells when taken the water injection well as the center and one-unit water is injected is calculated by formula (11)
where,
The utilization rate of injected water reflects the oil displacement efficiency of one-unit injection water. Lower the water injection utilization rate corresponds to less displaced crude oil at the same injected water volume and the worse the ineffective water circulation, indicating the possible existence of preferential seepage channels and the occurrence of water logging and water channeling; On the contrary, more displaced oil always represents better the production condition. Therefore, the ideas of evaluating the separate layer water injection efficiency and optimizing injection-production working scheme based on inter-well connectivity idea are proposed. Comparing the calculated water injection utilization rate of each water injection well with the average water injection utilization rate of the whole block, if the water injection utilization rate of a single well is smaller than the average water injection utilization rate of the whole block, reduce the injection volume, otherwise, increase the volume. Meanwhile, the injection-production working scheme is adjusted according to the updated water injection allocation factors to reduce the invalid water circulation and to increase the water flooding efficiency of the whole block. After a period of production, it is necessary to recalculate the water injection utilization rate and update the injection-production working scheme, and therefore to realize the dynamic optimization of injection-production policy. The specific procedures as following (Huang et al., 2017):
Calculate the average water injection utilization rate of the whole block at the last production time T, and use it as the standard to screen high and low efficiency wells. The specific calculation formula is (Zhao et al., 2018)
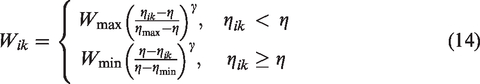
Classify and evaluate the high and low efficiency water wells. If the water injection efficiency 3. After the separated layer water injection scheme is updated, the production volume from oil wells is optimized based on the variations in injection volume and the water split coefficient according to formula (15)
where,


Repeat steps 1-3, update the injection production optimization scheme, and optimize the real-time dynamic production.
Concept example
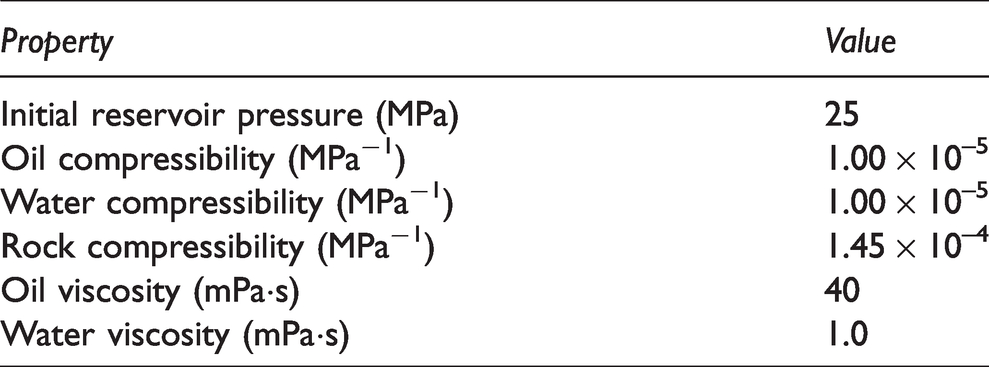
The validity of the proposed method is verified by applying to a multi-layer conceptual reservoir. In this paper, a 25 × 25 × 3 concept reservoir example with high permeability channels is constructed by ECLIPSE. The grid size is DX =DY = 25m, DZ = 15 m (DX, DY and DZ represent the grid size of X, Y, Z axis, respectively), the initial grid oil saturation is 0.8, and all the grid porosity is 0.2 The average permeability of each layer is 511.9 mD, 3010 mD and 1921 mD, separately. There are 9 wells in this model, including five water injection wells and four production wells, As shown in Figure 1. Table 1 shows the other attribute parameters.
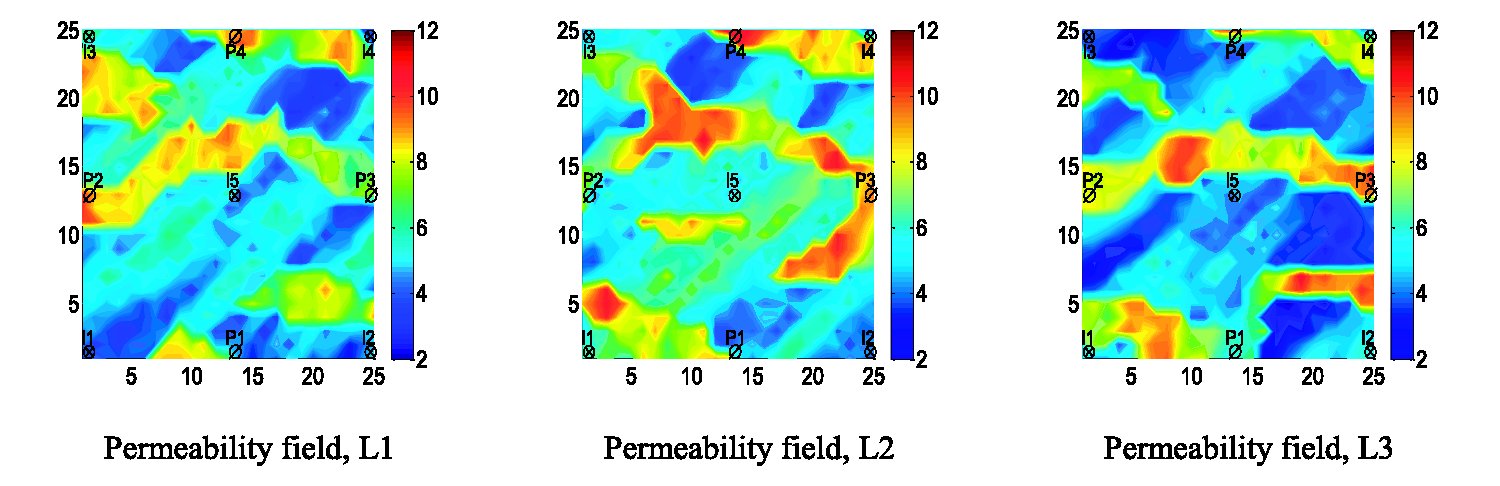
Permeability of different layers.
Physical properties of the concept reservoir.
The production cycle of the model is 1200 days, and has been divided into 40 times steps. The injection rate is 200 m3/d.
The production performance data of 1200 days generated by INSIM model are matched with the observed data obtained from the real model. The standard deviation of the normally distributed measurement error of the observed oil production rate data is set to be 5% of the observed data. Figure 2 shows the relationship between the function value and the iterative times. The value of the objective function decreases significantly in the first 30 iterations, and converges at 200 iterations. Figure 3 is the fitting results of water cut, cumulative oil production and daily oil production. The fitting accuracy is higher than 98%.
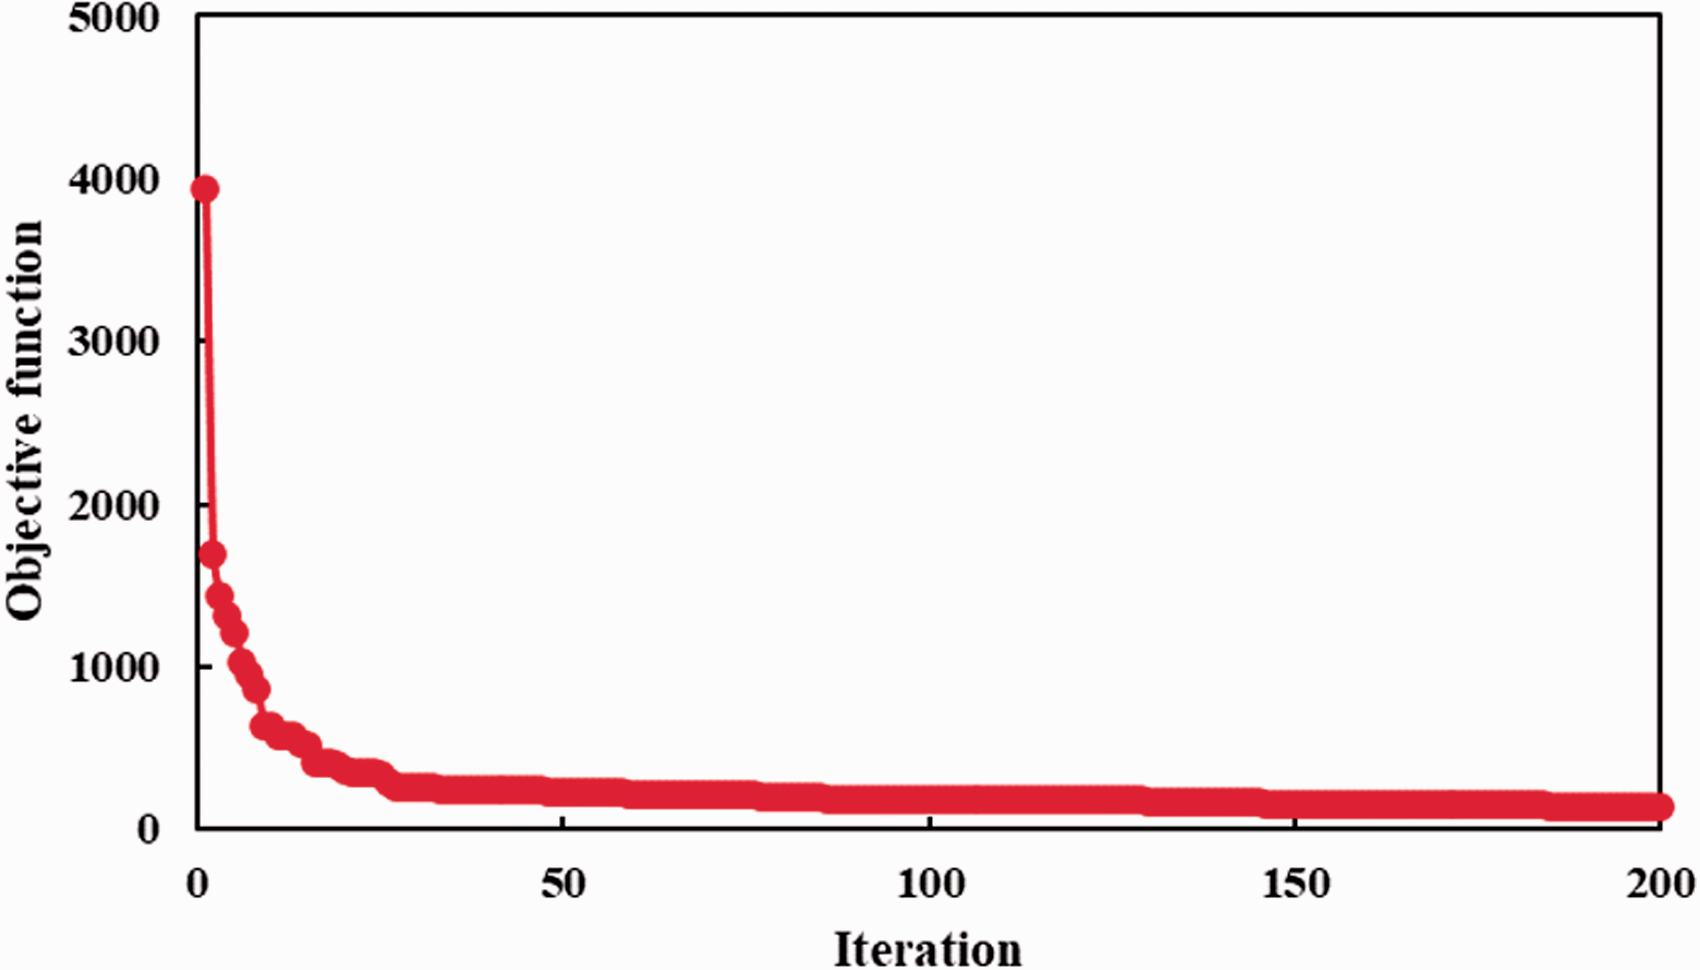
Objective function values vs. iteration numbers.
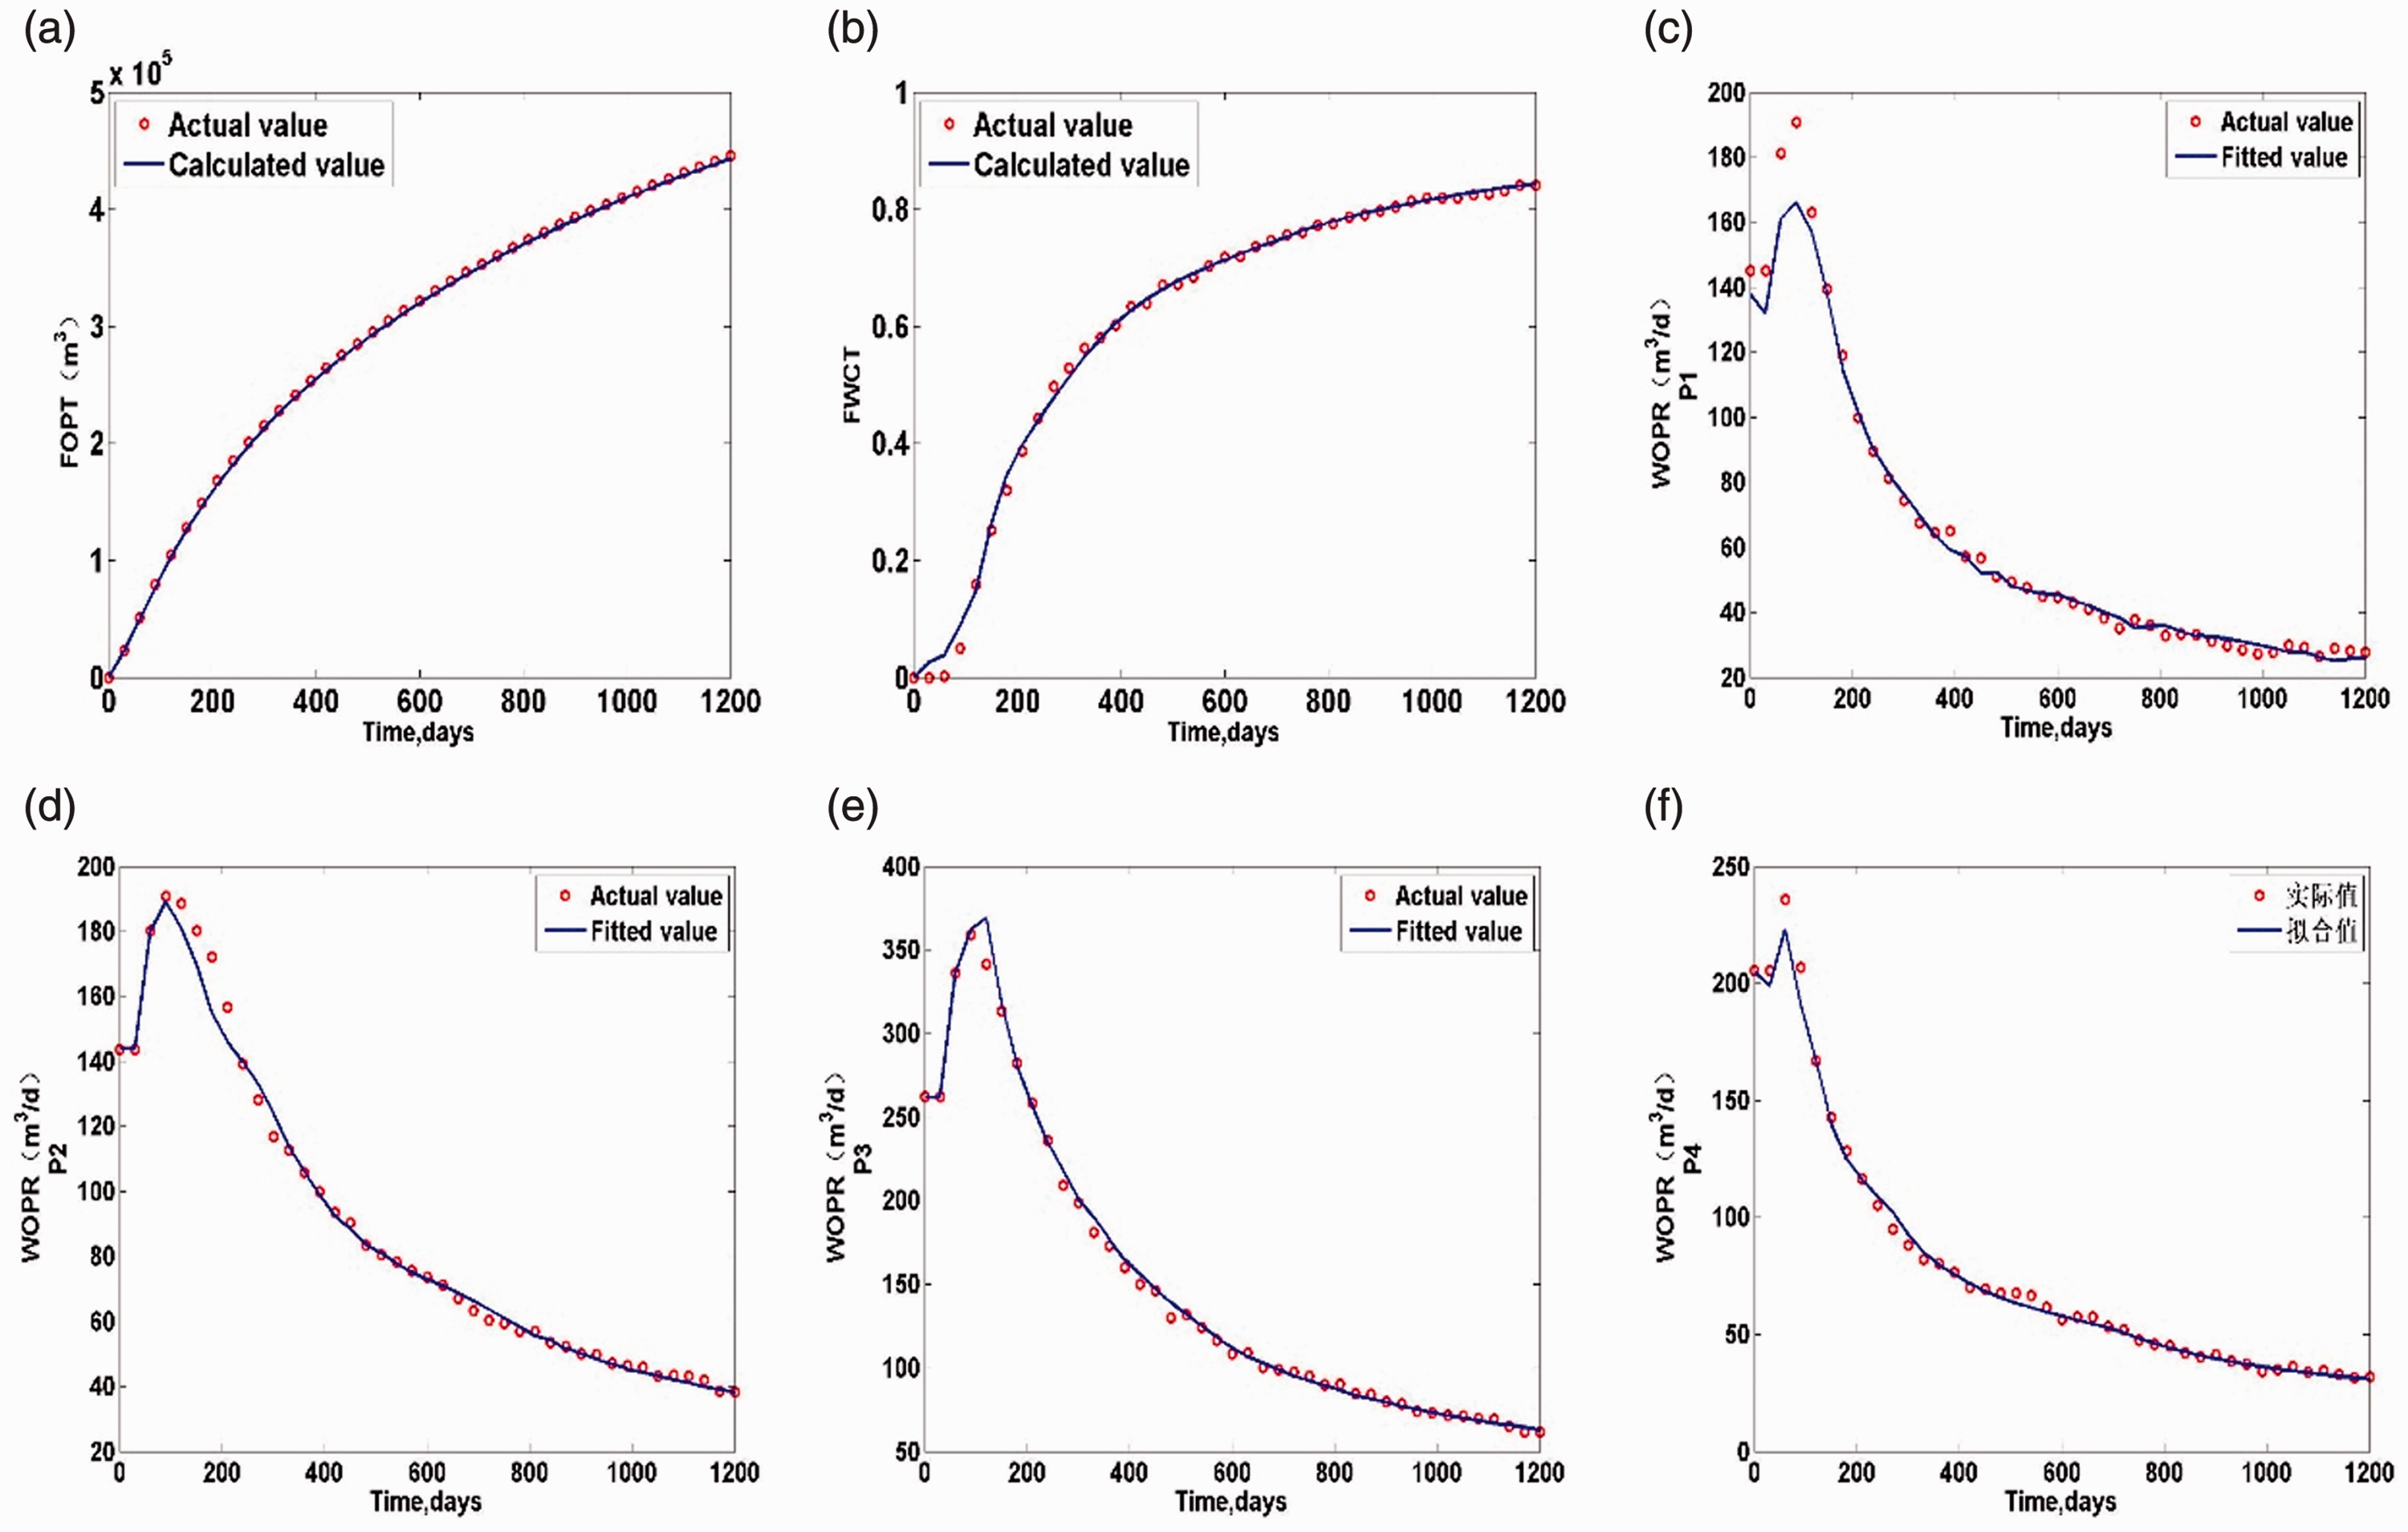
History matching results of the concept reservoir. (a) FOPT (b) FWCT (c) WOPR: P1 (d) WOPR: P2 (e) WOPR: P3 (f) WOPR: P4.
The reservoir model generated by inversion is applied for injection and production optimization with an injection efficiency-based injection- production regulation scheme. According to the method described above, the water injection efficiency of the five injection wells together with the average injection efficiency of the whole block are calculated. Then the wells are defined as either high or low efficiency well based on the average water injection efficiency of the block. Increase the injection volume for high efficiency well and decrease the volume for low efficiency well. After the optimization of the injection volume, the corresponding liquid production of each well is calculated according to the allocation factors of each oil well and then. optimize the liquid volumes of different wells. Herein, 180 day is a cycle, the water injection utilization rate of a single well and the average block water injection efficiency are recalculated at the end of each cycle. Thereafter, the new utilization rate and injection efficiency are used for the next cycle. After 3 cycles, good fitting between simulation data and production date is obtained, as shown Figures 4 to 6.
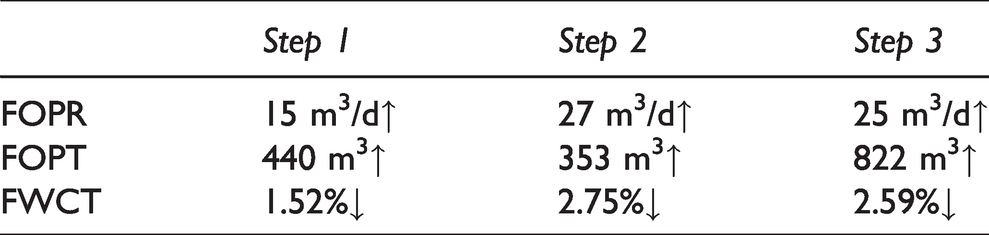
In Figures 4 to 6, the blue curve is the simulated production performance with original production system, and the red curve is the production performance obtained after three iterations of water injection efficiency. After iterative optimization, the oil production rate and cumulative oil production of the block significantly increased, and the water content has decreased. The black dotted lines in Figures 4 and 5 are the initial time of optimization stage of each iteration, it can be found that iterative optimization can significantly improve oil production rate and reduce the water content of the block in a short time, and then gradually reach a plateau, indicating that better block production dynamics can be achieved after each 180-day injection efficiency-based optimization cycle, as shown in Table 2. As a result, it is necessary to update the injection and production volume by multiple iterations of water injection efficiency.
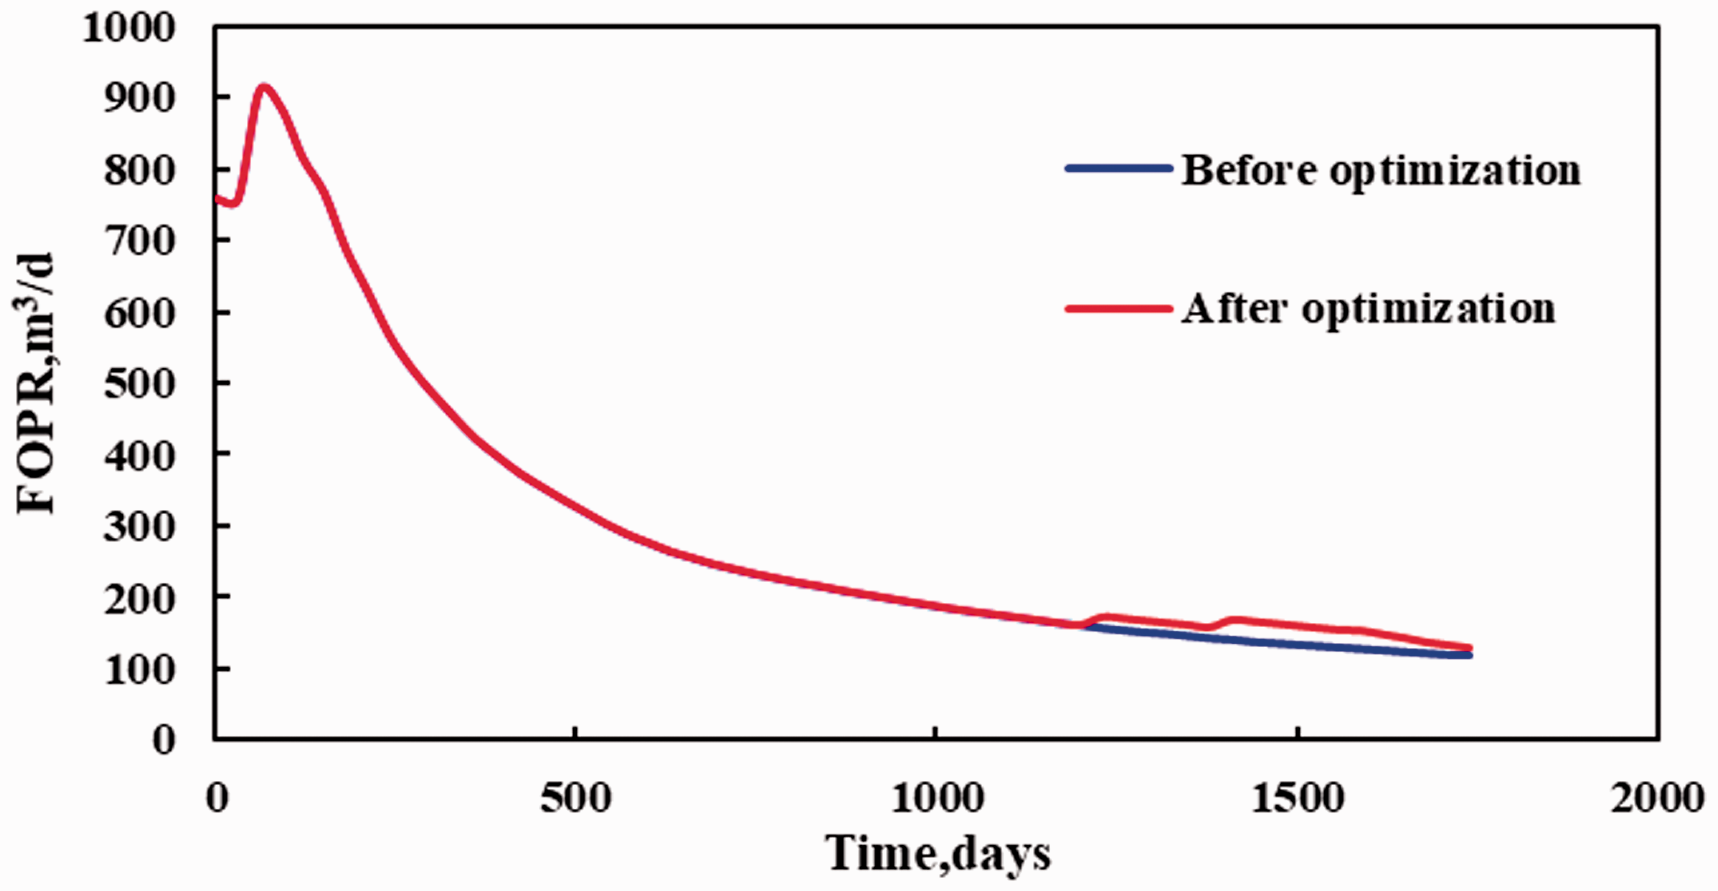
Before and after optimization of FOPR.
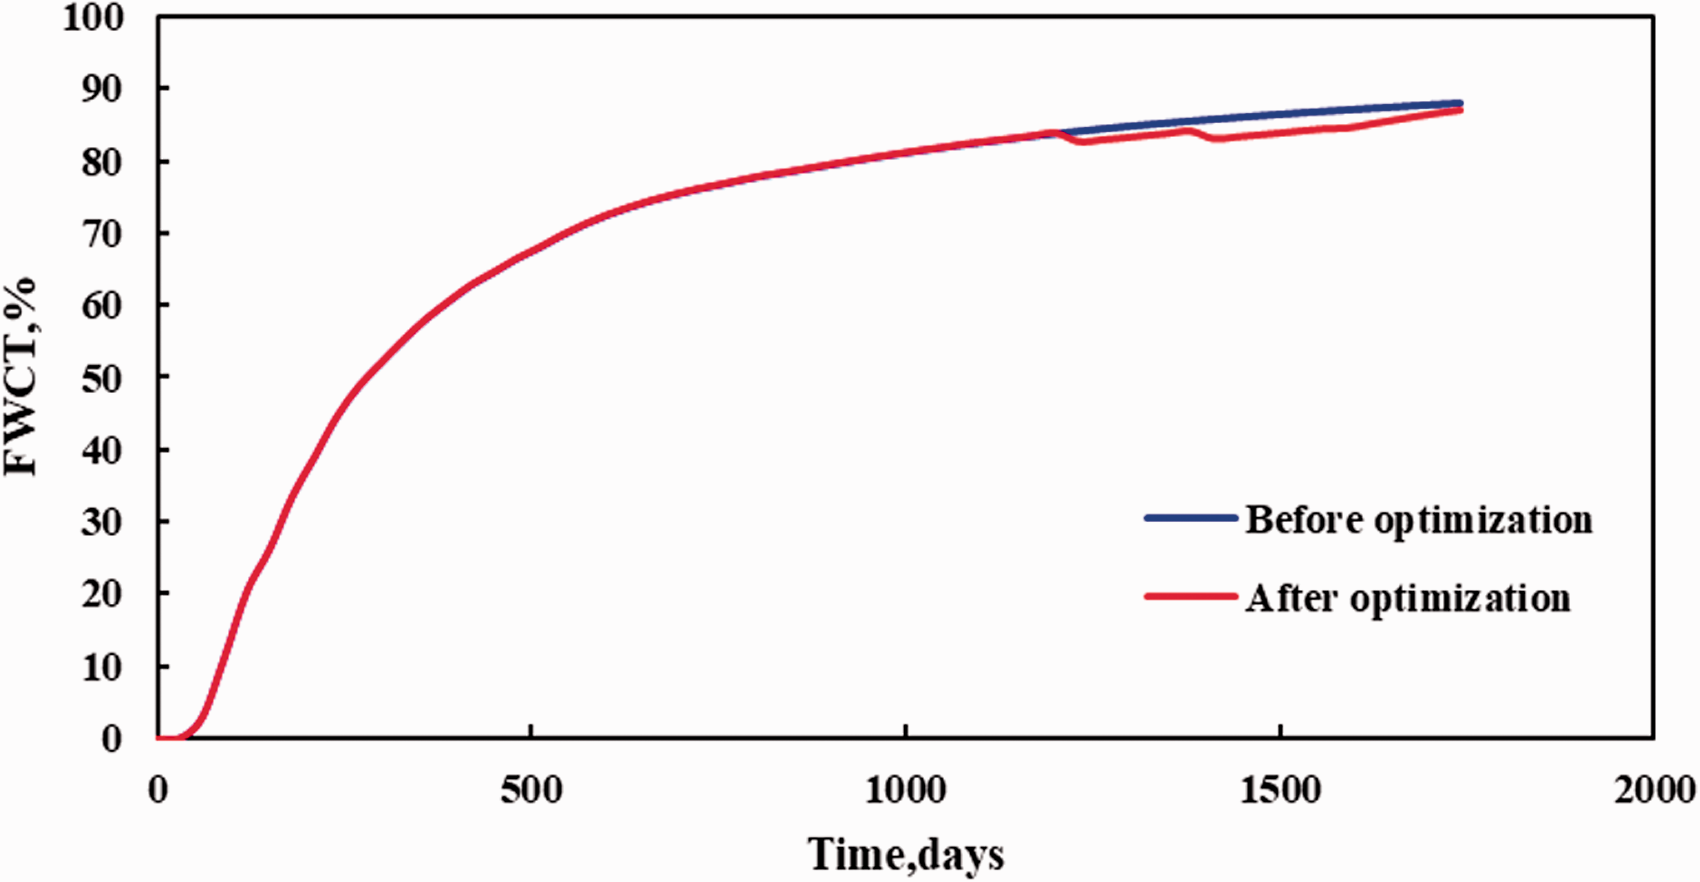
Before and after optimization of FWCT.
Comparison of field indexes.
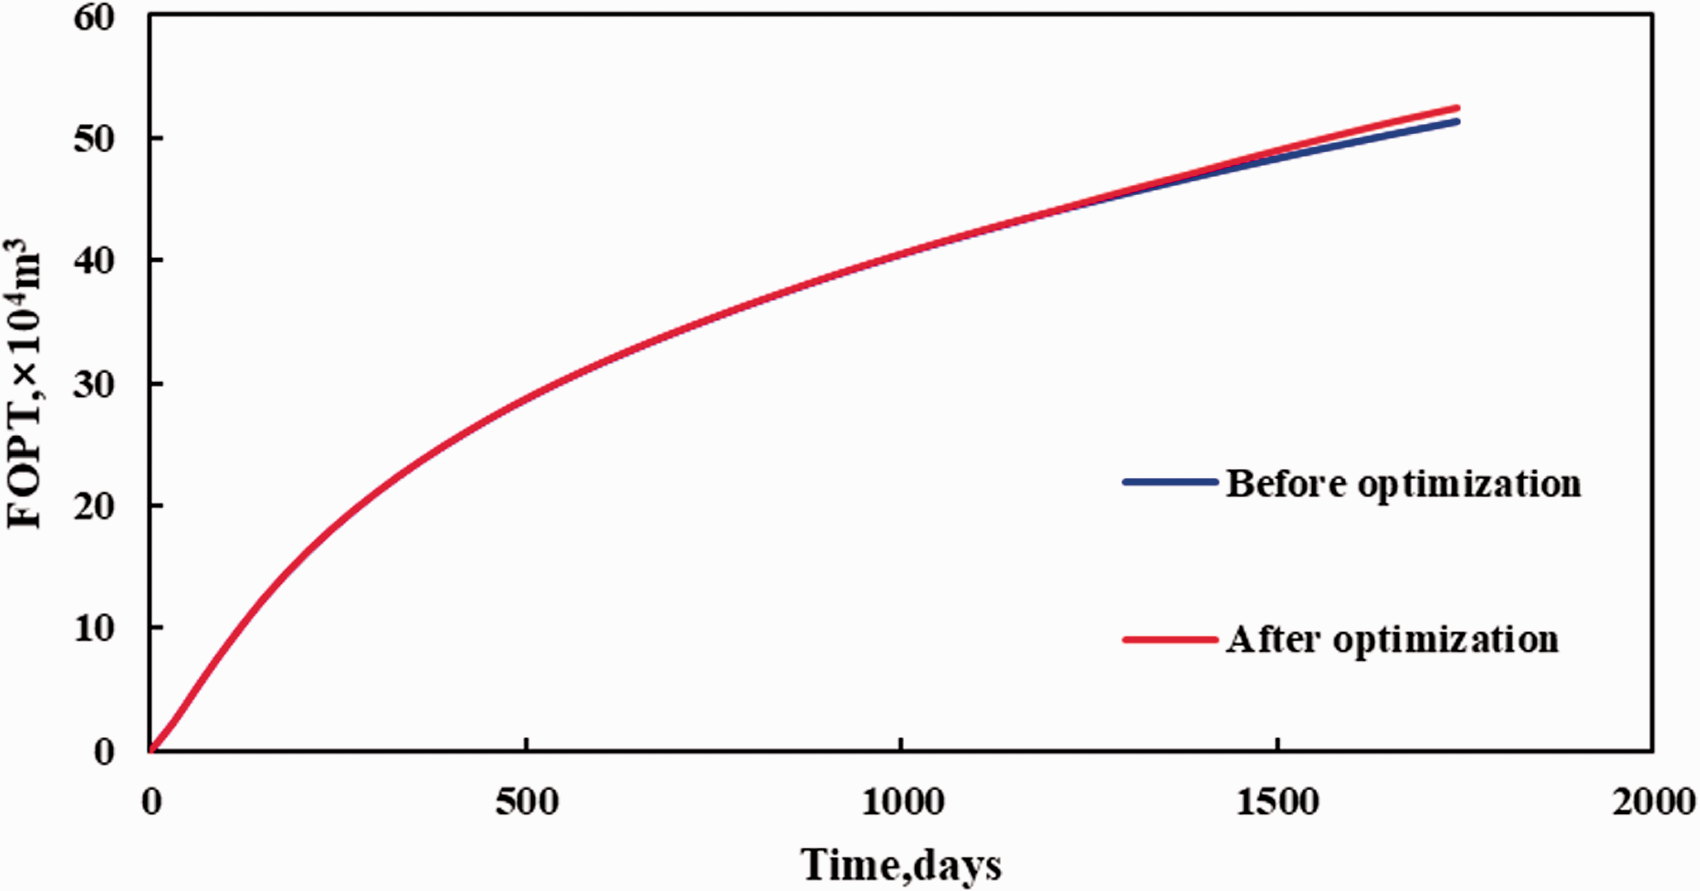
Before and after optimization of FOPT.
Case study
M Reservoir is a 9-layer carbonate reservoir with fractures, pores and caves. The reservoir started to exploit in 2012 and water flooding was conducted in 2013. At present, there are 174 open wells. The composite water cut is 47.3%, the cumulative regional oil production is 829 × 104t, the oil recovery is about 6.1%, and the current reservoir pressure is around 54.3% of the initial formation pressure. The main controlling factors that affect the remaining oil distribution in the reservoir are not clear, and the risk of water logging by infilling well network is high, leading to great difficulty in further improving the performance of water flooding. The main issues that are waiting to be resolved at present are identifying the internal inter-well interactions and connectivity, determining the size and distribution of preferential seepage channels and the distribution of remaining oil, and proposing optimization measures targeting at water logging and water channeling.
Establishment and verification of inter-well connectivity model
Combine the inter-well connectivity model with the real reservoir geological parameters to carry out an automatic historical fitting of the production dynamics. The inversion results are shown in Figure 7. Figure 7(a) is the inversion result of conductivity and Figure 7(b) is inversion result of connected volume.
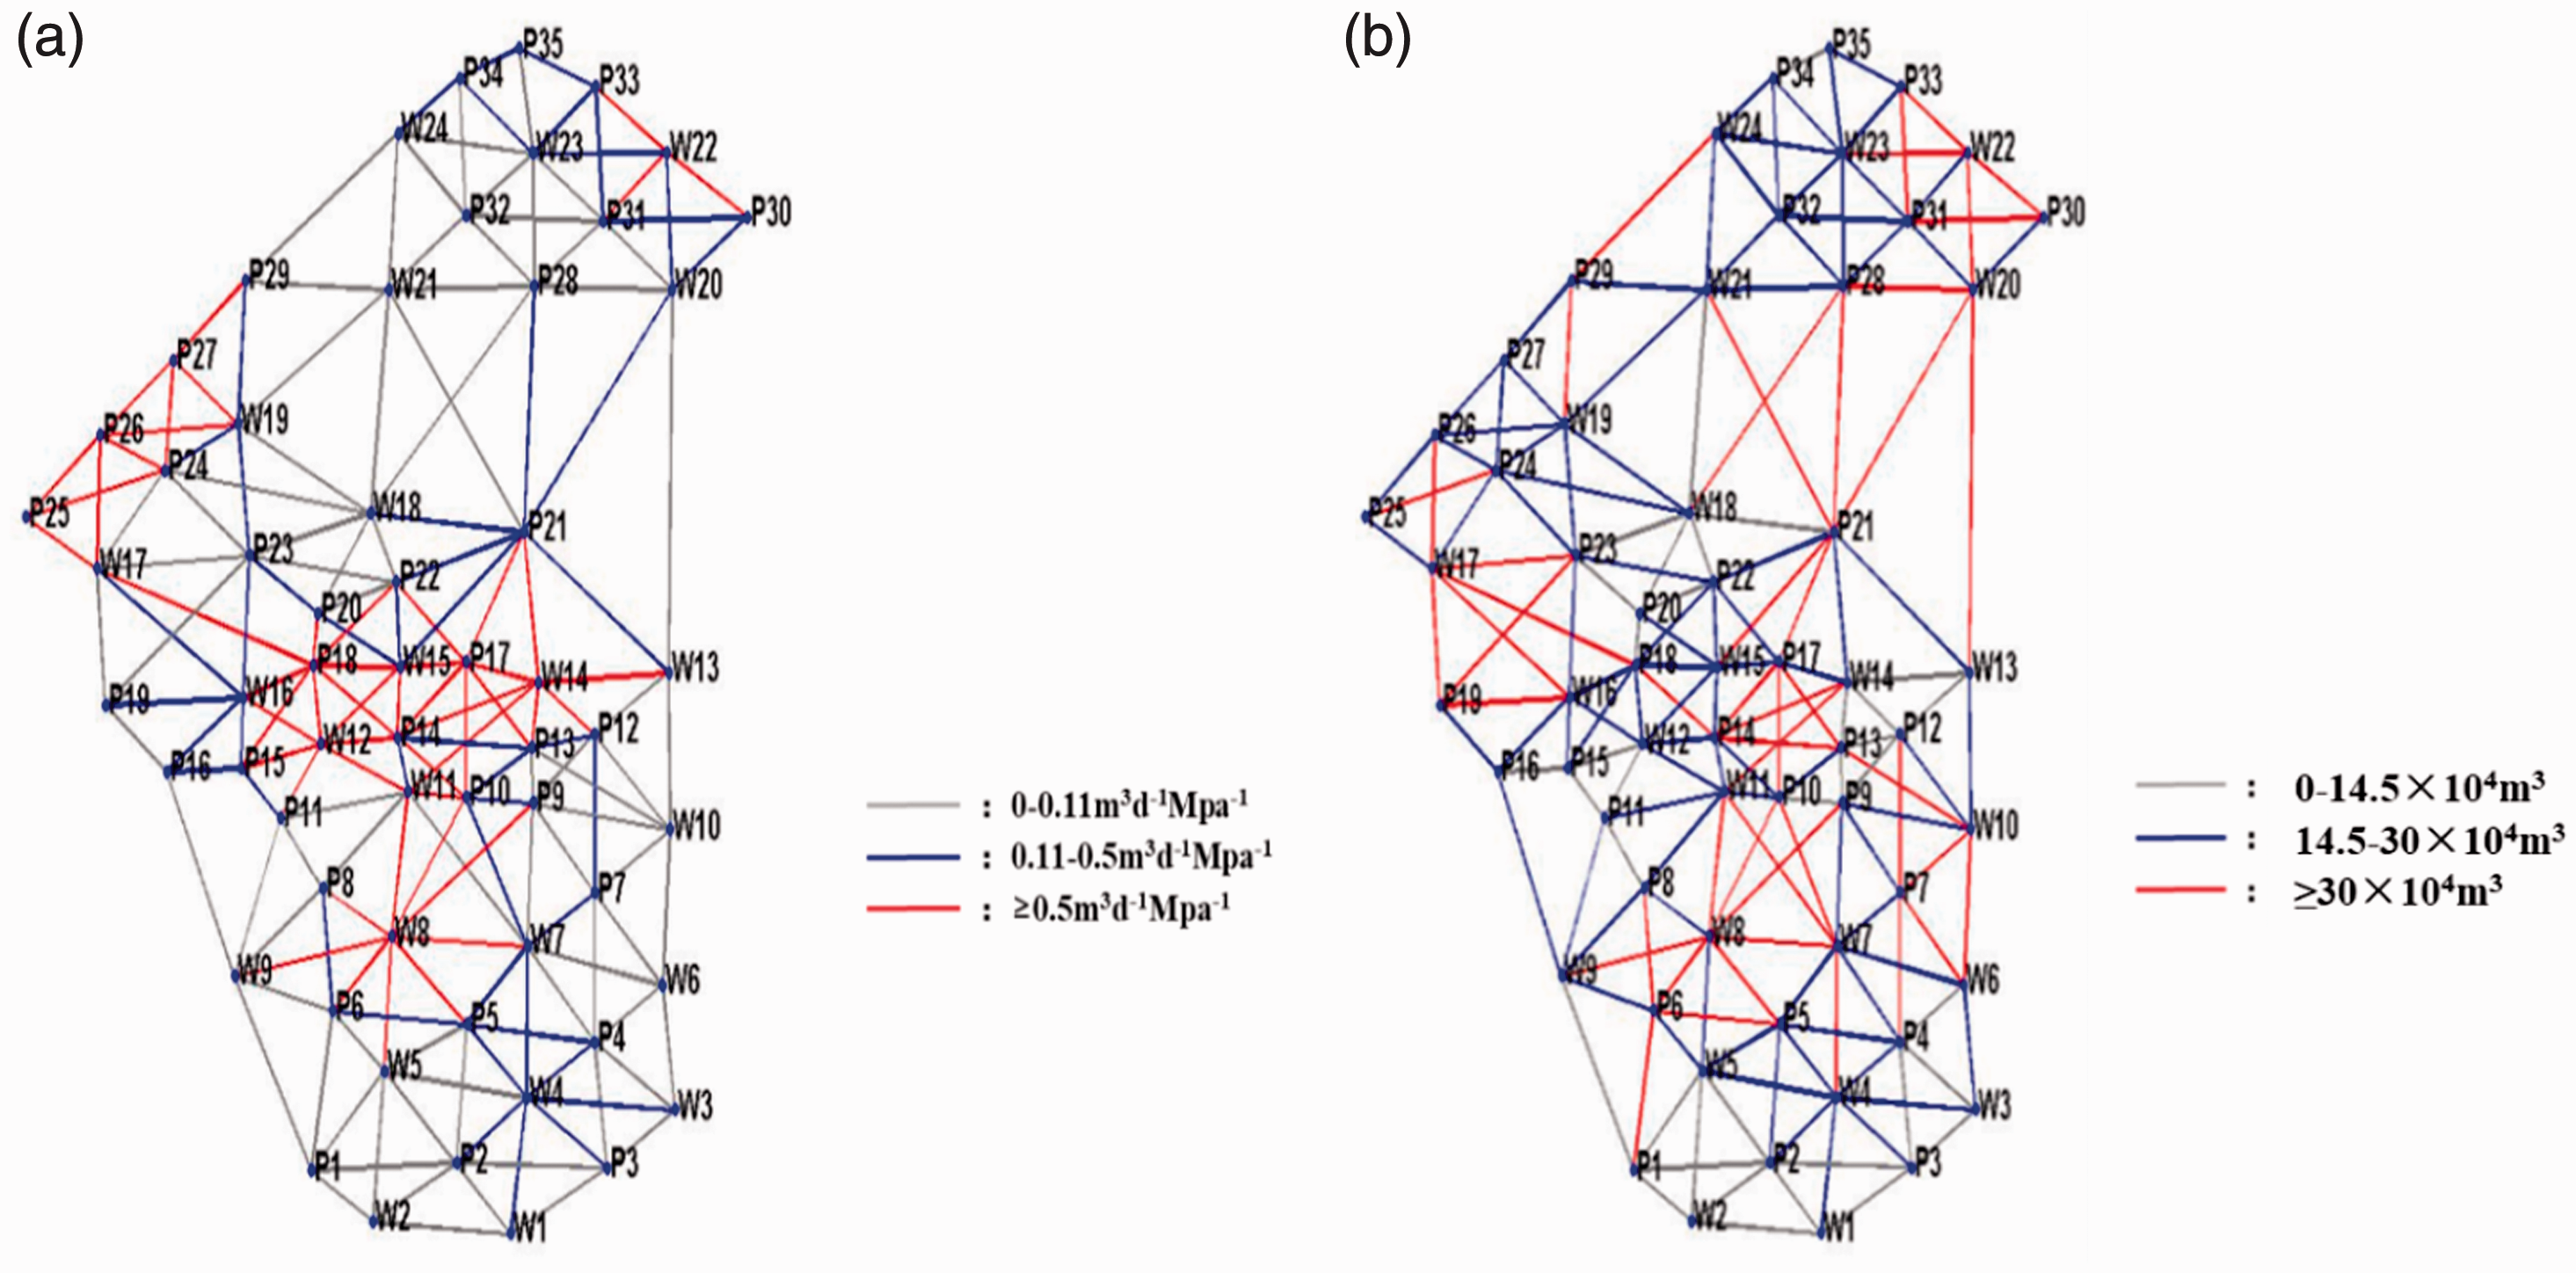
Inversion results of connectivity parameters in M reservoir. (a) Conductivity (b) Connected volume.
Tracer verification
To verify the accuracy of the inter-well connectivity model, W19 well group is used as an example to study the consistence between water split coefficient and the water flooding direction monitored by the tracer (Zhao et al., 2010).
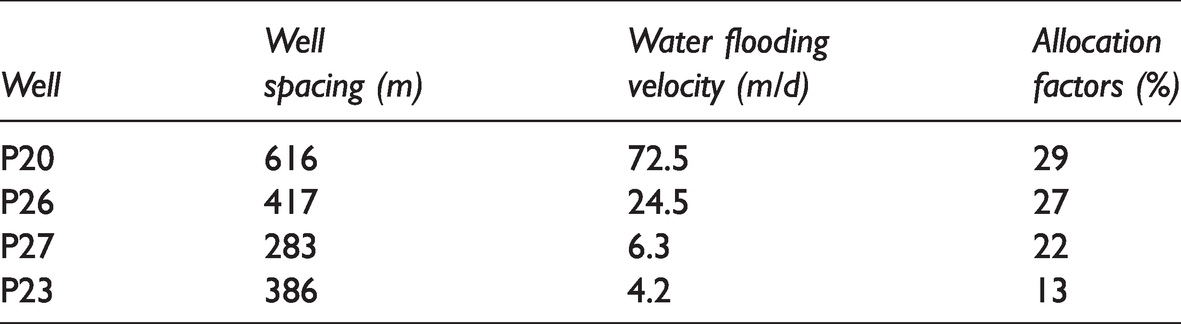
As shown in Figures 8 and 9, and Table 3, the tracer test indicates response was received mainly in four wells, P20, P26, P27 and P23. The water flooding velocity in different directions can be roughly deduced the well spacing and the responding time. The comparison between the results of tracer test and the water allocation factors from inter-well connectivity model shows that P20, the well with the most intensive response has the fastest flooding velocity of 72.5 m/d and the highest allocation factors of 29%. Followed by well P26, the water flooding velocity is 24.5 m/d, and the allocation factors is 27%. The allocation factors of other wells all show good positive relationships with the tracer-indicated water flooding velocity. The good consistence between tracer test and numerical simulation manifests the high accuracy of the proposed model. It is worth noting that the allocation factors mentioned above is calculated based on the flow rate of the water injection well to each production well, which reflects the flow capacity of the injected water in all directions. It corresponds to the tracer monitoring results to verify the model.
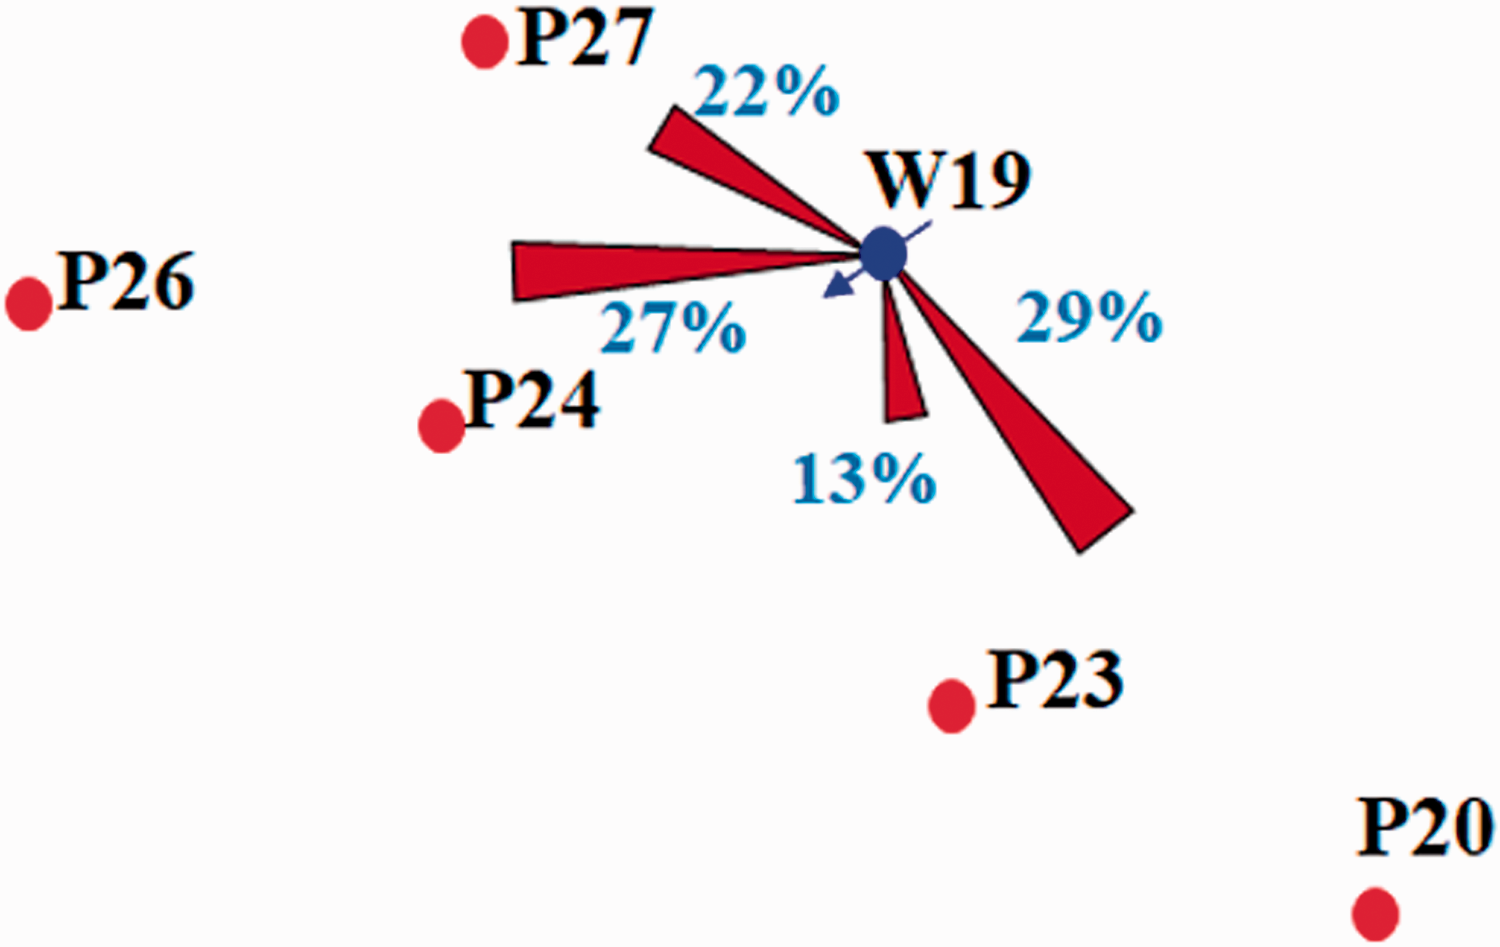
Water split coefficient.
Tracer indicated water flooding velocity and water allocation factors in W19 well group.
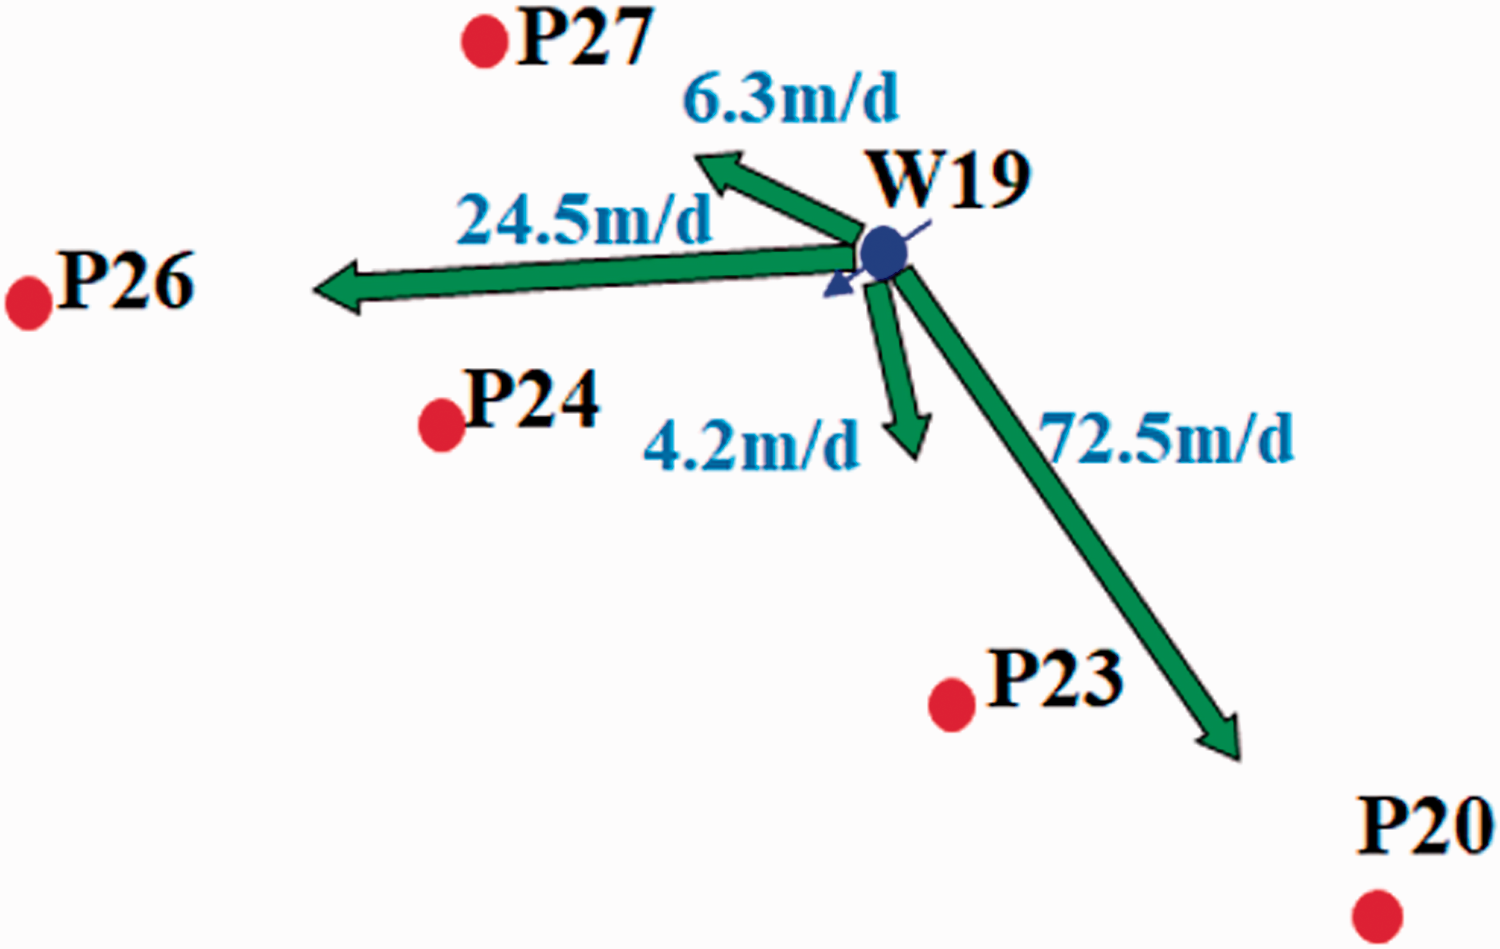
Tracer indicated water flooding direction.
Production-suction profile verification
A low-efficiency injection well W3 was selected as the research object. According to the perforation data, the perforated layer, L3, L4, and L6 of well W3always kept a perforated state started from August 2012, and the corresponding relative water injection and water suction data are shown in Figure 10.
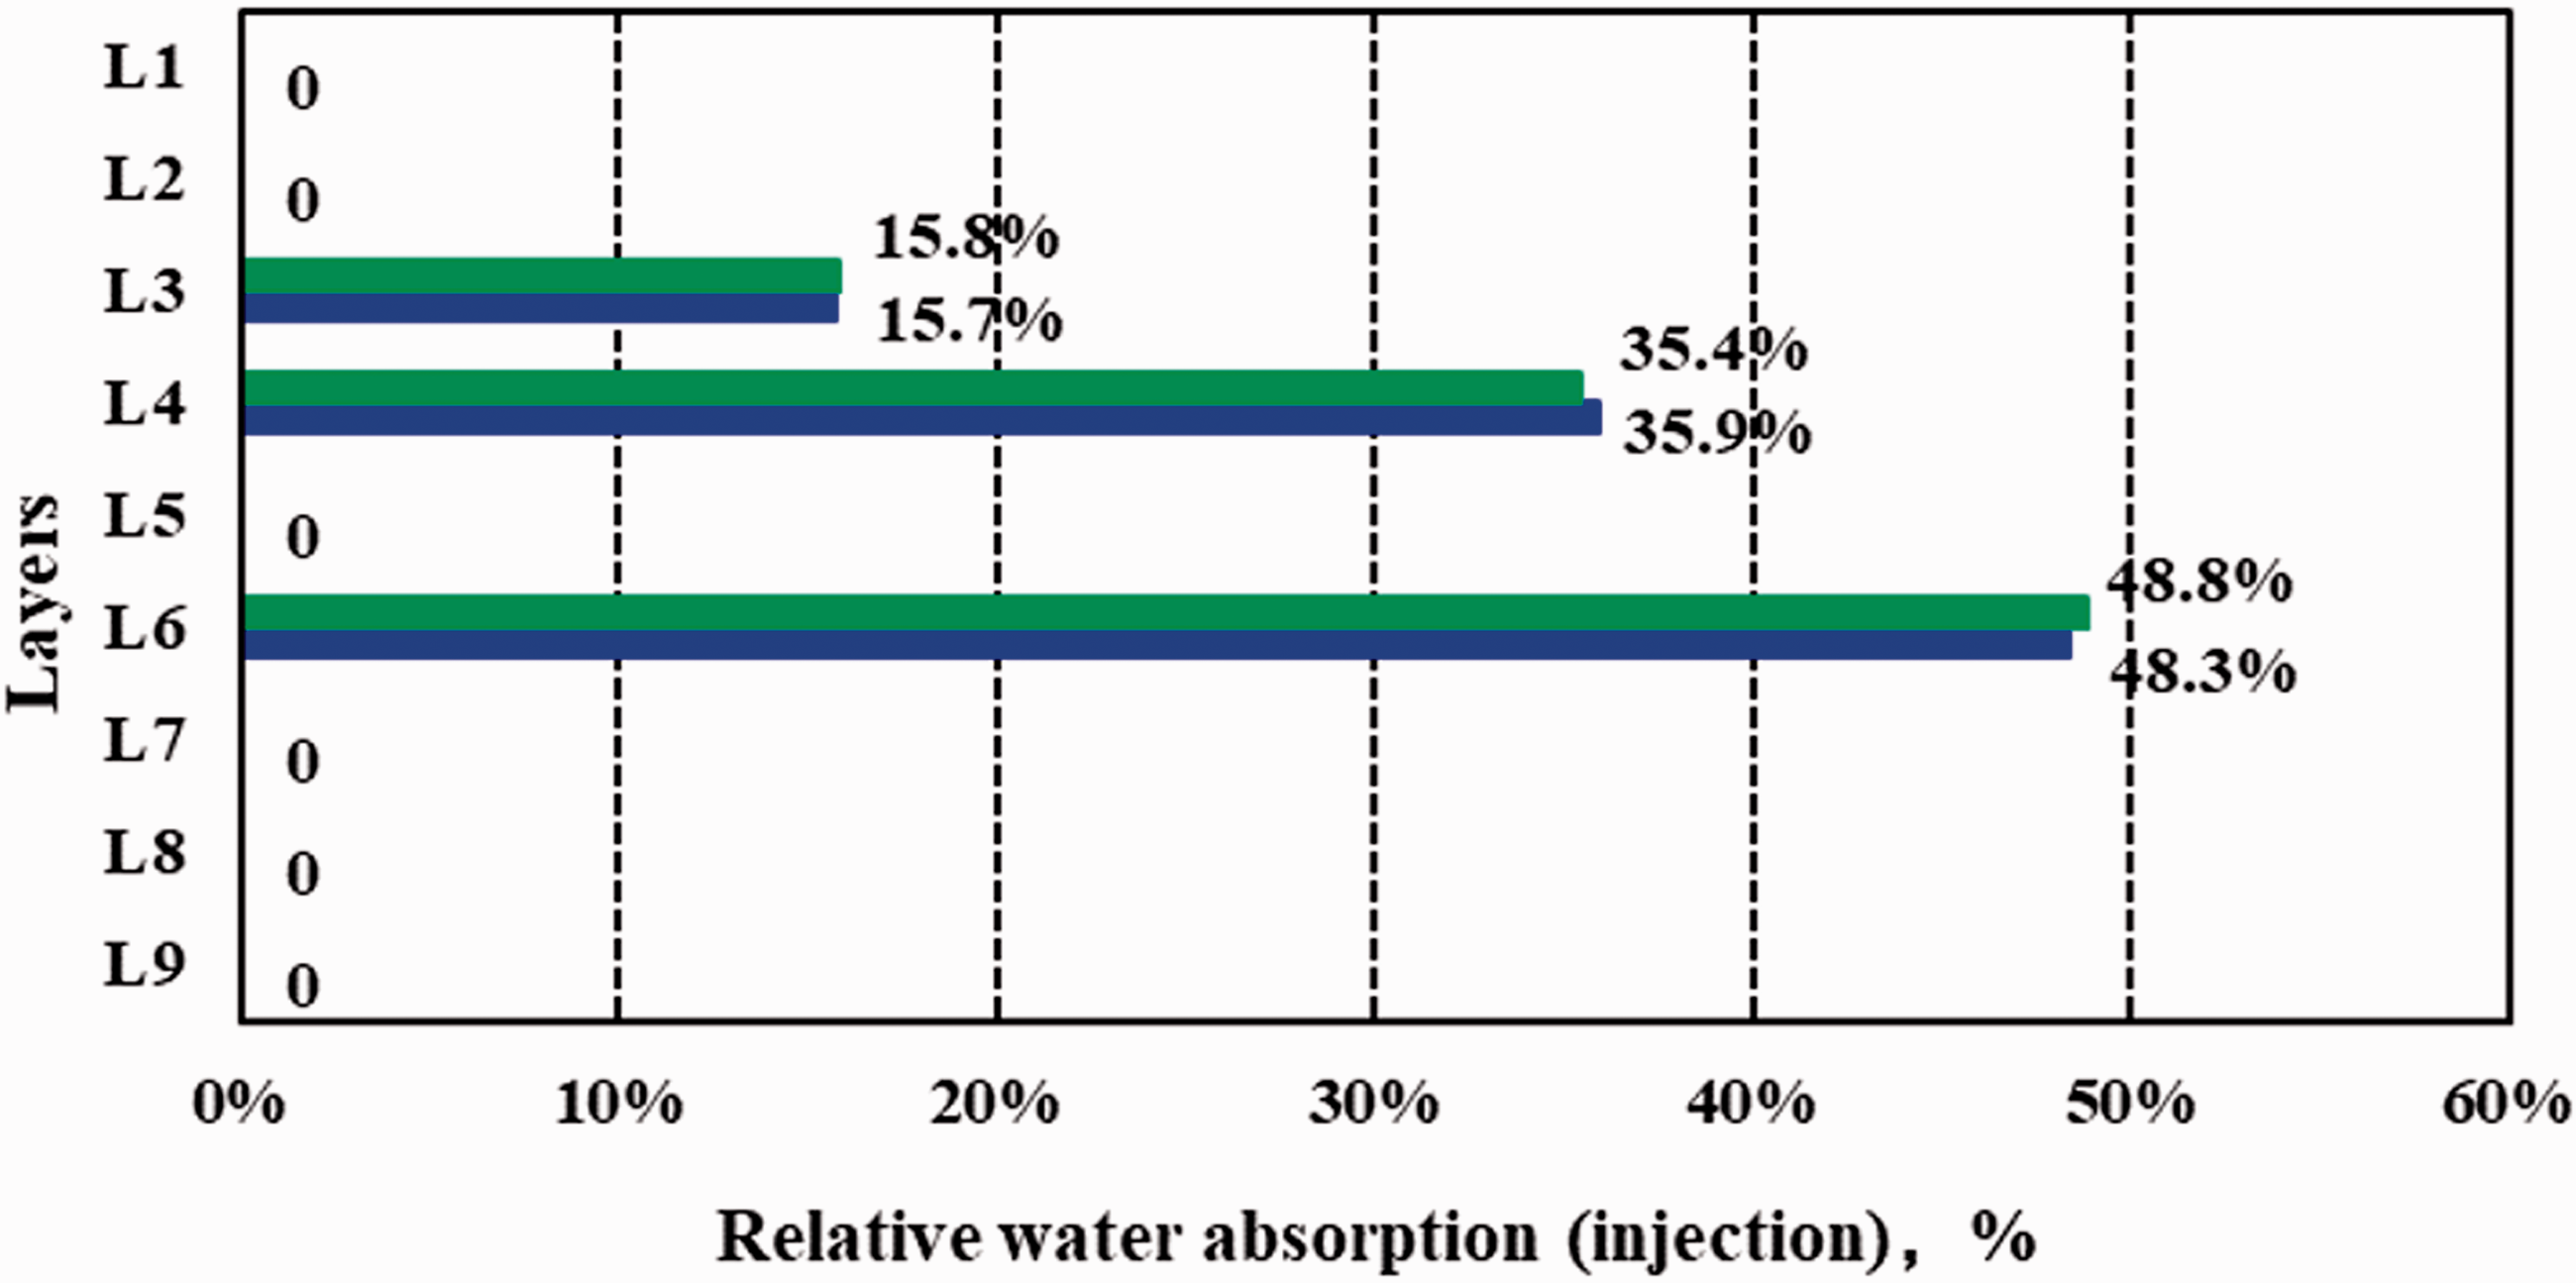
Relative water injection and water suction of each layer in well W3.
The water supply for well W3 mainly comes from the water injection from three layers, L3, L4 and L6. The water absorption and relative injection shows that there is a good corresponding relationship between relative water suction and relative water injection, which further illustrates the accuracy of the propose longitudinal multilayer connectivity model.
Working scheme optimization of 2 M-block based on inter-well connectivity model
The average water injection utilization rate of the block can be obtained by the history-matched connectivity model and the water split coefficient. of the water injection wells. The results are shown in Figure 11. When conduct the oil and water allocation for the production and injection wells, increase the injection volume if the well injection efficiency is higher than the average water injection utilization rate, otherwise, reduce the injection volume.
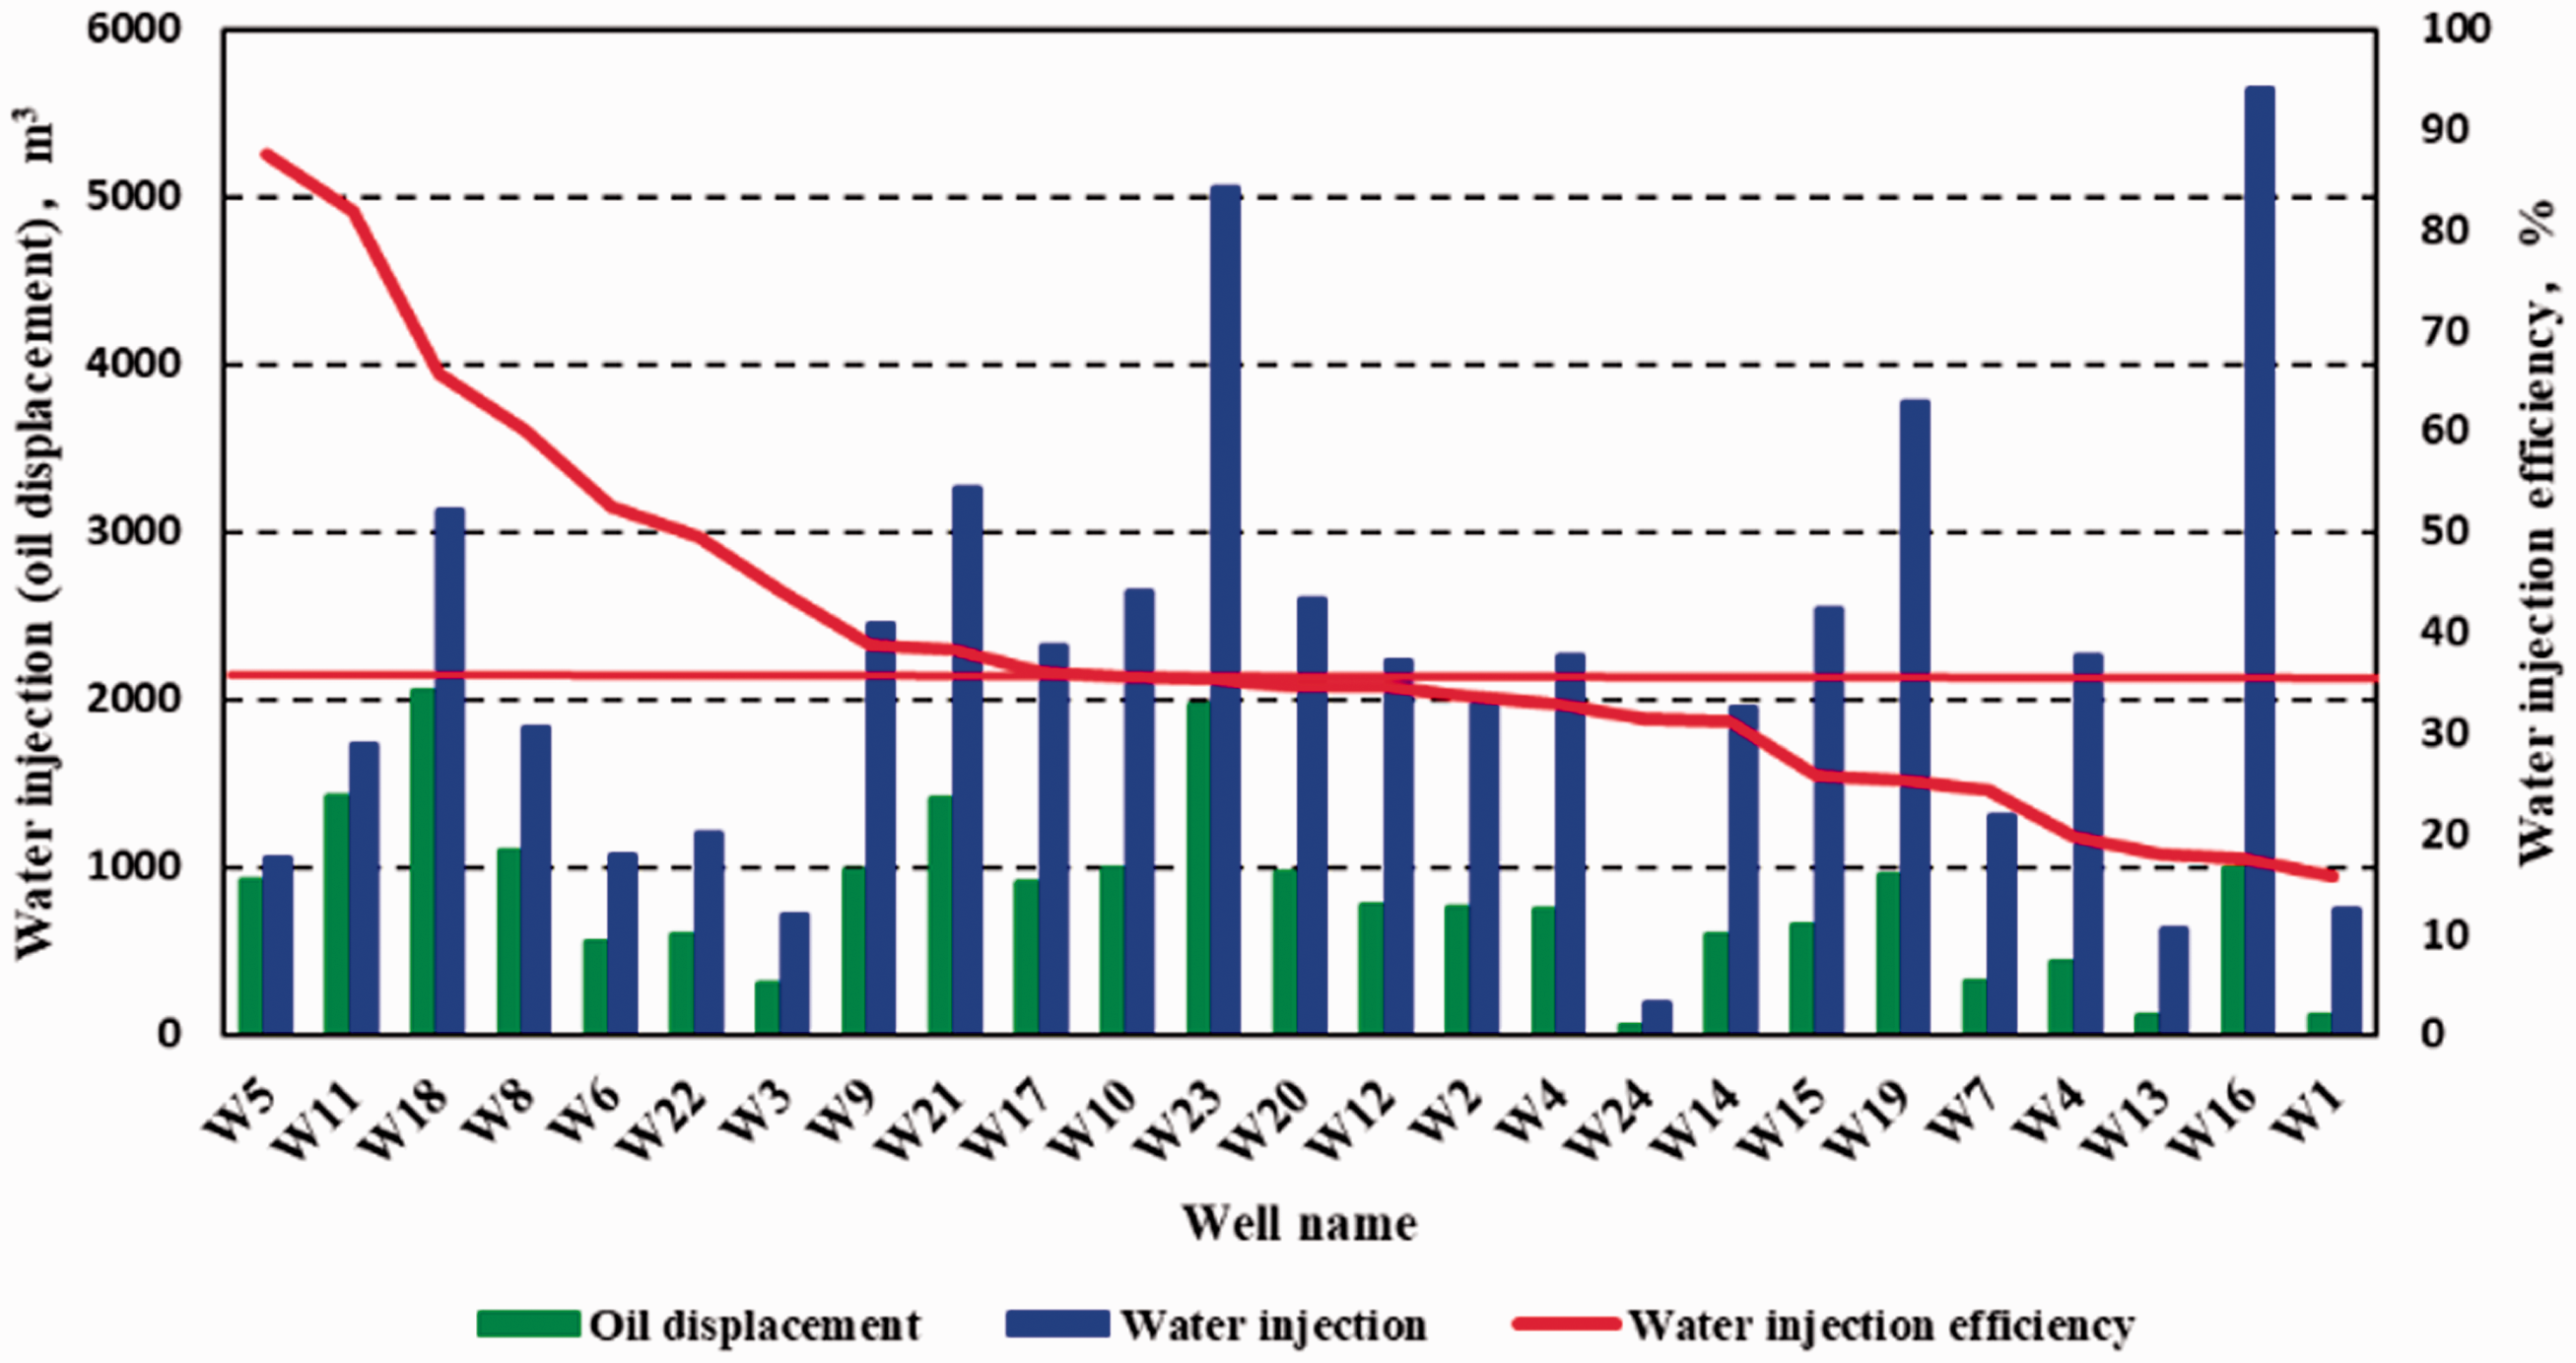
Water injection efficiency.
The calculation results show that the average water injection utilization rate is 38%, based on this standard, wells are divided into high efficiency wells and low efficiency wells. As shown in Figure 11, there are 16 low-efficiency wells and 9 high-efficiency wells. The overall water injection utilization rate is low, for those injection wells with higher water injection utilization rate, the water injection can be appropriately increased.
A targeted countermeasure was developed according to the injection-production relationship, the water injection utilization rate, the water cut of production wells, the recovery efficiency and the inter-well connectivity in M Block. The details are, adjusting the injection volume based on the water injection utilization rate; Modifying the production volume at a given flow pressure according to the real-time allocation. The specific adjustment scheme and well locations are shown in Table 4 and Figure 12.
The specific adjustment scheme.
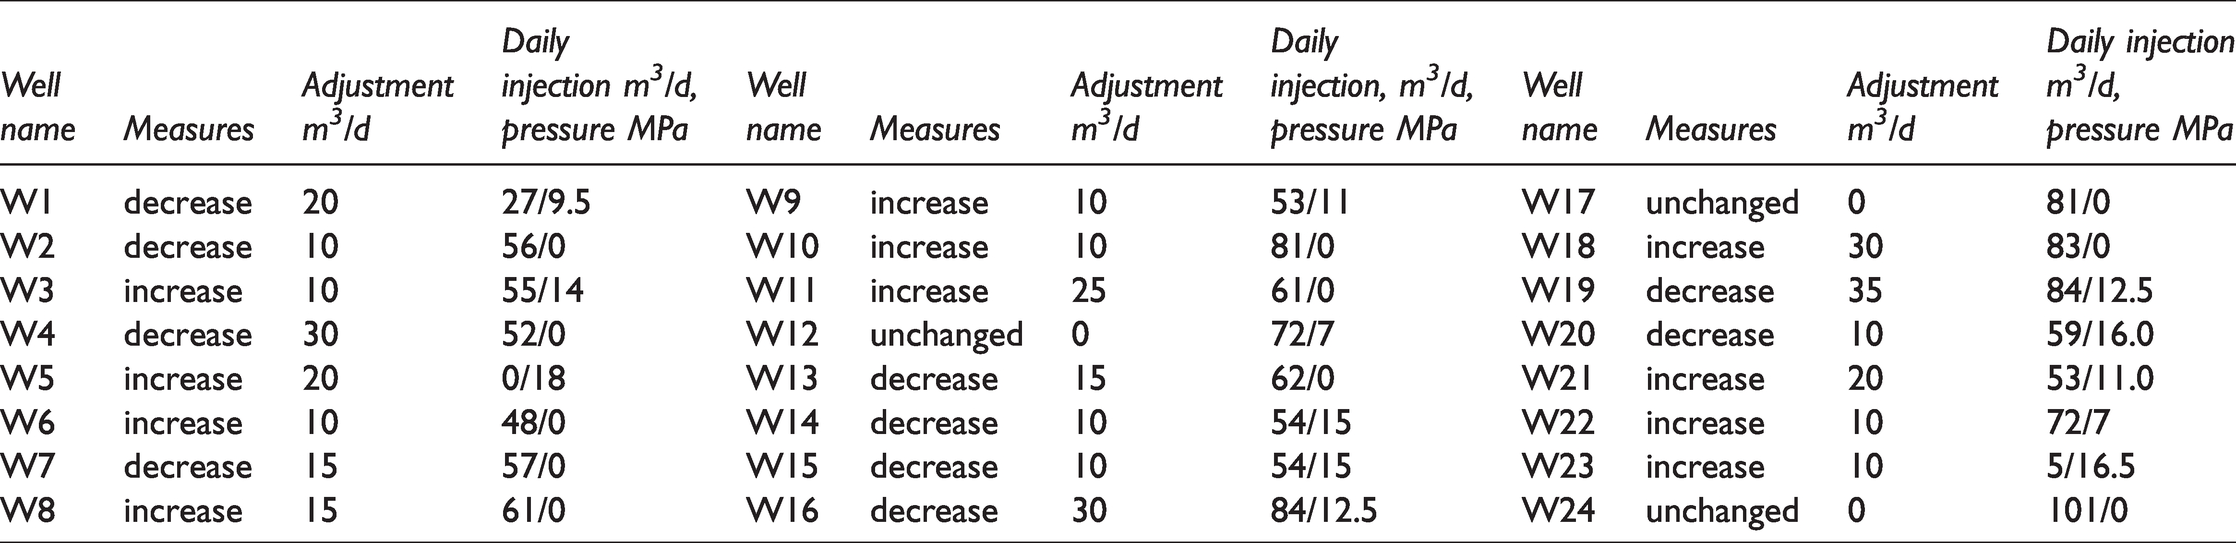
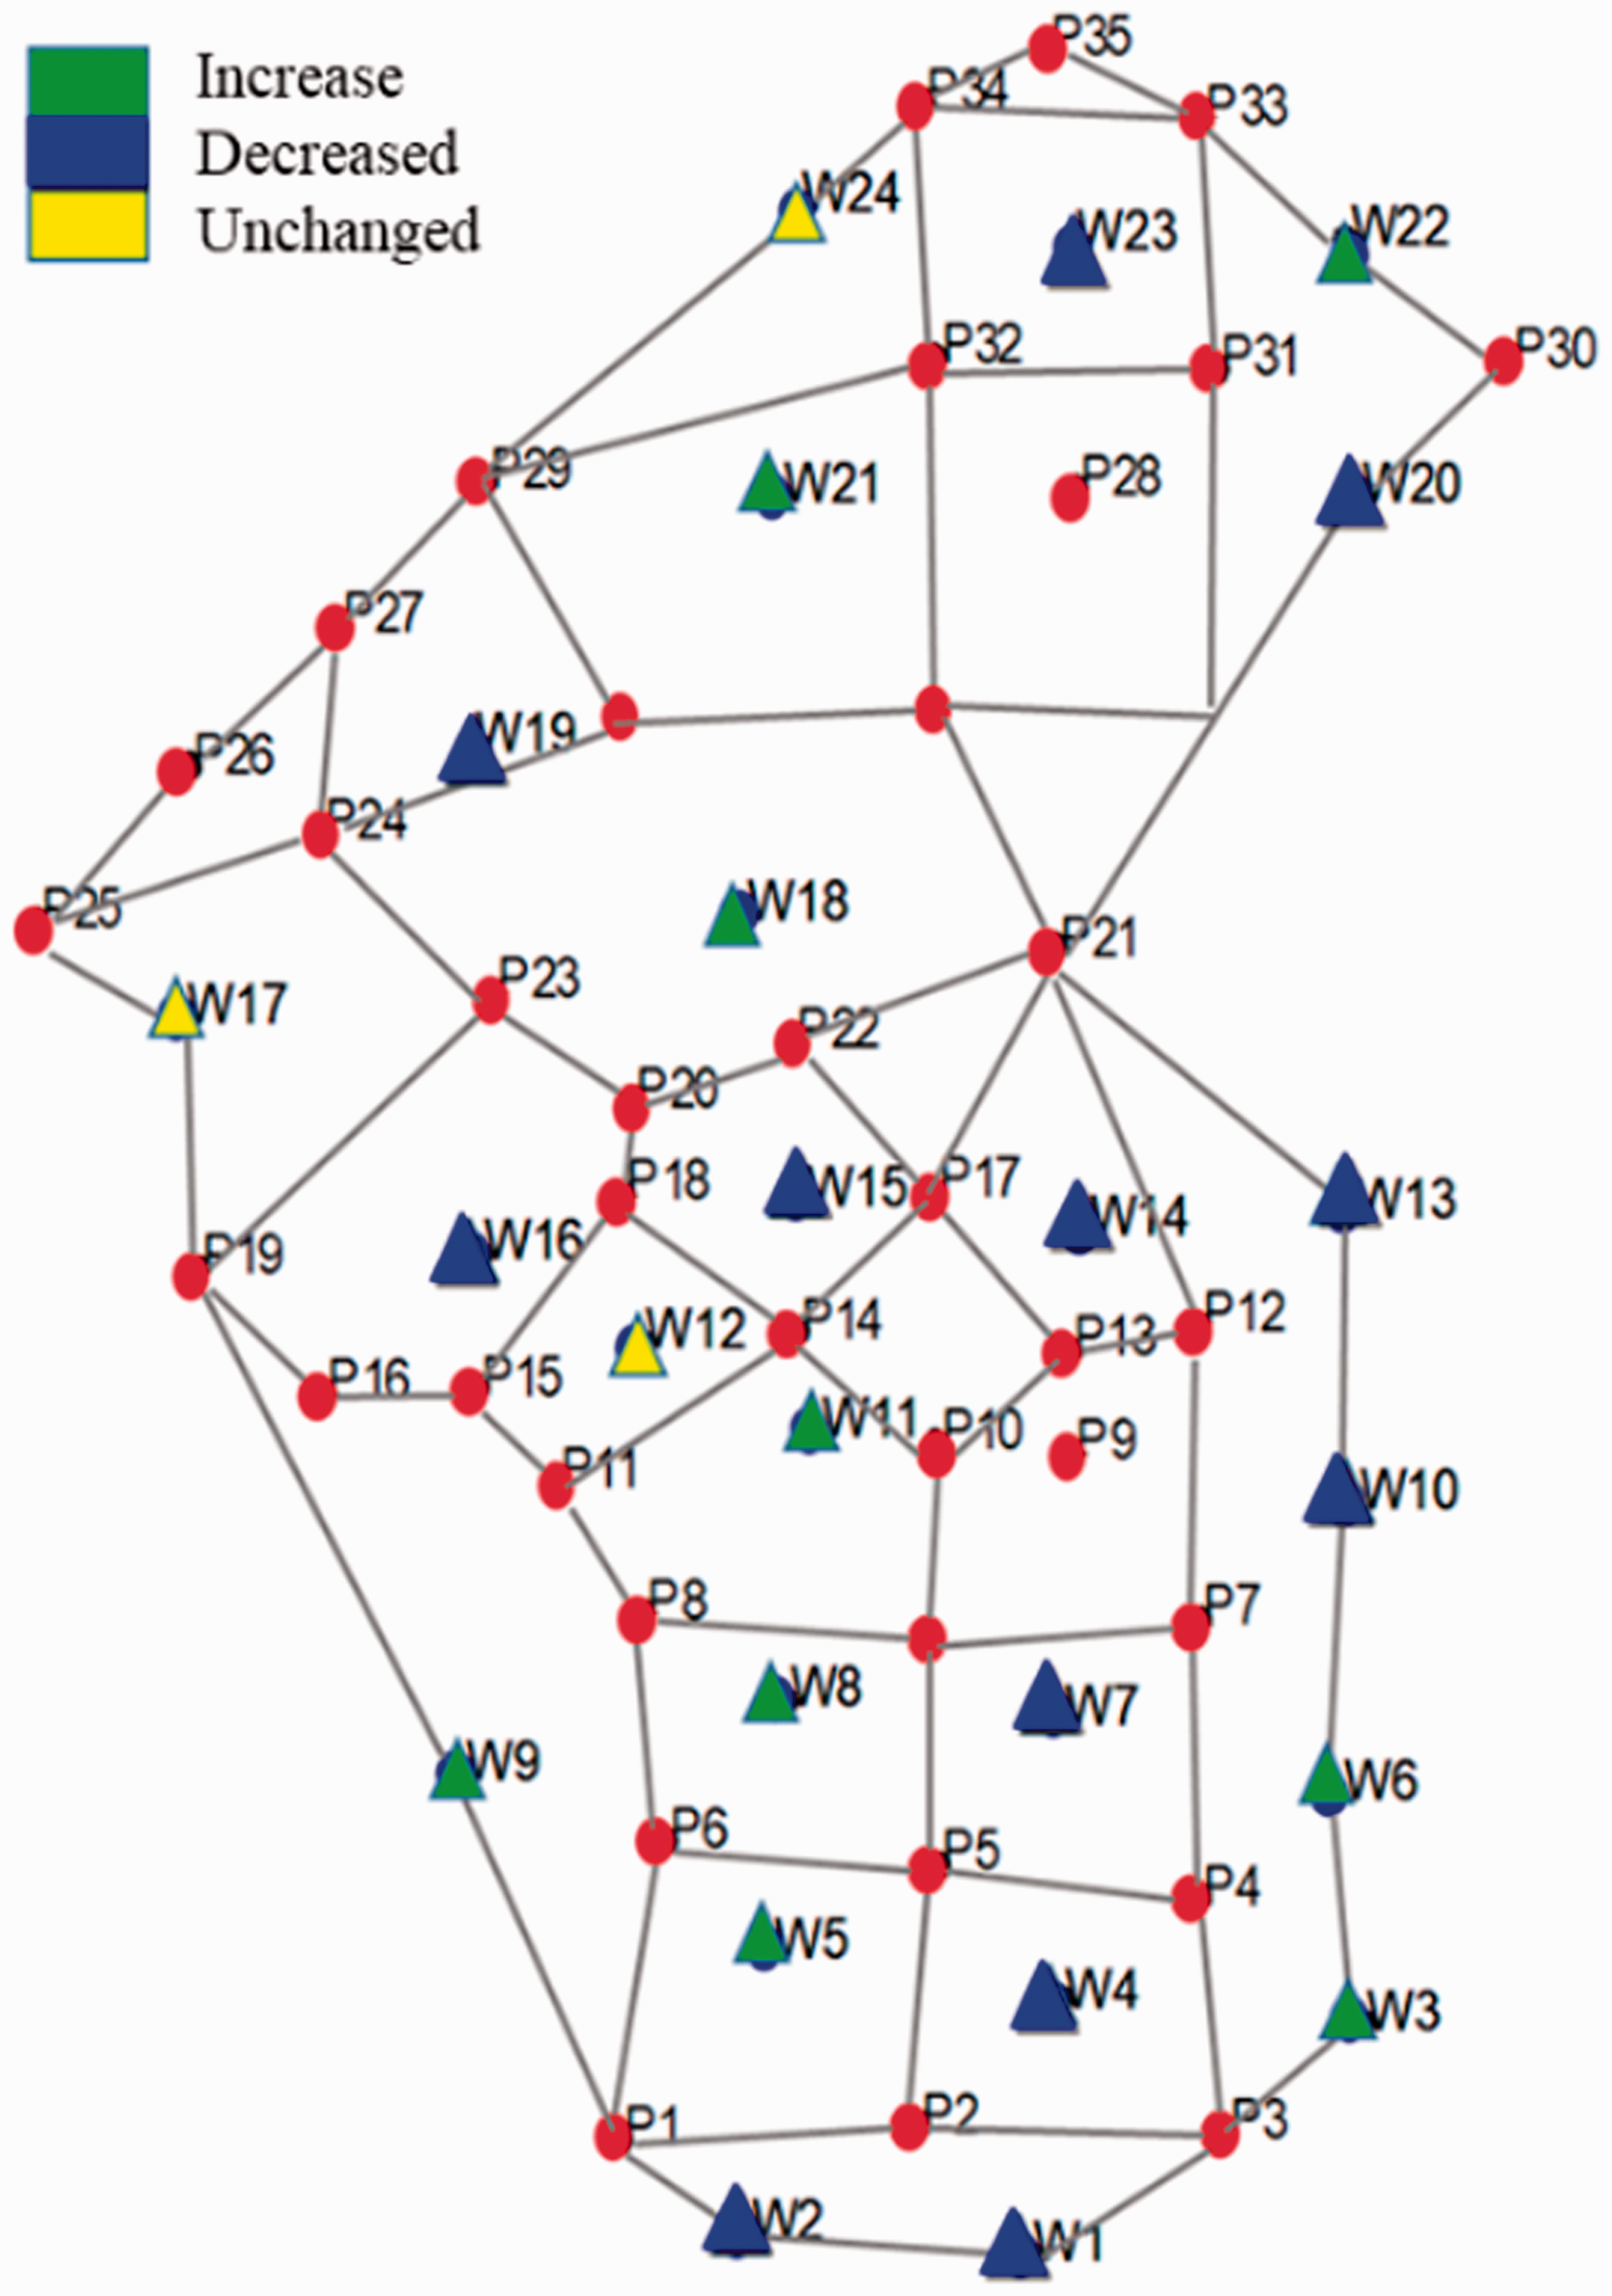
Distribution of adjusted wells.
The injection-production adjustment was monitored for one year. Compared with the original plan, after the adjustment, the water cut of the block has decreased from 65.2% to 64.1% and the cumulative oil production has increased from 393.4 × 10⁴ m3 to 394.5 × 10⁴ m3, showing an increase of 1.1 × 10⁴ m3. In addition, the daily oil production also demonstrates a sharp increase, as shown in Figures 13 and 14.
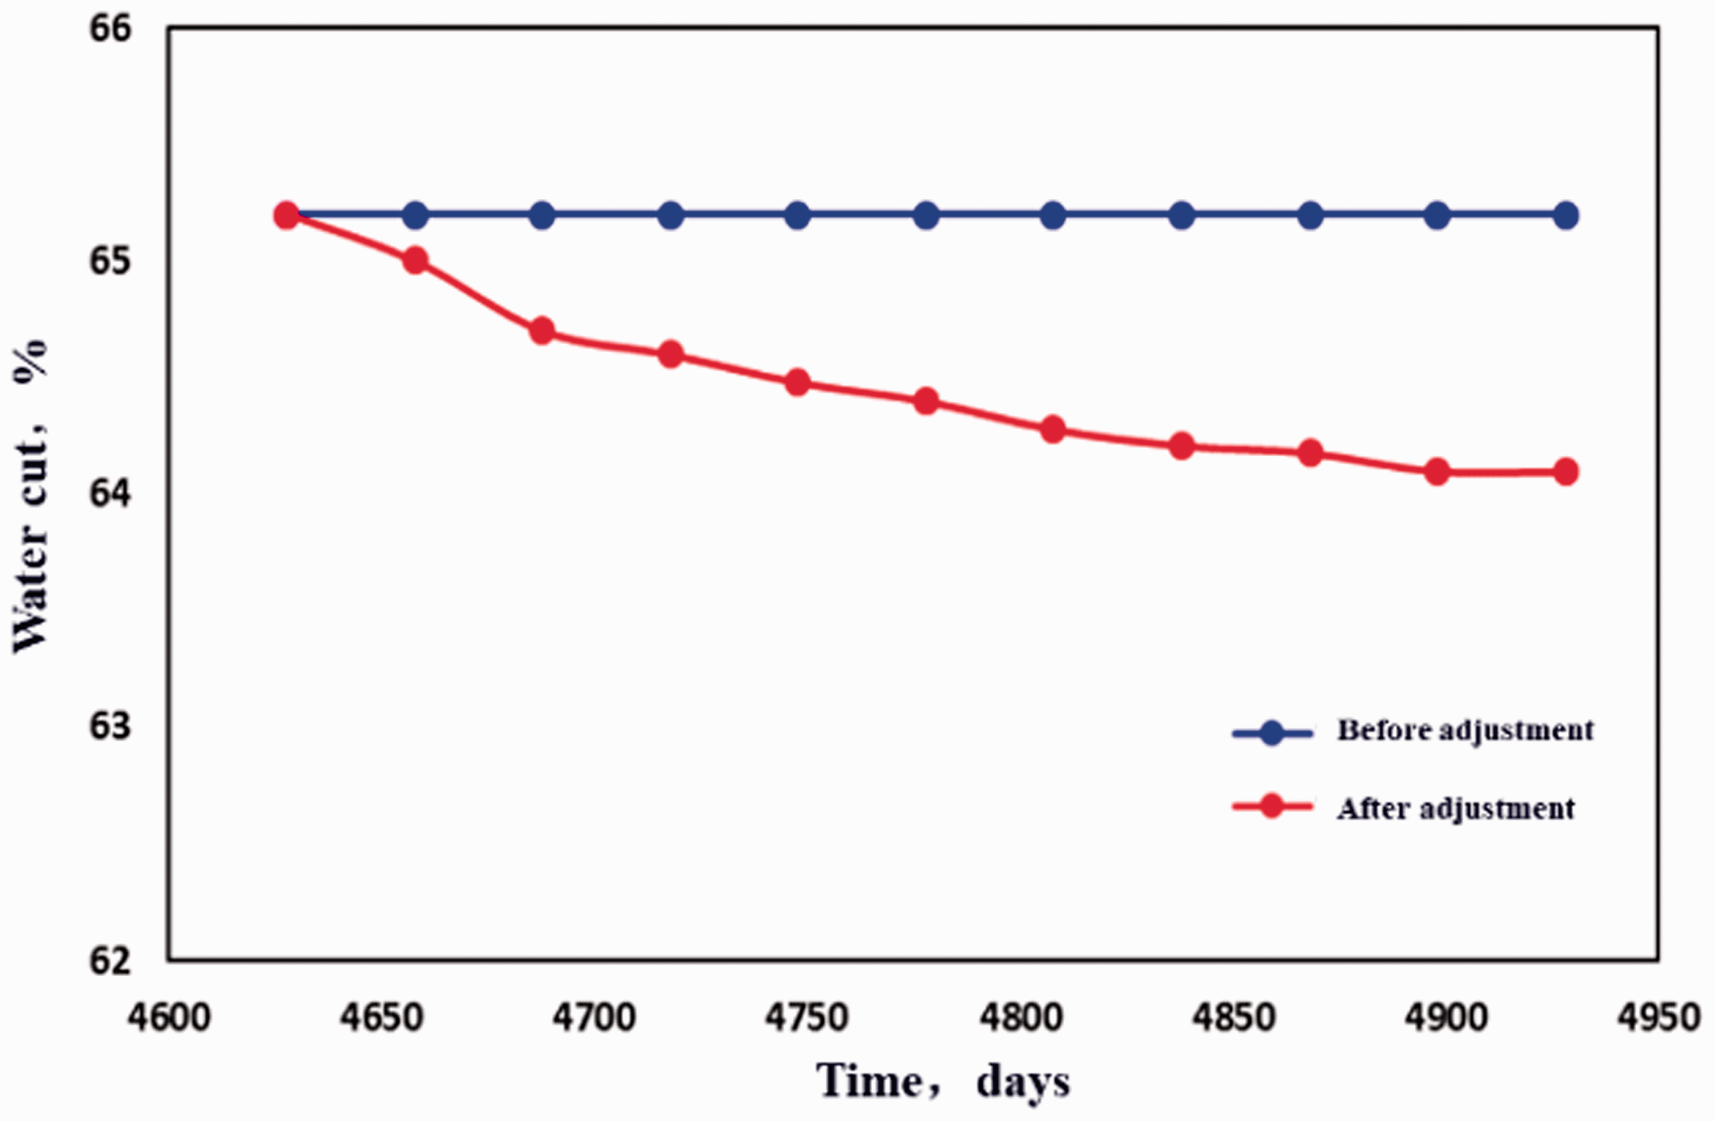
Before and after optimization of FWCT.
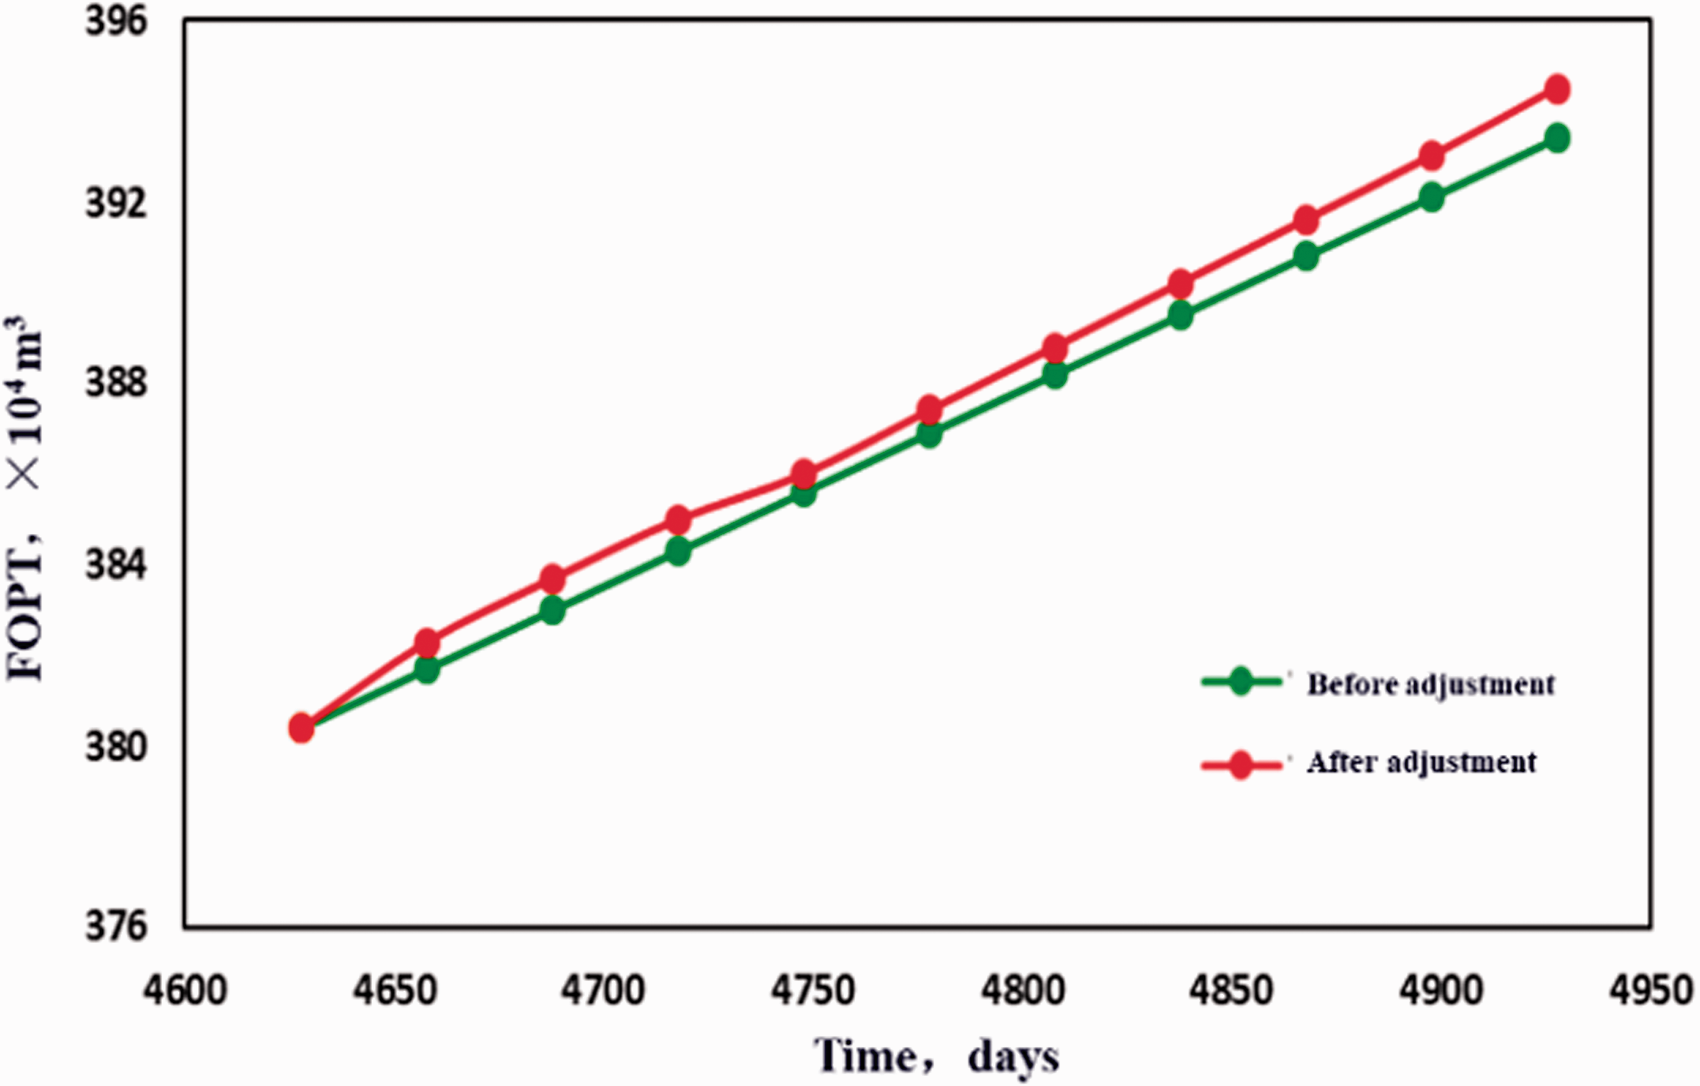
Before and after optimization of FOPT.
Conclusions and recommendations
In this paper, the injection-production well connectivity of carbonate reservoir M is analyzed by a longitudinal multilayer connectivity model. With the inclusion of inter-well connectivity-based optimization method, a thorough understanding of the development mechanism of carbonate reservoirs was obtained. In addition, the inversion of the overall inter-well connectivity is conductive to the evaluation of the water utilization condition. Based on the clear idea of the injection-production well connectivity, optimizing the injection-production scheme, and verifying the model by well group successfully provided a theoretical guidance for further exploitation. The conclusions and recommendations are as following,
A longitudinal multilayer inter-well connectivity model was established and improved to simulate the oil-water dynamics of carbonate reservoirs. Meanwhile, dynamic history fitting and injection-production parameter optimization systems were developed based on optimization theory. An Inter-well longitudinal multilayer connectivity model for M reservoir was constructed, and the connectivity parameters were obtained by inversion. The reliability of the model was verified by tracer test, production-suction profile, etc. According to the water utilization rate, the injection wells are divided into high-efficiency wells and low-efficiency wells, and the important parameters such as the planal water splitting direction and corresponding coefficient are obtained. In addition, through the real-time allocation optimization method, a targeted adjustment scheme was given to realize the objective of increasing oil and decreasing water.
Supplemental Material
sj-pdf-1-eea-10.1177_0144598721994653 - Supplemental material for Injection-production optimization of carbonate reservoir based on an inter-well connectivity model
Supplemental material, sj-pdf-1-eea-10.1177_0144598721994653 for Injection-production optimization of carbonate reservoir based on an inter-well connectivity model by Yuhui Zhou, Sheng Lei, Xuebiao Du, Shichang Ju and Wei Li in Energy Exploration & Exploitation
Supplemental Material
sj-pdf-2-eea-10.1177_0144598721994653 - Supplemental material for Injection-production optimization of carbonate reservoir based on an inter-well connectivity model
Supplemental material, sj-pdf-2-eea-10.1177_0144598721994653 for Injection-production optimization of carbonate reservoir based on an inter-well connectivity model by Yuhui Zhou, Sheng Lei, Xuebiao Du, Shichang Ju and Wei Li in Energy Exploration & Exploitation
Footnotes
Declaration of conflicting interests
The author(s) declared no potential conflicts of interest with respect to the research, authorship, and/or publication of this article.
Funding
The author(s) received no financial support for the research, authorship, and/or publication of this article.
References
Supplementary Material
Please find the following supplemental material available below.
For Open Access articles published under a Creative Commons License, all supplemental material carries the same license as the article it is associated with.
For non-Open Access articles published, all supplemental material carries a non-exclusive license, and permission requests for re-use of supplemental material or any part of supplemental material shall be sent directly to the copyright owner as specified in the copyright notice associated with the article.