
Abstract
With resource crisis and environmental crisis increasingly grim, many countries turn the focus to pollution-free and renewable wind energy resources, which are mainly used for offshore wind power generation, seawater desalination and heating, etc., on the premise that the characteristics of resources are fully grasped. In this study, the evaluation of offshore wind energy in offshore waters in China, as well as the advantages and disadvantages of existing studies were overviewed from four aspects: the spatial-temporal characteristics of wind energy, wind energy classification, the short-term forecast of wind energy and the long-term projection of wind energy, according to the research content and the future considerations about wind energy evaluation (evaluation of wind energy on islands and reefs, the impact of wind energy development on human health) were envisaged, in the hope of providing a scientific basis for the site selection and business operation ‘or military applications’ here (after business operation), etc. of wind energy development, ‘aritime navigation against environmental construction,’ here and also contributing to the sustainable development and health of human beings.
Keywords
Introduction
The development of clean energy is an important guarantee for humans to achieve sustainable development. Offshore wind energy has the advantages of safety, no pollution, renewability, large reserve, wide distribution and no occupation of land resources, etc. (Junginger et al., 2004; Xydis, 2015, 2016; Zheng et al., 2013). Wind power generation is the major way to exploit and utilize wind energy resources. In addition, it has been widely used in ship navigation, water pumping, irrigation, wind heating and other projects (Soteris, 2005) and will become an important energy source to support the sustainable development of mankind.
Compared with onshore wind energy, offshore wind energy has the following advantages (Yao et al., 2007; Zheng et al., 2018): (1) offshore wind energy has very rich resources and can generate more power than onshore wind. Generally speaking, the sea surface wind speed 10 km offshore is about 25% higher than that of coastal land, and is less affected by the environment. The available wind resources are three times that of the land. (2) The sea surface has low roughness, small friction and smooth underlying surface, the wind speed changes little with the height, and a high pylon is dispensed with, which can lower the cost of wind turbines. (3) The wind power technology has been mature and has the most-largest development and commercial development. In some European countries, offshore wind power has entered the stage of commercialization after 2001, and the technology will become increasingly perfect. (4) In most sea areas of the world, the frequency of wind speed available for wind energy development is basically higher than 60%, that is to say, most sea areas of the world can carry out wind power generation at least half the year, which solar energy is limited by daylight, and the availability time is less than 50%.
Currently, onshore wind power generation technology has been relatively mature, but offshore wind power generation is only mature in a few European countries. In addition, the distribution of wind energy resources shows strong regional differences. There are huge differences between southern and northern China, between coastal and inland areas in wind energy. Therefore, the basic principle for large-scale development of wind power in China is “to give priority to resource evaluation and planning”, handle the evaluation of wind energy resources properly and develop plans for wind power development and construction of supporting power grids, based on a detailed survey of wind energy resources. Only in this way can we achieve the orderly exploitation and utilization of wind energy resources.
Advance in the research on wind energy
Spatial-temporal characteristics of wind energy
Compared with onshore observation, offshore observation is more challenging and there are scarce data, which restricts the study of offshore wind energy. The China Meteorological Administration conducted two surveys on wind energy resources in the 1980s and 1990s respectively, and gave the distribution map of onshore wind energy resources in China. Wang et al. (2007) set up a nonlinear dynamic system model for the generating capacity time series of wind power generation system. By estimating important parameters, such as the dimensions of dynamic space, time delay and largest Lyapunov exponent, etc., they tested the chaotic properties of the proposed system. The results indicated that the generating capacity of the wind power generation system showed a non-self-intersecting dynamic orbit in an 8-dimensional dynamic space, and the largest Lyapunov exponent was positive. Thus, from the perspective of engineering application, the generating capacity of the wind power generation system had chaotic properties, and it was possible to forecast the generating capacity of the wind power generation system in a short time by using phase-space reconstruction method. Not only the complexity of the prediction of wind power capacity can be effectively lowered and the prediction accuracy can be improved, but also a theoretical foundation can be laid for the prediction of wind power capacity by making use of non-meteorological information. Mao et al. (2005) analyzed the wind energy resources in Guangdong Province and coastal areas, using the historical wind data of 86 meteorological stations in Guangdong Province and temporary observation data of 72 anemometer towers along the coast, and found that the potential development areas for wind energy in Guangdong Province were distributed along the coast and estuaries, with an area of 6599 km2, a theoretical exploitable capacity of 7.99×l03 MW and a technical exploitable capacity of 6.27 × l02 MW. The wind energy-rich areas in Guangdong were mainly distributed in the outer coast and offshore islands. In concave bay areas along the coast, the effective wind power density only reached the level of relatively rich areas, while the wind energy on high mountains in inland areas of Guangdong Province can also reach the level of rich areas. Among them, the wind energy-rich areas on Mount Tianjing and Mount Shikengkong in Nanling Mountains, and Yunkai Great Mountain in the southwest of Guangdong Province were concentrated, but the wind energy distribution in other high mountains was scattered. In Guangdong province, 9 × l04 km of wind energy resources can reach the level above potential use, with a theoretical exploitable capacity of 7.50 × l04 MW and a technical exploitable capacity of 5.89 × l03 MW. Huang et al. (2007) presented a general picture of the wind energy resources in Jiangsu Province, using the observation data of 67 stations in Jiangsu Province from 1971 to 2000, (as shown in Figure 1). The results showed that the wind energy density in most areas of Jiangsu Province was 25–100 W/m2. In coastal areas, the density was above 100 W/m2, for example, 111.2 W/m2 in Yanwei Port. The maximum wind energy density of the whole province was found in Xilian Island at 207.7 W/m2. The effective wind energy time was dominated by coastal areas, 6337 h and 6146 h for Xilian Island and Yanwei Port respectively. Most areas in the province were within 3,000–6,000 h, while low value areas below 3000 h were distributed in the northwest of Xuhuai, and Changzhou, Zhenjiang and Yangzhou along the Yangtze River. Wind energy is high in winter and spring, while low in summer and autumn.
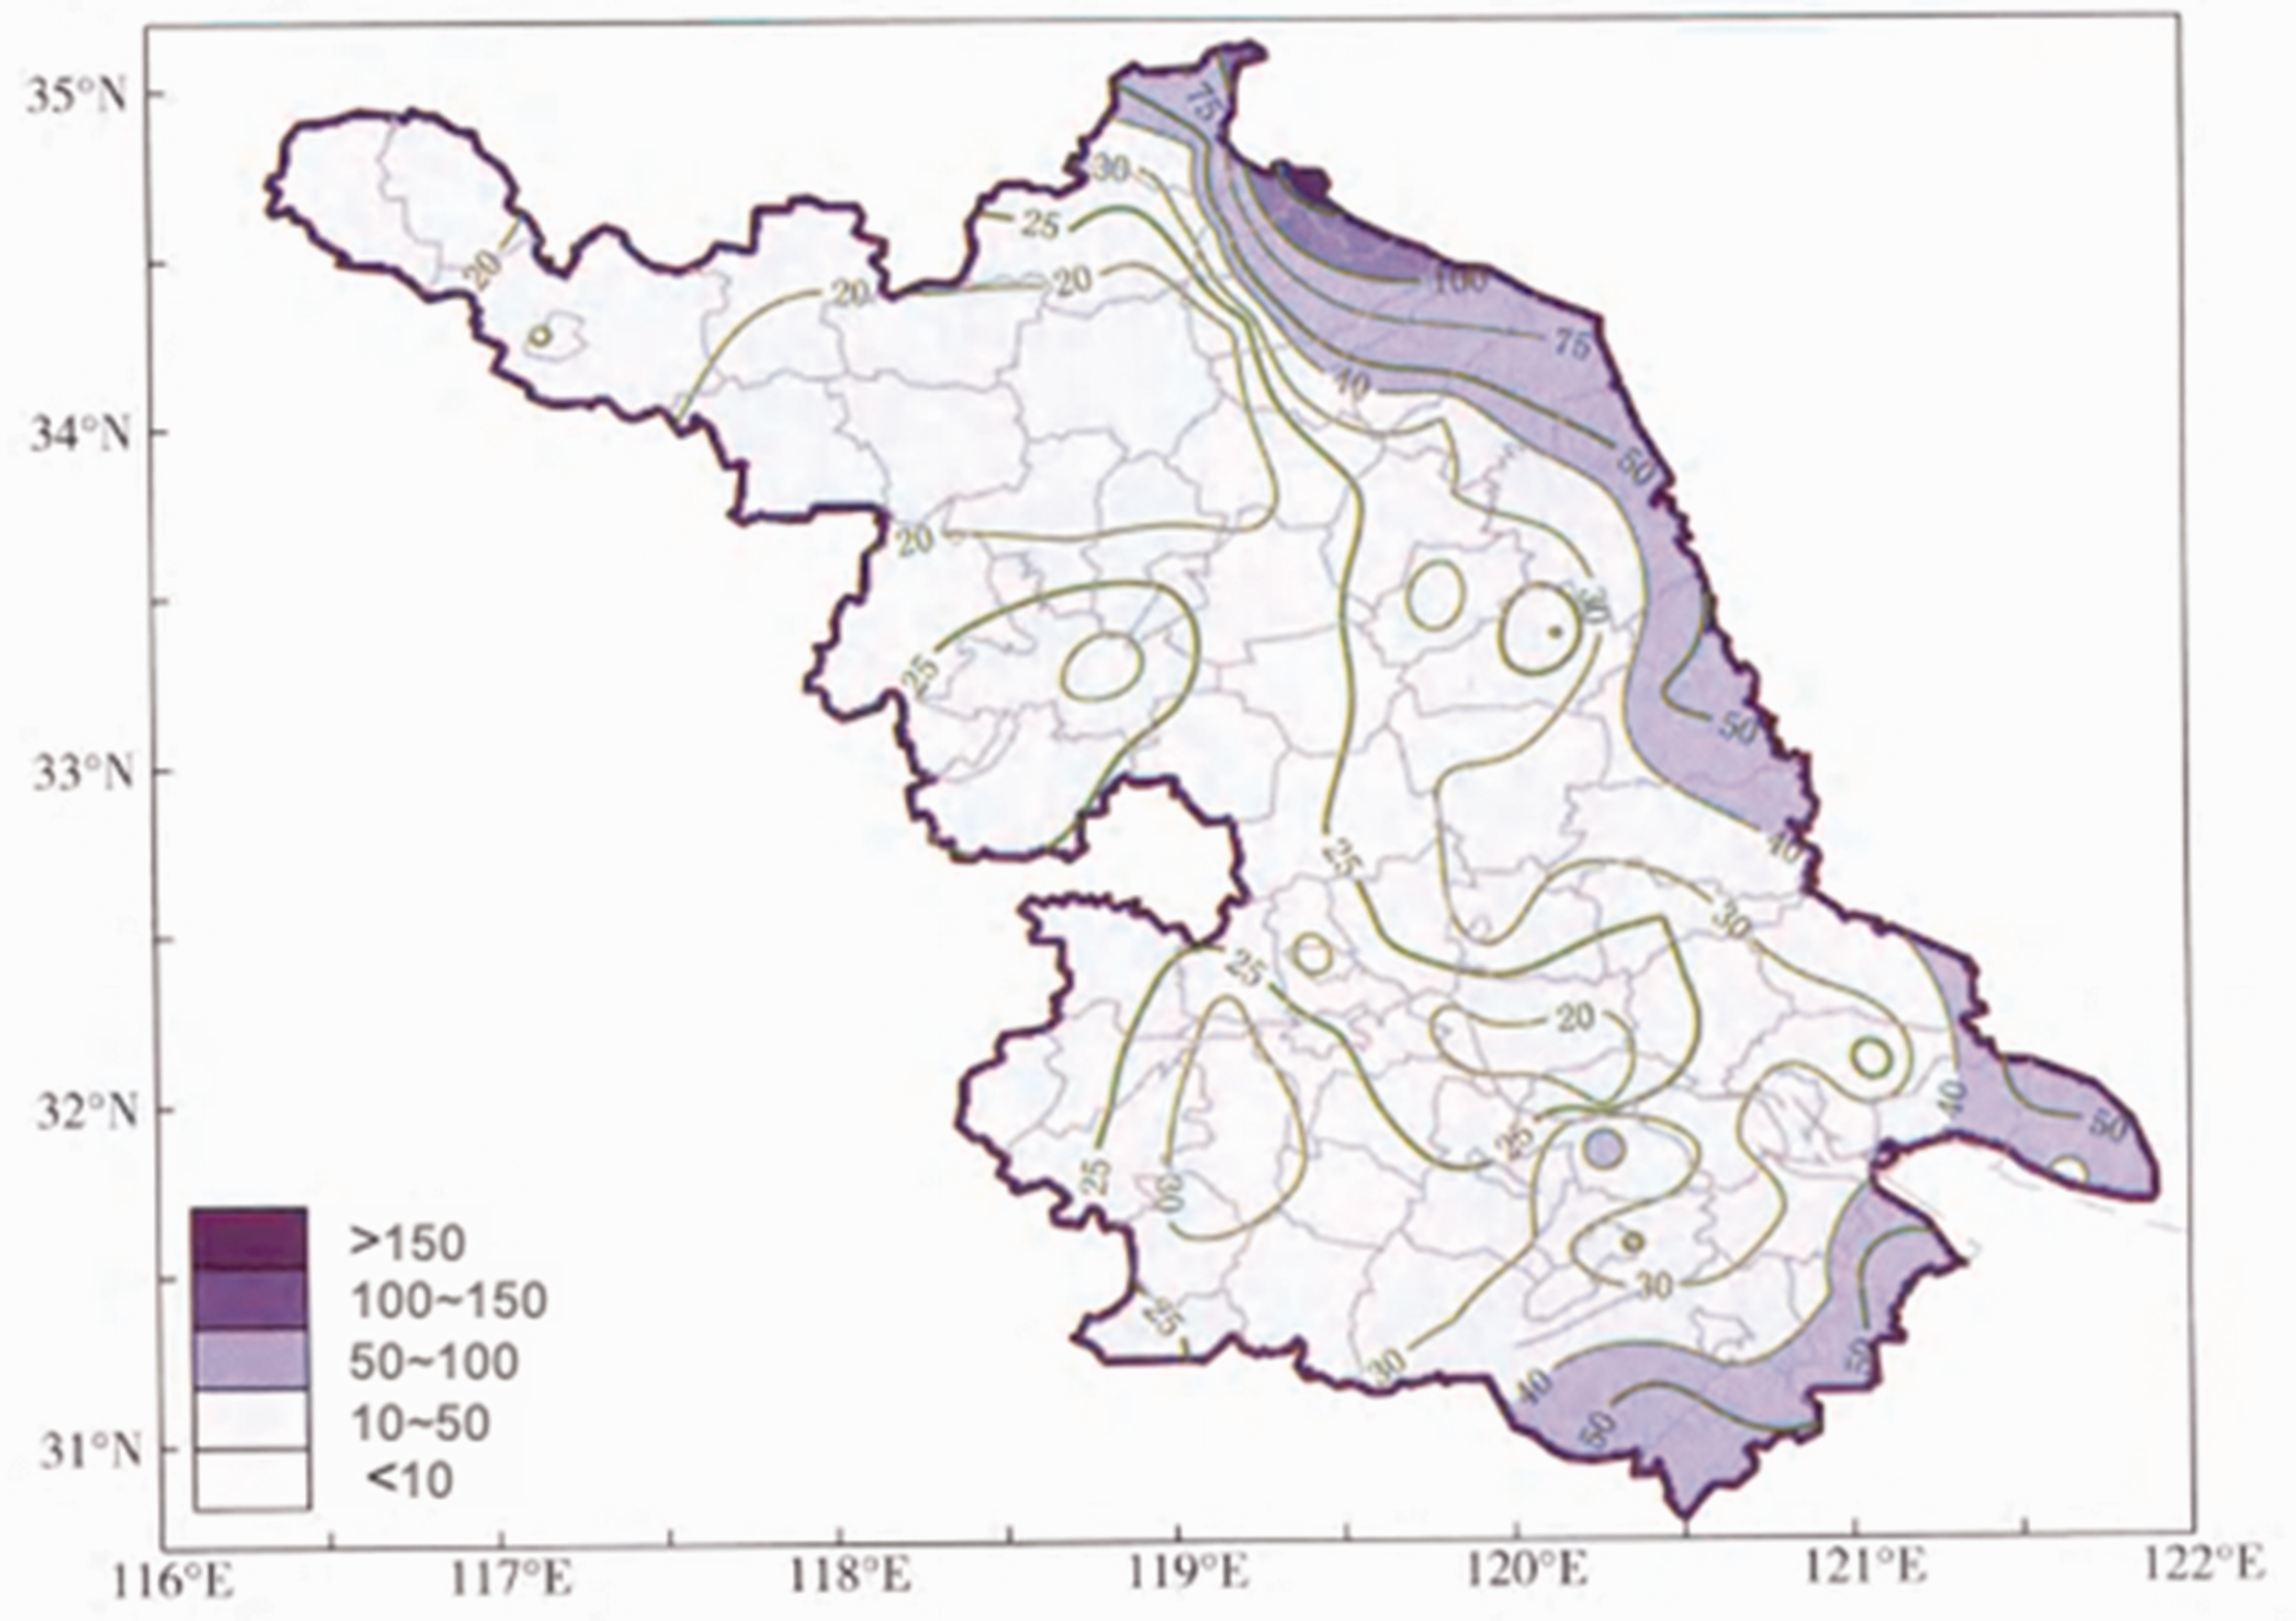
Annual average wind energy density in Jiangsu province.
Using measured data (6 wind farm anemometer towers, 14 meteorological stations, and Huludao Ocean Station), Gong et al. (2006) calculated the wind energy in the coast areas of Liaoning Province. The results showed that the annual average wind speed along the coast of Liaoning Province had the following characteristics: the annual average wind speed along Liaodong Bay was higher than that along the northern Yellow Sea. The former was higher than 5 m/s except for Liaobin, while the latter was less than 5 m/s. From coast to inland, the wind speed decreased rapidly. On the land slightly far from the coast, the wind speed was higher at the top of Liaodong Peninsula (4.4–4.6 m/s), but less than 4 m/s in other areas. The coastal areas had rich or relatively rich wind energy resources, but the resources in the coast of Liaodong Bay were more abundant than those of the northern Yellow Sea. Since Liaoning Province was located in a monsoon climate, north and south were two main directions where wind energy was concentrated. However, the wind energy along the northern Yellow Sea was dominated by the north wind component. Spring was the best period for the utilization of wind energy resources in the coastal areas of Liaoning Province, followed by autumn and winter, while the worst period was summer. The best time of a day for the utilization of wind energy resources was daytime, especially afternoon. The annual effective wind energy at a height of 50 m in Liaobin and Mingyang were 2763 and 1482 (kW·h)/m respectively, which was more than 1 time higher than that at a height of 10 m. The annual effective utilization duration was more than 6000 h. The coastal areas of Liaoning had the potential for large-scale exploitation and utilization of wind energy resources.
Wen et al. (2011) analyzed the wind energy resources along the coast of Fujian Province, using observation data of 18 anemometer towers with a height of 70 m in the coastal areas of Fujian Province. The results indicated that the coastal areas of Fujian had rich wind energy resources, among which the resources in the coastal areas from the south-central part of Fuzhou to the south part of Quanzhou were the most abundant, and the annual effective wind power density ranged from 516.7 to 516.7–930.4 W/m2, and the wind power density of Pingtan Island was as high as 930.4 W/m2. In addition, the area around Chihu Town, Zhangpu County in the south of Fujian Province was also very rich in wind energy resources, with an annual effective wind power density of more than 509.9 W/m2, as shown in Figure 2. The annual average effective wind hours and their percentage in coastal areas of Fujian were 7837.3 h and 82.9% respectively. The application grades of wind power in the coastal areas from the south-central part of Fuzhou to the south part of Quanzhou for generation were “very good”, while the other areas were between “good” and “fair”.
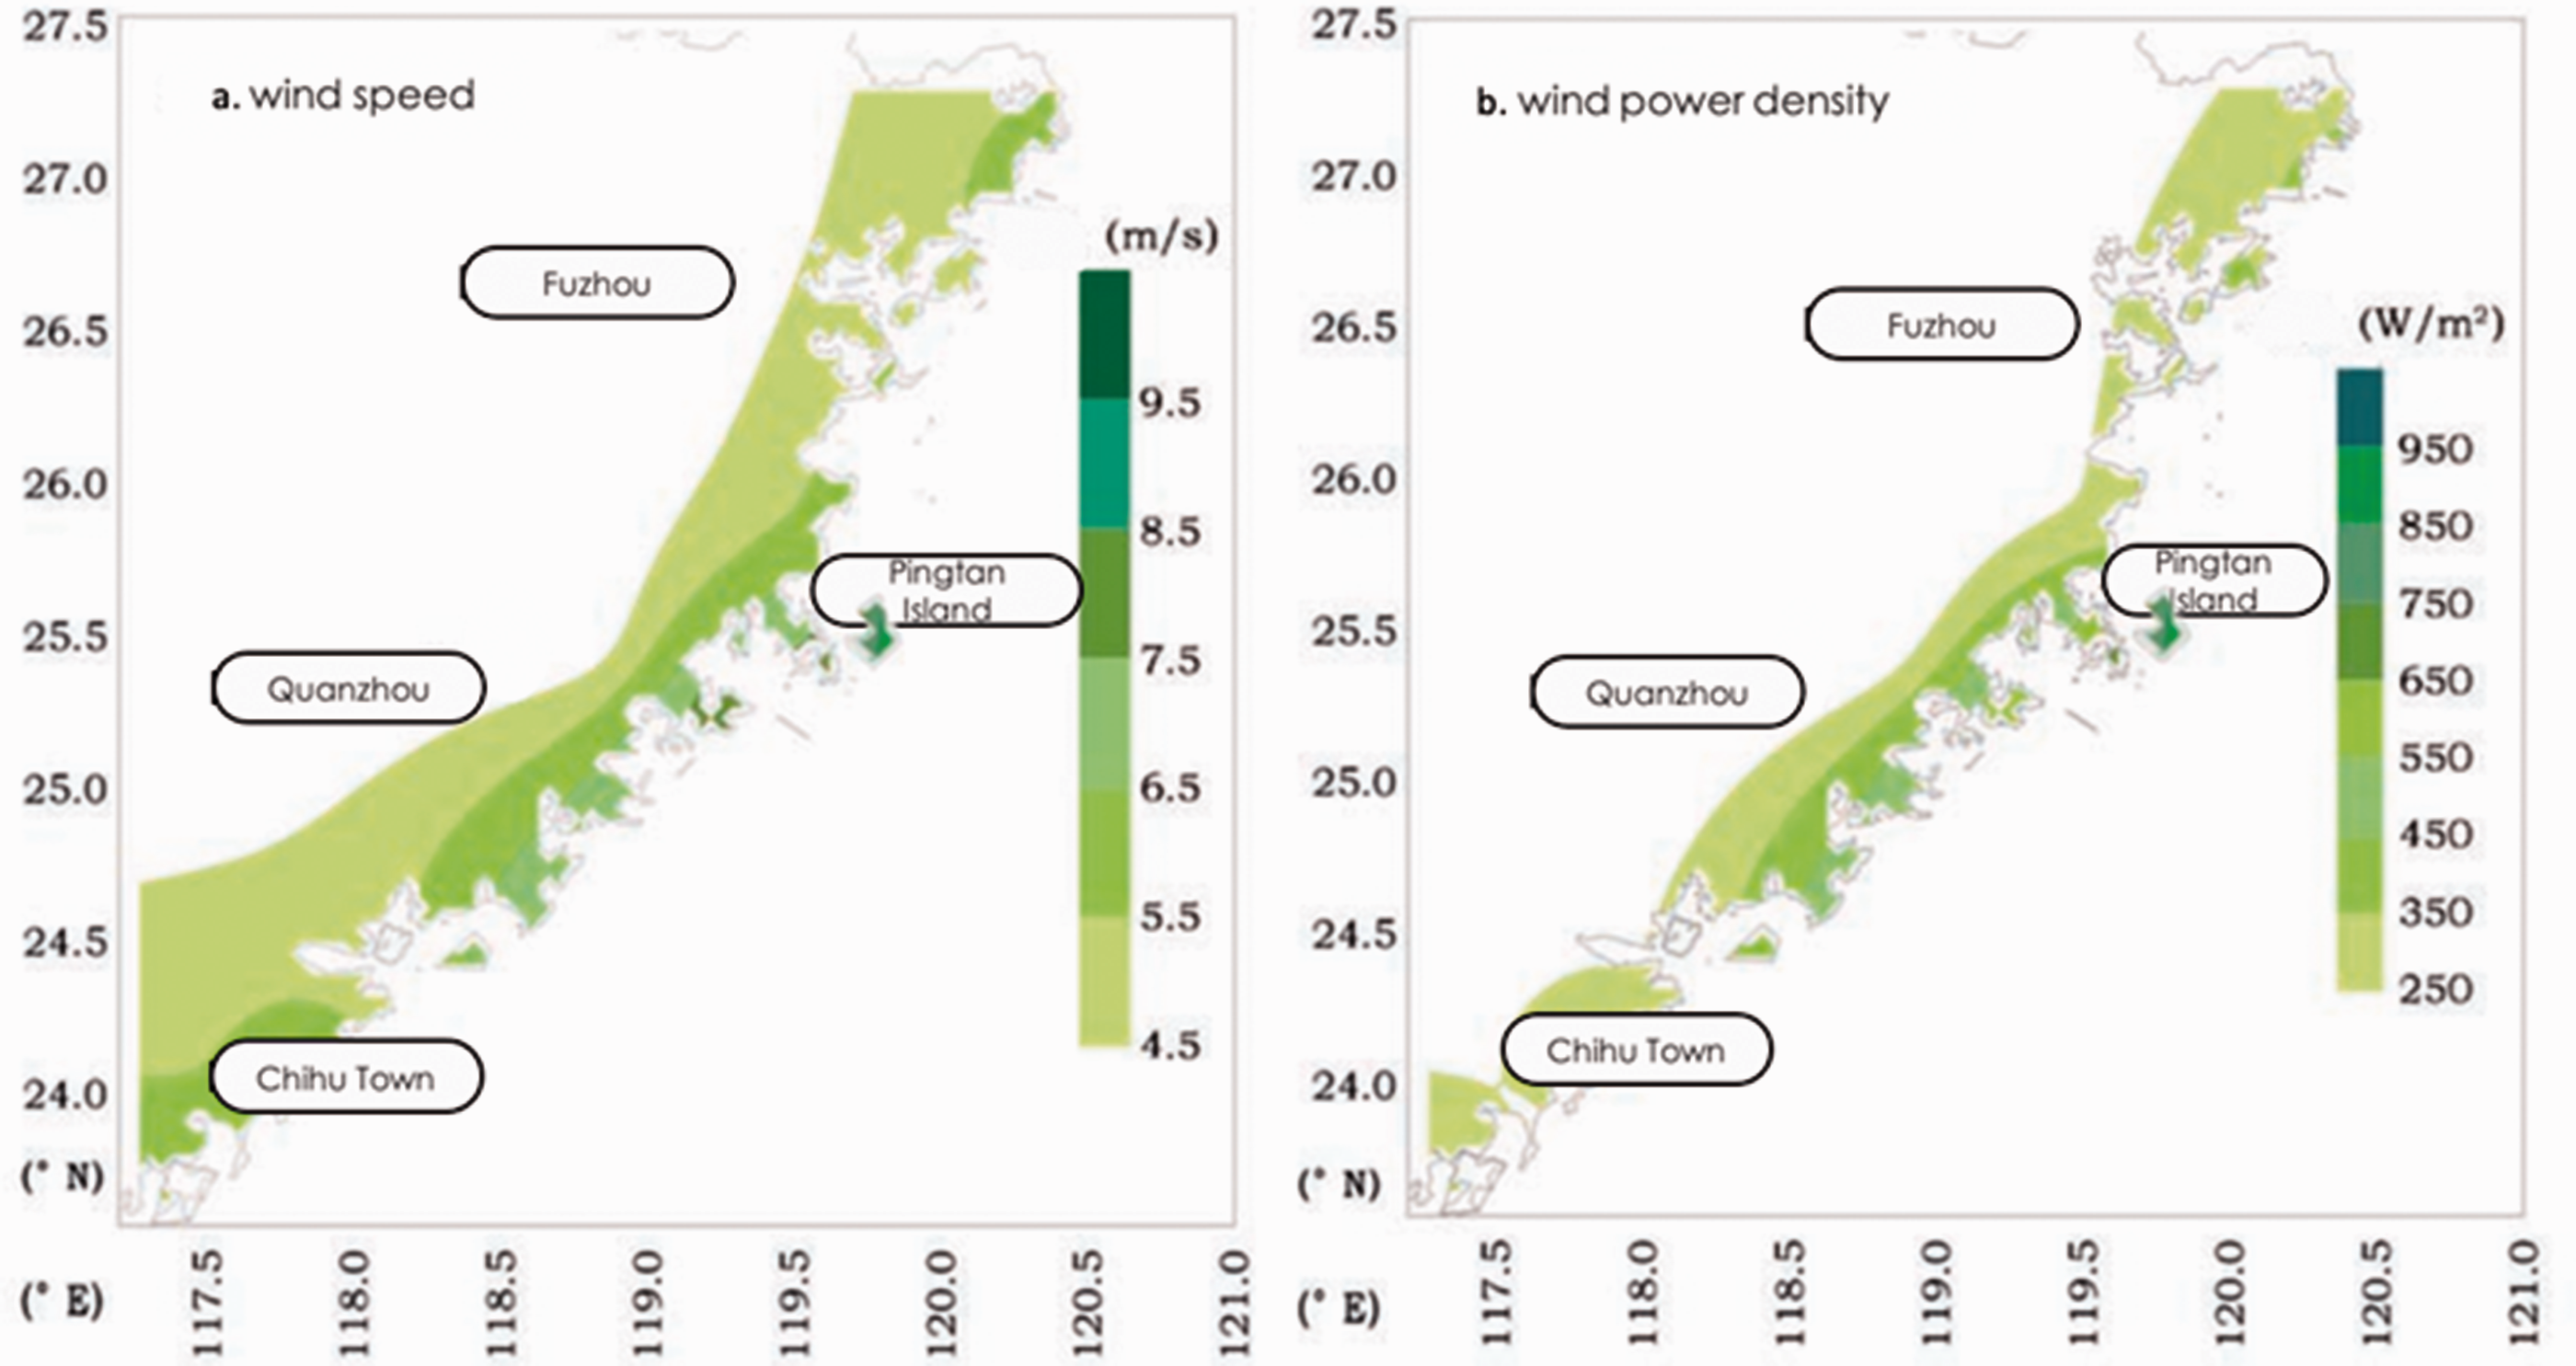
Wind speed and wind energy density at 70 m in the coast areas of Fujian.
Using the observation data of the ocean station, Yang et al. (2011) analyzed the wind energy resources in Longkou, and the results implied that from 1995 to 2008, the annual average wind speed at 10 m in Longkou was 6.8 m/s, and the annual average wind energy density was 377 W/m2. The annual average effective hours were 7589 h, the main wind direction was distinct, and the wind energy was concentrated, which was suitable for the development of wind power generation.
Lee (2010) pointed out that during the site selection of wind energy development in coastal areas, wind power, earthquake, land use, seabed structure, typhoon, typhoon, distance between road sections and water depth, etc. should be taken into account. He also analyzed the wind energy resources in the waters around Taiwan, and discovered that the waters near Changhua were suitable for the exploitation and utilization of wind energy resources.
Zhou et al. (2010) adopted an MM5/Calmet model to simulate the wind energy in coastal areas in China from January to May 2009. The results indicated the coastal areas in China had very abundant wind energy resources. The perennial average wind power density on land at the height of 70 m in coastal provinces was basically 200–400 W/m2 and the perennial average wind power density of surrounding waters was 300–800 W/m2. There were particularly rich wind energy resources in Fujian Province, followed by Liaoning Province, Zhejiang Province and Guangdong Province, then Shandong Province, Hebei Province, Tianjin City and Shanghai City, and finally Jiangsu Province, Hainan Province and Guangxi Province.
By employing an MM5/Calmet model and NCEP/NCAR reanalysis data, Dong et al. (2011) performed a simulation study on wind energy resources in offshore waters in Shandong in 2008. The results showed that the average wind speed in the offshore areas of Yellow River Estuary, Changdao and Weihai in Shandong Province exceeded 6.0 m/s and the annual average wind energy density was more than 225 W/m2. The wind energy density in the coastal areas of eastern Weihai and Chengshan Cape reached above 275 W/m2 and the annual effective hours in the northern offshore waters and eastern Weihai (the hourly average wind speed was 3–25 m/s) was more than 7400 h, but slightly lower in southern coastal areas.
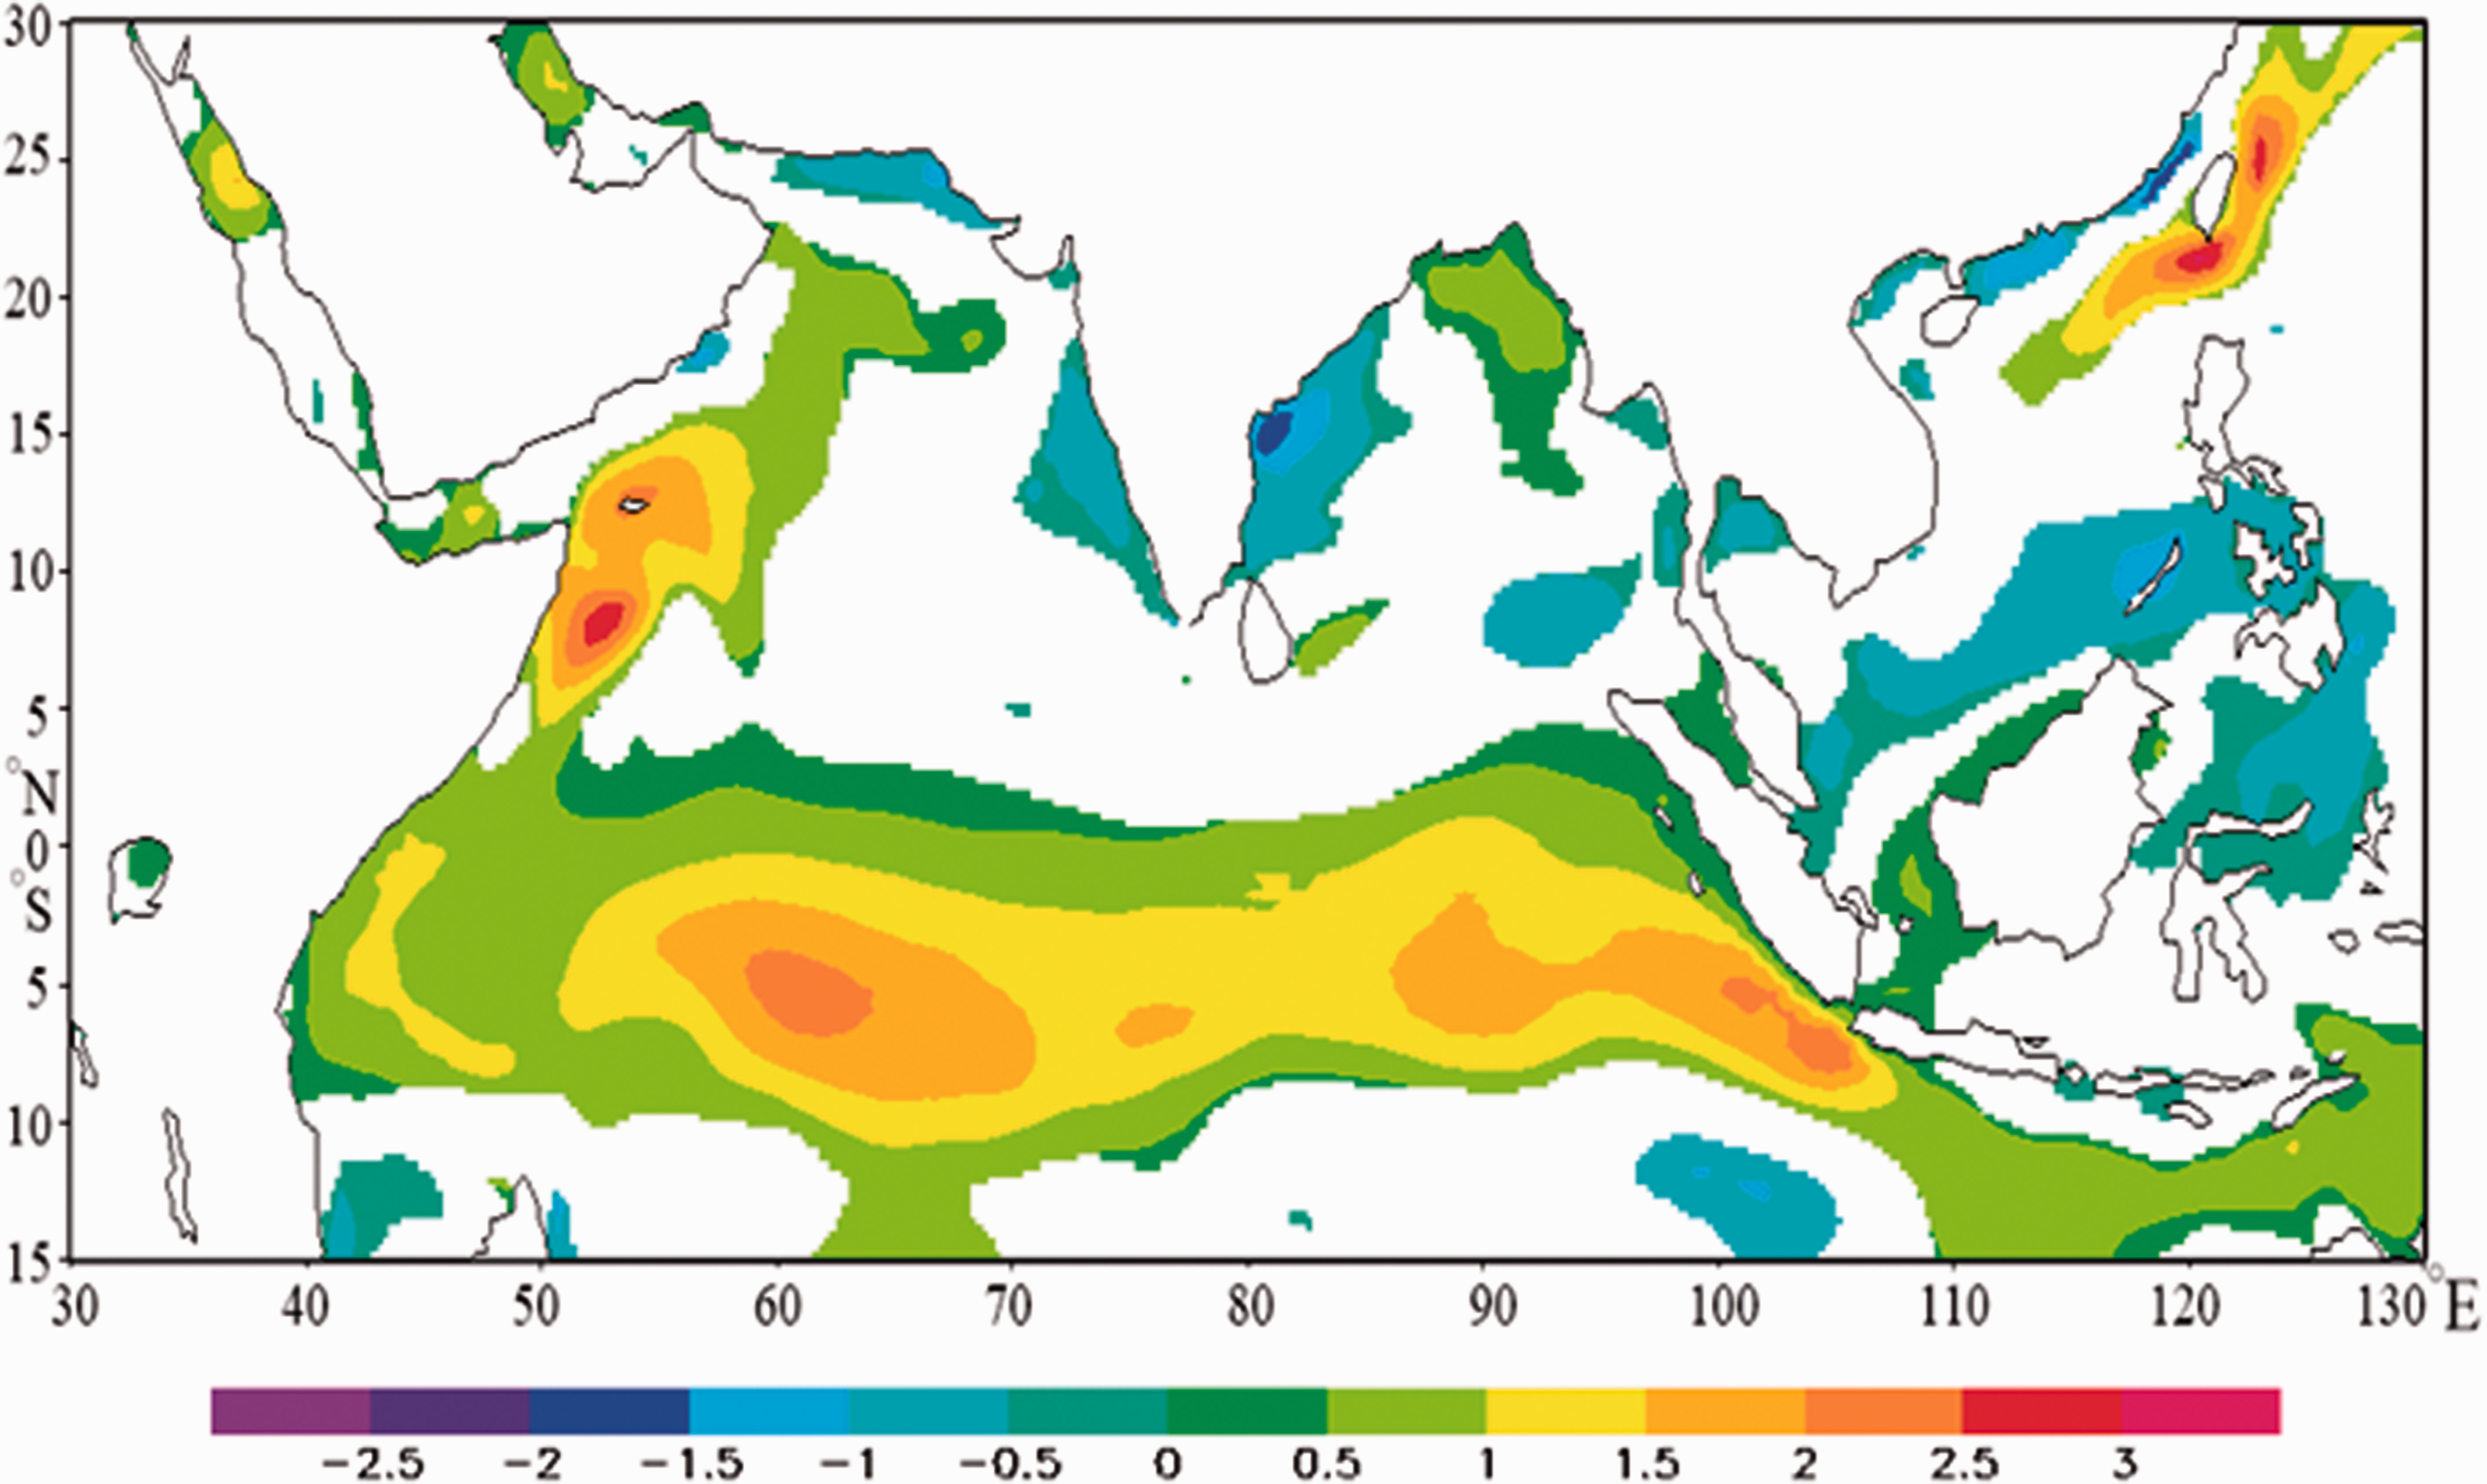
Zheng et al. (2012) defined two key indicators for the first time: effective wind speed frequency and frequency of wind energy level. By comprehensively considering the size of energy flow density, frequency of energy level and stability of energy flow density, etc. they conducted a detailed survey on the offshore wind energy resources in the whole China seas for the first time. According to the traditional wind energy grade division scheme, they carried out the offshore wind energy grade division of China seas and made pioneering contributions to the evaluation of offshore wind energy resources in all of the China seas. The results showed that the annual average wind energy density in most sea areas of China seas exceeded 100 W/m2, and large value areas were located in the Ryukyu Islands-Luzon Strait- frontline of Binh Thuan Island line and Taiwan Strait, basically above 300 W/m2, as shown in Figure 3. The East China Sea and the South China Sea were high-frequency areas of wind energy densities above 50 W/m2. The frequency of wind energy densities above 50 W/m2 was basically above 70%. The frequency in the south-central part of Yellow Sea was lower than those in the East China Sea and the South China Sea, while the frequencies in Bohai Sea and the northern Yellow Sea were low as a whole. The wind energy density in July was the least stable of the year. Over the last 22 years, the wind energy density in most of the China Seas had shown a significant linear rising trend year by year. Regions with stronger upward trend of wind energy density were located in Taiwan Strait, Luzon Strait and Tsushima Strait, while regions with stronger upward trend of wave energy flow density were concentrated in the Ryukyu Islands-Luzon Strait.
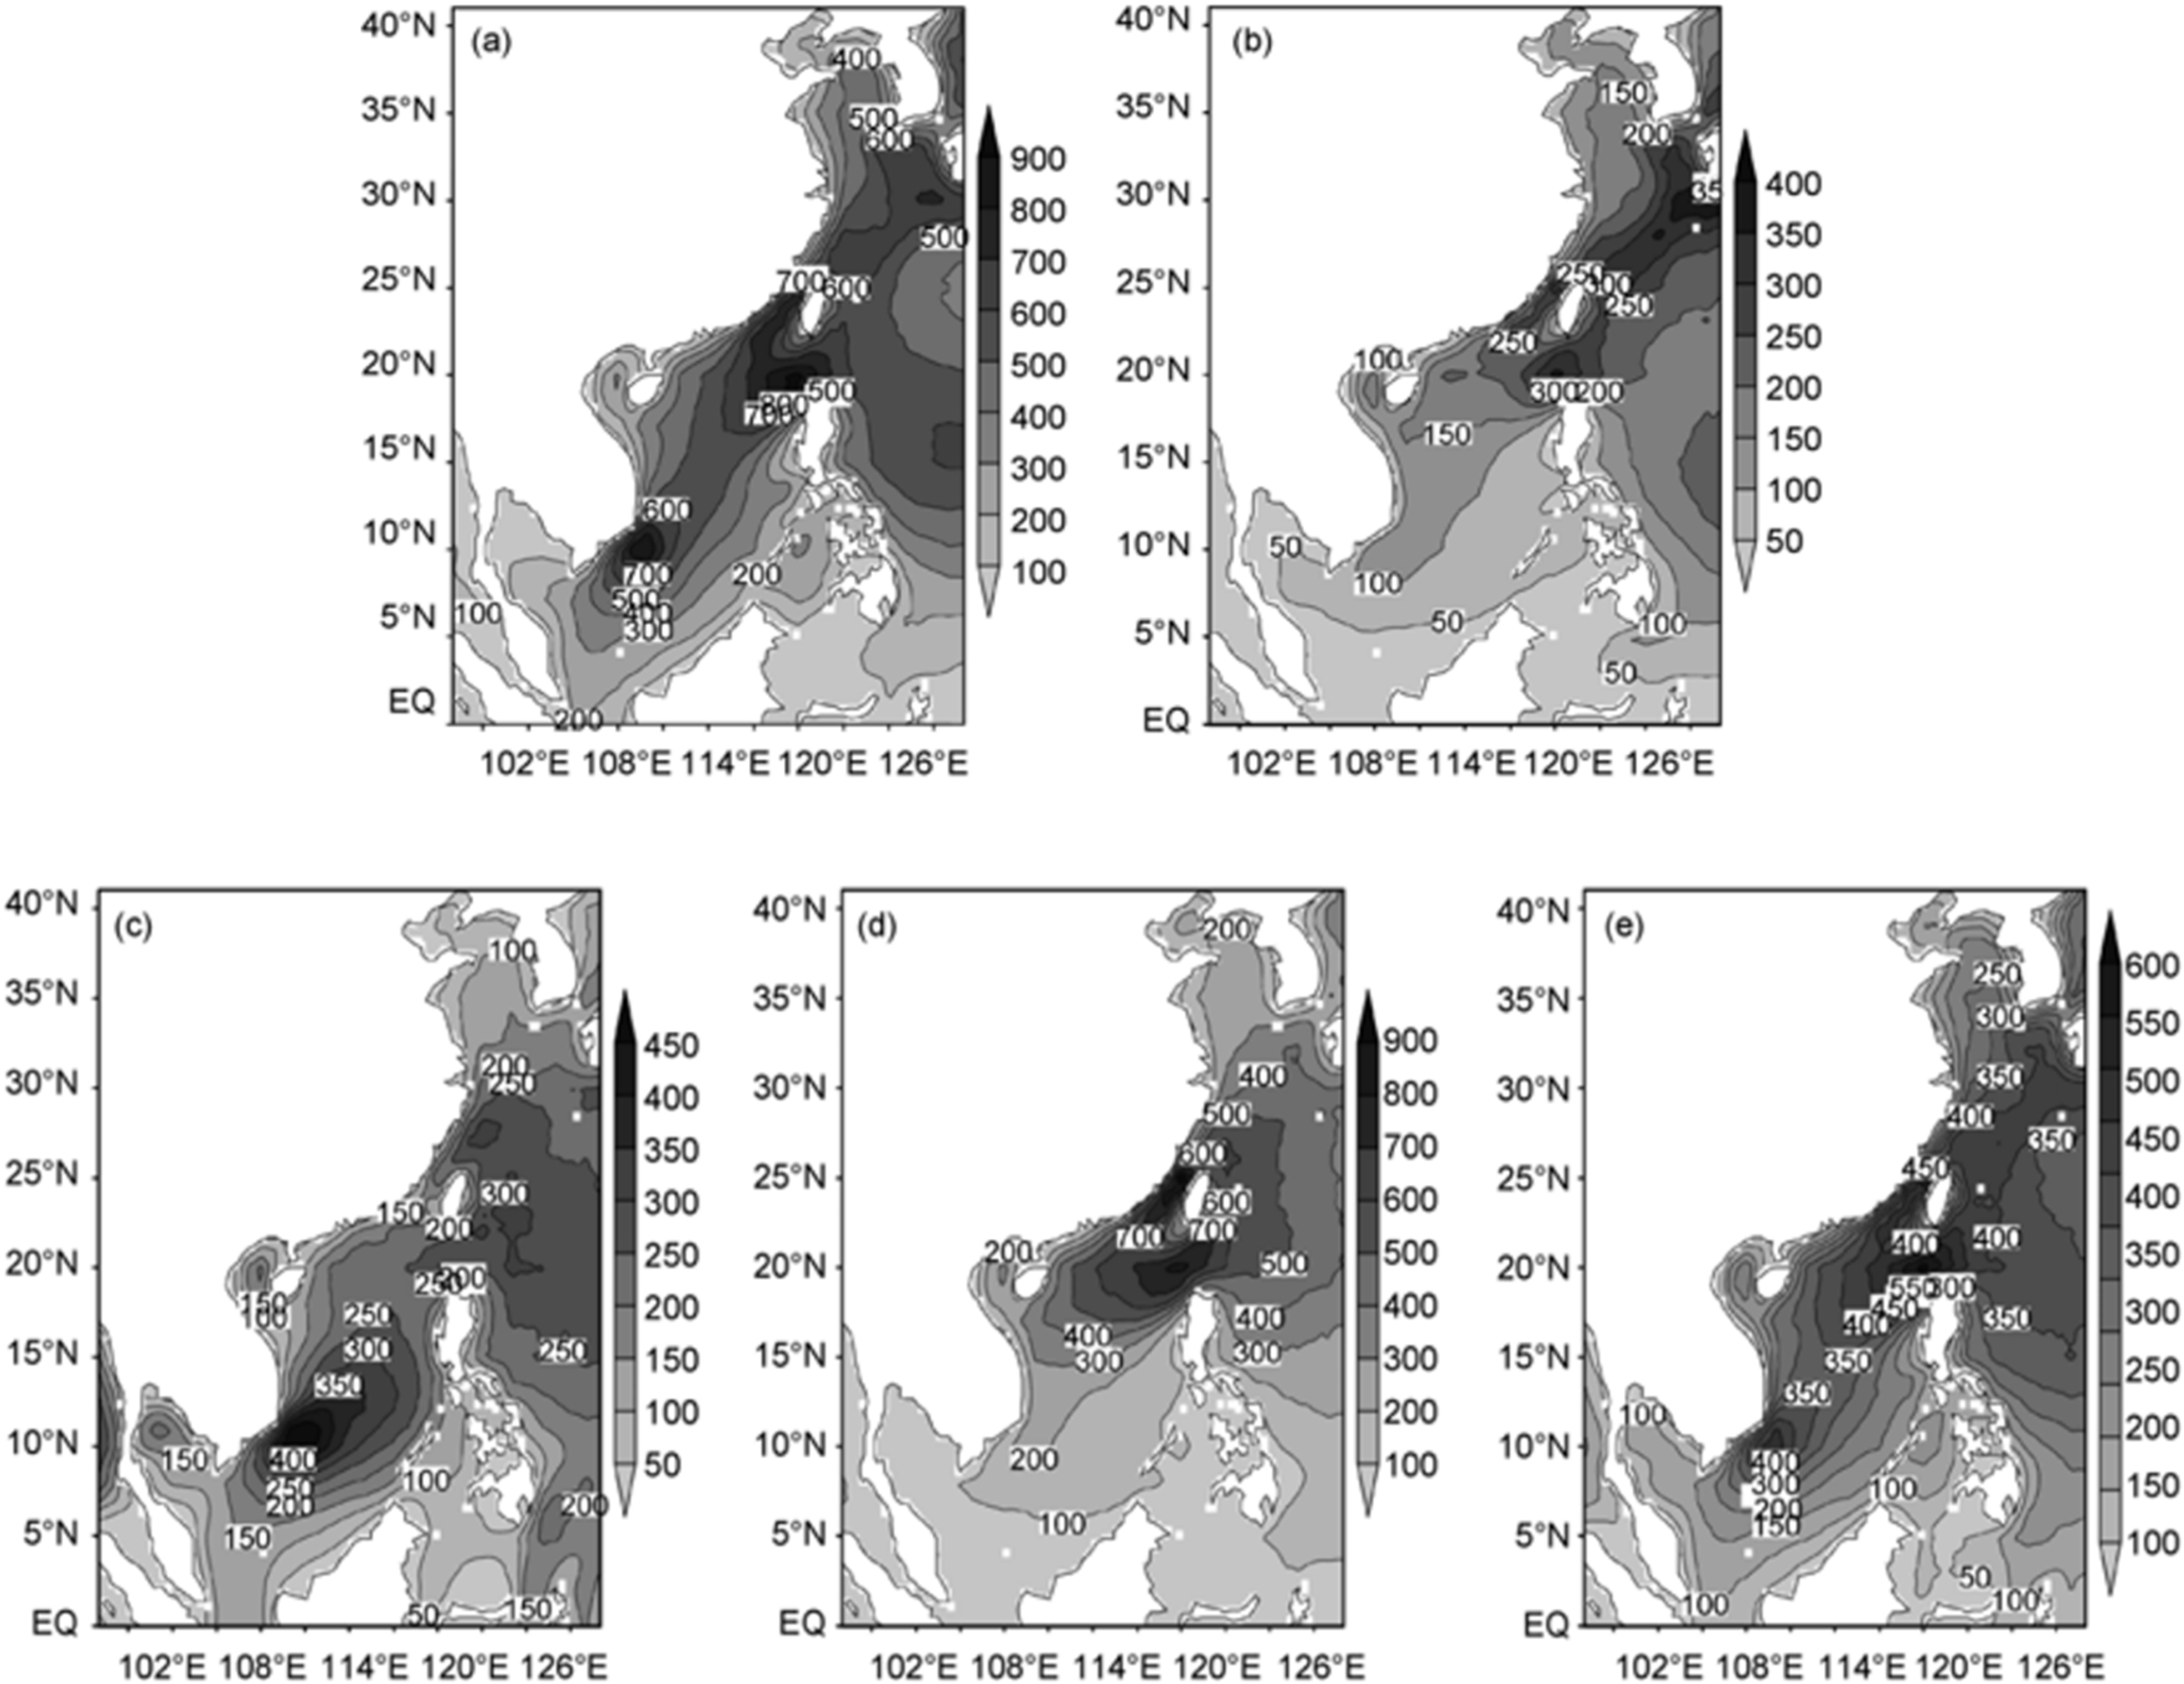
Wind power density in January (a), April (b), July (c), October (d) and annual average value (e) in the China Sea.
Wind energy classification
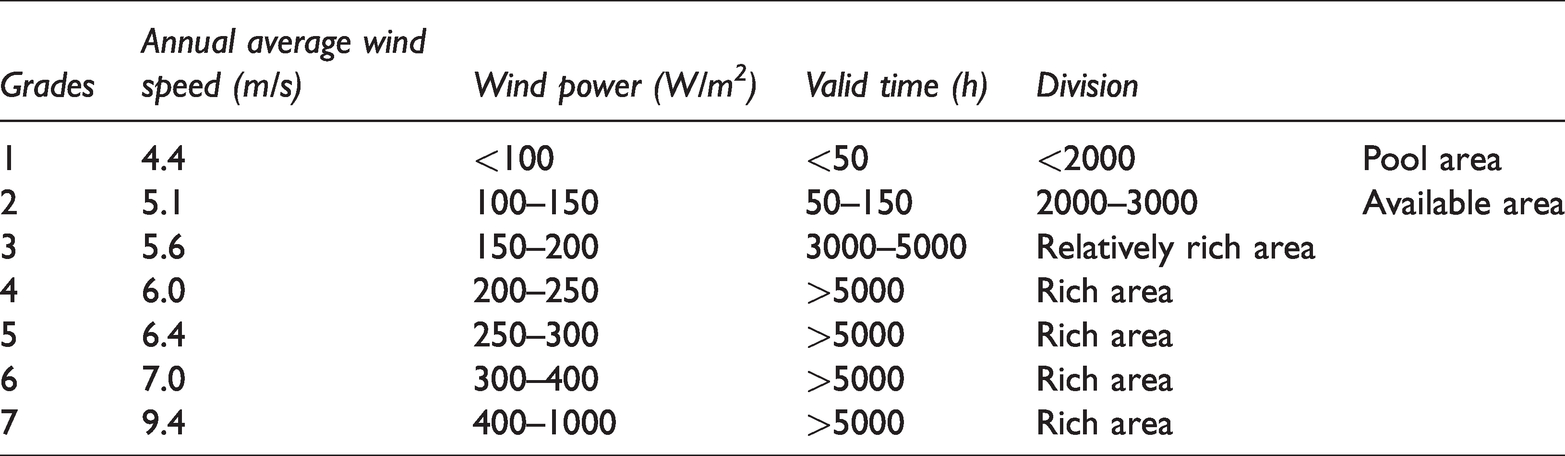
Resource level zoning is the key basis for wind power generation site selection, Huang et al. (2007) carried out a hierarchical zoning of wind energy in Jiangsu Province based on the index of wind energy division (as shown in Table 1). The results showed that the province’s wind energy-rich areas were mainly located on coastal islands (such as Xilian Island). The secondary rich areas were located in Lianyungang Town, Xugou Town, etc. The available areas were located in Ganyu-Guanyun-Xiangshui-Sheyang Line, Dafeng, the coastal area from the east of Qidong to the sea, and the area to the east of Taihu Lake. While the poor areas were most of the land areas.
The indexes of wind power density grades and division.
Chen et al. (2008) carried out a hierarchical division of wind energy in Lianyungang City using the meteorological data of this City for more than 30 years (the plan as shown in Table 2). The results showed that the wind-rich areas in this area were mainly located in the coastal area of Lianyungang, 6–10 km away from the coast; the richer areas were mainly located in the coastal area from the south of Qingzhen in Ganyu County to the Yanwei Port line within 6 km; the available area was mainly distributed in the area extending 5–15 km from the coast to the inland; the poor area was located in the inland area.
The indexes of wind power divisions.
Overall, the traditional wind energy level zoning scheme only considers the energy flow density alone, or considers the three elements offe wind speed, wind energy density, and effective wind speed frequency. While in the actual wind energy development process, not only the characteristics of resources, but also a series of marine environmental elements closely related to marine engineering should be considered. Zheng et al. (2018, 2019) took the lead in creating a new resource level zoning plan that could comprehensively consider the three aspects of resource characteristics, environmental risks, and cost-effectiveness, which was not achieved by traditional plans. This scheme took 8 elements into consideration: wind power density (WPD), effective wind speed occurrence (EWSO), rich level occurrence (RLO), water depth (WD), distance to coast (DC), extreme wind speed (EWS), coefficient of variation (CV) and monthly variability index (MV), and combined with the weight of each element (Table 3) and standardized values to calculate the expected value of wind energy, finally divided it into 7 levels to achieve resource level division. Using this scheme, the wind energy resources in the global seas were re-leveled, and the wind energy resources in the New Zealand sea area were divided in micro-fine level (Figure 4).
Weight coefficient of significant factors in the wind energy classification, unit: %.
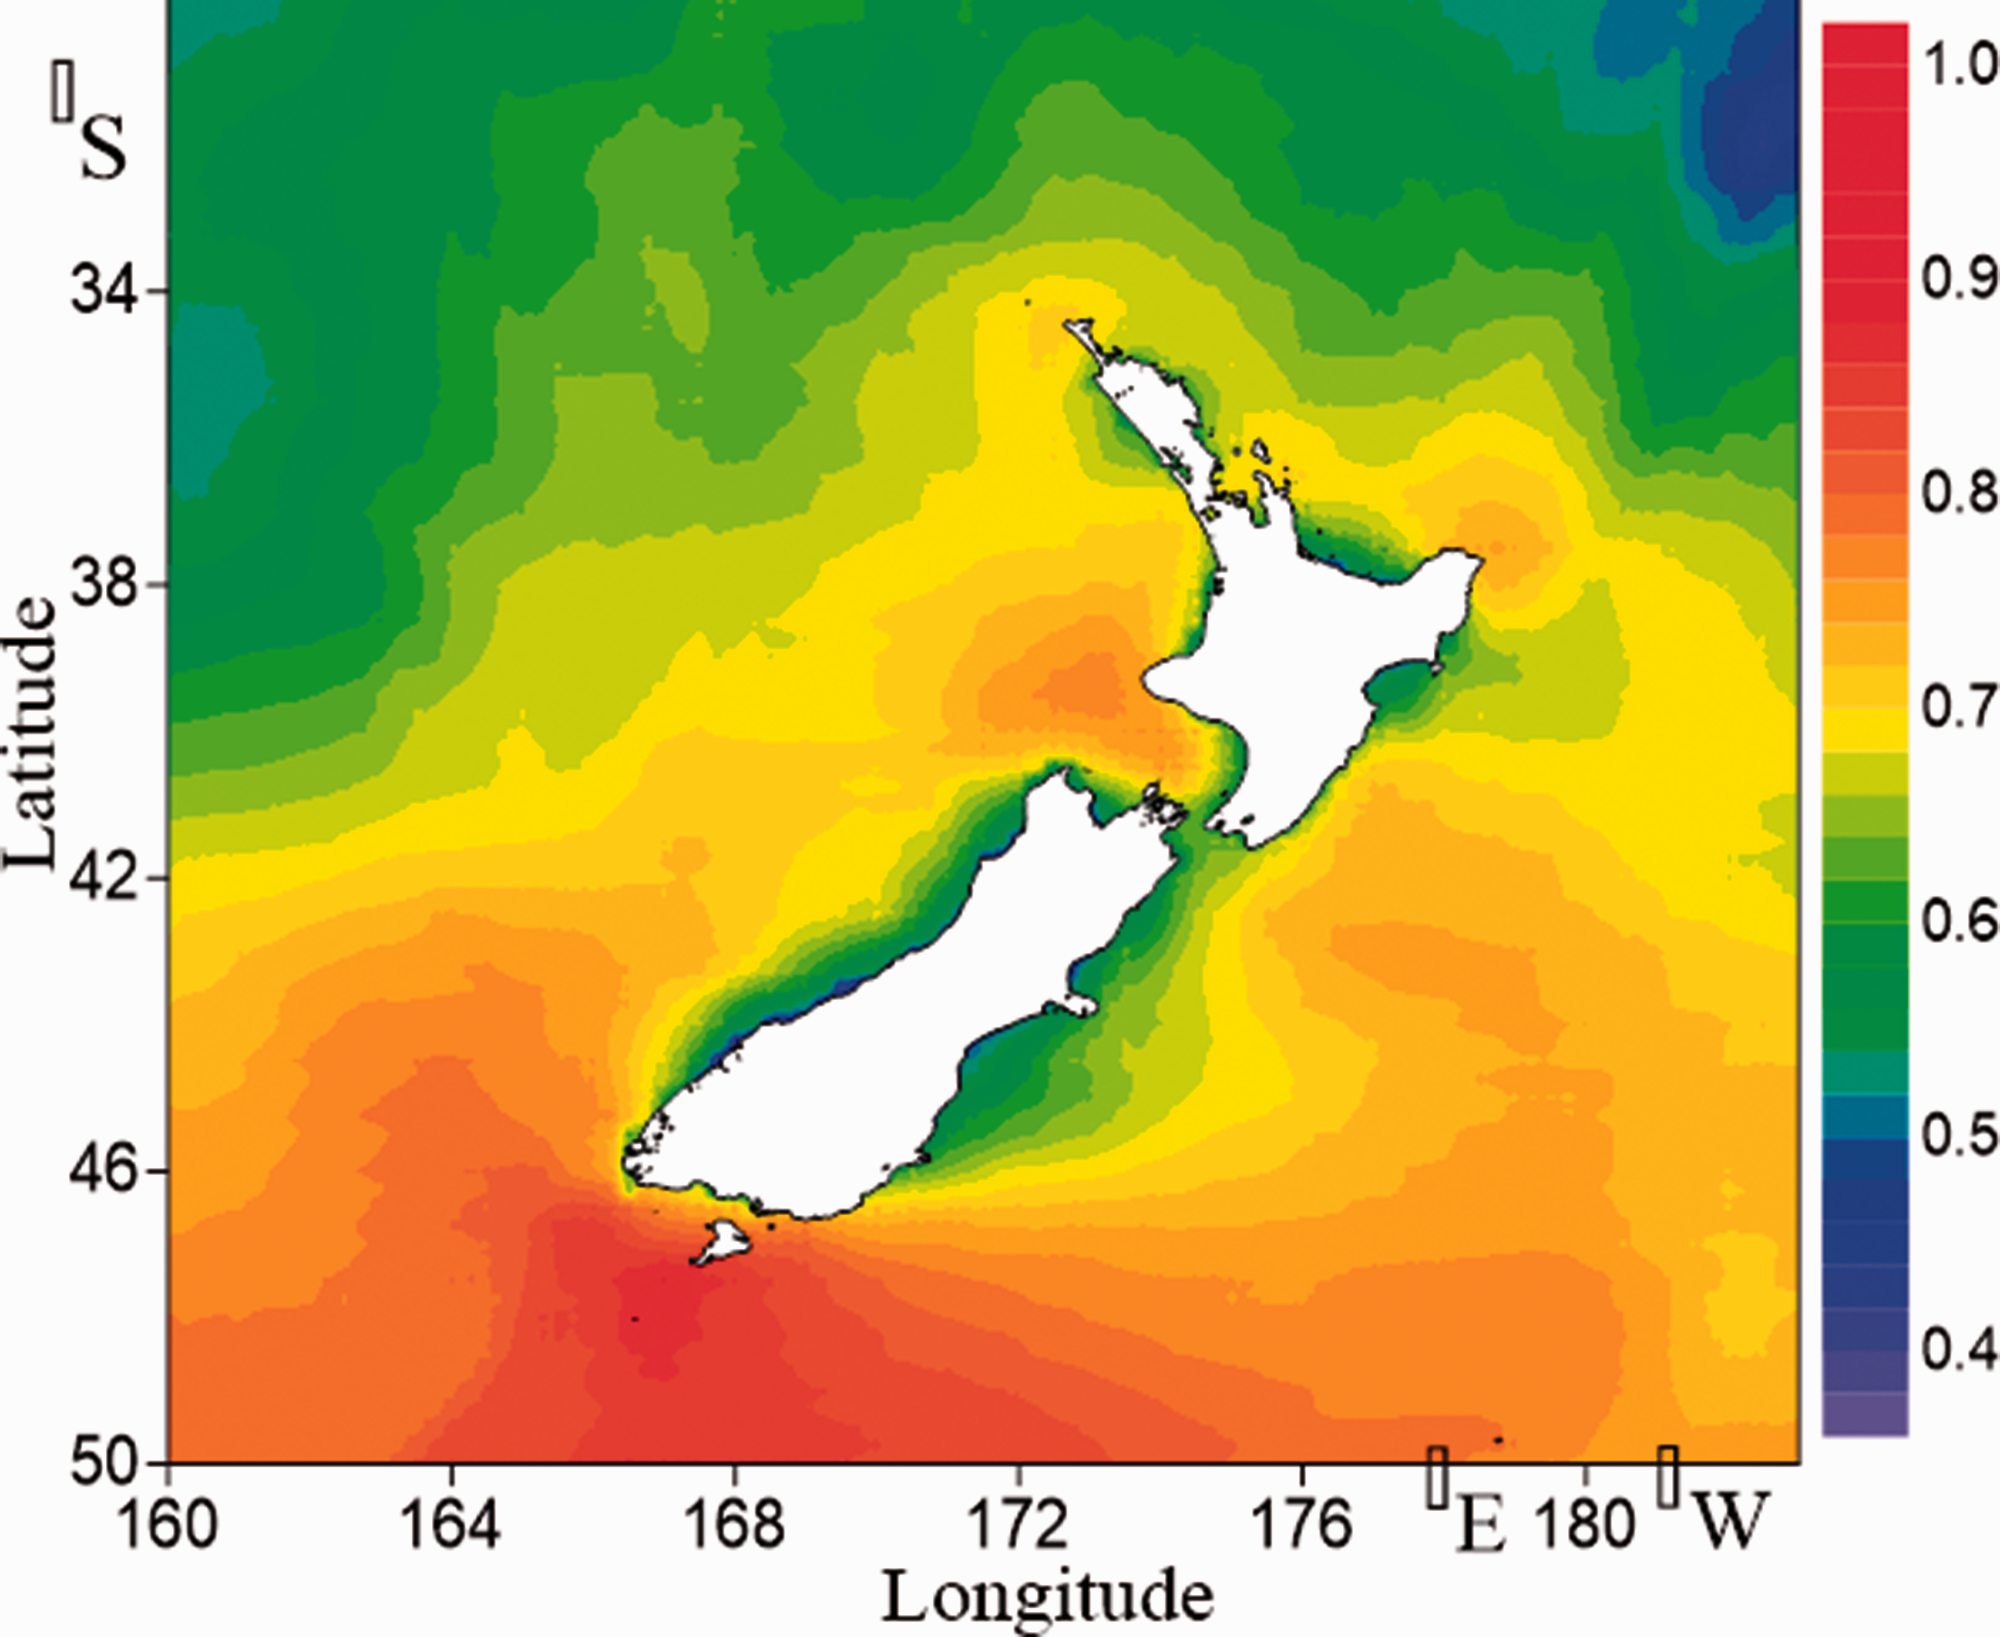
Wind energy classification in the New Zealand waters.
Short-term forecast of wind energy
The short-term forecast of wind energy is closely related to resource exploitation. In the early 1990s, Europe began to develop wind energy forecast systems. The most classic ones were Prediktor and WPPT (Wind Power Prediction Tool) from Denmark, eWind developed by True Wind Solution in the United States, WEST from Canada, Previento from Germany, LocalPred and RegionPred from Spain, HIRPOM from Ireland and Denmark, etc. China has made a lot of efforts and contributions to the short-term forecast of meteorological and marine elements. However, up to now, there are scarce studies on the short-term forecast of wind energy. By modeling the correspondence between actual wind speed and wind power, Li et al. (2010) figured out corresponding fitting parameters, and proposed a short-term forecast method of wind speed based on the grey forecasting model. At present, the most common forecasts in China were based on the WRF model or CALMET or CFD for accurate and detailed forecasts (Chen et al., 2015; Li et al., 2012; Wang and Wang, 2013). In addition, there was also an hourly wind speed forecast equation, fitted with the specific heights of two anemometer towers in the coastal areas of Fujian, based on MM5 numerical forecast products, in combination with stepwise regression method (Bai et al., 2013). Based on 4 combinations of different parameterization schemes of near-surface layer-boundary layer, Wang et al. (2015) simulate the hourly wind speed of a 70-meter-high anemometer tower in Dafeng City, Jiangsu Province in January, April, July and October respectively, using a WRF model. The results showed that the Scheme A, a combination of parameterization schemes of MM5 similarity near-surface layer and YSU boundary layer, had a better effect. The simulation accuracy of 4 combinations of parameterization schemes for wind speed in wind farms in autumn and winter were obviously better than that in spring and summer. The WRF model simulated better for seaward wind than for landward wind, and the simulation error had obvious directionality and the special terrain distribution in coastal areas had a significant impact on it. Zheng et al. (2014) applied NCEP wind field to the wind energy forecast in offshore waters in China, which provided a pragmatic, convenient and low-cost and effective way for offshore wind energy forecast in offshore waters in China. Zhang (2020) launched a study on the improvement of the numerical forecast capability and the development of application system for typical wind farms. In view of the complex topography and underlying surfaces and few observation stations in Hexi of Gansu Province, the author analyzed the wind field characteristics of typical wind farms in western Hexi of Gansu Province, performed a numerical simulation of wind farm and improved the numerical model specifically, as shown in Figure 5.
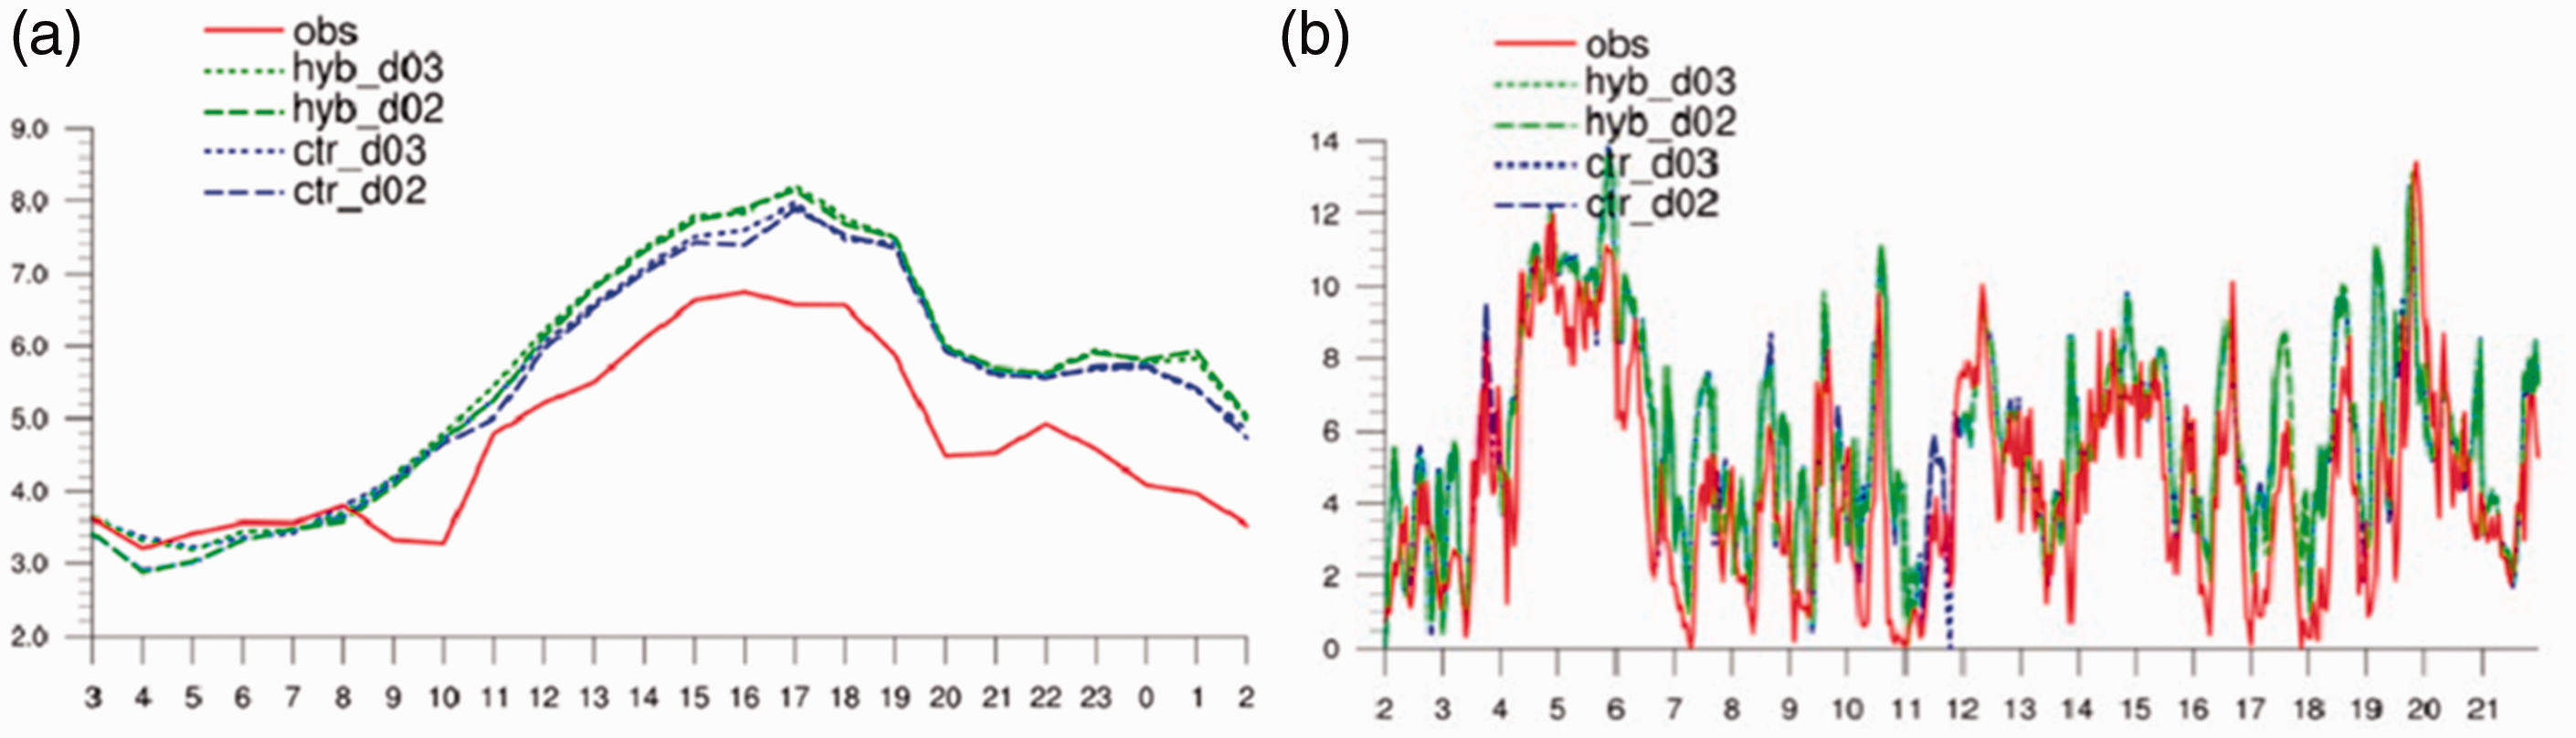
Simulated and actual wind speeds at a height of 10 m in Anma Wind Farm ((a) was the change of wind speed with forecast time and (b) was the hourly change of wind speed).
Long-term forecast of wind energy
The long-term estimation of wind energy is closely related to the medium and long-term planning of resource exploitation. Predecessors have done a lot of work to study the variation trend of meteorological and marine elements. Currently, the research on the long-term variation trend of wind energy resources is still scarce, but provides a theoretical basis for the improvement of the accuracy of long-term forecast. By making use of the meteorological data of Lianyungang City over more than 30 years, Chen et al. (2008) discovered that the offshore waters of Lianyungang had huge reserves of wind energy, the wind power density was above 200 W/m2 and the annual cumulative hours of effective wind were more than 6 000 h. Moreover, it was close to the power shortage area of the Yangtze River Delta. If neritic wind power generation was carried out, it would surely become another important energy base with sustainable development capacity in the eastern coast of China. Since the late 1970s, the wind energy reserves in Lianyungang had decreased year by year, and in the late 1990s, the wind energy reserves tended to be stable. Compared with onshore, the interannual variation of offshore wind energy was not evident, so the wind energy reserves were more abundant and had greater development value. Affected by the stability of underlying surface and atmospheric stratification, etc., the wind energy resources in coastal and offshore areas showed different diurnal and seasonal variation laws from those in inland areas. The utilization of offshore wind power for generation can help solve the contradiction between peak demand for electricity in summer and seasonal reduction of wind speed to a larger extent. The vertical shear of offshore wind was smaller than that of onshore wind. The wind speed at the same height was more than 14% higher than that of coastal land, and there were fewer calm wind hours, so offshore wind power was more valuable to exploit and utilize than onshore wind. The intensity of wind turbulence was highly seasonal, which was low in winter, but high in summer and decreased with the increase of height. As a whole, the few studies on the long-term variation trend of wind energy in existence mainly focused on the variation trend of wind energy density (Zheng et al., 2017). Zheng (2018) pointed out that the long-term variation trend analysis of wind energy should not only include the variation trend of wind energy density, but also include the long-term variation laws of a series of key indicators, such as effective wind speed frequency, frequency of energy level, coefficient of variation, monthly change and seasonal change, etc. It pointed out a direction for the study of wind energy variation trend. By using the data of ERA-Interim wind field, for the first time, Zheng (2018) identified the variation trend of a series of key indicators of wind energy resources along “Maritime Silk Road” over the past 40 years and provided a theoretical support for improving the wind energy forecast capability, and the results indicated that the wind energy resources along “Maritime Silk Road” tended to be optimistic: the WPD, EWSO and RLO in most sea areas showed a dramatic increase or no significant change (Figure 6); The Cv and Sv of wind energy density in most sea areas presented dramatic decrease or no significant change. Only some sporadic areas presented dramatic increase. Zheng et al. (2019) utilized CMIP data and realized the long-term estimation of wind energy resources in seas throughout the world for the first time. The estimation content systems included WPD, EWSO, RLO and other key indicators. They also estimated the grade of wind energy resources, compared and analyzed the characteristics of previous and future wind energy, providing a theoretical basis and technical approach for the medium and long-term estimation of wind energy resources.
Annual variation trend of wind energy density along the Maritime Silk Road, unit: (W/m2)/yr.
Conclusion and outlook
China started late in the evaluation of offshore wind energy resources, but made rapid progress. Despite an extreme scarcity of data, predecessors have made a lot of efforts and contributions to wave energy resources in part of the nearshore areas in China. On the whole, the team led by Zheng Chongwei has established a universal evaluation system for offshore wind energy (Zheng et al., 2018), which covered a series of key indicators of wind energy, such as spatial-temporal distribution characteristics, short-term forecast scheme of wind energy resources, law and mechanism of historical evolution, and long-term estimation of wind energy resources, etc., providing a scientific basis for the site selection, business operation and long-term planning of offshore wind power, maritime navigation against environmental construction for military (areas with less wind energy are a necessary condition for the construction of a fixed environmental field) and other wind energy projects. But on the other hand, the following aspects need to be strengthened in the future.
Evaluation of wind energy on islands and reefs
There are many islands in China, but most of these islands are far away from the mainland and the power is in short supply, which seriously restricts the economic activities and residents' life on the islands. To full exert the advantages of coastal wind energy resource and implement offshore wind power generation can effectively relieve the power crisis in deep seas and remote islands, on the premise that the characteristics of resources are fully grasped. Predecessors have done a lot of work on large-scale evaluation of wind energy, but so far, there are few studies on the evaluation of wind energy on islands and reefs. The team led by Zheng Chongwei has established a universal evaluation system for wind energy on islands and reefs (Zheng, 2018; Zheng and Li, 2018; Zheng et al., 2016, 2017). The system covered the inter-monthly/annual/decadal characteristics of a series of key indicators of wind energy, the micro grade division, short-term forecast, law of historical evolution, medium and long-term forecast of wind energy in seas around islands and reefs, characteristics of disastrous gales, extreme wind speed, etc., providing a scientific basis for the micro site selection, business operation, medium and long-term planning and safety assurance of the wind energy exploitation resources around islands and reefs. In addition, they carried out a case study on key islands and reefs in the South China Sea and Gwadar Port, etc. In the future, this evaluation system for wind energy on islands and reefs can be referred to, to perform an advance study on the characteristics of wind energy on more key islands and reefs. Zheng (2020, 2021).
Wind energy exploitation and diseases
Shepherd et al. (2011) carried out a health-related quality of life (HRQOL) questionnaire survey on residents living near turbines and the results showed statistically significant differences in some HRQOL scores. Residents living within 2 kilometers of turbines reported lower overall quality of life, physical quality of life and environmental quality of life. Jabben et al. (2011) analyzed the impact of wind turbine noise, with an aim to assess the Dutch criteria for wind turbine noise, the impacts on humans and feasibility of attaining energy policy objectives. The authors used a combination of audible and low-frequency noise models and function to predict the level of interference experienced by residents living near wind turbines. It was found that serious disturbance caused by low-frequency noise was unlikely at 45 dB (Lden). It was suggested that the noise limit shall weigh a balance between the demand to prevent noise interference and the feasibility of attaining the national renewable energy targets. Nissenbaum et al. (2012) launched a questionnaire survey on the impact of fan noise on sleep and health. The purpose of his survey was to determine the relationship between the health status reported by residents in two rural communities and wind turbines. Participants living within 375–1,400 m and 3.3–6.6 km were surveyed and data on sleep quality, excessive daytime sleepiness and overall physical and mental health were obtained. The author reported that compared to people living at least 1.4 kilometers away from wind turbines, people living within 1.4 km of the wind turbine had poor sleep, weak daytime sleep and poor mental health score. Baxter et al. (2013) carried out a study to investigate the role of perceived health risk, economic benefits and community conflicts in wind turbine policies. Two communities were assessed: one was located near two wind farms that were under operation and the other didn’t have any turbine. The authors discovered that residents in the community with operable wind energy projects lent more support to wind turbines than residents in the community with turbines. Møller and Pedersen (2011) initiated a low-frequency noise study on 4 large turbines (>2 MW) and 44 other small and large turbines (7 turbines > 2 MW and 37 turbines <2 MW). Ten rooms were exposed to low-frequency noise, and their low-frequency sound insulation was measured under normal living conditions. The conclusion was that the spectrum of wind turbine noise moved down in frequency with increasing turbine size, suggesting that the low-frequency part of the spectrum played an important role in the noise at the neighbors. They hypothesized that if the noise from the investigated large turbines had an outdoor A-weighted sound pressure level of 44 dB (A), there was a risk that a substantial part of the residents would be annoyed by low-frequency noise even indoors
From the work of predecessors, it’s not hard to see that the wind energy exploitation will exert a certain impact on human health. Therefore, in the future evaluation of wind energy, especially during the site selection of wind energy, it is a must to fully consider the distributions of population and wind energy, in order to minimize the impact of wind energy exploitation on human health and strike a balance between wind energy exploitation and human health.
Footnotes
Declaration of conflicting interests
The author(s) declared no potential conflicts of interest with respect to the research, authorship, and/or publication of this article.
Funding
The author(s) disclosed receipt of the following financial support for the research, authorship, and/or publication of this article: The authors would like to acknowledge the open fund project of Shandong Provincial Key Laboratory of Ocean Engineering, Ocean University of China (kloe201901). This work was supported by the National key R&D Program of China (Technology and application of wind power/photovoltaic power prediction for promoting renewable energy consumption, 2018YFB0904200) and eponymous Complement S&T Program of State Grid Corporation of China (SGLNDKOOKJJS1800266). This work was supported by the Major International (Regional) Joint Research Project of National Science Foundation of China (No. 41520104008). This work was supported by Naval equipment military scientific research funding project (DJYJNKY-2019-021).