
Abstract
Pores associated with organic matter are well known to play a significant role in shale gas capacities. However, an extremely high heterogeneity of organic pores often impacts our evaluation of reservoir quality. In this work, we analyze the formation mechanisms of the heterogeneity based on positioning observation method using a combination of field emission scanning electron microscopy and optical microscopy. These analyses were conducted on six lacustrine shale samples at the gas window in the Lower Cretaceous Shahezi shale, which is located in the Changling Fault Depression of Songliao Basin. The results reveal that organic pore heterogeneity is mainly attributed to four controlling factors. (a) One is different hydrocarbon generation potentials among different macerals. The degree of pore development from high to low is solid bitumen, vitrinite, and inertinite. The content of carbon by the weight percentage of solid bitumen, vitrinite, and inertinite is in the opposite order, which reflects that the different hydrocarbon generation potential of each maceral is the dominant factor. (b) Another one is the remnants of primary pores in organic matter with plant cell structures. Well preserved telinite, fusinite, and semi-fusinite show cell structures, and the cells that are not completely compressed or not fully filled retain the original residual pores. (c) The third one is evolutional differences of individual solid bitumen. Not all solid bitumen developed organic pores, which is mainly attributed to the difference of solid bitumen reflectance in different solid bitumen particles. The solid bitumen reflectance of porous solid bitumen is mostly distributed between 1.6% and 2.0%, in which oil cracking to gas is dominant and porous residual solid bitumen subsequently forms. The solid bitumen reflectance of non-porous solid bitumen peaks in 1.2–1.6%, which is in the stage of kerogen transformation and oil generation with rare pore development. (d) The last one is the catalysis of clay minerals. All organoclay complexes develop abundant sponge-like pores due to catalysis during the transformation from smectite to illite. A high content of illite in the mixed layers I/S increases the specific catalytic activities, promoting the organic matter and solid bitumen to further generate hydrocarbon and form pores. Most organic–inorganic mixtures develop pores also because of catalysis from inorganic minerals.
Introduction
The success of shale gas exploration and development in the United States has dramatically changed the role of fine-grained rocks, such as shale, from source rocks for conventional oil and gas reservoirs to primary (unconventional) hydrocarbon resources (Curtis, 2002; Tissot and Welte, 1984; Zou et al., 2015). As a hydrocarbon-bearing formation, the gas reserves mainly depend on the shale gas storage capacity, which is determined by the pore system (Loucks et al., 2009, 2012; Milliken et al., 2013; Ross and Bustin, 2009). Over the past decades, researchers have attempted to characterize shales through observational techniques and invasion methods with respect to properties of pores, such as pore type, pore shape, average pore diameter (APD), pore size distribution (PSD), pore abundance, pore volume (PV), and pore specific surface area (SSA) (Chen et al., 2017; Gao et al., 2019; Jiang et al., 2016; Klaver et al., 2012, 2015; Loucks et al., 2009, 2012; Ma et al., 2015; Milliken et al., 2013; Xiong et al., 2017, 2020).
Pores in shales can be divided into interparticle mineral, intraparticle mineral, and organic matter (OM) pores in terms of pore occurrences in different matrices (Loucks et al., 2012). Among these pores, OM-hosted pores are widely recognized as a significant contributor to gas storage and transport (Ambrose et al., 2012; Chalmers and Bustin, 2007; Chen et al., 2017; Ji et al., 2015; Milliken et al., 2013; Sun et al., 2016; Xiong et al., 2016). However, the significant heterogeneity in OM-hosted pores, one of the biggest challenges to characterize, often hinders our accurate evaluation of reservoir quality: one of two adjacent OM particles may contain numerous pores while the other developed no pores (Curtis et al., 2012; Gao et al., 2018; Song et al., 2020; Guo et al., 2018). This phenomenon has been generally thought to be relevant to OM types—macerals (Curtis et al., 2012; Fishman et al., 2012; Gao et al., 2018; Liu et al., 2017; Mastalerz et al., 2018). Investigators often tend to attribute OM with no pores to woody materials (Guo et al., 2018; Hackley et al., 2017; Liu et al., 2017; Loucks et al., 2012; Milliken et al., 2013), while associating the porous OM to solid bitumen (SB) in the scanning electron microscopy (SEM)-visible range. However, the heterogeneity of OM-hosted pores is typically complicated. A few studies have clearly demonstrated the pore development characteristics of each OM type.
In general, all OM in shale can be classified into primary sedimentary OM (i.e. kerogen) (Hunt, 1996; Tissot and Welte, 1984) and secondary OM, such as oil and SB (Jacob, 1985; Jarvie et al., 2007). The former deposits with sediments and the latter evolved later from the primary sedimentary OM. The OM of shale in lacustrine environments mainly originates from nearshore woody plants and phytoplankton in central lakes. The OM is rich in various macerals, and the heterogeneity of the OM pores is extremely high. To understand the effects of different types of OM on pore development, this work takes the Shahezi shale in the Changling Fault Depression as an example to mainly emphasize the role of various kinds of OM present in shale. The specific objectives of this work are a systematic identification of all types of organic macerals and the observation of pore development associated with each maceral jointly using field emission SEM (FE-SEM) and optical microscopy.
Geological setting and samples
The Changling Fault Depression that located toward the south of the Central Depression Zone is the largest secondary structural unit with an area of 1.3 × 10⁴ km2 in the Songliao Basin (Figure 1(a)). Consistent with the basin tectonic movements, the Changling Fault Depression experienced three distinct stages of evolution: rifting, subsidence, and tectonic reversal (Cai et al., 2017; Wei et al., 2010). The rifting stage can be further divided into three distinct segments: initial, maximum, and late rifting, which correspond to the sedimentary deposition of the Huoshiling Formation (J3h), Shahezi Formation (K1sh), and Yingcheng Formation (K1yc), respectively (Zhang et al., 2010) (Figure 1(b)). Considering differences in intensity of faulting, the Changling Fault Depression can be divided into seven secondary half-graben depressions: Qian’an sag, Qianshenzi sag, Heidimiao sag, Changling sag, Longfengshan sag, Zhaganhua sag, and Fulongquan sag. During the Shahezi stage, the depression continued to expand, and the sedimentary environment became a braided delta–lake–subaqueous fan system (Cai et al., 2017; Wang et al., 2016). The lake deposit is dominated by a thick set of dark shales with thin interbedded sandstone layers.
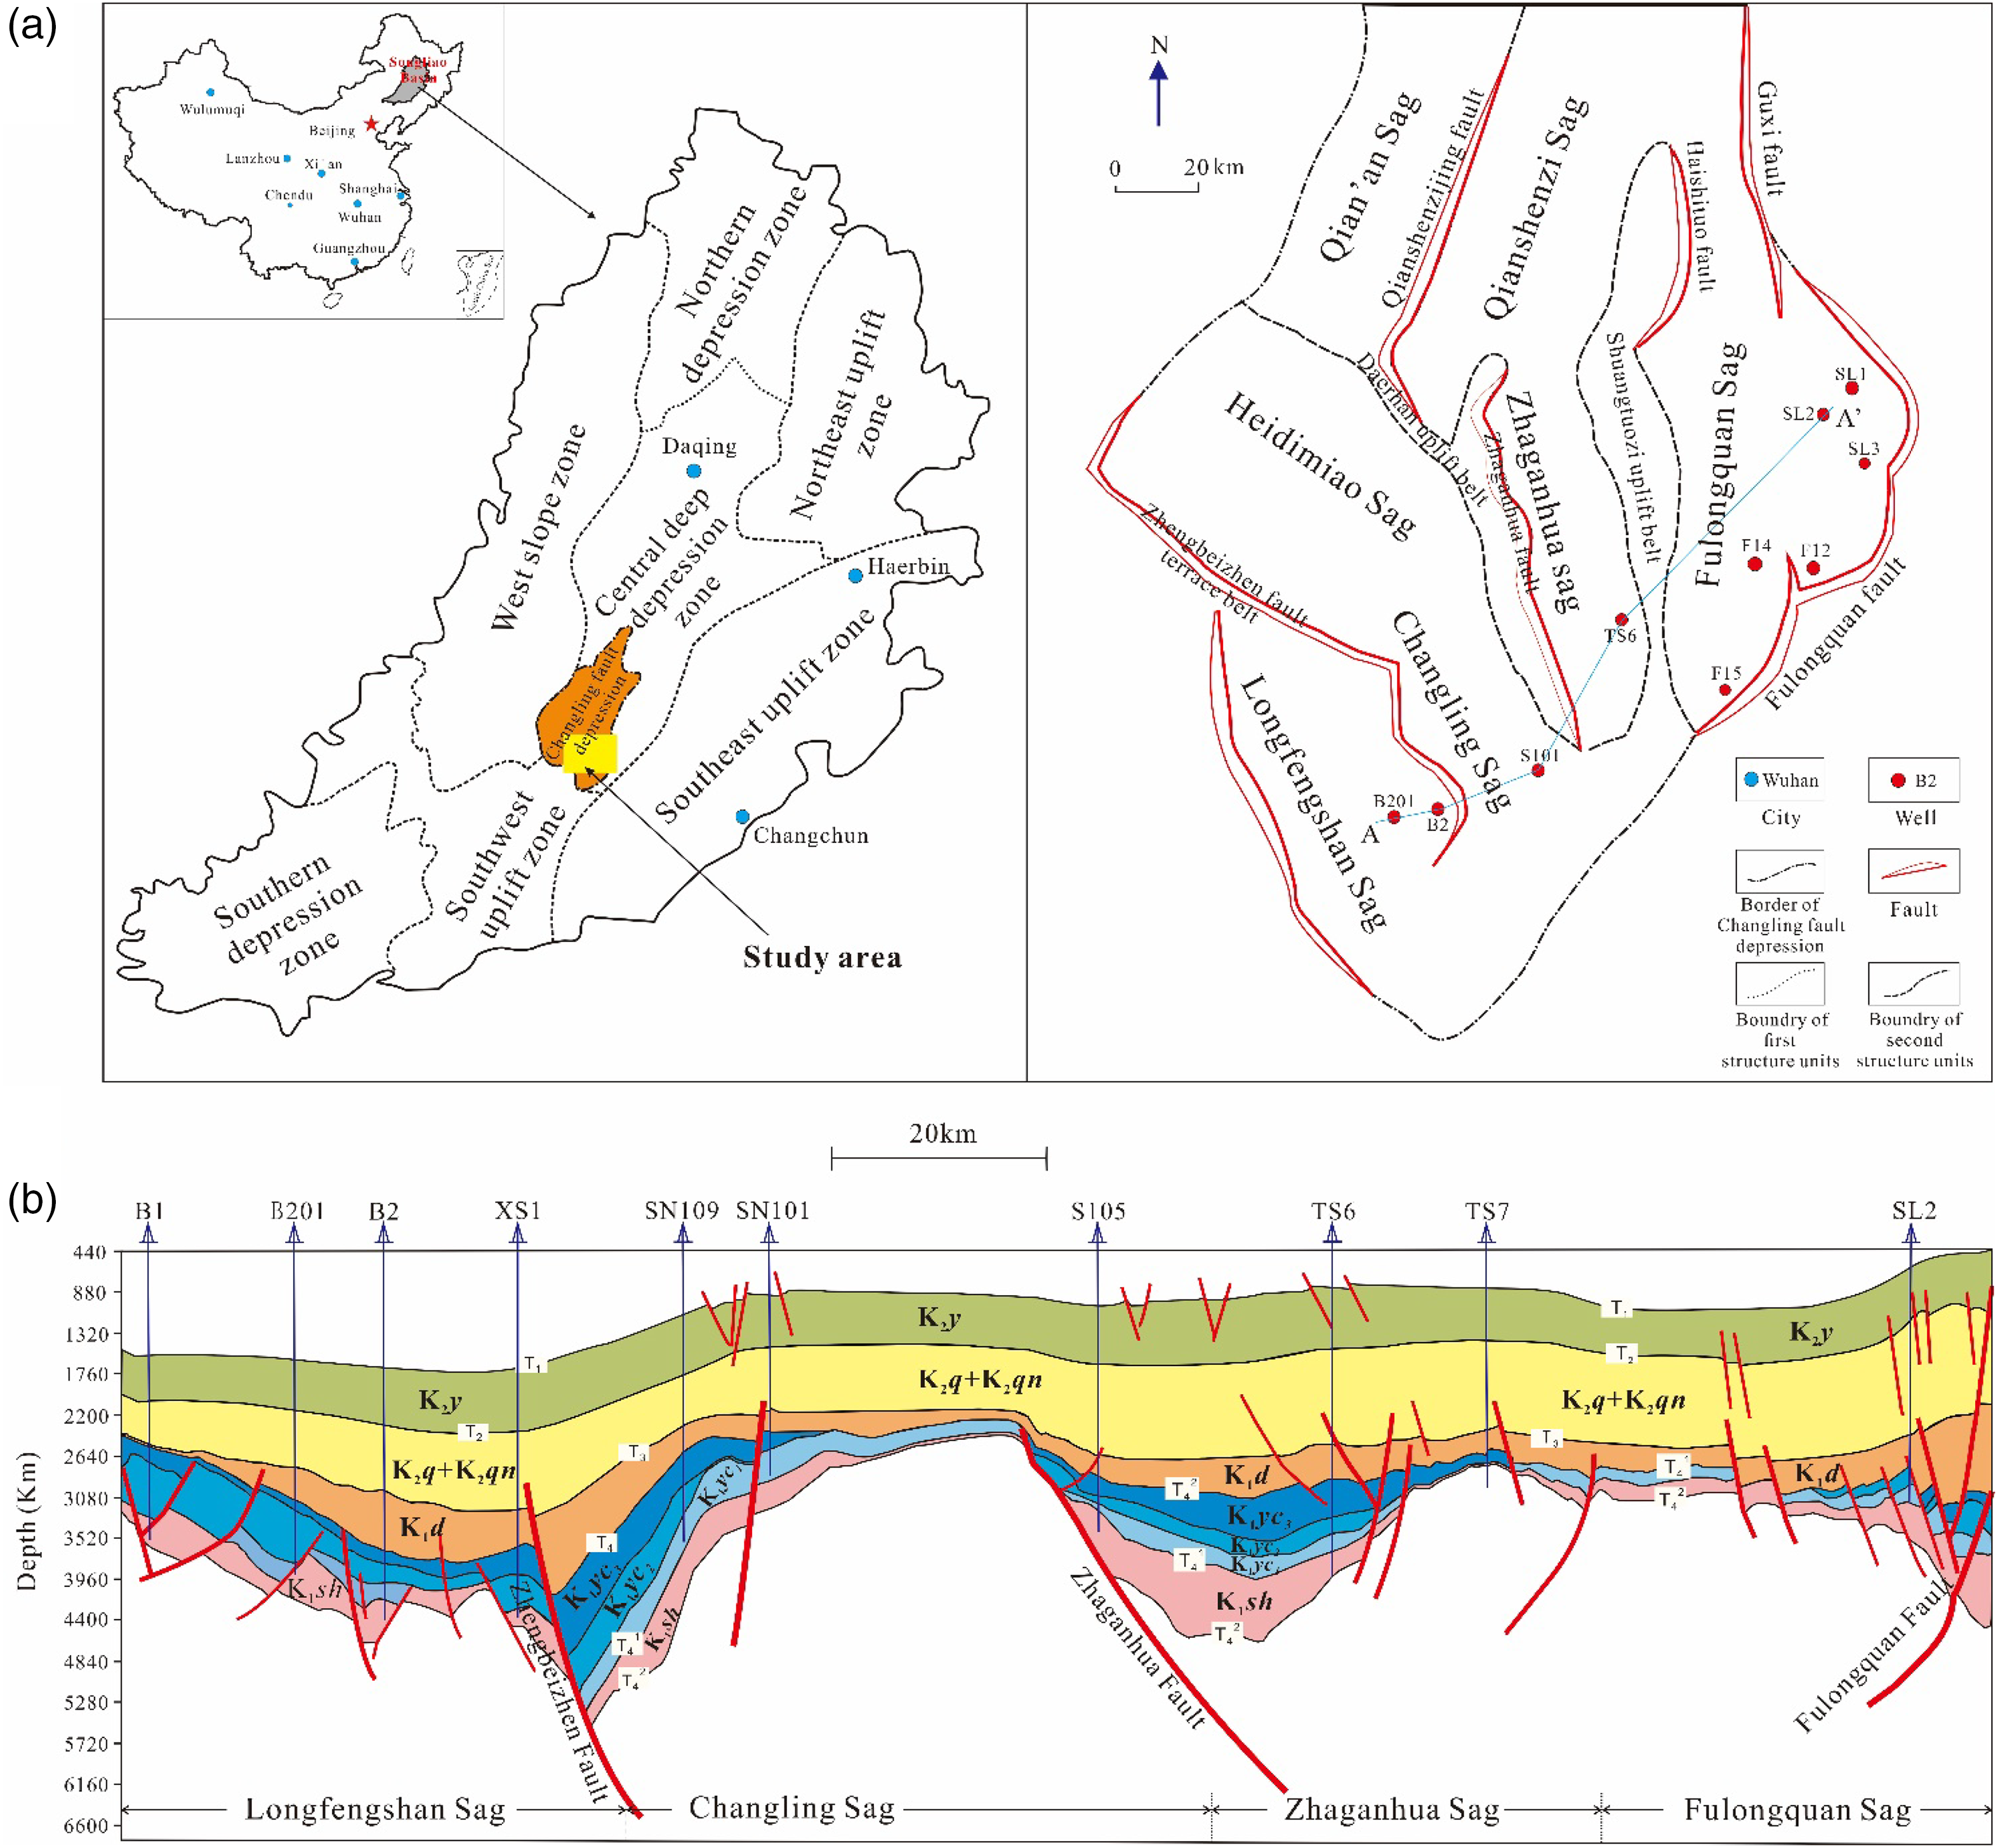
Geologic map of the Changling Fault Depression, Songliao Basin, Northeast China. (a) Location of the study area and the tectonic units of the Changling Fault Depression and (b) geological profile along line AA′ (see AA′ for the location of the cross section in A).
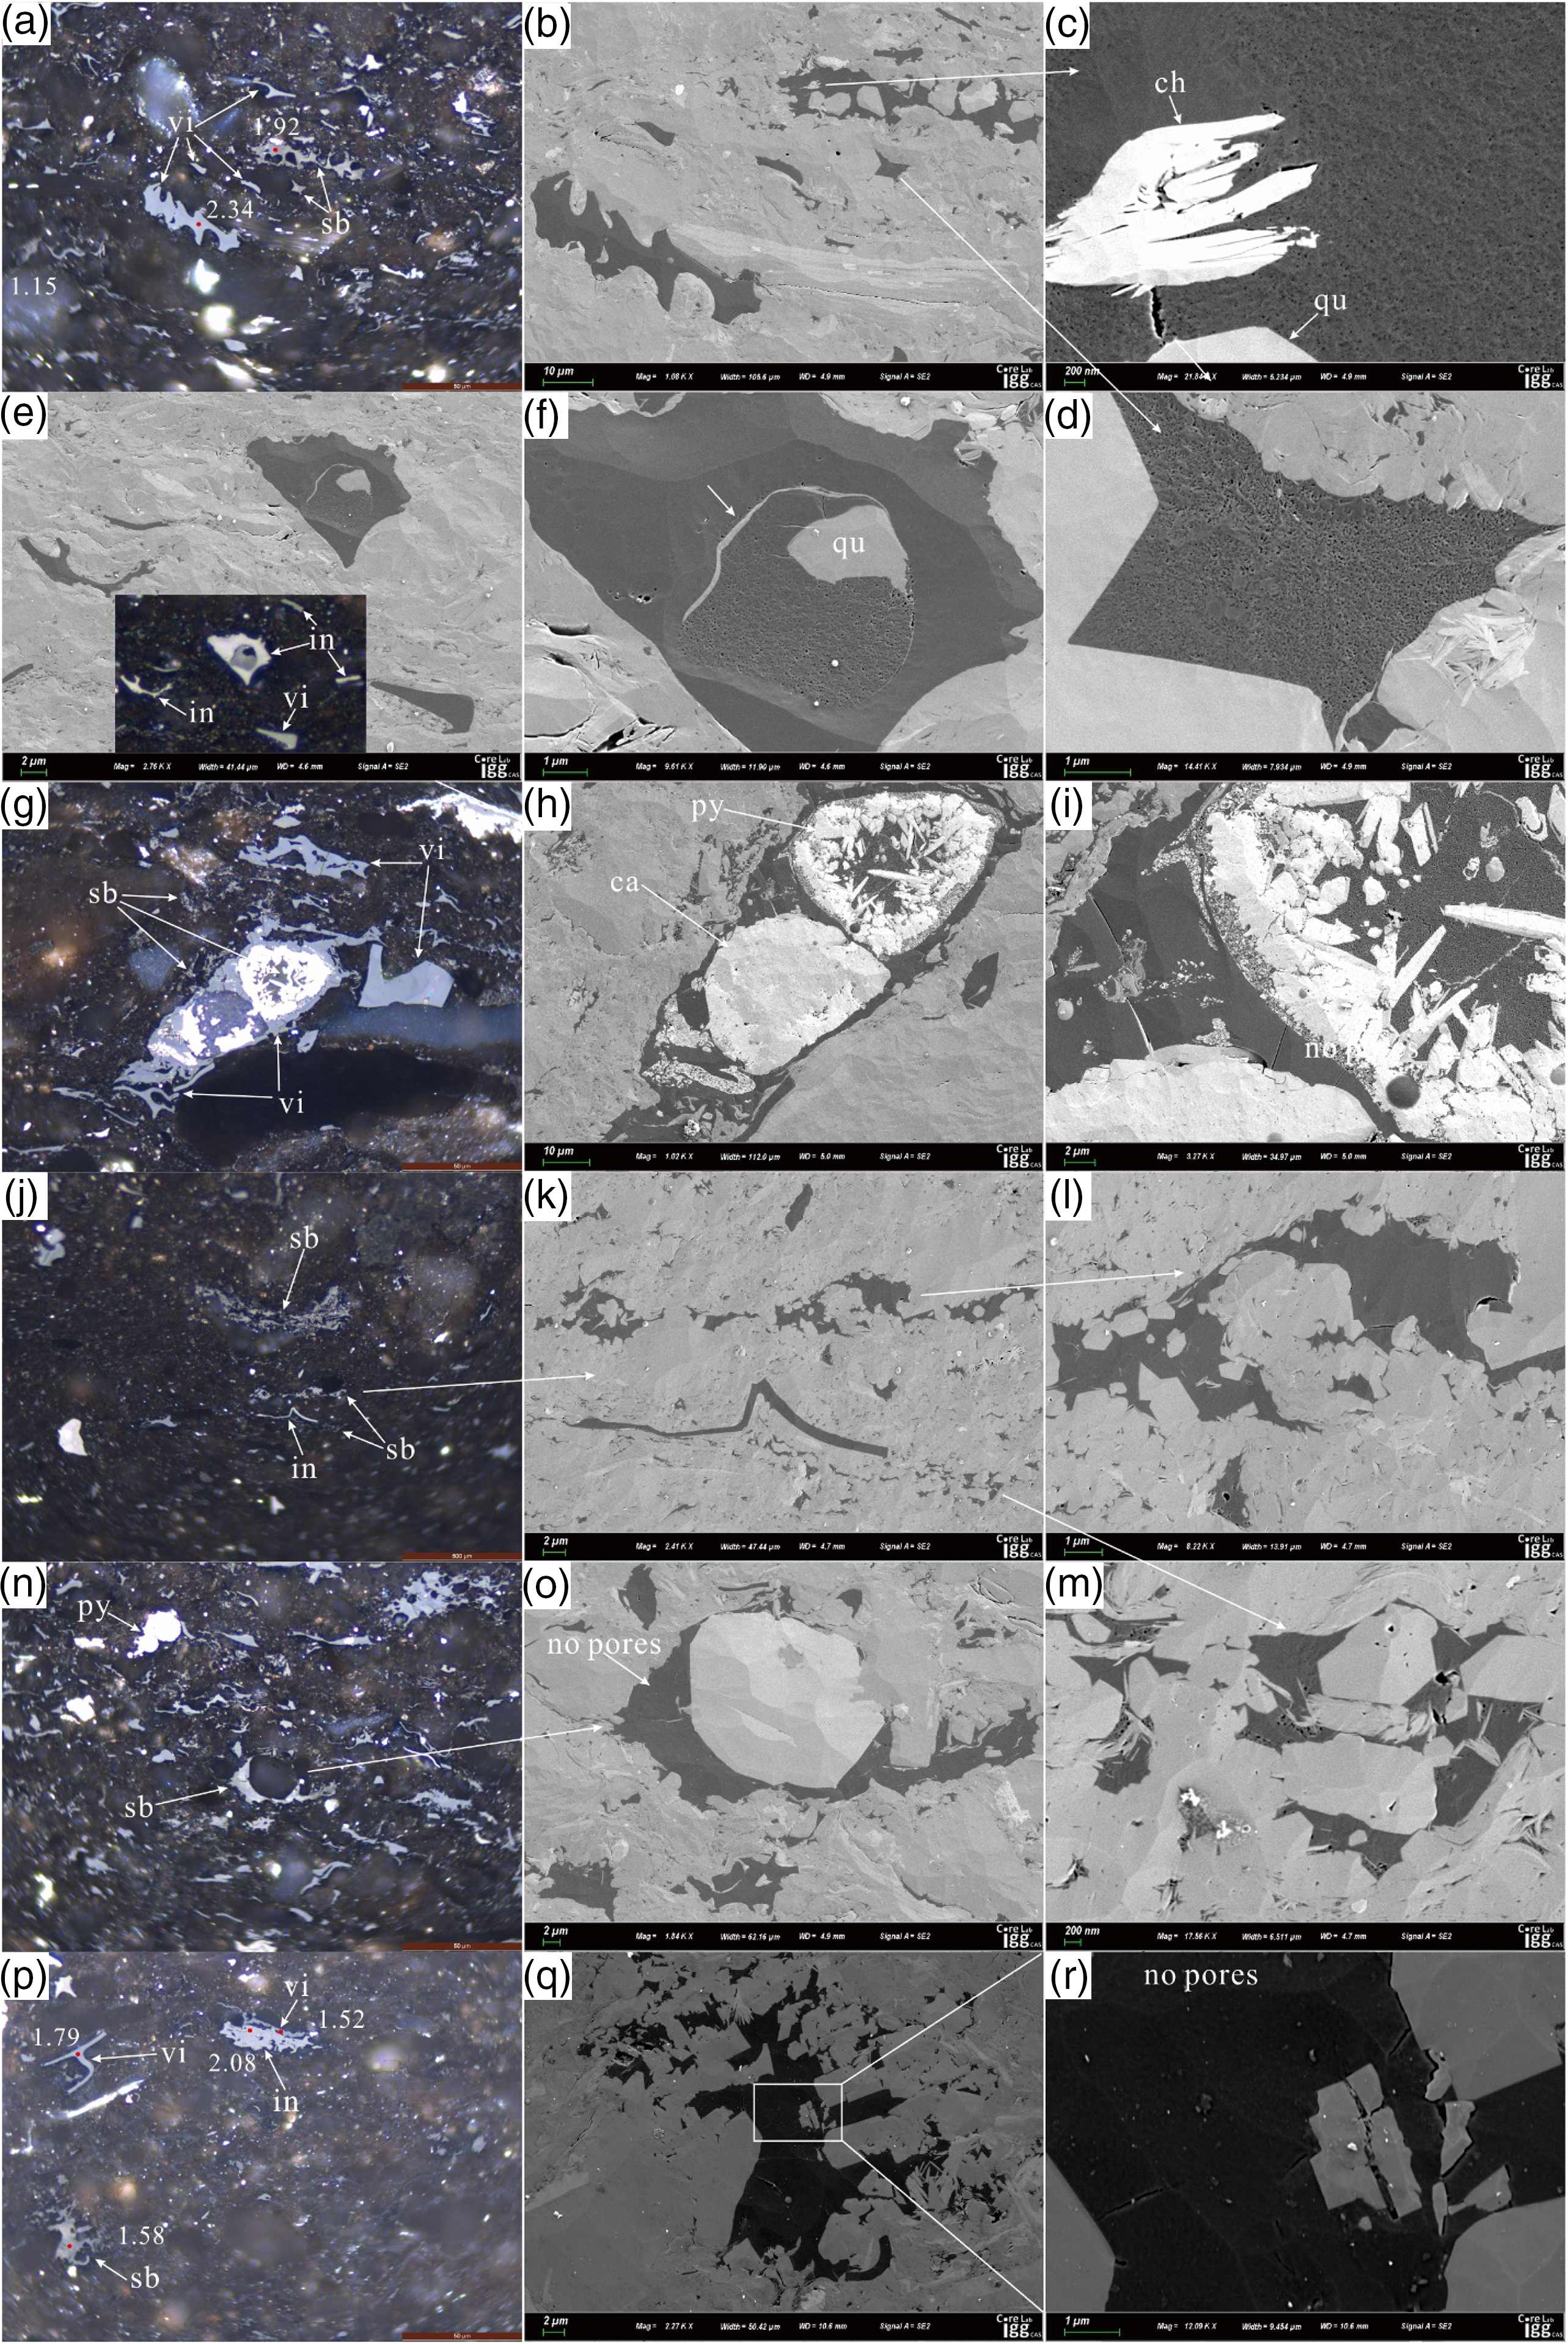
For this study, a total of six core samples of the Lower Cretaceous Shahezi Formation were used to investigate the organic pore heterogeneity of lacustrine shale. They were collected from wells B2, SL2, and S103 (Figure 1). The lithology of the samples is mainly gray, dark gray, and black shale. The depth of these cores ranges from 2663.7 m to 3942.1 m. All six samples were subjected to geochemical and petrologic analysis. The total organic carbon (TOC) content ranges from 0.9 wt.% to 3.6 wt.%. The Ro ranges from 1.44% to 2.4%, indicative of a high- to over-mature stage. The minerals mainly comprise of clay minerals (31.1–69.4%, averaging 53.5%) and quartz (6.9–56.9%, averaging 35.0%). The detailed geochemical and petrological characteristics were reported in Table 1 in Gao et al. (2018).
Maceral composition of six shale samples.
OM: organic matter.
Experiments and methods
FE-SEM analysis
FE-SEM observations were conducted at the Micro-nanostructure Imaging Laboratory in the Institute of Geology and Geophysics, Chinese Academy of Sciences. For the purpose of fixed location observation, it is important to note that during the observation, the relative positions of all observed OM particles under FE-SEM should be labeled and located so that they can be easily found under optical microscopy. The specific method is to select a characteristic OM as the starting marker and then observe in a specific direction from the OM. In this way, the characteristic OM and other OM particles can be all tracked following the marked direction using FE-SEM and optical microscopy. In addition, we perform an energy spectrum analysis on OM to facilitate subsequent compositional analysis during FE-SEM observation.
Optical microscope analysis
The optical microscopy observation with reflected light and oil immersion aims to: (a) determine vitrinite reflectance (VRo) and SB reflectance (SBRo), (b) determine the statistics of organic petrographic composition, and (c) identify each OM maceral. The samples that were used to measure Ro and quantify maceral composition were crushed and then prepared as whole-rock slice. The detailed procedure of Ro measurement and maceral identification was summarized in Taylor et al. (1998). The samples that used to determine the type of OM were the same blocks used in the FE-SEM imaging. Only in this way, the OM that was marked using FE-SEM can be found and identified under reflected light and oil immersion. The classification of organic maceral is based on Cheng et al. (1989). During the imaging with optical microscopy, the point of interest selected in the first large view via FE-SEM is located to ensure the same field of view. Subsequent observations followed the same direction as that through FE-SEM.
Results
Maceral compositions and characteristics
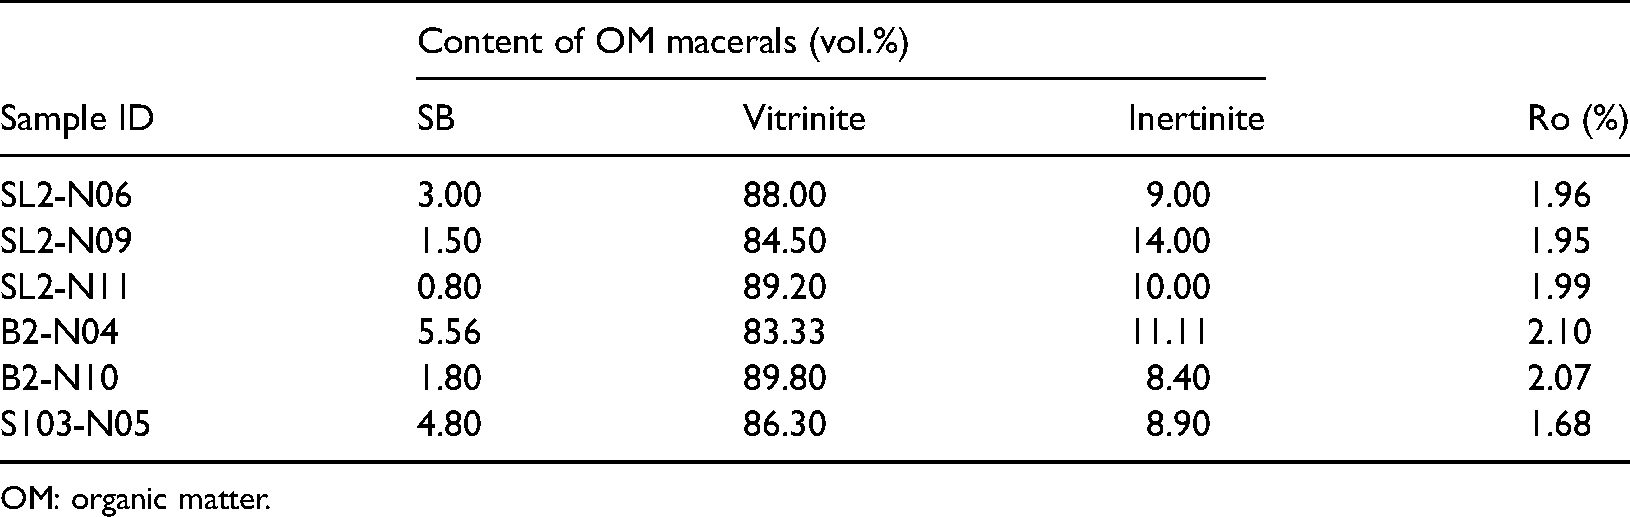
The maceral composition of the samples is listed in Table 1. The OM particles of samples are mainly vitrinite, inertinite, and SB. The content of SB is generally low, ranging between 0.80 vol.% and 5.56 vol.% of OM (Table 1). Compared with primary macerals, the most remarkable feature of secondary SB is the lack of a specific shape, usually determined by space infilling (Cardott et al., 2015; Guo et al., 2018; Hackley and Cardott, 2016; Mastalerz et al., 2018). Under oil-immersion reflected light, the color of SB varies from gray to dark gray (Figure 2(c) and (d), 3, and 4). The SB does not show fluorescence under blue fluorescent light (Figure 2(c) and (d)). Sometimes the optically homogeneous SB is easy to confuse with vitrinite by only considering the color (Figures 3(a) and 6(f)). However, SB could be further differentiated by its low relief and irregular shape.
Photomicrographs of macerals in (a), (c), and (e) oil-immersion reflected light and (b), (d), and (f) blue fluorescent light: . (a) and (b) SL2-N06: telinite with cellular structure, vitrodetrinite; (c) and (d) S103-N05: fusinite with cellular structure, vitrodetrinite, and filled SB; (e) and (f) S103-N05: perhydrous vitrinite with light brown fluorescence, flaky SB, vitrodetrinite, and inertodetrinite.
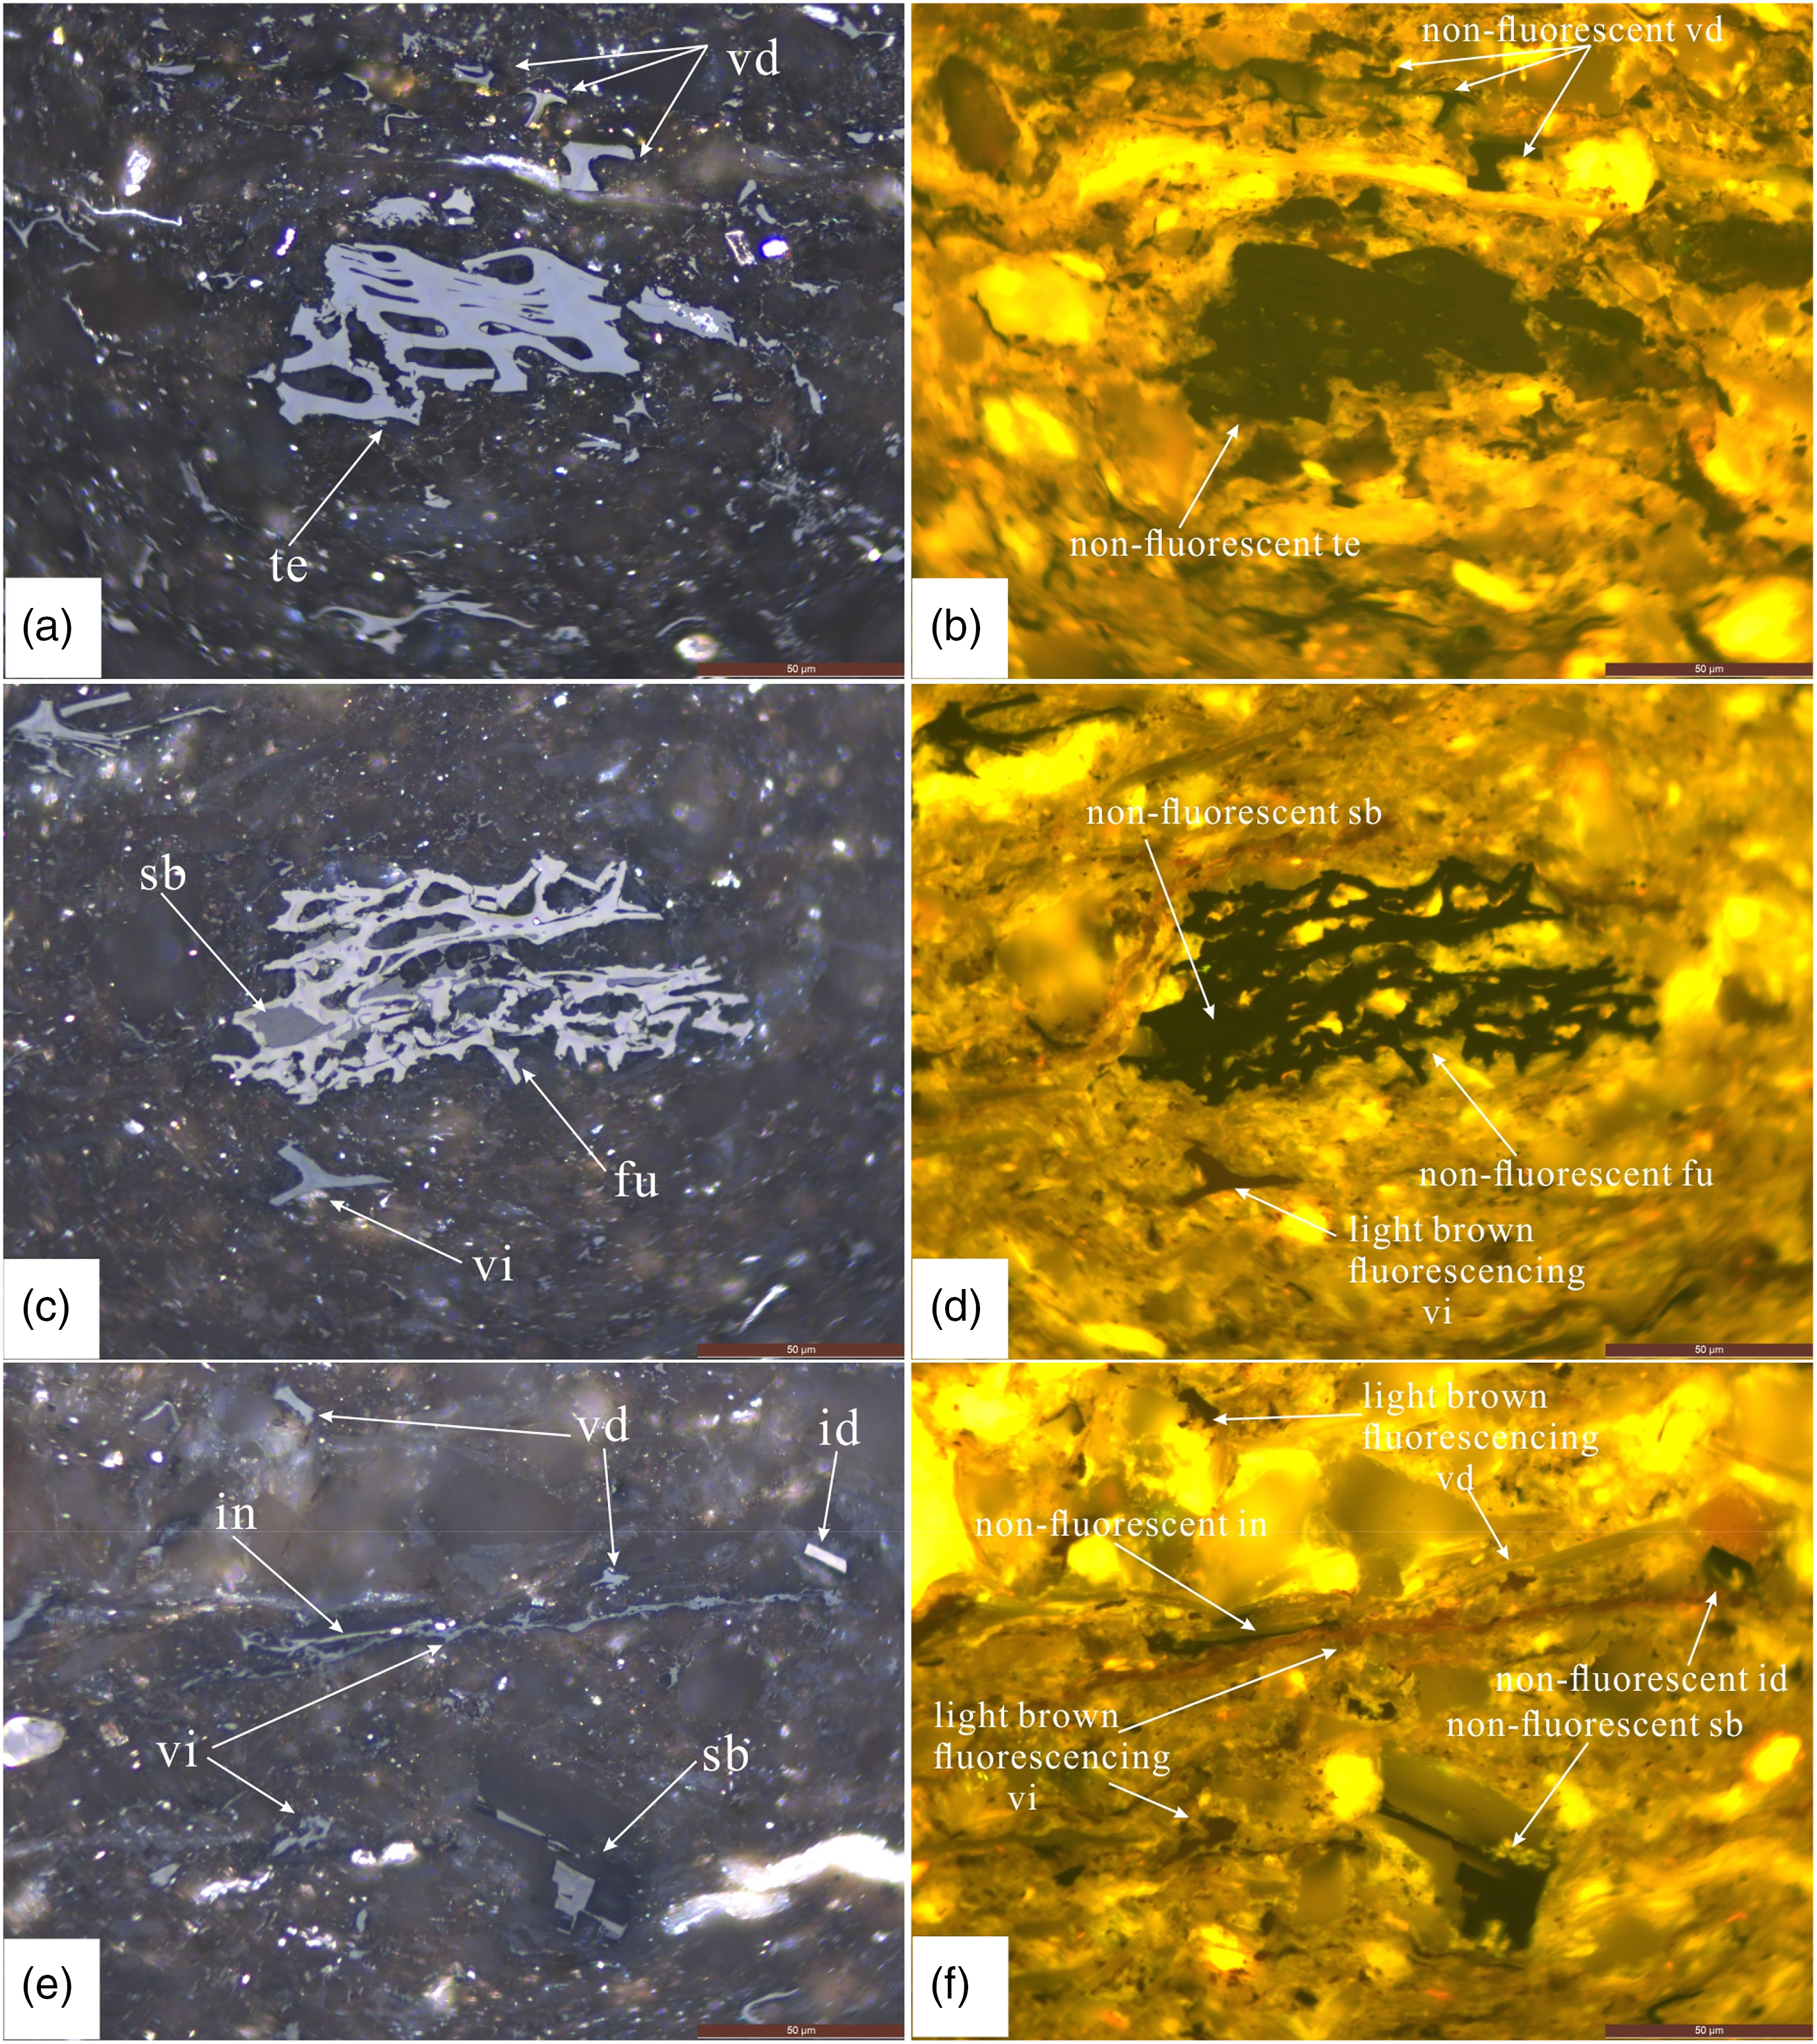
Photomicrographs of pore development in SB from FE-SEM images combined with: (b)–(f), (h), (i), (k)–(m), (o), (q), and (r) reflected light and (a), (g), (j), (n), and (p) oil immersion. (a)–(d) SL-N06: the differences of pore development between vitrinite and SB; (e) and (f) SL-N11: porous SB filled in the nonporous arched inertinite; (g)–(i) B2-N04: two cells of nonporous telinite are filled by porous SB and calcite, respectively; (j)–(m) B2-N10: different pore developments of solid bitumen; (n) and (o) SL2-N06: no pores developed in SB around quartz grains; (p)–(r) S103-N05: no pores found in SB embedded in minerals. ca: calcite; ch: chlorite; FE-SEM: field emission scanning electron microscopy; py: pyrite; qu: quartz; SB: solid bitumen.
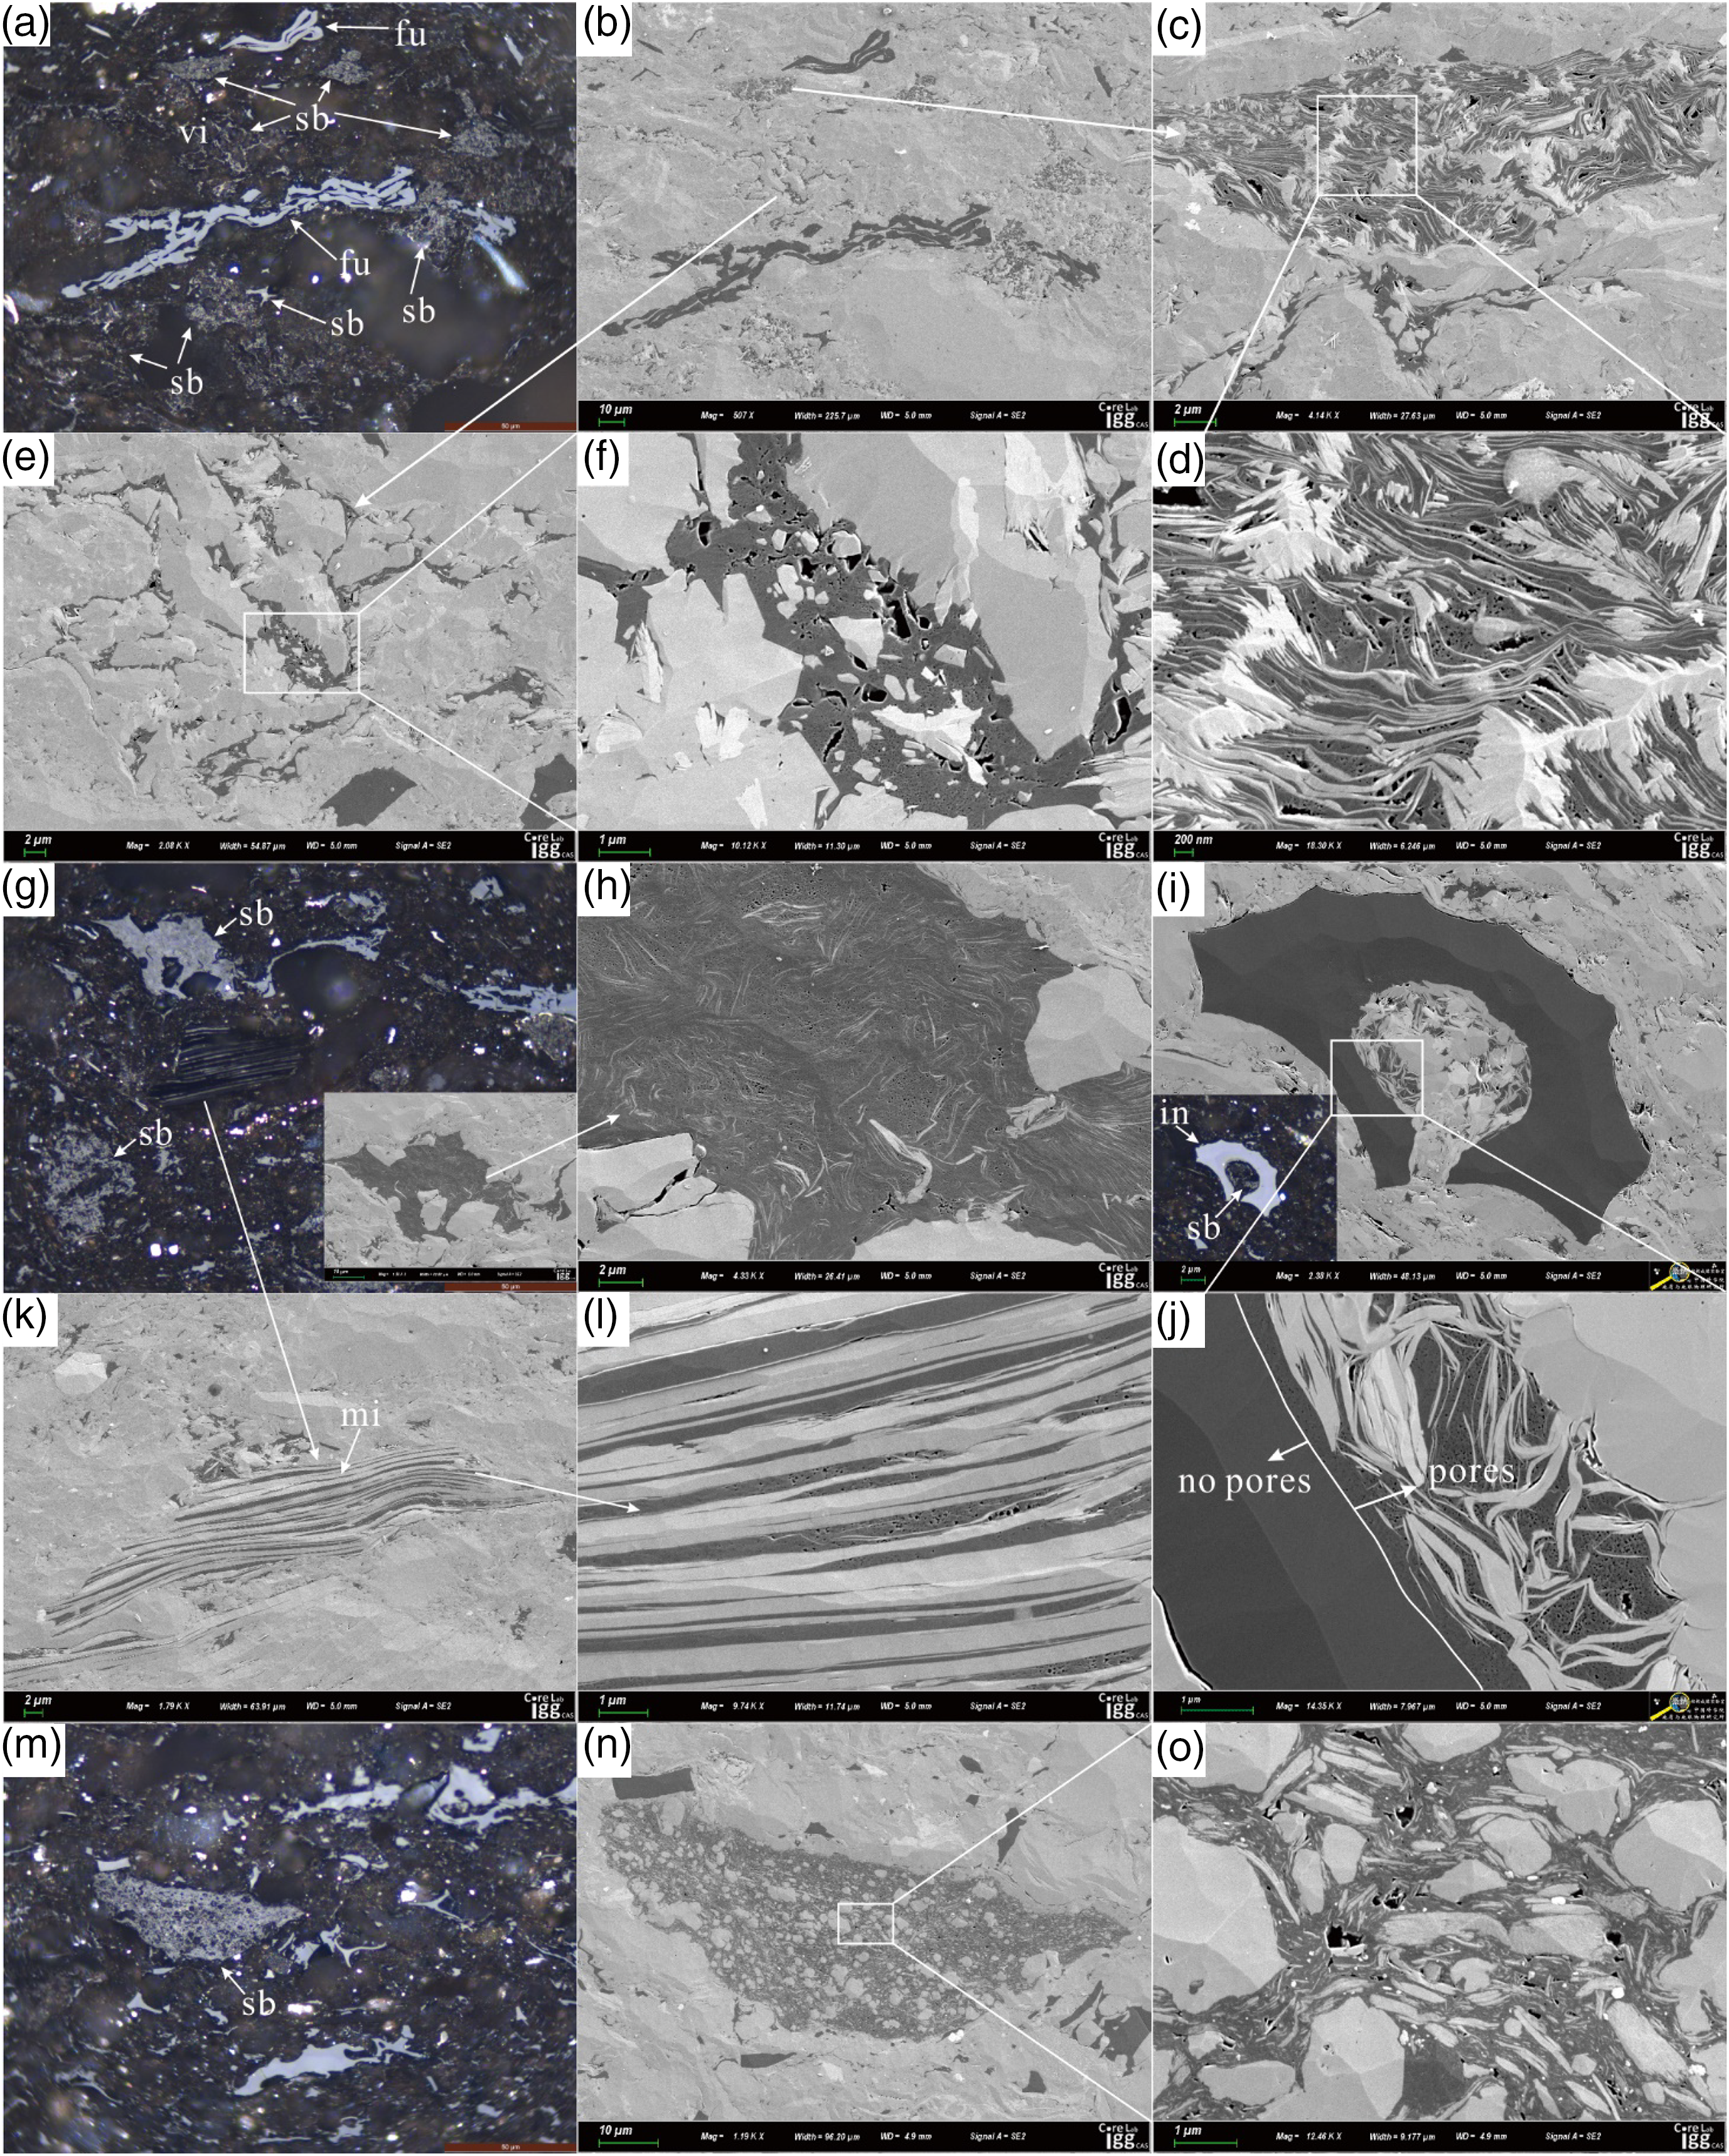
Photomicrographs of pore development in organic–clay complex observed from FE-SEM images combined with: (b)–(f), (h), (i), (k), (l), (n), and (o) reflected light and (a), (g), and (m) oil immersion . (a)–(f) B2-N04: organic pores developed in organic–clay (chlorite, illite) complex; (g) and (h) B2-N04: organic pores developed in organic–clay (illite) complex; (i) and (j) B2-N04: SB filled in the arched inertinite forming an organic–clay complex with illite; (k) and (l) B2-N04: organic–clay complex forming by filling SB in the interlayers between mica sheets; (m)–(o) SL2-N11: an organic–clay complex formed by OM, illite, and chlorite.
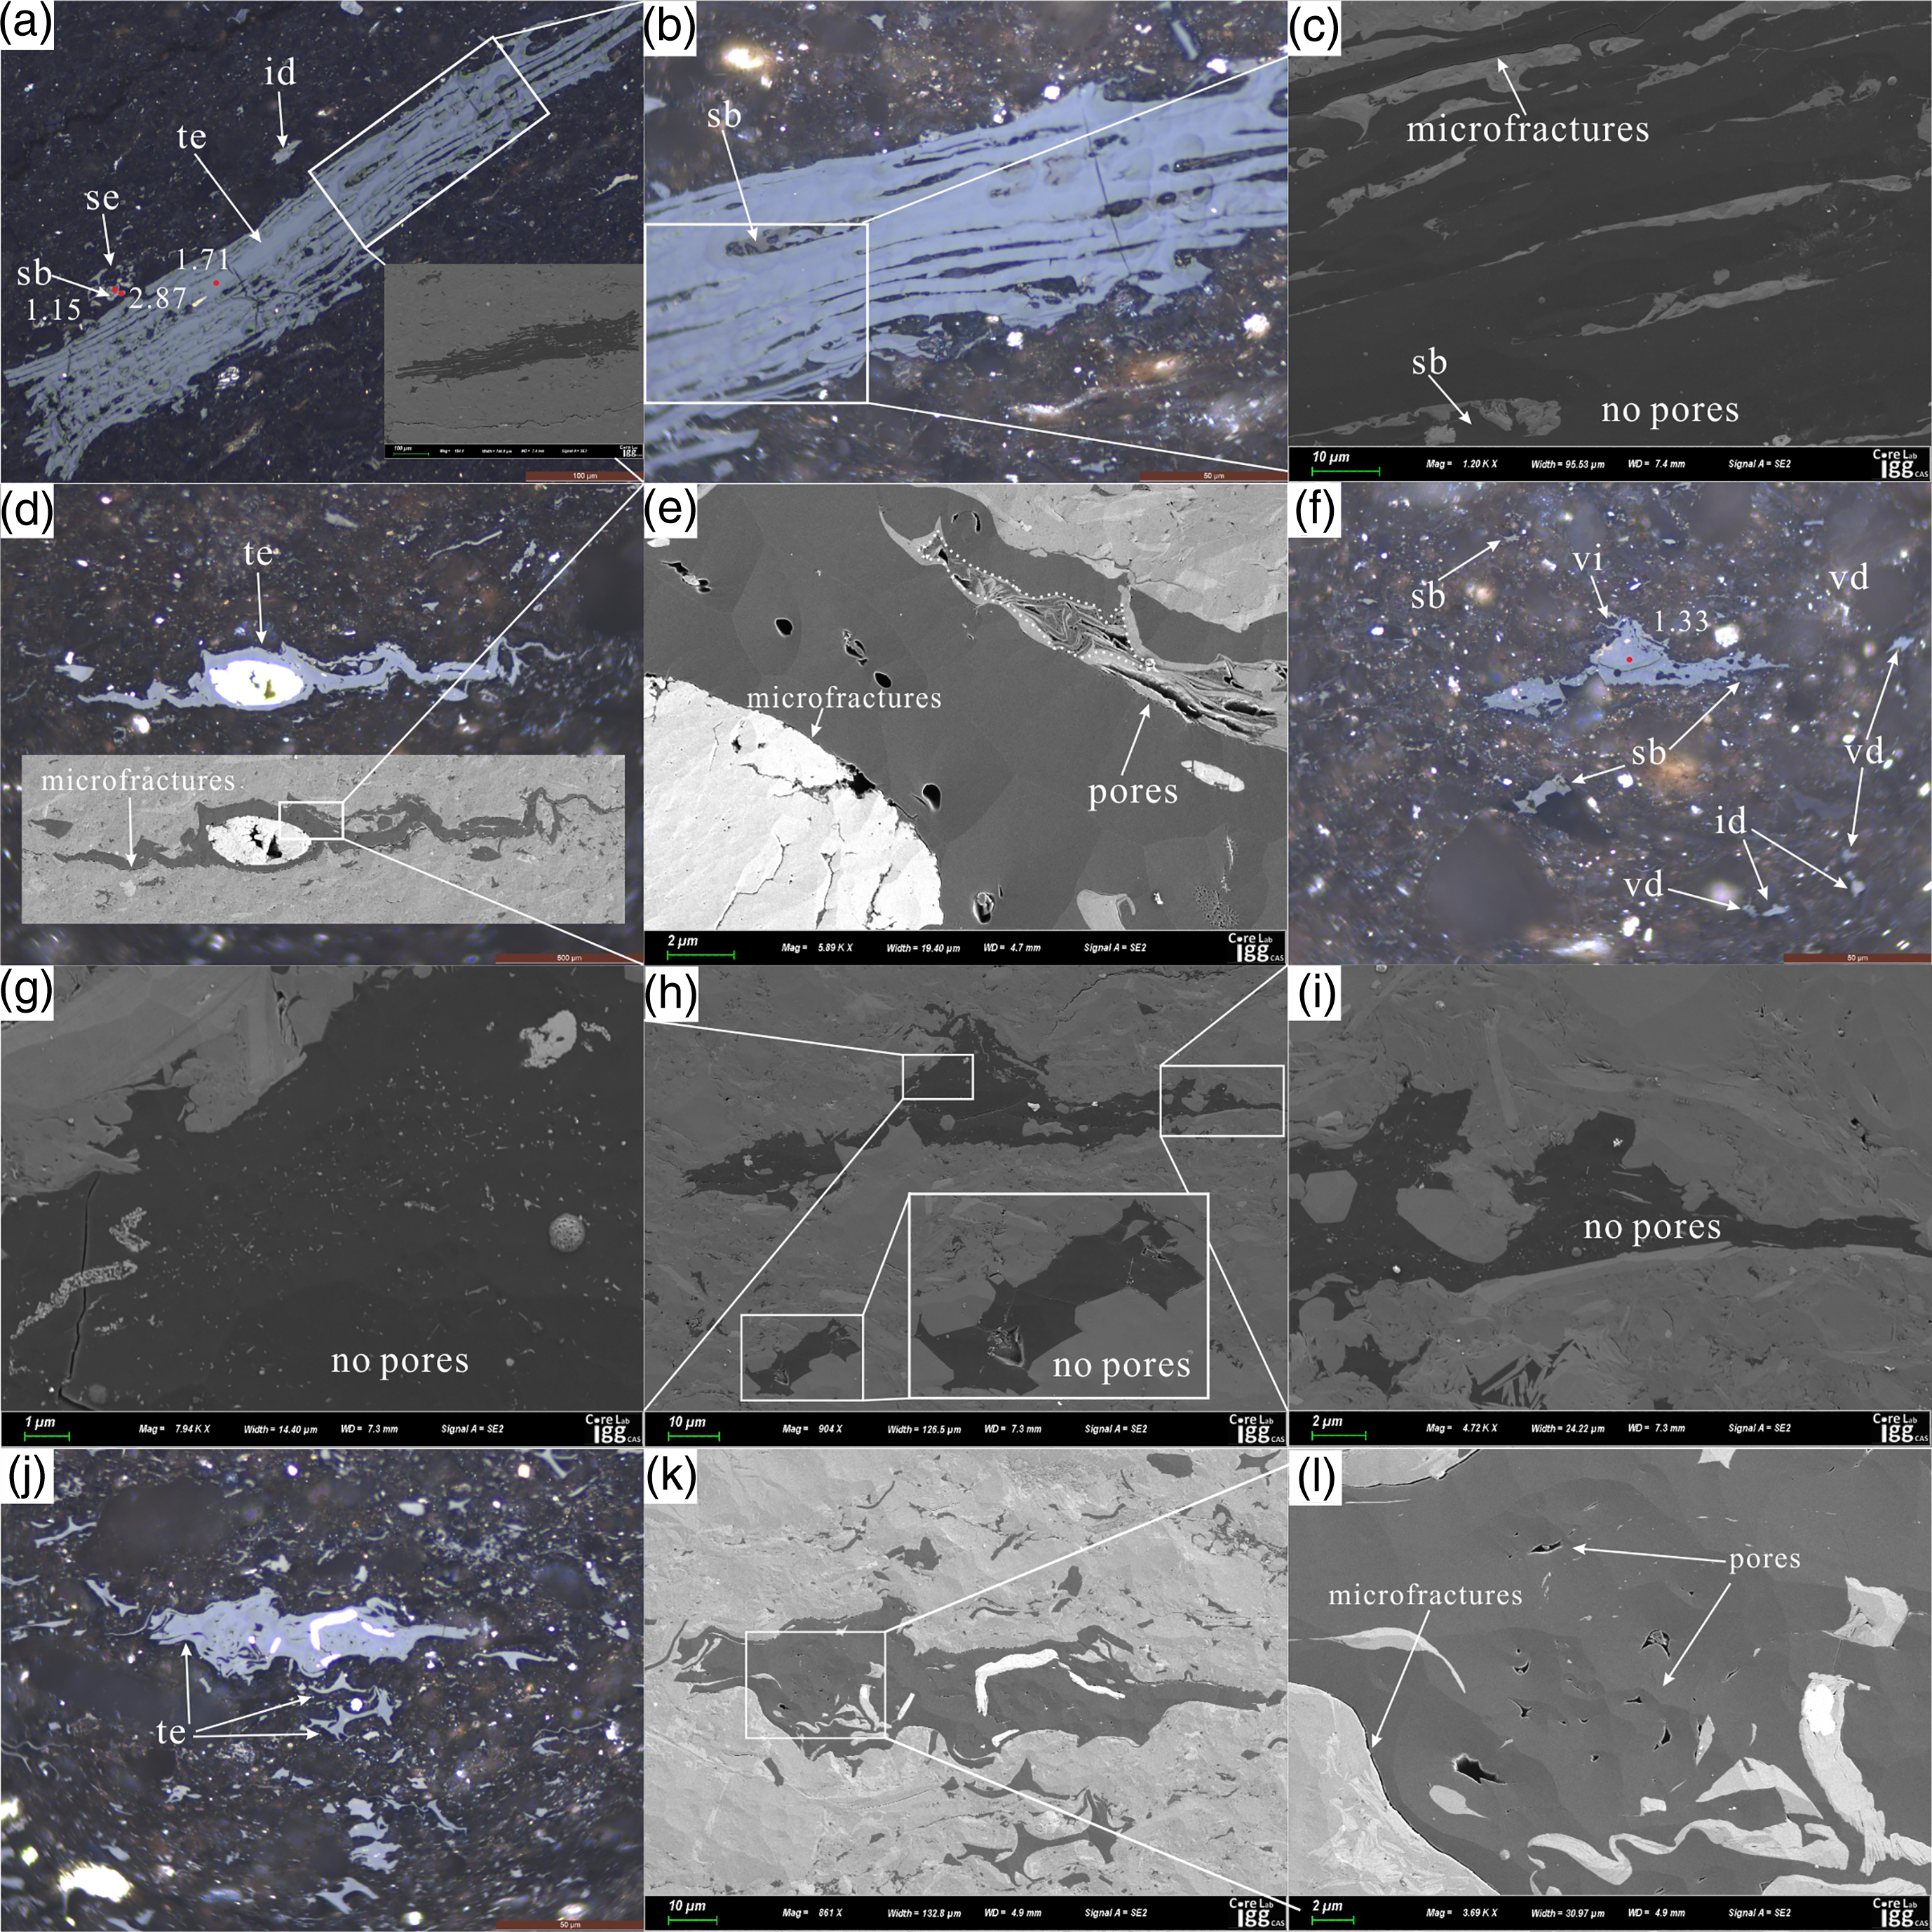
Photomicrographs of pore development in vitrinite observed from FE-SEM images combined with: (c), (e), (g)–(i), (k), and (l) reflected light and (a), (b), (d), (f), and (j) oil immersion. (a)–(c) S103-N05: telinite with no pore; (d) and (e) B2-N10: circular and elliptical pores developed along the ring of OM; (f)–(i) S103-N05: collotelinite with no pores; (j)–(l) SL2-N06: remaining pores due to the cell wall of telinite overlap together.
Vitrinite is the most common OM particle in the samples, with the content in the range of 83.33–89.80 vol.% (Table 1). Normal and perhydrous vitrinite particles coexist and show non-fluorescent and light-dark brown in blue fluorescent light, respectively. The color of vitrinite in oil-immersion reflected light ranges from light to dark gray (Figures 2(b), (d), (f) and 6(a)). Vitrinite typically possesses a particular texture and shape such as particles and fragments with straight edges or subtle curvature (Guo et al., 2018; Jiang et al., 2015; Lu et al., 2015; Milliken et al., 2013) (Figures 2(a), (c), (e) and 6(a), (b), (d), (m)). The vitrinite includes telinite, collotelinite, and vitrodetrinite. Telinite has a well-preserved cellular structure, which is similar to a lattice network (Figures 2(a) and 6(a), (d)), while collotelinite appears as a homogeneous vitrinite with a few cracks (Figure 6(f) and (h)). Vitrodetrinite occurs as small vitrinite pieces and fragments with various shapes (Figures 2(a), (e), and 6(j)). The relief of vitrinite is high, which is an important characteristic to differentiate homogeneous SB from homogenous vitrinite.
We also observed inertinite, whose amount ranges between 8.40 vol.% and 14.00 vol.% (Table 1). The color appearance of inertinite varies from light white to yellowish white in oil-immersion reflected light, and in blue fluorescent light, the inertinite is non-fluorescent (Figure 2). Similar to vitrinite, inertinite also retains woody plant tissues and original particle shapes (Figures 2(a) and 7). Inertinite in the samples is mainly comprised of fusinite, inertodetrinite, and a small amount of semifusinite and funginite. The relief of inertinite is the highest among all macerals.
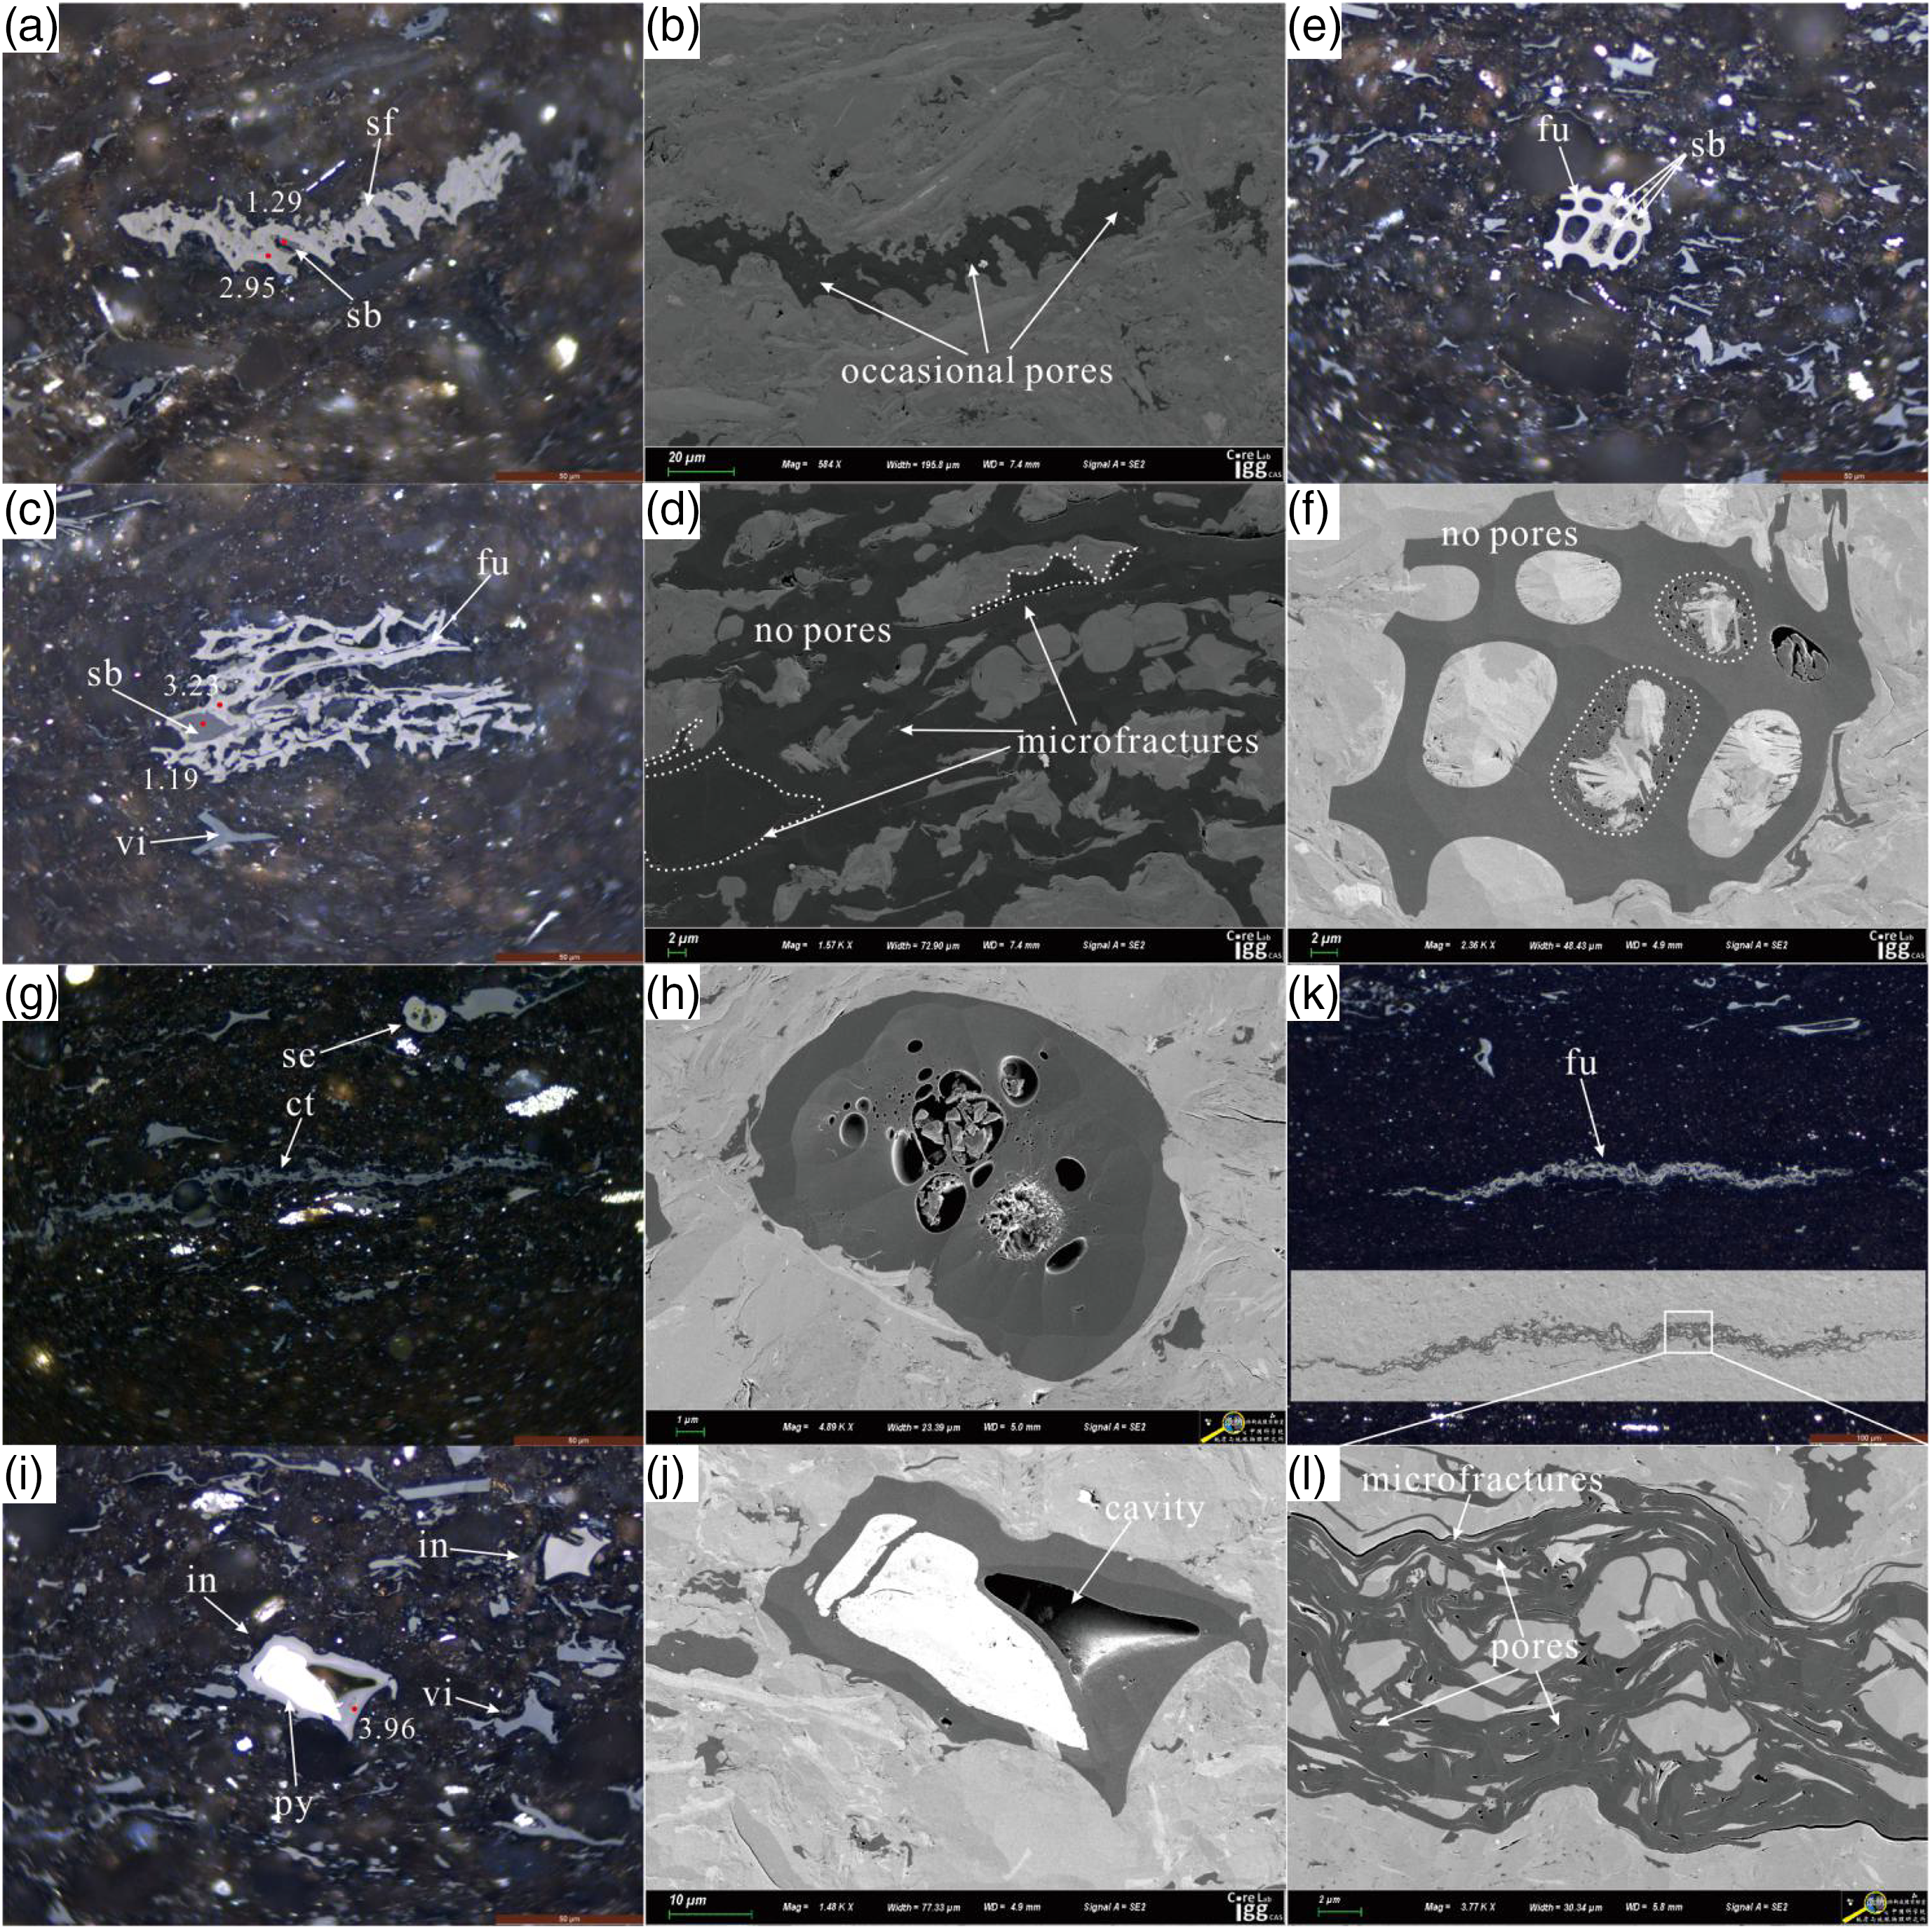
Photomicrographs of pore development in inertinite observed from FE-SEM images combined with: (b), (d), (f), (h), (j), and (l) reflected light and (a), (c), (e), (g), (i), and (k) oil immersion. (a) and (b) S103-N05: semi-fusinite with countable pores; (c) and (d) S103-N05: both fusinite branches and infilling SB in the cell lumens have no pores; (e) and (f) SL2-N06: porous organic–clay complex filling in the cell of non-porous fusinite; (g) and (h) SL2-N09: round pores in funginite; (i) and (j): well preserved cell lumen of fusinite; (k) and (l) SL2-N11: residual pores between overlapped band-like fusinite.
Organic pore development observed from FE-SEM and optical microscope
Pores developed within SB
SB is an important OM type, which belongs to the secondary OM and occurs in the stage of oil and gas window (Cardott et al., 2015; Kondla et al., 2015; Mastalerz et al., 2018; Rippen et al., 2013). SB develops the most pores among the three types of OM. Most of SB develops sponge-like pores that are closely and evenly distributed in large quantities. The minimum pore diameter can be less than 10 nm. The type of OM observed in Figure 3(b) can be clearly distinguished from Figure 3(a). The upper right OM is interpreted as SB, in which the sponge-like pores are shown in Figure 3(c). Below the upper right SB (Figure 3(c)), the star-like SB with sharp angles also develops sponge-like pores (Figure 3(d)). Figure 3(e) is interesting: in the space surrounded by a white arched inertinite, the dark gray SB partly infills and coexists with quartz and illite (Figure 3(f)). The inner SB hosts a large number of honeycomb pores and is clearly demarcated with peripheral inertinite by filamentous illite (Figure 3(f)). In a small region next to the left of the filamentous illite, we also observed sponge-like pores distributed along the string-like illite (Figure 3(f)). Figure 3(g) to (i) demonstrates that one cell of telinite is filled with both pyrite and SB. The pores within infilled SB are still abundant, and closely and evenly distributed. We also observed that some regions of SB develop no pores (Figure 3(j) to (r)). The OM shown in Figure 3(k) consists of two types of OM (Figure 3(j)). The upper large connected pieces of irregular OM are SB with almost no pores (Figure 3(l)). The lower right SB contains a small number of pores (Figure 3(m)). SB in Figure 3(n) to (o) distributed around quartz grains develops no pores. No pores were found in SB either in the lower left corner of Figure 3(p), which is divergent and embedded between minerals (Figure 3(q) to (r)).
Pores developed within organic–clay complex
Organoclay minerals refer to a mixture of OM and clay minerals combined chemically or physically. In our samples, the OM particles in organoclay minerals are almost SB. The pores in organoclay minerals are well developed. In Figure 4(a) and (b), there are many organoclay complexes distributed in which the string-like illite joins the granular chlorites with each other (Figure 4(c) and (d)). The organoclay develops a wide range of organic pores in the micro- to macro-range. The large pores with an aperture range of 100–500 nm tend to occur at the bend of illite (Figure 4(d)). Figure 4(e) and (f) is organic-chlorite composites that filled in the interparticle space of quartz minerals. Both macro- and micro-pores develop in the organic-chlorite composites. Similar to the organoclay composite shown in Figure 4(c), the left upper SB in Figure 4(g) is also an organic–clay complex and the clay minerals are silk flocculent illite in all directions (Figure 4(h)). The proportion of illite in this kind of composite is quite low compared to the complex in Figure 4(c), but the composite is still observed to develop abundant micro and meso sponge-like pores. In Figure 4(i), a layer of SB with generally consistent thickness attaches to the inner edge of the arched inertinite, which can be observed at the right side of the white line in Figure 4(j). The right side possesses a large number of pores, while the left side develops no pores. Figure 4(k) shows an organic–clay complex formed by the filling of SB in the interlayer of mica sheets. Further observation reveals that the SB in the center of Figure 4(l) develops honeycomb organic pores and the surrounding SB possesses almost no pores (Figure 4(l)). Where pores appear, a sliver of illite always appears (Figure 4(l)). Figure 4(m) to (o) shows a mixture that consists of SB, quartz, chlorite, and illite. The pores are not the same as honeycomb-like pores but locally distributed in the corners or depressions where OM and the minerals contact each other. In summary, organic pores in the organic–clay composite are widely developed, but the degree of pore development varies within different composites.
We also observed a kind of OM that coexists with inorganic minerals such as quartz, pyrite, rutile, and apatite. The OM was basically recognized as SB and usually shows an embedded structure under white reflected light and oil immersion. The pores associated with this kind of OM are often abundant and in the micro- and meso-range (Figure 5).
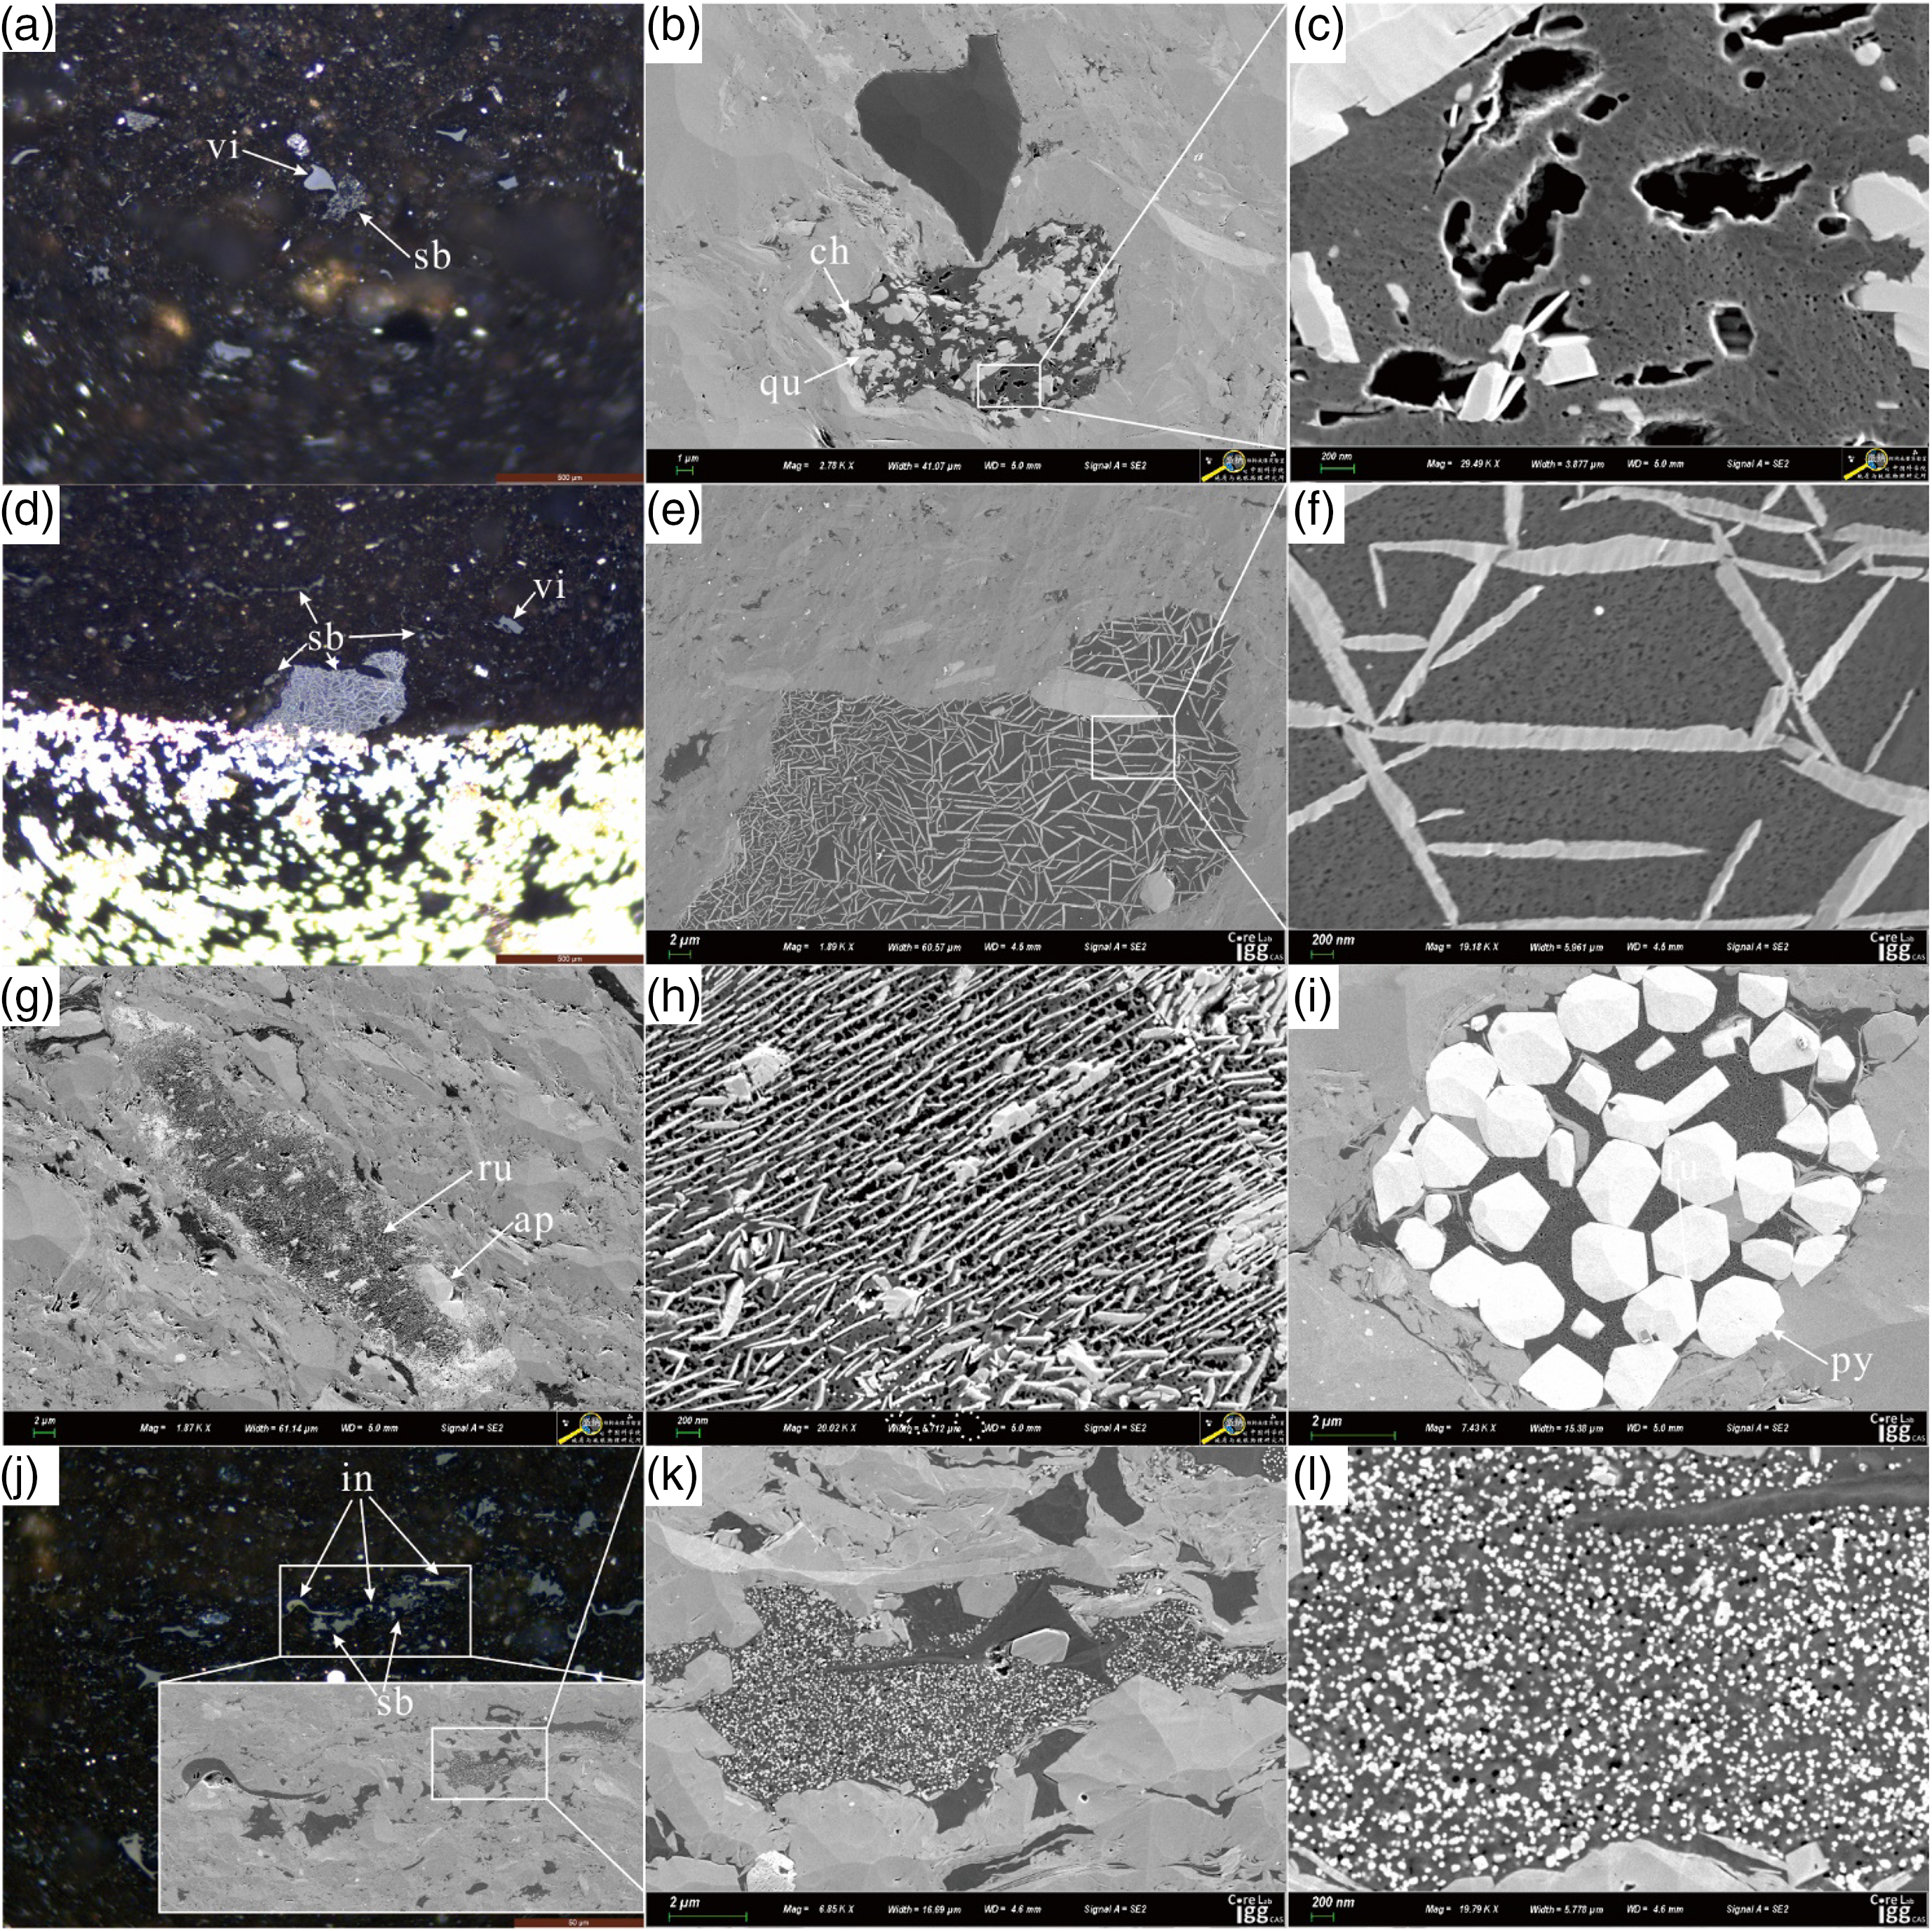
Photomicrographs of pore development in organic–mineral mixtures observed from FE-SEM images combined with: (b), (c), (e)–(i), (k), and (l) reflected light and (a), (d), and (j) oil immersion. (a)–(c) B2-N10: adjacent to the heart shaped vitrinite, there exists a porous organic–inorganic (quartz) mixture; (d)–(f) B2-N10: porous SB and needle-like rutile constitute organic–inorganic mixture; (g) and (h) B2-N04: porous SB and parallel needle-like rutile constitute organic–inorganic mixture; (i) B2-N04: pyrite framboid filled with porous SB; (j)–(l) SL2-N09: fine point-shaped pyrite crystals evenly distributed in SB.
Pores developed within vitrinite
Vitrinite originates from terrestrial advanced plants and thus retains associated structures such as discrete particle shapes and plant cell structures (Guo et al., 2018; Jiang et al., 2015; Liu et al., 2017; Wei et al., 2014). In general, the pores in vitrinite are less developed. Figure 6(a) to (c) shows that the vitrinite maintains the fibrous structure of advanced plants, which was recognized as telinite. There are no pores in the telinite (Figure 6(c)). Most of the cell lumens inside the telinite are completely filled with minerals and SB, which develop no obvious pores (Figure 6(c)). The OM in Figure 6(f) was identified as collotelinite. It is challenging to observe the cell structure of woody plants and collotelinite can be easily mistaken for SB without optical microscope observation because of their similar shape and homogeneity. No matter which part of the collotelinite, no pores were observed (Figure 6(g) to (i)). Nevertheless, we still observed some organic pores associated with vitrinite (Figure 6(d), (e), and (j) to (l)). Circular and elliptical pores develop along the boundary of OM and pyrite (Figure 6(e)). This kind of pores is rare. There are also some pores in irregular shapes, such as crescent and triangular, in telinite (Figure 6(j) to (l)). These pores are likely the remnants of compaction of unfilled cell lumens inside telinite.
Pores developed within inertinite
Similar to vitrinite, inertinite also originates from woody plants. However, its white and yellowish-white reflected color and higher relief, compared to vitrinite, are two important characteristics to distinguish inertinite from vitrinite (Guo et al., 2018; Jiang et al., 2015; Liu et al., 2017; Wei et al., 2014). Various morphological inertinites are observed, which include dominant fusinite, inertodetrinite, and a small amount of semifusinite and funginite. Figure 7(a) and (b) shows that semifusinite maintains partially particular plant tissues, but the cellular structure seems to be blurred due to the swelling of cell walls. Sporadic distinguishable organic pores can be observed within the semifusinite, which may be residual cellular space that is unfilled and subjected to shrinkage due to expansion (Figure 7(a) and (b)). Figure 7(c) to (f) shows a well-preserved fusinite. The fibrous structure and cell lumens of the original plant are clearly visible. Under compaction, the cell lumens in Figure 7(c) rupture and become irregular; some cells are completely filled with minerals, while some are filled with homogeneous SB (Figure 7(c) and (d)). No pores developed in the fusinite (Figure 7(d)). Figure 7(e) to (f) shows well-preserved fusinite that was not subjected to obvious compaction. No organic pores are observed in the cell wall of funisite, but some cells in the fusinite are not fully filled with nonporous SB and possess large residual spaces (Figure 7(f)). We also observed some funginite (Figure 7(g) and (h)), which usually possesses a relatively regular round shape. Contrary to fusinite and semifusinite, pores are more developed in the funginite and distributed in the center of the funginite. Small pores within large pores are clearly observed (Figure 7(h)). The shape of pores is regular oval or round. The fusinite in Figure 7(i) developed two cell cavities. The unfilled cavity is well-preserved with a length of ∼20 µm, while the adjacent cavity has been fully filled by pyrite (Figure 7(j)). Figure 7(k) and (l) shows fusinite with a band-like shape. Under compaction, the bended and deformed band-like fusinite overlaps and contacts each other, and some irregular pores are preserved.
Discussion
Residue of primary organic pores
The degree of pore development associated with different OM in the gas-window shale exhibits significant variations. Based on observations in this study, the causes of organic pore heterogeneity in the study area can be summarized. Organic pores include primary and secondary organic pores, which mainly originate from porous original OM deposited together with sediments followed by further transformation of kerogen and secondary OM to petroleum, respectively. The primary organic pores have rarely been observed in previous research (Guo et al., 2018; Lu et al., 2015). However, in our samples, the primary residual pores are mostly recognized in telinite (Figure 6(d), (e), and (l)), fusinite (Figure 7(f) and (j)), and semi-fusinite (Figure 7(b)). The common features among these macerals are the well-preserved primitive plant cell structures, including cell walls and lumens. We summarize the formation mechanisms of primary residual organic pores within these macerals into three modes (Figure 8). The first mode refers to the original residual organic pores from cell lumens that have not been completely filled (Figure 8(a)). Most of the cell lumens were observed to be filled with pyrite, clay minerals, and even SB (Figures 6(c), (e), and 7(d), (f), (j)). However, there are still some cell cavities that are only partially filled or not filled at all, leaving a residual pore. The second mode is related to compaction-related deformation (Figure 8(b)). In the process of deposition, telinite and fusinite are prone to deformation under compaction, leading some unfilled cell cavities to form irregular pores such as crescent and triangle shapes (Figure 6(l)). When the plastic branches of banded-like fusinite and telinite fold and overlap with each other under compaction, pores will form and can be preserved (Figure 7(l)). For semi-fusinite, residual pores were preserved through further spatial compression of the unfilled cell lumens. The compression is most likely due to the swelling and expansion of cell walls (Figure 7(b)). The third mode is the recovery of primary cell cavities due to SB cracking (Figure 8(c)). The original cell lumens of some telinite and fusinite are initially filled by SB in a low-high mature stage (Figure 7(f)). As the maturity increases, SB cracks to form gas in a high-over mature stage, developing abundant honeycomb pores, which is considered to be the partial restoration of the original cell space (Figure 8(c)).
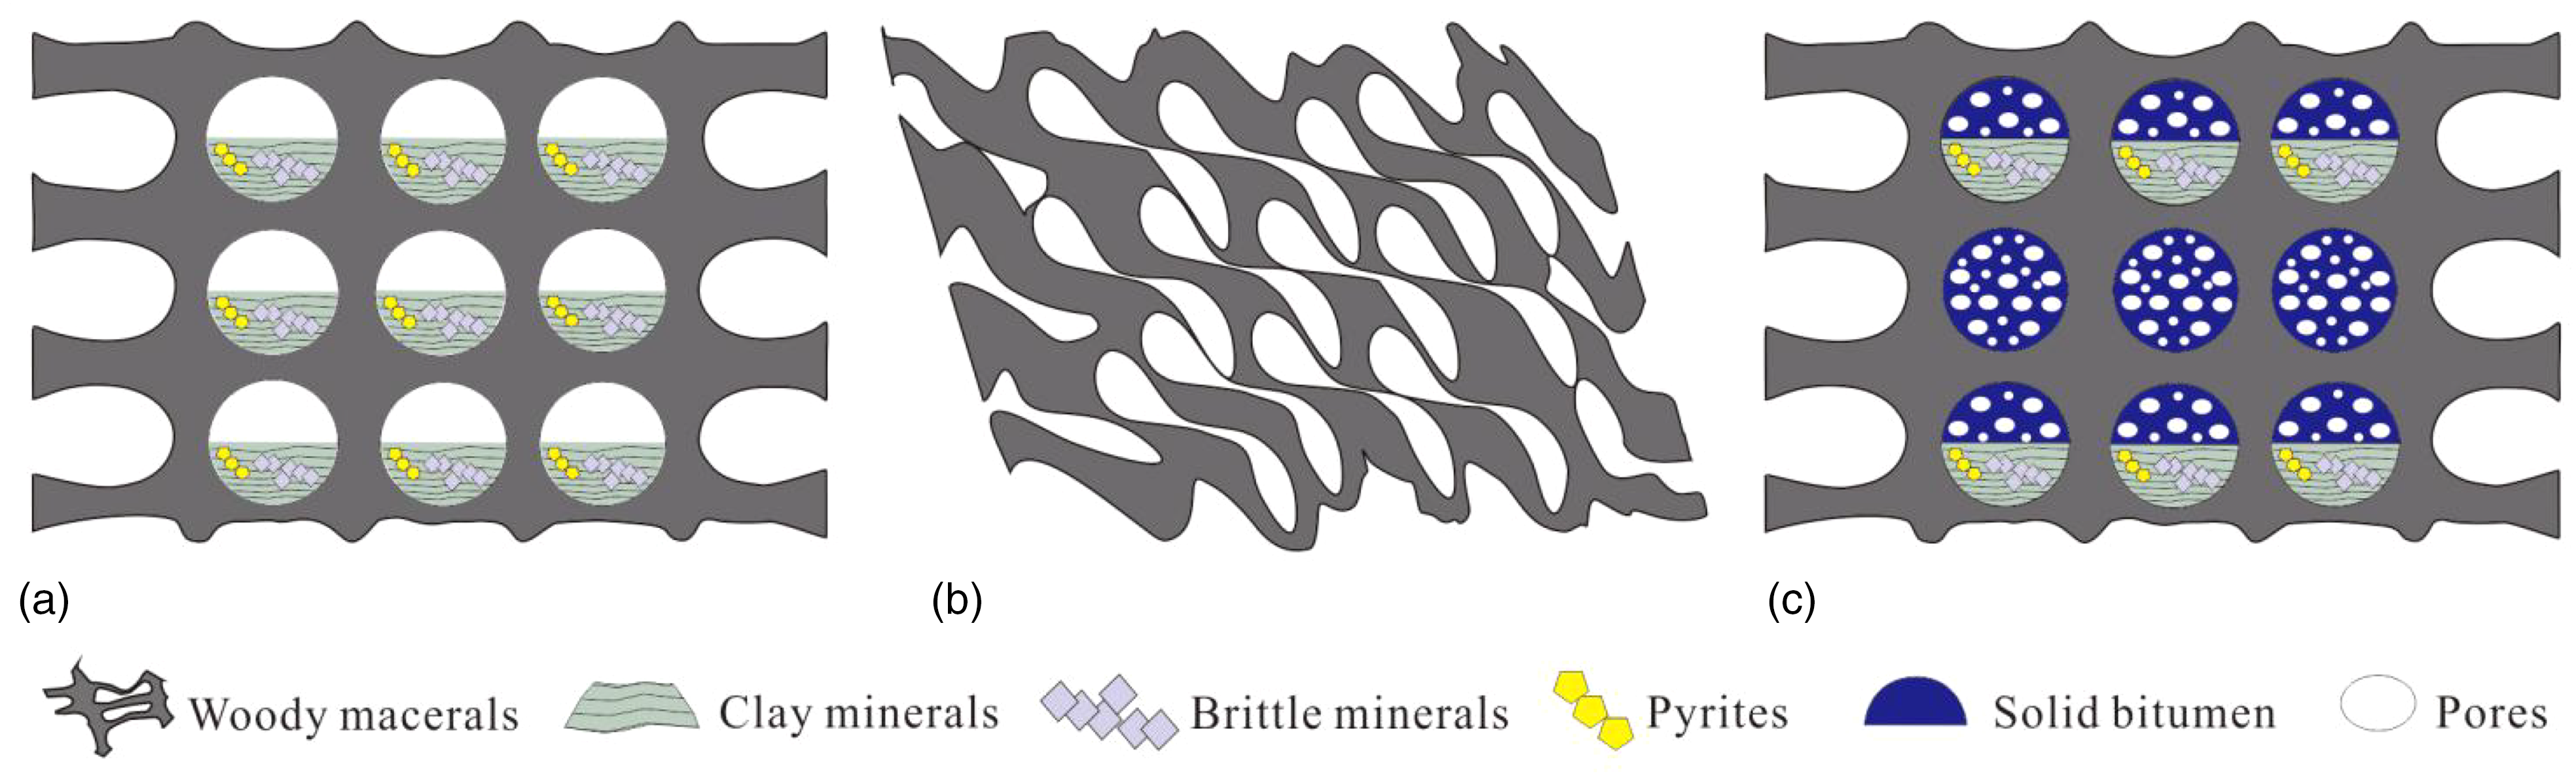
Preservation mechanisms of organic pores related to vitrinites and inertinites. (a) Unfilled residual pores; (b) compaction-related residual pores; (c) residual pore recovery from solid bitumen (SB) cracking in cell lumens.
Individual SB formation in different evolutionary stages
Most SB is highly porous, while some are not (Figure 3). We measured SBRo on 44 points of different OM of the samples on Ar-milled surfaces. It was found that within one shale formation that even experienced the same thermal evolution, the reflectance of different SB particles can vary slightly. This is because SB is formed at different thermal evolution stages. The SBRo of porous SB ranges between 1.05% and 2.73% (averaging 1.85%), and most SBRo values are in the range of 1.6–2.0%, accounting for 20.5% of 44 points (Figure 9). The SBRo of non-porous SB ranges from 0.76% to 2.68% with an average of 1.56%, and the peak values distribute in the range of 1.2–1.6%, accounting for 31.8% of 44 points (Figure 9). Equations from previous study have been used to convert SBRo to VRo, and the results suggest that VRo is close to SBRo (Bertrand, 1993; Schoenherr et al., 2007; Wei et al., 2014). Therefore, most of the non-porous SB is likely in the early stage of high maturation (Figure 9), in which kerogen conversion and oil generation dominate, while the porous SB is mostly at the high and over mature stage (Figure 9), in which generated oil and SB is cracking to gas. As a result, the former contains almost no pores, while the latter generates abundant pores due to hydrocarbon transformation (Jarvie et al., 2007; Mastalerz et al., 2018; Milliken et al., 2013). SB that develops no pores at the over mature stage may be different in chemical composition or lack catalytic function via minerals, which needs further study.
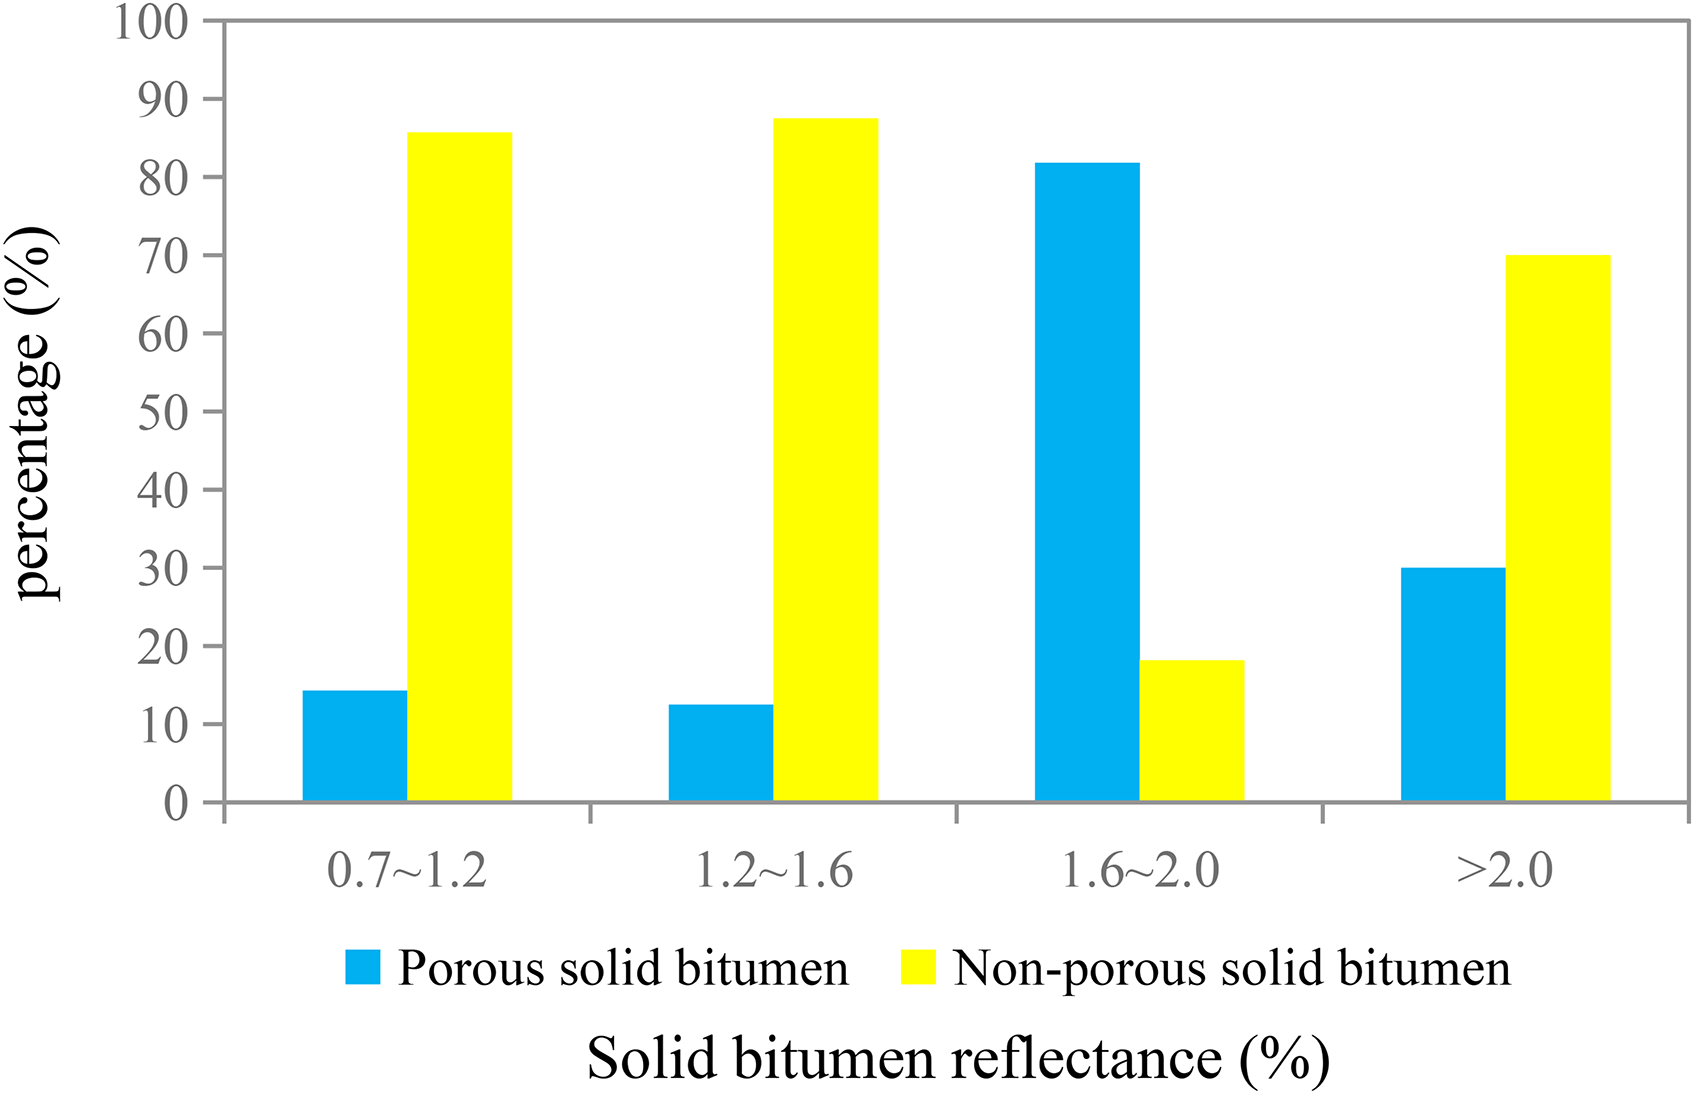
Solid bitumen reflectance (SBRo) of 44 points in porous and non-porous SB.
Difference in hydrocarbon generation potential
The degree of pore development in different macerals varies considerably. Overall, pores are most developed within SB, followed by vitrinite and inert bodies (Figures 3 to 7). We attribute this phenomenon essentially to the difference of hydrocarbon generation potential of organic macerals, based on the theory of hydrocarbon generation accompanied with pore production (Curtis et al., 2012; Gao et al., 2018; Liu et al., 2017; Loucks et al., 2012). Previous studies have shown that the exinite and sapropelinite have the greatest potential for hydrocarbon generation. The vitrinite is mainly a component that produces gas (Jiang et al., 2015; Tissot and Welte, 1984). The inertinite can neither produce gas nor oil (Ao et al., 2011; Jiang et al., 2015). SB is the secondary OM and has the potential of further cracking to produce light oil and natural gas (Zhao et al., 2005), so it has better hydrocarbon generation potential than vitrinite and inertite. The hydrocarbon indices are direct indicators to determine the hydrocarbon generation potential. We performed energy dispersive spectrometer (EDS) analysis on the chemical elements of each maceral to measure carbon content by weight percentage in the process of FE-SEM observation (Figure 10). The lower the carbon content, the better the hydrocarbon generation potential. The results show that the carbon content of SB ranges from 31.87% to 57.43%, which is 50.24–71.08% for vitrinite and 57.54–95.88% for inertinite (Table 2). From SB to vitrinite and inertinite, the content of carbon increases, which clearly shows that the difference of pore development in different macerals is essentially determined by their different hydrocarbon generation potential.
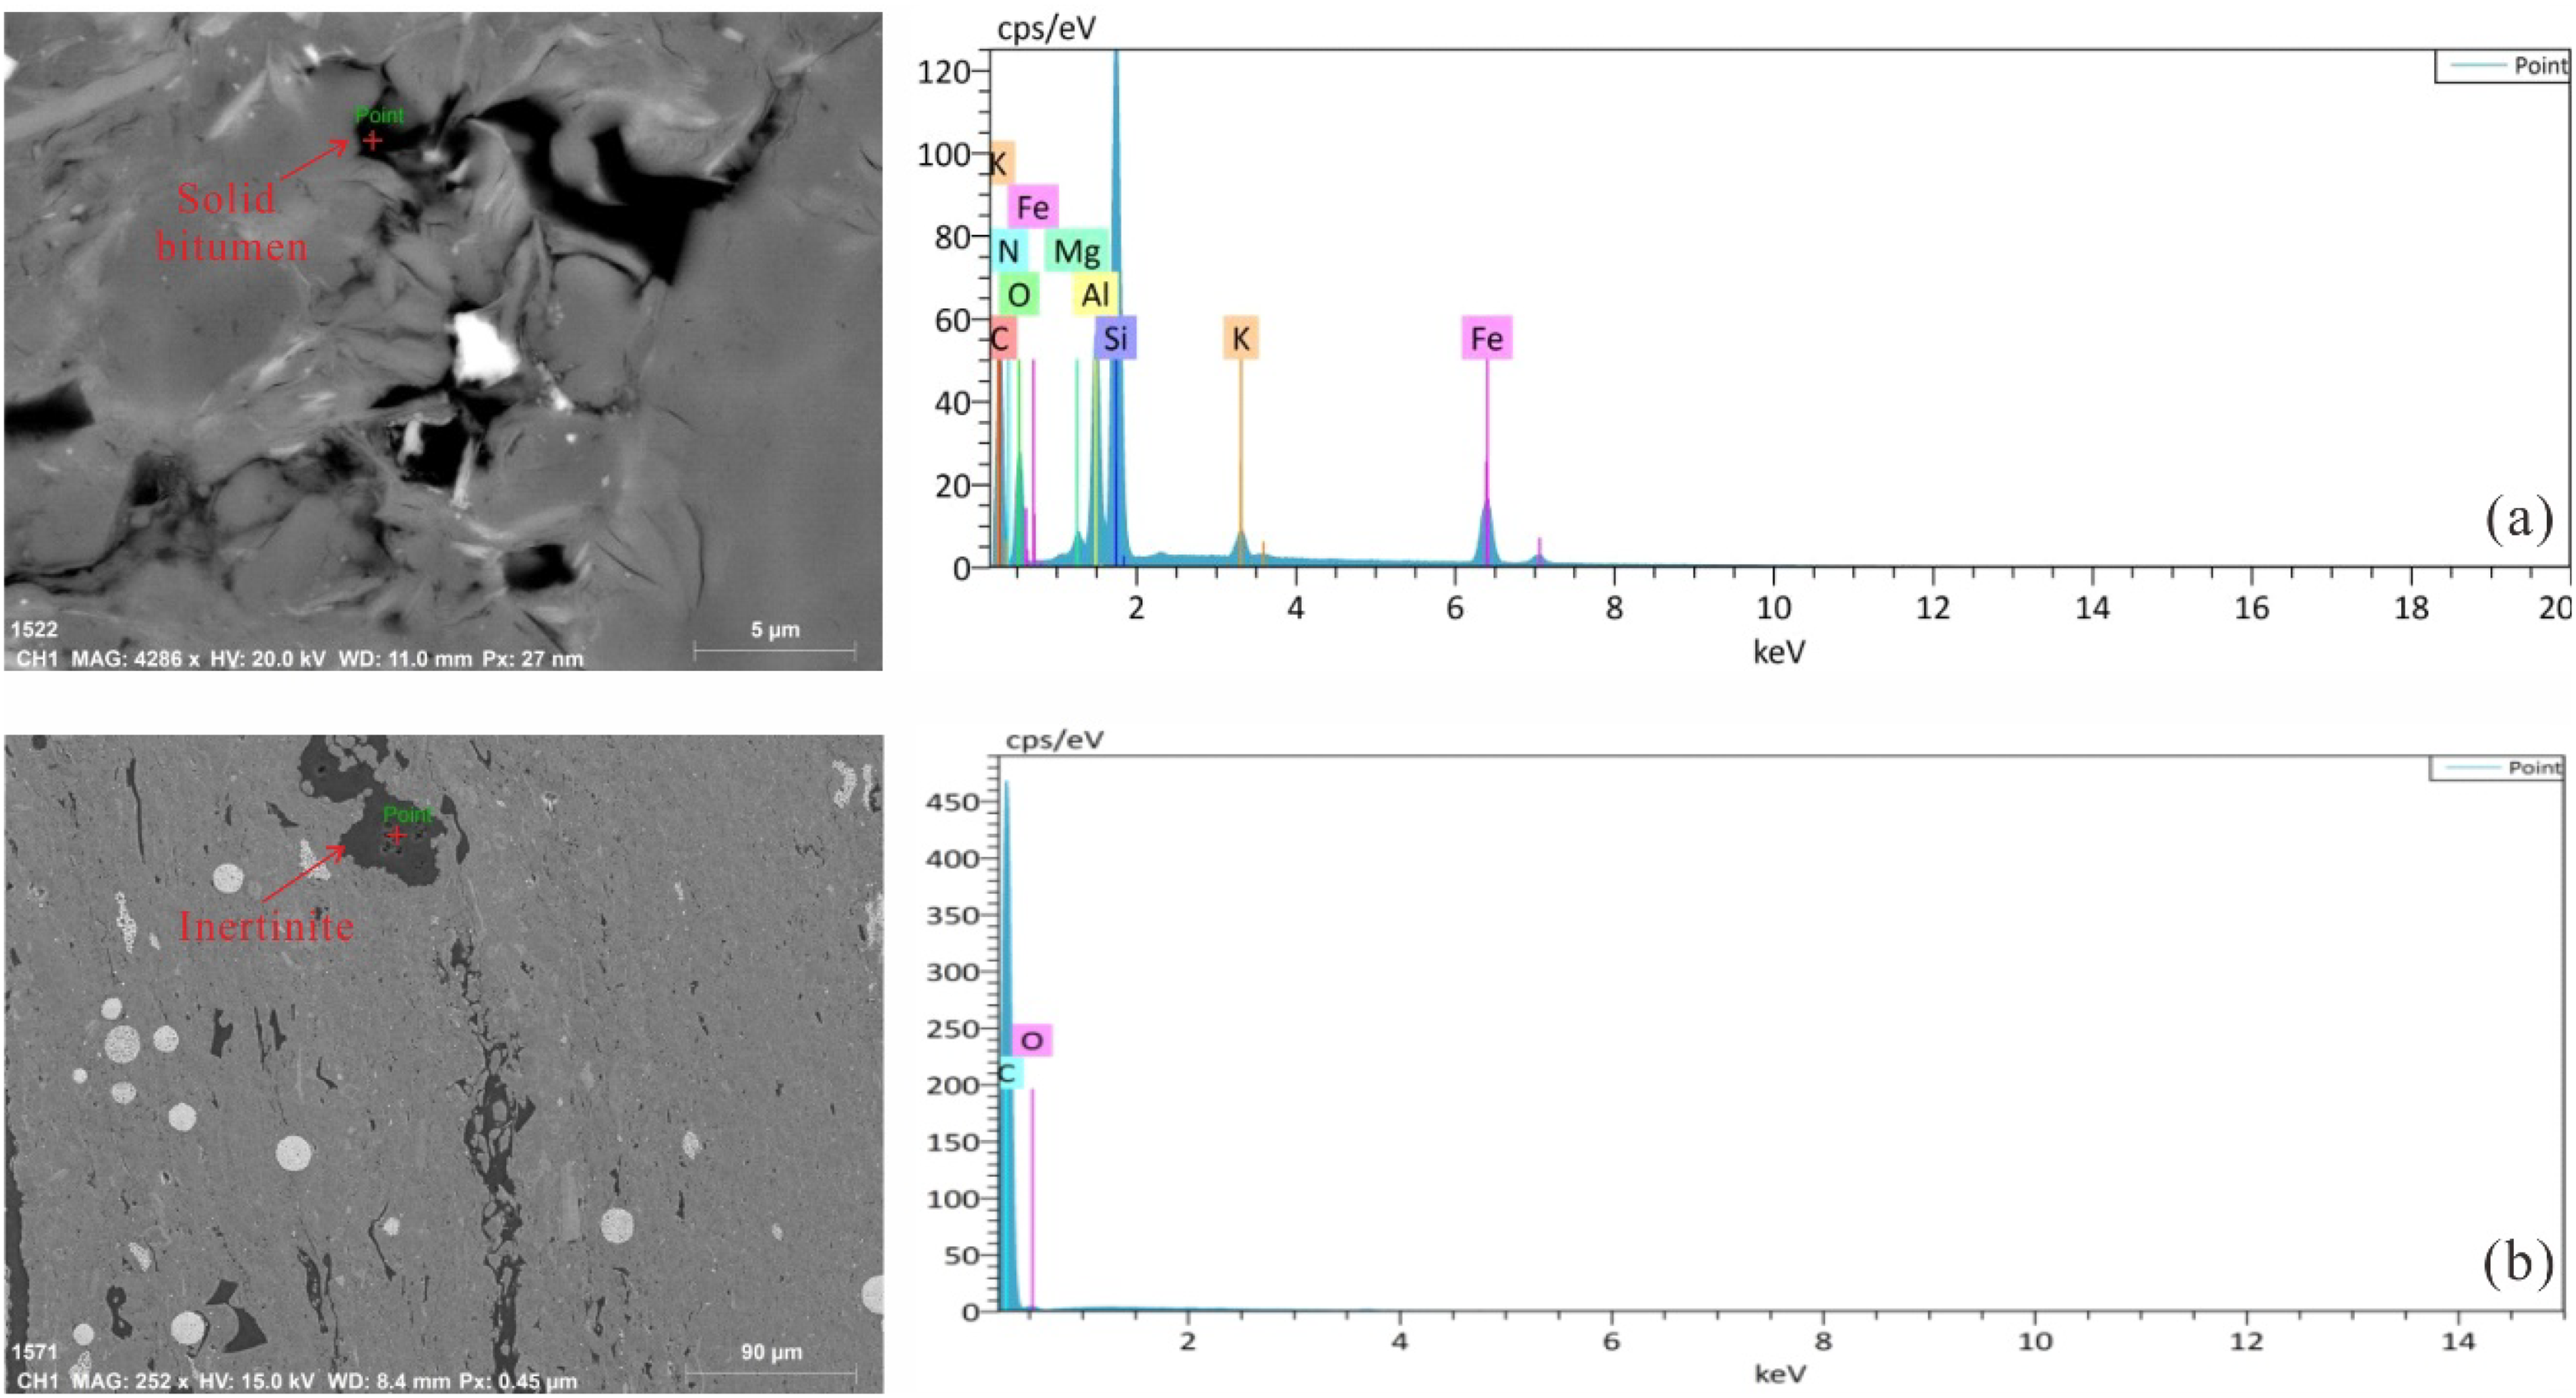
SEM images and according EDS spectrums of different macerals. (a) Measuring point of SB and its EDS spectrum showing low carbon content; (b) measuring point of inertinite and its EDS spectrum showing high carbon contents.
Carbon content by weight percentage of different macerals from EDS.
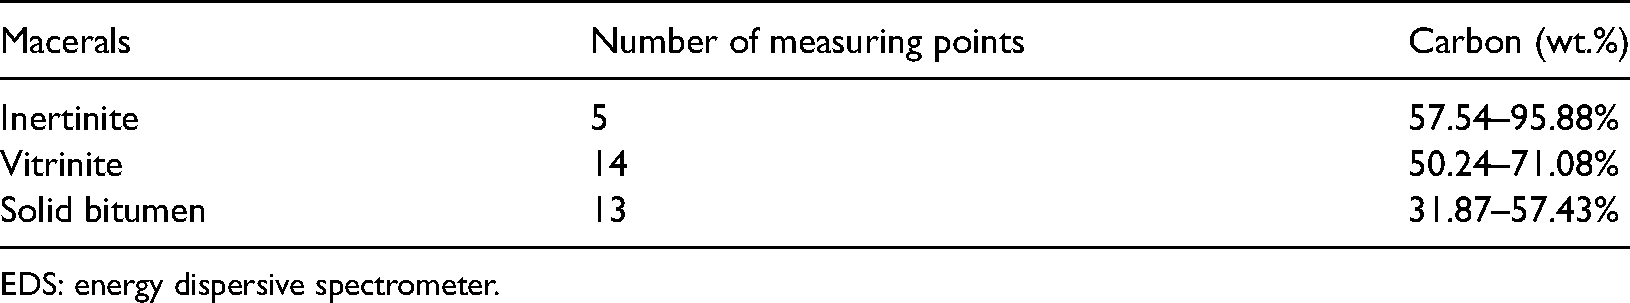
EDS: energy dispersive spectrometer.
Catalysis of clay minerals
We also observed that OM often coexists with clay minerals (referred to as an organoclay complex), which develops a number of pores (Figure 4), especially OM distributed around illite (Figure 4(d) and (l)). The pore development of OM distributed around illite is higher than that of OM coexisting with other clay minerals. The phenomenon that organic pores develop in organic clay complexes has been reported before (Milliken et al., 2013; Guo et al., 2018). Experimental observations have shown that clay minerals preferentially catalyze the formation of gaseous hydrocarbons over other kinds of minerals (Tannenbaum and Kaplan, 1985) and facilitate the nucleation and subsequent escape of gas bubbles on the mineral surfaces (Milliken et al., 2013). Two processes occur simultaneously: one is the production of organic acids as kerogen is converted to hydrocarbons, with the organic acids promoting the transformation from smectite to illite; the other process is that during the transformation from smectite to illite, the specific catalytic activity increases with the higher amount of illite in the mixed layer I/S. The illite in the mixed layer I/S is a more active catalyst than smectite (Johns and Mckallip, 1989). The two processes are complementary and promote the OM and SB to further generate hydrocarbon and form pores. Other inorganic minerals coexisting with OM, such as pyrite, also have a catalytic effect on hydrocarbon generation (Li et al., 1998).
Conclusion
In this work, we analyzed the formation mechanisms of organic pore heterogeneity based on the fixed location observation using a combination of FE-SEM and optical microscopy. The main conclusions are summarized below:
The OM of Shahezi shale is dominated by vitrinite, followed by inertinite and SB. Vitrinite is mainly comprised of telinite, collotelinite, and vitrodetrinite. Inertinite includes mainly fusinite and inertodetrinite, and a small amount of semifusinite and funginite. Telinite, fusinite, and semifusinite retain woody plant tissues. The degree of pore development varies greatly among different types of OM. SB is the maceral that develops most organic pores, but not all SB develops organic pores. Almost all organoclay complexes as well as the mixtures of OM and minerals develop pores. Most of vitrinite and inertinite contain rare pores. Four major origins of organic pore heterogeneity are proposed. Primary residual pores remain in or between telinites, fusinites, and semi-fusinites. The SBRo of porous and nonporous SB is different. The porous SB is mostly in the gas generation stage, while most of the non-porous SB is in the kerogen conversion and oil generation stage. The catalytic function of the transformation process from smectite to illite and other minerals is the main reason for pore development inside organoclay complexes and mixtures of OM and inorganic minerals. The variation of pore development among SB, vitrinite, and inertinite basically depends on the different hydrocarbon potentials of macerals.
Footnotes
Declaration of conflicting interests
The author(s) declared no potential conflicts of interest with respect to the research, authorship, and/or publication of this article.
Funding
The author(s) disclosed receipt of the following financial support for the research, authorship, and/or publication of this article: This work was supported by the National Science and Technology Major Project (Grant No. 2016ZX05034001-005), China Geological Survey Project and the Northeastern Petroleum Bureau of SINOPEC.