
Abstract
The rapid and cost-effective quantitative characterization of broad-sense shale oil reservoirs is highly challenging due to the complex lithology and strong heterogeneity of the strata. In this paper, the pore structures and surface roughness of samples of various lithologies from a shale oil reservoir were studied using atomic force microscopy (AFM) and the open-source Gwyddion analytical software. The surface morphology was reconstructed both two-dimensionally and three-dimensionally using the AFM data for the mudstone, siltstone, and dolarenite in a broad-sense shale oil reservoir. The surface roughness was evaluated with respect to parameters such as the arithmetic average roughness, root mean square roughness, surface skewness, and kurtosis coefficient. The pores of various scales were quantitatively identified using the watershed algorithm. The samples were also evaluated using focused ion beam scanning electron microscopy for comparison, and the derived pore scales are consistent with those obtained from the AFM analysis. In conclusion, the utilization of AFM and open-source software provides a new easy-to-operate method, which can be widely applied to characterize the surface roughness and pore structures of unconventional oil and gas reservoirs.
Introduction
In a broad sense, shale oil refers to crude oil that remains in mudstone/shale as a result of incomplete migration or migration over very short distances, and therefore, it is a typical self-generating self-storage type of petroleum reservoir and is characterized by in-situ accumulation (Hu et al., 2020; Li et al., 2017; Song et al., 2020). The media in which shale oil is stored mainly consist of mudstone/shale, which have generated or are still generating crude oil. Possible interbeds of thin tight sandstone, carbonate rocks, and volcanic rocks in the mudstone/shale are also included in the concept of shale oil reservoirs (Lu et al., 2018; Song et al., 2020). Shale oil reservoirs have complex characteristics in terms of their physical properties, with various lithologies, mineral compositions, organic matter compositions, tiny pore geometries, and natural fracture systems. These characteristics have significant impacts on the fluid flow properties; and in particular, the characteristics of the pore-throat structures are the foundation for investigating fluid storage and production capacities (Gorham et al., 2007; Li et al., 2020; Wang et al., 2018; Xiong et al., 2020).
At present, the pore characterization of shale oil and gas reservoirs mainly involves imaging analysis and fluid invasion techniques. Imaging analysis includes transmission electron microscopy (TEM), scanning electron microscopy (SEM), focused ion beam scanning electron microscopy (FIB–SEM), and computed tomography scanning (CT). In addition, atomic force microscopy (AFM), which is based on mechanical principles, has been progressively applied in imaging analysis in recent years (Milliken and Curtis, 2016; Pack et al., 2010; Wang et al., 2019; Yang et al., 2019). In imaging analysis, the characteristics of the core surfaces, especially the actual conditions of the pores, can be directly observed; and quantitative information, such as the porosity and pore diameter distribution, can be obtained when statistical methods are used in combination with imaging analysis (Howaniec, 2016). However, the challenge remains to simultaneously perform surface imaging and quantitative analysis using a single method (Craddock et al., 2018; Dufrêne et al., 2017; Li et al., 2017; Radlinski et al., 2004; Rief et al., 1997; Su et al., 2018; Xing et al., 2017).
The development of both manufacturing techniques and analysis software has widened the application of atomic force microscopy (AFM). The atomic force microscope, which was invented by G. Binning in 1986, provides a new analytical imaging method. Compared with conventional instruments, the AFM is superior for investigating the nano-scale pore structures of rocks because it allows not only 2D imaging but also 3D imaging with high resolutions. Moreover, quantitative analysis is enabled through the processing and analysis of AFM images. These factors make the AFM one of the most powerful analytical tools in nanotechnology. The AFM has been well-recognized in fields such as molecular biology (Beuwer et al., 2016; Guo et al., 2004), material science (Kim et al., 2018; Zhang et al., 2012), and electro-chemistry (Ghorbal et al., 2013) because it is able to provide images of the surface morphology and information about the mechanical and structural properties (Jafarzadegan and Merwade, 2017; Li et al., 2016; 2018).
Reviews of applications of the AFM in the energy industry show that it was first applied to characterize the pore structure of coal, and it has been used to assess shale gas reservoirs since 2015. Using the AFM, Yao et al. (2011) studied the nano-scale pore structures, pore diameter distributions, and porosities of coal samples with various degrees of metamorphism. Yang obtained high-resolution images of coal structures by combining scanning tunneling microscopy (STM) and AFM (Qi et al., 1994). Pan et al. performed preliminary research on the pore structures of tectonically de-formed coal using AFM, and their results revealed that coalification can increase the amount of micropores in coal (Pan et al., 2013, 2015). Eliyahu et al. (2015) were the first to apply AFM to the analysis of shale samples, and Pan et al. (2018) examined the surface morphology of shale samples using AFM. Lawrie et al. (1997) utilized AFM to analyze the pores (>8 nm) in different macerals and to demonstrate that these pores were formed during maturation of the coal-forming materials. With the help of AFM PeakForce quantitative nanomechanical mapping (AFM PF-QNM) technology, Emmanuel et al. (2017) investigated the impact of thermal maturation on the elastic properties of the organic matter in Cretaceous shale. Li et al. (2018) researched the mechanical properties of the organic matter in shale at the micro-nano scale using AFM, which demonstrated the great potential of the AFM for analyzing the nano-scale mechanical properties of organic rocks. Xu et al. (2020) used AFM to study the adhesion and friction behavior of the kerogen in a shale reservoir.
The literature has confirmed the successful application of AFM to the characterization of the nano-scale structures of organic matter (Dun et al., 2014; Morga, 2011), but previous studies on the nano-scale pore structures of shale oil reservoirs (in a broad sense) have mainly focused on direct description or semi-quantitative analysis. Thus, the AFM-based quantitative characterization of broad-sense shale oil reservoirs has rarely been reported (Carbone et al., 2011; Misra et al., 2018). In this paper, AFM was used to achieve 3 D surface morphology observations and quantitative analysis of the nano-scale pores of the broad-sense shale oil reservoir in the Lucaogou Formation in the Jimsar Sag, Xinjiang, China. The results of this study elucidate the surface complexity of the various lithologies of the broad-sense shale oil reservoir and provide experimental support for further research on the fluid occurrence and production in such shale oil reservoirs.
Materials
The core samples used in the experiments were collected from the Permian Lucaogou Formation shale reservoir in Jimsar, Xinjiang, China. The reservoir is located in the Jimsar sag in the east part of the Junggar Basin, 150 km from Urumqi City (Figure 1).
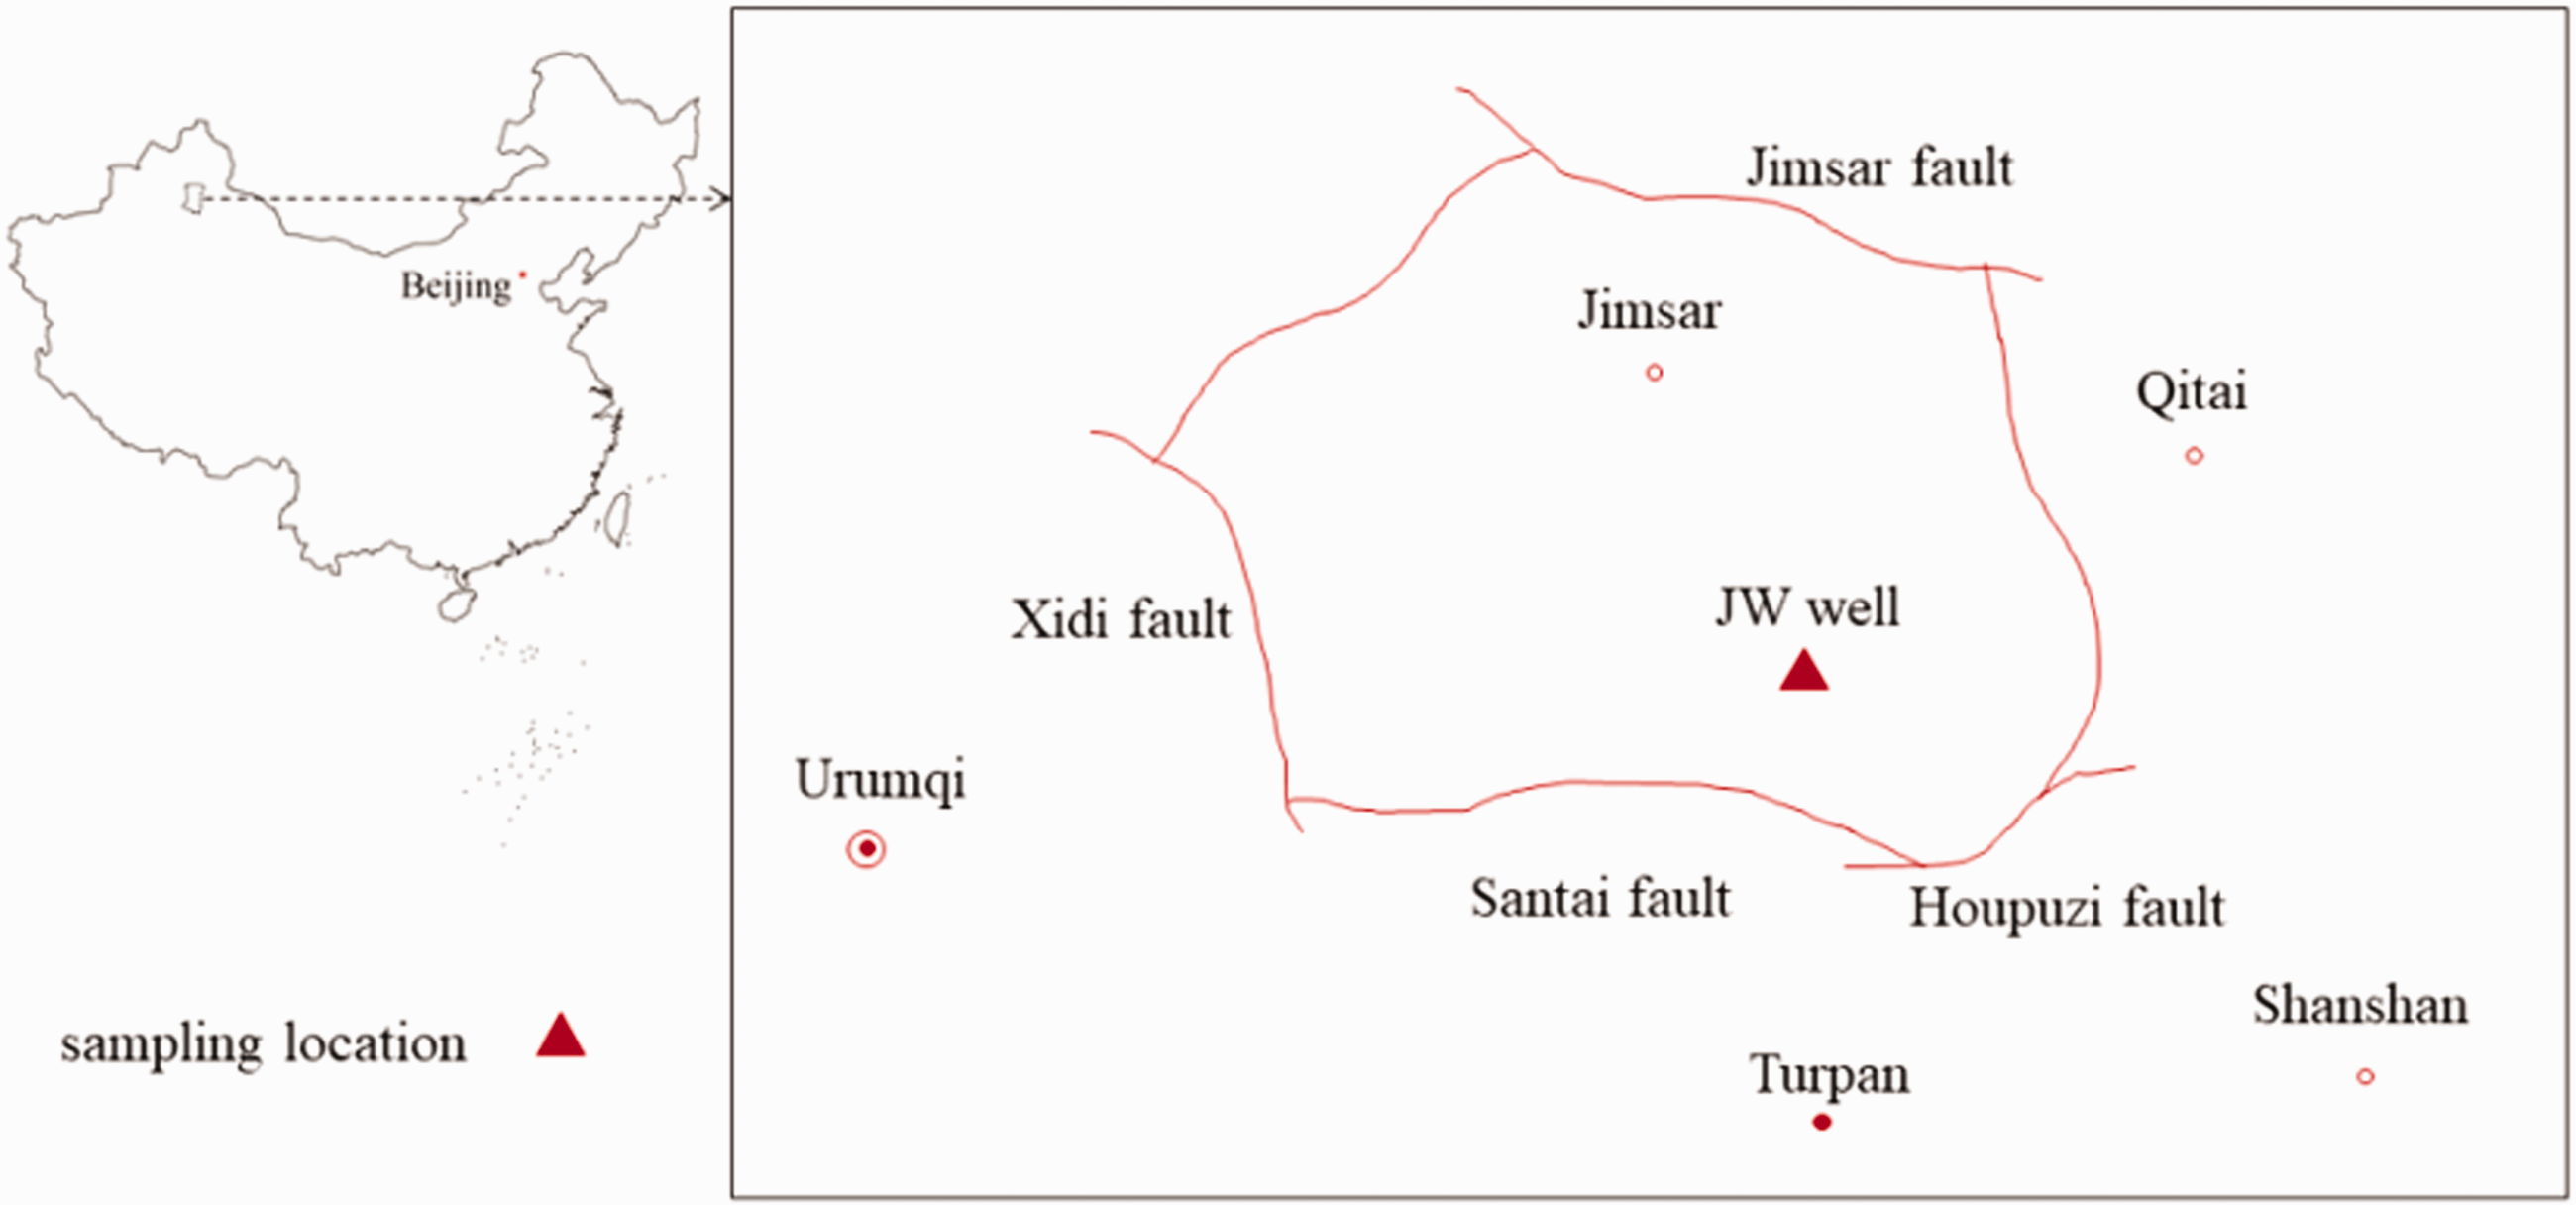
Geologic map showing the sampling location.
The saline-lacustrine basin sedimentary strata in the Jimsar Sag, Xinjiang, are rich in organic matter and are characterized by their combined role as both source and reservoir rocks. They exhibit two types of lithologic associations: (1) siltstone with mudstone and (2) dolomite with mudstone. According to the results of the X-ray diffraction (XRD) bulk rock analysis of more than 170 core samples, it is concluded that a diverse variety of minerals are present in the sweet-spot interval in the Lucaogou Formation in the Jimsar Sag, the majority of which are silt-fine grained sandstone, mudstone, and carbonate rocks. The silt-fine grained sandstone includes dolomitic silt-fine grained sandstone and feldspathic silt-fine grained sandstone; and the carbonate rock is mainly dolarenite (Figure 2). The layers of silt-fine grained sandstone, shale, and dolarenite are all several centimeters thick and exhibit demonstrable rhythms. These rocks experienced heterogeneous mineral alterations such as silicification, dolomitization, and albitization during diagenesis, which led to a complicated mineral composition, rapid vertical lithologic variations, and consequently, a limited thickness.
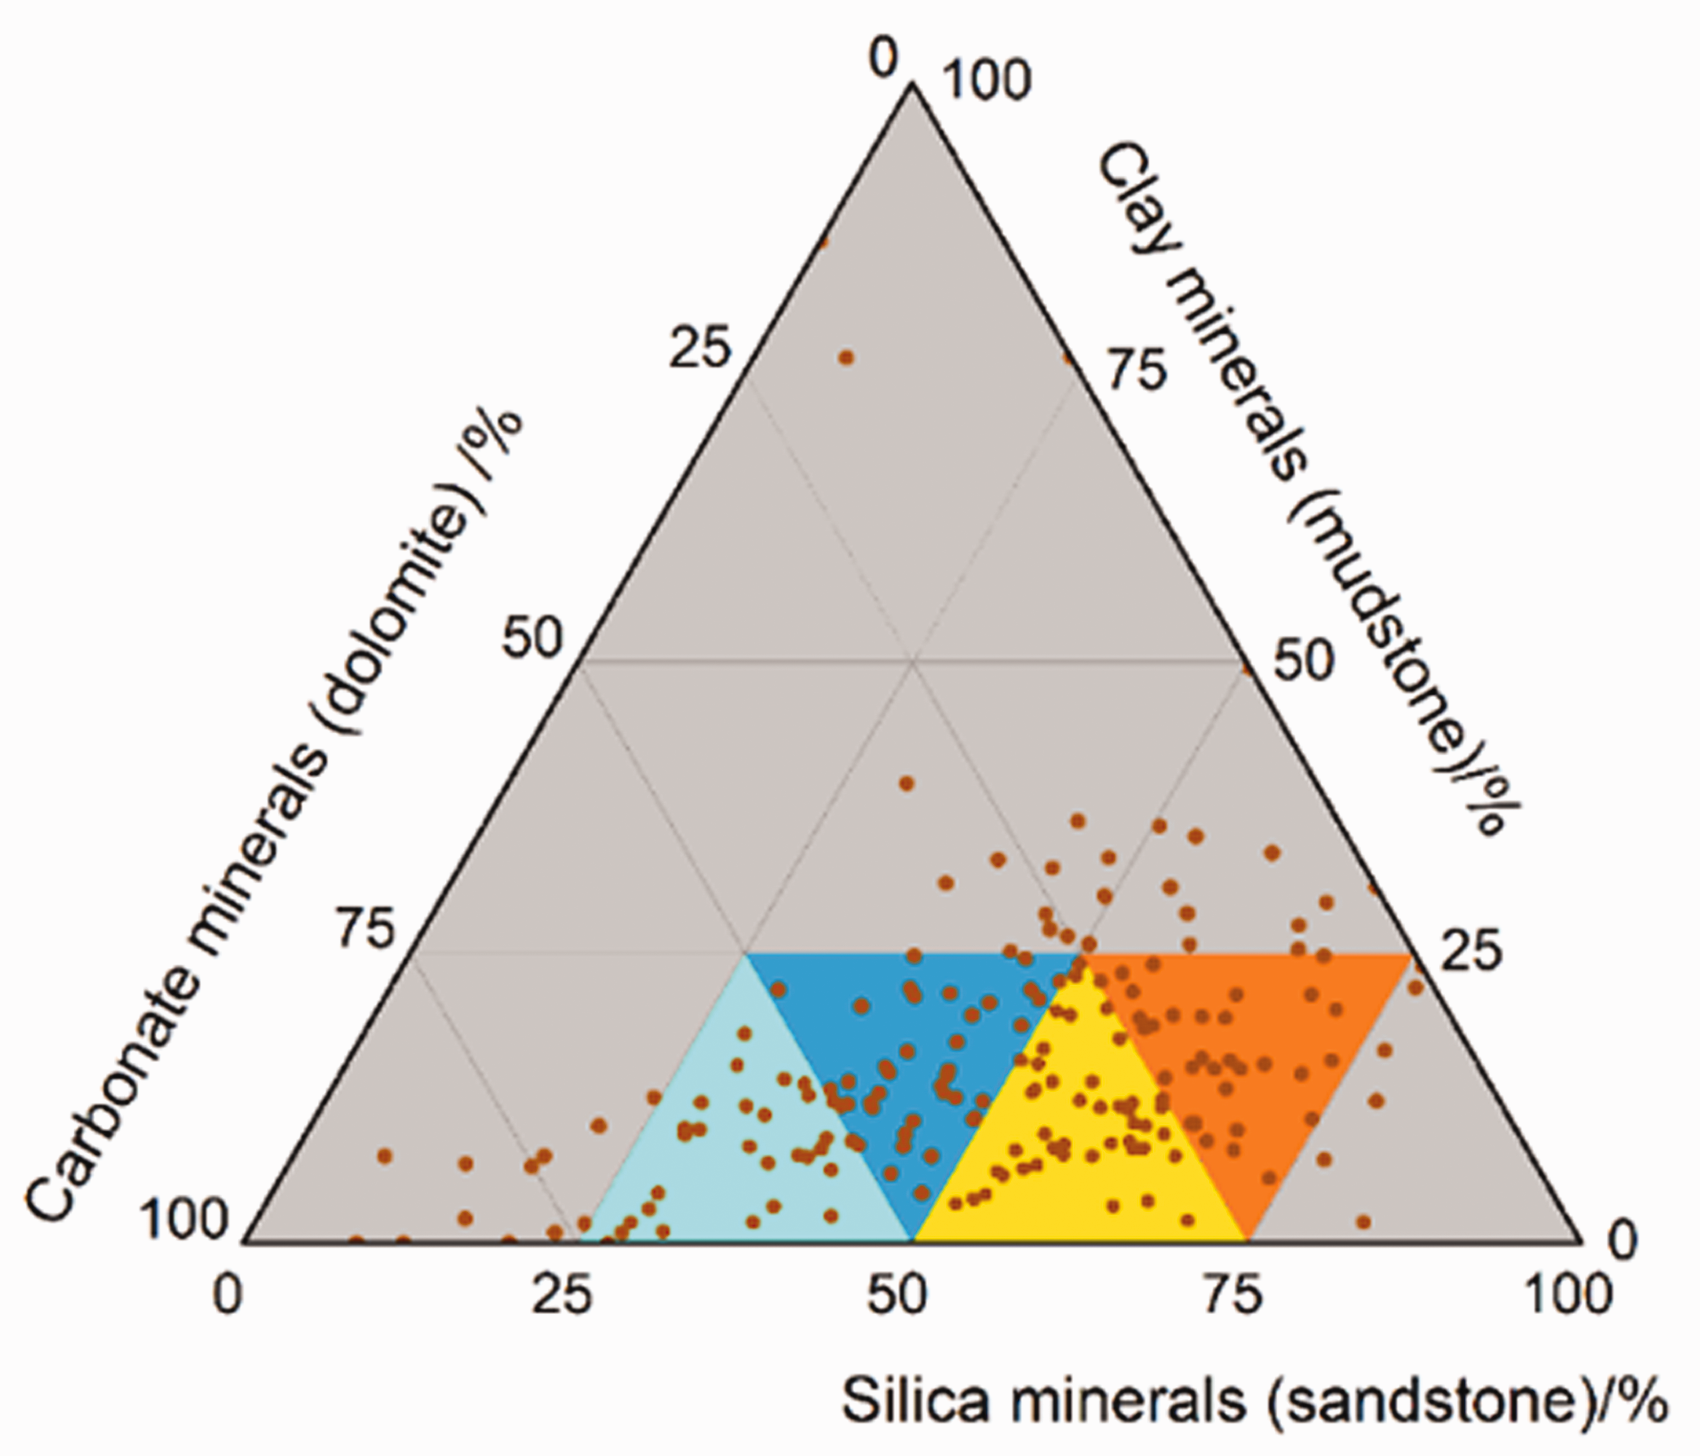
Ternary diagram of sandstone, mudstone, and carbonate.
For the sandstones and dolomites, the permeability is to some extent positively correlated with the porosity. The permeability of the sandstone exhibits a weak exponential relationship with its porosity. For the same porosity value, the sandstone has a higher permeability than the dolomite. As for the mudstone, there was no obvious correlation between its permeability and porosity, and approximately 60% of the mudstone has a porosity of less than 6% (Figure 3). The mudstone with a higher porosity and permeability is often found to have a higher silty or dolomitic content or fractures generated during core sample collection and preparation.
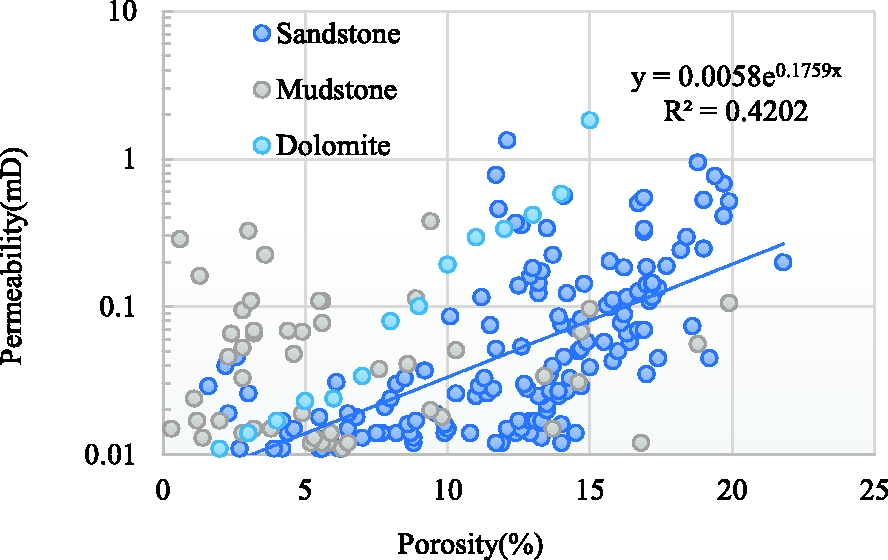
Plot of permeability vs. porosity.
The mudstone has a relatively high clay mineral content (greater than 25%). Feldspar, quartz, and dolomite are the major mineral components, with similar contents of 20.6–23.9% and an average of 21.6%.
The siltstone has a relatively high feldspar content (greater than 30%, with an average of 36.5%). its quartz content is between 10 and 34%, with an average of 16.8%. Its dolomite content is 18% on average, while the clay minerals have an average content of 13.7%.
The dolarenite has an average dolomite content of 28.6%. Its quartz content is between 10 and 30%, but the analyses of most of the samples gave a value of ∼22.8%. Its feldspar content is relatively high, with an average of 20.3%.
The sandstone and dolomite have a relatively high brittleness and lower clay contents. At the micro-scale, the local mineral distribution is extremely complex, and the brittle minerals, such as quartz and dolomite, are widely distributed, which facilitates the formation of fracture networks (Figure 4).
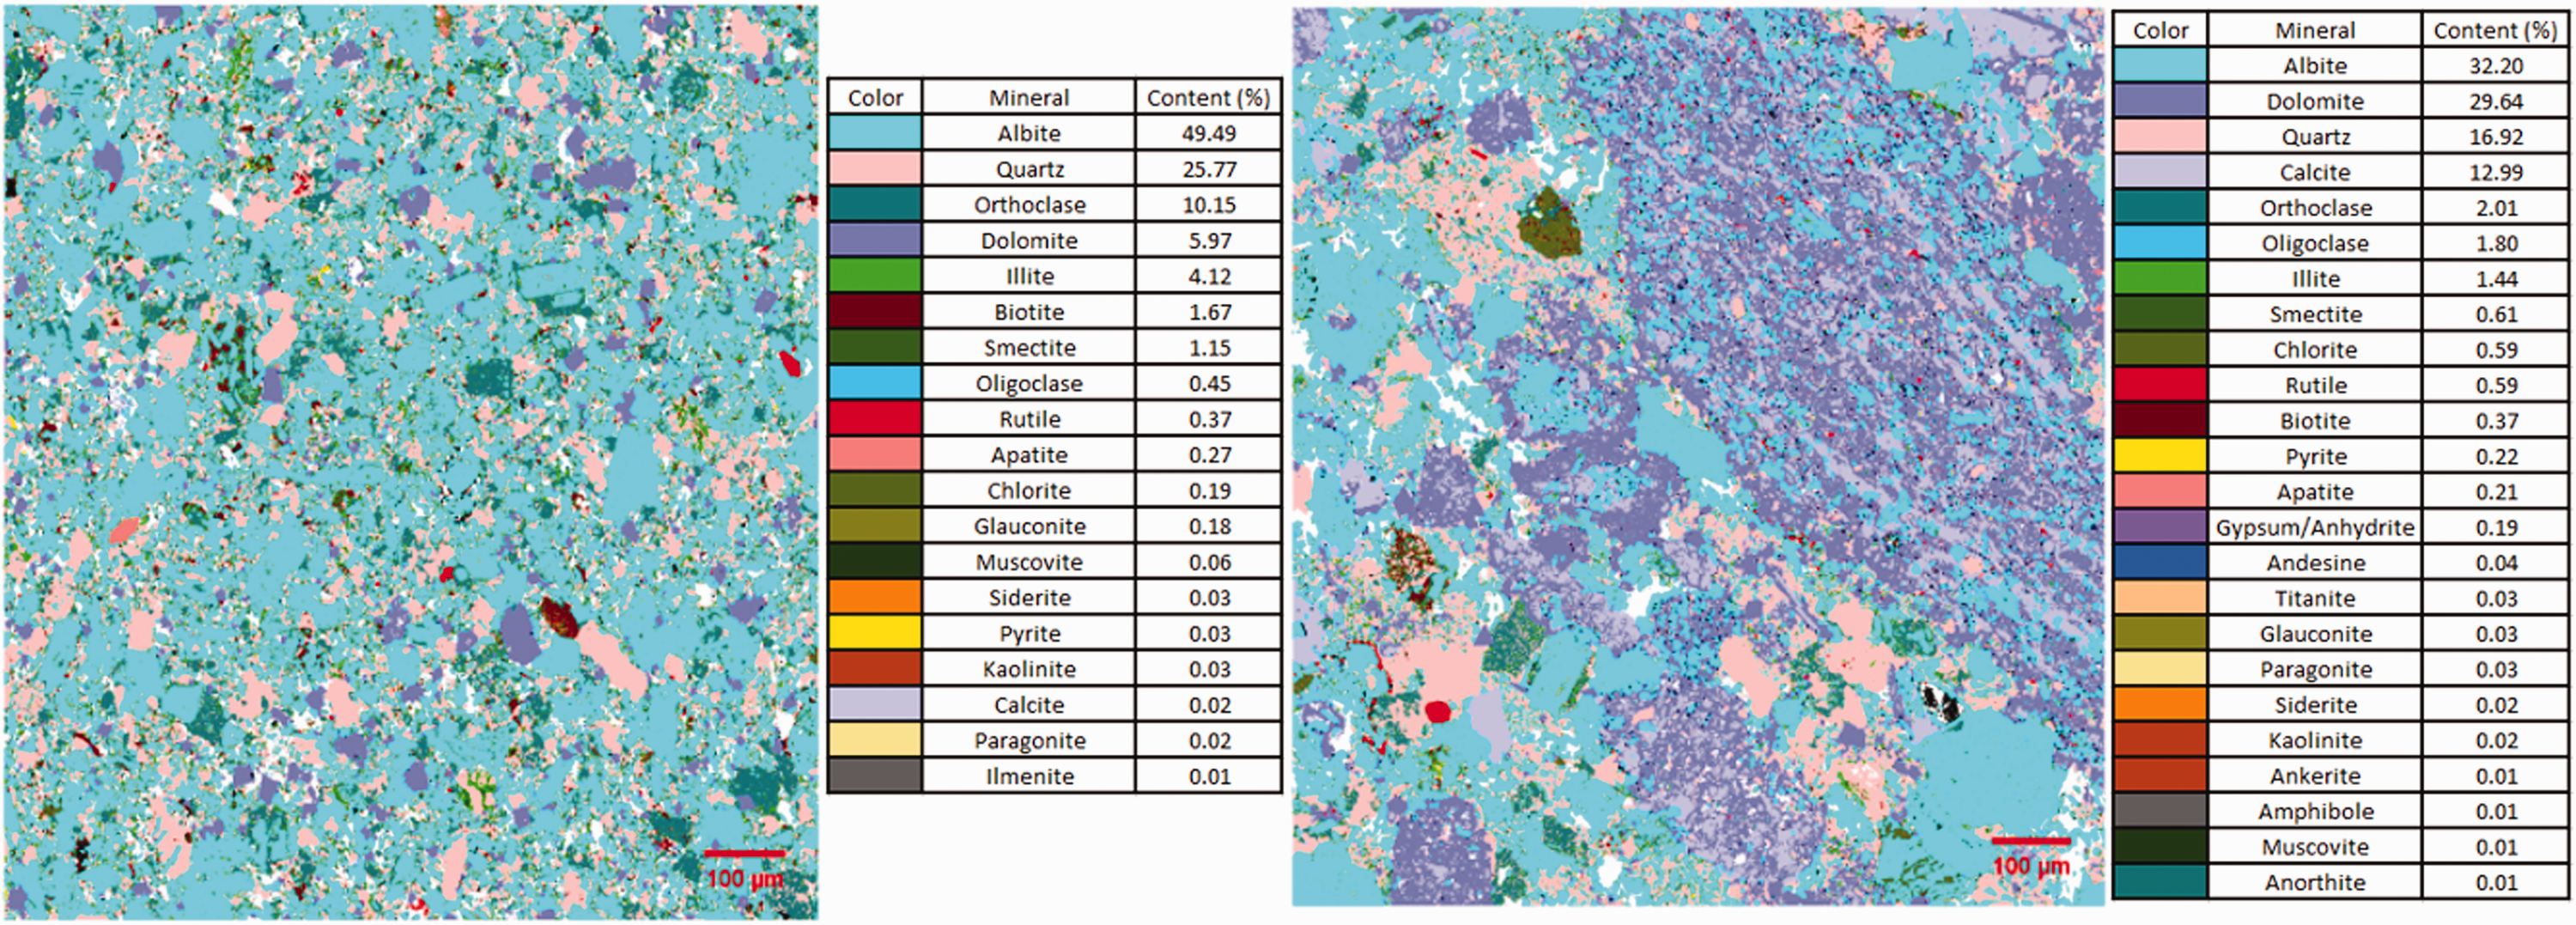
Local QEMSCAN images of the siltstone and dolarenite: (a) feldspathic sandstone; and (b) dolarenite.
Methods
Sample preparation
Before the AFM analysis, the shale oil reservoir core samples were cored to prepare thin cylindrical specimens with lengths of 5 mm and diameters of 25 mm. The end surfaces (one for testing, and the other for specimen placement) of the specimens were first treated using a fine grinding and polishing machine, then the surfaces to be scanned were polished further using 3000 mesh abrasive paper sheets, and finally, these surfaces were treated via argon ion milling to achieve maximum smoothness. Finally, the surfaces to be scanned had lower roughnesses suitable for mechanical testing.
Principles of AFM
A Jupiter XR AFM from Oxford Instruments was used to analyze the nano-scale pore structures of the shale oil reservoir samples. The Jupiter XR AFM has a scanning range of 100 µm in both the X and Y directions and a scanning range of 12 µm in the Z direction. The noise levels of its sensors are less than 150 pm in the X and Y directions and less than 35 pm in the Z direction. Tapping-mode was used for the scanning and imaging, which ensured the accuracy and reproducibility of the measurements.
In tapping mode, the cantilever is driven to mechanically oscillate by the nearby piezoelectric ceramics. Before the imaging began, the oscillation frequency was varied in a wide range to search for the natural frequency of the cantilever. Once it was found, the excitation frequency was set at or close to the natural frequency. The photoelectric detector monitors the oscillation of the cantilever, while the controller measures its amplitude and phase, and consequently, an extremely sinusoidal-like wave signal is created. When the probe approaches the surface of interest, the oscillation is modulated by the probe’s vibration and the oscillation amplitude decreases linearly. Such a Z-axis linear amplitude variation is ideal for signal transmission. If during the scanning process the scanned surface ascends abruptly, the oscillation amplitude will decrease, and the return signal will increase the Z-axis piezoelectric ceramics until the oscillation amplitude returns to the preset value. Therefore, three-dimensional morphology information can be acquired (Figure 5). In addition, the phase plot of the oscillation reflects the hardness and viscoelasticity of the tested samples.
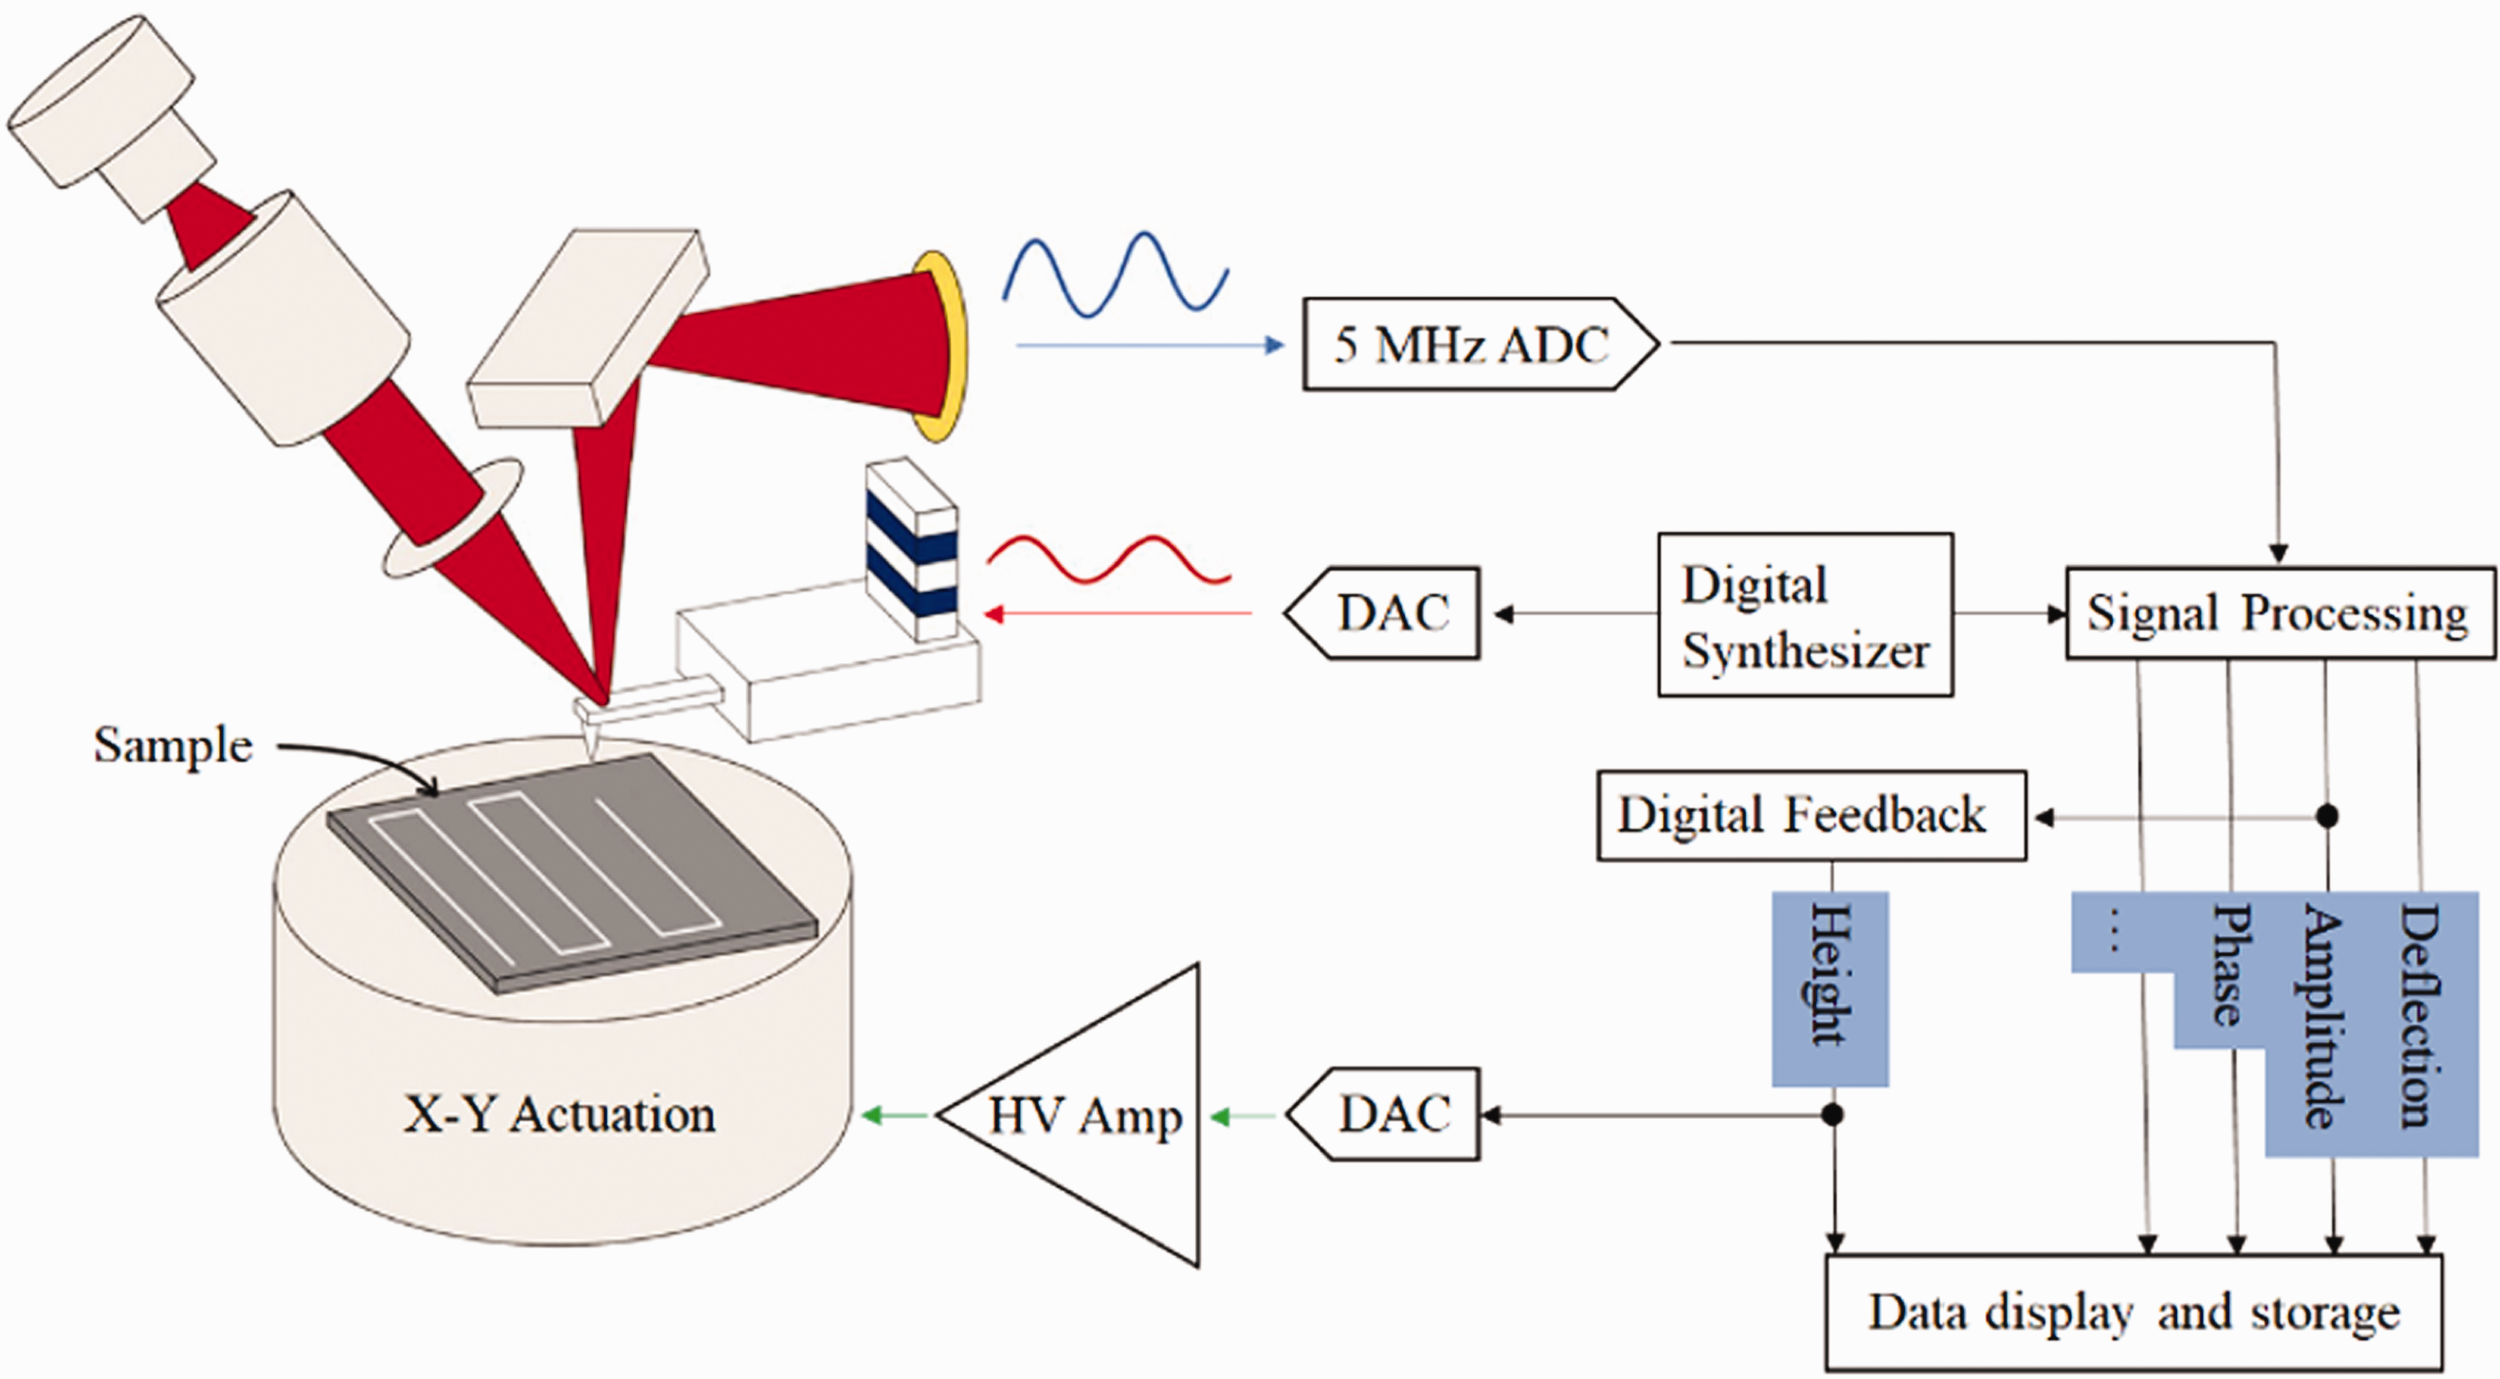
Principles of imaging under the AC air topography.
Analysis methodology
Gwyddion is a specialized open-source image processing software product that is primarily used for surface characterization and the statistical analysis of pores and crystals in AFM imaging (Butt et al., 2015). After importing the AFM images, Gwyddion uses the greyscale to identify and record the surface height field of the examined samples and calculates the surface roughness and pore structures.
Surface roughness
The nano-scale pores in coal were identified and analyzed quantitatively using the nano-scale analytics software. Cross-section analysis, facet analysis, and grain analyses were conducted on the AFM images for 512 × 512 scanning points on the samples. The structural parameters of the nano-scale pores were obtained, including the pore quantity, pore width, pore perimeter, pore length, and statistical distributions of the porosity and pore radius. It should be noted that several representative parameters of the surface roughness were determined for analysis. Gwyddion provides four parameters for users to evaluate the surface characteristics: the arithmetic average roughness (Ra), the root mean square roughness (Rq), the surface skewness (Rsk), and the kurtosis (Rku).
The surface roughness parameters include the arithmetic average roughness (Ra) and the root mean square roughness (Rq). The former is widely accepted to describe the surface roughness of porous materials. It is defined as the arithmetic mean of the absolute deviation relative to the average cross-section of a sampling length for the surface roughness
The surface skewness (Rsk) reflects the integrity of the surface roughness, and it is defined as
The kurtosis coefficient describes the shape feature of the surface height distribution. If it is equal to zero, then the surface height has a normal distribution. A positive kurtosis value indicates a peaked distribution and that the surface height values are mostly close to the mean value. A negative value means a flattened distribution and therefore a highly flattened surface. The equation for kurtosis is
Quantitative evaluation of pores
The pores must be classified and marked before quantitative evaluation. The grain analysis module in the Gwyddion software was used to mark and quantify the grains in the AFM images, and the inverted height function was used to invert the heights of the marked pores (Marsh et al., 2018). The edge detection method, Otsu’s method, segmentation method, thresholding algorithm, and watershed algorithm can all be used to mark the pore distribution, and the thresholding and watershed algorithms are the most frequently-used (Jafarzadegan and Merwade, 2017; Jiao et al., 2018; Wu et al., 2017).
The thresholding method marks the pores according to height, slope, and curvature thresholds. The results of this method are determined by the characteristics of the pores. Pores often have low height values, with their boundaries exhibiting high slope and curvature values. This is why pores can be marked using the thresholds of these properties on sample surfaces. This technique has been widely applied to the pore structure characterization of samples (Kimura et al., 2012; Nečas and Klapetek, 2012; Yazid and Arof, 2013).
For more complicated structures, the thresholding algorithm has its limitations, and thus, the watershed algorithm has been widely applied (Liu et al., 2019; Qin et al., 2018; Yang et al., 2016; Zhao et al., 2019). The watershed method is based on the principle that water always flows to a local minima, which is a pore in this context. The specific process can be described as follows. A water droplet is placed on each individual point of the sample’s surface. The water flows to the local minima. The pore diameter, surface porosity, specific surface area, and pore volume are calculated from the volume of water that converges at the local minimum, and the pores are identified accordingly.
Fast Fourier transform
The frequencies of an image are indicative of the intensity of the greyscale variation across the image, namely, the planar gradients of greyscale. Fourier transform converts an image from the spatial domain to the frequency domain, that is, from the greyscale distribution function to the frequency distribution function of the image. Its inverse transformation converts the images from the frequency domain to the spatial domain. Fourier transform produces spectral frequency images, i.e., images of the gradient distribution (Henry et al., 2020). Although the points on a spectral frequency image do not correspond to the points on the original image one by one, the brightness of the points on the Fourier spectral frequency image do reflect the contrast between the individual points and the surrounding points, namely, the gradient values. The higher the gradients are, the brighter the points are, and vice versa. If a spectral frequency image contains more dark points, the actual AFM image is smoother, and correspondingly, the sample surface has a higher homogeneity and better sorting. In contrast, if there are more bright points in a spectral frequency image, the AFM image will be sharp, with clear boundaries and a considerable disparity between the pixels beside the boundary, and the sample surface is characterized by a large heterogeneity and poor sorting.
Results
Characteristics of surface pore distribution
To quantify the nano-scale pores, first the samples were observed at a large surface area scale (500 µm × 500 µm) via optical microscopy, and then, they were scanned over a reduced area (50 µm × 50 µm) for observations.
The three-dimensional topographic map visualizes the height variations of the sample surface (Figure 6). The color scale of the mudstone has a higher contrast than those of the siltstone and dolarenite, indicating there are larger pores in the mudstone’s surface. Many cone-shaped clay minerals are present on the surface of the mudstone, and the pores are under-developed. Some large pores are present due to the presence of dolomite and silts, but fewer throats are connected to these pores. Accordingly, the mudstone generally has a poor pore connectivity. The pores in the siltstone are typically slab-shaped or wedge-shaped. They are often larger, with widths of 1–5 µm and lengths of 5–20 µm. They are also well connected and have rough surfaces. The pores in the dolarenite are mostly cylindrical or tapered, are relatively large, are well connected by numerous throats, and have rough surfaces.
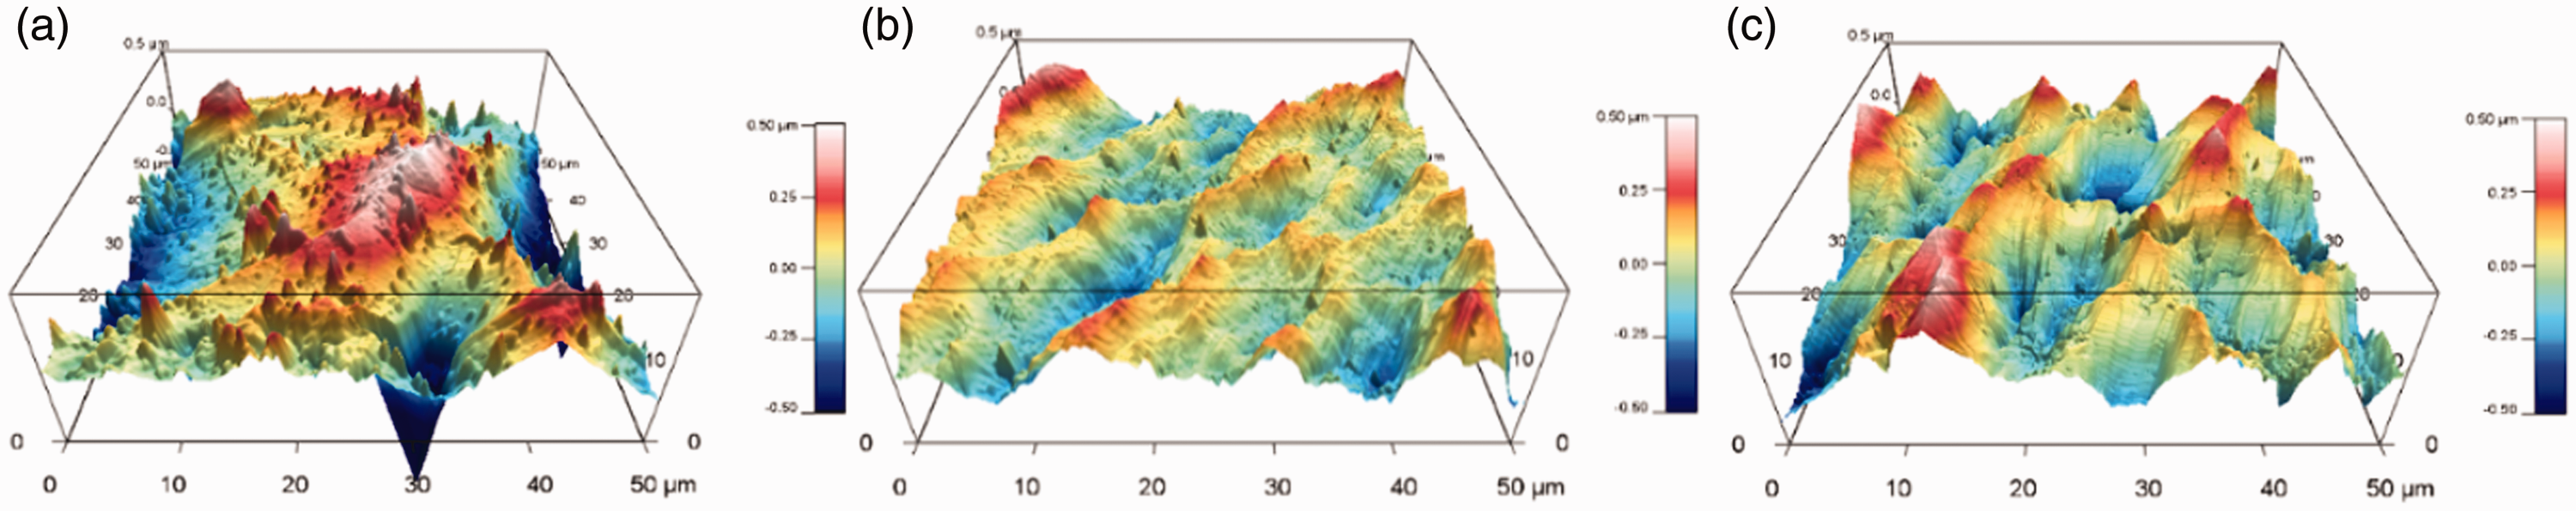
3D Topographic map of the shale oil reservoir samples of different lithologies: (a) mudstone; (b) siltstone; and (c) dolarenite.
Figure 7 shows the surface phase maps of the mudstone, siltstone, and dolarenite. The mudstone exhibits an obvious cone shape, complex pore structures, and a high fractal dimension. There are a large number of stripes with a phase of close to 0°, suggesting an abundance of soft materials (such as clay minerals and/or organic matter) that are rarely found in sandstone and dolomite. The siltstone has ridges on its surface, but the height differences are generally limited. The pores are mostly wedge or slab shaped, and the phase angles are fairly even, illustrating the homogeneity of the mineral distribution. The dolarenite contains dissolution pores, with relatively large height differences and has even phase angles, demonstrating the homogeneity of the mineral distribution.
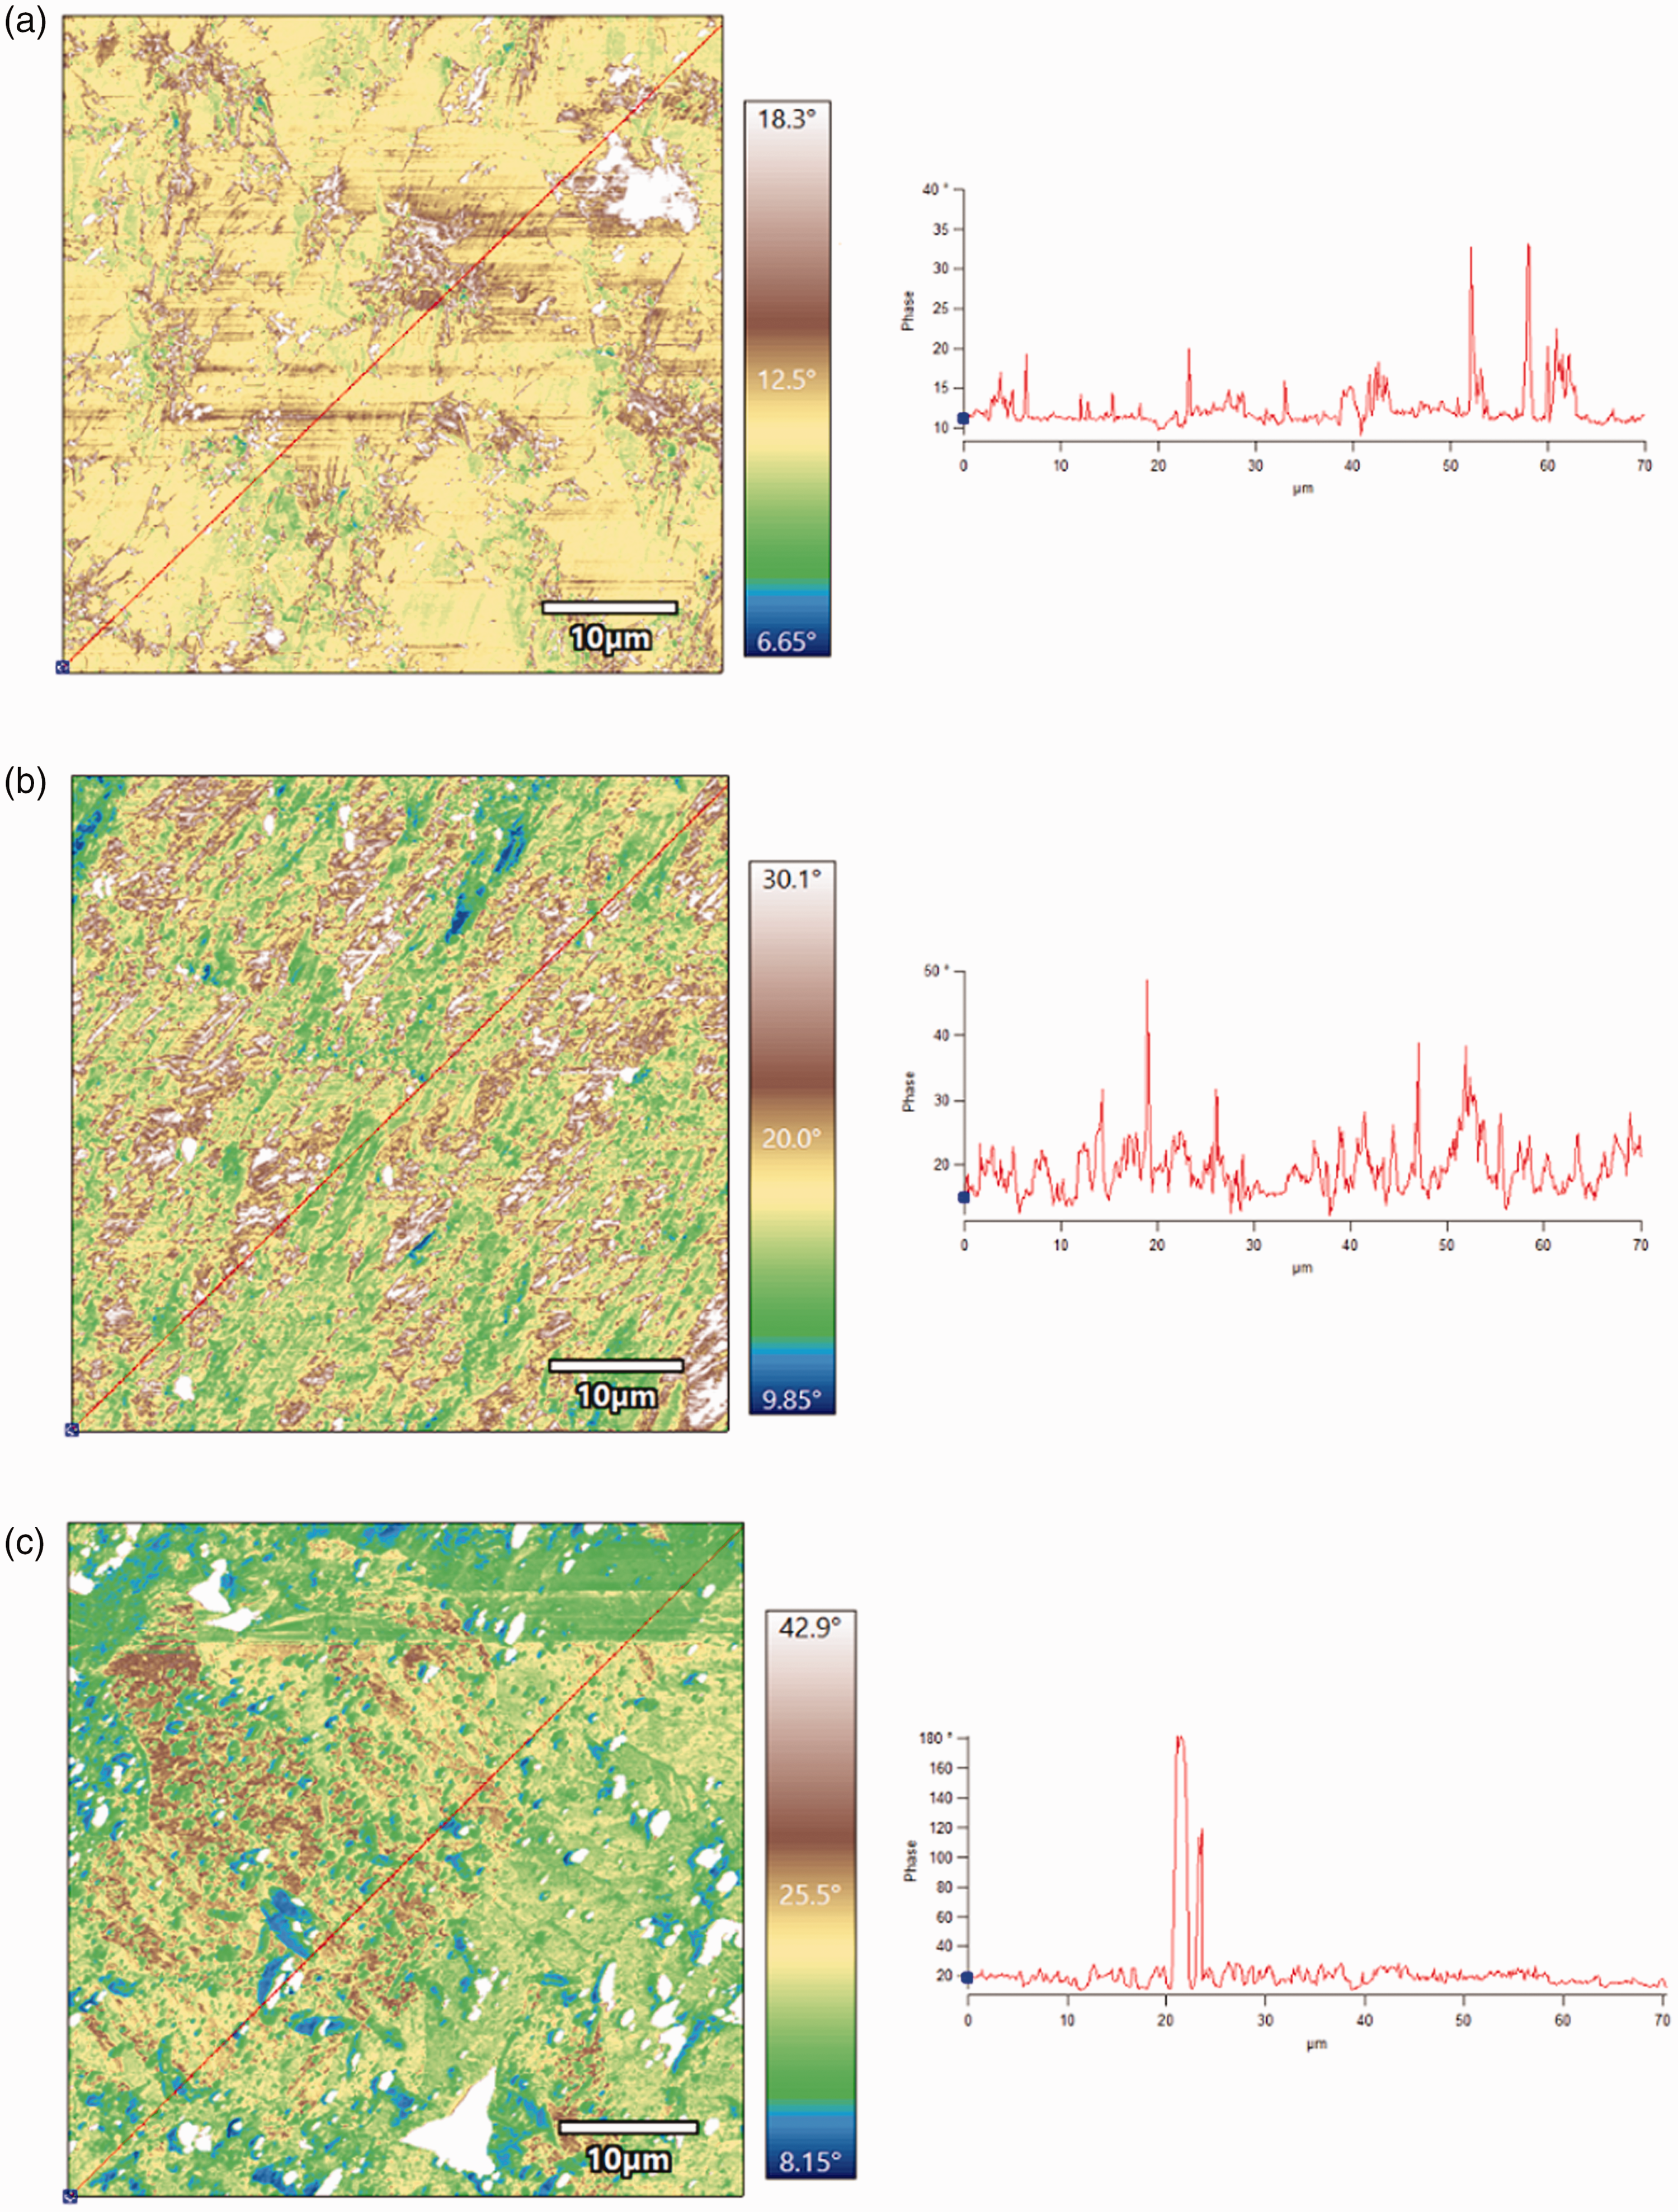
Surface phase maps of the shale oil reservoir samples of different lithologies. (a) mudstone; (b) siltstone; and (c) dolarenite.
Heterogeneity
In the 2D FFT images in the upper left insets in Figure 8, the brighter the point, the higher the greyscale gradient of the corresponding image, and vice versa. If there are more dark points in a spectral frequency image, the sample surface has a stronger homogeneity and better sorting. In contrast, if there are more bright points in the image, the sample surface is more heterogeneous and is poorly sorted. As is shown, the mudstone image has fewer bright points, and moreover, the bright points are concentrated in a circular area, thus demonstrating that the mudstone is rather homogenous and the granularity of the observed surface has a low anisotropy. The siltstone and dolarenite have more bright points in their images, and the bright areas are ovals, suggesting that the observed surfaces have higher heterogeneities and anisotropies. It can also be seen from the images that despite the larger pore widths that the pores in the mudstone are quite scattered and are rarely associated with throats, which leads to poor connectivity.
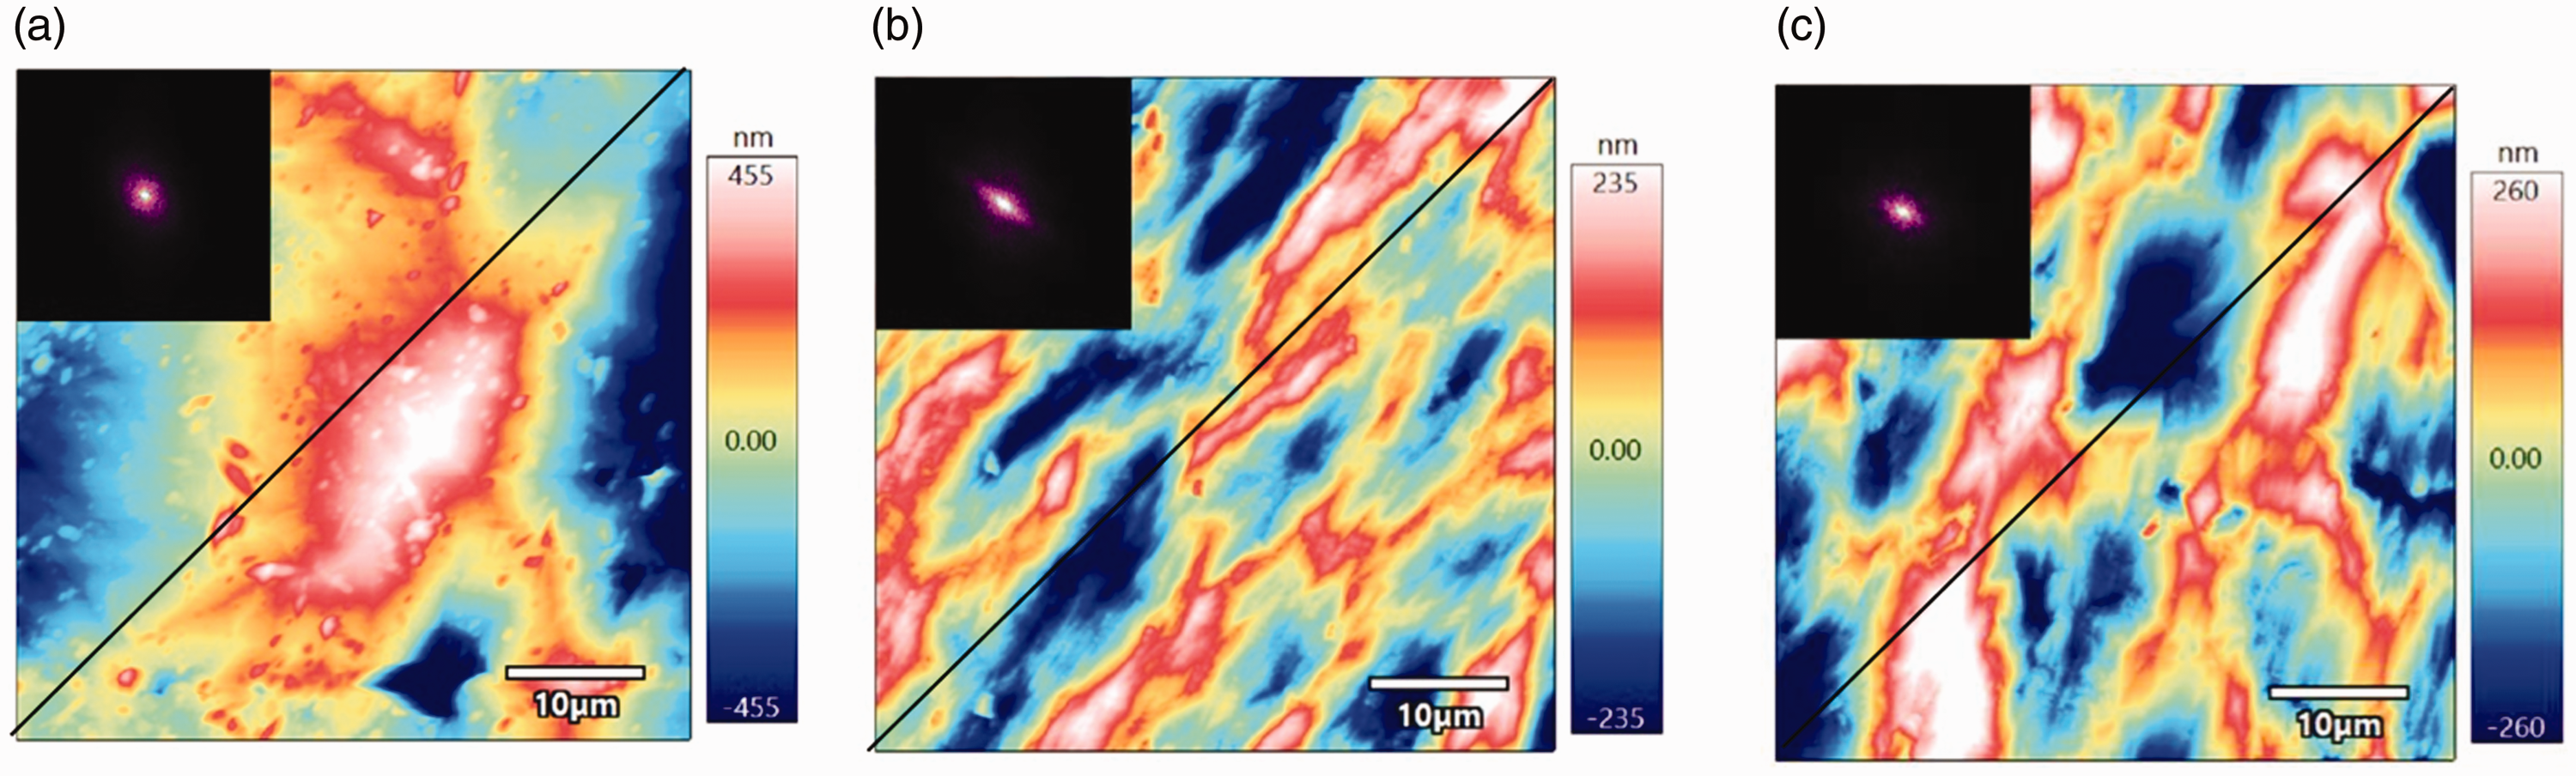
Surface morphology and 2D FFT images. (a) mudstone; (b) siltstone; and (c) dolarenite.
Figure 9 shows the surface morphologies along the diagonal direction shown in Figure 8. The resultant curves clearly illustrate the surface relief, and the valleys represent the pores.
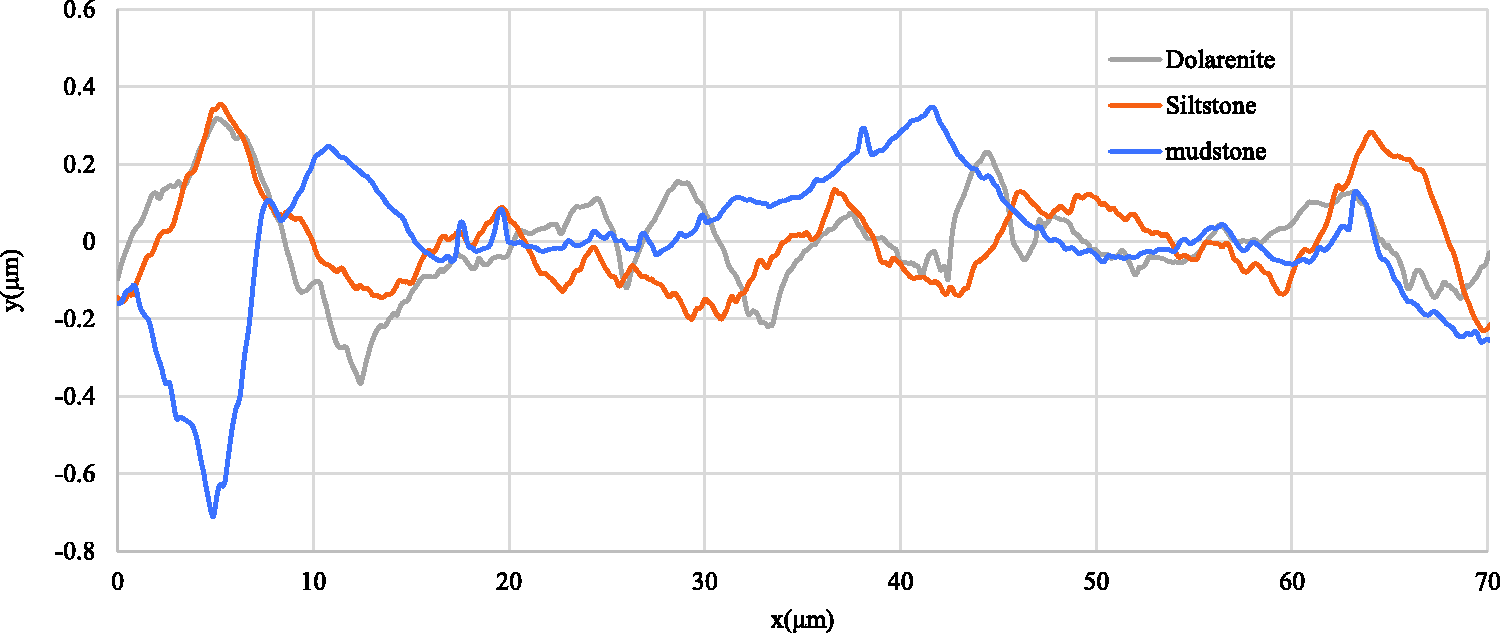
Specimen analysis along the diagonal direction.
The surface roughness reflects the complexity of the pore structure, and it can be used to analyze the force applied to the fluids by the pore surfaces. When the pore surfaces are rougher and the pore structures are more complicated, there is more resistance to fluids flowing through the pores. At the macro-scale, this corresponds to a higher rugosity and a lower permeability.
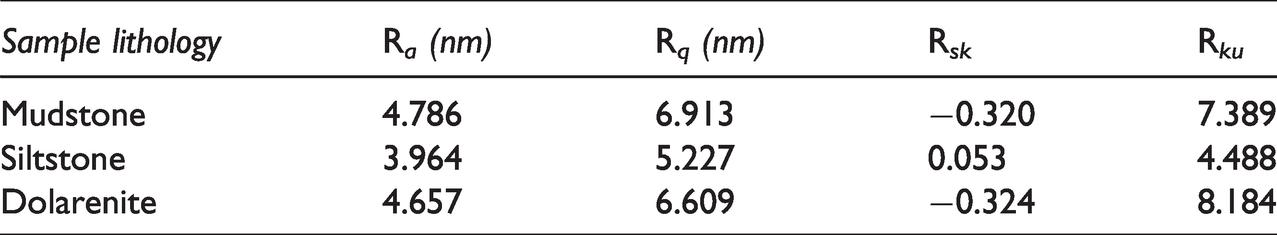
The mudstone, dolarenite, and siltstone have similar arithmetic average roughness and root mean square roughness values, with those of the mudstone being the highest and those of the siltstone being the lowest. The mudstone and dolarenite have higher Ra and Rq values than the siltstone, indicating that their surface roughnesses change more rapidly than that of the siltstone.
The clay contents of the mudstone, dolarenite, and siltstone are 16%, 13%, and 10%, respectively. For the Jimsar shale oil reservoir, the surface roughness is directly proportional to the clay content. The siltstone specimen has a positive Rsk value, meaning its surface has more valleys than peaks. The mudstone and dolarenite specimens have negative Rsk values, implying fewer valleys than peaks. The Rku values of these specimens are 4.488–8.184, suggesting relatively concentrated pore distributions (Table 1).
Statistical analysis of the surface roughness.
The mineral compositions of shale oil reservoirs are diverse; most are transitional rocks, with strong heterogeneities; and the pore shape and roughness change drastically in the planar and vertical directions. It is difficult to characterize the overall pore properties of a reservoir using only micro parameters such as pore shape and roughness. A large number of core samples must be used for statistical analysis combined with logging data. On the plane, the surface morphology information of a larger scale sample can be obtained and calculated by splicing a continuous field scanning map. Vertically, scanning results for more sample points at different depths are obtained through intensive sampling, and the changes in the surface morphology and roughness at different depths are plotted. Through the above means, the shale oil reservoir’s overall pore structure characteristics can be determined.
Pore diameter distribution
The thresholding method marks pores by setting a specific height threshold, and the areas with heights below the threshold are defined as pores. However, small pores can still exist in a surface area with height values above the threshold. When the threshold is increased to include these small pores, the previously recognized pores are assigned larger sizes. Accordingly, the thresholding method yields larger pore diameters and fewer pores than the watershed algorithm. The watershed algorithm calculates the number of pores based on the principle that water always flows to the local minima, and thus, it is more practical than the thresholding method. Given this, the watershed method was used in this paper for the pore analysis.
Figure 10 illustrates the pore distribution identified using the watershed algorithm, in which the pores are shown in red. The planar porosity parameters, such as the number of pores, the pore size distribution, the pore surface areas, and the pore volume (Table 1) were obtained via the grain statistics and grain size distribution functions. The siltstone has 595 pores; the dolarenite has 452 pores; and the mudstone has 419. The pore diameters of the siltstone are of 44–2500 nm, with an average of 1273 nm. Those of the dolarenite are 70–3960 nm, with an average of 2017 nm. The average pore size of the dolarenite is higher than that of the siltstone, but the dolarenite has fewer pores than the siltstone (Figure 11).
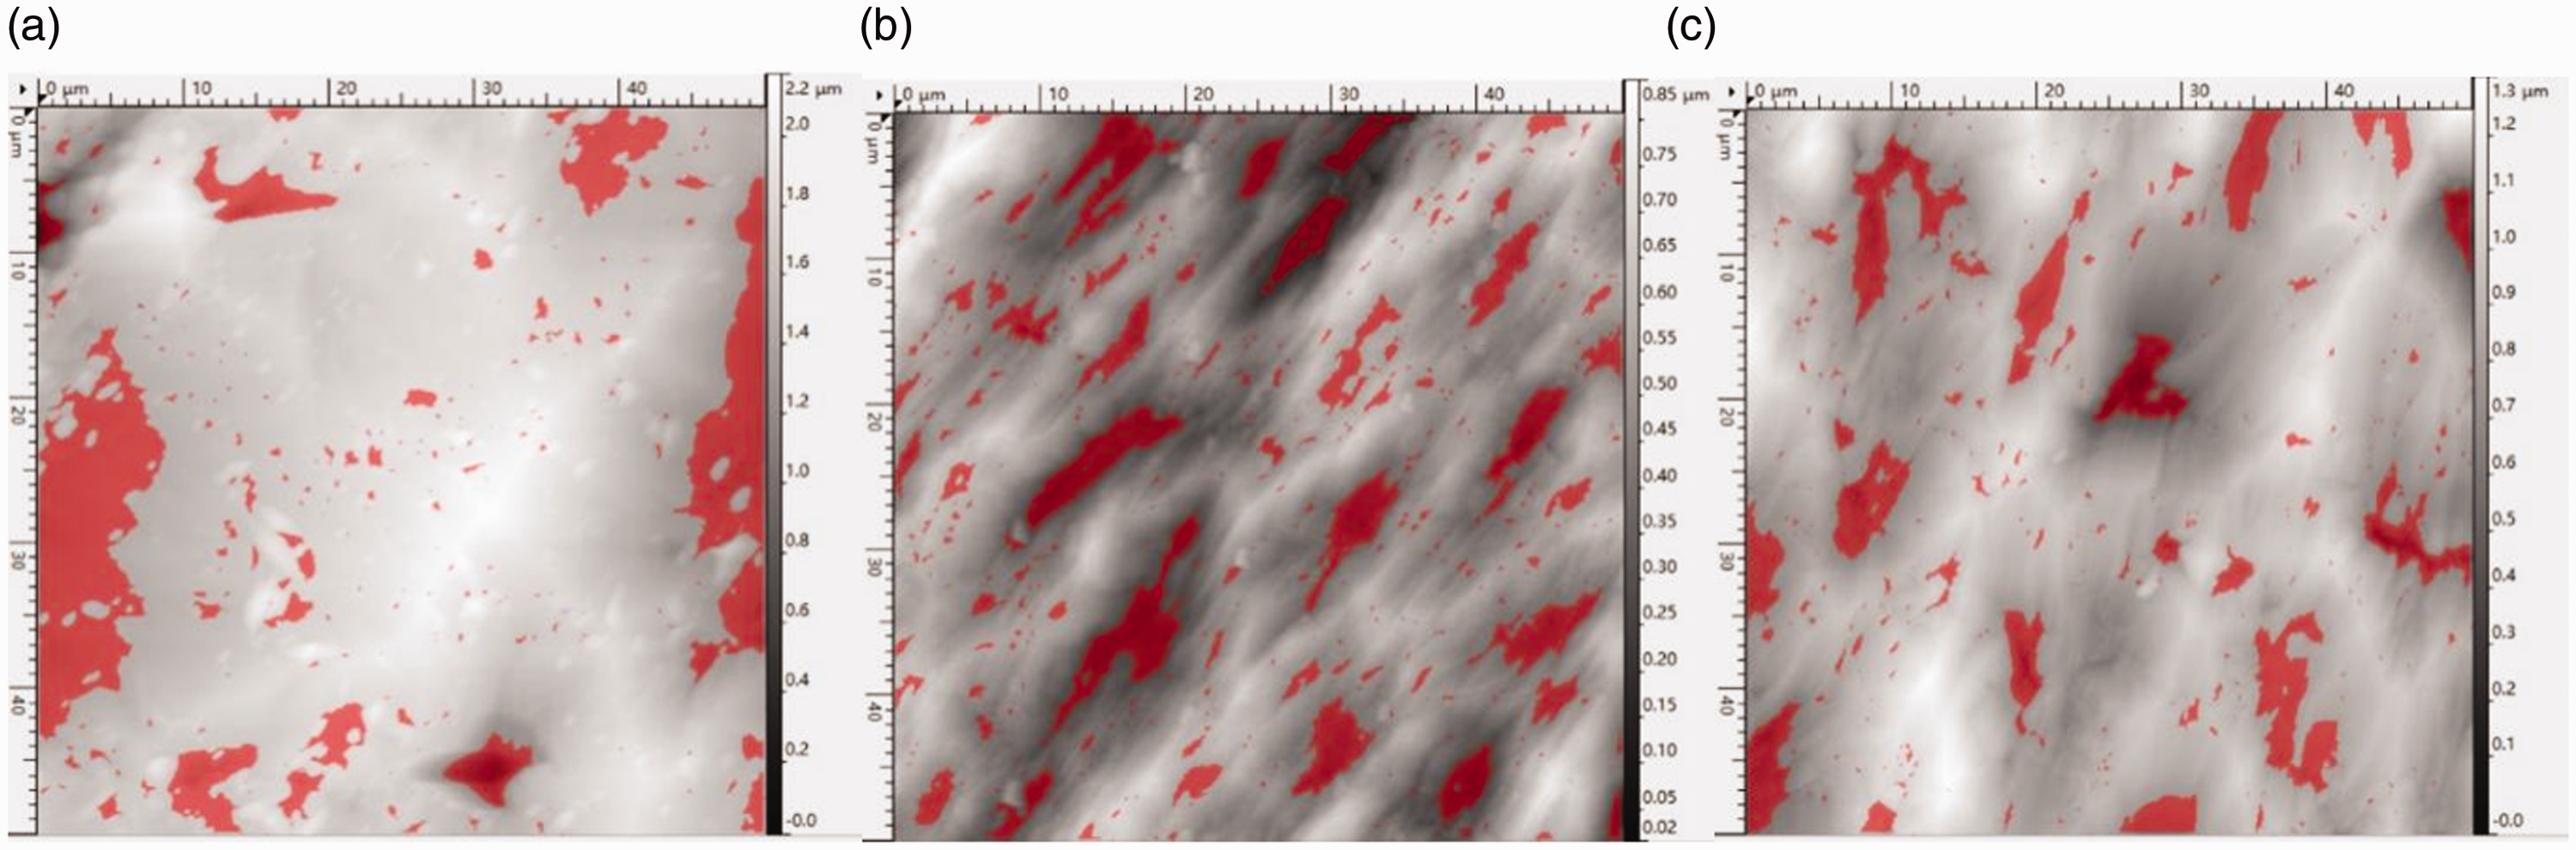
Pore identification using the watershed algorithm. (a) mudstone; (b) siltstone; and (c) dolarenite.
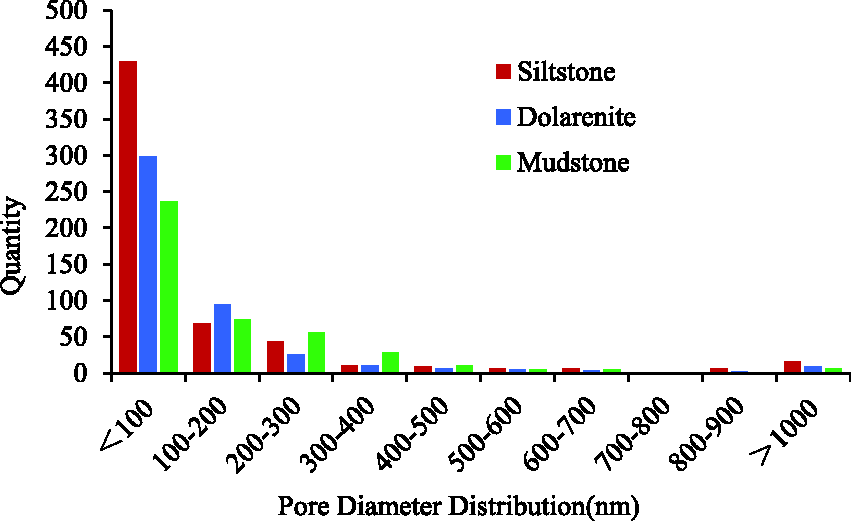
Pore diameter distribution.
Discussion
The number of pores and the pore diameter distribution were also evaluated using focused ion beam scanning electron microscopy (FIB–SEM), and the results were compared with those of the AFM analysis.
Figure 12 shows the reconstructed pore images of the mudstone, siltstone, and dolarenite. The pores in the mudstone are scattered, and they are mostly intergranular pores in the quartz minerals dispersed among the clay minerals and calcite and dolomite dissolution pores. The siltstone generally contains intergranular pores with lengths of less than 1.5 µm, which are often slab shaped or wedge shaped. Ellipsoid pores were also observed in the siltstone, and they are smaller than the slab-shaped pores. The dolarenite has a higher dolomite content; its pores are primarily ellipsoid rather than slab-shaped; and the majority of the pores are dissolution pores. These observations are similar to the conclusions obtained from the AFM analysis (Figures 6, 8, and 10).
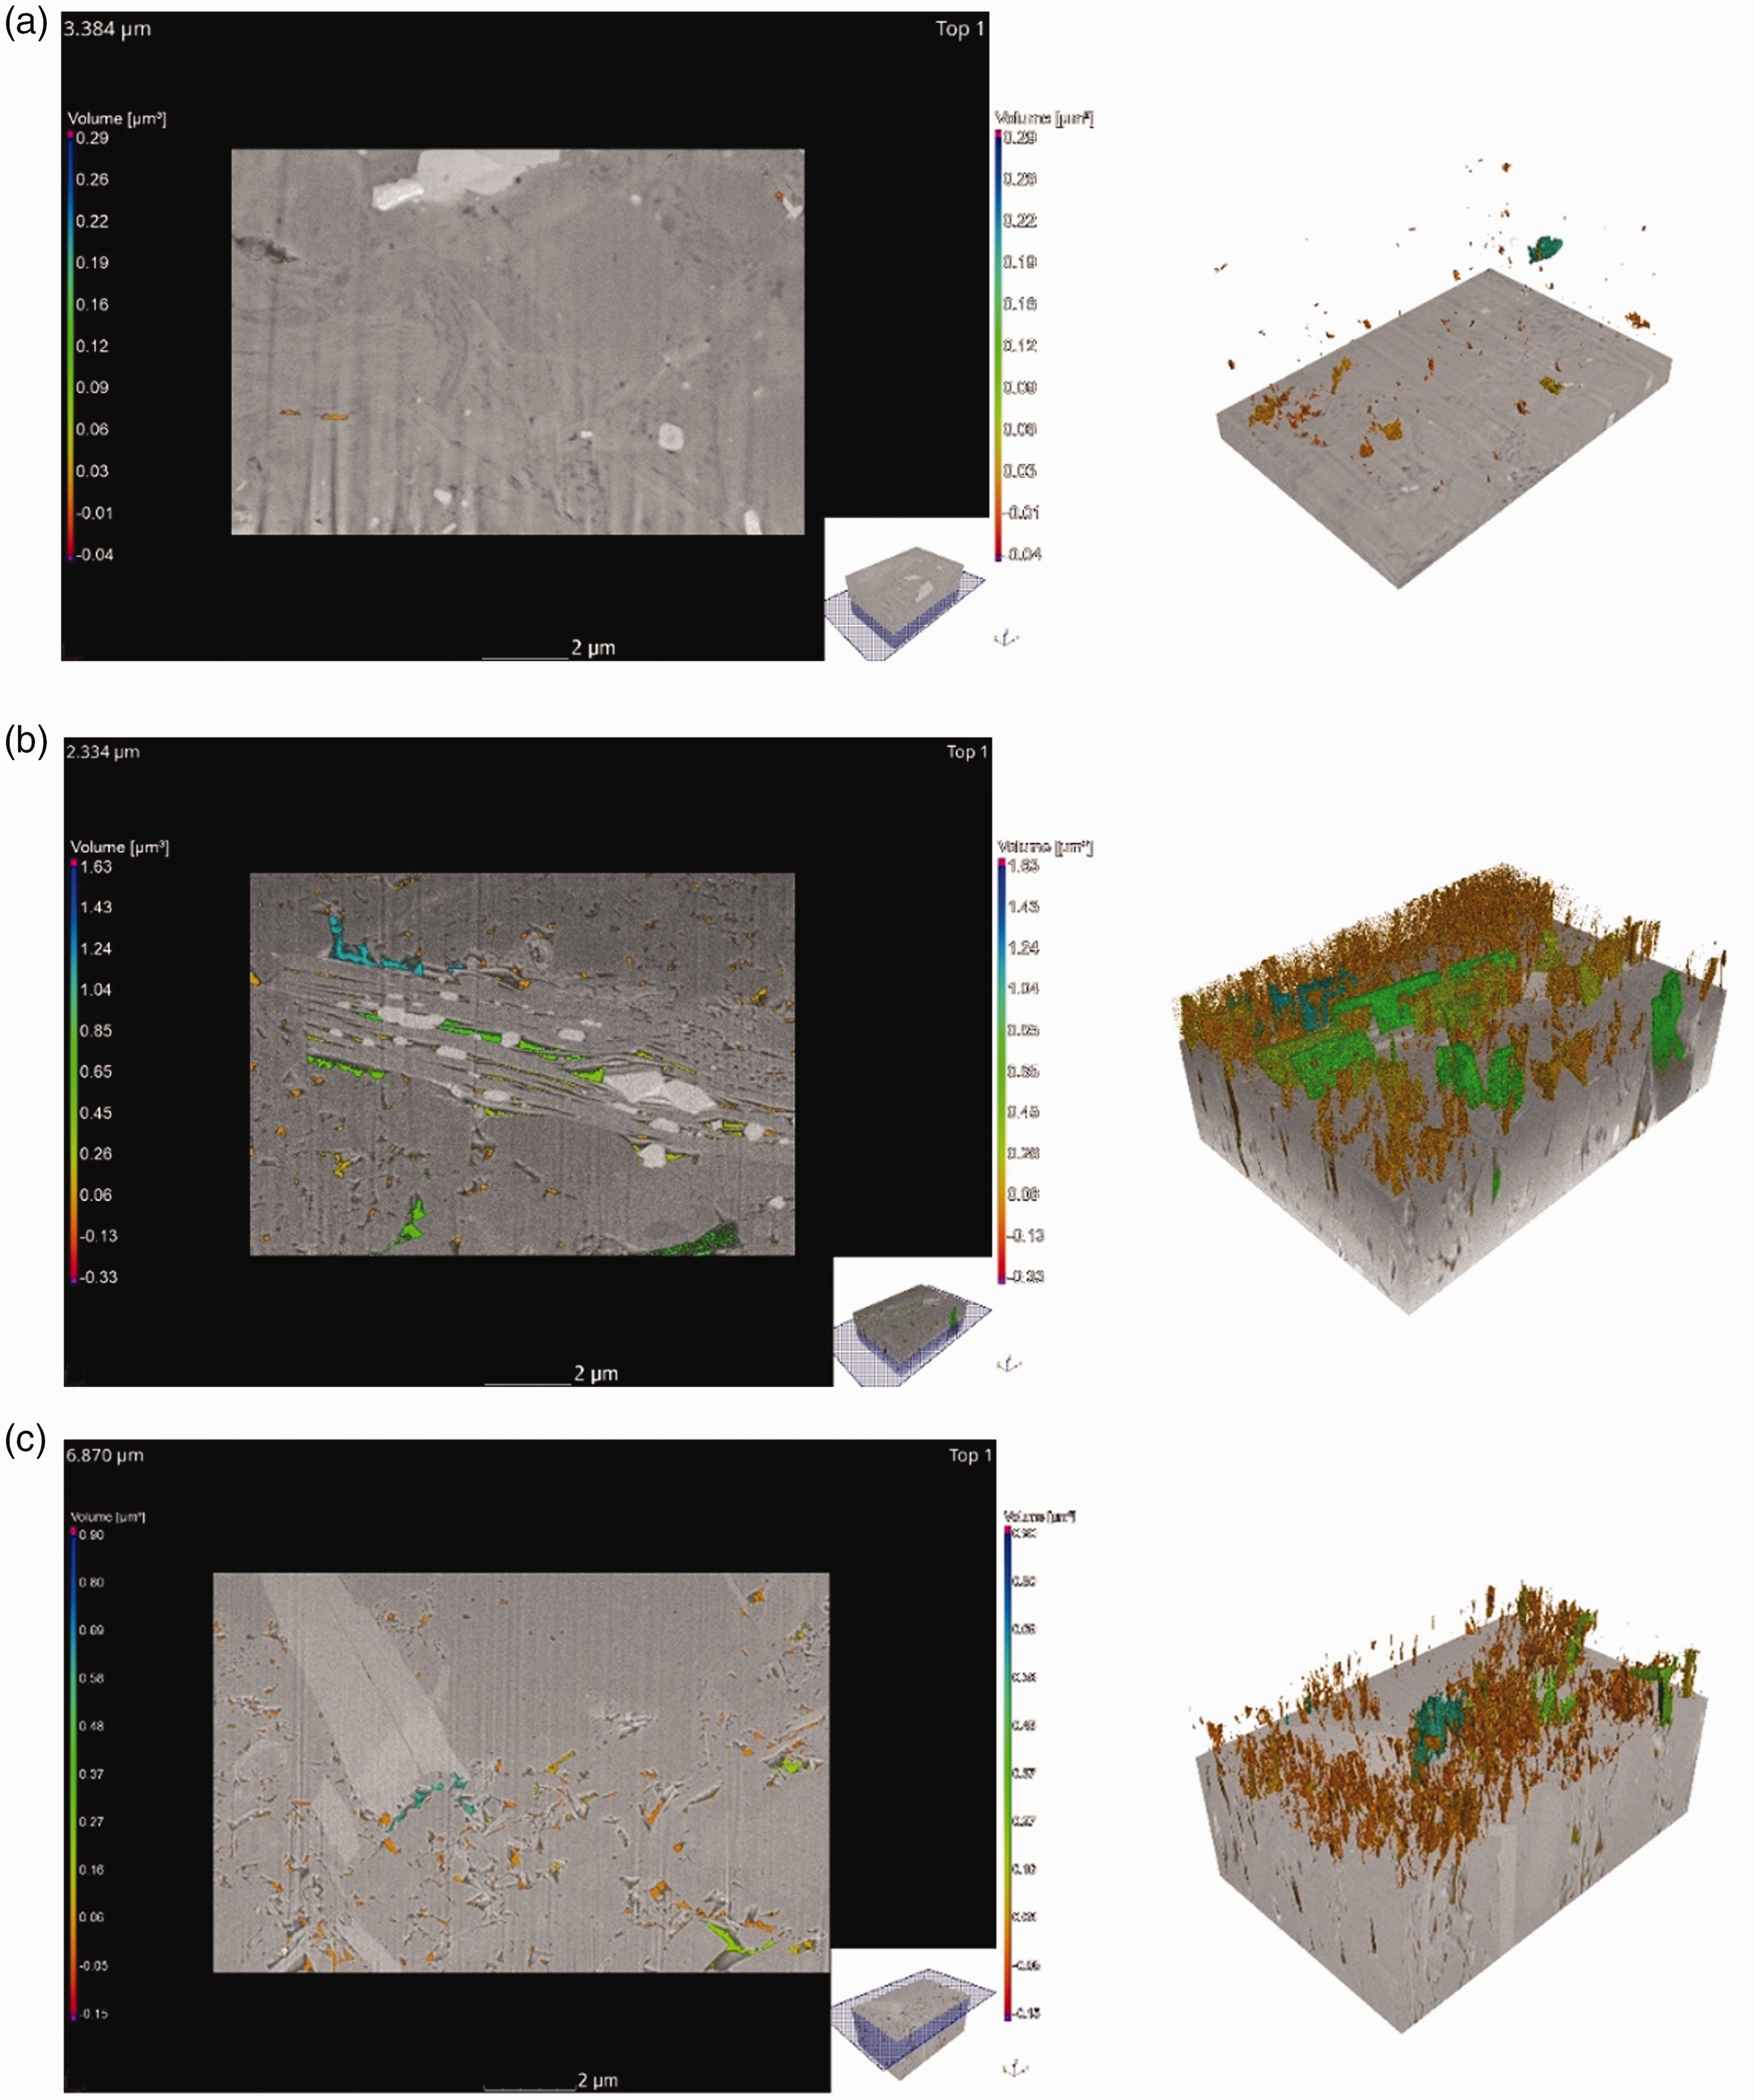
Top view and 3D view of the pore reconstruction models constructed using FIB–SEM: (a) mudstone; (b) siltstone; and (c) dolarenite.
Figure 13 shows the proportions of the pores with different diameter ranges in the total pore quantity for the mudstone, siltstone, and dolarenite, which were calculated via both FIB–SEM and AFM. Both methods confirm that the majority of the pores are nano-pores (diameter < 100 nm). Moreover, the proportions of the nano-scale pores measured via FIB–SEM are higher than those measured via AFM. The differences between the results of these two methods are larger for the mudstone and siltstone and are much smaller for the dolarenite. This disparity is probably related to the pore shapes and the pore identification algorithms used. In general, it is safe to say that the pore diameters detected via AFM are consistent with those detected via FIB–SEM. The 2D and 3D pore reconstructions of the shale oil reservoir are valid and can be used to identify the pore structures, surface morphologies, and roughness.
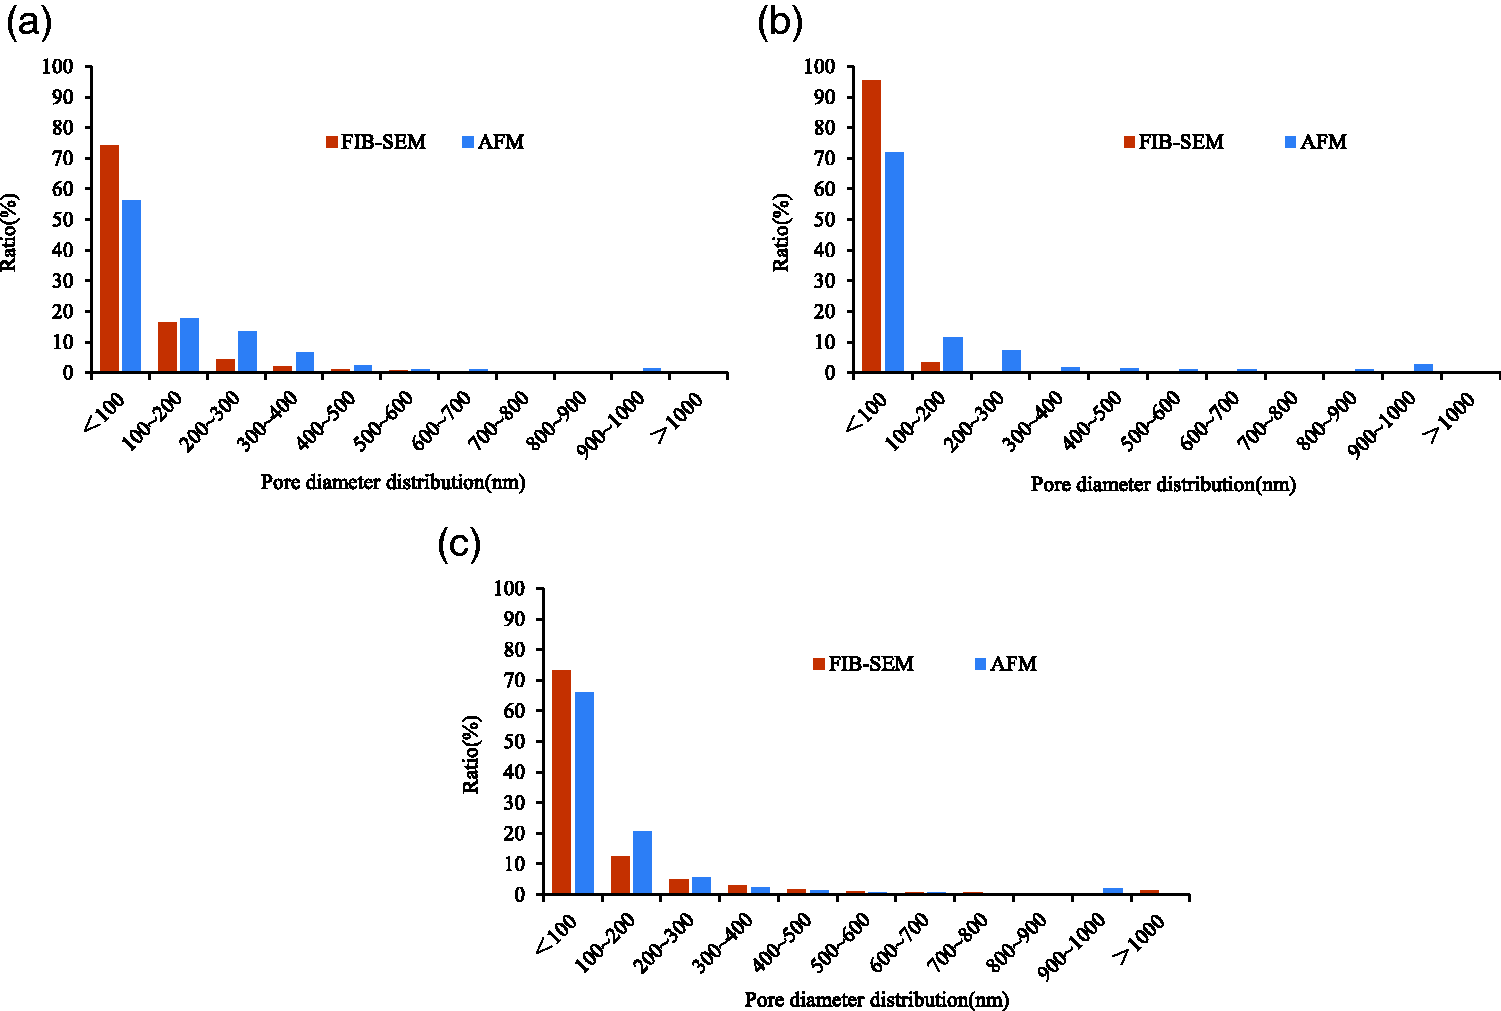
Pore diameter distributions obtained via AFM and FIB-SEM: (a) mudstone; (b) siltstone; and (c) dolarenite.
Conclusions
The surface morphology and pore structure distributions can be reconstructed for core samples of different lithologies from a broad-sense shale oil reservoir. The surface roughness can be measured and exhibited in 2D and 3D. The distribution of the components with various hardness values can also be qualitatively estimated using phase maps. The Gwyddion software can effectively describe the pore structure distribution, calculate the pore quantity and pore diameter distribution, and capture the topography and pore occurrence of a specific cross section. The heterogeneity can also be analyzed for an image using the FFT algorithm. Pores with diameters of 0.001–1 µm can be identified by the watershed algorithm, and the results can be verified via SEM. In the Jimsar shale oil reservoir, the siltstone contains slit-shaped or wedge-shaped intergranular pores; and the arenaceous dolomite contains intergranular pores and intragranular dissolution pores. They are the diagenetic facies of a high-quality reservoir. Therefore, a small layer with a larger thickness of siltstone or arenaceous dolomite in a dessert should be selected as the target of a horizontal well.
Footnotes
Declaration of conflicting interests
The author(s) declared no potential conflicts of interest with respect to the research, authorship, and/or publication of this article.
Funding
The author(s) disclosed receipt of the following financial support for the research, authorship, and/or publication of this article: This paper is supported by National Major Research Program for Science and Technology of China (Grant No. 2017ZX05037-001) and Research Fund for Basic Research and Strategic Reserve Technology of Institutes Directly under CNPC (Grant No. 2018D-500806).