
Abstract
Overpressure is one of the most important factors for oil and gas charging in petroliferous basins. Research on overpressure evolution and its formation mechanisms is of great significance for predicting formation pressures in oil and gas reservoirs before drilling. However, research methods addressing overpressure evolution are not without issues. Based on the measured formation pressures and fluid inclusions, the evolution of the formation pressures in the Xujiahe Formation in the northeast part of the Sichuan Basin was investigated by PVT and basin simulations and the causes of overpressure were also analyzed. The results show that overpressure in the continental strata began to develop at the bottom of the Middle Jurassic Shaximiao Formation. The pressure coefficients of the Upper Triassic Xujiahe Formation range from 1.01 to 1.90, and belong to the normal pressure and overpressure regimes. The present-day overpressure of the Xujiahe Formation is mainly caused by hydrocarbon generation and tectonic compression. The tight reservoirs are conducive to the formation and preservation of overpressure. The pressures in the Xujiahe Formation experienced two evolution processes, namely an “increase-decrease-increase” (eastern area) process and an “increase-decrease” (western area) process. Overpressure began to develop in the Middle Jurassic(J2) period. Due to the hydrocarbon generation taking place, the formation pressures increased rapidly from the Middle Jurassic(J2) period to the early Late Cretaceous (the early part of K2) period. The degree of development of overpressure in the western part of the study area was greater than that in the eastern part of the study during the critical charging period (J3–K1). Since the early Late Cretaceous, the formation pressure has gradually decreased due to tectonic uplift and erosion. From the Oligocene (E3) period to the present, the formation pressures have increased again in local areas due to tectonic compression.
Keywords
Introduction
There are approximately 180 sedimentary basins worldwide with abnormal pressures (Hartmann et al., 2000; Hunt, 1990). These abnormal pressures are the main mechanism for hydrocarbon migration and accumulation in both conventional and unconventional reservoirs (Su et al., 2019), and they control the oil and gas distributions (Guo et al., 2016; Hao, 2005; Sathar and Jones, 2016).
How to accurately and quantitatively reconstruct paleo-pressures has always been a tricky issue in formation pressure studies (Aplin et al., 1999; Liu et al., 2003; Mi et al., 2004; Thiéry et al., 2000). At present, the methods used to reconstruct paleo-pressures have mainly included basin simulations (Liu et al., 2010), PVT simulations (Aplin et al., 1999), PIT (Thiéry et al., 2000), and salinity-homogenization temperatures (Zhang and Frantz, 1987), etc. Among these methods, PVT and basin simulations are widely applied. Software such as PVTsim, PIT, and PetroMod have been widely used in the reconstructions of paleo-pressures (Liu et al., 2003, 2019; Ping et al., 2017; Thiéry et al., 2000).
Many mechanisms for explaining the development of overpressure in sedimentary basins have been put forward (Osborne and Swarbrick, 1997), which can be categorized into undercompaction, fluid expansion (such as hydrocarbon generation), tectonic compression, diagenesis, and pressure transmission (Bowers, 2002; Osborne and Swarbrick, 1997; Tingay et al., 2013). Two of the most common mechanisms for generating large-scale overpressure conditions are undercompaction and fluid expansion (Guo et al., 2010; Tingay et al., 2009, 2013). Some methods to identify the mechanisms of abnormally high pressure have been developed (Hermanrud et al., 1998; Teige et al., 1999; Tingay et al., 2009). Bowers (2001) developed the loading-unloading curve to determine the mechanisms of overpressure formation, which is based on the fundamental rule that the responses of logging parameters are closely related to different mechanisms of overpressure formation; this method has been applied widely and has even seen further development (Guo et al., 2010; Tingay et al., 2007, 2009, 2013).
The Upper Triassic Xujiahe Formation, in the northeast of part of the Sichuan Basin, has favorable exploration prospects. However, the evolution processes of paleo-pressures and their generating mechanisms have not to date been sufficiently determined, thus restricting exploration for natural gas resources and evaluations of drilling safety. This paper aims to reconstruct paleo-pressures for different periods by PVT and basin simulations and to investigate the formation mechanisms of overpressure in the reservoirs of the Xujiahe Formation, which can be used to clarify the migration process for natural gas as well as the enrichment regularity. In this study, we aim to provide a reference for natural gas exploration and predictions of formation pressures.
Geological setting
The Sichuan Basin, located in the southwest part of China, is a superimposed basin that developed on the Upper Yangtze Craton (Wang et al., 2014, 2019). The western part of the northeastern Sichuan Basin is the Longmenshan tectonic belt, the northern part is the Micangshan uplift tectonic belt, and the eastern part is the Dabashan thrust-nappe belt (Figure 1(a)) (Tang et al., 2008; Yang et al., 2013). The tectonic units in the study area can be divided into the Tongnanba anticline, Tongjiang depression, Jiudongshan anticline, Chixi depression, and Cangxi-Bazhong low-lying tectonic belt (Figure 1(b)) (Li et al., 2015; Wu et al., 2019; Zhong et al., 2019).
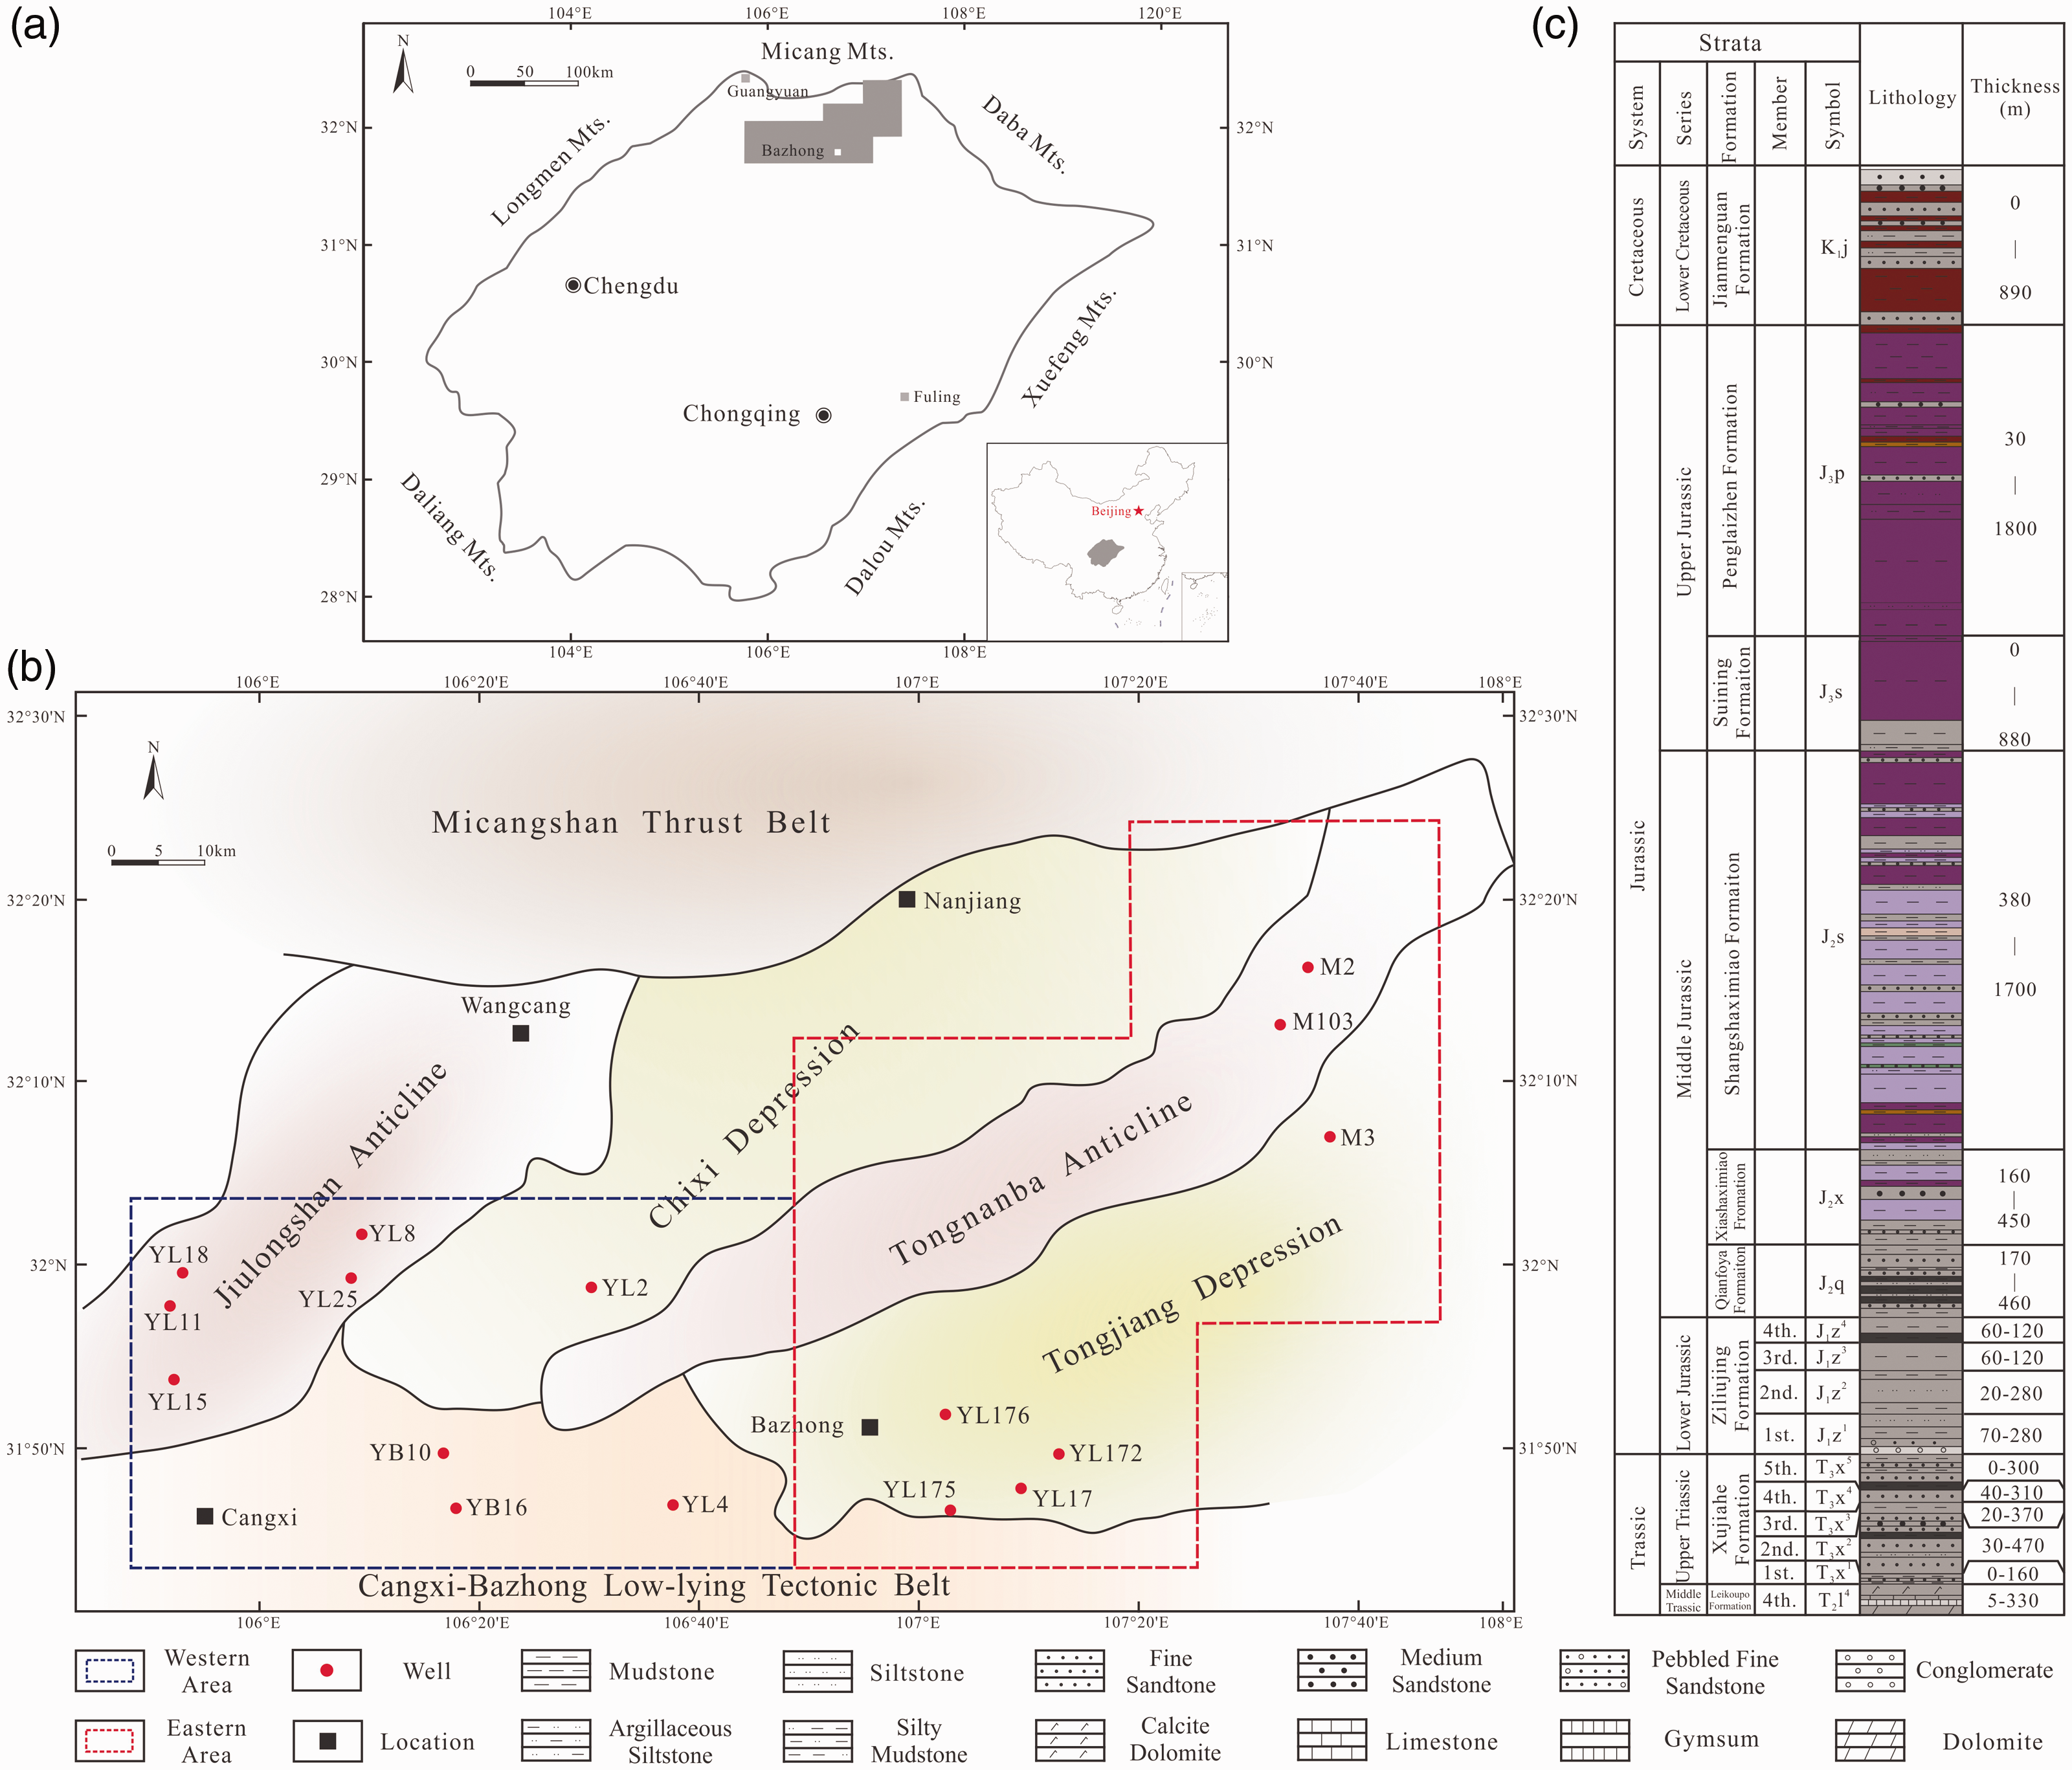
Regional location (a), tectonic units (b), and continental strata (c) in the northeast part of the Sichuan Basin.
The Xujiahe Formation (T3x) was deposited in the Late Triassic (T3) and the strata were buried rapidly from the Late Triassic to the Early Cretaceous (T3–K1) period with maximum burial depths of more than 6,000 m (Zeng, 2010). From the Late Cretaceous (K2) to the present, the strata underwent tectonic compression and uplift denudation in the Late Indosinian, Yanshanian, and Himalayan periods (Li et al., 2012; Shen et al., 2009). At present, the burial depth of the Xujiahe Formation is more than 3,500 m. Tectonic movements in the Himalayan period caused the eastern part of the study area to be strongly uplifted, which resulted in a large number of faults and densely developed fractures (Li, 2016). The tectonic compression in the western part of the study area was relatively weak, and the scale of the faults and fractures is relatively more developed in the eastern part of the study area (Liu et al., 2014).
The braided river-delta facies and coastal shallow-lake facies were the main sedimentary systems in the Xujiahe Formation (Lai et al., 2017, 2018) and are divided into five sections (T3x1–T3x5) (from bottom to top) (Figure 1(c)). Among these, the first, third, and fifth members of the Xujiahe Formation represent the main source rocks, whose lithologies are mainly dark mudstone and carbonaceous mudstone, while coal rocks exist only in local sections (Zhang et al., 2009; Zhao et al., 2011). The type of organic matter is mainly II2–III, which is in a stage of high overmaturity (Bian et al., 2015; Wang et al., 2013). The second and the fourth members are the main reservoirs, whose lithologies are dominated by lithic sandstone and feldspar lithic sandstone (Figure 2), which experienced strong compaction and cementation, resulting in the abnormally tight reservoirs (Liu and Liu, 2018; Zhang et al., 2016).
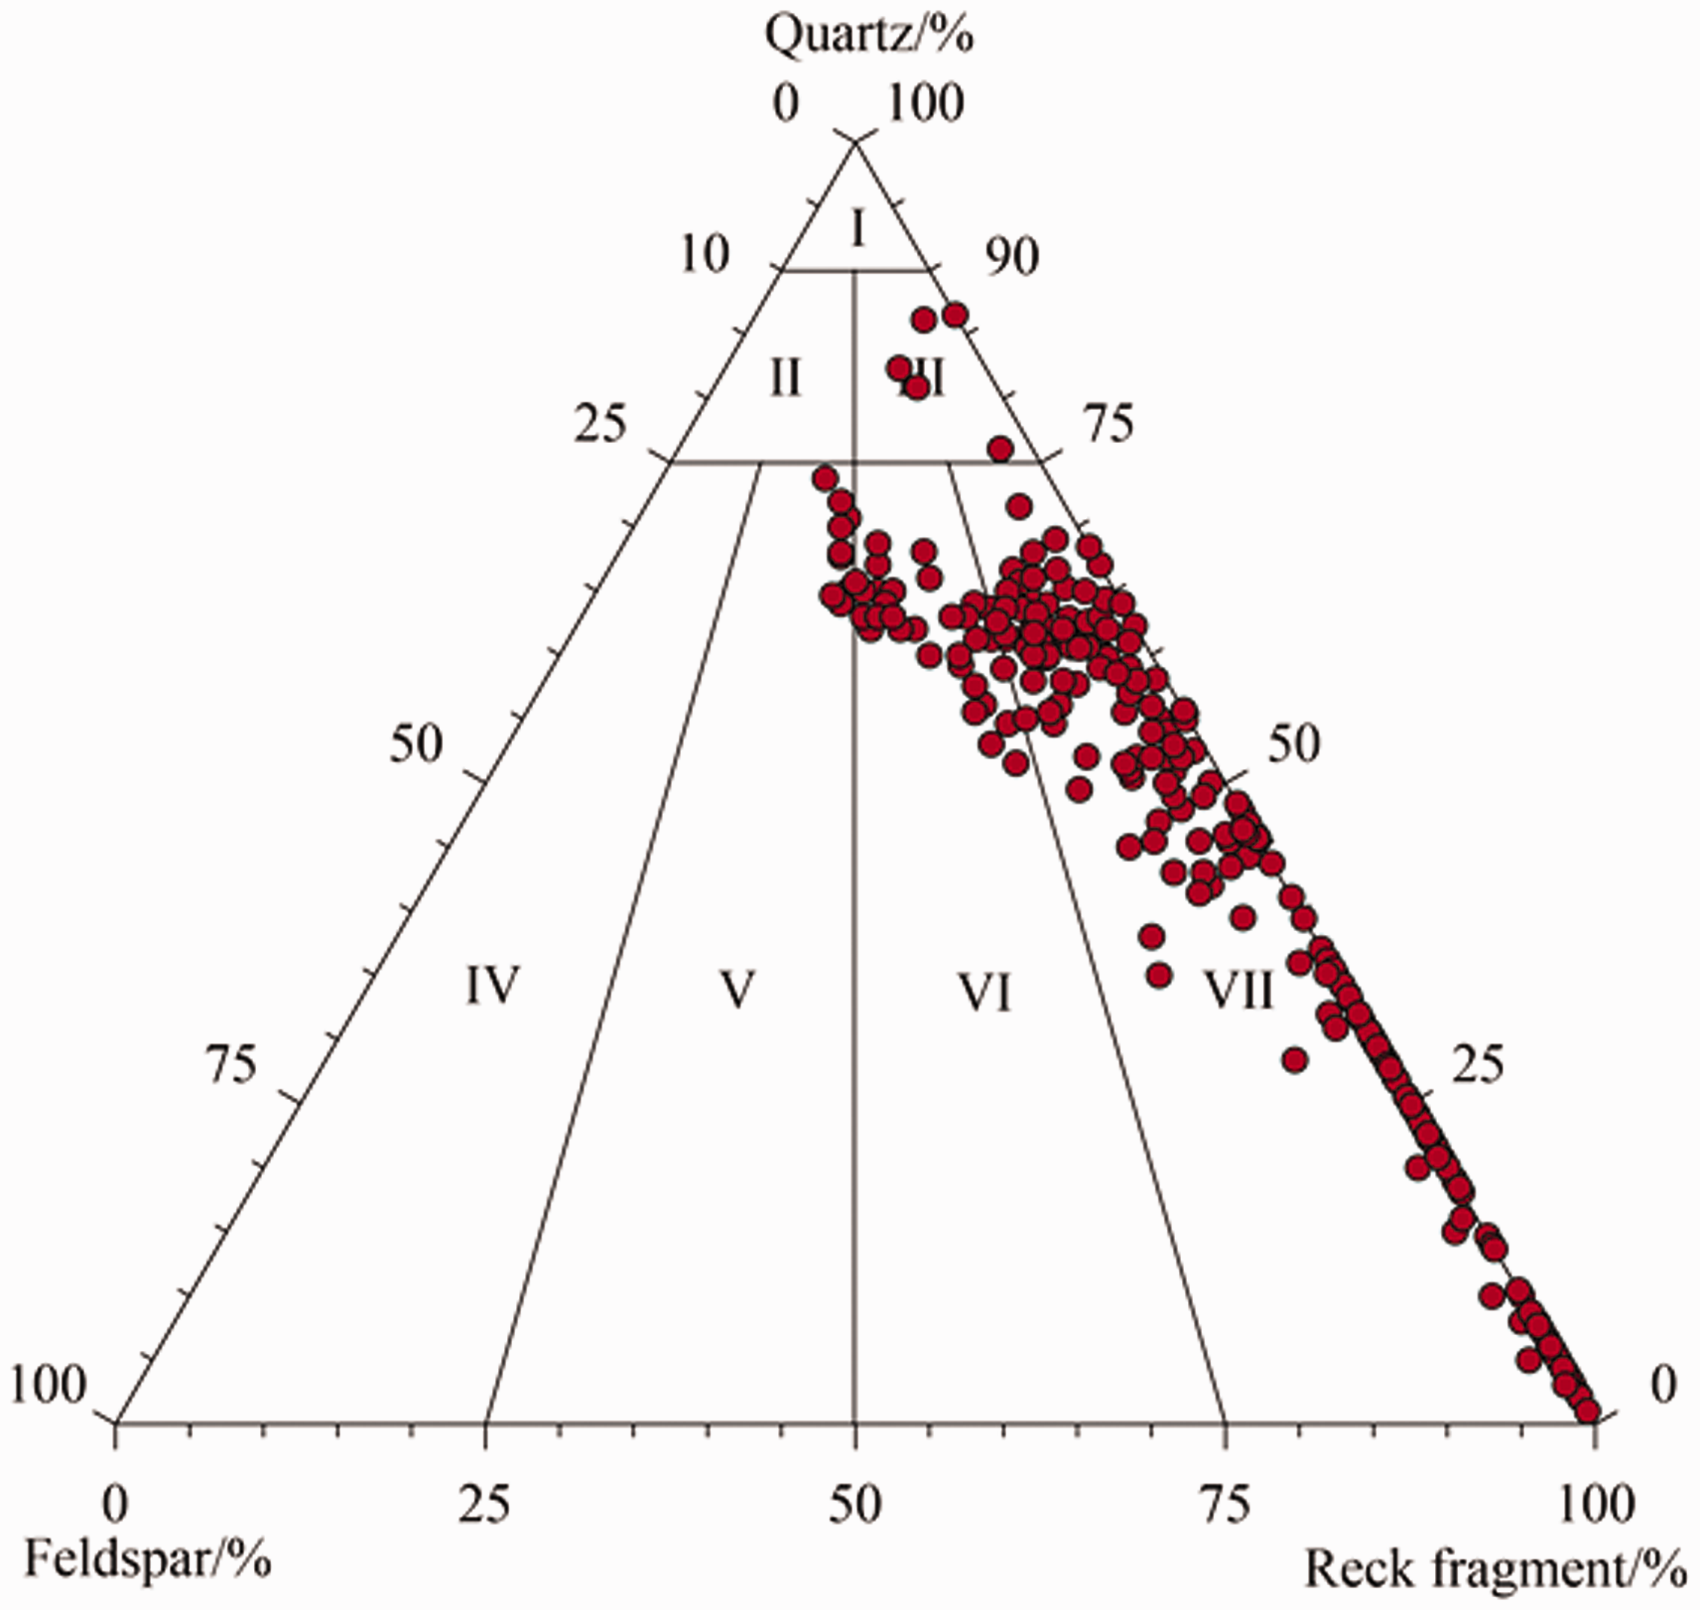
Rock composition of the T3x2 and T3x4 tight sandstone reservoirs. I-quartz sandstone, II-feldspar quartz sandstone, III-lithic quartz sandstone, IV-feldspar sandstone, V-lithic arkose, VI-feldspar lithic sandstone, VII-lithic sandstone.
Samples and methods
Current formation pressures
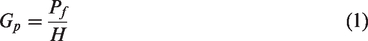
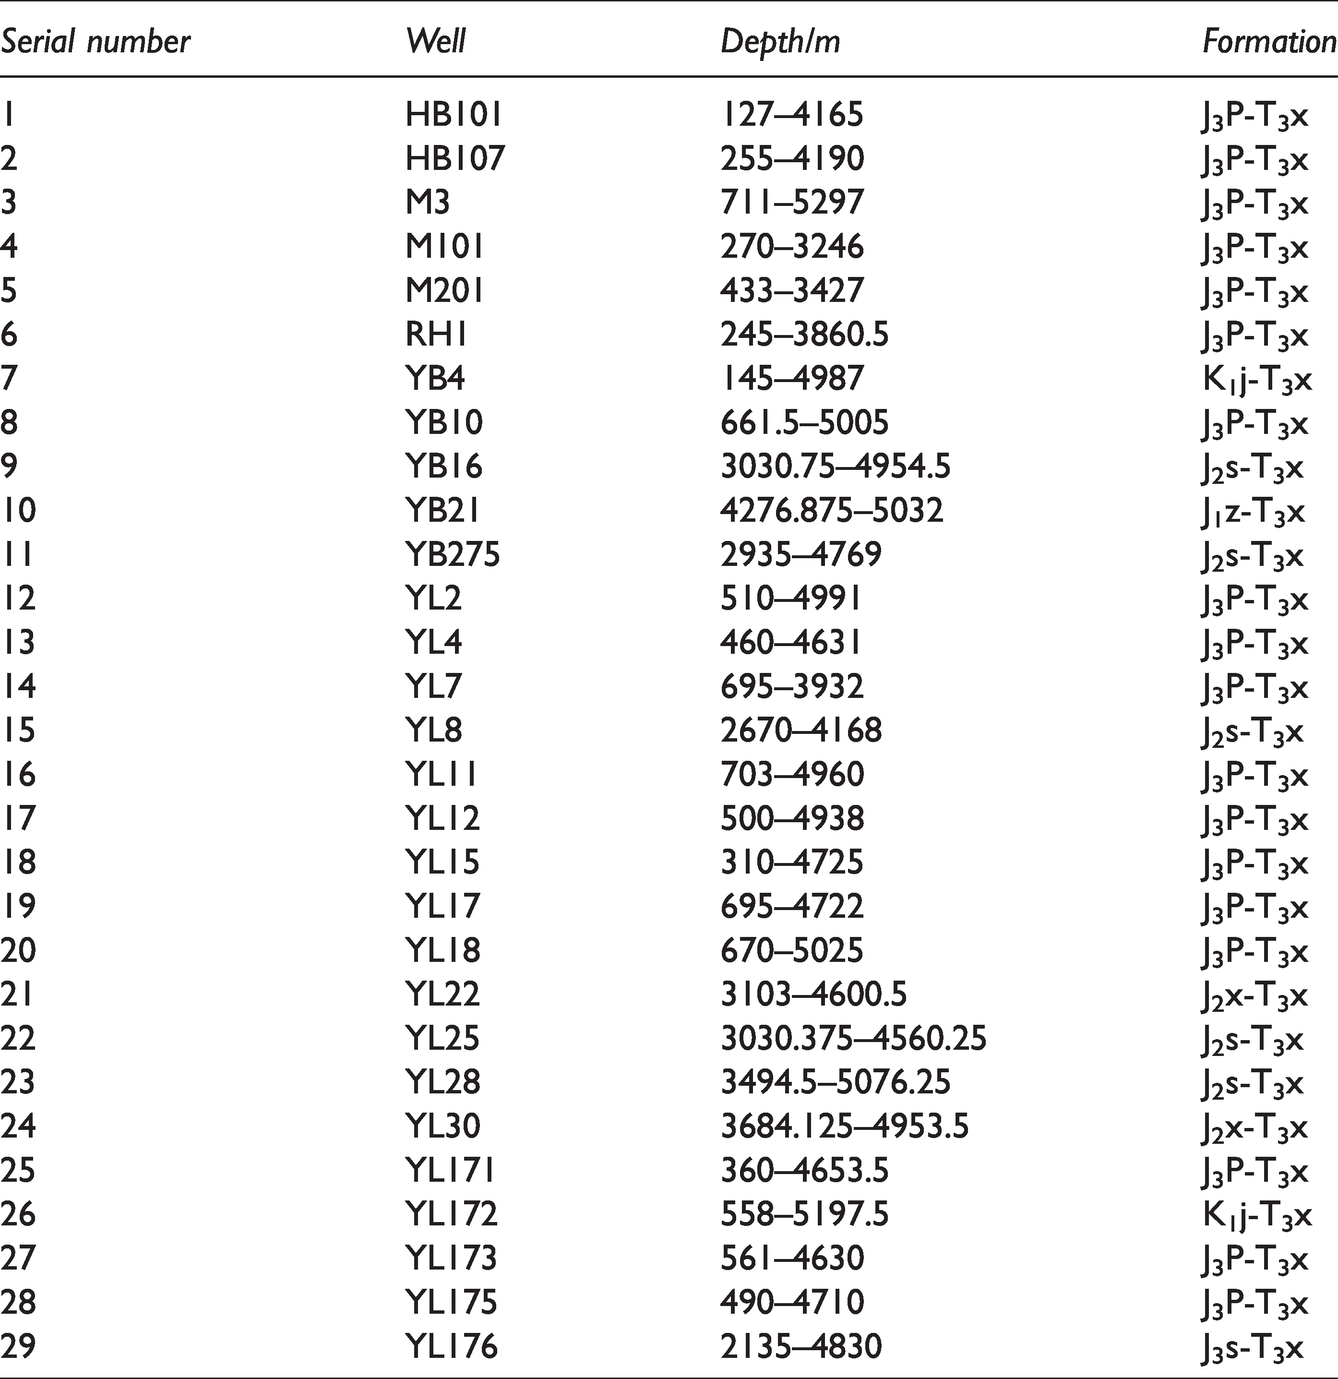
Data of the current formation pressures in the northeast portion of the Sichuan Basin were obtained from the logging data of 29 wells (Table 1) from the Exploration Branch of Sinopec Co., Ltd. Also, collected were well logging data, including sonic travel time, density, and resistivity logging data. Most of the pressure data collected are pressure gradients at different depths. For ease of comparison, the pressure gradients were converted into pressure coefficients. The pressure gradient is the ratio of the original formation pressure to the corresponding depth and the calculation formula is as follows:
Sample information of logging data.
The pressure coefficient is the ratio of the formation pressure to the hydrostatic pressure and the calculation formula is as follows:
According to equations (1) and (2), the relationship between the formation pressure gradient and the pressure coefficient can be obtained as:

Pressure gradients can be converted into pressure coefficients by formula (3). According to the geological conditions of the study area and previous research results, Hao (2005) proposed a classification scheme for abnormal pressure: pressure coefficients (αP) between 0.96–1.06 were defined as hydrostatic pressure; 1.06–1.27 as weak overpressure; 1.27–1.73 as overpressure; and values greater than 1.73 as strong overpressure.
One-dimensional (1D) simulation
The burial history and hydrocarbon generation of data from 16 wells were simulated by the 1D module in the PetroMod software. The parameters used in the simulation process mainly included the depths of different strata, start times of deposition, and uplift, lithology proportions, paleo-water depths, paleo-heat flow values, paleo-geothermal gradients, and measured vitrinite reflectance (Ro) values.
The strata erosional thickness was recovered by the H-LogRo% model using measured vitrinite reflectance values. The empirical formulas of Miller and Komar (1980), and Diem (1985) were used to calculate the paleo-water depths in the study area for different geological times. The paleo-geothermal gradient was selected from the “Auto SWIT” module of the PetroMod software. The latitude was defined as 32°N (latitude of the northeast part of the Sichuan Basin). The paleo-heat flow value was referred to Liu’s research results (2011). The Easy%Ro model in the PetroMod software was used to simulate the vitrinite reflectance (Ro) values of the organic matter, and these ranged from 0.2% to 4.47% (Sweeney and Burnham, 1990). The Ro values were obtained from Easy%Ro simulation, which was calibrated repeatedly until the simulation results were close to the measured Ro values.
Fluid inclusion parameters
Petrographic characteristics and homogenization temperatures of inclusions
The core samples from the second member of the Xujiahe Formation in the study area were mainly lithic sandstone and feldspathic lithic sandstone, and the samples used were thin sections. The petrographic characteristics of the inclusions were observed with the ZEISS AXIO Imager D1m multifunctional research-level microscope. This microscope is equipped with two light sources, namely transmitted light (TR) and ultraviolet light (UV). The petrographic characteristics of inclusions, such as the inclusion sizes, host minerals, occurrence locations, etc., can be observed and recorded under transmitted light. Under UV light, hydrocarbon inclusions and non-hydrocarbon inclusions can be distinguished, and the maturity of the hydrocarbon inclusions can be determined according to the fluorescent color of these inclusions.
The homogenization temperatures (Th) of the calibrated hydrocarbon inclusions and associated brine inclusions were tested by use of a Linkam THMS600 cooling and heating station. The measurements started with an initial heating rate of 10°C/min to 70°C, then of 5°C/min to 80°C, and the temperature was then increased at a rate of 1°C/min to observe inclusion bubble sizes; when the bubbles were about to disappear, the sample was heated at a heating rate of 0.1°C/min to determine the homogenization temperature of the inclusion. The measurement accuracy is ±0.1°C.
Vapor-liquid ratios of inclusions
Vapor-liquid ratios have an extreme impact on paleo-pressure simulations (Aplin et al., 1999). Confocal Laser Scanning Microscopy (CLSM) can determine the total volume of hydrocarbon inclusions and their bubble volumes with an accuracy of 95% (Aplin et al., 1999; Bourdet et al., 2010). However, CLSM cannot accurately determine the vapor-liquid ratios of gaseous hydrocarbon inclusions. Zhou et al. (2012) in this study proposed a convenient method of determining the vapor-liquid ratios of inclusions by combining high-resolution microscopy with drawing software. The principle of this method is similar to CLSM, and this method is not constrained by inclusion type. Even inclusions that do not fluoresce, such as saline inclusions and H2O-CH4 inclusions, can be analyzed by this method, which has been applied and has achieved good results (Zhang et al., 2015). The vapor-liquid ratios of the inclusions in this study were therefore obtained by this method.
Firstly, a series of images at different slice depths was obtained by adjusting the focal length of a high-resolution microscope (Figure 3). Secondly, CorelDRAW software was used to calculate the areas of inclusions and bubbles; fitting functions were established between the inclusion areas and slice depths, and between the bubble areas and slice depths. Thirdly, the inclusion and bubble volumes were integrated to obtain the vapor-liquid ratios of the inclusions.
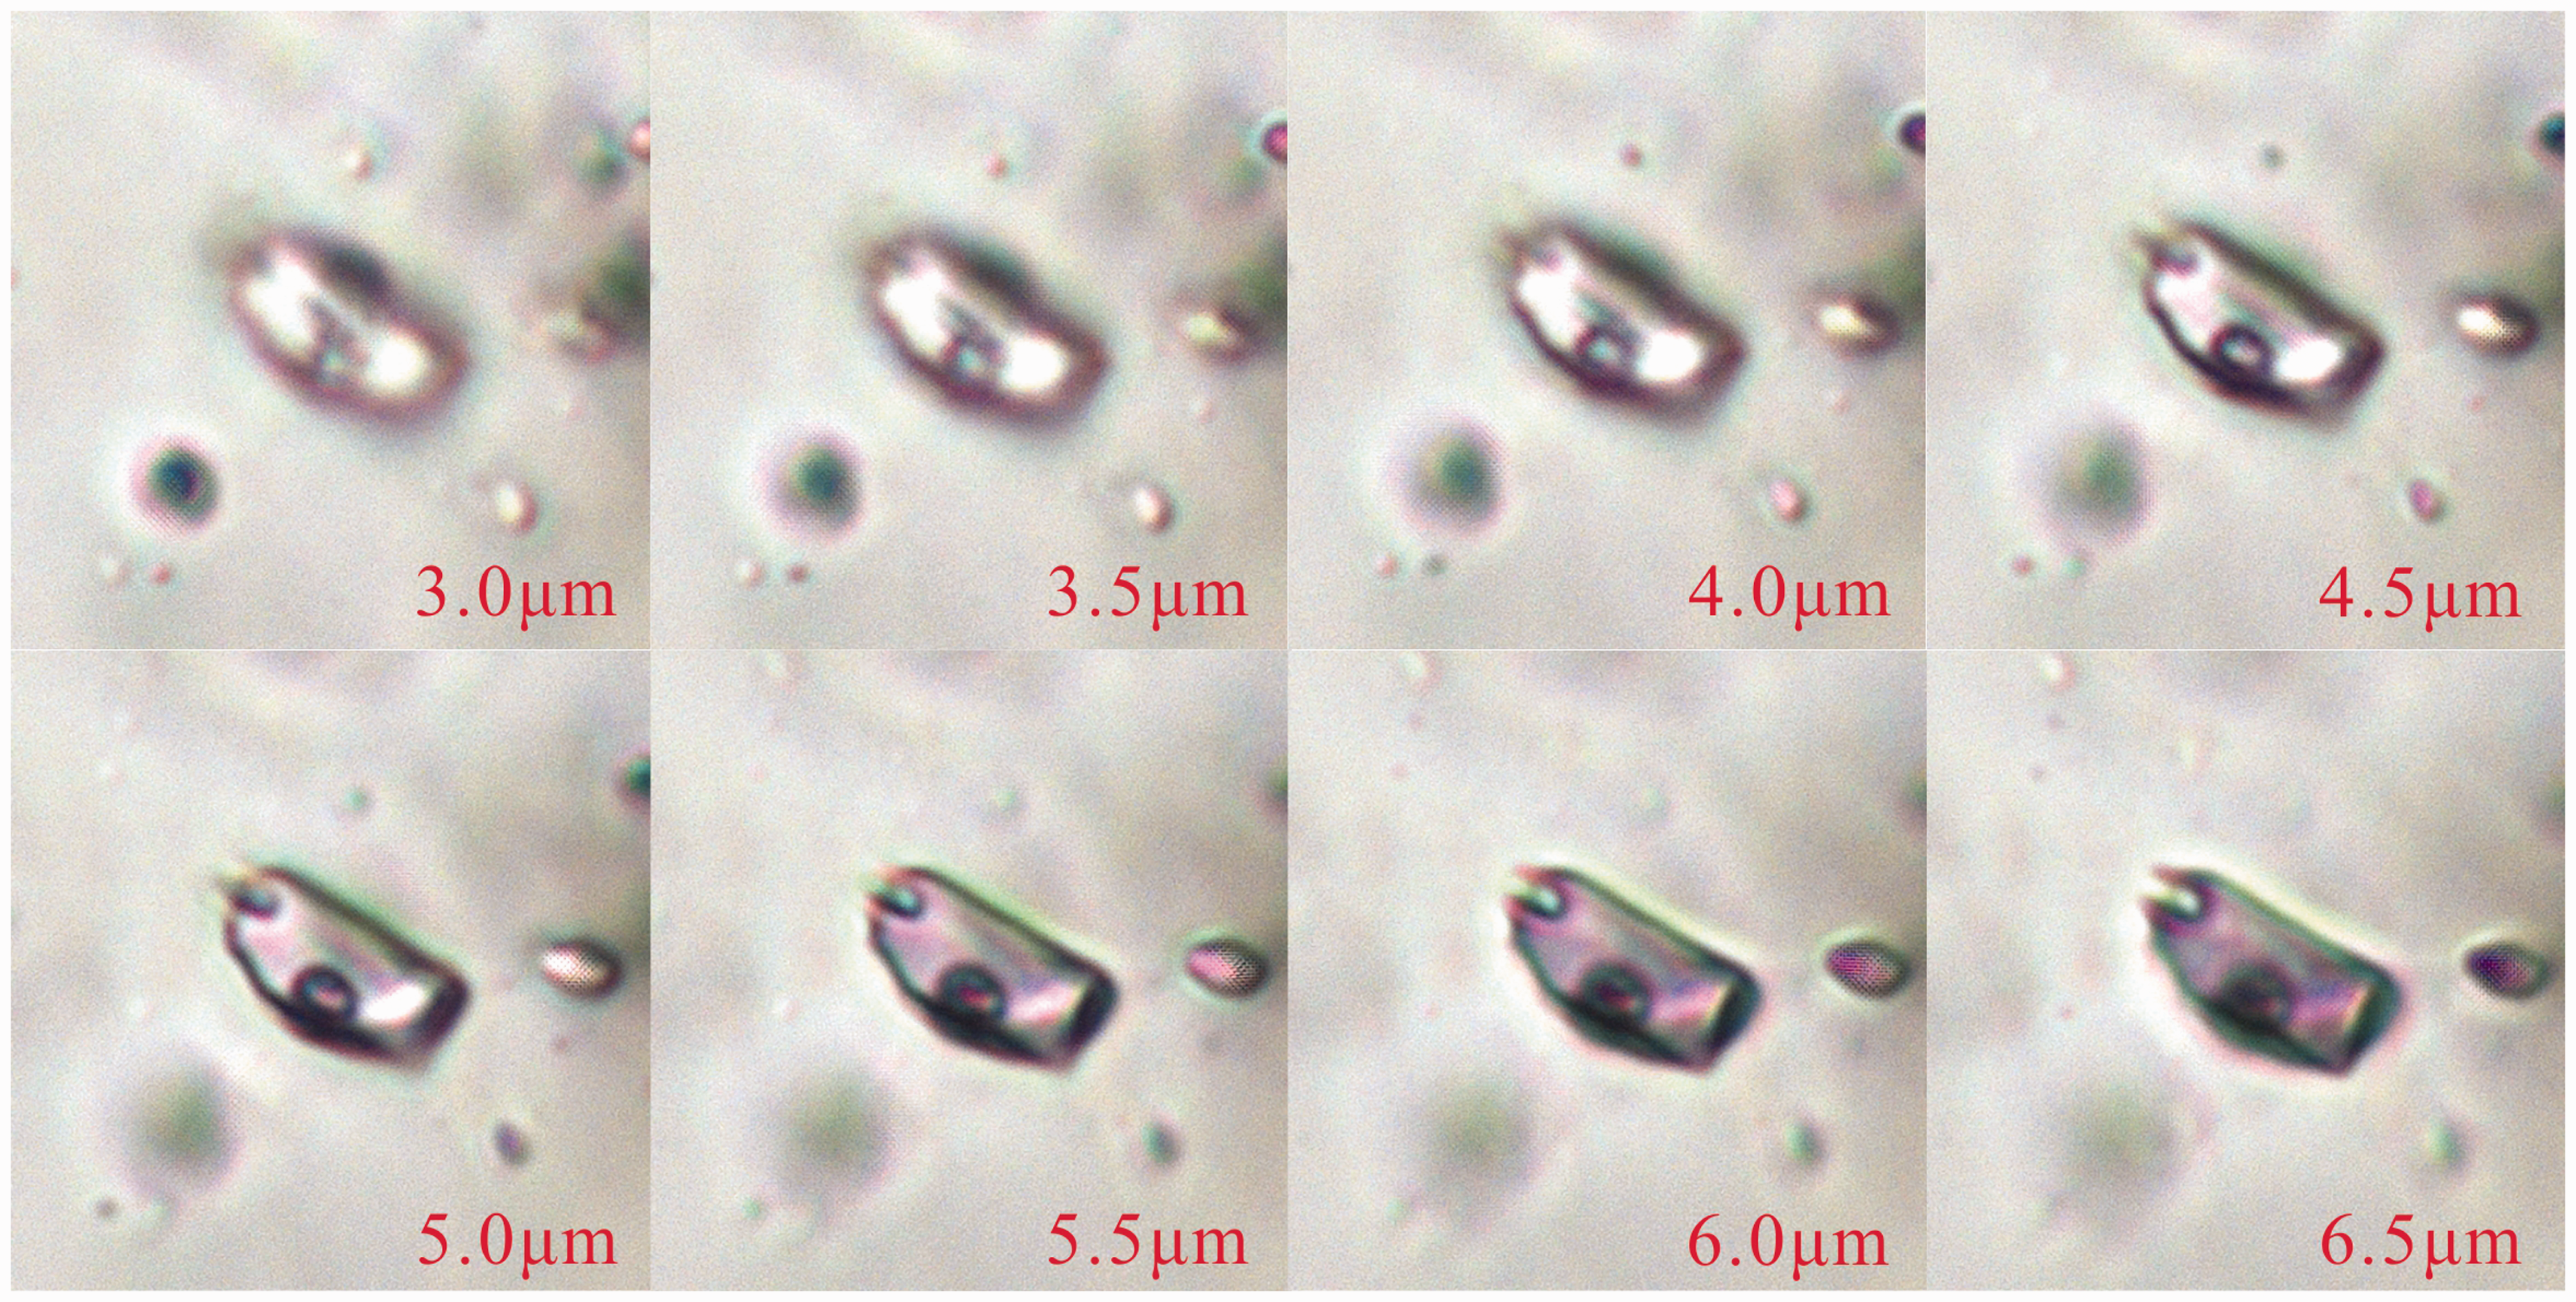
Images of inclusions at different slice depths.
Inclusion components
For inorganic gas inclusions containing CO2 and N2 without fluorescence, hydrocarbon inclusions including CH4, C2H6, C3H8, and C4H10, and solid substances in asphaltene-containing inclusions (Liu et al., 2007), laser Raman spectroscopy is a powerful tool for investigating the gaseous components of these inclusions (Dubessy et al., 2001; Frezzotti et al., 2012; Guillaume et al., 2003).
Laser Raman spectroscopy tests were performed on the hydrocarbon inclusions from the Xujiahe Formation in the northeast part of the Sichuan Basin at the State Key Laboratory for Enhanced Petroleum Recovery, Research Institute of Petroleum Exploration & Development. The test instrument was a LabRAM HR confocal laser Raman spectrometer with a scanning range of 100–4,000 cm−1. At room temperature (20°C), the components of the gaseous hydrocarbon inclusions from the Xujiahe Formation were measured. However, only the host minerals were determined by laser Raman spectroscopy, and not the hydrocarbon components (Figure 4). The reasons for this phenomenon may be the low resolution of the laser Raman spectrometer or the low concentrations of hydrocarbons in the inclusions. The organic components of the natural gas in the present-day gas reservoirs under study are mainly CH4, C2H6, C3H8, iC4, nC4, iC5, and nC5, while the inorganic components are mainly H2, N2, and CO2. So, PVTsim software was used to simulate the component contents to represent the gaseous hydrocarbon inclusions.
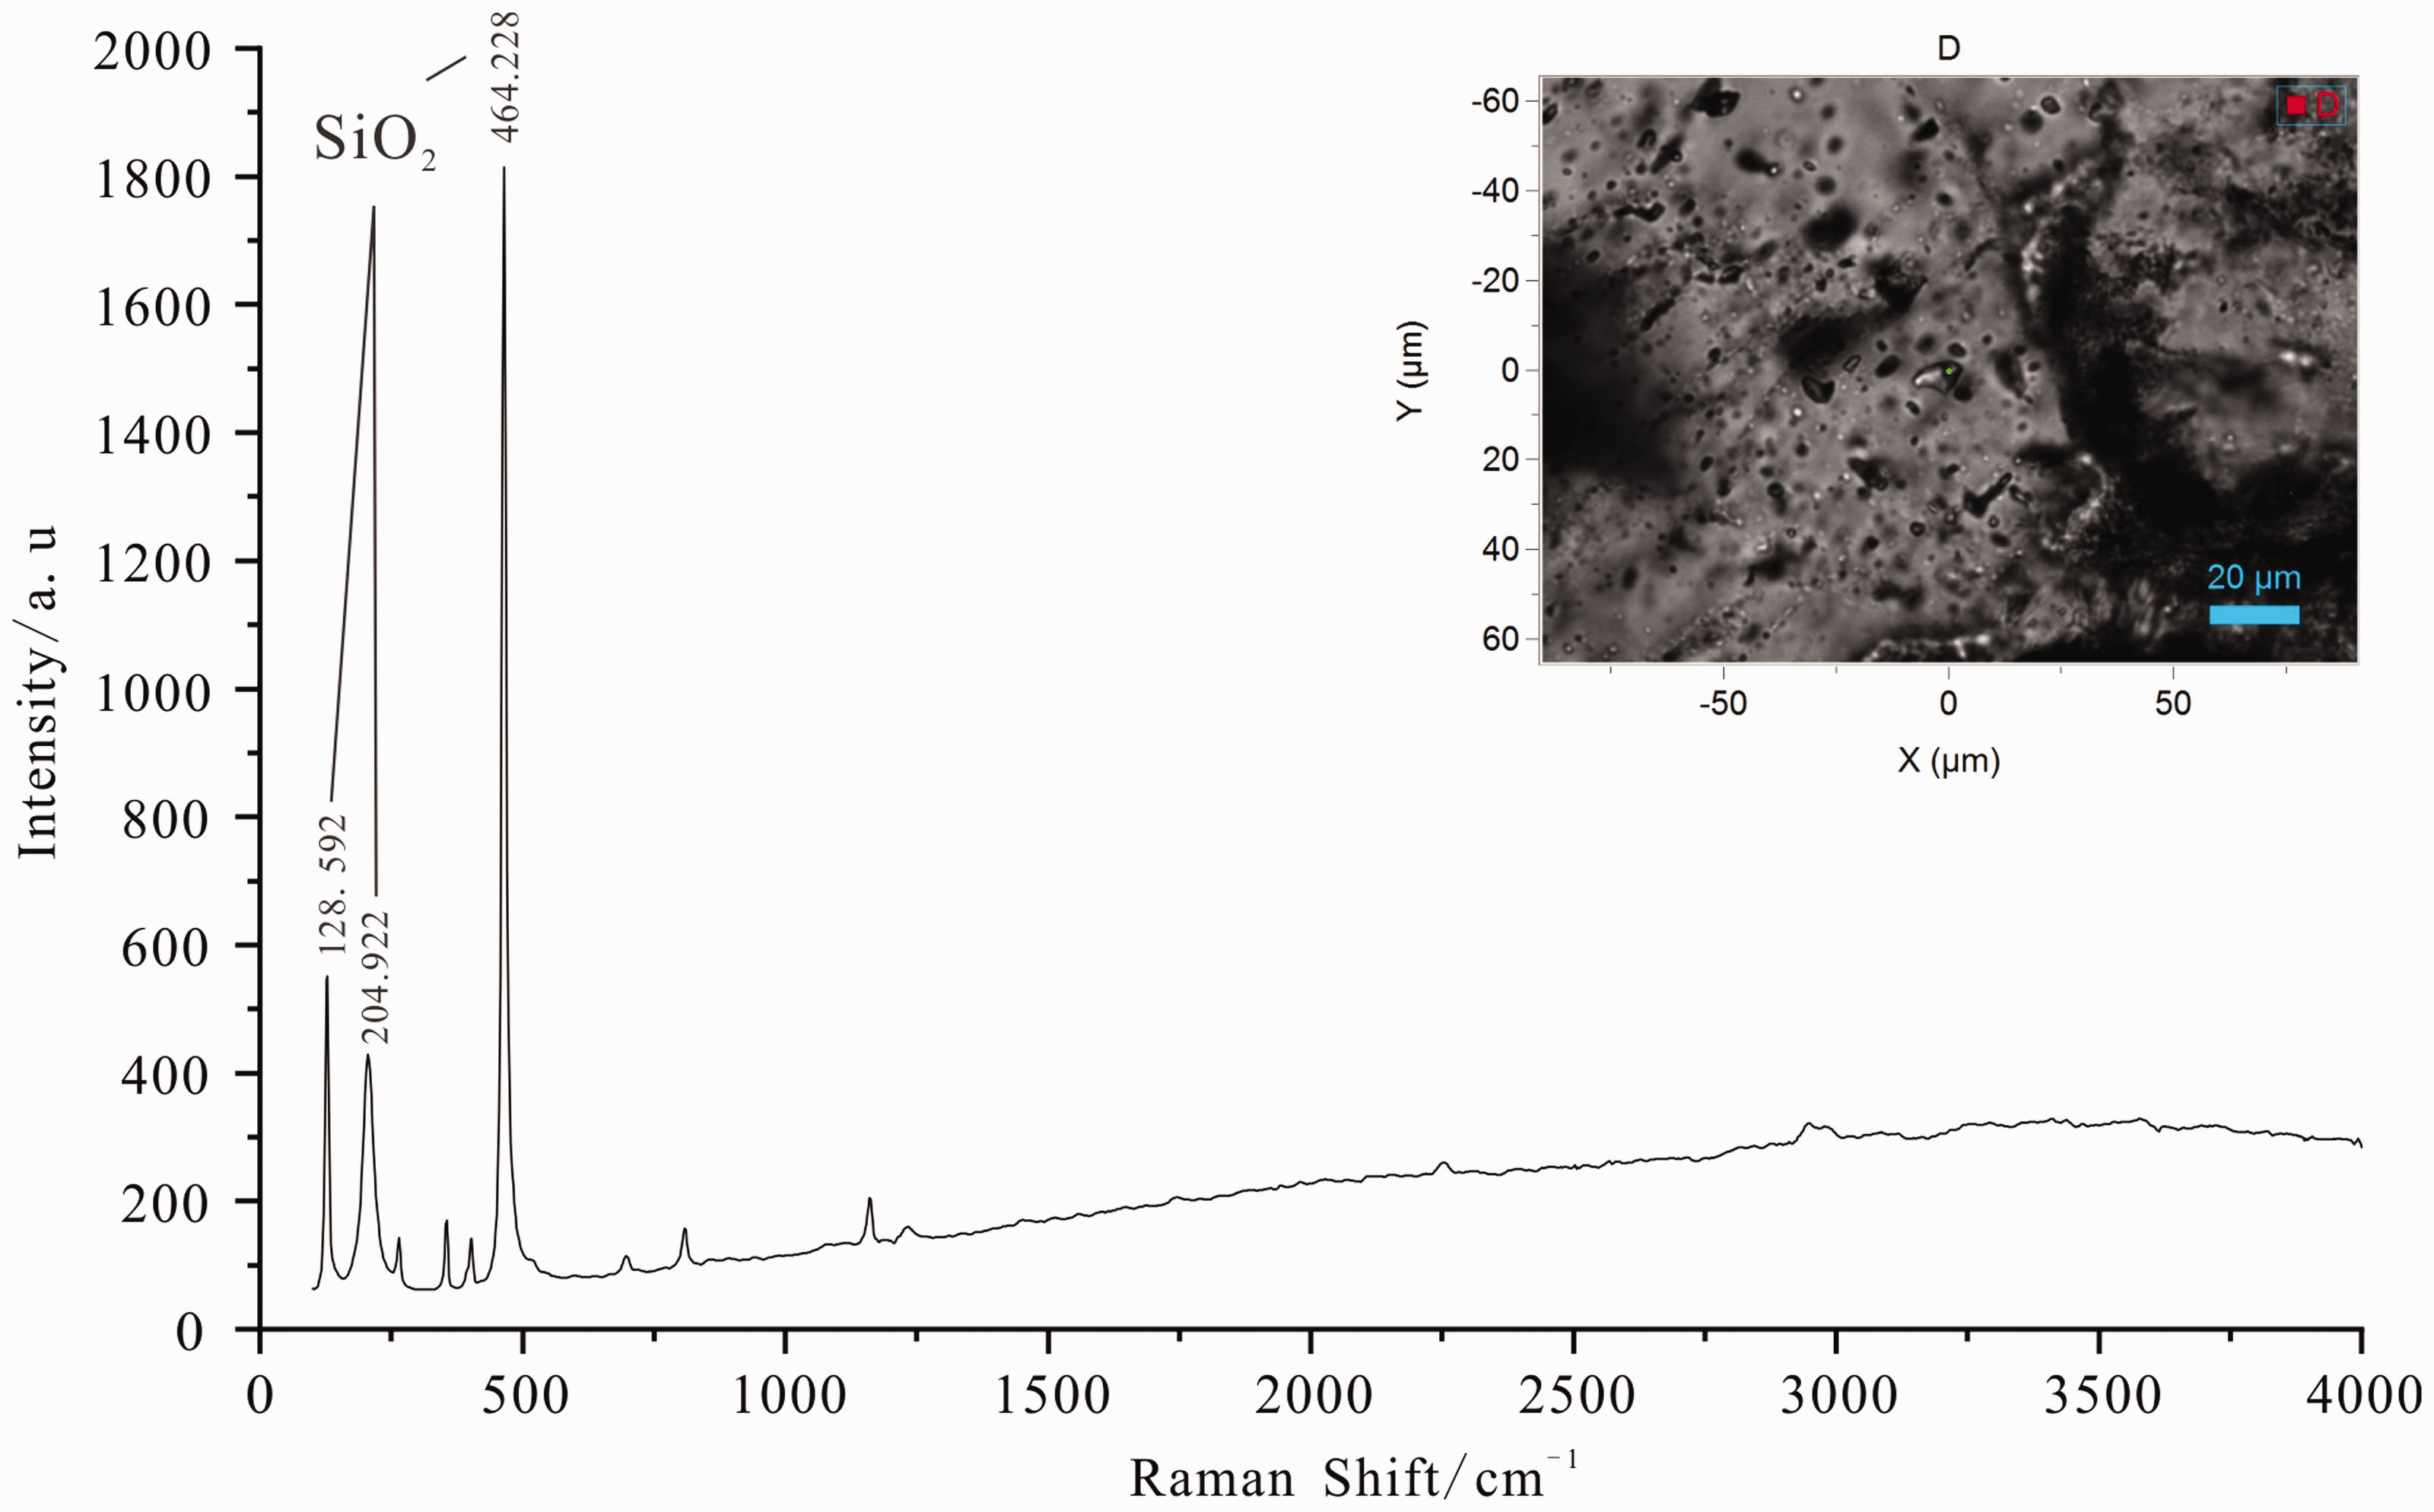
Well B10, 4928.59 m, laser Raman spectra of gaseous hydrocarbon inclusions.
Paleo-pressure restoration
PVT simulation
PVTsim software was used to reconstruct the paleo-pressures of the second member of the Xujiahe Formation. The software adopted the Soave-Redlich-Kwong equation and iterative calculations to calculate the capture pressures of the inclusions (Aplin et al., 1999; Liu et al., 2007). However, because of the complex phase evolution of the gaseous hydrocarbon inclusions (Friend et al., 1989), it is impossible to directly reconstruct the paleo-pressures of the gaseous hydrocarbon inclusions by reconstructing the paleo-pressures of the oil inclusions.
This study used a proper method proposed by Wang and Zou (2013) and Zhang et al. (2015), which is applicable for reconstructing the trapping pressures of gaseous hydrocarbon inclusions and is based on PVTsim software. This method also requires vapor-fluid ratios, homogenization temperatures, and some other parameters. The trapping temperatures are 2°C higher than the homogenization temperatures for the gaseous hydrocarbon inclusions from the Xujiahe Formation in the northeast part of the Sichuan Basin (Aplin et al., 1999; Mi et al., 2002; Zhang et al., 2015). Considering this, the trapping pressures can be reconstructed with the simulated isovolumetric lines of the gaseous hydrocarbon inclusions.
Basin simulation
PetroMod software was used to simulate the paleo-pressure evolution processes for the Xujiahe Formation, in which the current measured formation pressure, and the reconstructed paleo-pressure simulated by PVT simulations were considered as the correct data to ensure the accuracy of the results.
Identification of the causes of abnormal pressure
Combined with logging data, the effective vertical stress of the mudstone formation in each well was calculated by using the formula proposed by Terzaghi and Peck (1967):

The loading-unloading curve (Bowers, 2001) (Figure 5) was used to determine the overpressure mechanisms in the Xujiahe Formation. Overpressure caused by undercompaction lies on the loading curve, while overpressure caused by fluid expansion and tectonic extrusion lies on the unloading curve (Bowers, 2001; Zhao et al., 2017).
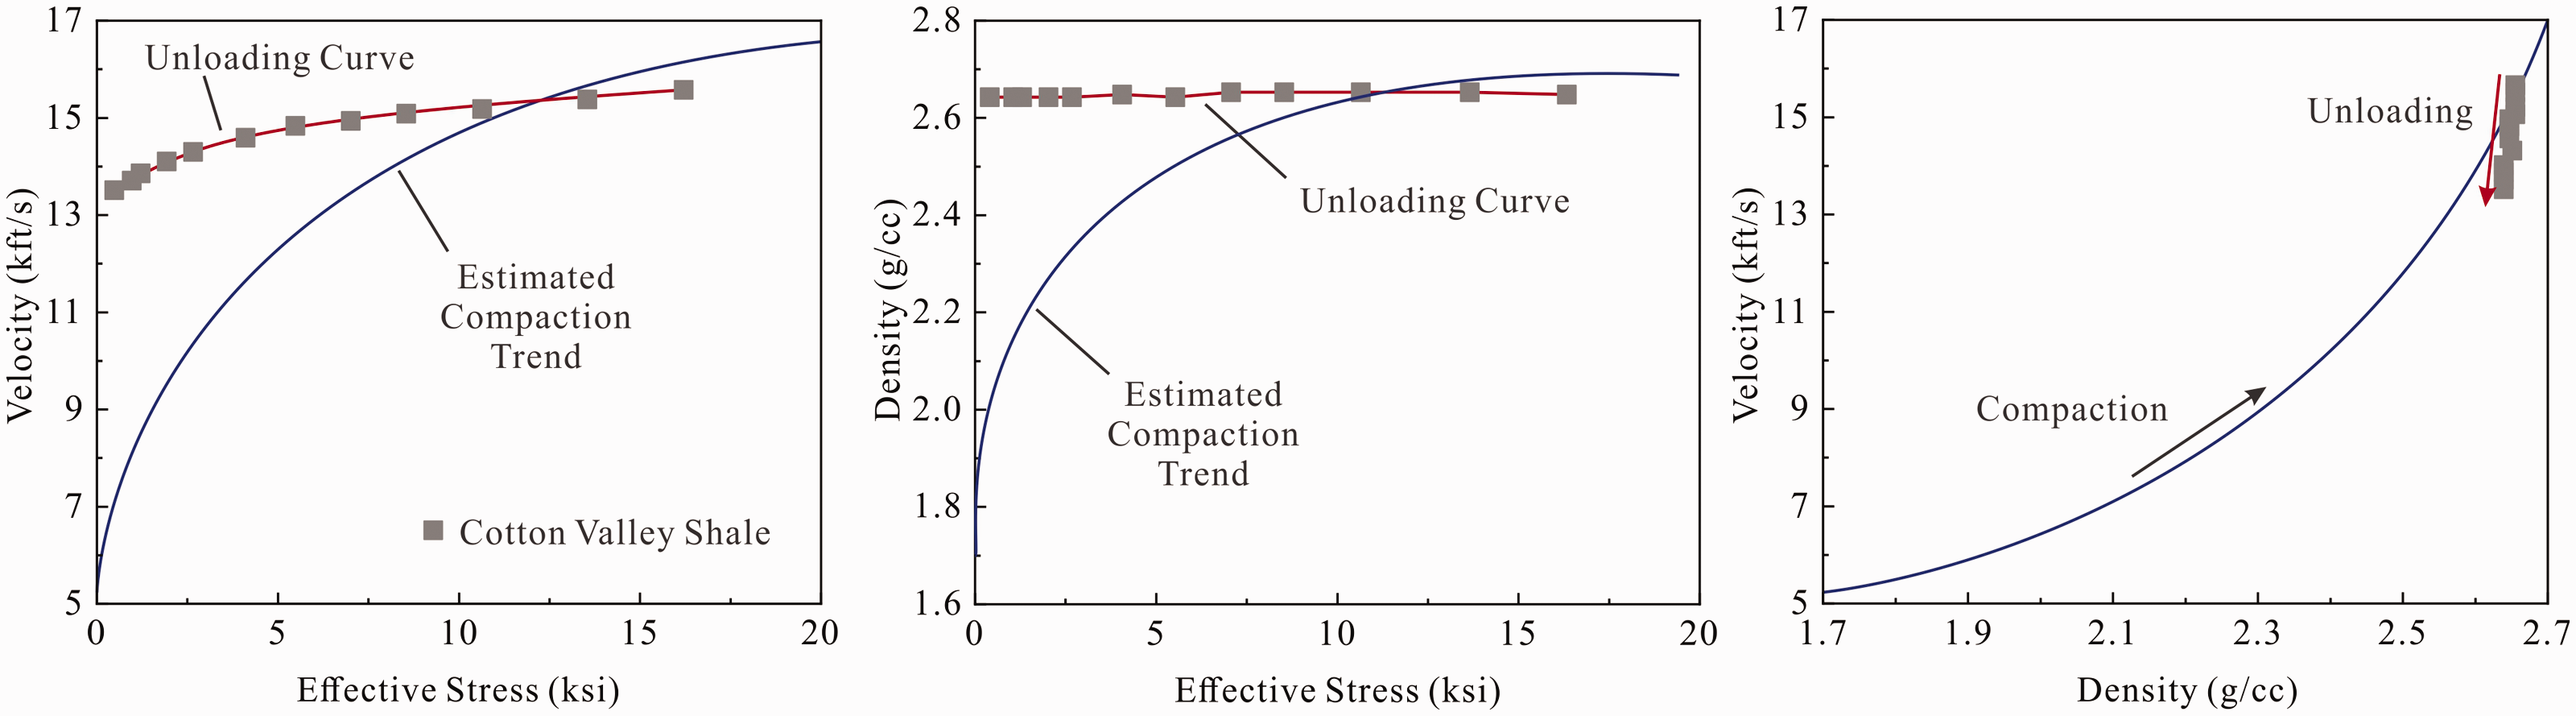
Shale compaction/unloading behavior (Bowers, 2001).
Results and discussions
Current formation pressure characteristics
In the northeastern part of the Sichuan Basin, overpressure began to develop in the continental strata at the base of the Middle Jurassic Shaximiao Formation (J2s) (Figure 6), the initial depth of the overpressure in the west and south portions was approximately 3,100 m, and the initial depth of the overpressure in the northeast was approximately 2,000 m. The range of formation pressures in the continental strata from the Xujiahe Formation to the Shaximiao Formation is 9.7–106.5 MPa, and the main range of the pressure coefficients is 0.99–1.90. The formation pressures of the Xujiahe Formation are 36.4–106.5 MPa, and the main range of the pressure coefficients is 1.01–1.90.
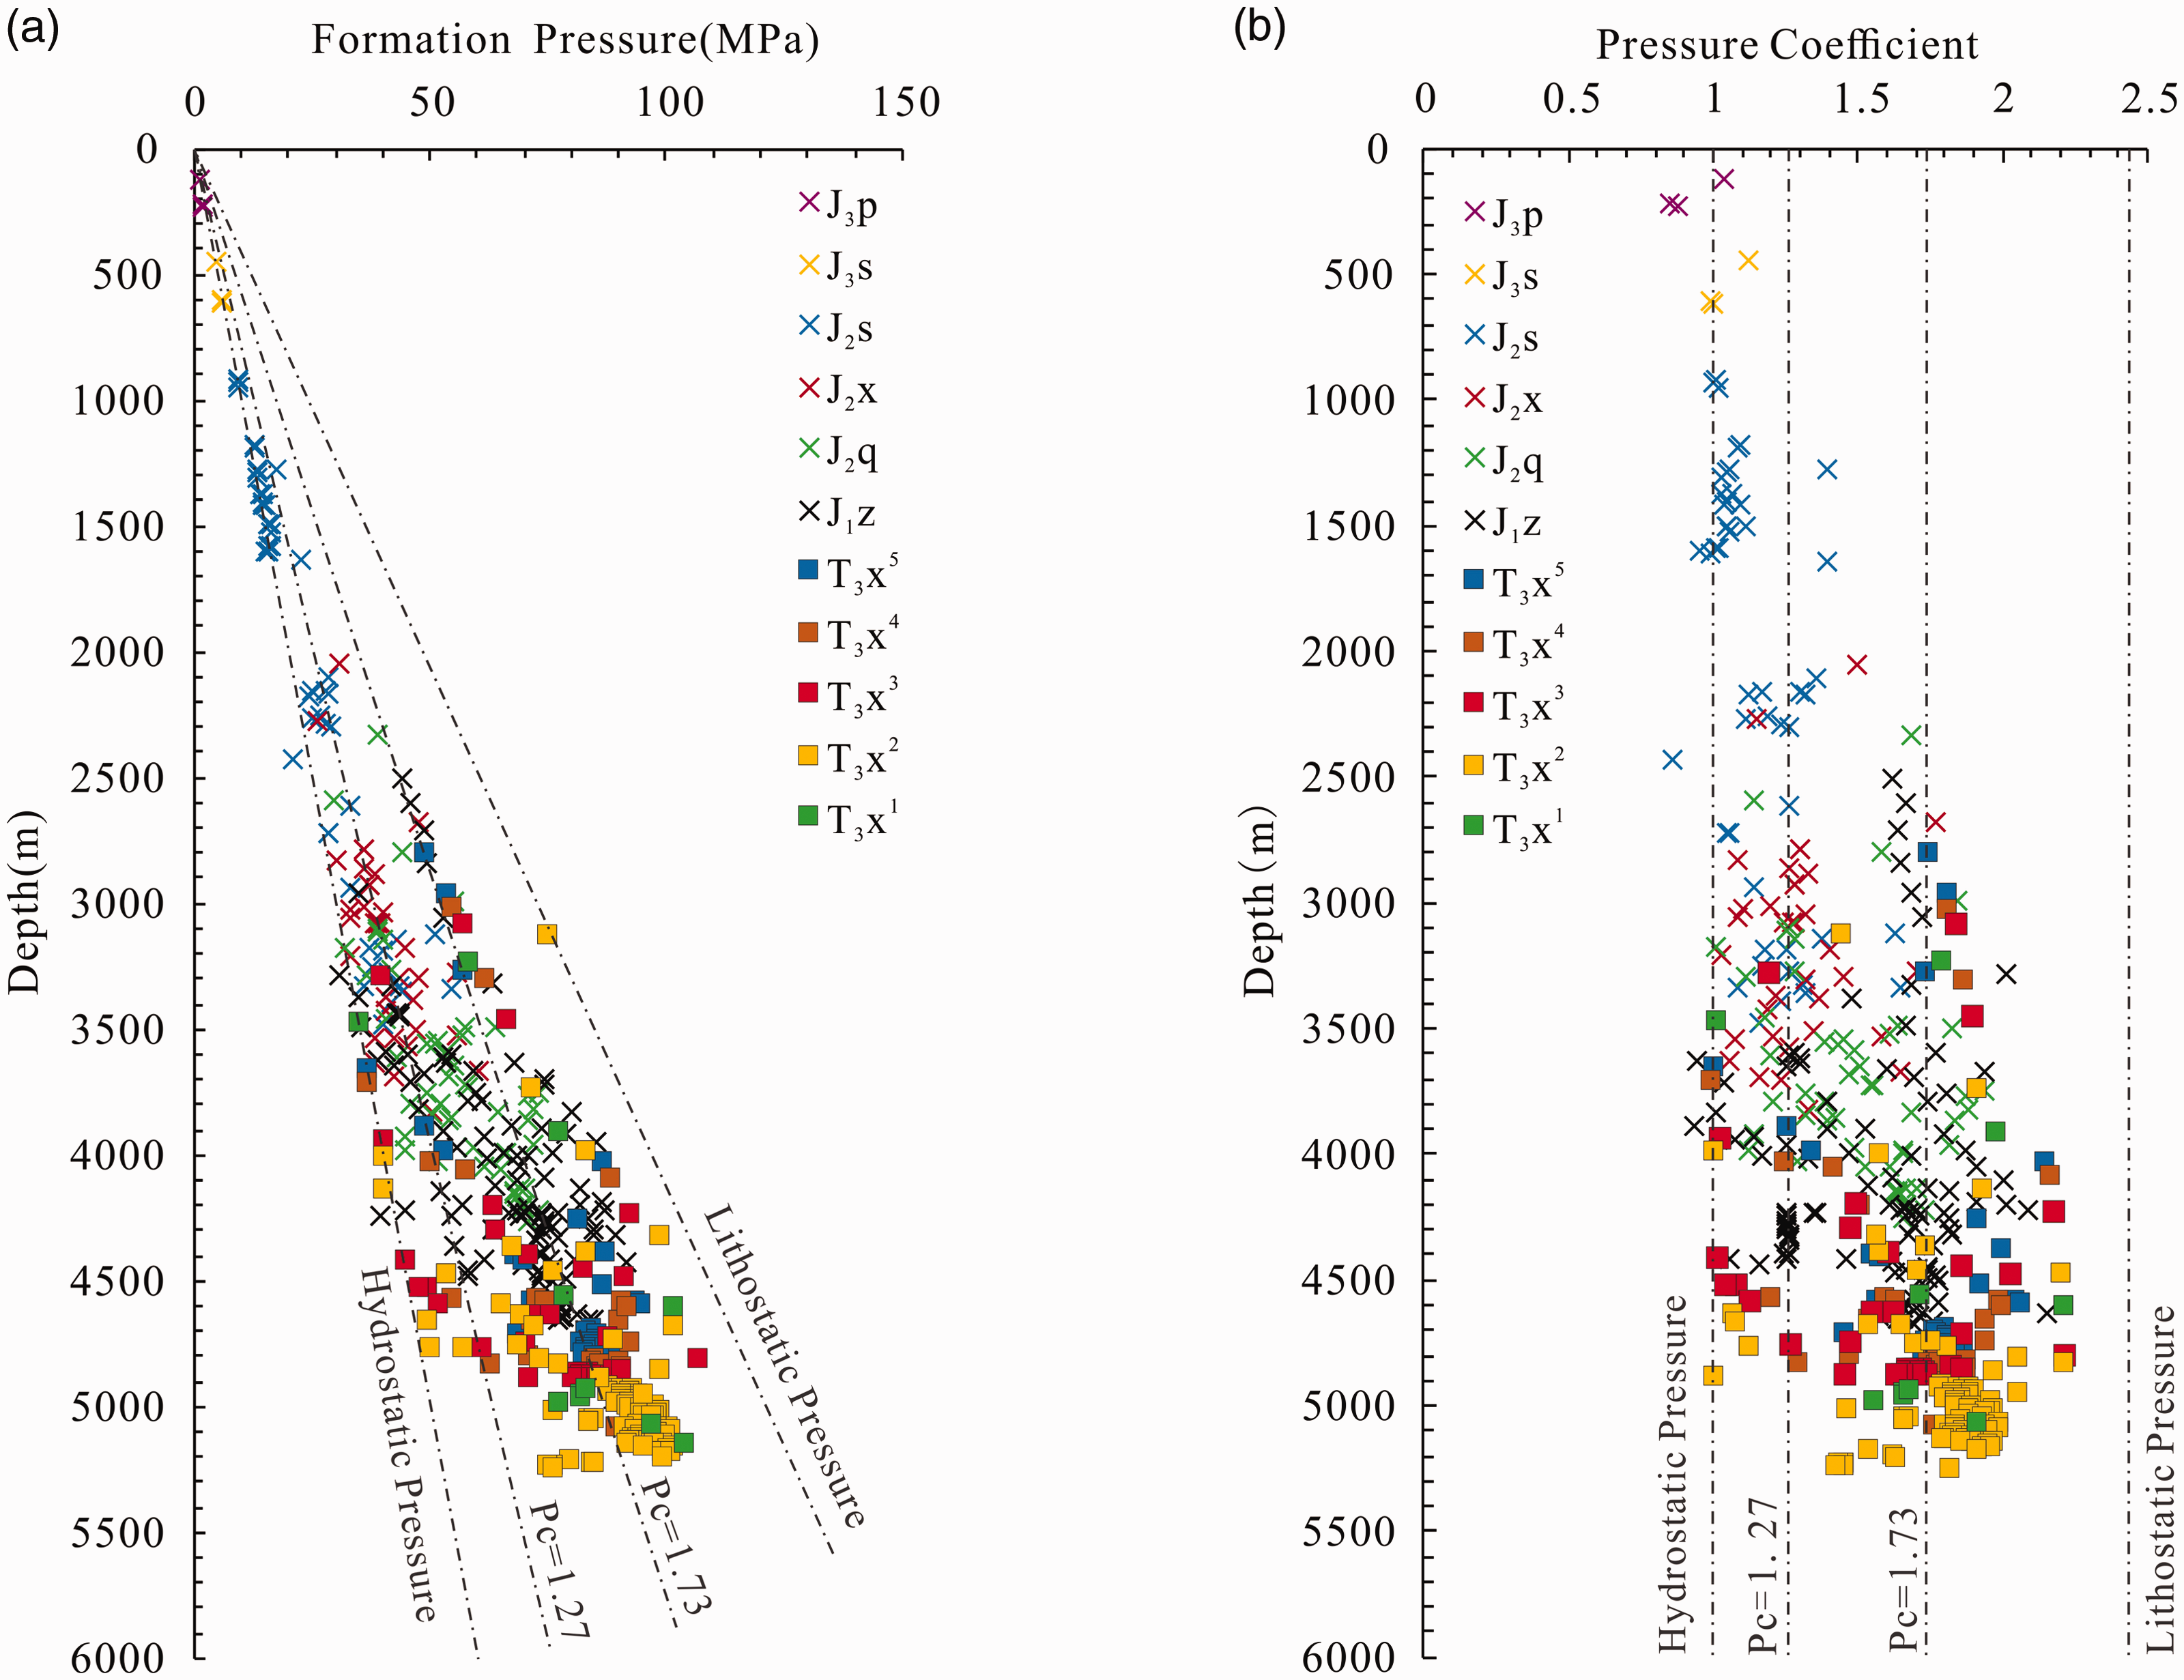
The measured pressure and pressure coefficient of continental strata in the northeast part of the Sichuan Basin. (a) The relationship between measured formation pressure and depth. (b) The relationship between formation pressure coefficient and depth.
Burial history and hydrocarbon generation history
Simulation of the burial history (Figure 7) shows that the continental strata in the northeastern Sichuan Basin were mainly in a state of continuous burial from the Late Triassic period to the early Late Cretaceous period, during which only a small-scale tectonic uplift occurred in the Late Jurassic period (J3). After the early Late Cretaceous period, influenced by the Yanshanian and Himalayan movements, tectonic uplift occurred in these strata as a whole (Lei et al., 2012; Yang et al., 2013).
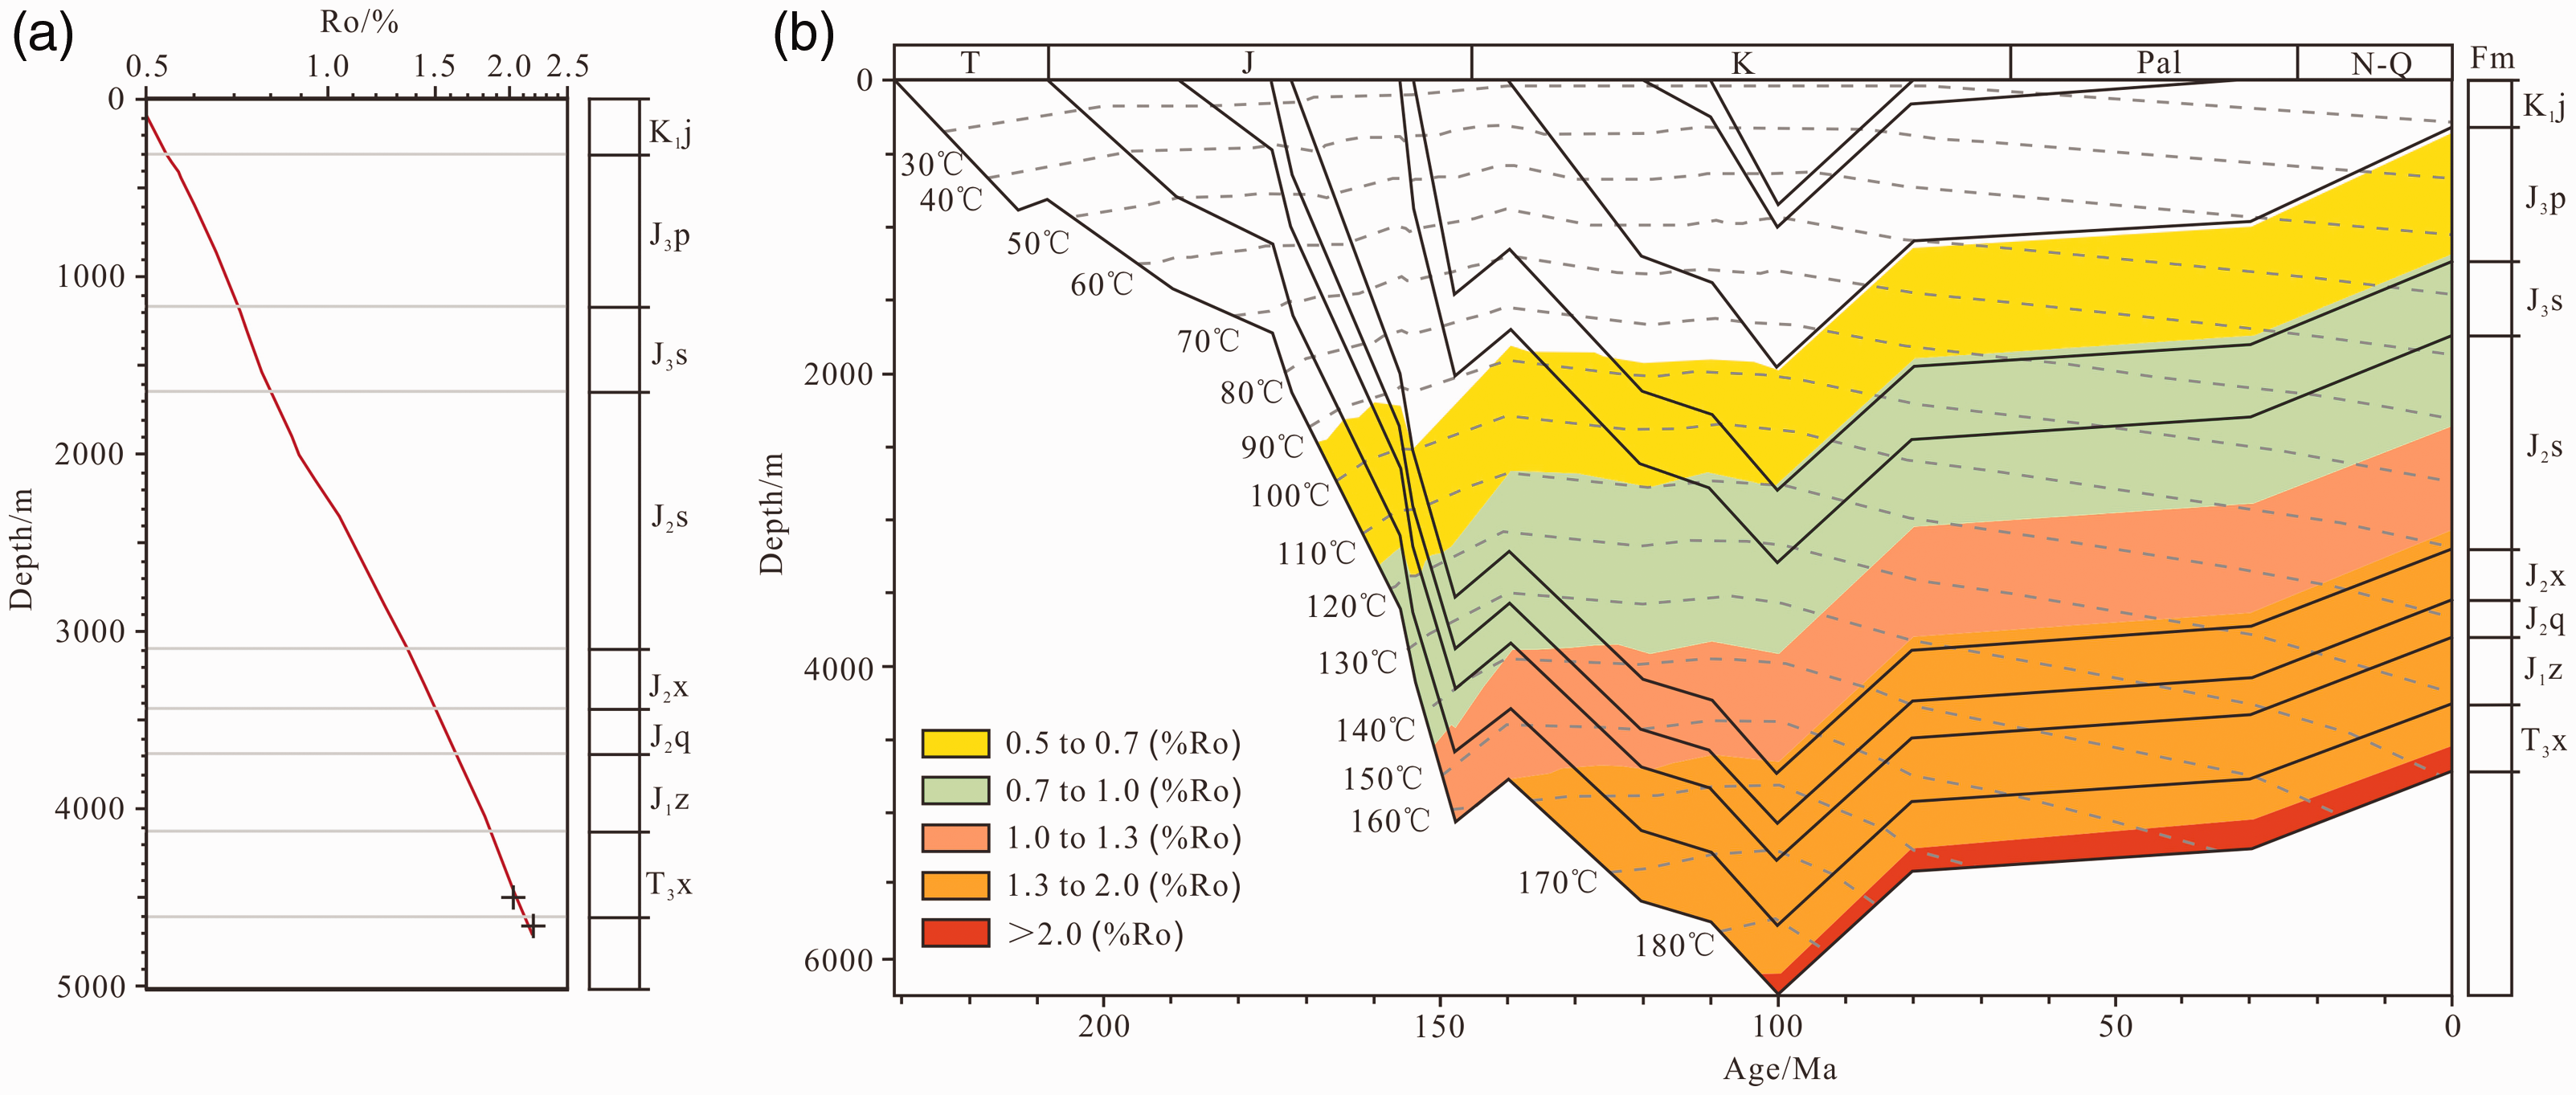
(a) Maturity correction model. (b) Burial history and hydrocarbon generation history of well YL17 in the northeast part of the Sichuan Basin.
Based on theory, when the organic matter Ro values reached 0.5%, the organic matter entered the hydrocarbon generation window and began to generate natural gas. When the Ro values reached 0.7%, the organic matter entered the stage of major gas generation. When the Ro values reached 1.0%, the organic matter entered the stage of peak gas generation. When the Ro values were greater than 2.0%, the organic matter entered the stage of dry gas generation. By contrast, the Ro values of the present-day organic matter in the source rocks of the Xujiahe Formation are all greater than 1.3%, and most of these values have reached 2.0%, which is the stage of high overmaturity (Zhang et al., 2009).
According to the simulation of the hydrocarbon generation history (Figure 7(b)), the source rocks of the Xujiahe Formation reached the low maturity stage (Ro = 0.5%) in the Middle Jurassic and began to generate natural gas. By the end of the Middle Jurassic, the Ro values reached 0.7% and the organic matter entered the mature stage and began to produce large amounts of natural gas. In the Late Jurassic period, the Ro values reached 1.0% and the organic matter entered the peak period of gas generation. In the Early Cretaceous period, the Ro values reached 1.3% and the organic matter entered a stage of high maturity. In the late Early Cretaceous period, the Ro values reached 2.0% and the organic matter entered the over mature stage of dry gas generation. Since the Late Cretaceous period, the strata have experienced tectonic uplift and hydrocarbon generation has gradually ceased.
Reservoir densification
The exceptionally tight reservoirs of the Xujiahe Formation are conducive to the preservation of overpressure. The lithologies of the second member of the Xujiahe Formation are mainly lithic sandstone and feldspathic sandstone, feldspathic sandstone, and lithic quartz sandstone (Zhu et al., 2008). The Xujiahe Formation, with a maximum burial depth of more than 6,000 m during its geological history, is in the middle diagenetic stage B and is subject to strong compaction and cementation over the period of geologic evolution (Lai et al., 2017; Liu et al., 2018) (Figure 8). Accompanied by the arrival of the hydrocarbon generation peak, diagenesis mostly ended due to the entry of oil and gas. At this time, large amounts of natural gas were generated, thus resulting in volume expansion. Due to the abnormal density of the reservoir, the pore fluids could not be effectively discharged and this resulted in overpressure. In the later stages, the overpressures further increased, and this increase was caused by structural compression.
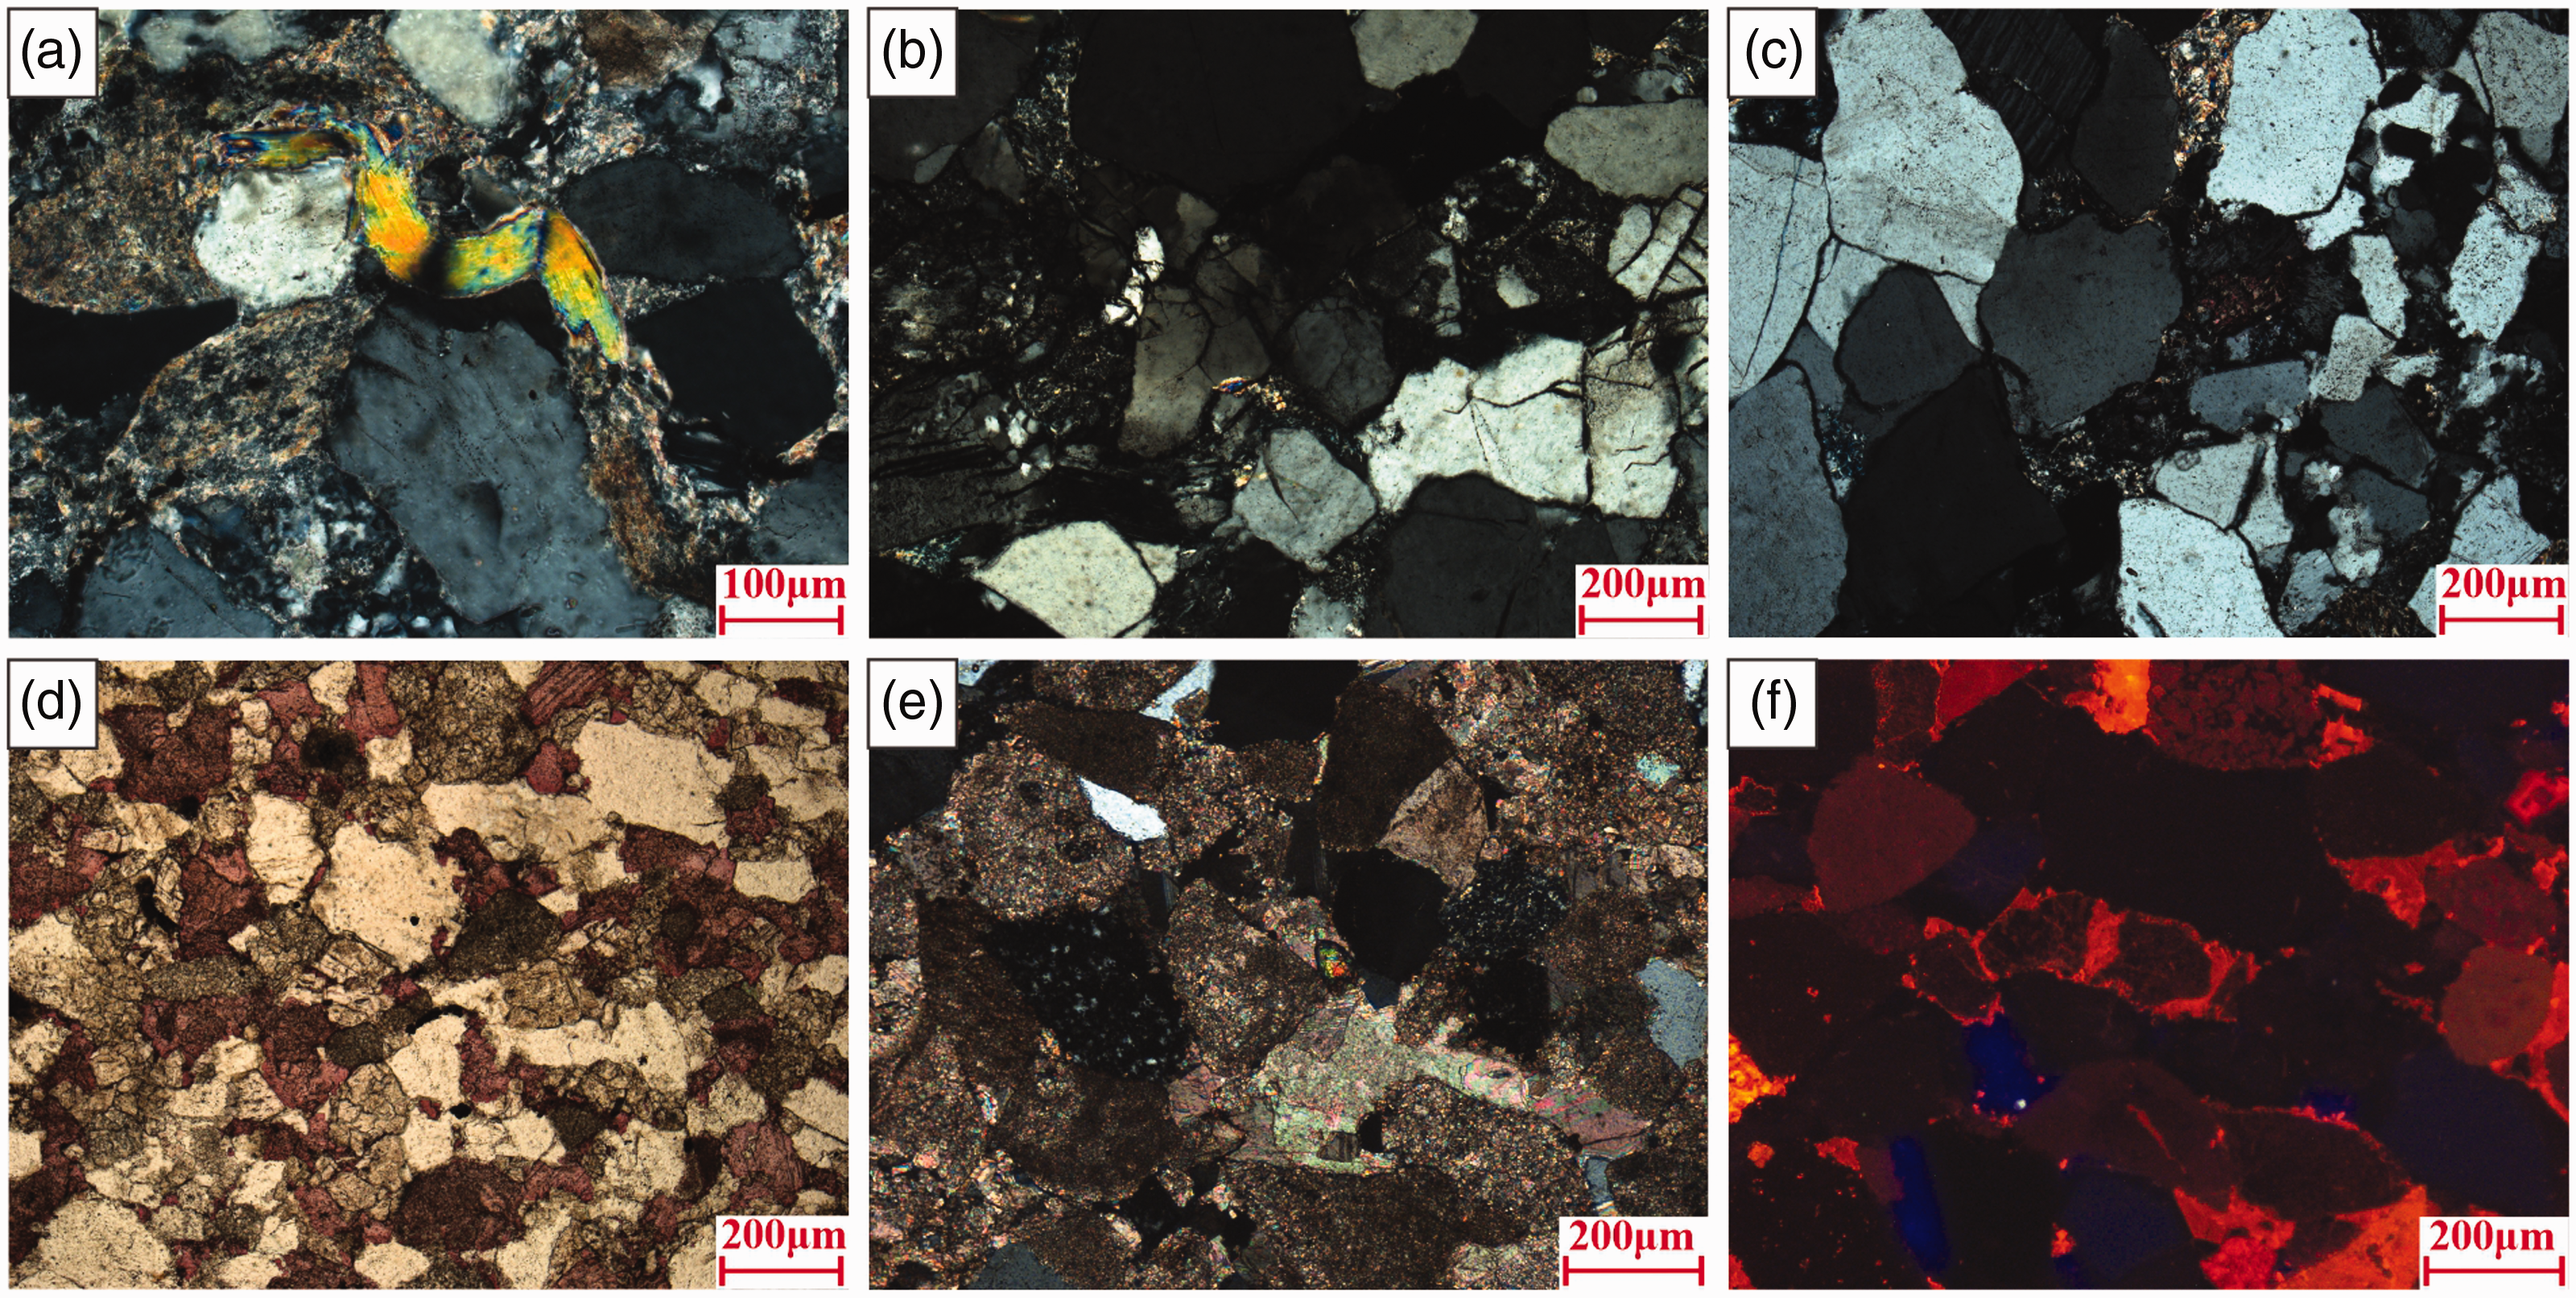
Compaction and cementation of the reservoir in the Xujiahe Formation. (a) Well YB10, 4928.29 m, mica particles are bent. (b) Well YB4, 4776 m, quartz particles are fractured. (c) Well YB16, 4745.49 m, quartz particles with line contact and concave convex contact. (d) Well YL11, 4623.5 m, calcite cementation in intergranular pore space. (e) Well M3, 5183.05 m, calcite. (f) Well YL15, 4628.5 m, the intergranular calcite cement.
Characteristics of the fluid inclusions
Petrographic characteristics of the fluid inclusions
The source rocks of the Xujiahe Formation in the study are mainly of type II2-III, with vitrinite reflectance greater than 1.3% and are in a stage of high maturity to overmaturity, which leads to the hydrocarbon inclusions being mainly composed of gaseous hydrocarbon inclusions in the Xujiahe Formation, with lesser amounts of bitumen inclusions and rare petroleum inclusions. Most of the gaseous hydrocarbon brine inclusions and their associated brine inclusions are distributed in the healing micro cracks of quartz in moniliforms. The gaseous hydrocarbon brine inclusions have a gas-liquid phase with a black bubble edge under TR and show a clear boundary with the liquid phase. The liquid phase is colorless and transparent, while the bubbles observed under UV are weak and white and the liquid phase is colorless (Figure 9(a-1) and (a-2)). The bitumen inclusions are black under TR and white fluorescence is observed under UV (Figure 9(b-1) and (b-2)). There are two kinds of brine inclusions, namely single liquid phase brine inclusions and vapor-liquid inclusions. Under TR, the inclusions are transparent and colorless with black edges and jumping bubbles, and show no fluorescence under UV (Figure 9(c)). The bubbles in the brine inclusions are relatively large and an oil ring is distributed around the bubbles, which fluoresces under UV (Figure 9(d)).
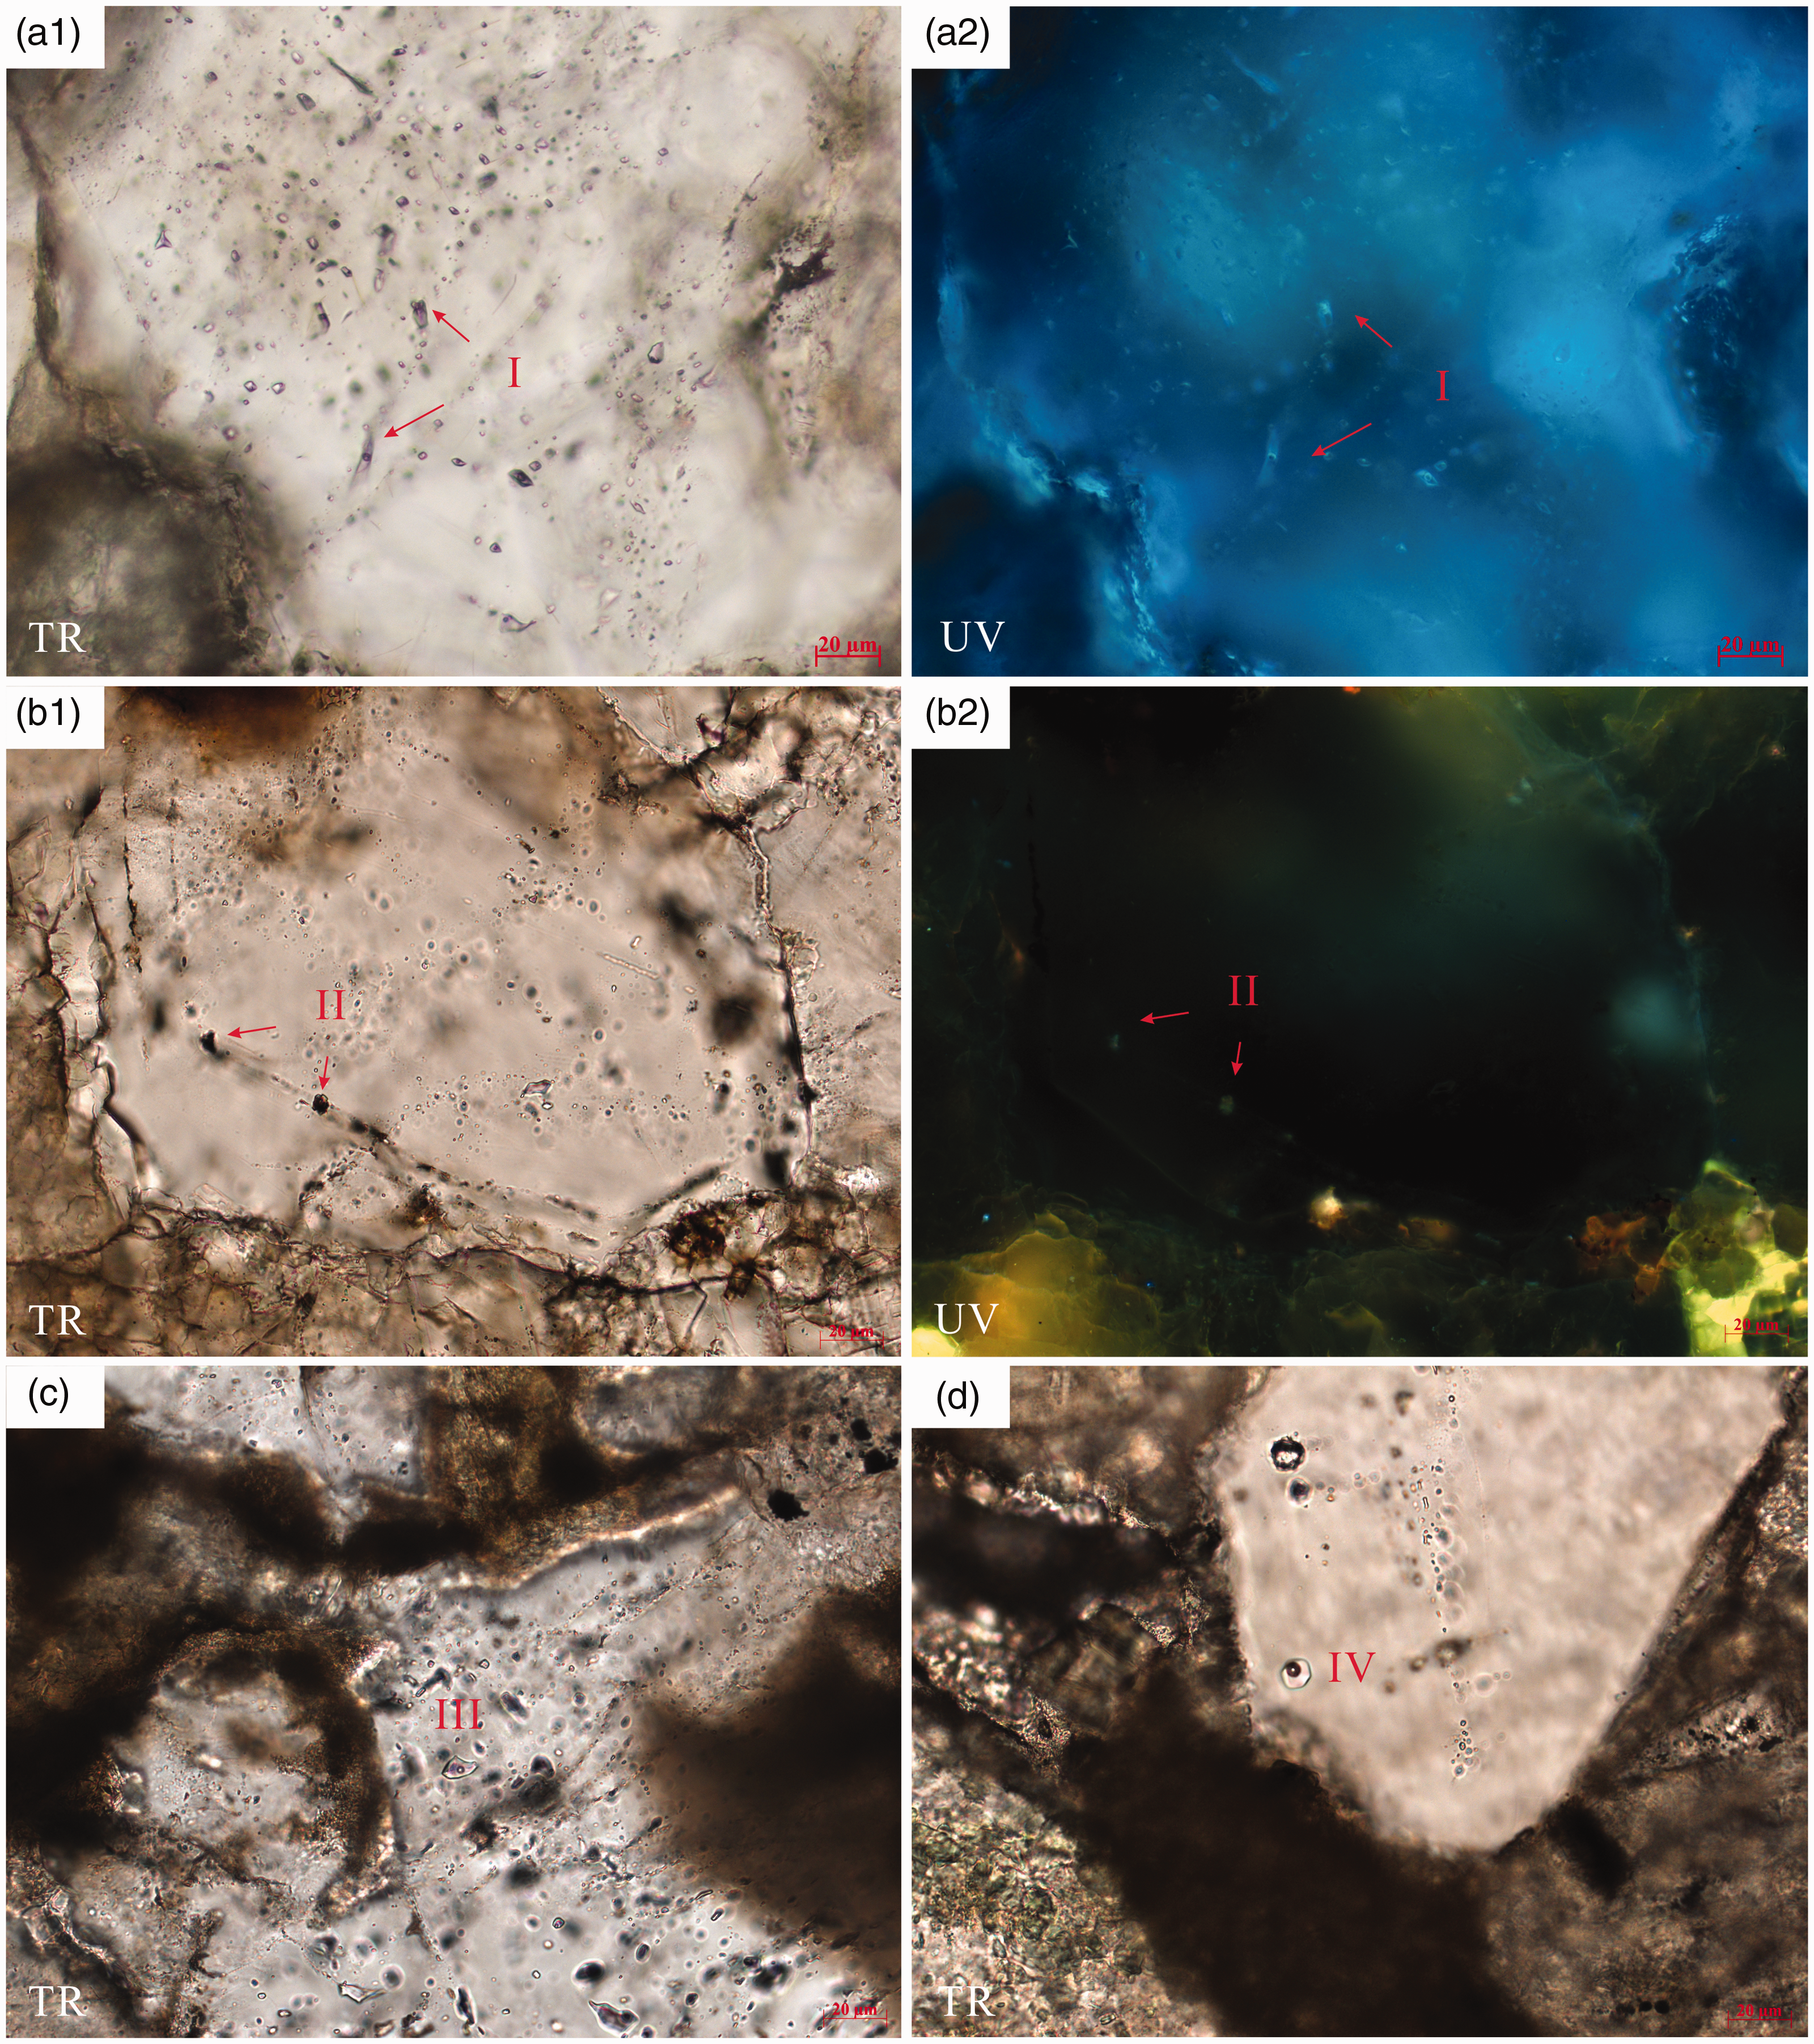
The micrograph of inclusions of the Xujiahe Formatiom in the northeast part of the Sichuan Basin. (a-1, a-2): Well YL4, 4513.08 m, gaseous hydrocarbon inclusions (I) in the dense distribution. (b-1, b-2) Well YL15, 4628.5 m, bitumen inclusions (II) distribute along the healing microcrack of the quartz. (c) Well YB10, 4928.29 m, brine inclusions including single liquid phase brine inclusions and vapor-liquid inclusions. (d) Well YL11, 4623.5 m, an oil ring is distributed around the bubbles (IV).
The vapor-liquid ratios of fluid inclusions
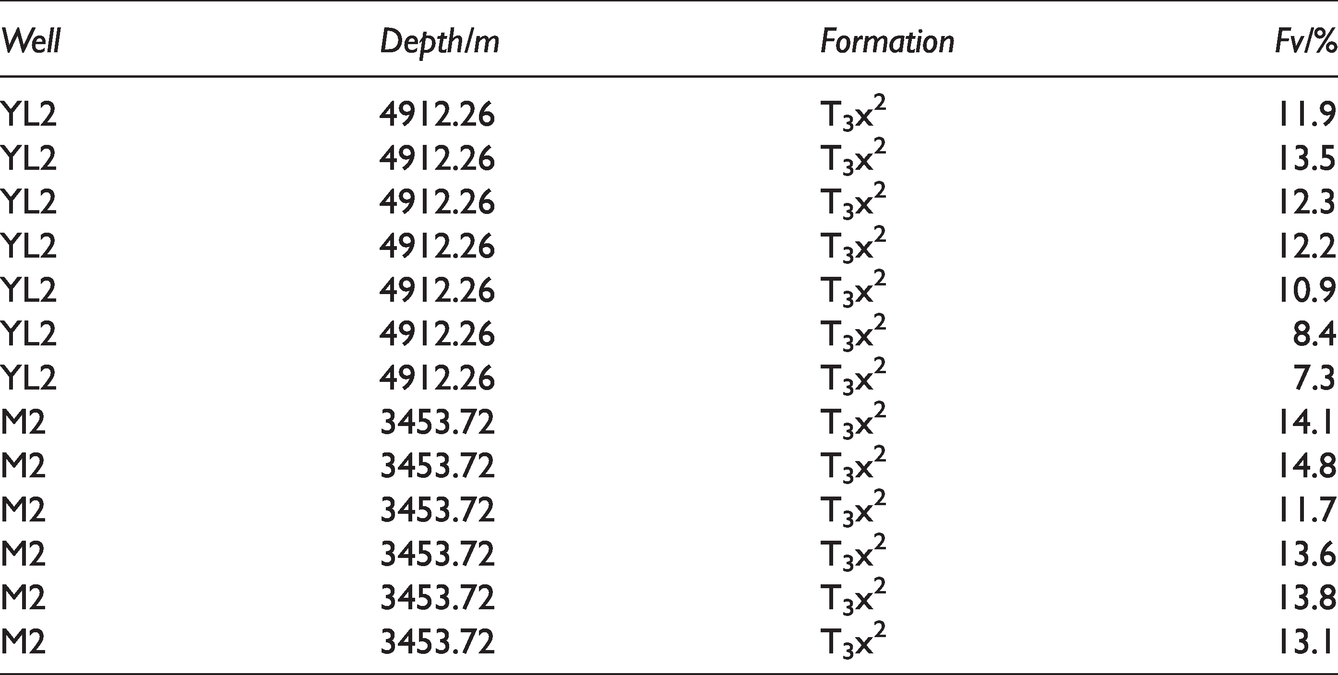
The vapor-liquid ratios (Fv) of the gaseous hydrocarbon brine inclusions were tested and the data were obtained as is shown in Table 2. The vapor-liquid ratios of the gaseous hydrocarbon brine inclusions in the Xujiahe Formation in the study area range from 7.3% to 14.8%.
Vapor-liquid ratios of inclusions in the Xujiahe formation in the northeast part of the Sichuan Basin.
Components of the fluid inclusions
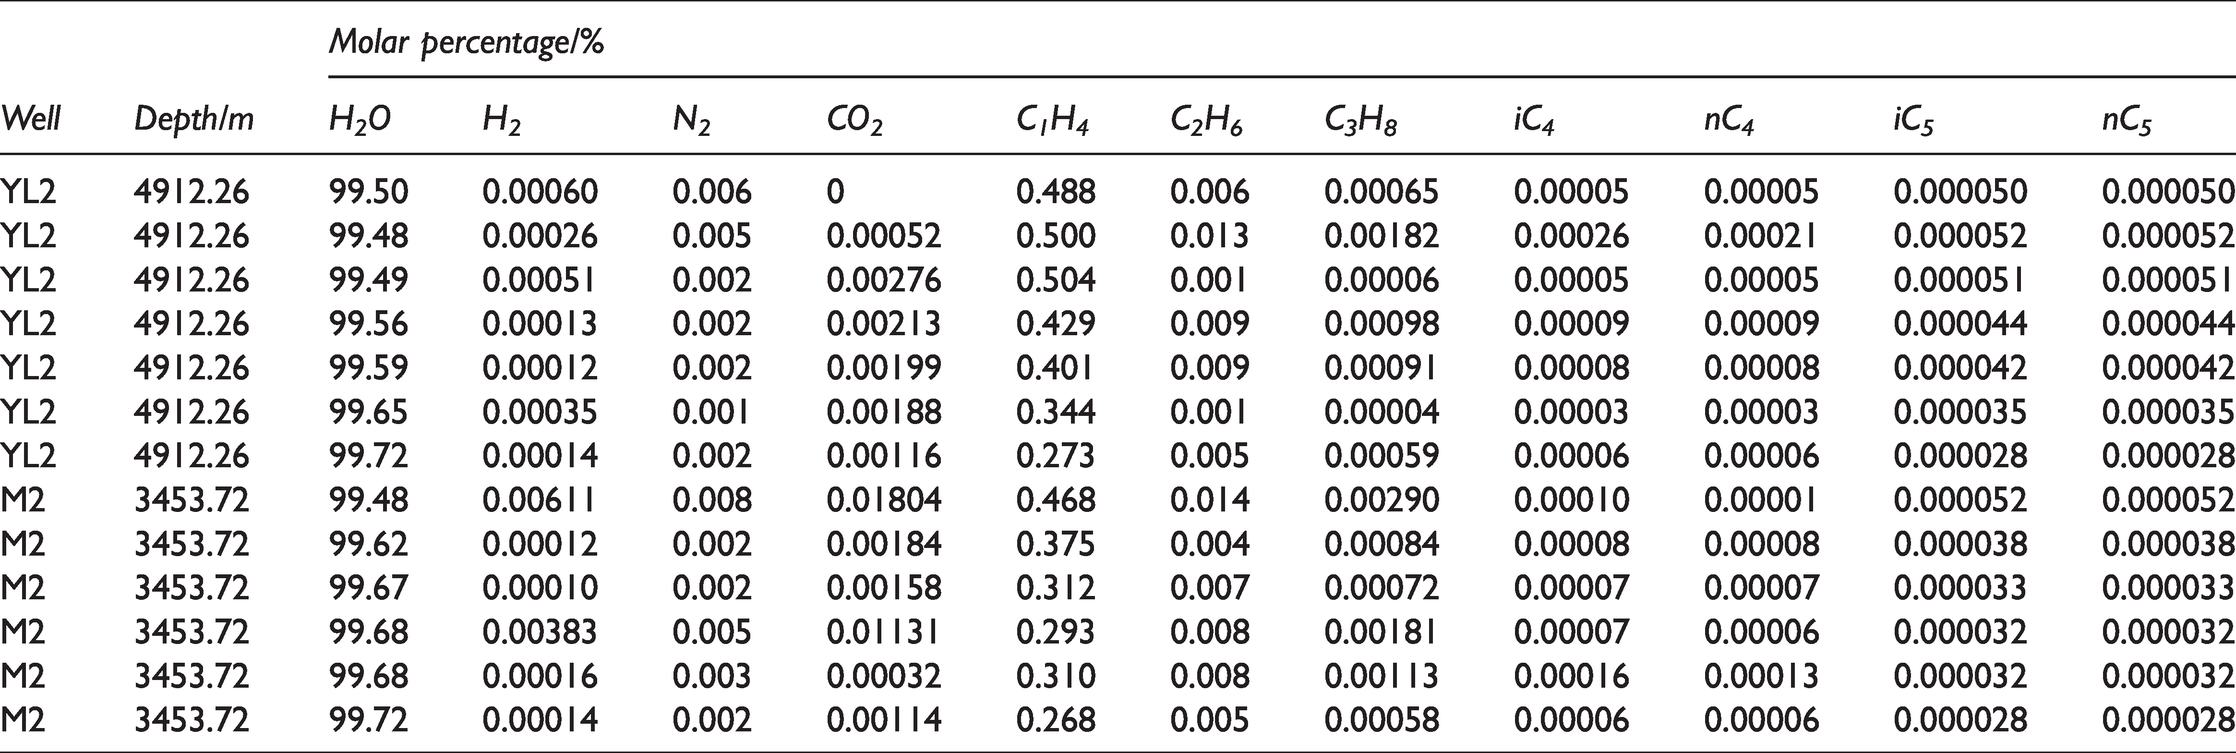
Table 3 shows the gas compositions of the gaseous hydrocarbon brine inclusions in the Xujiahe Formation in the study area. The CH4 content is the highest (0.268%–0.504%) and the C5H12 content is the lowest (0.000028%–0.000052%). The content of H2 in the inorganic gas is 0.00010%–0.00611%, the content of N2 is 0.001%–0.008%, and the content of CO2 is 0–0.01804%.
Simulation results of components of the hydrocarbon inclusions in the Xujiahe Formation in the northeast part of the Sichuan Basin.
Homogenization temperatures
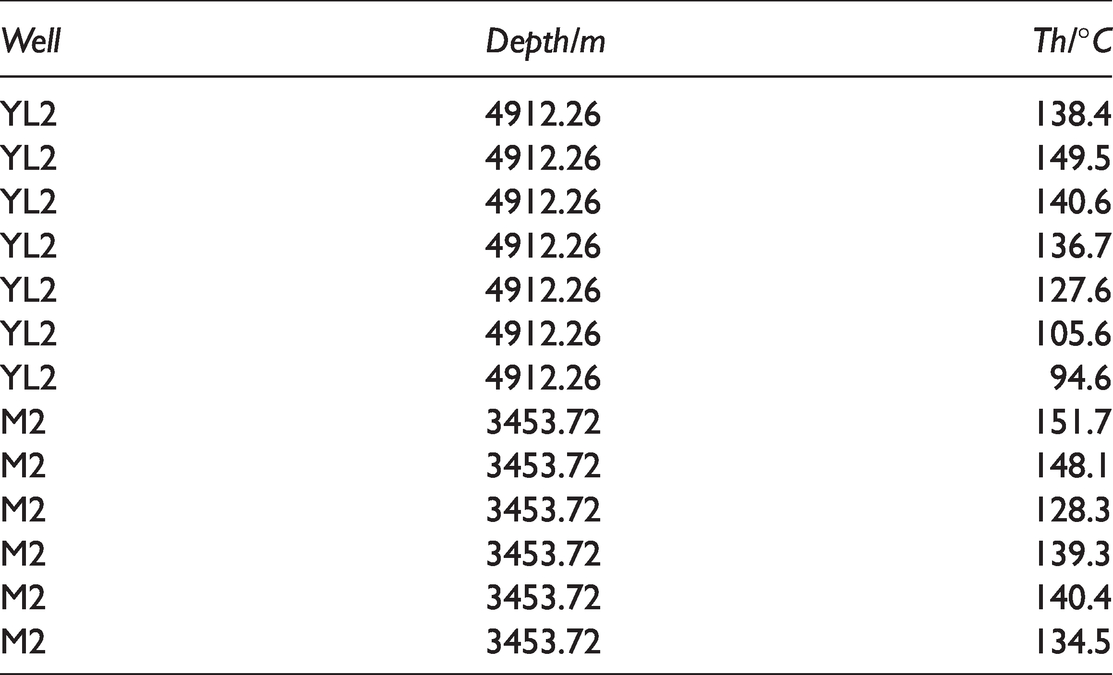
Table 4 shows the homogenization temperatures (Th) of the gaseous hydrocarbon brine inclusions and the associated inclusions. The depths of the inclusion samples range from 3,453.72 m to 4,912.26 m. All gaseous hydrocarbon brine inclusions and the associated inclusions could be changed from a gas-liquid two-phase state to a liquid phase by heating. The homogenization temperatures of the gaseous hydrocarbon inclusions range from 94.6°C to 151.7°C.
Homogenization temperatures of inclusions of the Xujiahe formation in the northeast part of the Sichuan Basin.
The evolution of paleo-pressure
The evolution process of paleo-pressure
The PVT simulation results of the inclusion trapping pressures are listed in Table 5. The simulation results show that the paleo-pressure ranges from 33.1 MPa to 77.5 MPa, and that the pressure coefficient ranges from 1.03 to 1.99 from the Middle Jurassic period to the Early Cretaceous period.
Simulation results of trapping pressure of the Xujiahe formation in the northeast part of the Sichuan Basin.
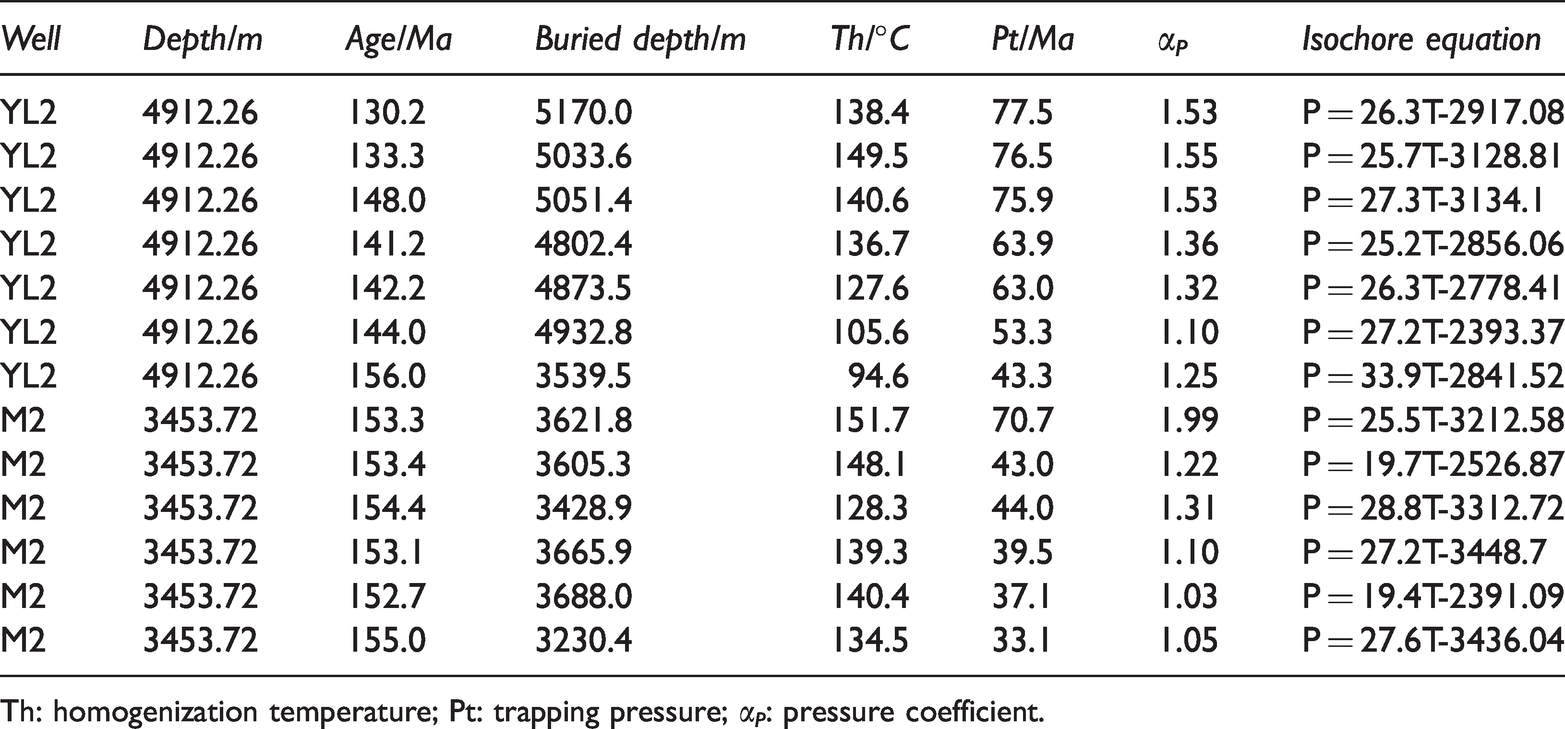
Th: homogenization temperature; Pt: trapping pressure; αP: pressure coefficient.
Figure 10 shows the formation pressure evolution process of the Xujiahe Formation by basin simulation. As shown in the pressure evolution diagram, from the Middle Jurassic period to the present, the formation pressure of the Xujiahe Formation in the study area underwent a process of “accretion-reduction” on the whole (Figure 10A, a), while the formation pressures of some wells underwent a process of “accretion-reduction-increase.” (Figure 10 B, b) The Xujiahe Formation in the study area has developed overpressure since the Middle Jurassic, when the formation pressure was approximately 20 MPa and the pressure coefficient was approximately 1.18, which belongs to a weak overpressure state. From the Middle Jurassic to the early Late Cretaceous, the formation pressure increased rapidly to 80–90 MPa with a pressure coefficient of 1.50–1.60, which belongs to a strong overpressure state. From the early Late Cretaceous period to the Oligocene period, the formation pressure decreased to approximately 55–75 MPa, and the pressure coefficient was 1.30–1.45, which belonged to an overpressure state. From the Oligocene period to the present, the formation pressure increased to 55–70 MPa and the main pressure coefficient was 1.50–1.60, which was considered to be overpressure.
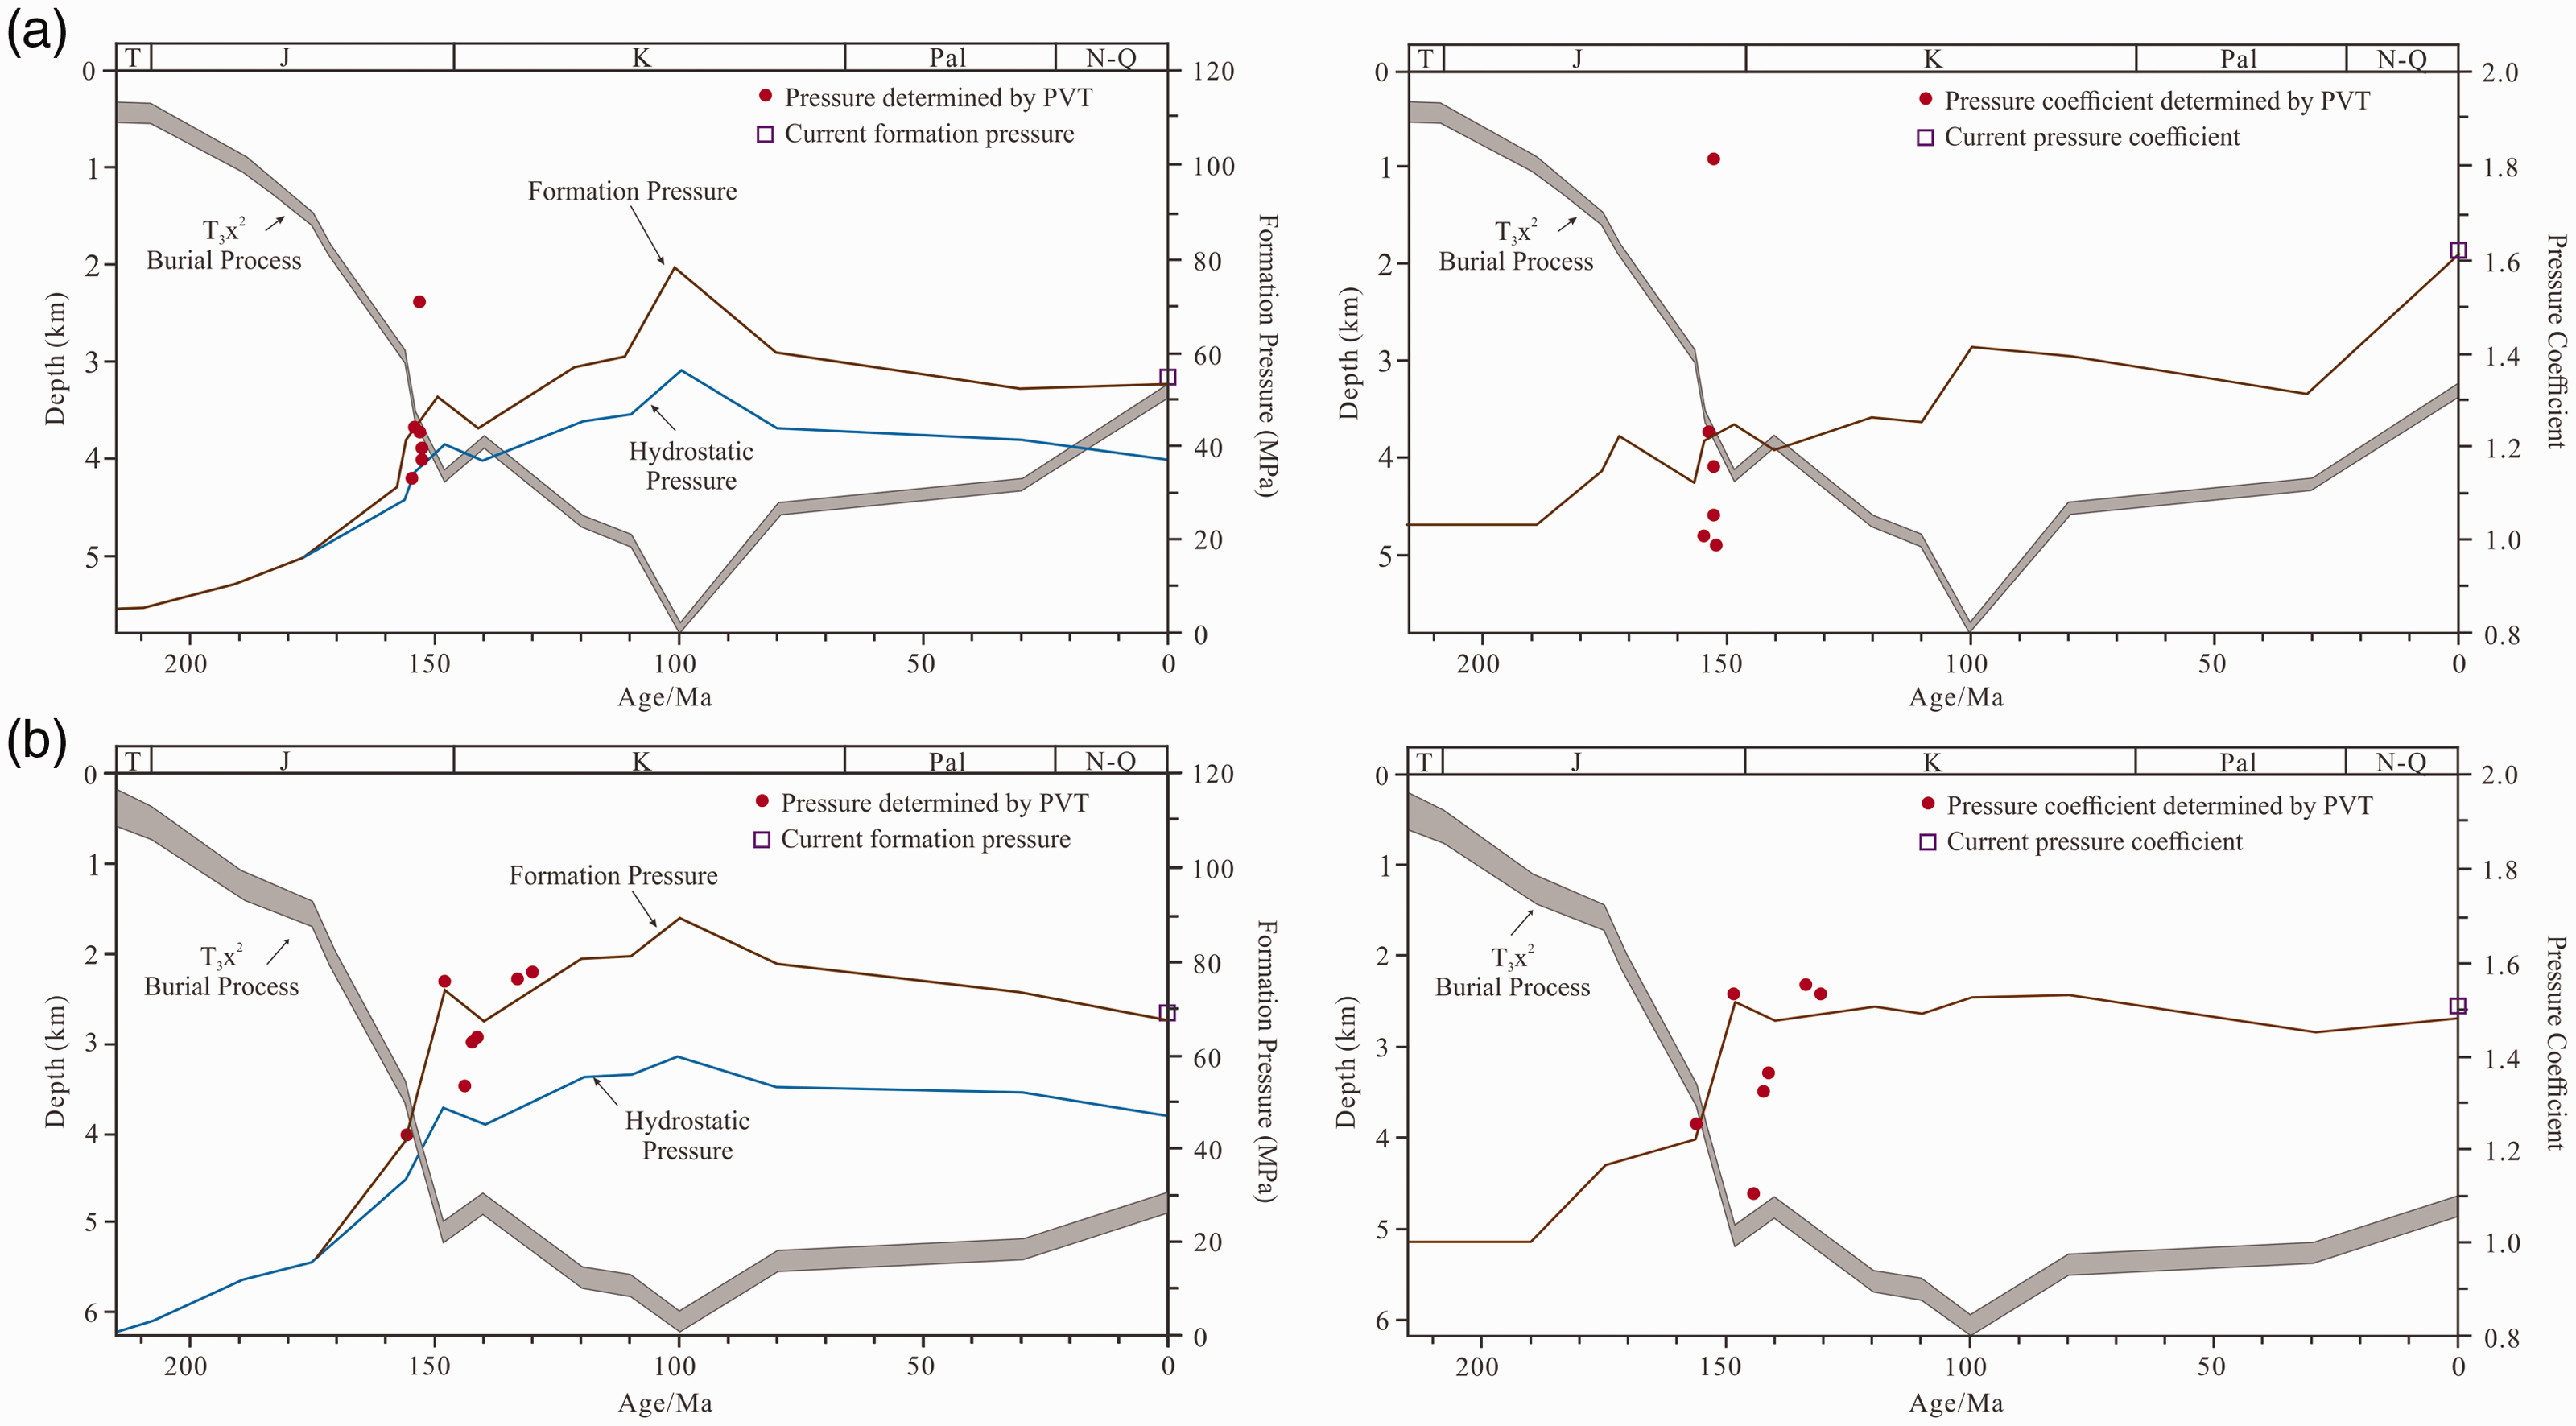
Evolution process of paleo-pressure and pressure coefficient of the Xujiahe Formation in the northeast part of the Sichuan Basin. (a) evolution process of pressure and pressure coefficient of the second member of the Xujiahe Formation of well M2. (b) Evolution process of pressure and pressure coefficient of the second member of the Xujiahe Formation of well YL2.
The plane distribution of paleo-pressures
By using the above methods, the paleo-pressure evolution processes of 16 wells were recovered, so the paleo-pressures of the reservoirs during the key charging period could be obtained and the distribution of the paleo-pressure plane of the reservoir during the key filling period could also be obtained.
The intensity of hydrocarbon generation of the source rocks in the western part of the third member of the Xujiahe Formation is greater than that in the eastern part of the study area (Zheng et al., 2019). Affected by the hydrocarbon generation intensity, the excess pressure in the second member of the Xujiahe Formation in the study area ranged in the Late Jurassic period from 1.3 to 10.7 MPa (Figure 11(a)). The excess pressure range in the western region was 2.0–7.3 MPa, while it was 1.3–8.2 MPa in the eastern region. At the same time, wells YL2, YL172, YL175, and M103 are overpressure centers whose excess pressures change rapidly, while the distribution of excess pressure in other areas changes relatively evenly. In the Early Cretaceous period, the range of the excess pressure of the second member of Xujiahe Formation was 9.8–30.1 MPa in the western region (Figure 11(b)). Among these, the range of the excess pressure was 13.0–28.0 MPa in the western region and was relatively evenly distributed; the range was 9.8–30.1 MPa and the difference between different well locations was great. Except for wells M3 and YL175, the excess pressure was relatively low in the other areas. Overall, the excess pressure in the western region is larger than in the eastern region.
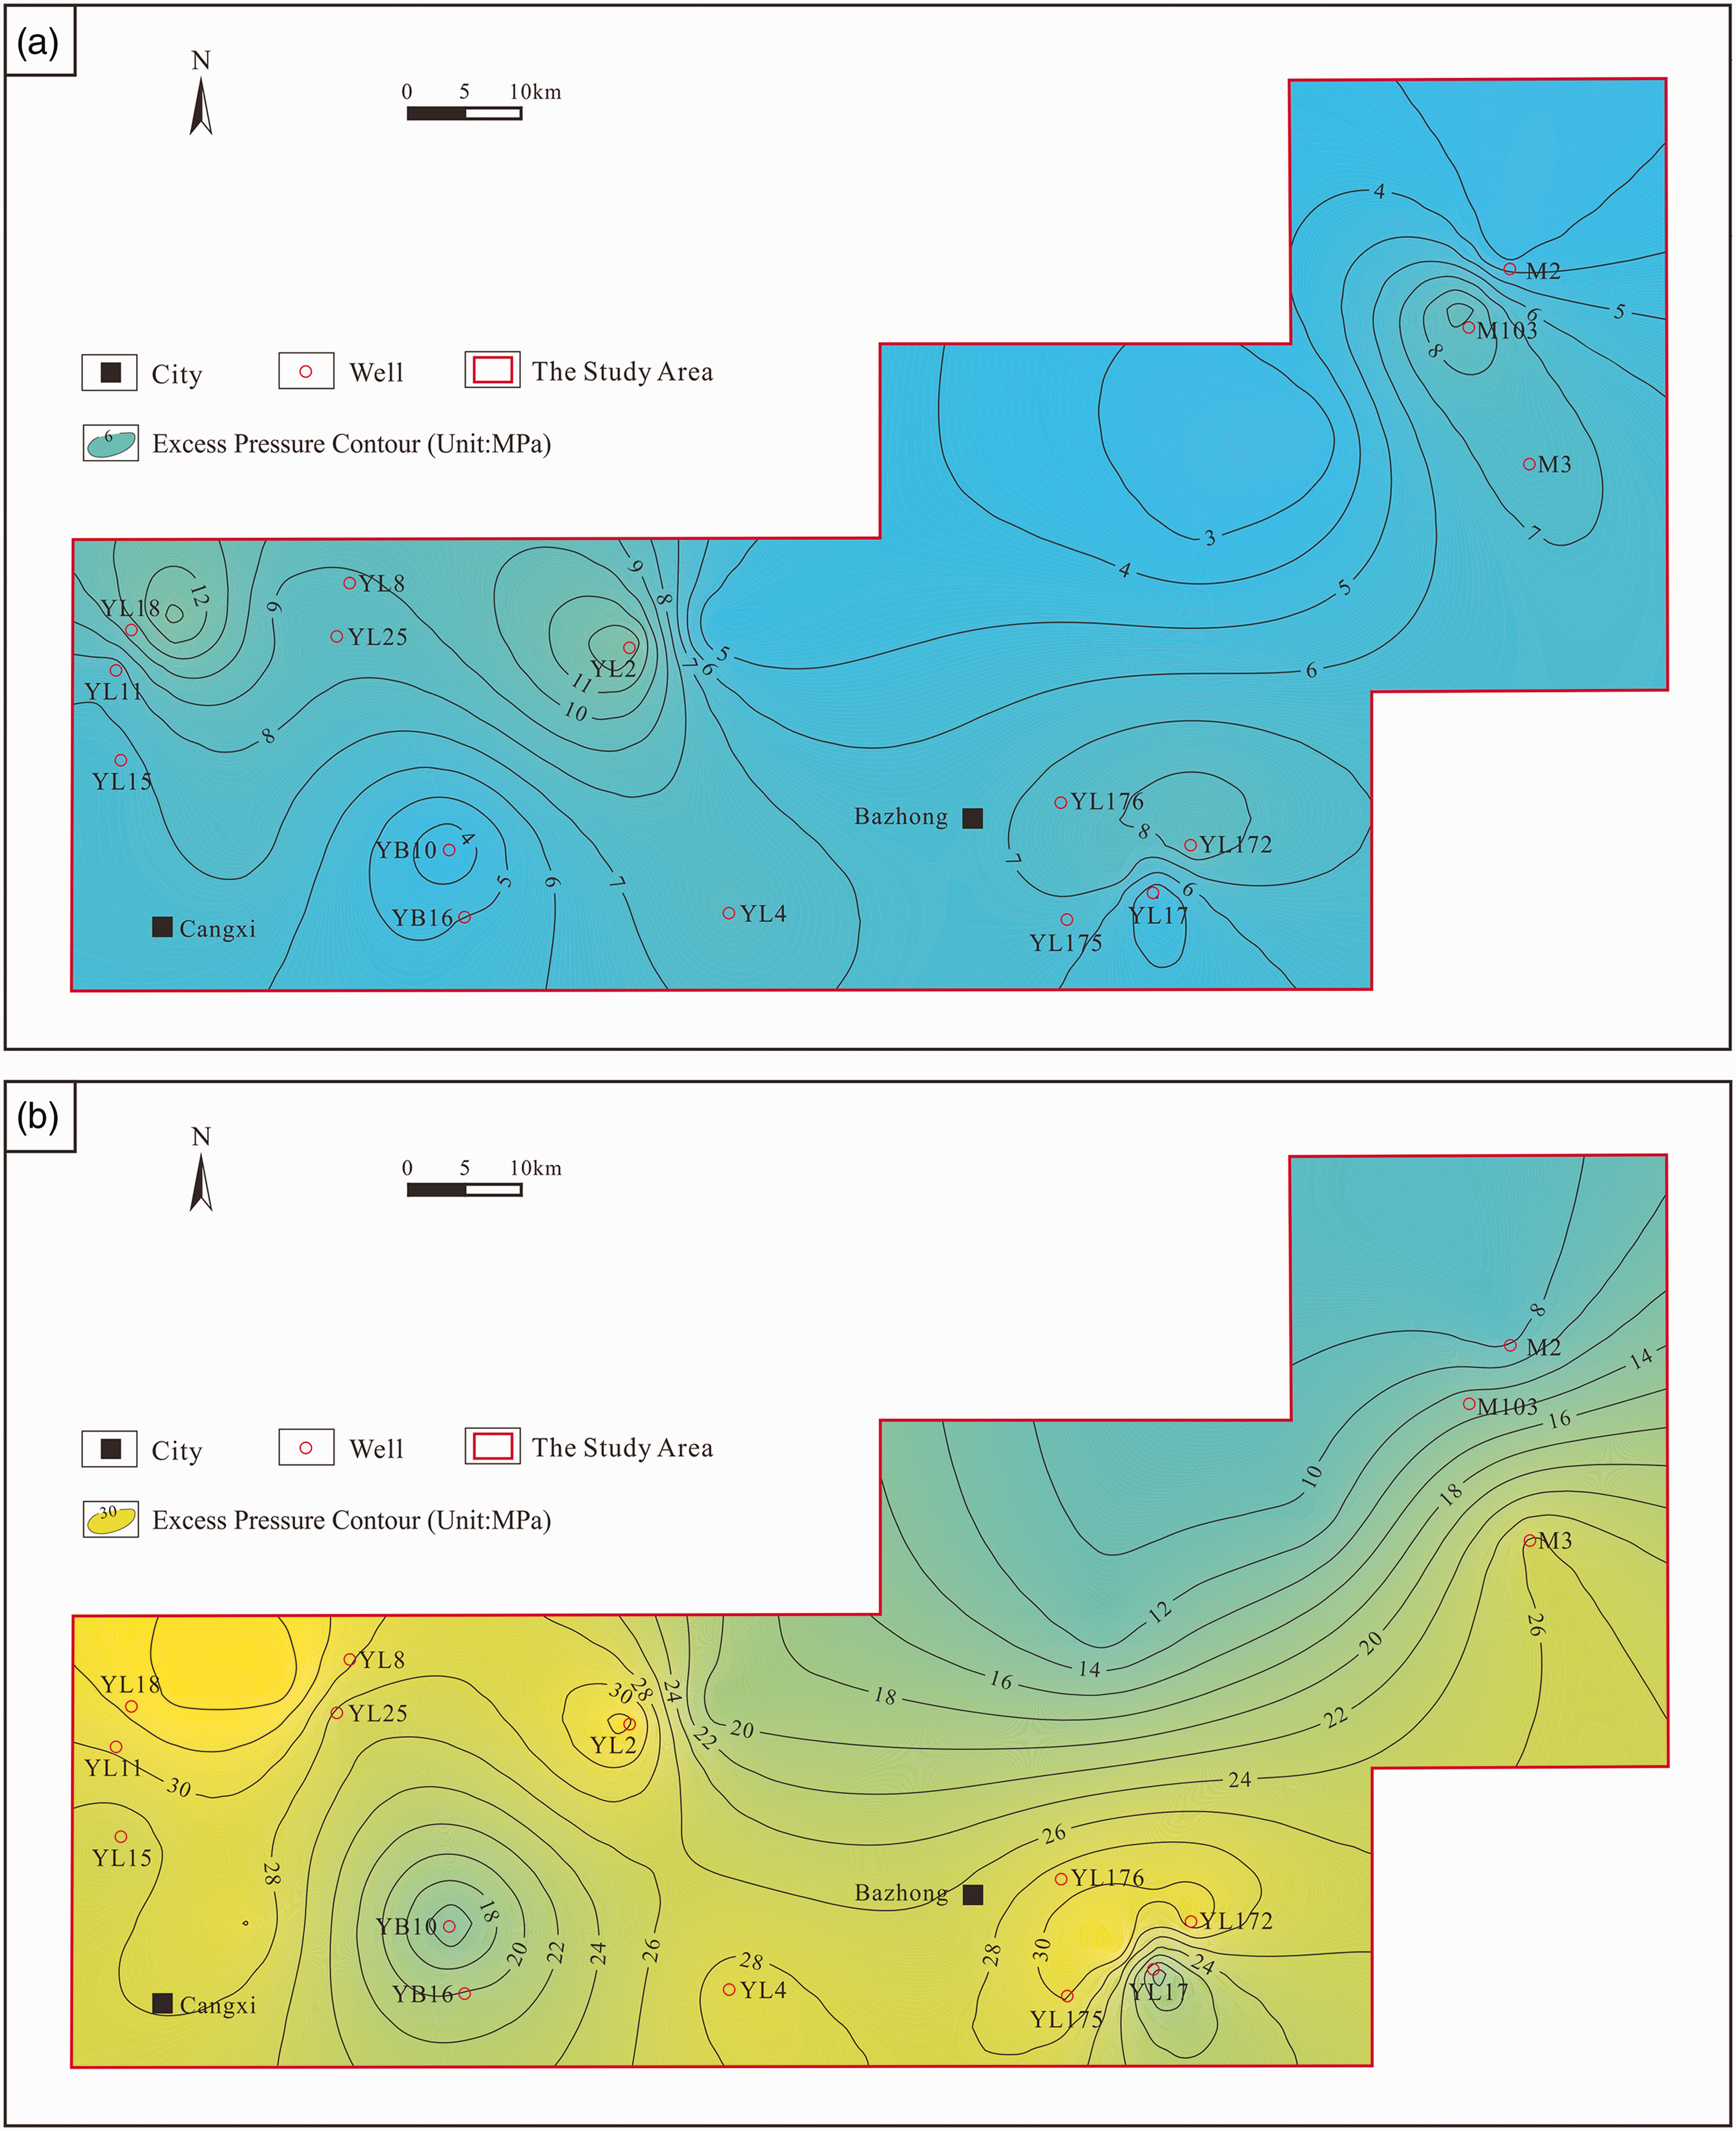
The plane distribution of excess pressure in the second member of the Xujiahe Formation in the northeast part of the Sichuan Basin. (a) Late Jurassic. (b) Early Cretaceous.
Causes of paleo-pressure
Determination of the causes of overpressure
With increases of burial depth, sonic travel time’s decrease, and the resistivity, density, and effective vertical stress increase, which is the change rule for normal compaction. The formation of overpressure in the Xujiahe Formation shows the phenomenon of the sonic travel time increasing while the effective vertical stress, density, and resistivity decrease slightly, which indicates that the cause of overpressure is the fluid expansion that exists in the Xujiahe Formation (Figure 12). By comparing the pressure coefficients, excess pressures, and TOCs of the overpressure zones of the Xujiahe Formation, it can be determined that the increase of formation pressure is consistent with the increase of TOC (Figure 13), indicating that hydrocarbon generation is the most critical component of fluid expansion. Additionally, there is a decrease in sonic travel time and the effective vertical stress remains unchanged with the increases in resistivity and density. The variation law for this logging data indicates that there is also overpressure caused by tectonic compression in the Xujiahe Formation.
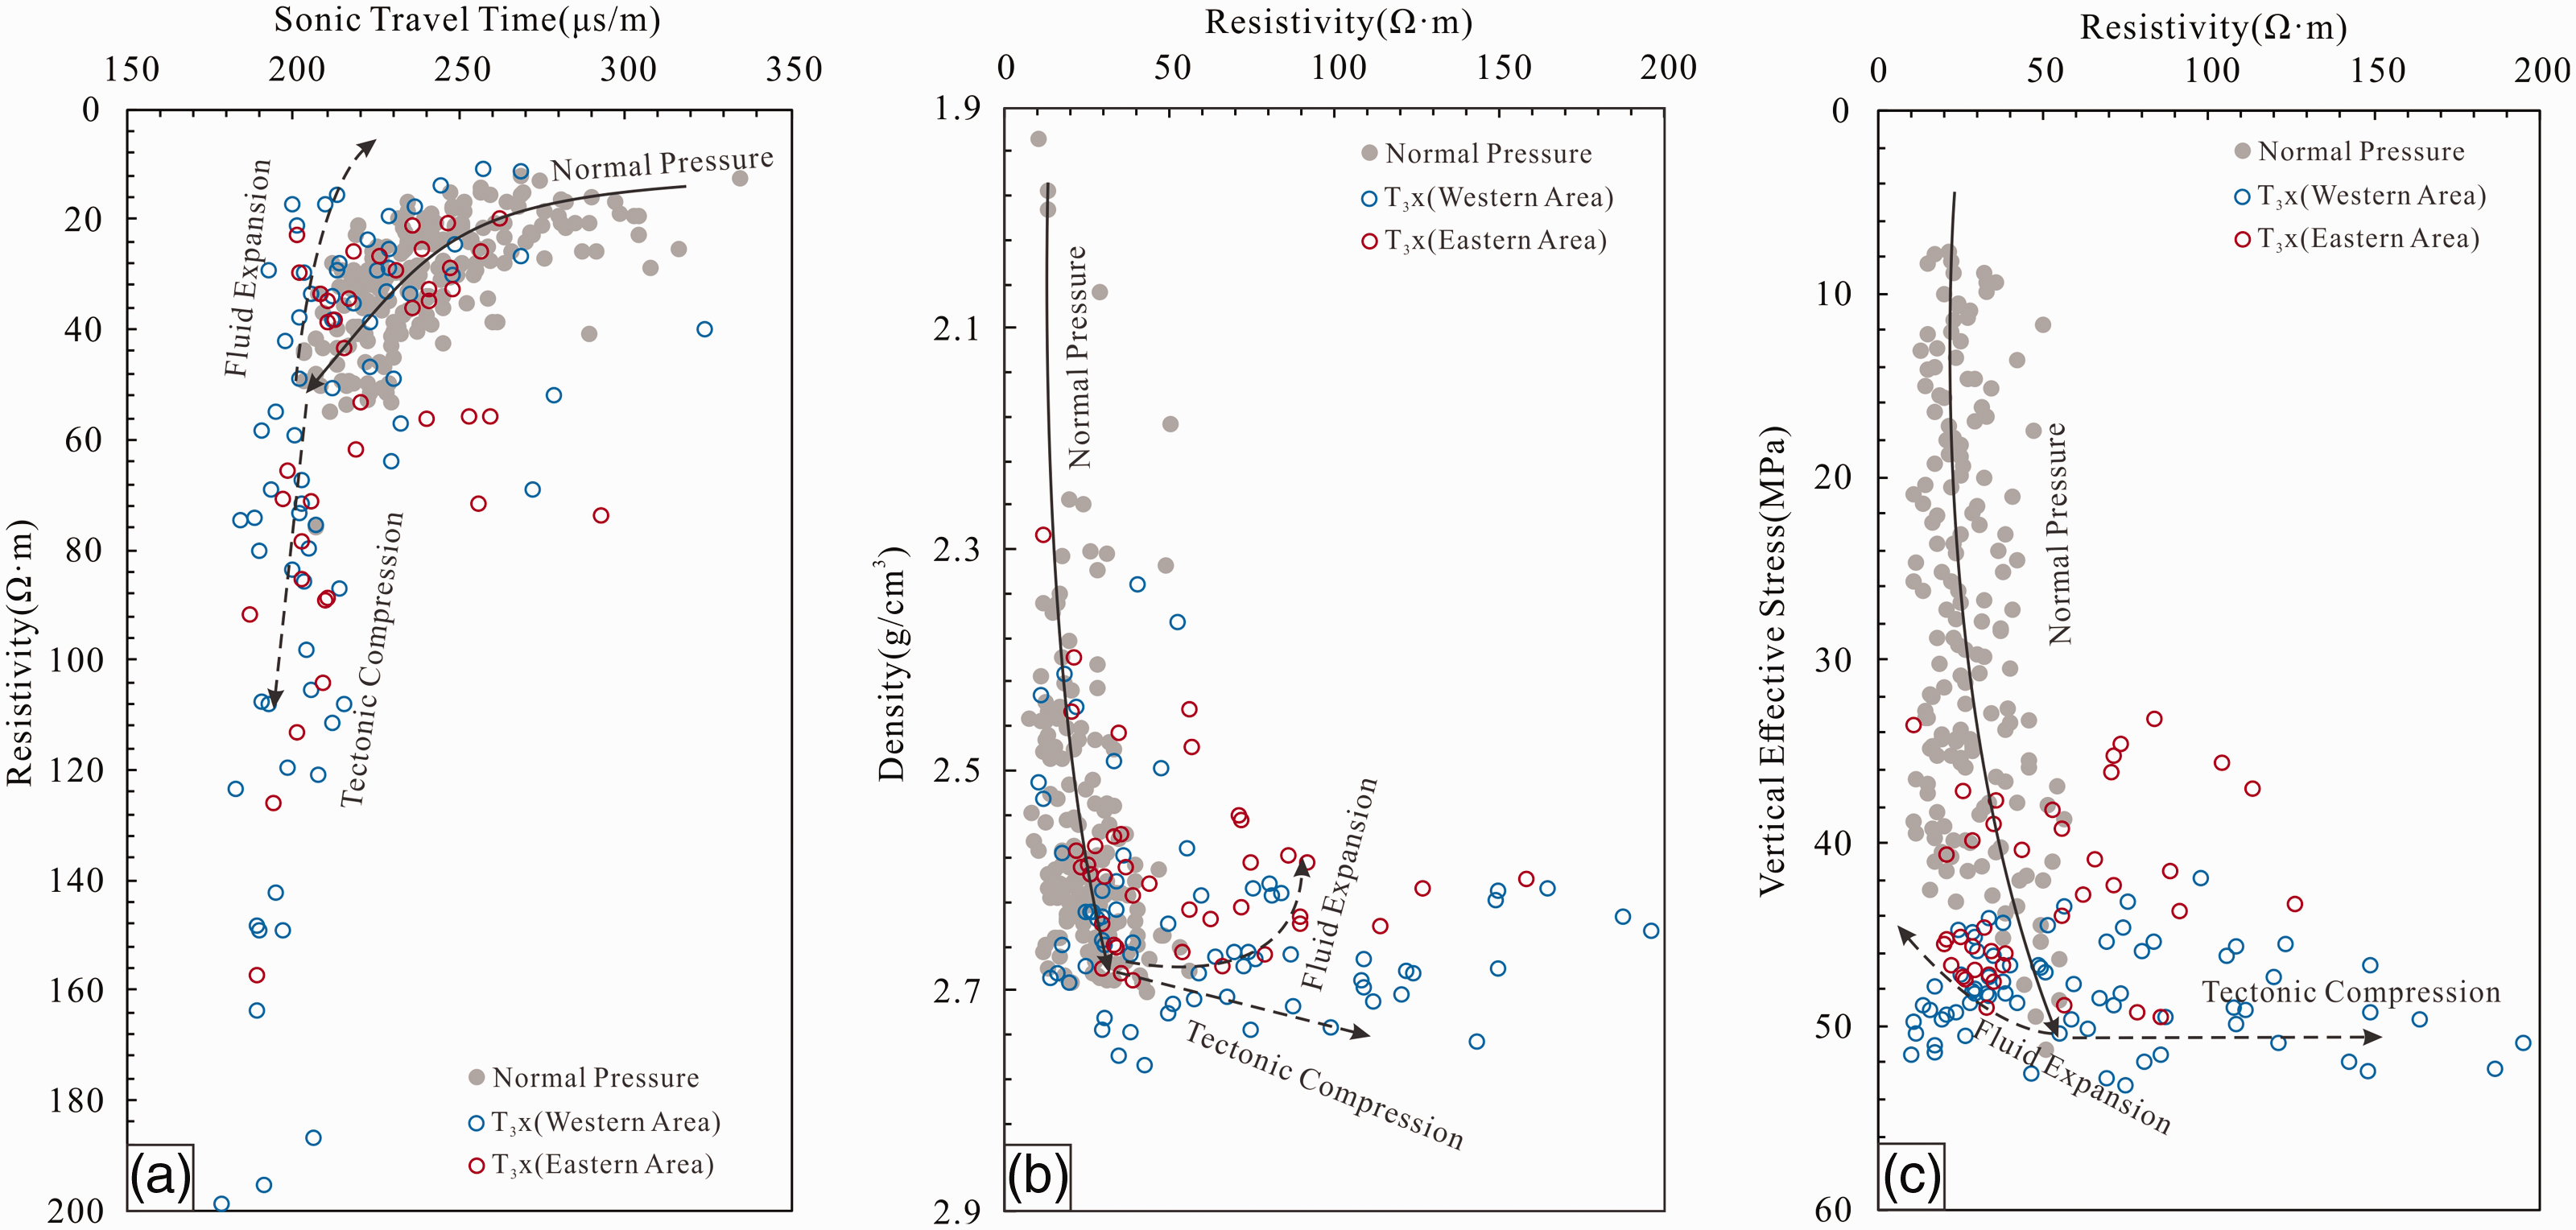
Determination diagrams of causes of overpressure. (a) Sonic Travel Time-Resistivity. (b) Resistivity-Density. (c) Resistivity-Vertical Effective Stress.
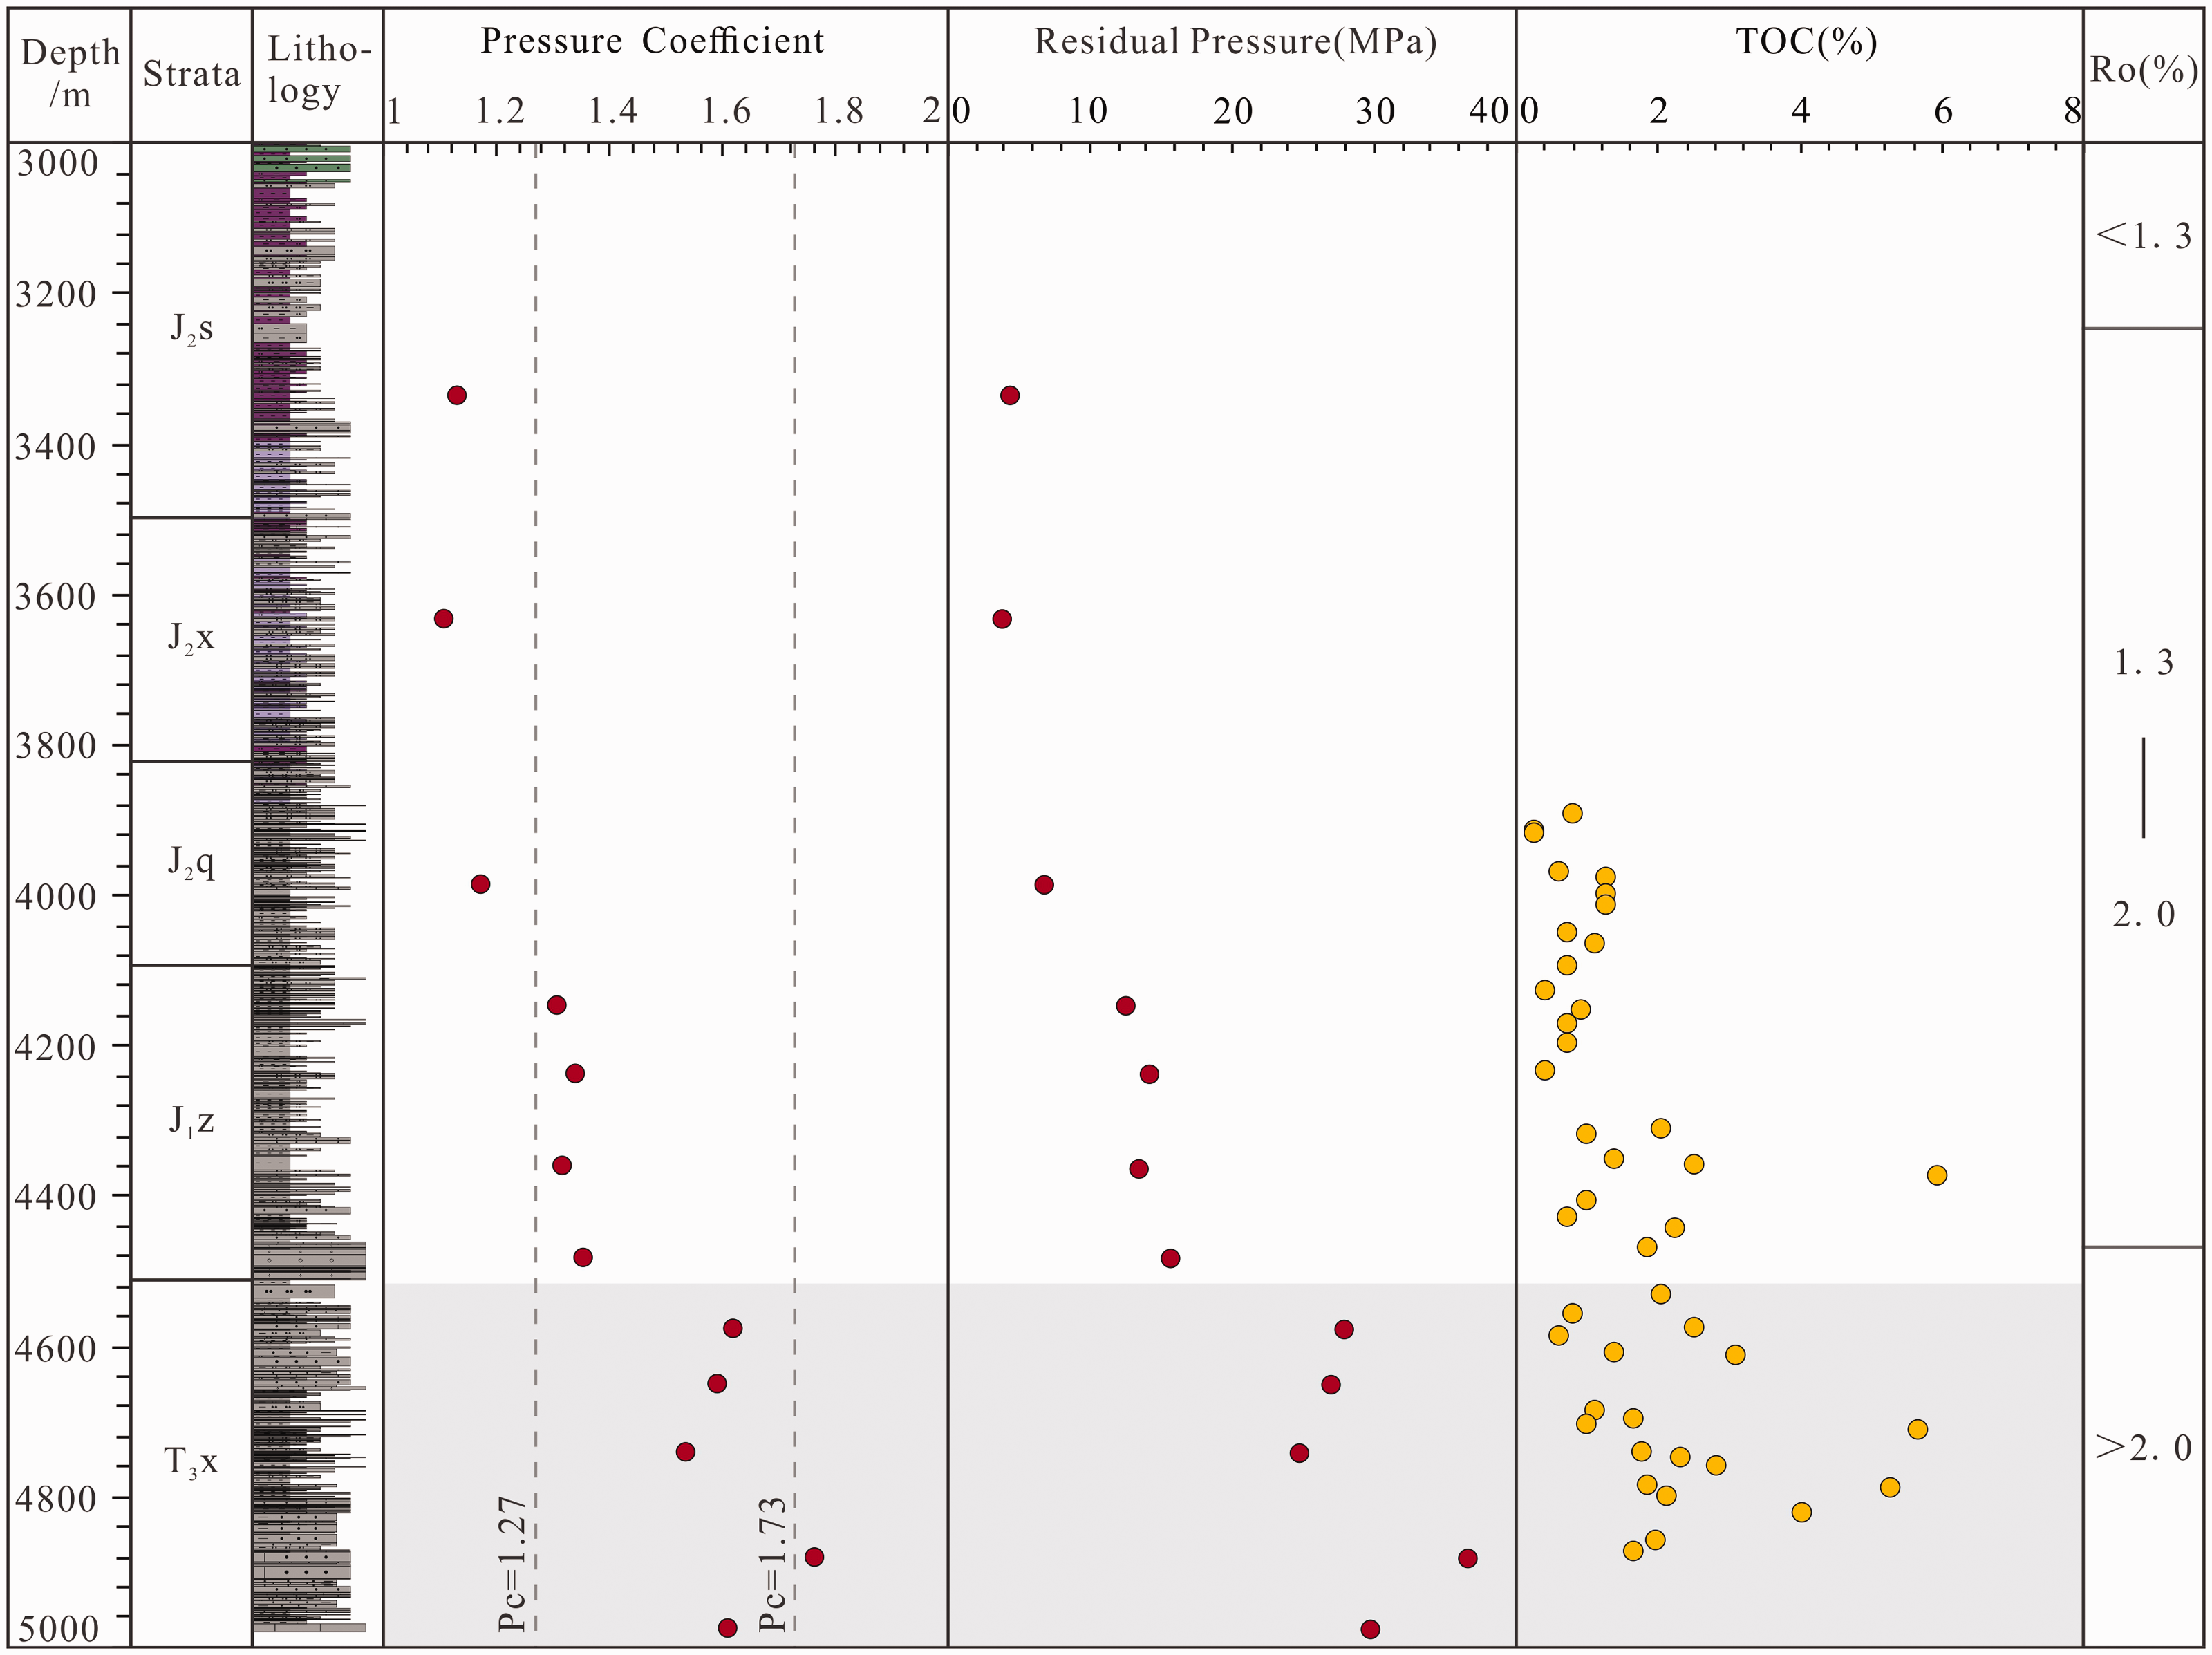
Relationship of pressure coefficient, residual pressure, TOC, and Ro with depth in well YL2.
The causes of paleo-pressure
The paleo-pressures of the reservoirs of the Xujiahe Formation in the study area have developed overpressure since the Middle Jurassic period, and the evolution process of formation pressure has experienced a process of increasing, decreasing, and then increasing again.
From the Middle Jurassic to the Early Cretaceous period, the paleo-pressure of the reservoirs increased rapidly. The organic matter present entered a low maturity stage and began to generate natural gas, as indicate by Ro values of 0.5% in the Middle Jurassic period when the Xujiahe Formation had undergone strong compaction. This resulted in the reservoir porosities falling to 10%–15% and to tight contacts between the reservoir particles. In the Late Jurassic period, the cementation further densified the reservoirs in the Xujiahe Formation. In the late Early Cretaceous, the Ro values of organic matter had reached 2.0%, which meant that the organic matter was in an over mature stage and underwent thermal pyrolysis to generate dry gas. The higher the TOC and hydrocarbon generation intensity, then the higher the formation pressure. The reservoir overpressure distribution in the Suji section is close to the hydrocarbon generation strength distribution in the hydrocarbon source rocks, resulting in a distribution of excess pressure in the Early Cretaceous period with high in the south and low in the north, as well as high in the southwest and low in the northeast.
For the formation pressures, in the Middle Jurassic, the excess pressure in the Xujiahe Formation was approximately 3 MPa and the pressure coefficient was 1.28; in the early Late Cretaceous period, the excess pressure had reached approximately 38 MPa and the pressure coefficient was approximately 1.9.
From the Late Cretaceous to the Oligocene, under the influence of the Yanshanian movement, the Longmenshan area experienced a thrust-nappe effect and the Micangshan Mountain and Dabashan Mountain areas began to rise rapidly. At this time, the strata of the Xujiahe Formation in the study area were mainly extruded by tectonic compression along a NW direction, which led to uplift erosion and a series of NE directional faults. The Cretaceous was the main formation period for faults in the western and eastern parts of the study area. The faults connecting the overlying strata were conducive to the release of formation pressure in the Xujiahe Formation. At the same time, during the uplift erosion of the strata, the load of the upper strata and the strata temperatures decreased, the rock matrix sprang back, the volume of the formation fluid shrank, the pore space became larger, and the formation pressure decreased rapidly. Due to the different thicknesses of denudation in different structural portions, the rebound actions of rock matrix were also different. When the differential stress was so large that rupture shear occurred, the release of overpressure accelerated (Sibson, 1996; Tingay et al., 2009). However, since the increasing amount of overpressure produced by tectonic compression was less than the release amount of overpressure, the formation pressure in the Xujiahe Formation gradually decreased. In the Late Cretaceous period, the excess pressure in the Xujiahe Formation was around 38 MPa and the pressure coefficient was 1.9. By the end of the Oligocene period, the excess pressure had decreased to approximately 10 MPa and the pressure coefficient was 1.27.
From the Oligocene period to the present, the Longmenshan Mountain area has continued to experience a nappe effect. The Micangshan Mountain area has developed a NE directional nappe structure and the Dabashan Mountain has experienced further thrust-nappe effects. Numerous, large-scale NW and NS directional faults have formed as a result of the stronger tectonic compression from the NE direction. Since the Paleogene period, the faults have mainly formed in the eastern part of the study area, while the faults in the western part of the study area have been relatively undeveloped and are well preserved, resulting in the overall increase in the formation pressures in the western part of the study area due to structural compression, while the formation pressures generally have been decreased in the eastern part. In the Oligocene period, the excess pressure in the Xujiahe Formation was approximately 10 MPa and the pressure coefficient was 1.27. At present, the excess pressure of the Xujiahe Formation is 0–59 MPa and the pressure coefficient is 1.0–2.2.
Conclusions
The continental strata in the northeastern portion of the Sichuan Basin began to develop overpressure from the bottom of the Middle Jurassic Shangshaximiao Formation, and the main range of the present-day formation pressure coefficient in the Xujiahe Formation is 1.01–1.90, with the maximum pressure coefficients being as high as 2.22, which is in the range of normal pressure to strong overpressure. On the basis of fitting the area-depth relationships of the inclusions and fitting the area-depth functions of the bubbles and integrating them to calculate the vapor-liquid ratios and using the natural gas compositions to replace the current inclusions, the capture pressures of the gas hydrocarbon brine inclusions can be simulated by PVT simulation. The evolution process of the formation pressures can then be obtained by combining this data with the basin simulation. Hydrocarbon generation and tectonic compression are the main causes of overpressure in the Xujiahe Formation in the study area. The formation pressures of the Xujiahe Formation underwent evolution processes of “elevation-reduction-increase” (eastern area) and “elevation-decrease” (western area). Overpressure developed from the Middle Jurassic. From the Late Jurassic period to the early Late Cretaceous period, large amounts of hydrocarbon-generating source rocks rapidly increased the formation pressures and developed strong overpressure states. From the early Late Cretaceous period to the Oligocene period, the formation pressures mainly decreased due to tectonic uplift and faults and only weak overpressure or overpressure developed. From the Oligocene period to the present, due to the influence of the differences in tectonic compression and the faults in the Himalayan period, the formation pressures in the western area have increased, while the formation pressures in the eastern area have generally decreased. Due to the influence of hydrocarbon generation and expulsion from the source rocks in the study area, the excess pressure range in the second member of the Xujiahe Formation in the Late Jurassic period was 1.3–10.7 MPa, and the difference between the western region and the eastern region were small. By the Early Cretaceous period, the main excess pressure range was 9.8–30.1 MPa and the excess pressure in the western region were larger than that in the eastern region.
Footnotes
Declaration of conflicting interests
The author(s) declared no potential conflicts of interest with respect to the research, authorship, and/or publication of this article.
Funding
The author(s) disclosed receipt of the following financial support for the research, authorship, and/or publication of this article: This study was financially supported by the Fundamental Research Funds for the Central Universities, the Development Fund of Key Laboratory of Deep Oil & Gas (20CX02110A), and the National Natural Science Foundation of China (41702142).