
Abstract
CO2-enhanced coalbed methane (CO2-ECBM) can improve coalbed methane production efficiency and simultaneously alleviate greenhouse gas emissions. In this paper, we integrated TOUGH2 and FLAC3D numerical simulation software to conduct hydro-mechanical coupling analysis for effects of hydrofracturing and secondary fracturing in CO2-ECBM. The simulation results show that the hydrofracturing and secondary fracturing treatments significantly increase the coal seam interconnectivity, enhancing overall injection and production. The reduction of the pore pressure near injection wells can effectively reduce the damage of gas injection well. Moreover, secondary fracturing can even increase cumulative gas production up to 32.5%. In addition to rising fracture density, increasing the fracture length is also considered an efficacious procedure for enhancing permeability in the secondary fracturing process.
Introduction
CO2-enhanced coalbed methane (CO2-ECBM) not only improves the gas recovery ratio (Godec et al., 2014) but also realizes CO2 emission reduction to ameliorate the greenhouse effect (Mazzotti et al., 2009; Pan et al., 2018; Reeves, 2010; Shen et al., 2018). It is therefore considered to be a win-win technology. CO2 would displace coalbed methane due to the strong adsorption capacity of coal and improve the production of CBM (Kumar et al., 2014; White et al., 2005).
The simultaneous CO2 injection and CH4 extraction process is believed to be a complex hydro-mechanical coupling process. The changes in effective stress caused by variations of pore pressure and adsorption/desorption-induced strains result in the evolution of permeability (Bustin et al., 2008; Connell and Detournay, 2009; Gu and Chalaturnyk, 2005; Lin et al., 2008; Ma et al., 2020b; Pan et al., 2018; Wang et al., 2009). Generally, strain-based and stress-based permeability models have been widely used in CBM production and CO2-ECBM. Pan et al. conducted a series of measurements about coal permeability for CO2-ECBM, and the evolution of permeability under different stress conditions was illustrated (Pan et al., 2010). Fan et al. established a THM coupled model to study the gas migration during CO2-enhanced coalbed methane recovery (Fan et al., 2019). The simulation shows that the injection of CO2 has a significant influence on the permeability of the coal seam. Connell and Detournay investigated the coupled flow and geomechanical processes CO2-ECBM by linking gas reservoir simulator SIMED II with the geomechanical model FLAC3D (Connell and Detournay, 2009). Ma et al. modeled the process of CO2-ECBM using the TOUGH-FLAC simulator, with consideration of the gas solubility. They revealed the impact of CO2 injection on the mechanical behaviors of the coal seam. Mechanical failure was induced near the injection well in the case with a very unfavorable stress field (Ma et al., 2017a).
As most of the coal reservoirs in China have low pressure and permeability, direct production is complicated and inefficient. The permeability of coal seam is one of the main parameters that affect gas production, and it is a controllable industry parameter that can be used to improve productivity. Hydrofracturing is a useful industrial technology for low permeability reservoir production. The fracture aperture is affected by normal stress and shear stress (Bai et al., 1999). Several numerical models have been developed to investigate the effects of fractures on flow patterns and gas production (Chen et al., 2017; Ma et al., 2020a; Wang, 2018). In these models, the geomechanical effects on fracture permeability are ignored. According to the parallel plate flow experiment, the relationship between the permeability and the opening degree of fracture is cubic. A small change in the fracture aperture results in a significant variation in permeability (Yuan, 2002), which should be considered.
In this study, the effects of hydrofracturing and secondary fracturing in CO2-enhanced coalbed methane with TOUGH-FLAC simulator with consideration of mechanical deformation on fracture permeability. Firstly, we perform a coupled THM simulation to investigate the influence of hydraulic fractures on fluid migration, stress evolution, and methane production. Then, we carry out a simulation case to examine the effect of secondary fracturing on injection and production efficiency. Finally, the influences of length and permeability of fractures are studied in a sensitivity analysis.
Mathematical model
Hydro-mechanical formulations
The general form of the fluid mass and energy balance equations is expressed as (Pruess et al., 1999)

The equation of solid deformation is shown as follows

Porosity and permeability changes
For the coal reservoir, we use the following stress-dependent porosity and permeability models (Ma et al., 2017b)
Ignoring the influence of fracture connectivity, we decomposed fracture permeability into the superposition of permeability in the three directions of x, y, and z, as shown in Figure 1 (Yuan, 2002).

The simplification of a fracture system with the parallel plate fracture flow model.
The permeability in a specific direction is determined by the opening degree of the vertical fracture and the matrix width. According to the cubic law, the expressions of permeability in all directions are obtained as follows


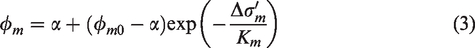
Equation (7) can be rewritten concerning the apertures of residual cracks

The relationship between fracture aperture and normal stress.
In the process of gas injection, the dilatancy effect caused by shear stress/strain affects the measurement of the fracture aperture (Bai et al., 1999)
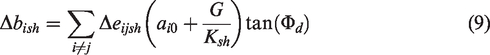

By introducing equation (10) into equation (5), we obtain
Also, the porosity of the fracture can be calculated as (Gan and Elsworth, 2016)

Geometric model and physical parameters
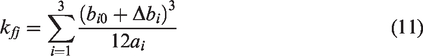
Figure 3 shows the description of a five-spot well distribution. The gas injection well is located in the middle, with four gas producing wells around it. Fractures generated by hydrofracturing are located in the horizontal direction of all the wells.
Five-spot well distribution.
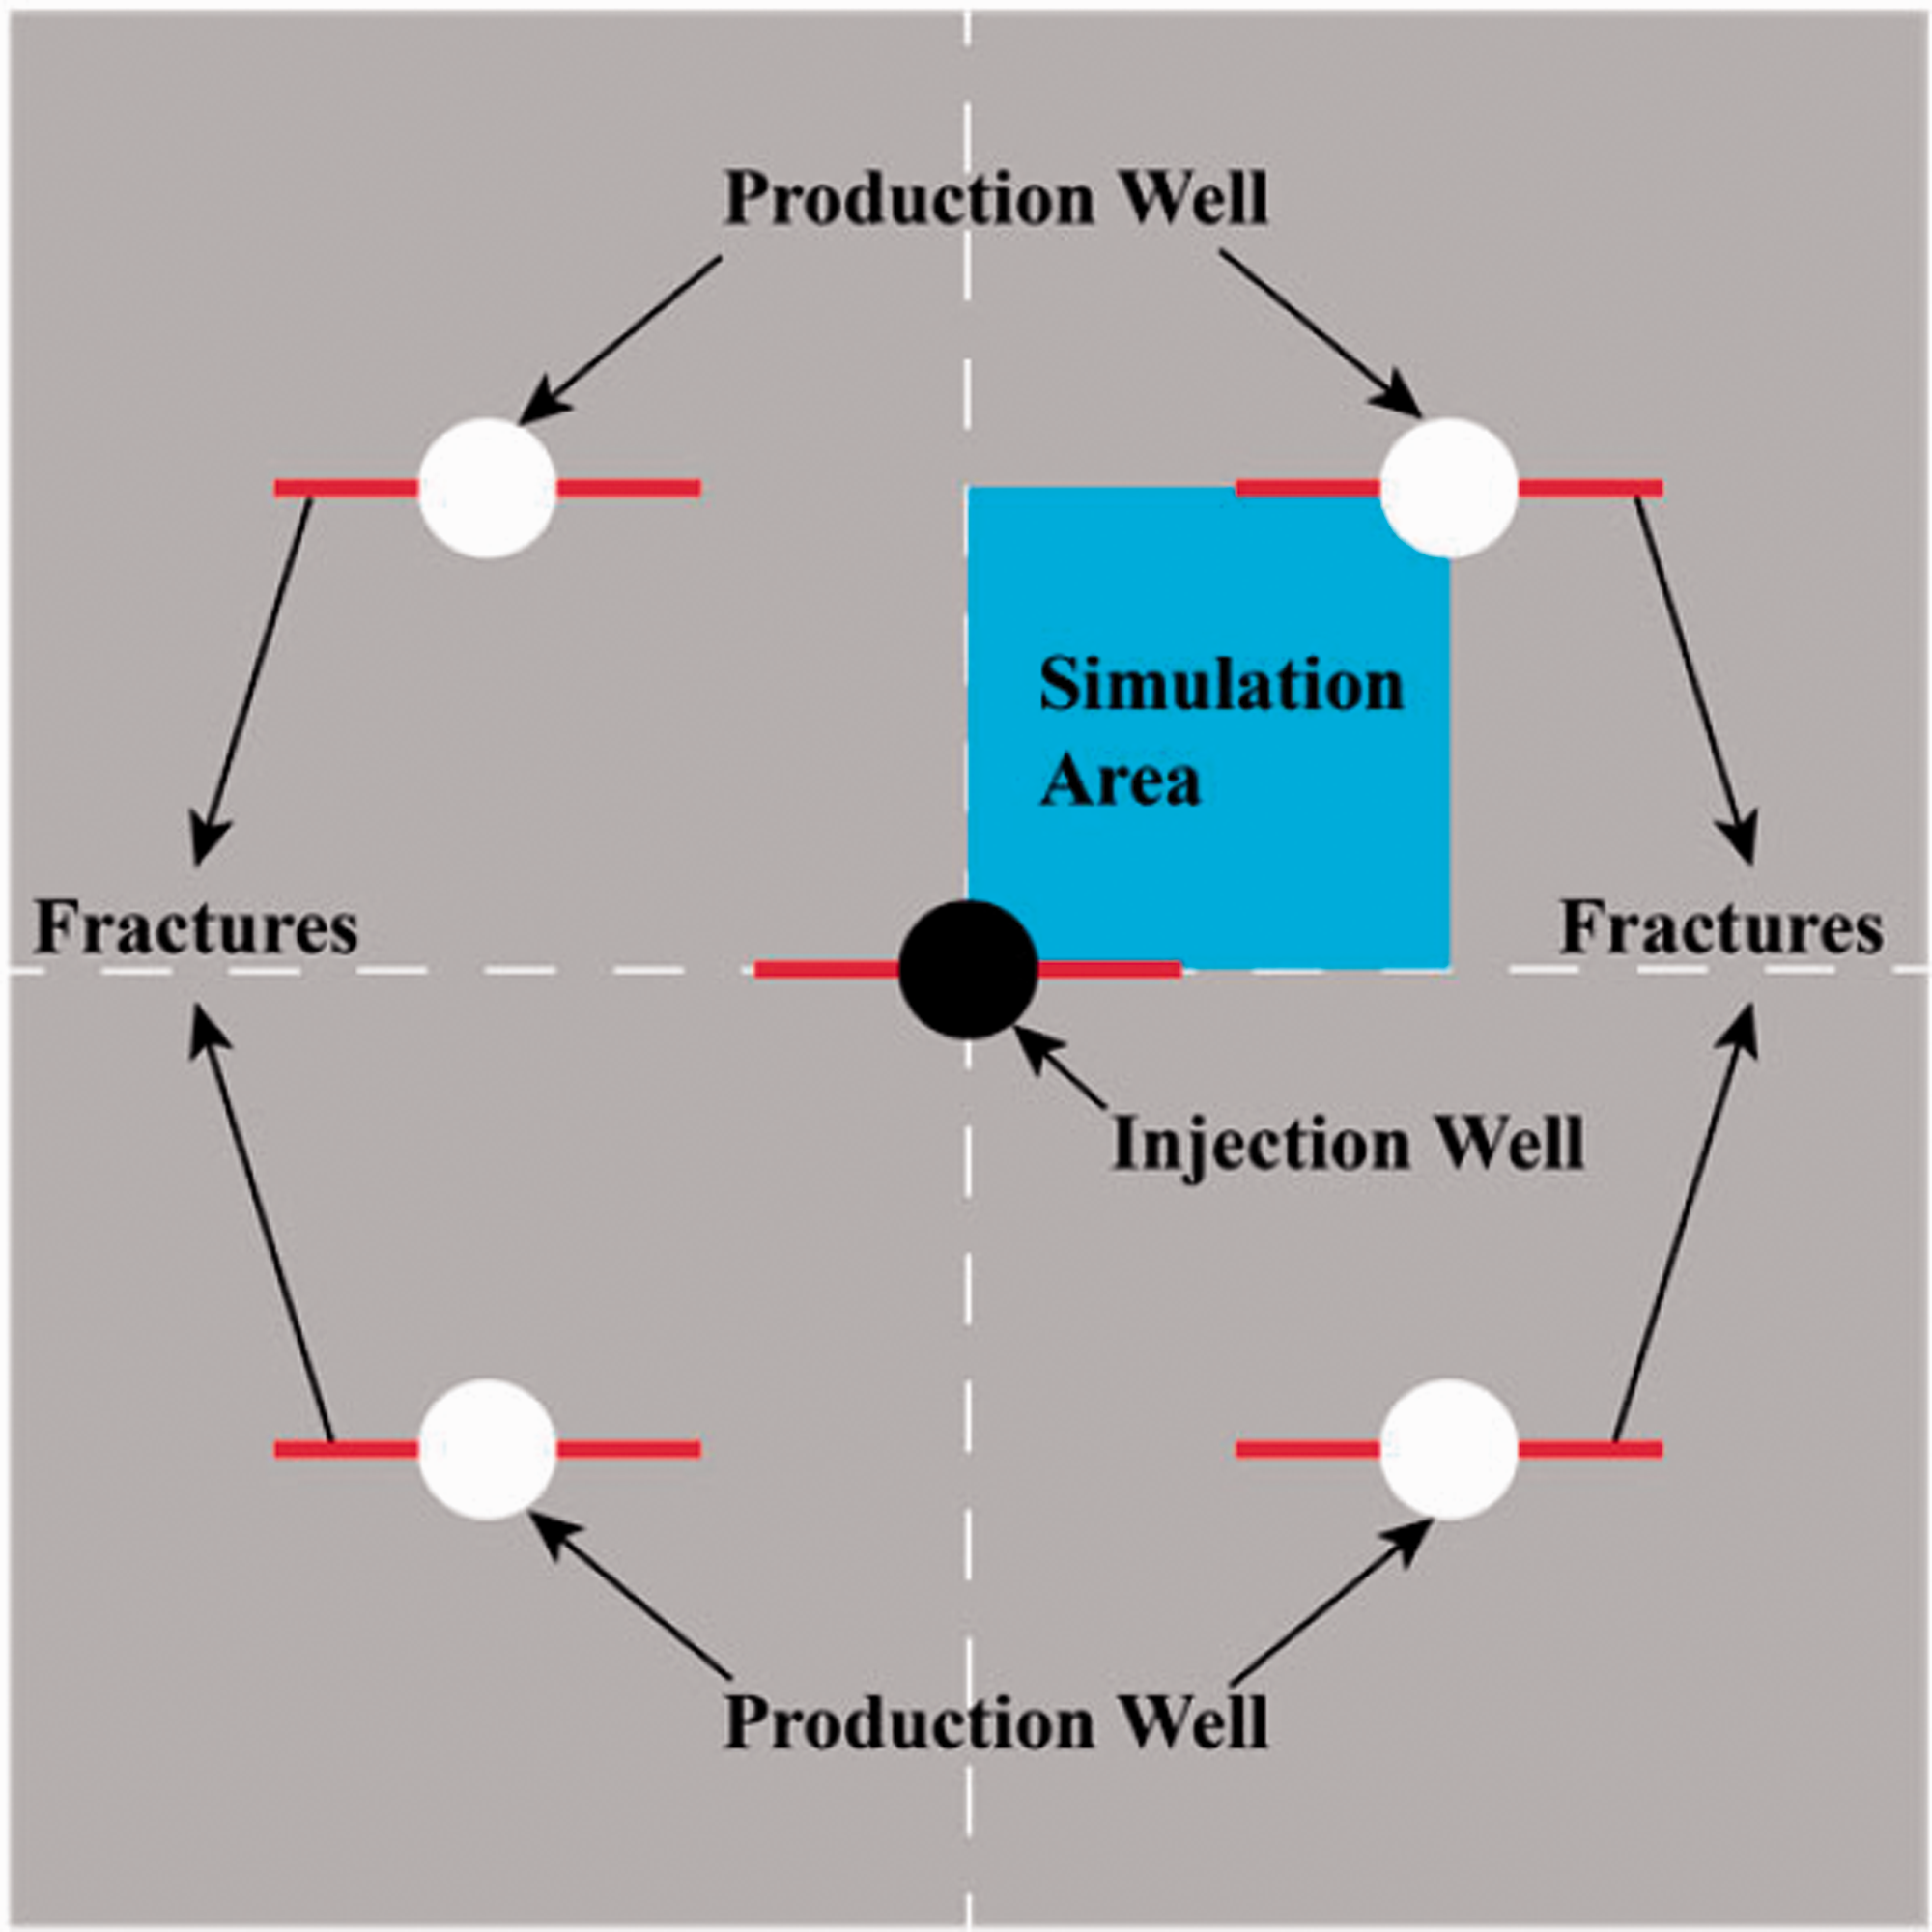
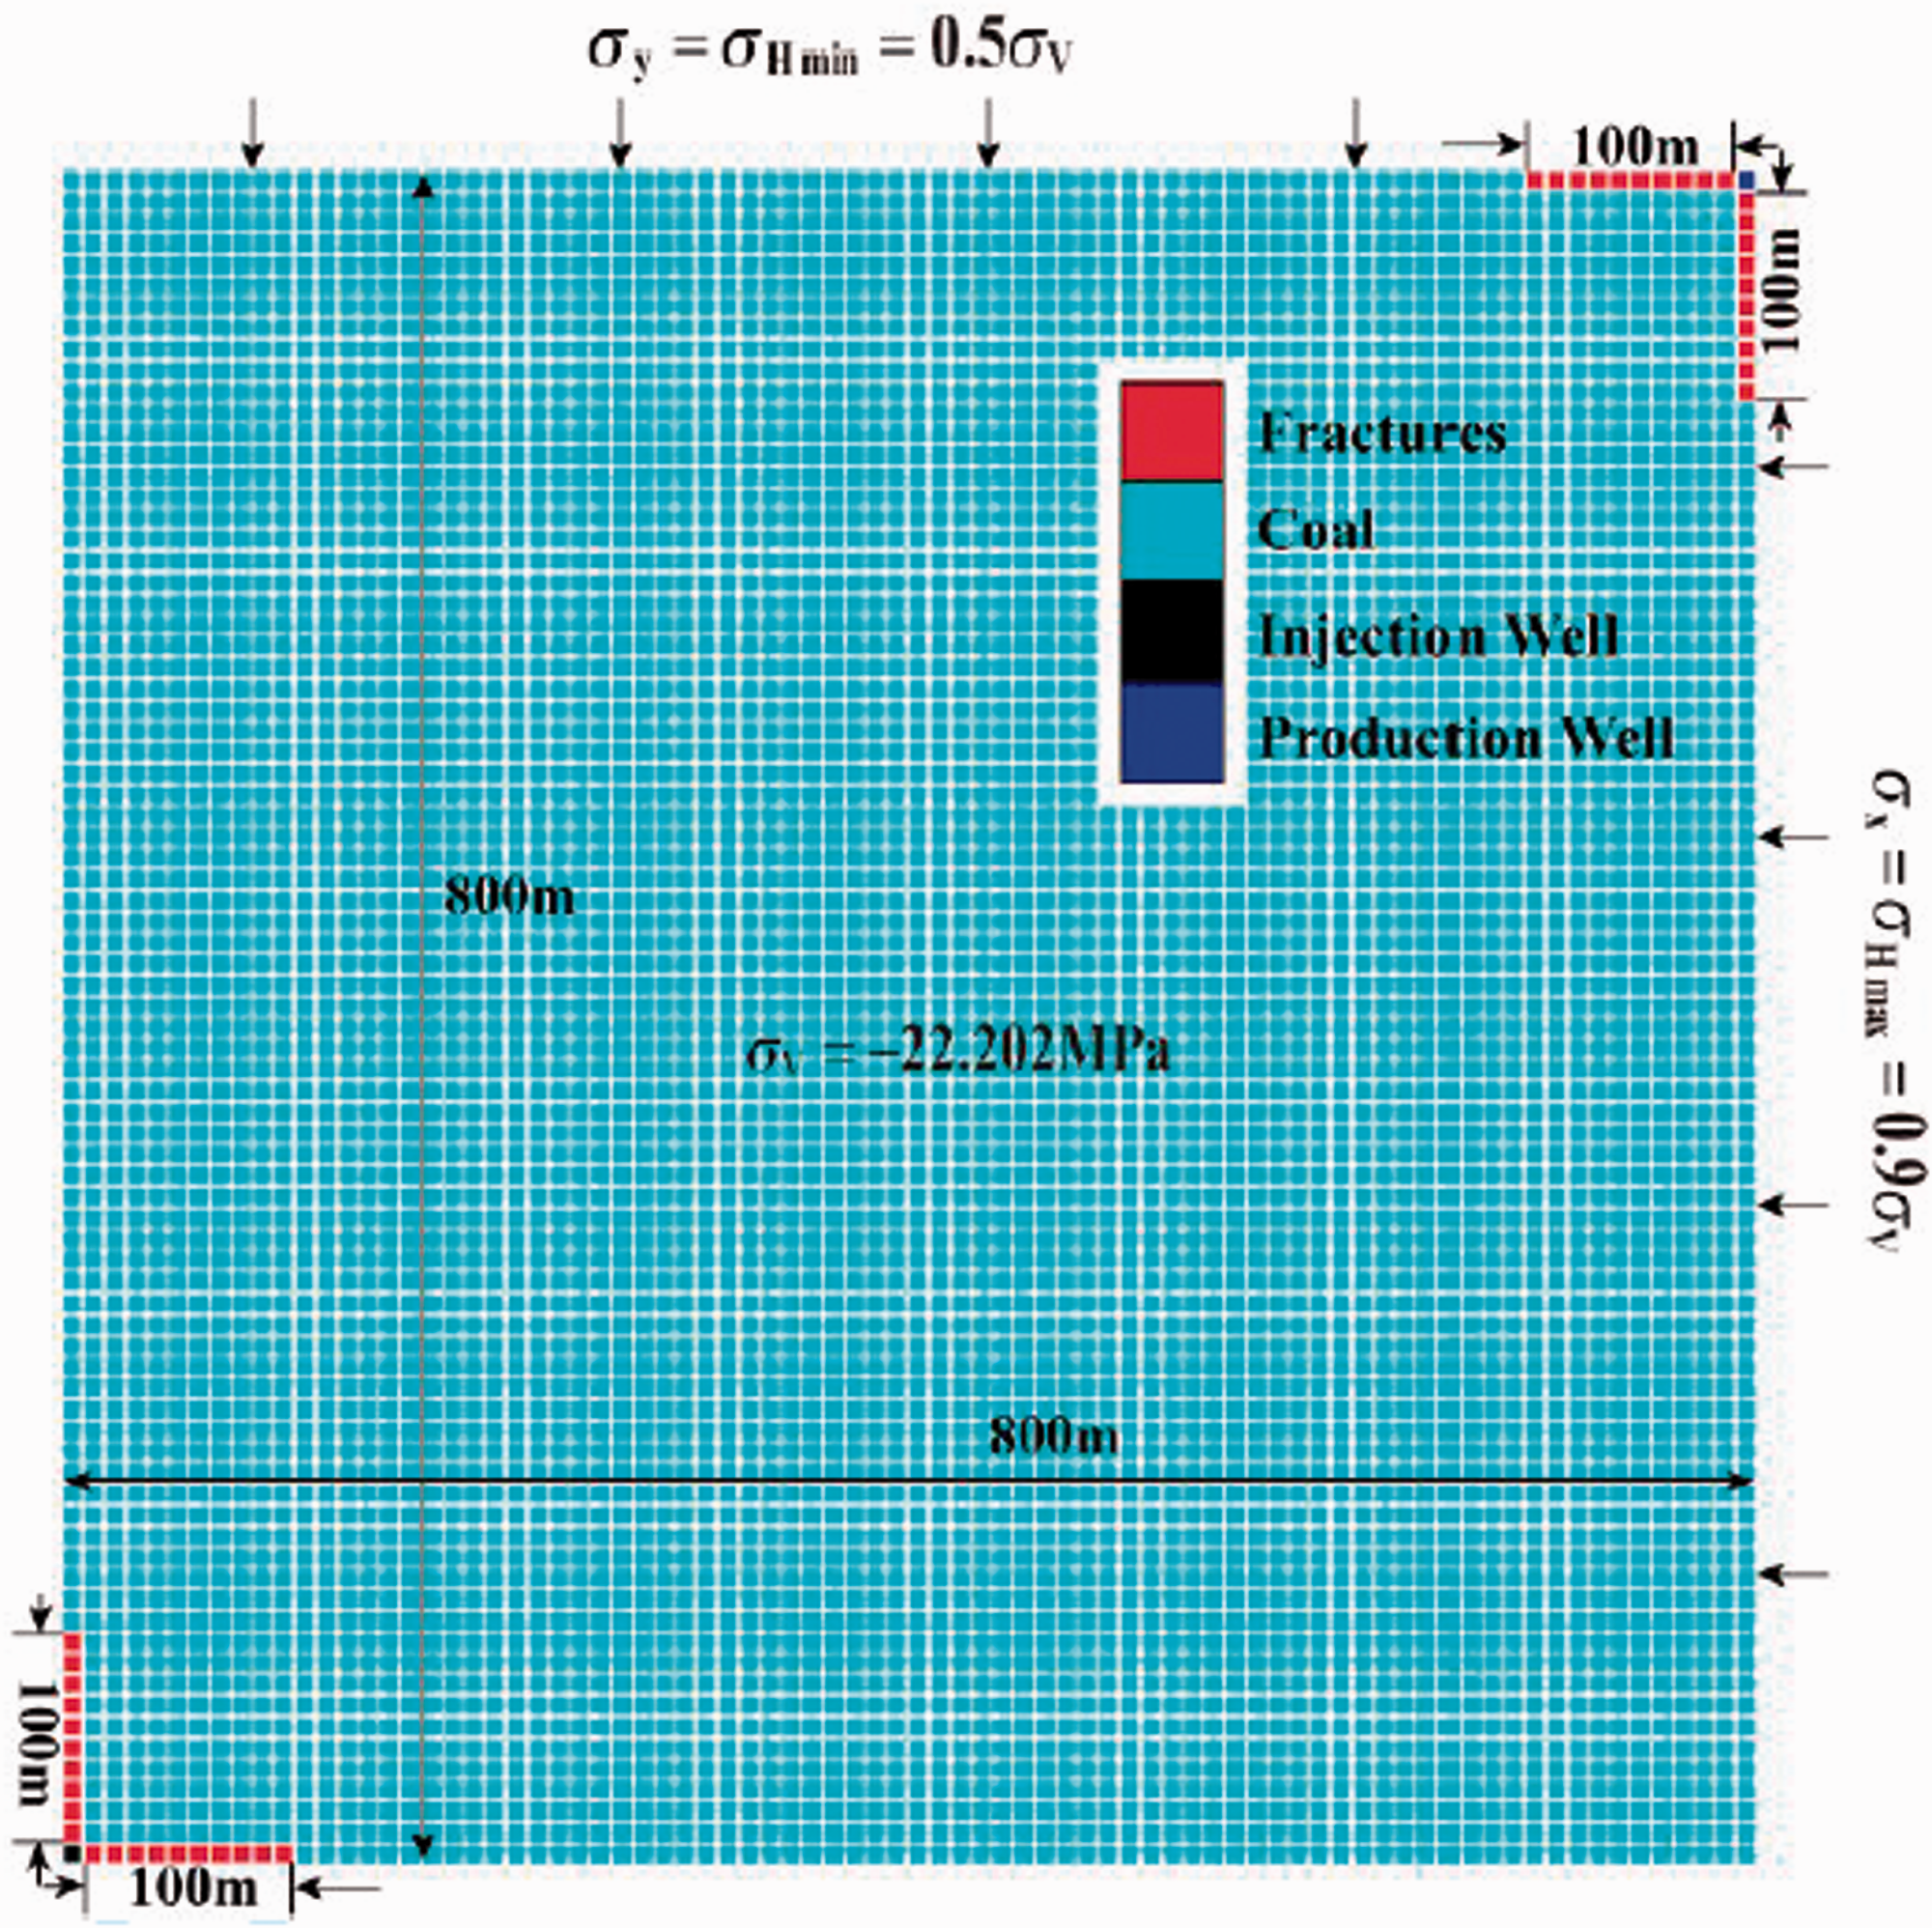
The schematic of the geometrical model within FLAC3D, involving coal seam, wells, and fractures are shown in Figure 4. The depth of coal seam is 1 km, and the average density of the upper rock is 2260 kg/m3. It can be calculated that the vertical stress
Schematic of the geometrical model, involving coal seam, wells and fractures.
Parameters of coal seam and fractures for CO2-ECBM simulation.
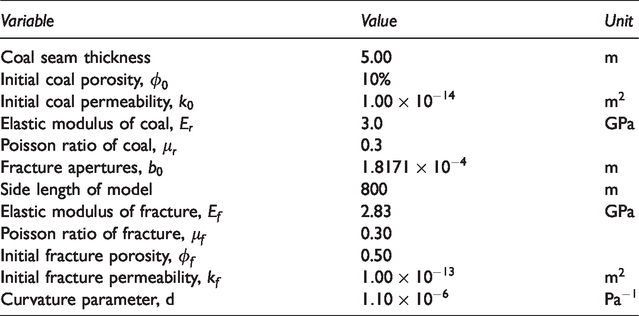
The elastic modulus of the fracture element 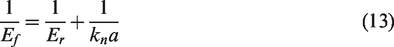
Simulation result and analysis
The influence of fracturing
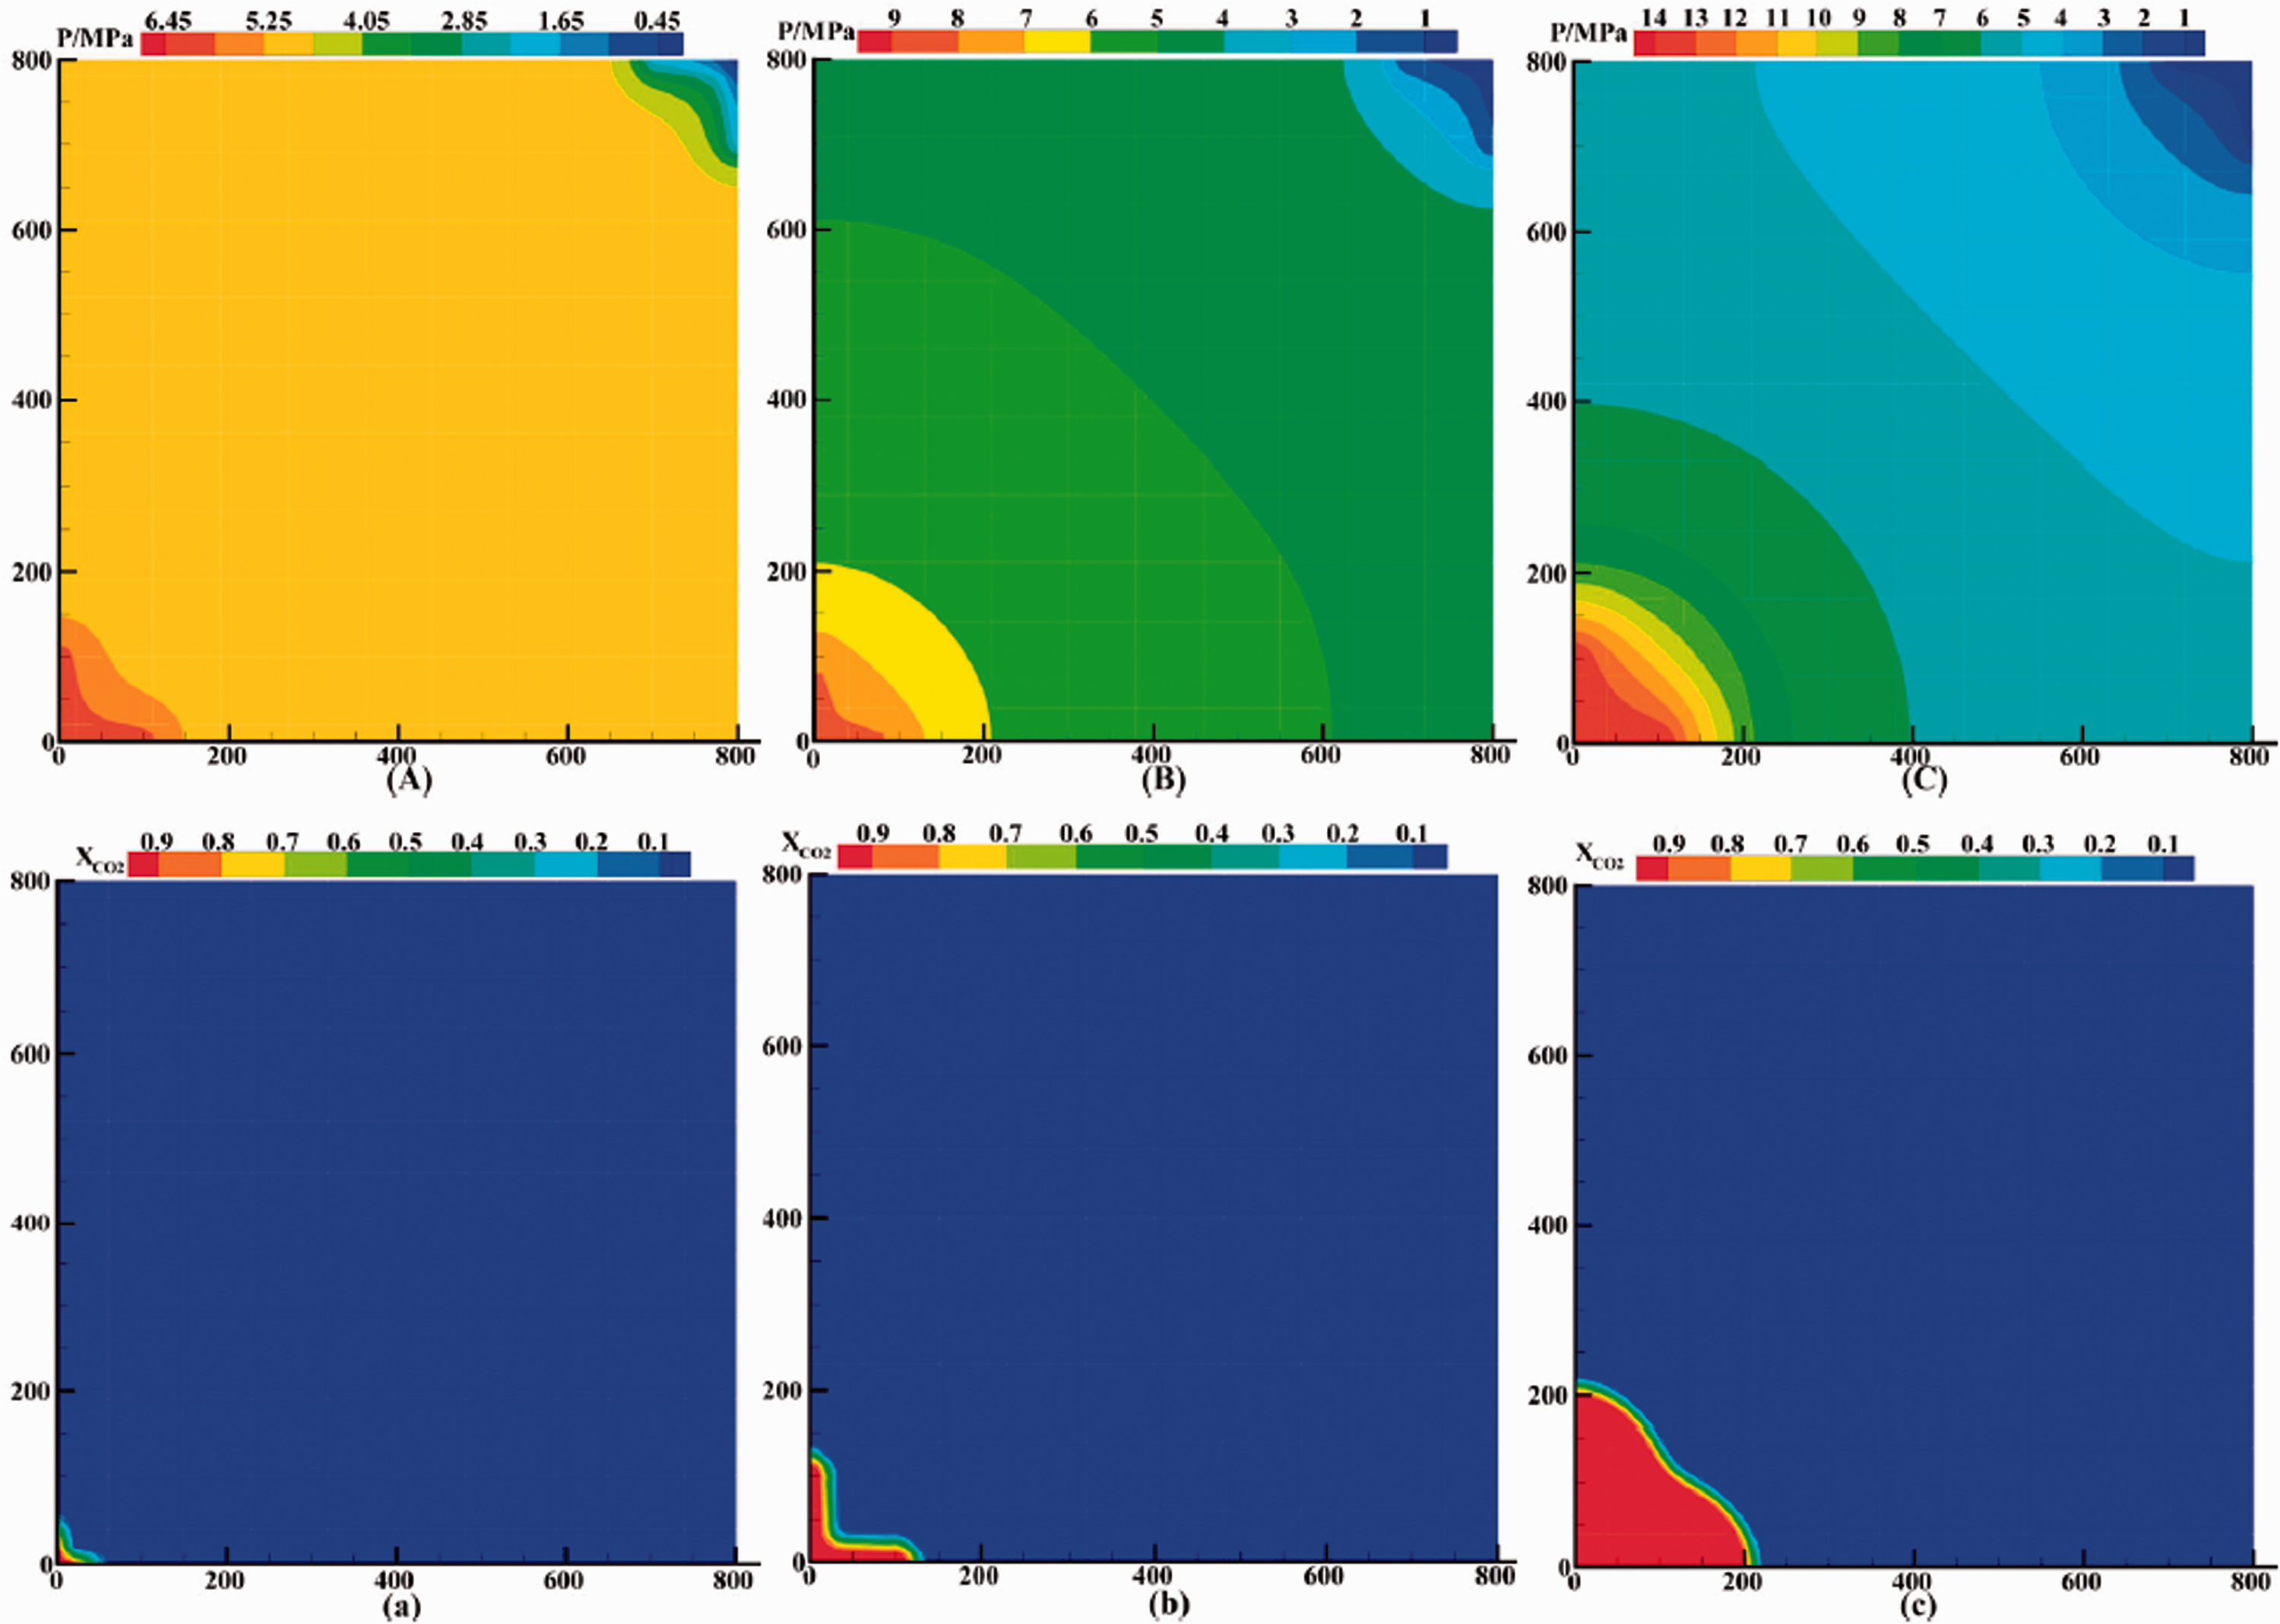
Figure 5 shows the distribution of the pore pressure (A) to (C) and CO2 mass fraction
The distribution of pore pressure in 10 days (A), 100 days (B), 1 year (C), and the distribution of CO2 mass fraction in 10 days (a), 100 days (b), 1 year (c).
Pore pressure and CO2 mass fraction after 10 days, 100 days and 1 year of injection and production.
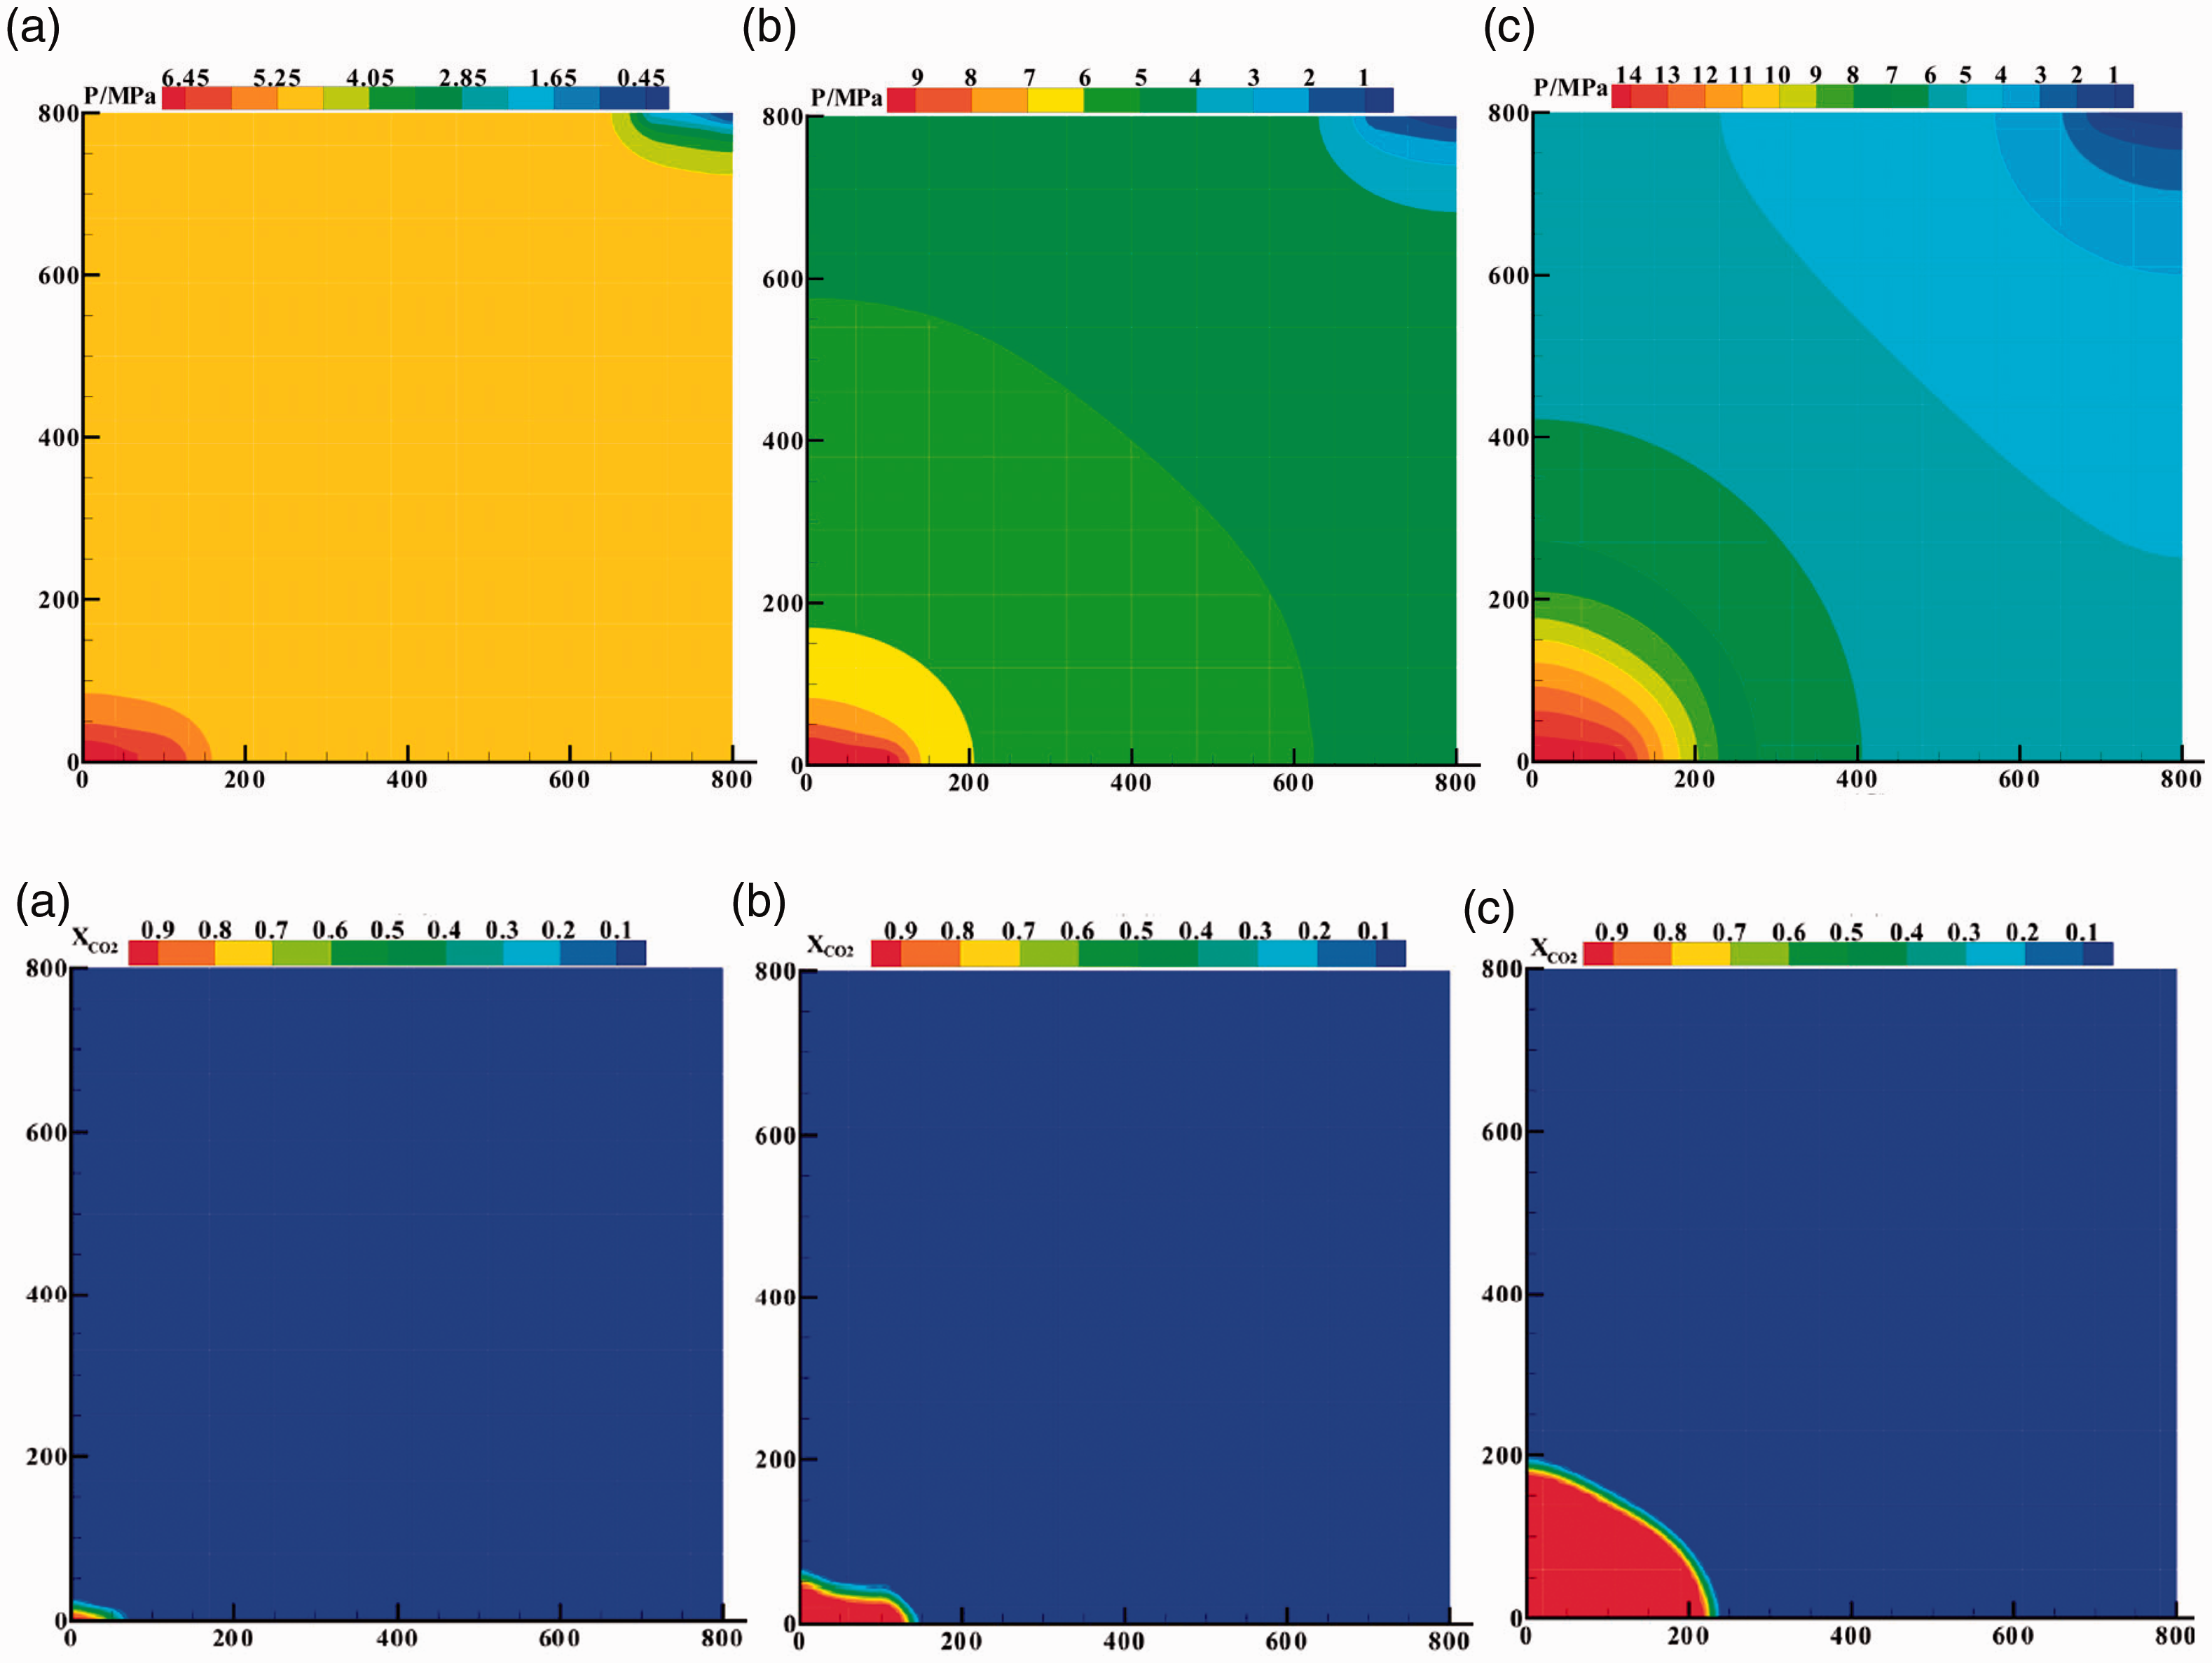
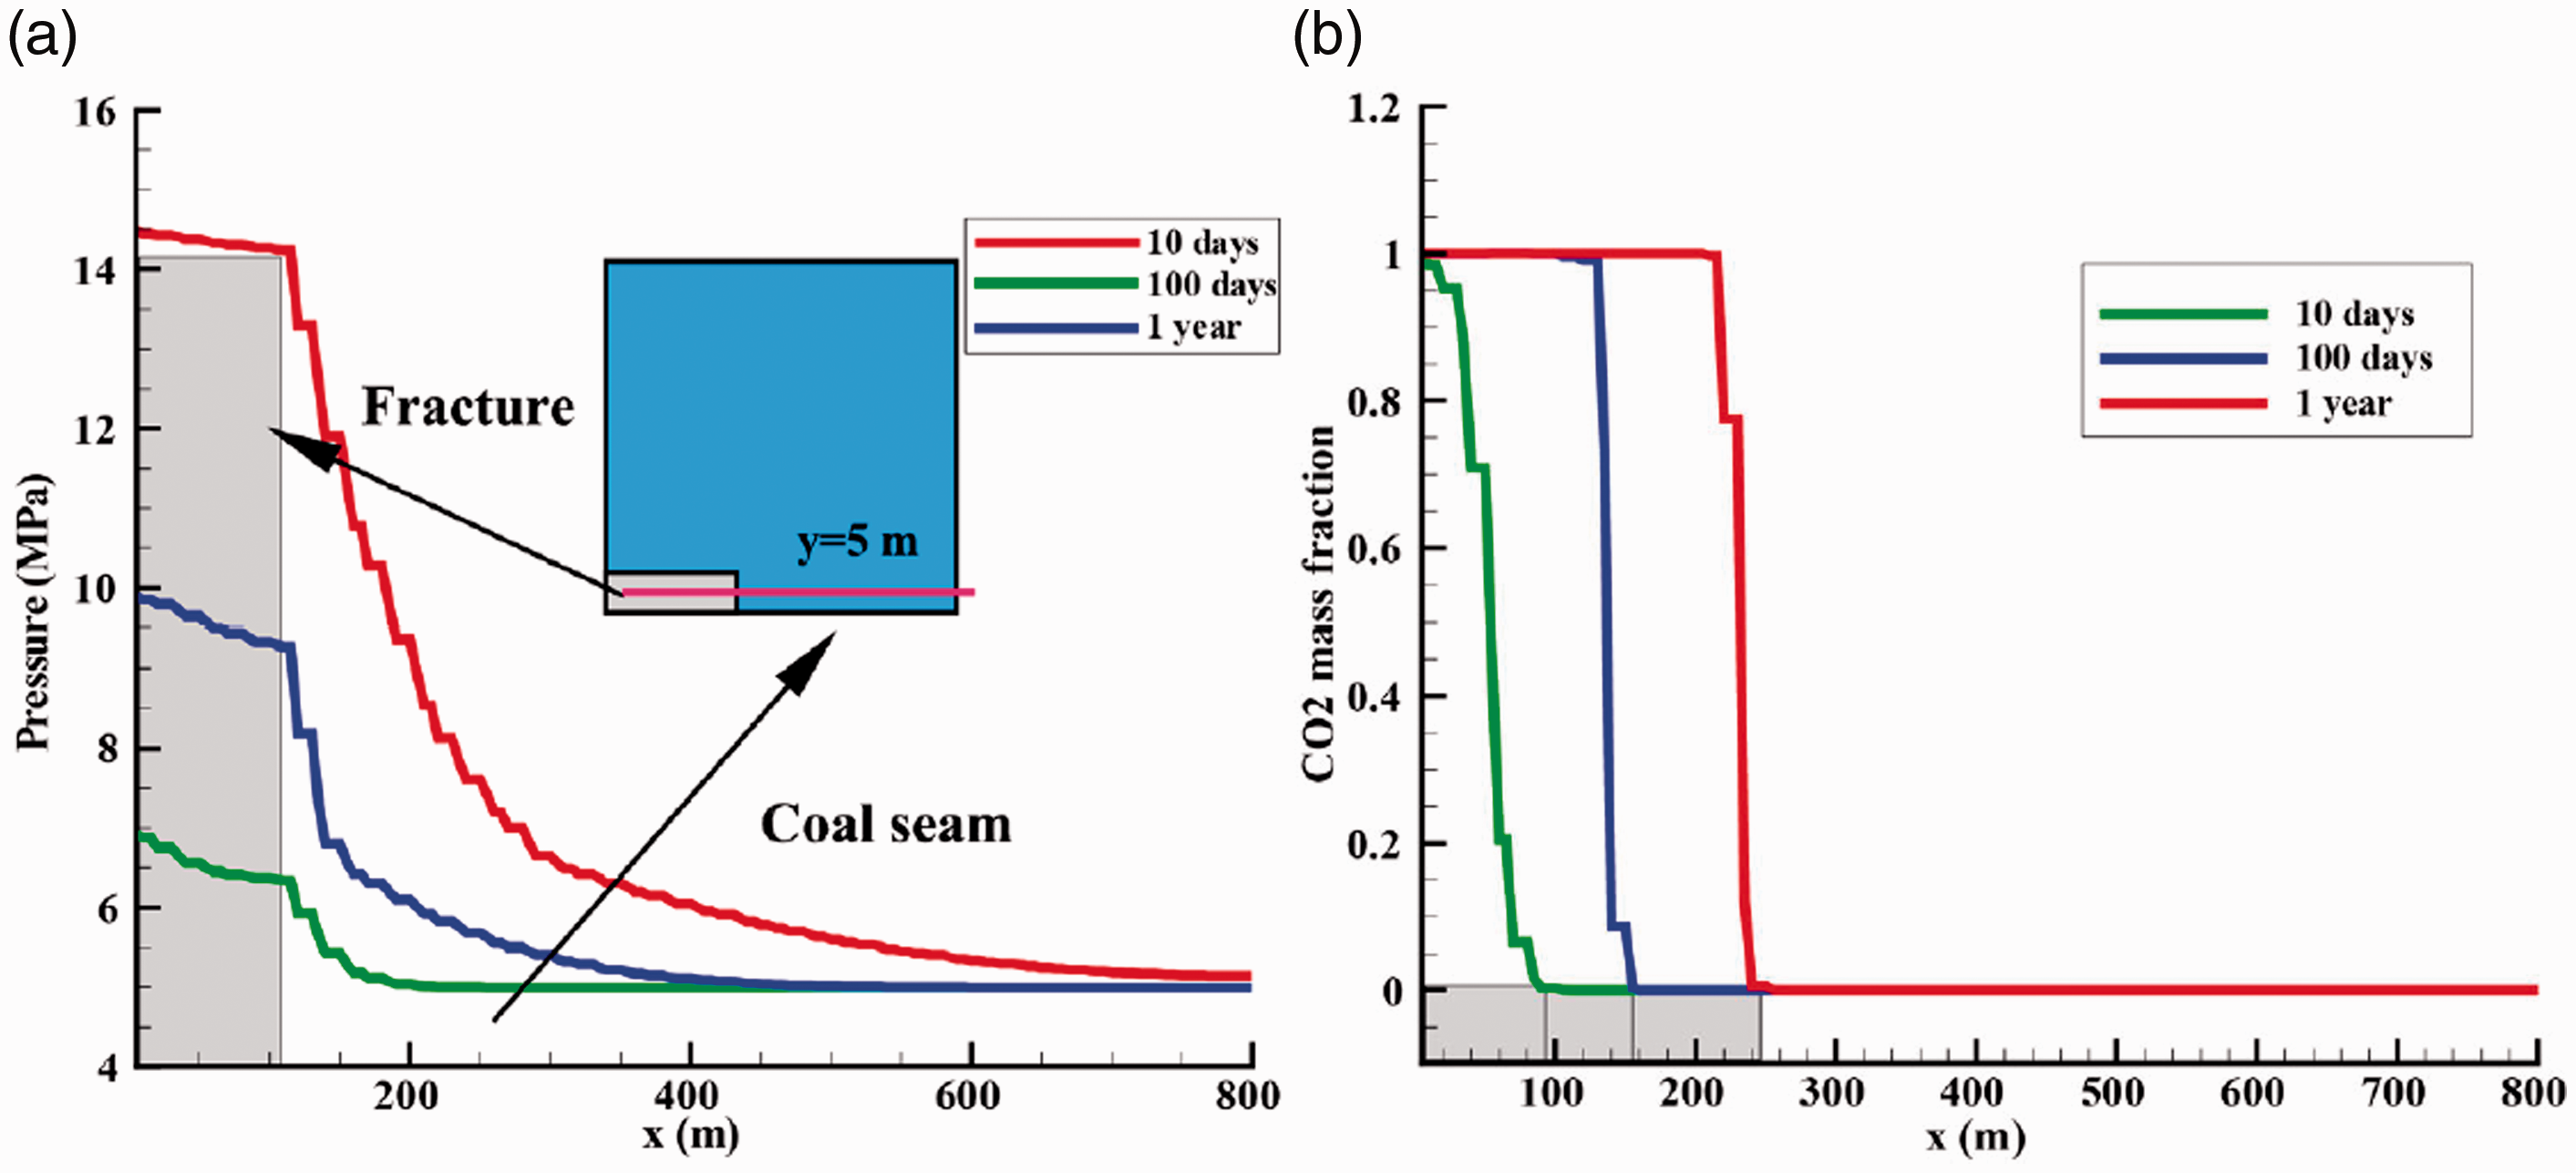
As shown in Figure 6(a), the changes in the pore pressure with time (
In Figures 5(a) to (c) and 6(b), the migration distance of CO2 in the horizontal direction is more considerable compared to the vertical direction. Compared with CH4, CO2 has a stronger adsorption capacity. Without considering the time effect of desorption and adsorption, CO2 completely displaced free and adsorbed CH4. In the early, middle and late stages of injection, CO2 flows to 100 m, 150 m and 240 m away from the wellhead in the horizontal direction.
Figure 7 shows the methane production rate is attributable to the fracture and coal elements and the ratio between them. During the entire injection and production process, gas in the production well originates from adjacent fracture elements and coal elements. The flow rate from the fracture elements to the well is faster. According to Figure 7, the maximum production of fracture element F2 and coal element C2 is 1.48 kg/s and
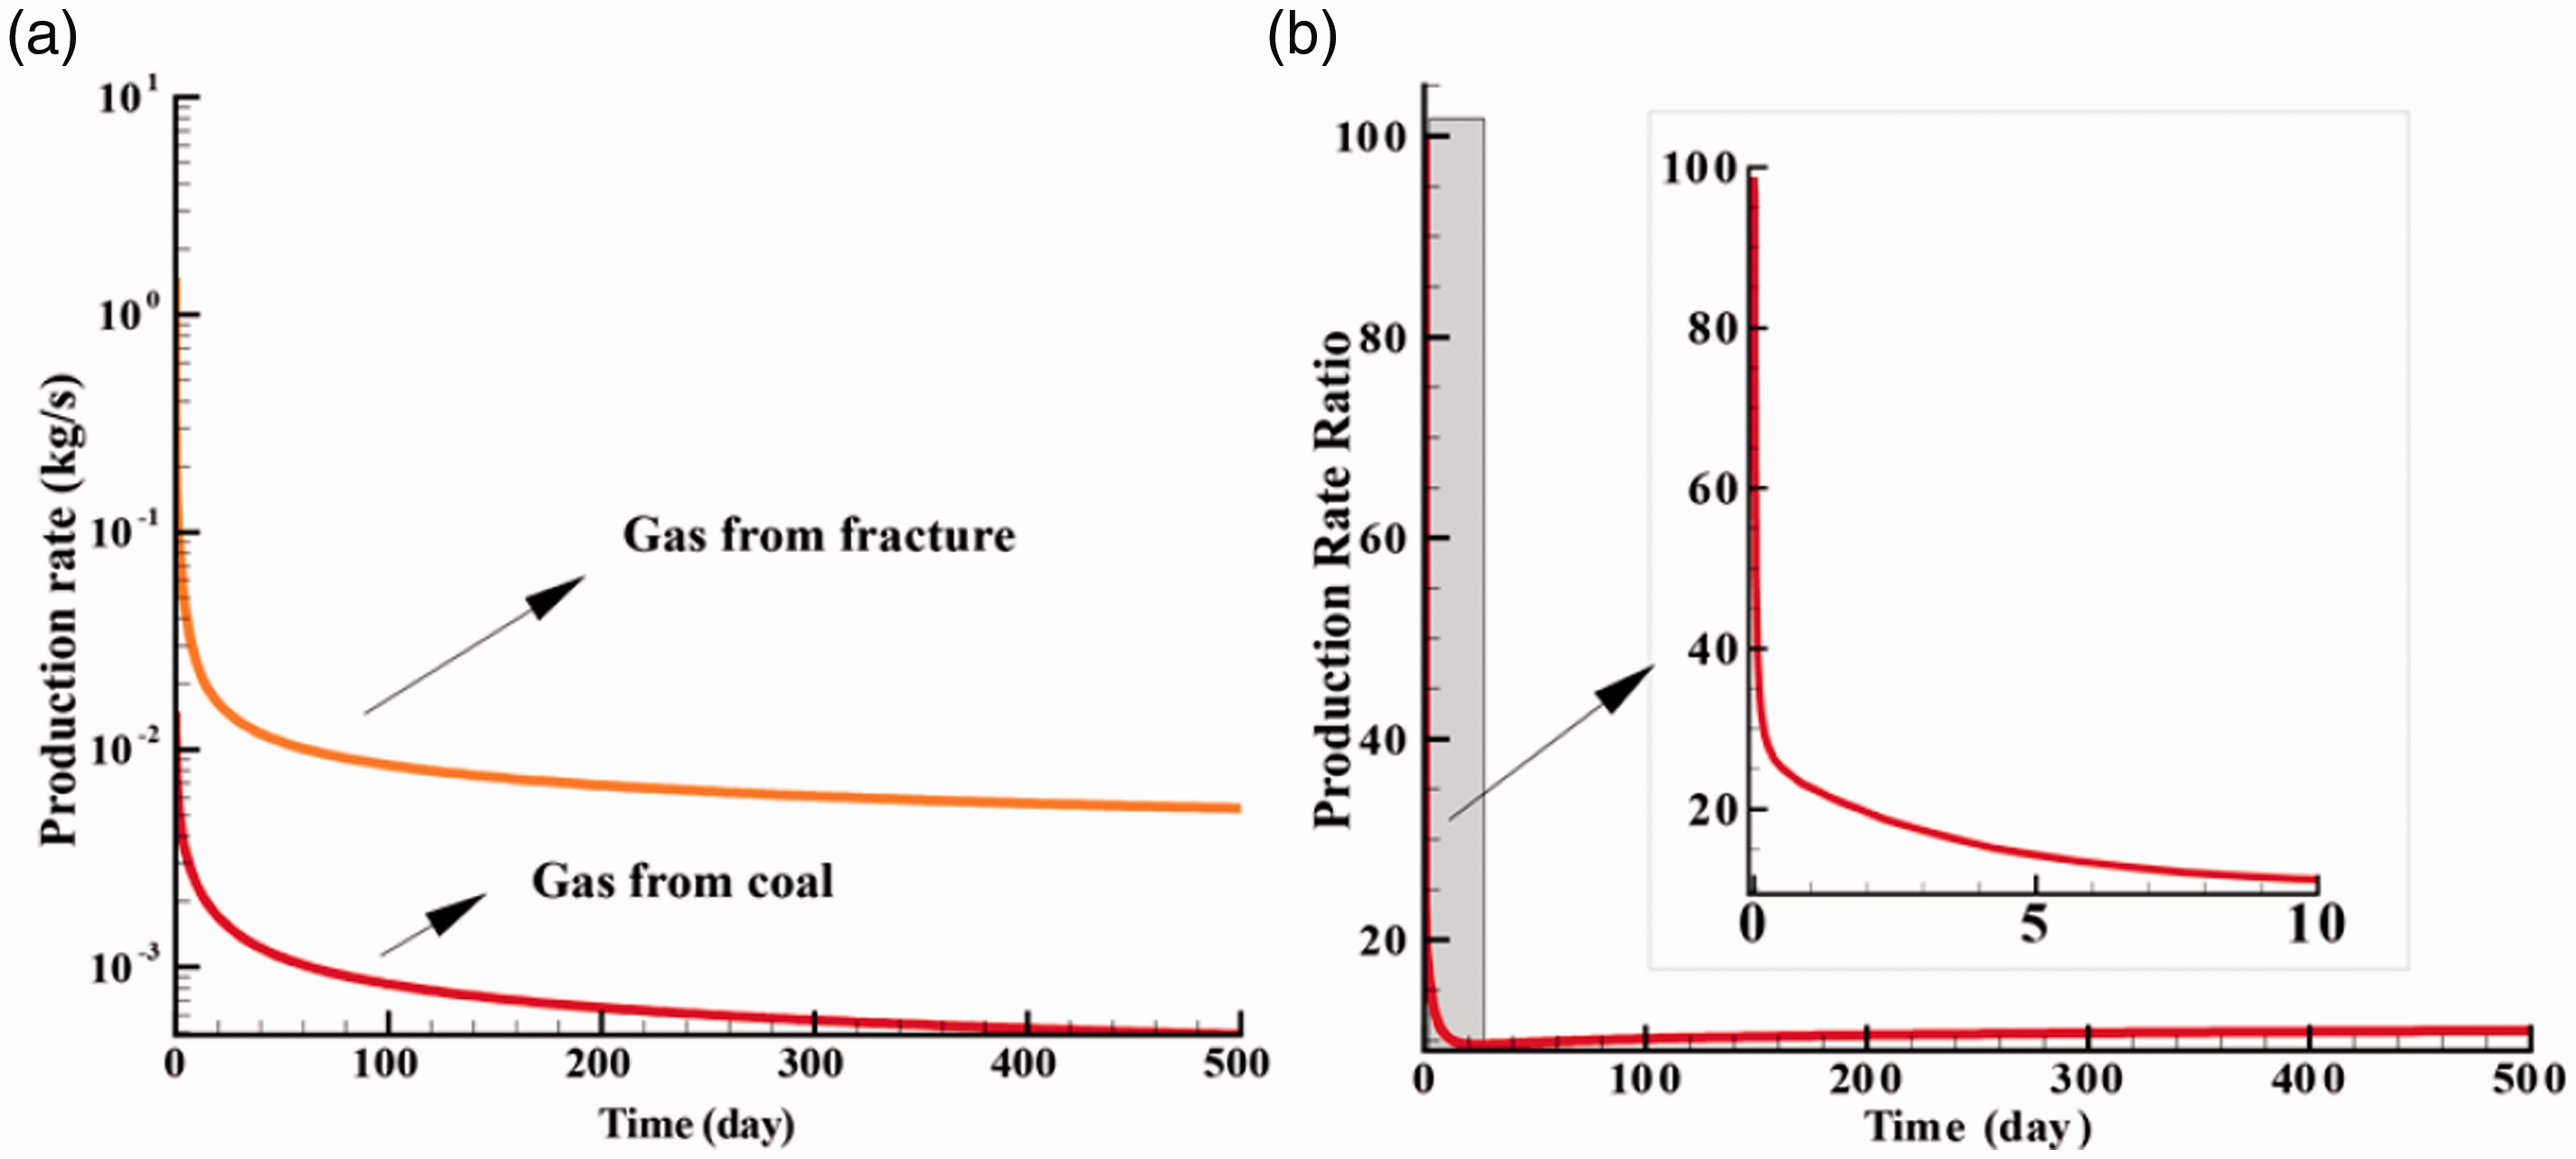
The methane production rate comes from the fracture and coal element (a) and their ratio (b).
Figure 8 shows the temporal evolution of pore pressure, temperature, and CO2 mass fraction at fracture and coal elements near the injection well. Given that the fracture and coal elements are adjacent to the injection well, the variation trend with time and the value of the pore pressure of the two elements are similar. The model doesn’t consider the adsorption of fracture and the strong adsorption of the coal elements for CO2. Therefore, CO2 can be quickly stored in the coal matrix by replacing CH4 (Figure 8(c)), thus enabling the
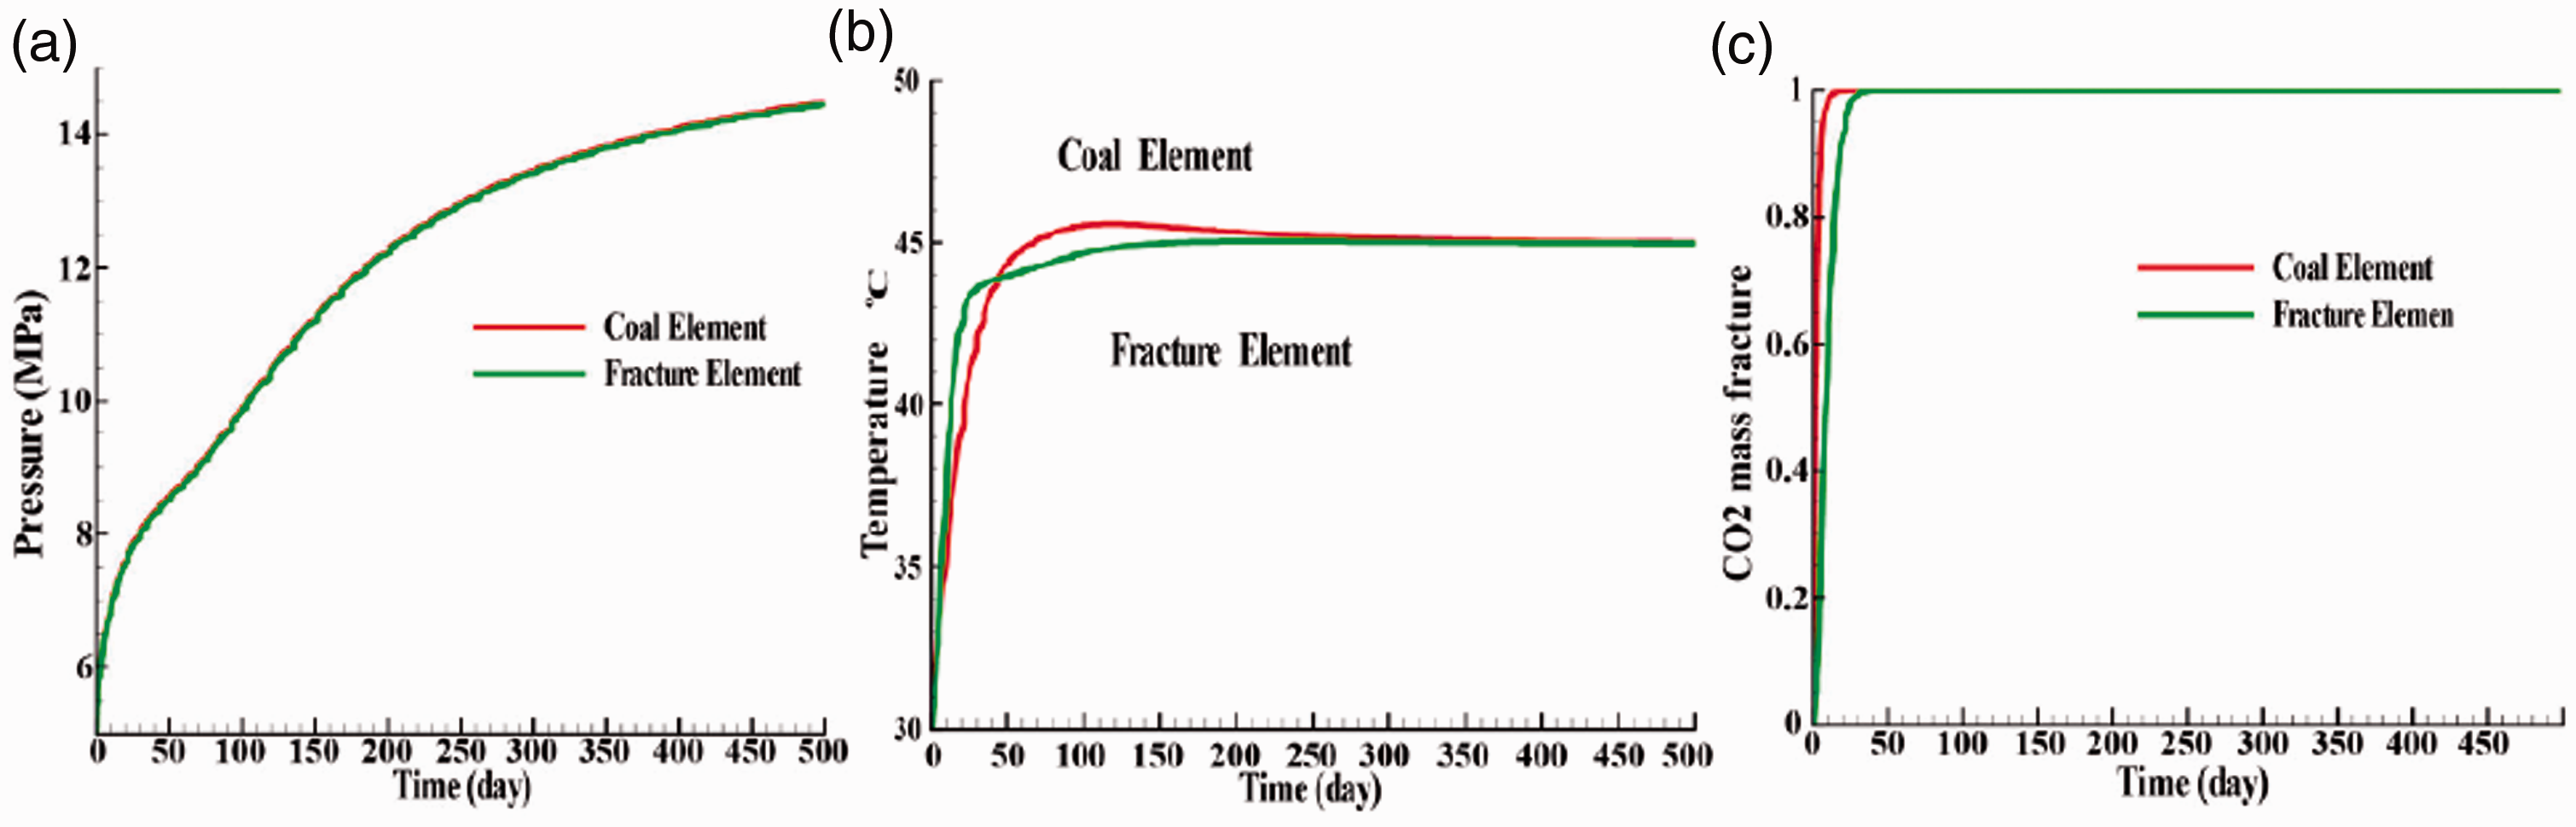
The temporal evolution of (a) pore pressure, (b) temperature, and (c) CO2 mass fraction at fracture and coal elements near the injection well.
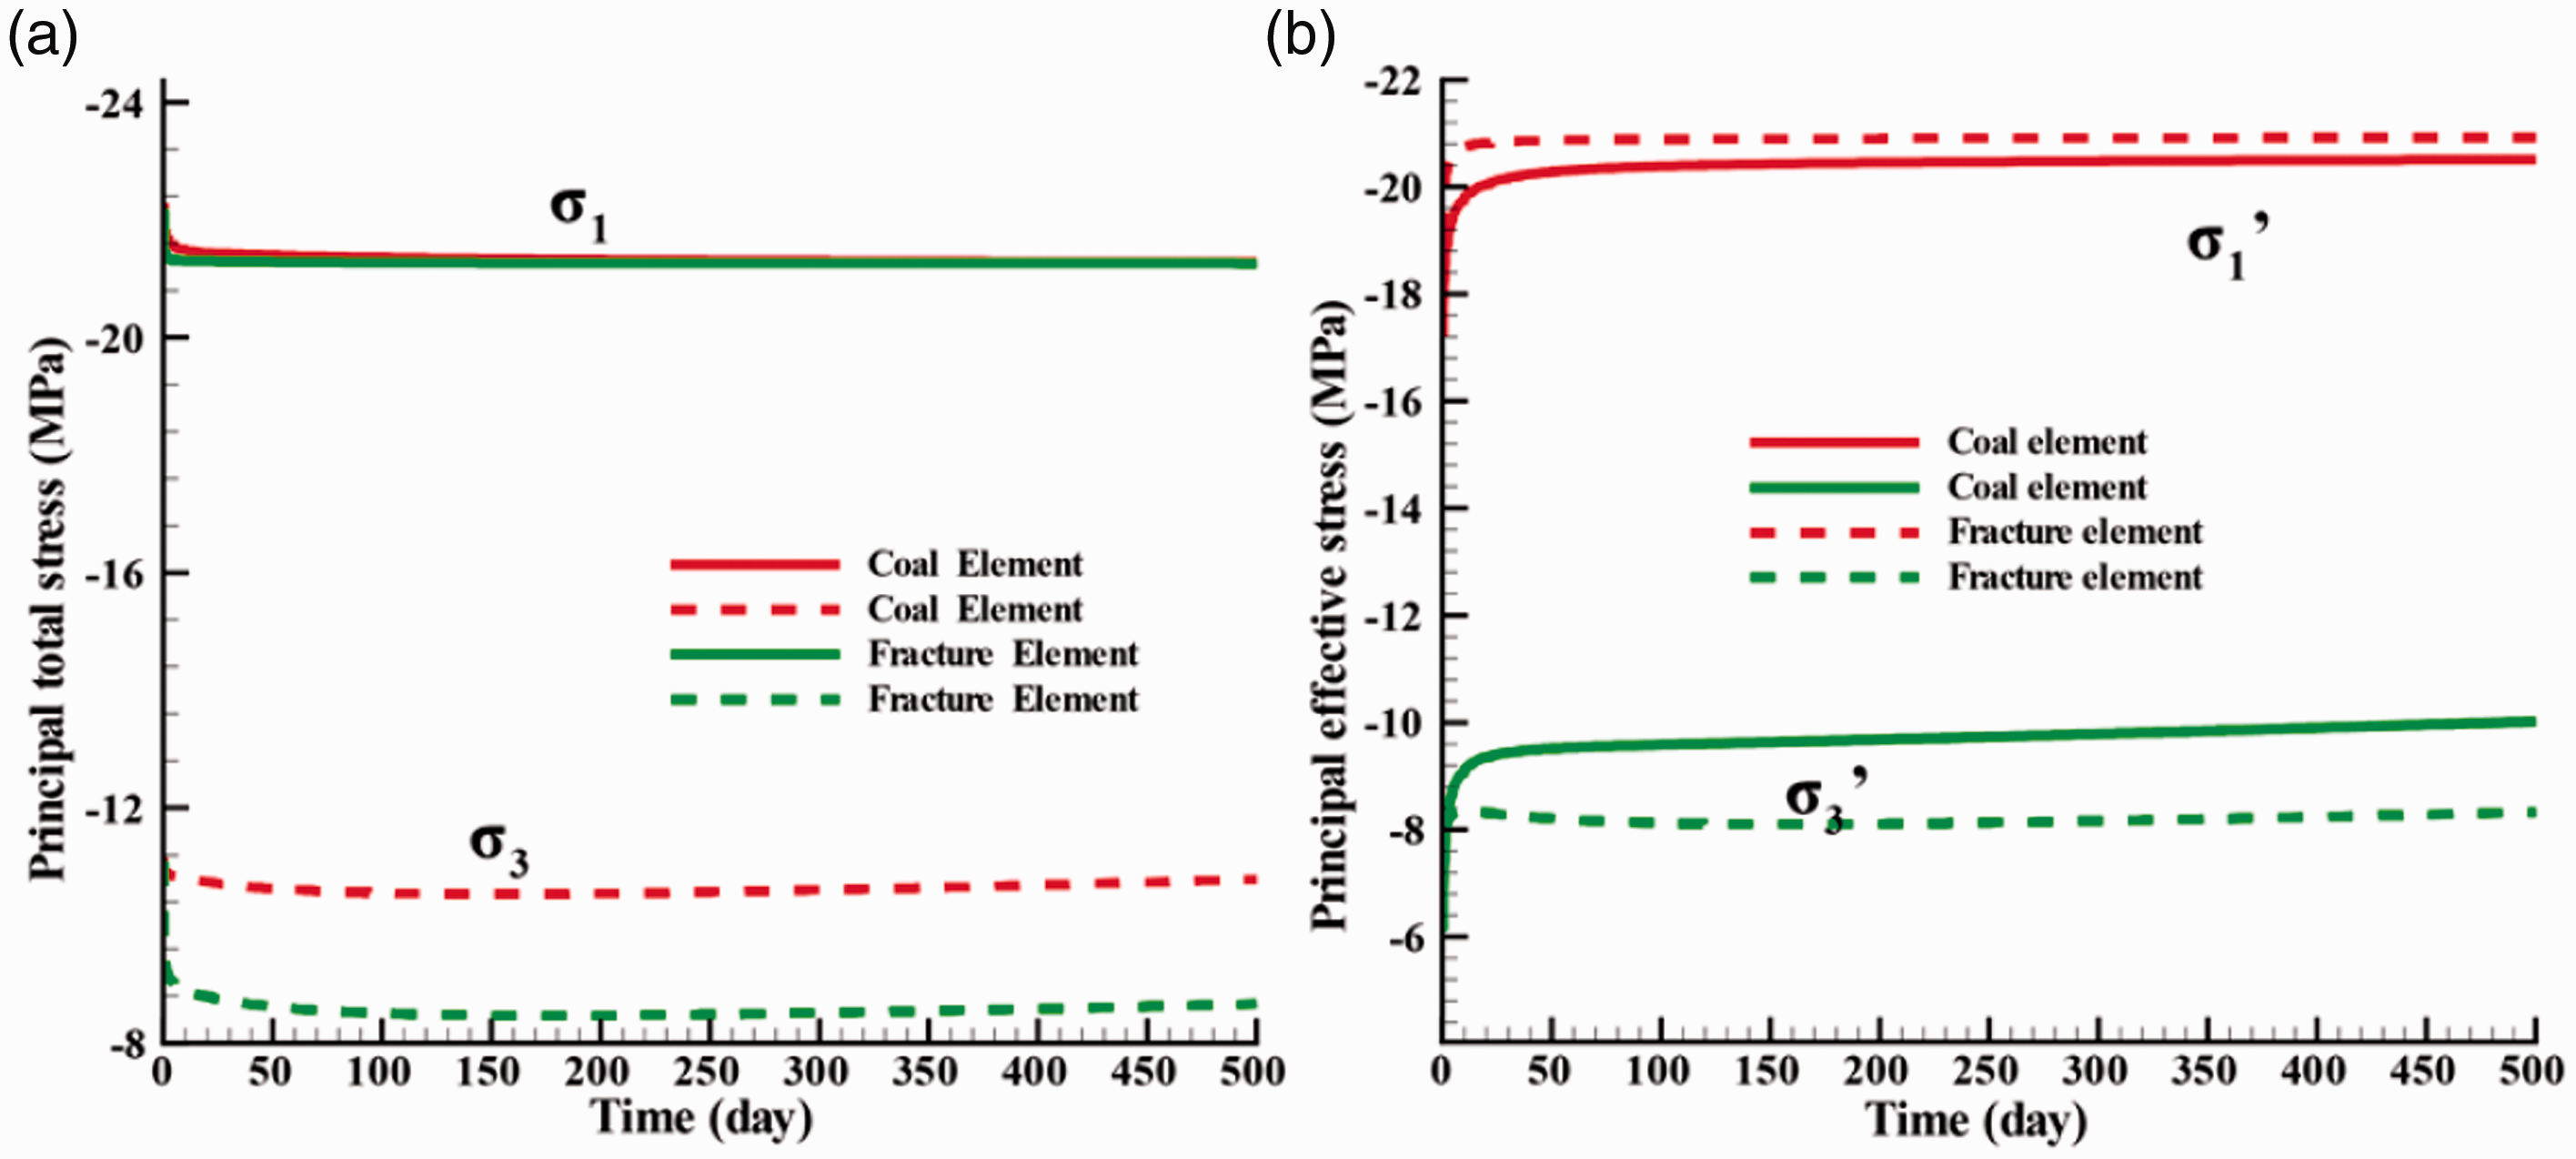
The temporal evolution of the total and effective maximum and minimum stress at C1 and F1 is shown as Figure 9. In Figure 9(a), the trend of the stress change of C1 and F1 are similar. An increase is initially observed followed by a steady trend, and the value is different. The initial maximum principal stress
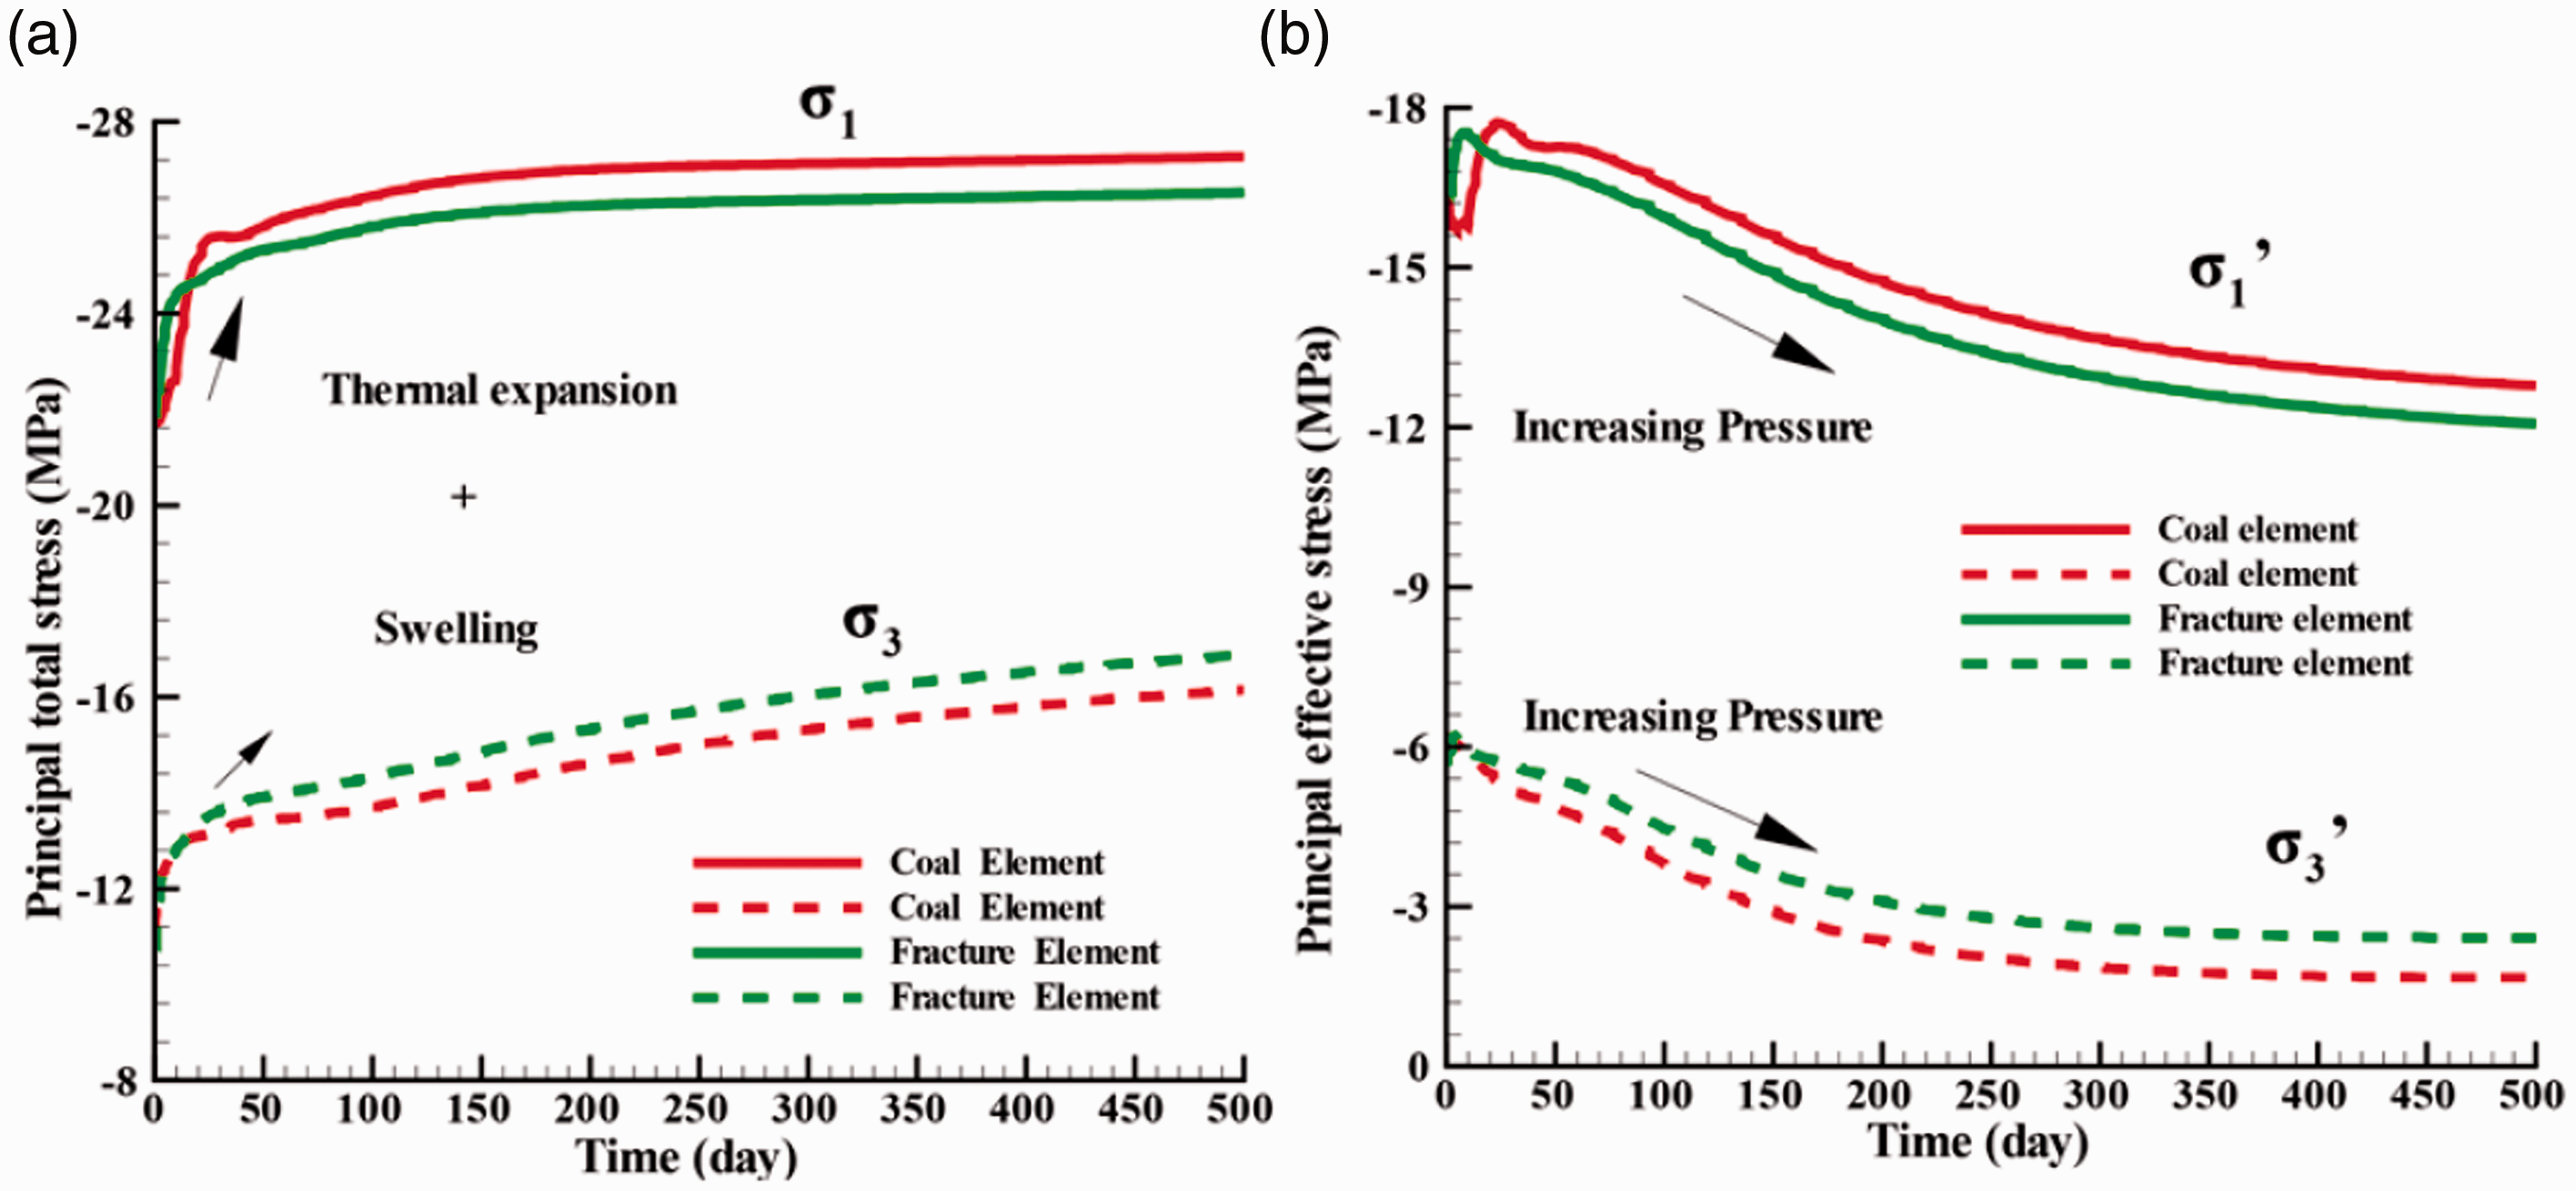
Temporal evolution of (a) total and (b) effective maximum and minimum stress at C1 and F1.
The elastic modulus of C1 and F1 is 3.0 GPa and 2.83 GPa, respectively, and their Poisson's ratios are 0.3. Thus, the corresponding bulk modulus are 2.500 GPa and 2.358 GPa. Assuming that fixed displacements around them constrain the C1 and F1 elements, the maximum extremes of the temperature-induced stress change are calculated to be 3.465 GPa and 3.268 GPa, respectively. Considering the stress change caused by the adsorption of C1, the variation of
Figure 10 shows the temporal evolution of the pore pressure and gas saturation at C2 and F2. With the development of production, pore pressure decreases rapidly. There is a rapid pressure drop in fractures, which promotes more gas flow into the production well so that the change of gas saturation in fractures is more prominent.
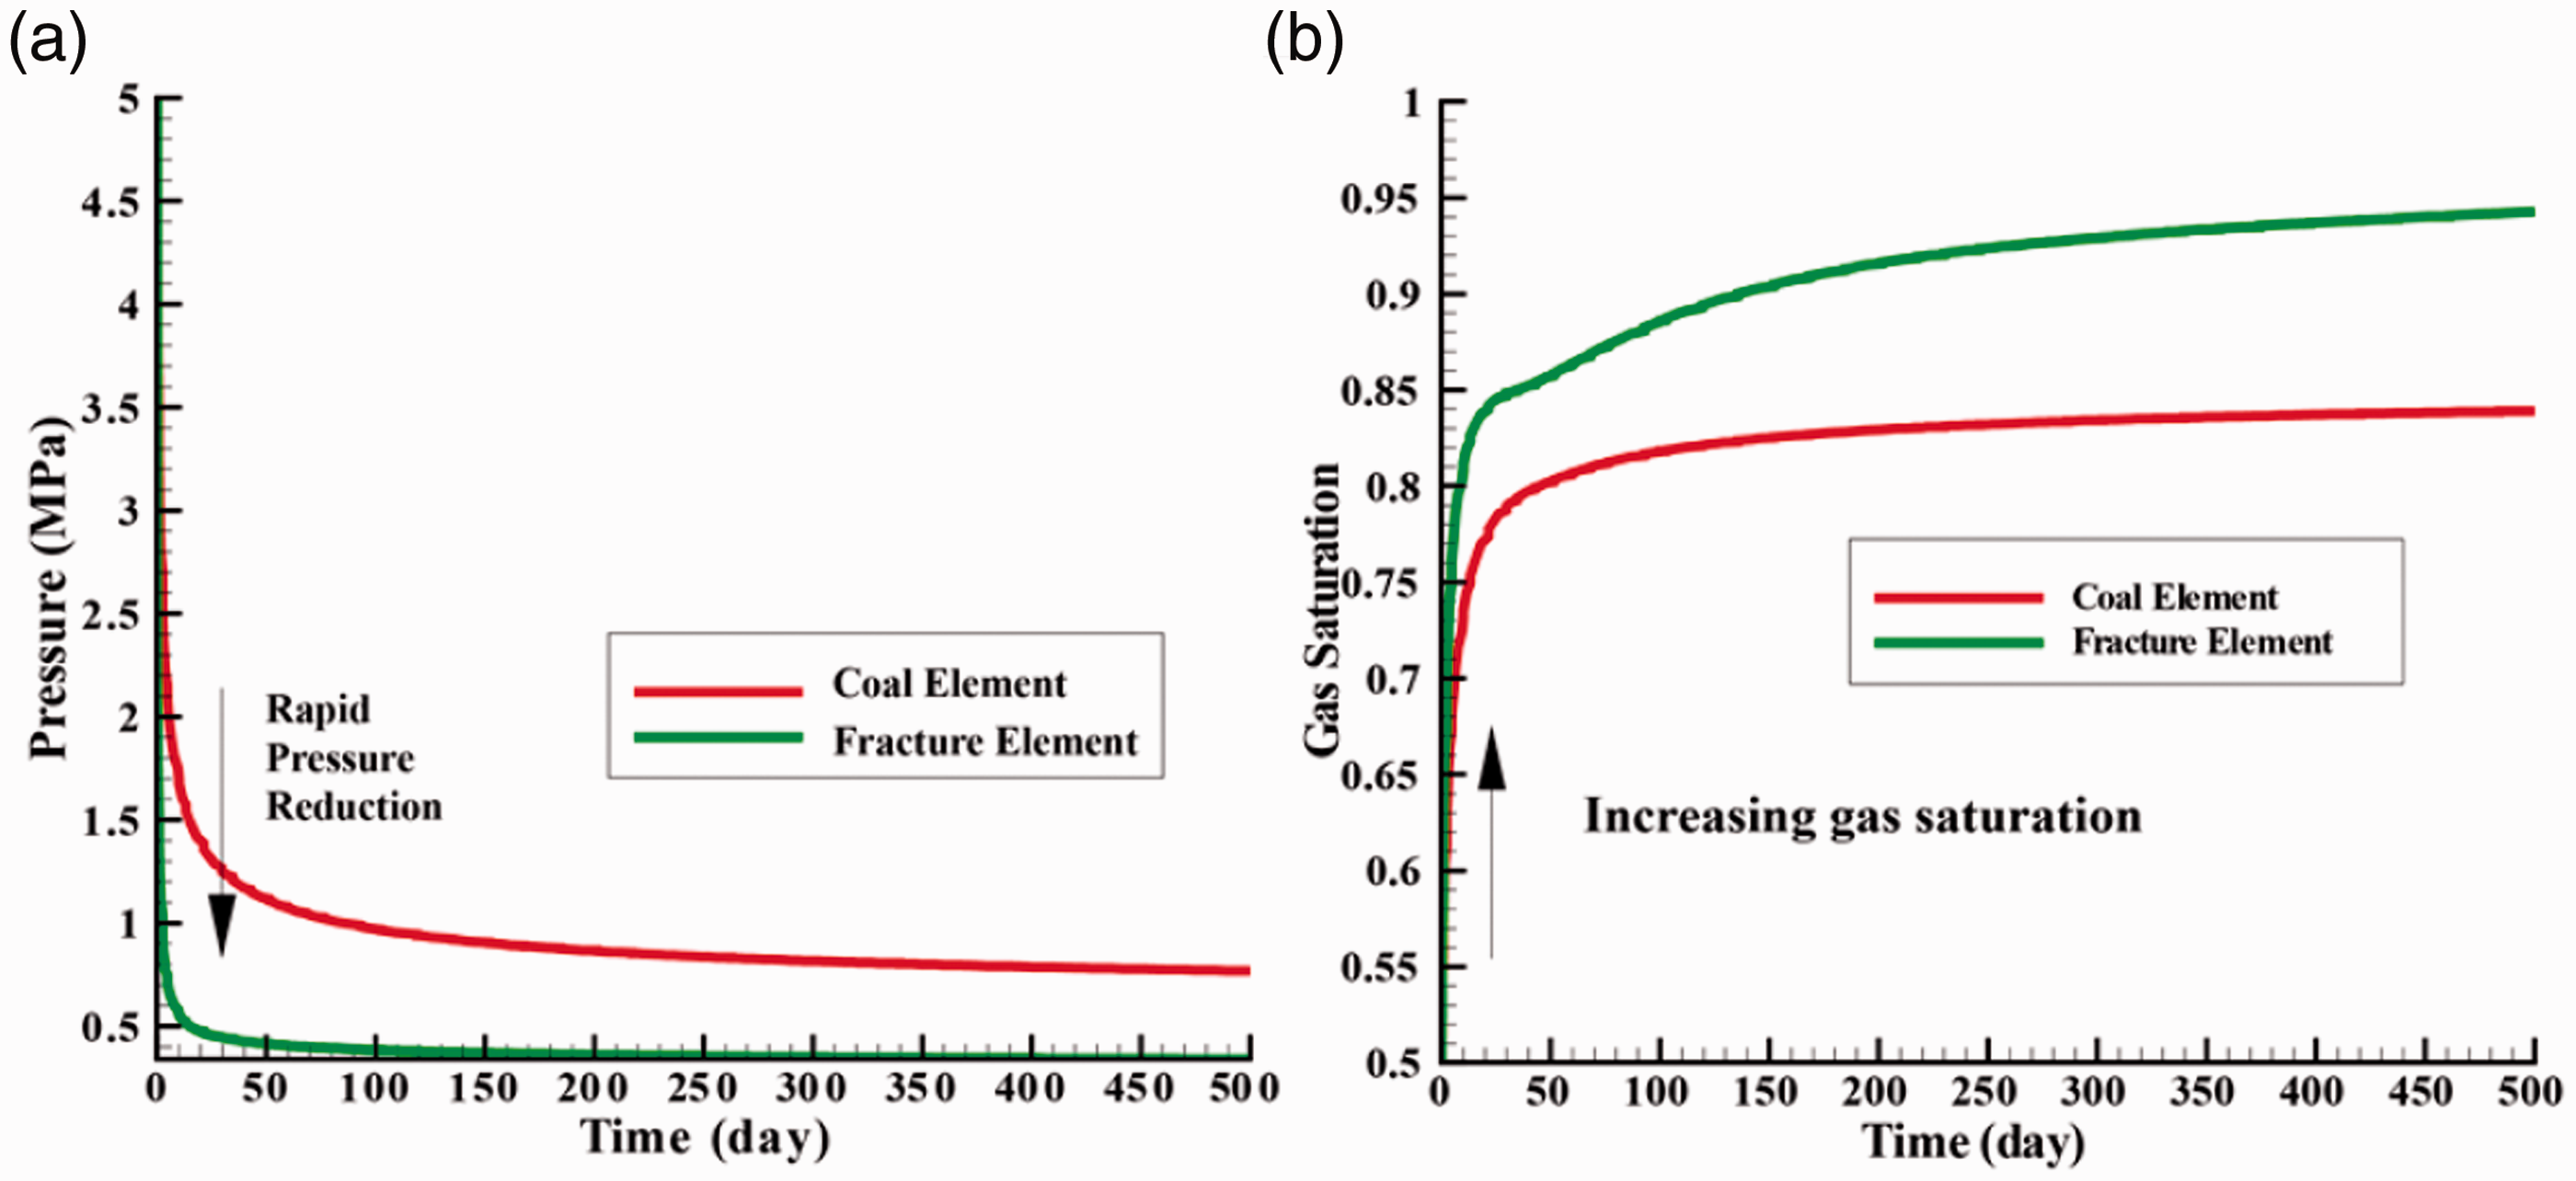
Temporal evolution of the (a) pore pressure and (b) gas saturation at C2 and F2.
The temporal evolution of the total maximum and minimum stresses and effective stresses at coal and fracture elements near the production well is shown in Figure 11. In the exploitation process, the reduction of pressure increases the shear stress in the reservoir, causing the difference between the maximum and minimum principal stresses. The shear stress increase is mainly due to the different mechanical boundaries in different directions and the different variations of stress caused by the pressure drop. In Figure 11(a), the shear stress in the fracture element advances more conspicuously. Subsequently, due to pore pressure reduction, the maximum and minimum effective stresses rise rapidly and remain stable.
Temporal evolution of (a) total and (b) effective maximum and minimum stresses at C2 and F2.
Based on the maximum and minimum effective stress in Figure 9(b), the corresponding stress path is drawn as Figure 12(a). Initially, to ensure that C1 and F1 are in a relatively safe state (without damage), it is assumed that the coal and fracture element's internal friction angle
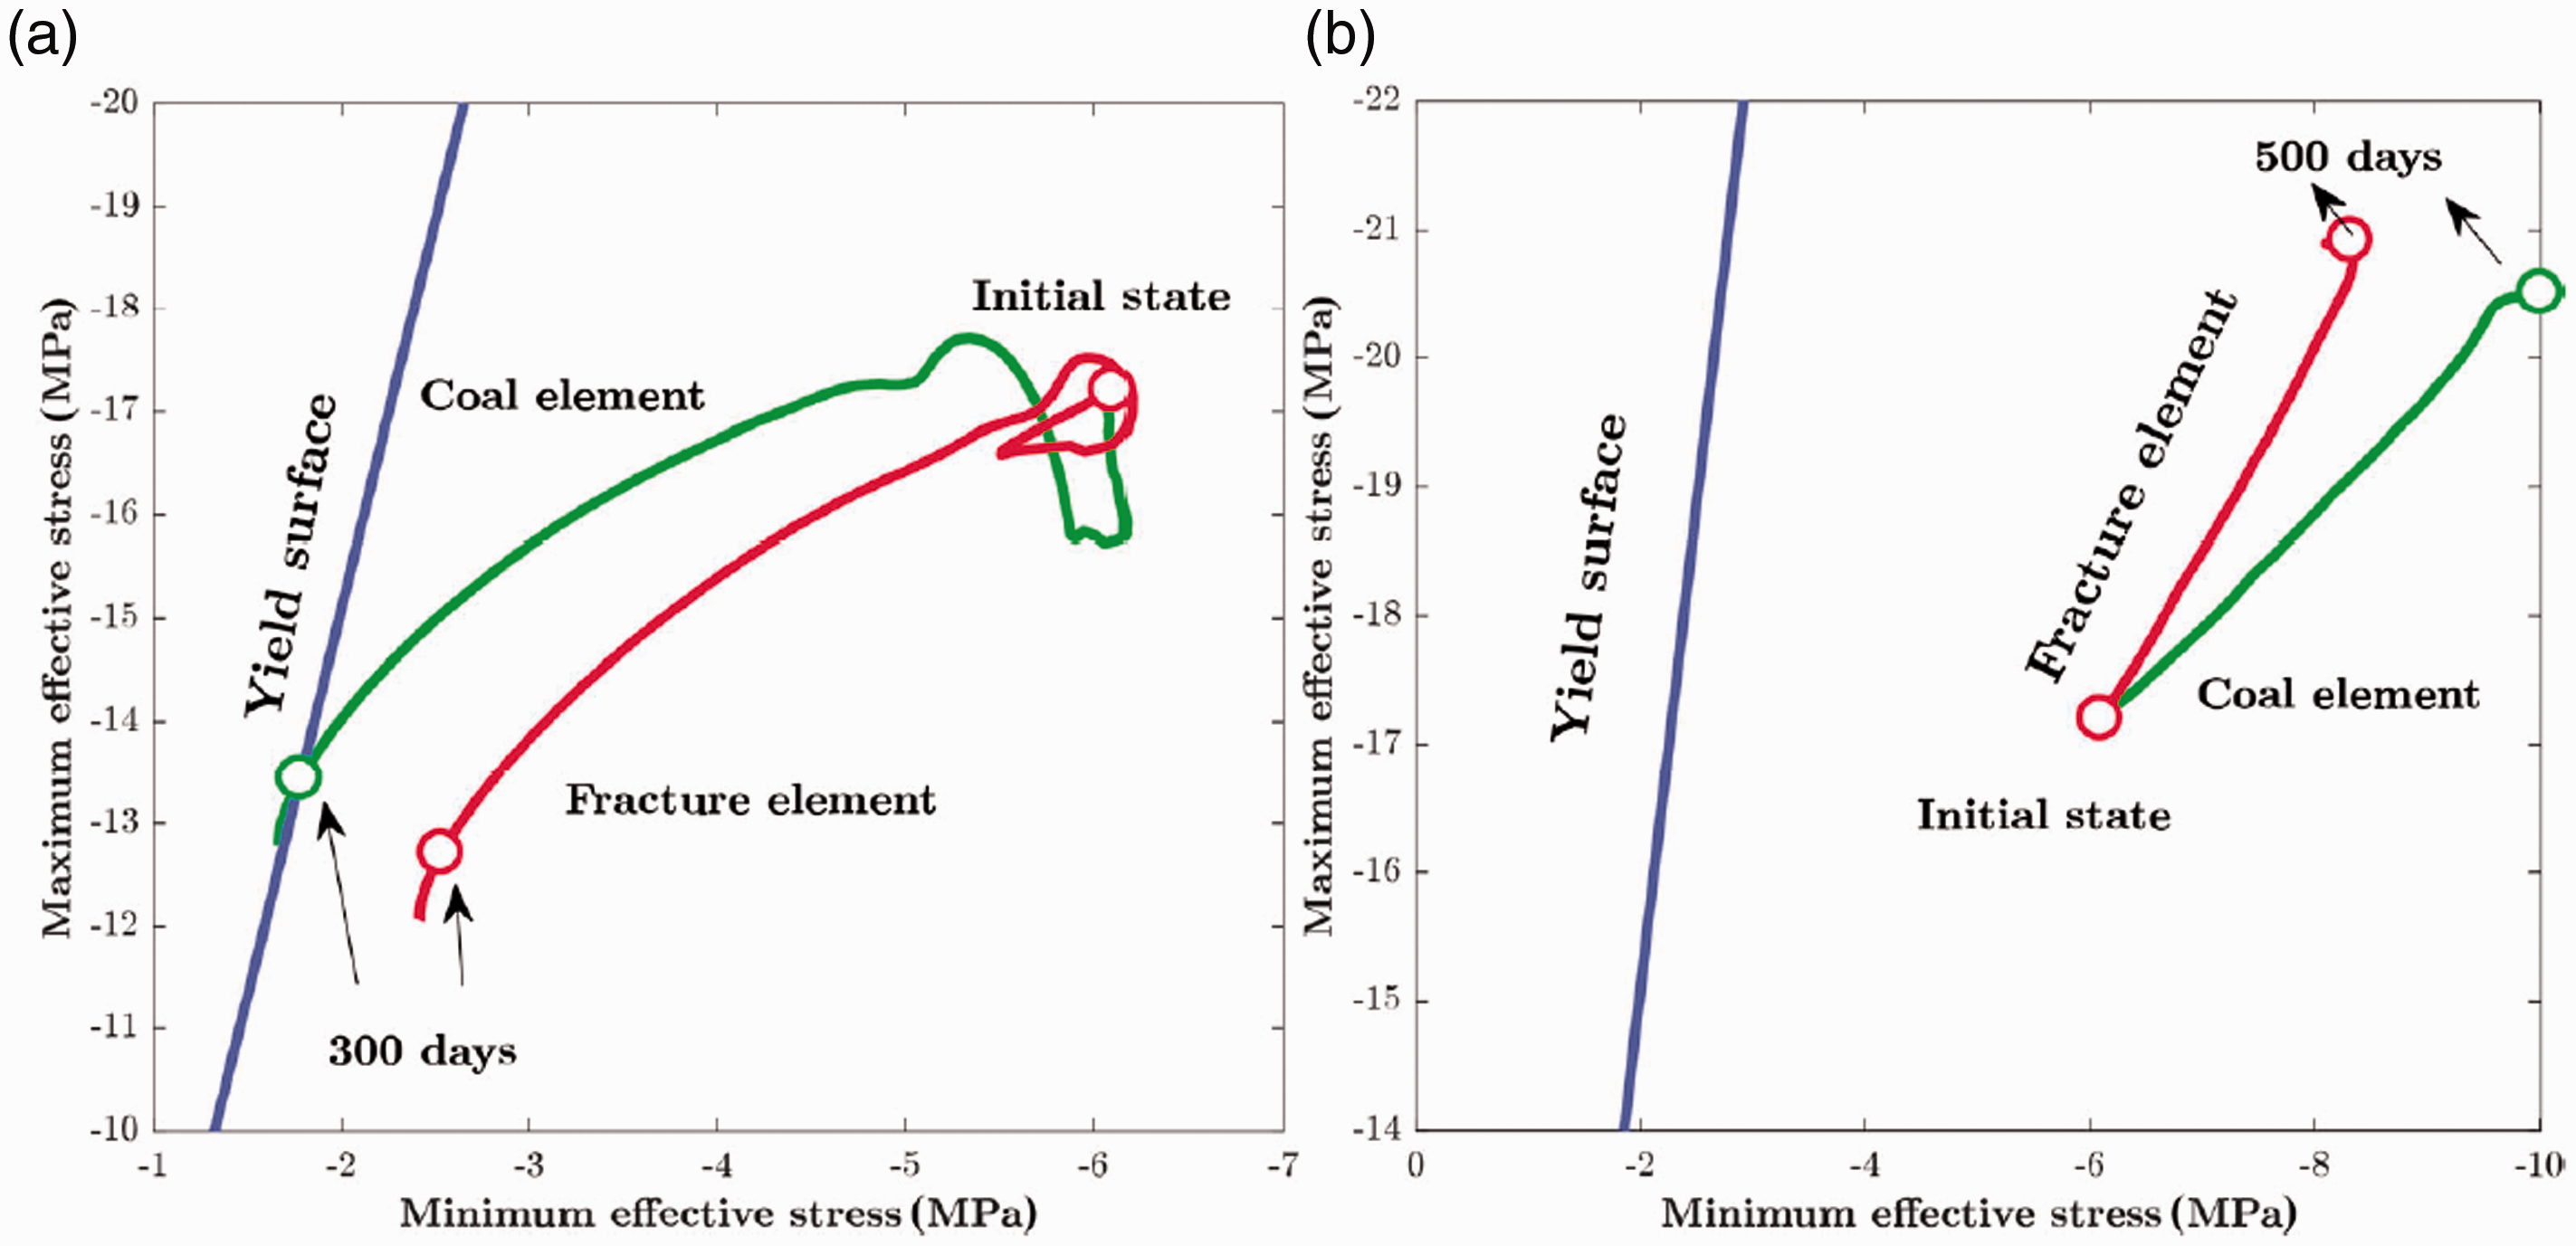
Effective stress paths at (a) C1, F1 and (b) C2, F2.
The influence of secondary fracturing
Figure 13 shows the distribution of the horizontal stress
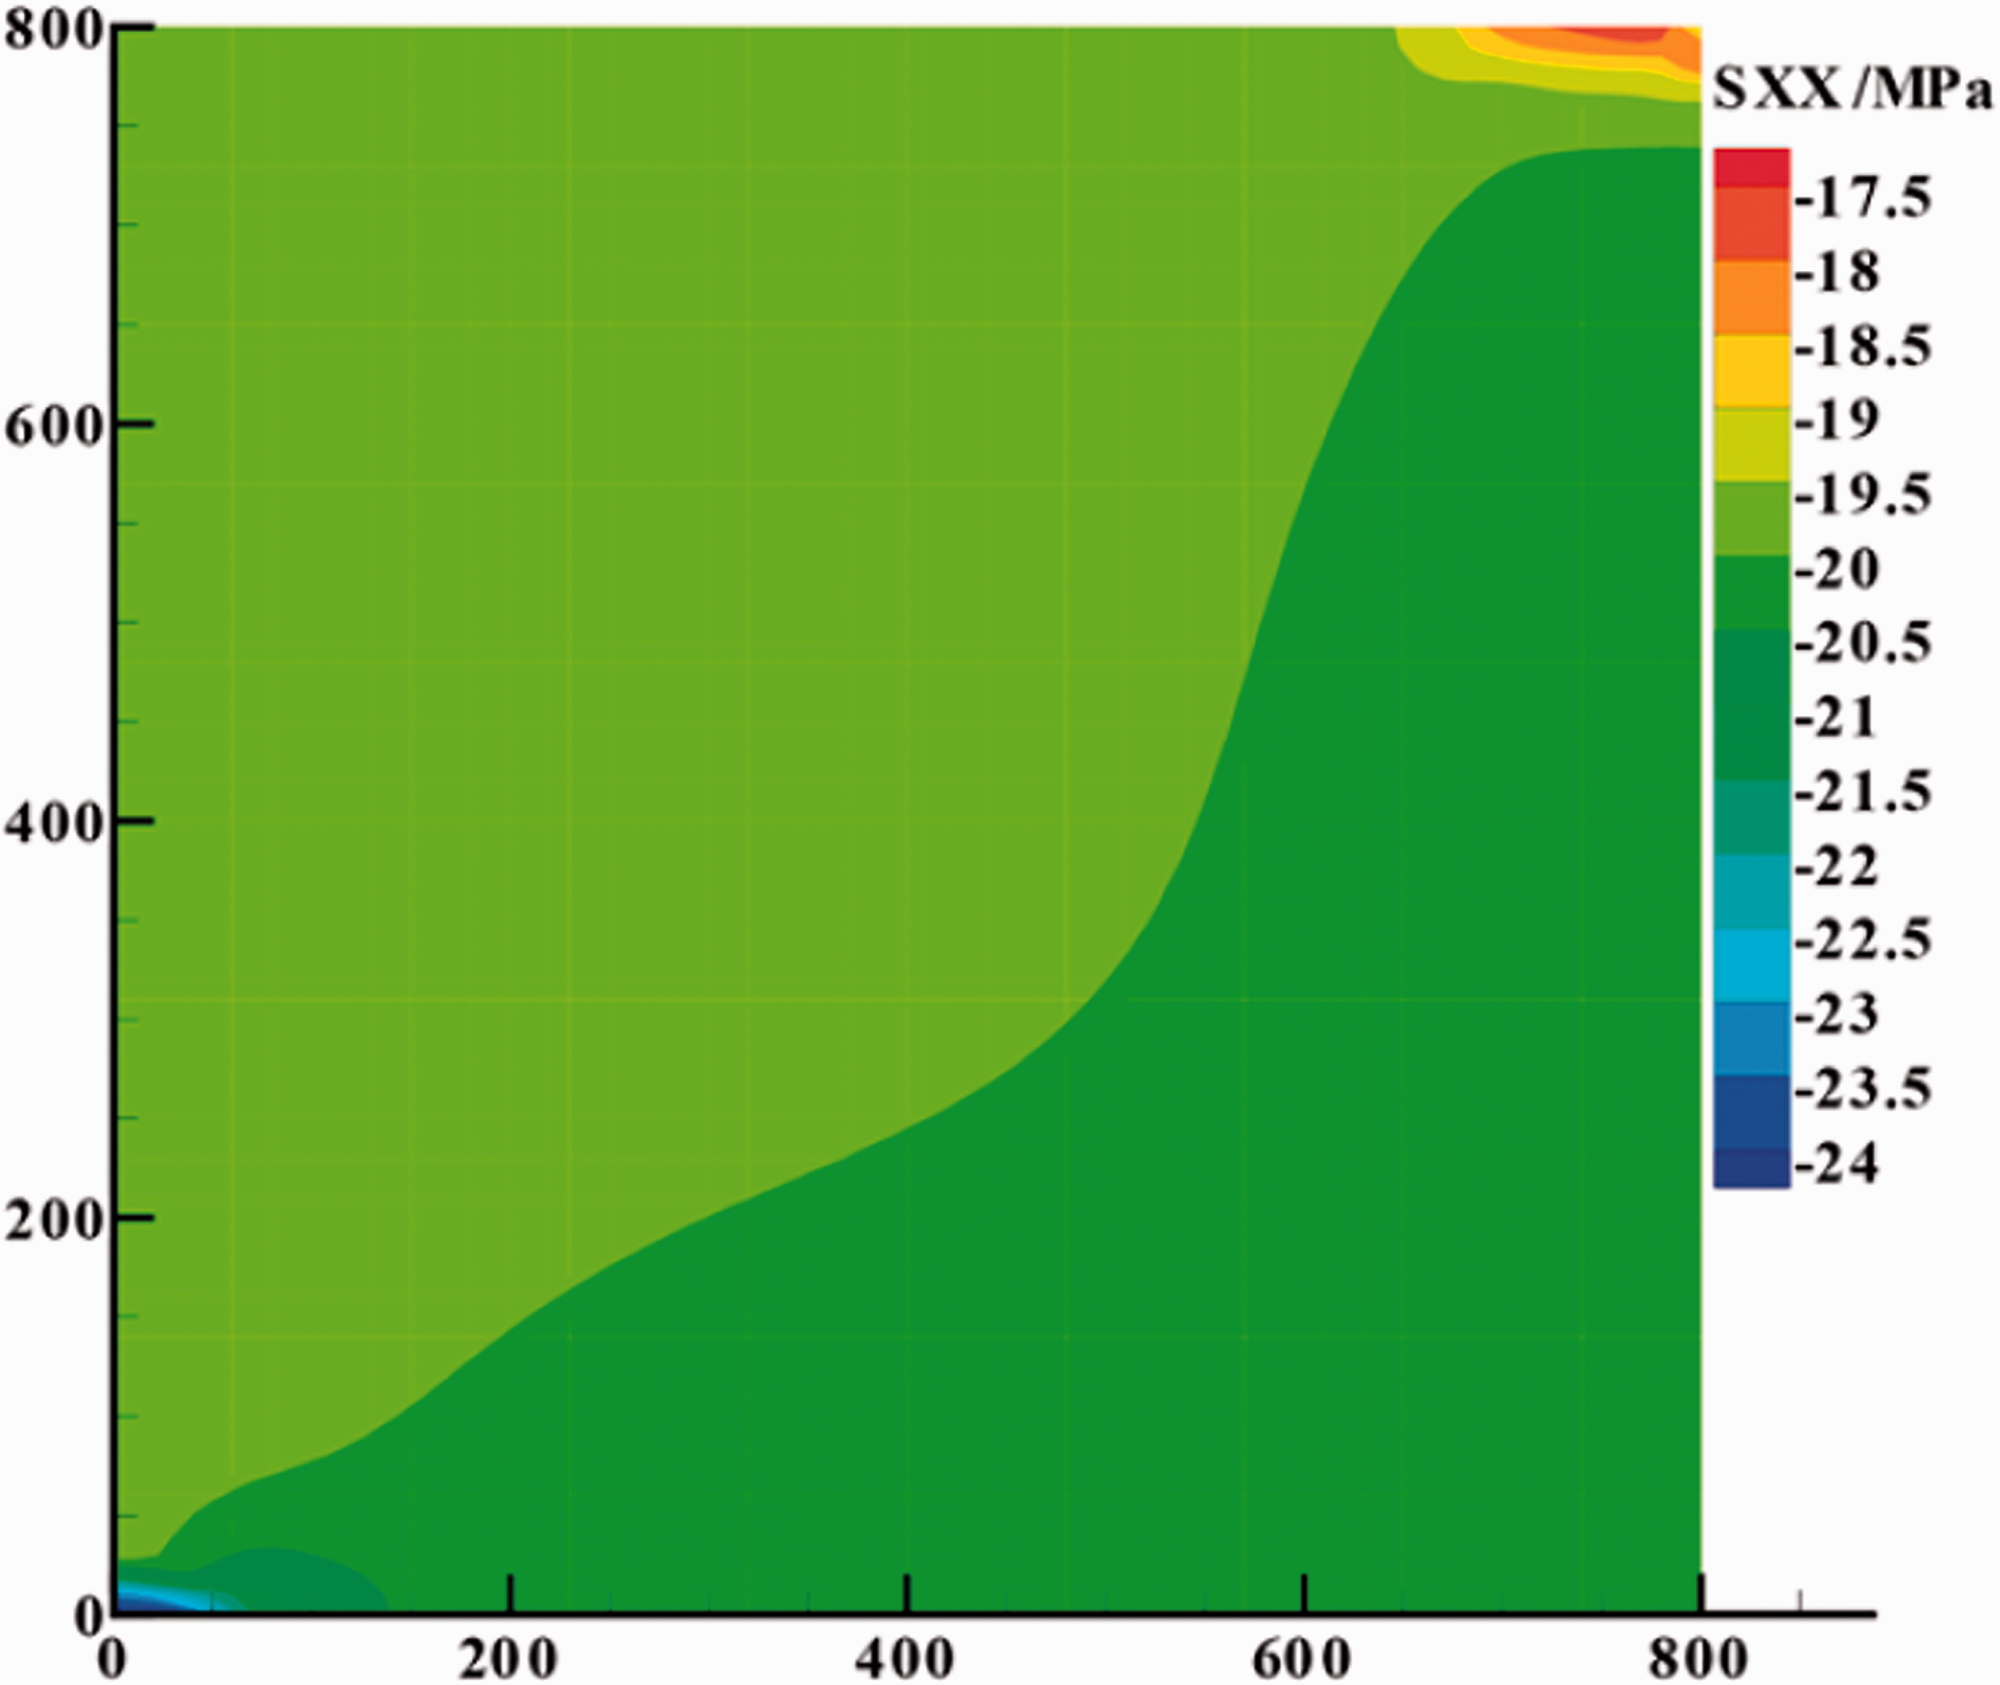
Distribution of horizontal stress
Figure 14 shows the geometry of the secondary fracturing model and the initial stress state. Figure 15 shows the distributions of the pore pressure and CO2 mass fraction
The geometry of secondary fracturing model and initial stress state.
In the case of secondary fracturing, the distribution of pore pressure in 10 days (A), 100 days (B), 1 year (C), and the distribution of CO2 mass fraction in 10 days (a), 100 days (b), 1 year (c).
Figure 16 Figure 16 shows the distributions of pore pressure and CO2 mass fraction along the vertical monitoring line (x = 2.5) in the early (10 days), middle (100 days), and late (1 year) of injection and production. Free CO2 can displace methane and water more quickly in the coal seam because of the higher permeability and porosity of the fractures. In the early, middle and late stages of injection, secondary fracturing results show that gaseous CO2 can reach 100 m, 150 m and 250 m away from the well. Figure 17 shows the production rate and cumulative production of coalbed methane. With the other parameters unchanged, the cracks of secondary fracturing help improve the production efficiency and cumulative production of coalbed methane in the entire production process. The cumulative production increased from
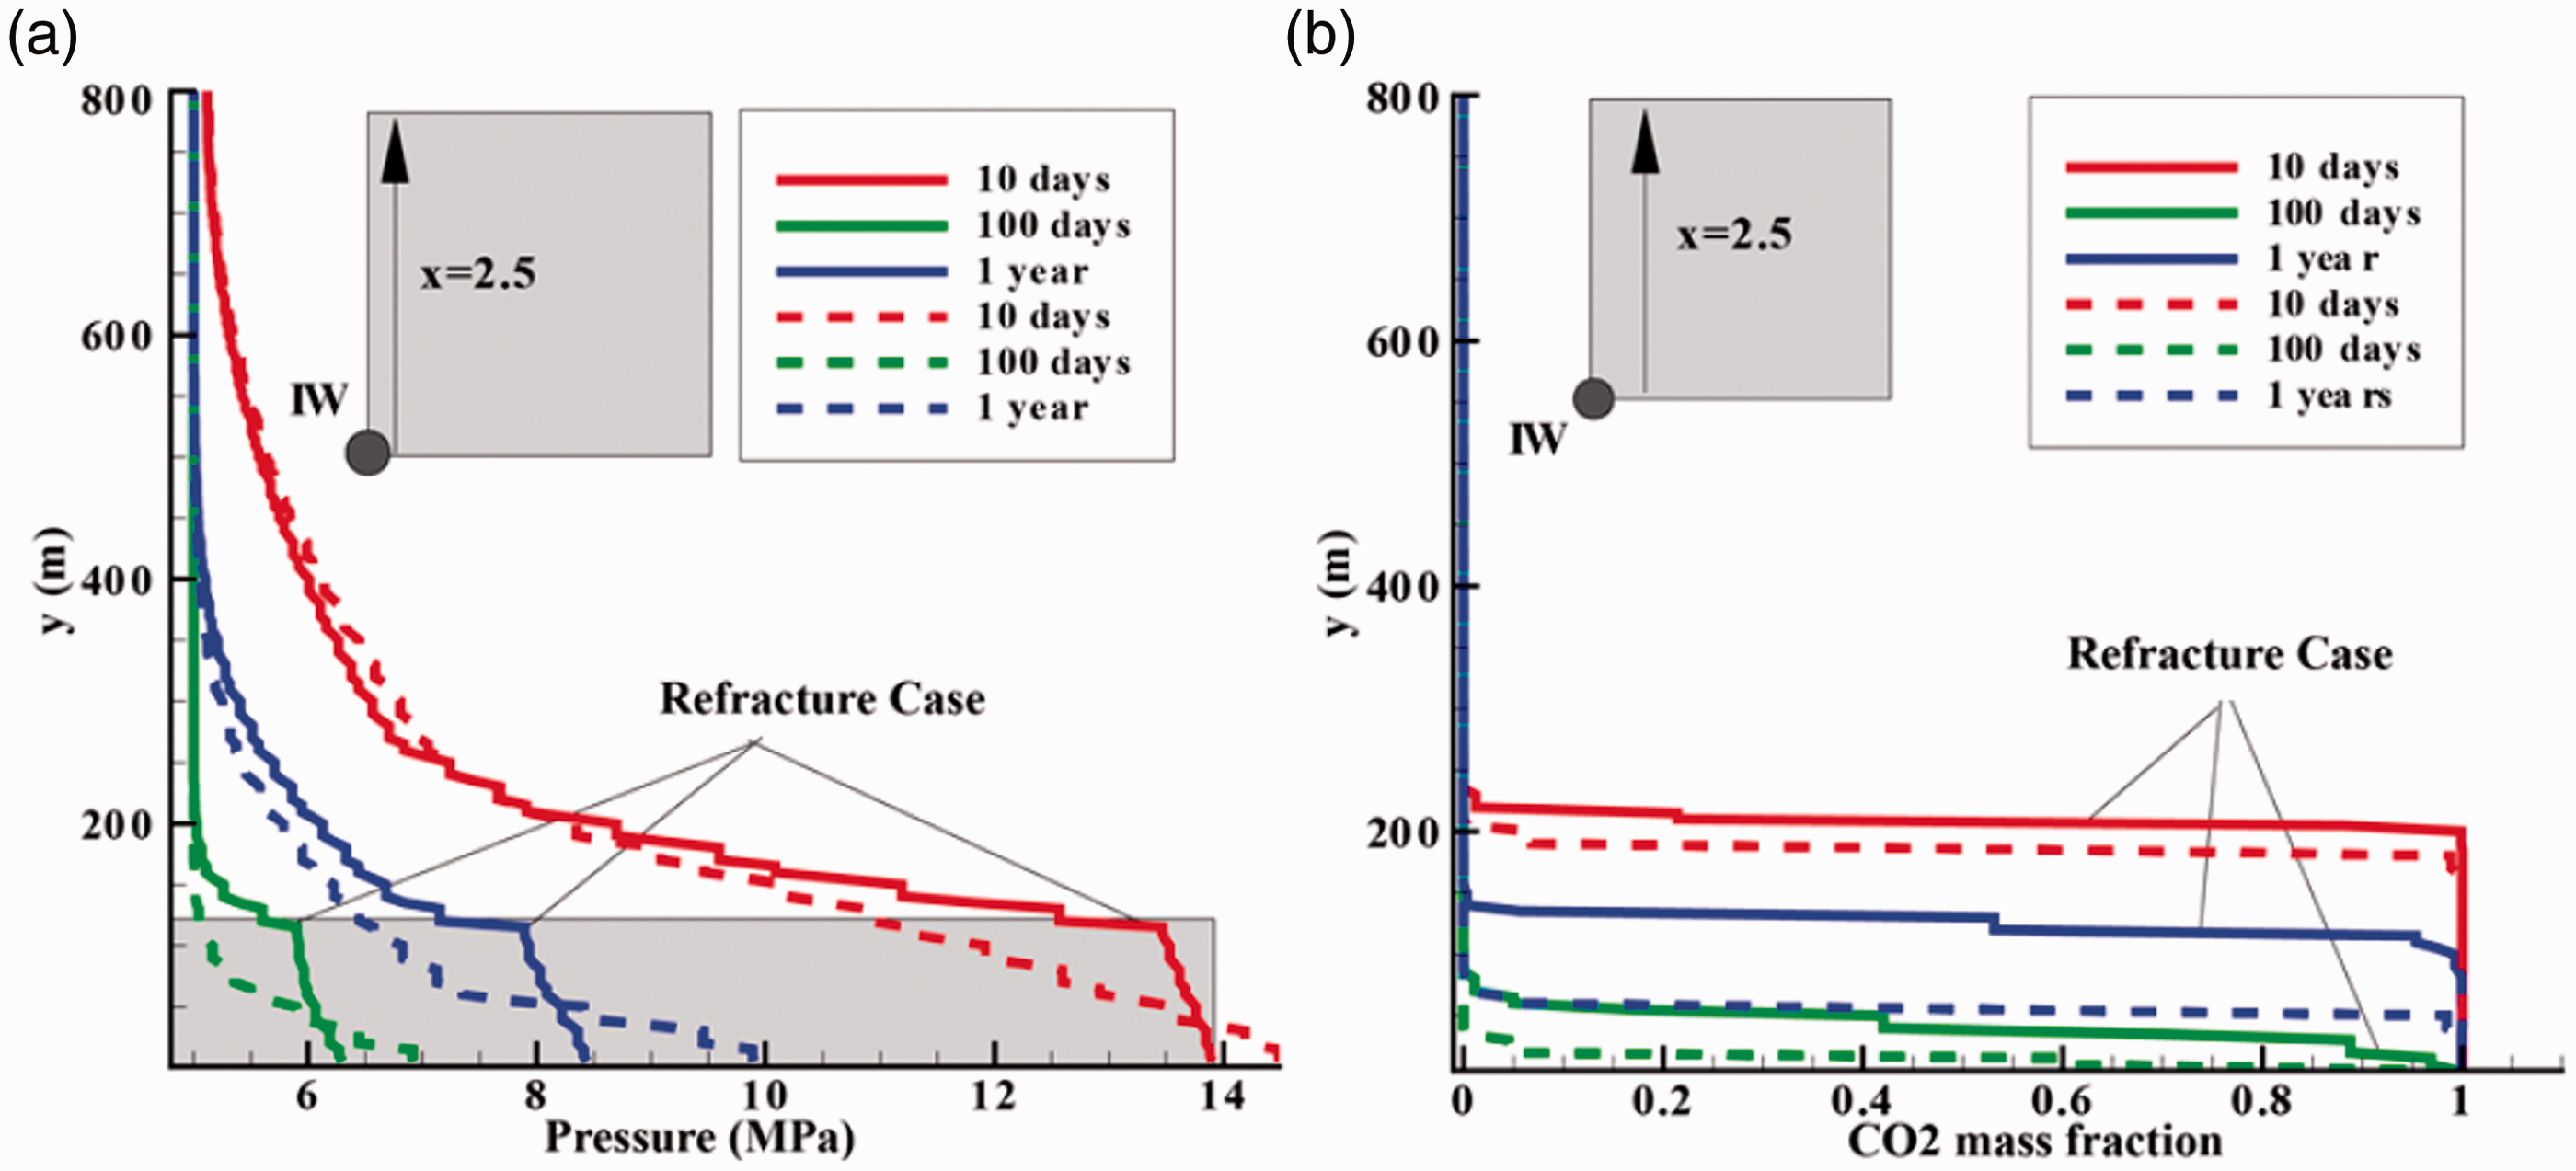
The distributions of pore pressure and CO2 mass fraction along the vertical monitoring line after 10 days, 100 days and 1 year of injection and production.
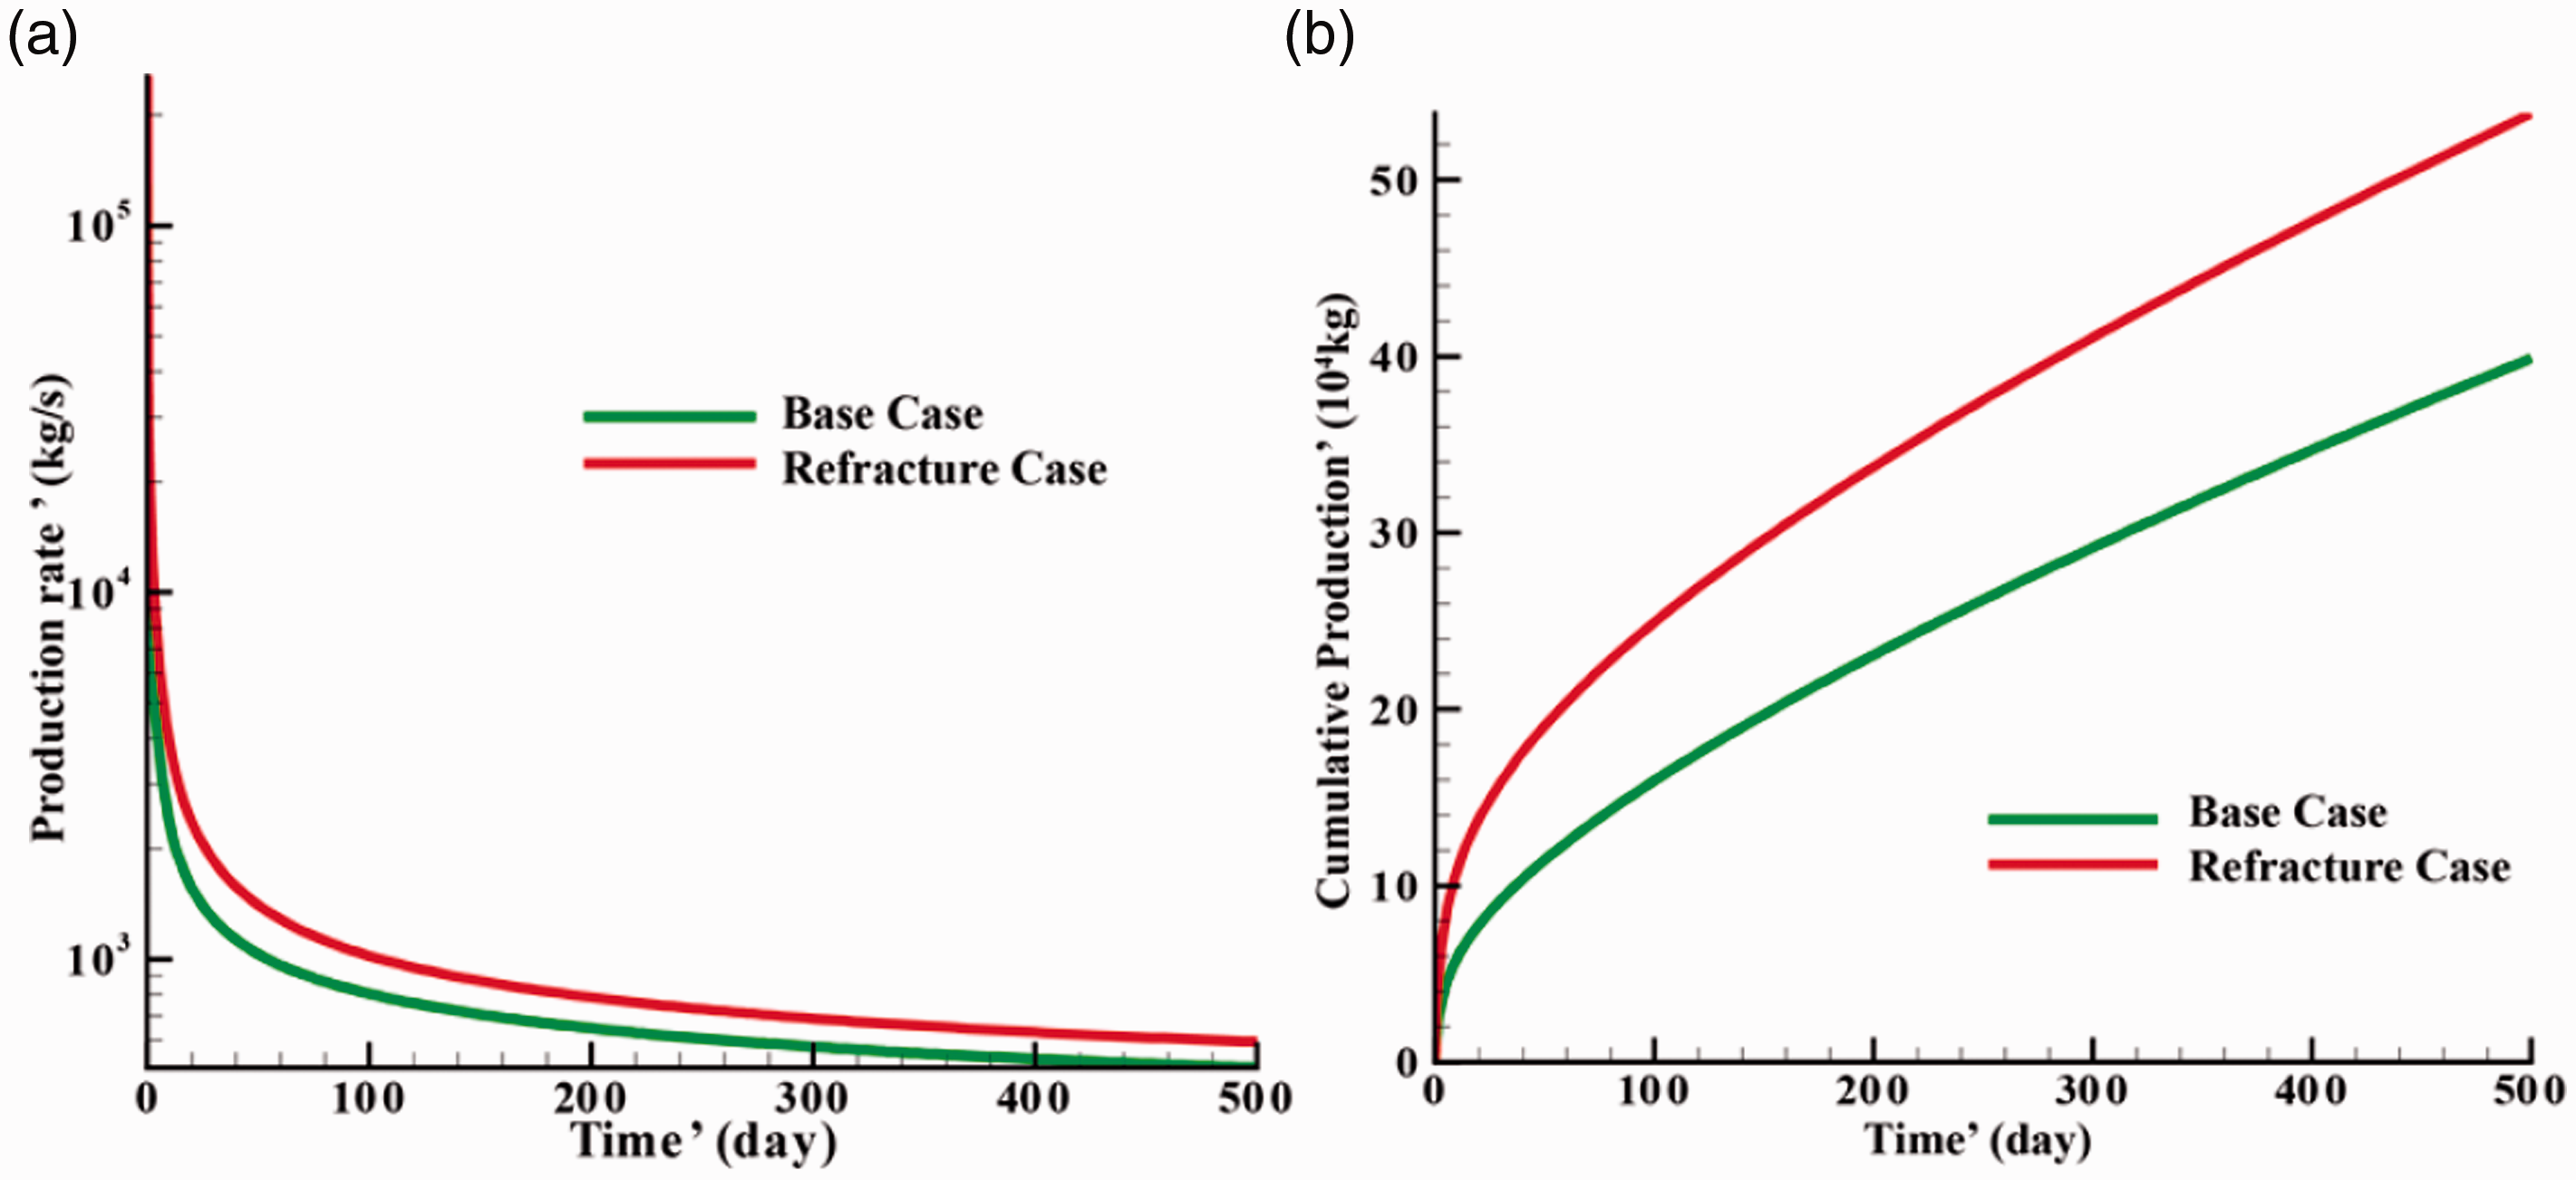
(a) Production rate and (b) cumulative production of coalbed methane.
This section presents sensitivity analyses on the effects of increasing/decreasing length and permeability of fracture caused by secondary fracturing (‘refracture’ for short) by 20% on the injection and production. The basic value of fracture length is 100 m, the decreasing and increasing values are 80 m and 120 m, respectively; the basic value of permeability is
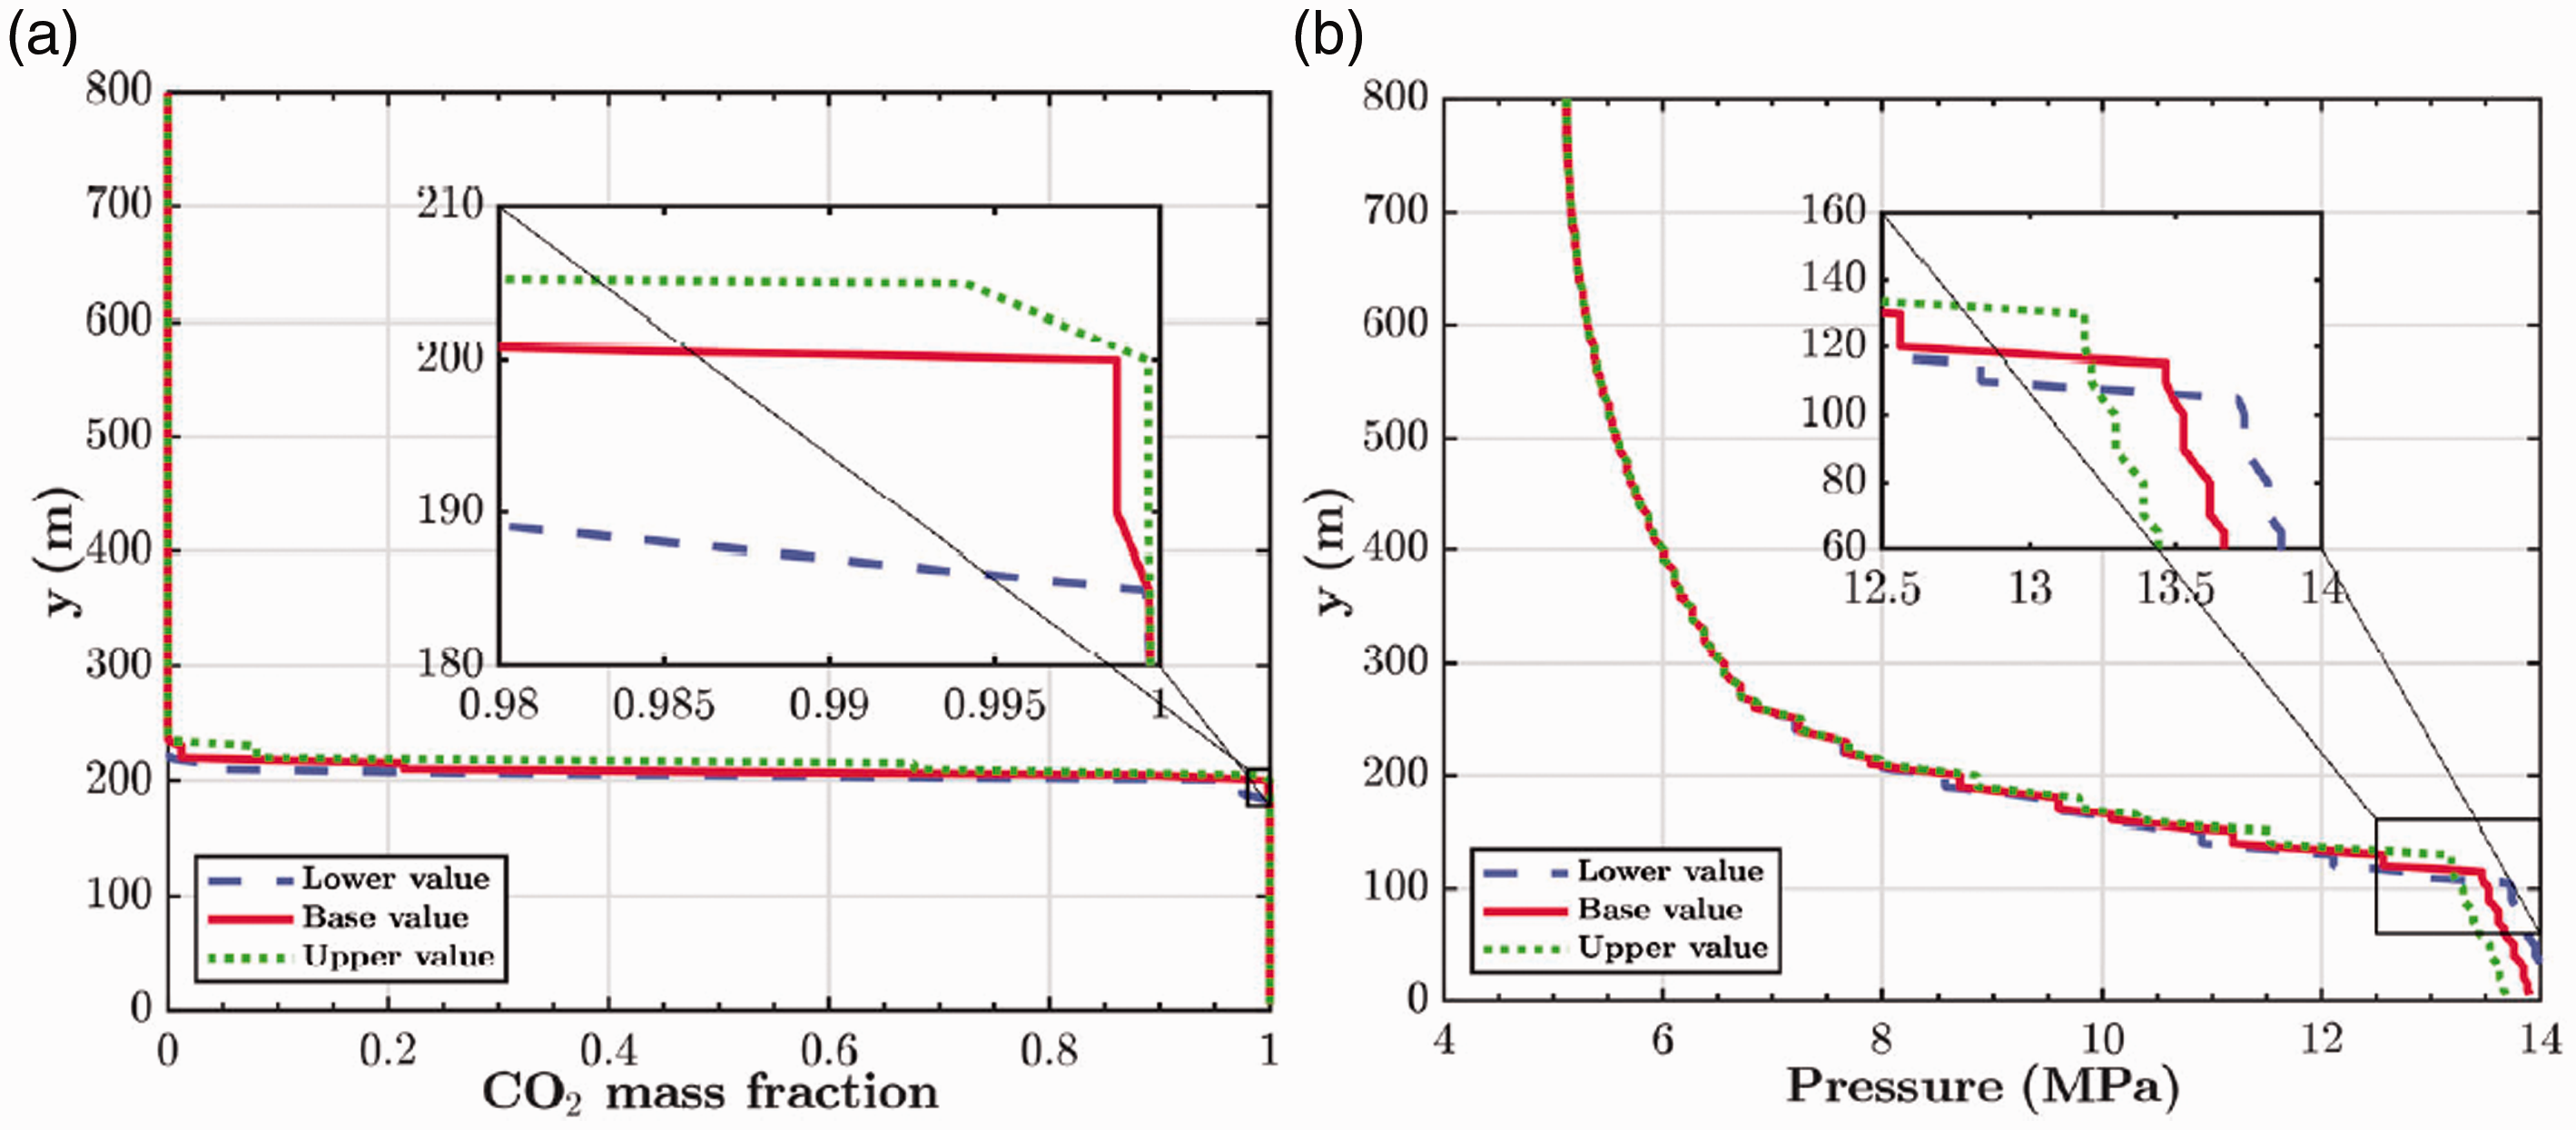
Effect of refracture length on (a) CO2 mass fraction and (b) pore pressure along the vertical monitoring line.
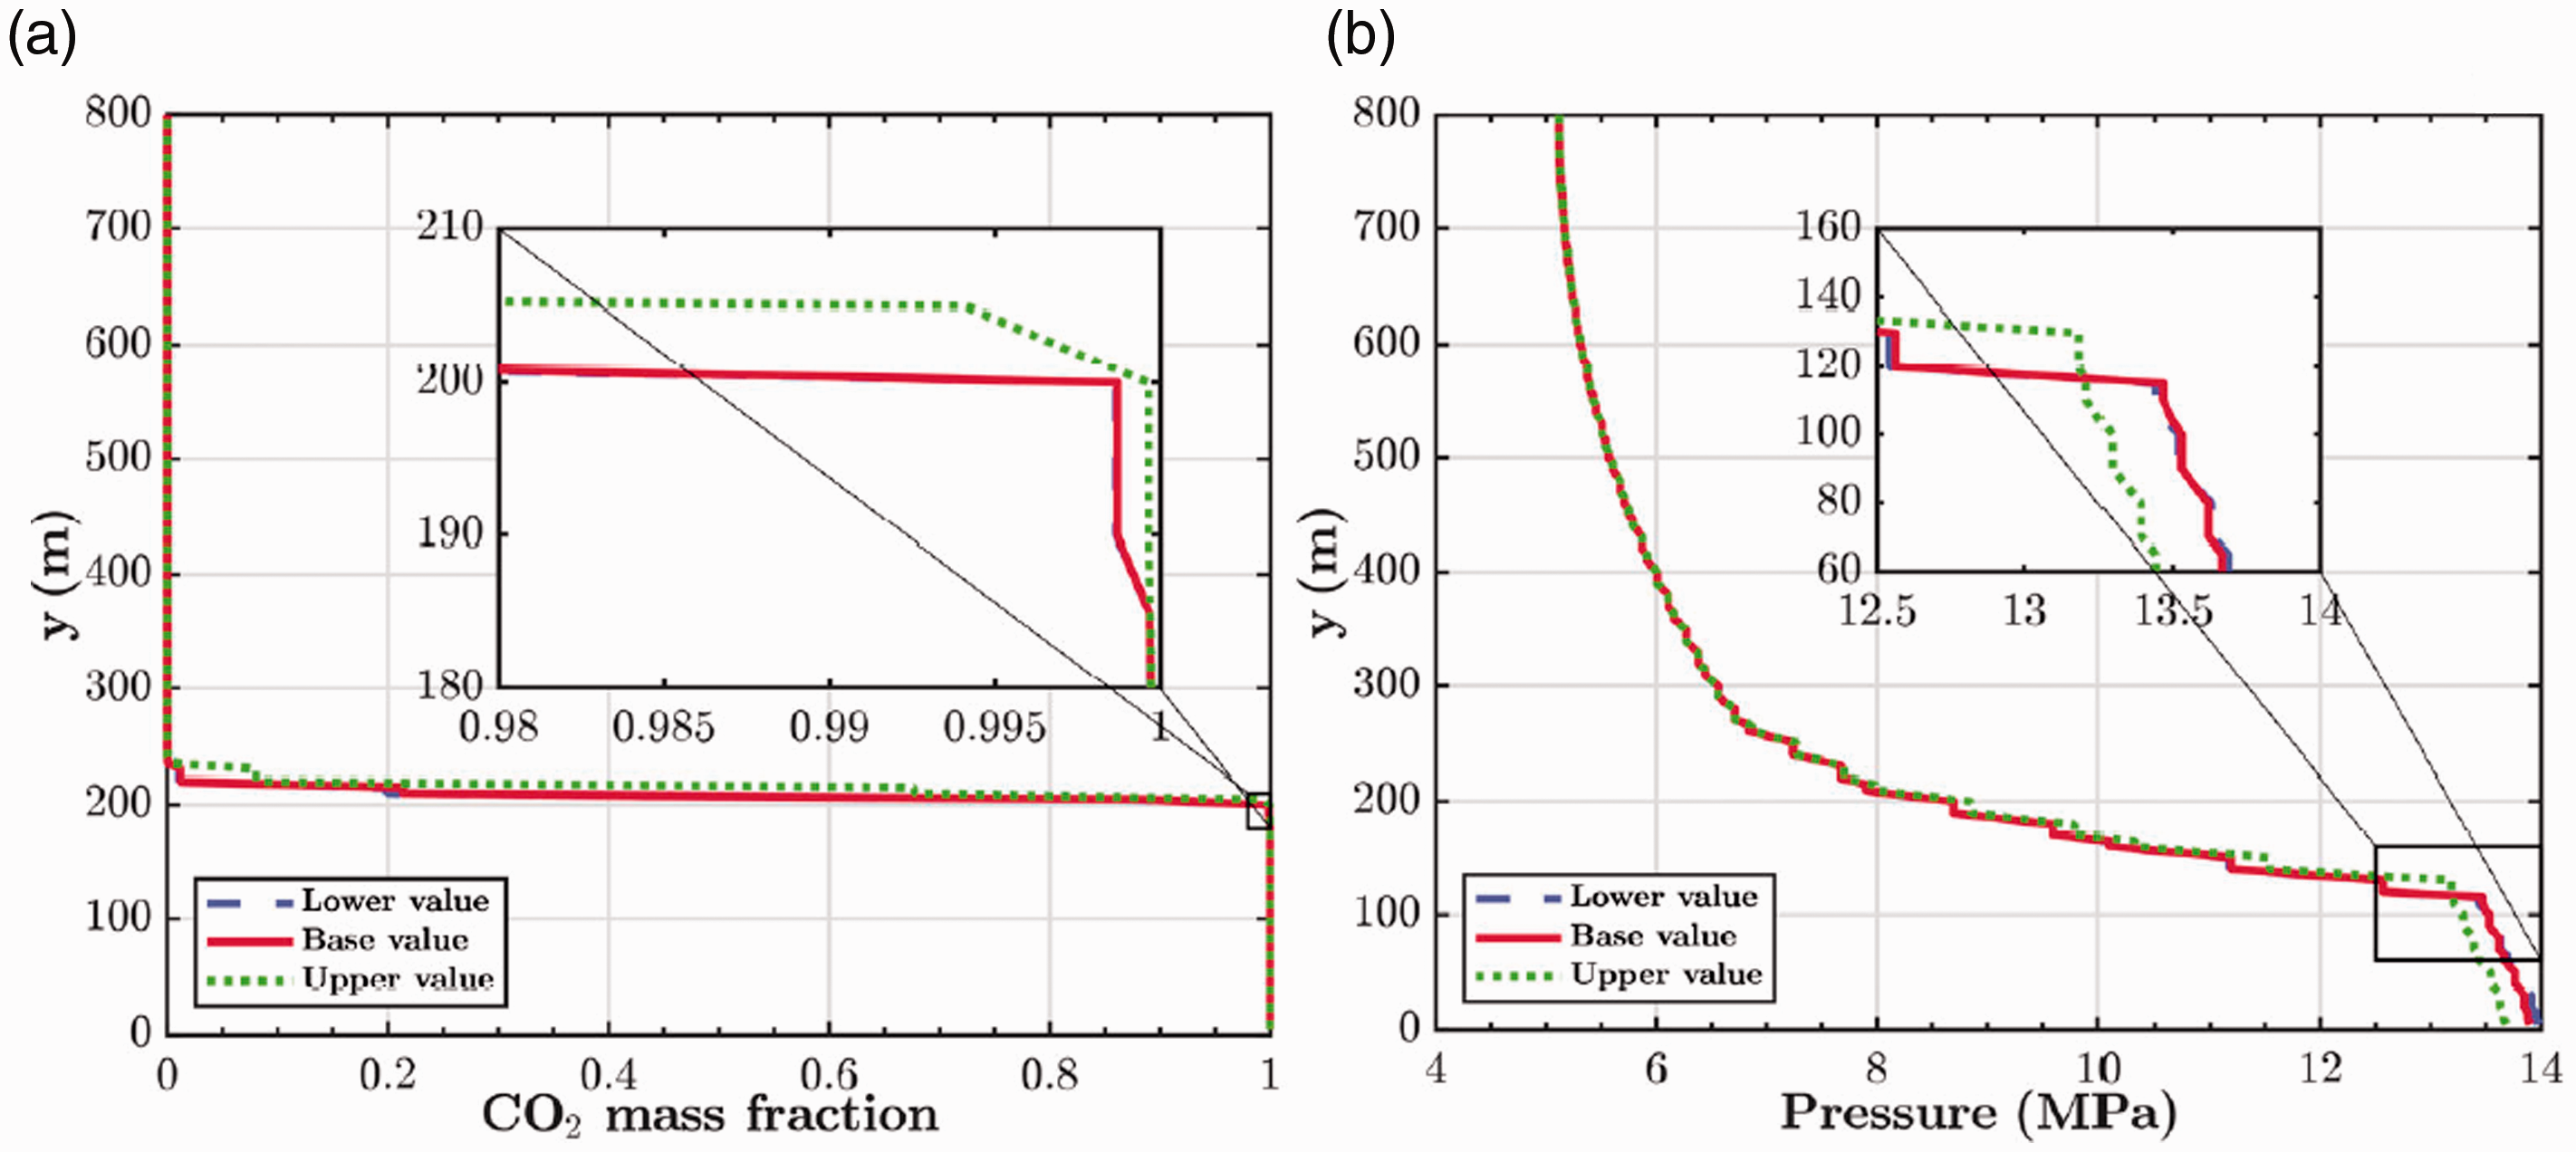
Effect of refracture permeability on (a) CO2 mass fraction and (b) pore pressure along the vertical monitoring line.
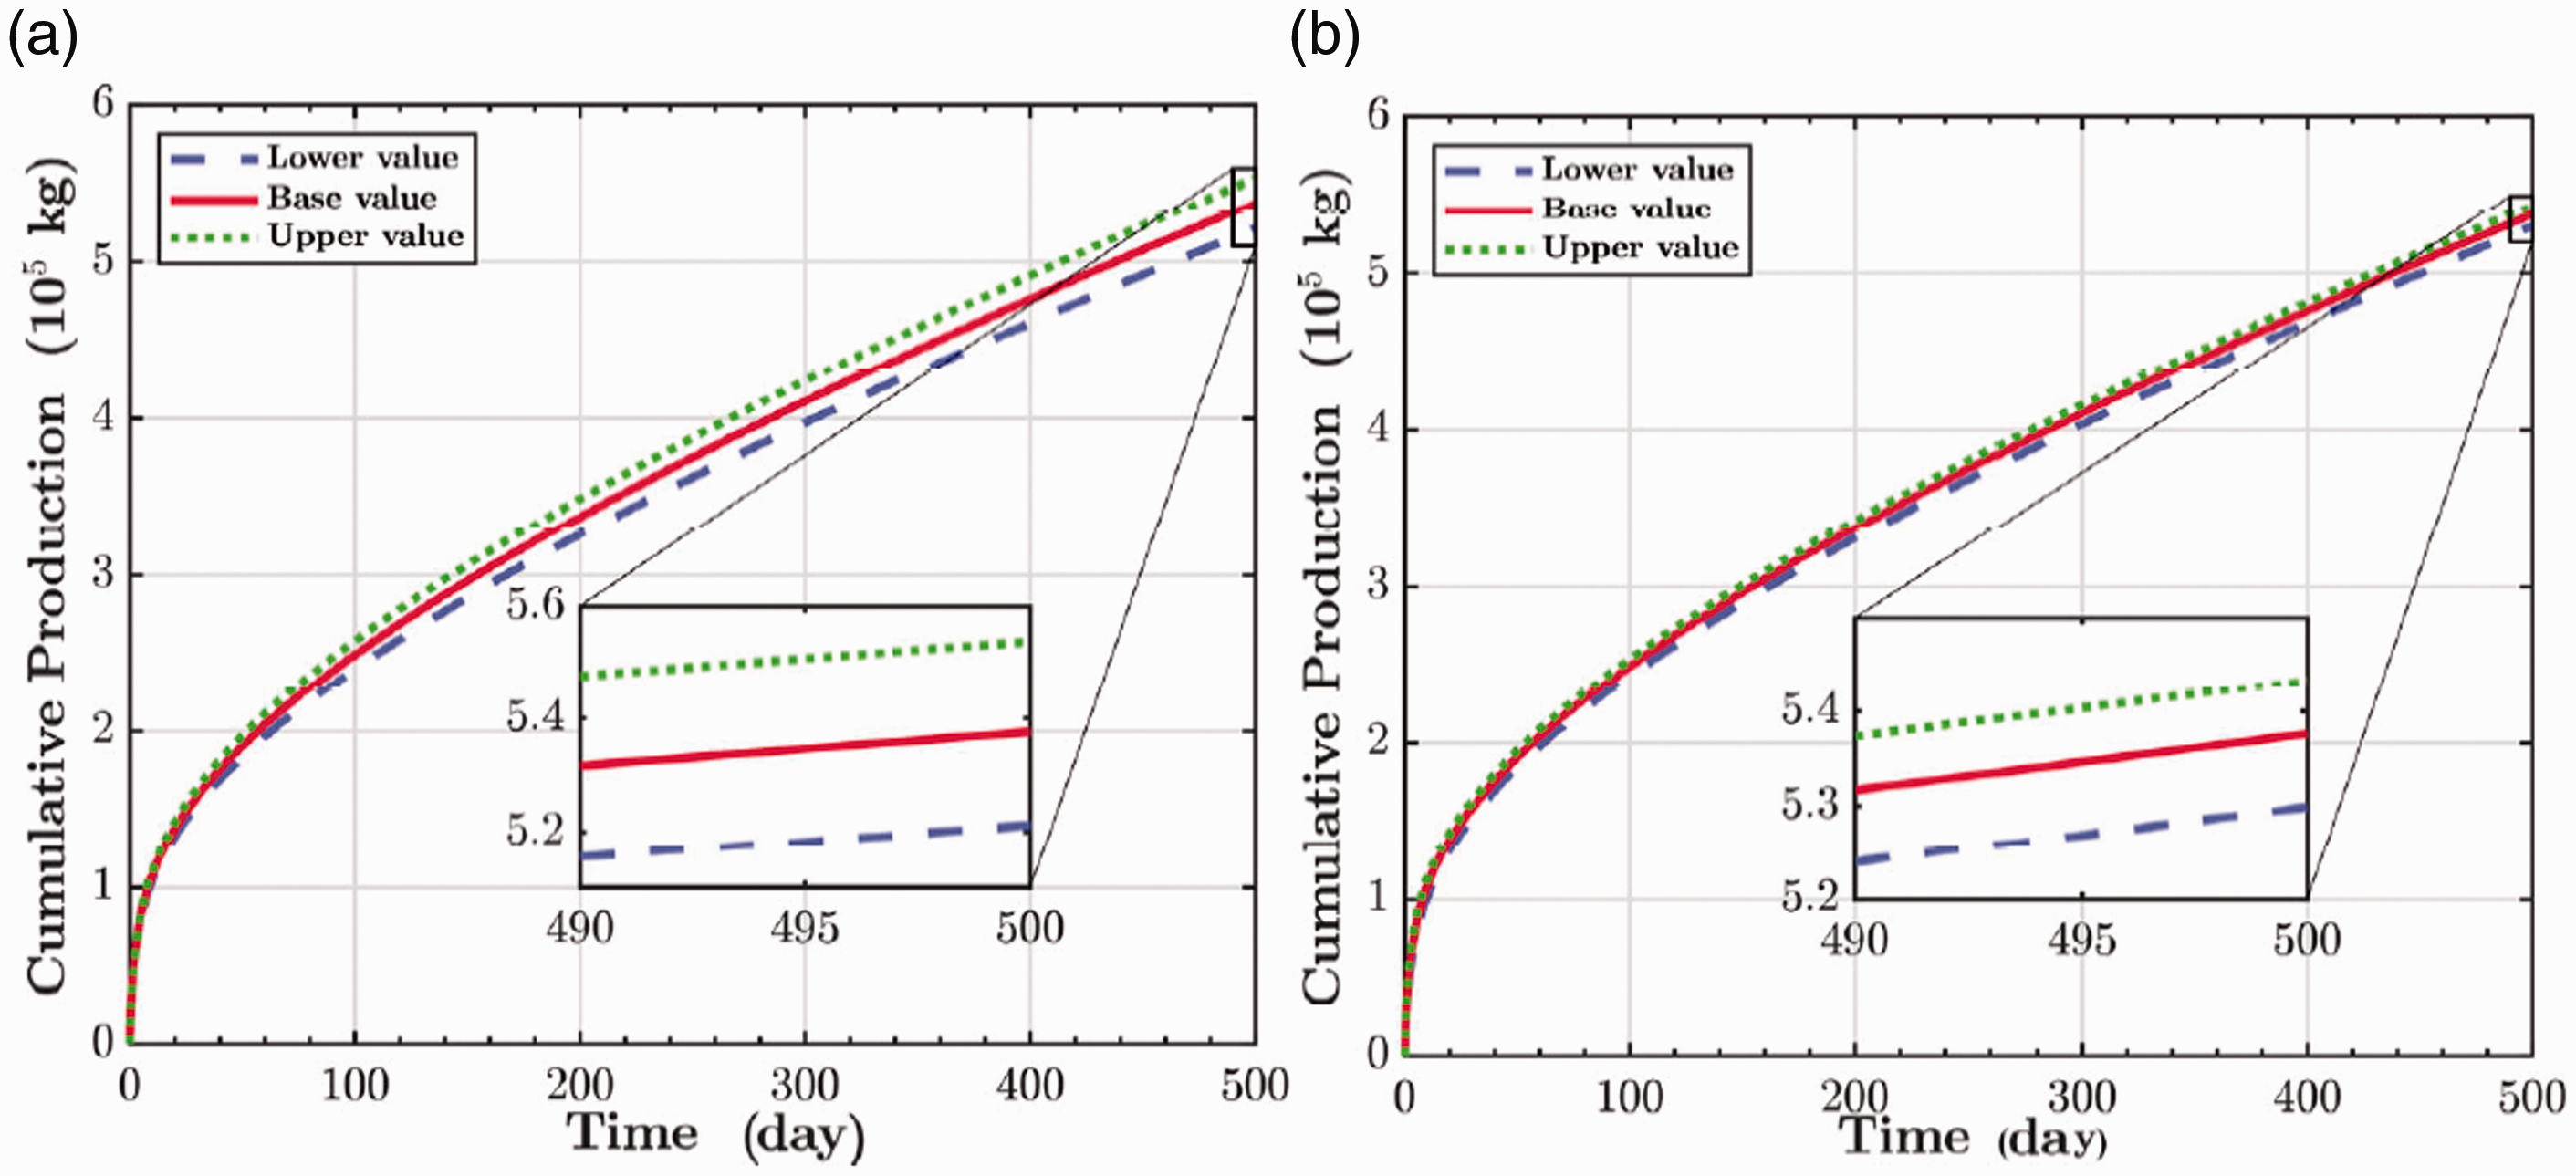
Effect of (a) length and (b) permeability of refracture on cumulative production of coalbed methane.
From Figures 18 and 19, it is evident that the increase of refracture length and opening contributes to the rapid flow of CO2 to the coal seam, thereby effectively reducing the pore pressure near the well. The pressure drop can reduce the probability of damage near wells. As shown in Figure 20, when the length of refracture changes by
Conclusions
In this study, the influence of hydrofracturing and secondary fracturing in CO2-enhanced coalbed methane was studied using a coupled THM model with consideration of a stress-dependent reservoir permeability model and an anisotropic fracture permeability model. The variation in fracture permeability is affected by fracture normal stress and dilatancy effect, and the basic mechanical properties of fracture were calculated using the equivalent continuity method. We conclude as follows:
Hydrofracturing and secondary fracturing help improve the permeability of coal seam, thus effectively improving the injection efficiency, causing CO2 to flow and rapidly displace CH4. Also, the pore pressure near the well is effectively suppressed, which reduces the probability of damage in this region. The maximum production of the fracture adjacent to the production well is 100 times that of the intact coal, which are 1.48 kg/s and In addition to continued fracturing, increasing the fracture length is also a meaningful way to increase permeability by secondary fracturing. The fracture length increases by 20%, and the cumulative production of coalbed methane increases by approximately 3.17%.
Footnotes
Acknowledgments
This study was supported by National Science and Technology Major (No. 2016ZX05043), National Natural Science Foundation of China (No. 42002255 and 41902310), Chinese Geological Survey (No. DD20201165), Natural Science Foundation of Jiangsu Province (BK20180636), Natural Science Foundation of Liaoning Province (2020KF2303), and Natural Science Foundation of Chongqing (cstc2020jcyj-msxmX1052).
Declaration of conflicting interests
The author(s) declared no potential conflicts of interest with respect to the research, authorship, and/or publication of this article.
Funding
The author(s) received no financial support for the research, authorship, and/or publication of this article.