
Abstract
In order to improve the accuracy of the surface dynamic prediction model in mining areas with thick unconsolidated layers and improve Knothe time function, the influence coefficient was firstly changed into the coefficient in exponential form, and the influence coefficient of unconsolidated layer was added. Then, a subsidence basin prediction model for mining under thick unconsolidated layers was established. Next, the model was combined with the improved Knothe function, thus constructing a new mining subsidence prediction model. The new subsidence prediction model was applied in 1414 (1) working face in Huainan mining area. The results showed that the integrated model could better reflect the subsidence process, and the prediction values and the measured values agreed well.
Introduction
In recent years, it has been found out that the surface subsidence in some mining areas with thick unconsolidated layer in China, such as Huainan, Huaibei, Datun, Yanzhou and etc, is intense and concentrated. Moreover, the convergence of surface subsidence basin edge is slow. Under such background, it is of great significance to dynamically get surface movement laws in such areas. This could reveal the mechanism of mining subsidence, but also provide data basis for buildings (structures) protection and damage identification.
At present, dynamic prediction methods of surface subsidence mainly include time function model, prediction model based on measured data, mechanical and numerical simulation method and etc. Zhang et al. (2020) proposed an improved two-parameter time function model and a simple parameter calculation method; Wang et al. (2012) proposed a time function model of surface subsidence based on Morgan-Mercer-Flodin (MMF) function, and verified its feasibility by engineering application; Djamaluddin et al. (2011) proposed a dynamic prediction model by integrating GIS system and Knothe function and applied it to the prediction of surface subsidence disasters and the evaluation of damage levels; Unlu et al. (2013) used geographic information technology to simulate the dynamic process of surface movement and deformation; Wang et al. (2018) provided a surface prediction model for rock grouting and filling mining and achieved good prediction results; Yang et al. (2017) proposed to use shape variables obtained by InSAR to calculate parameters of the logistic model in view of low quality of SAR image data under certain conditions, so as to conduct prediction by the logistic time function model; Zhao (2005) deduced the functional relationship between dynamic subsidence and time by using the principle of rheological mechanics, and estimated mechanical parameters based on the measured data; Based on the Knothe time function and Zero model, Yu et al. (2003) established a rheological model of overburden movement and deformation; Li et al. (2019) considered the influence of mechanical parameters of numerical simulation software during mining on the prediction results, and constructed a new method of predicting surface settlement. Many scholars have also developed other dynamic prediction methods of surface subsidence (Kowalski, 2001; Nie et al., 2015; Rošer et al., 2018; Xi et al., 2013). The above prediction models have basically been verified by engineering applications, and they are all suitable for general geological conditions. However, with special geological conditions such as thick unconsolidated layers, they could not guarantee the prediction accuracy of surface subsidence.
Based on the analysis of movement and deformation characteristics of surface monitoring points, an improved Knothe time function model will be proposed. Then a surface subsidence model suitable for mining conditions of thick unconsolidated layers will be given. On the basis, a new mining subsidence prediction model will be established, which aims to provide data support for formulation and implementation of prevention measures of surface damages.
Surface subsidence process in mining areas with thick unconsolidated layers
The process of surface subsidence under thick unconsolidated layers is basically consistent with that under general geological conditions. Considering great difference in lithology between unconsolidated layer and bedrock, the laws of surface movement and deformation are often different from those under general geological and mining conditions.
Surface movement can usually be divided into three stages according to velocity of the maximum subsidence: early, active and decline stage. The early stage starts when the subsidence amount reaches 10 mm, until the subsidence velocity is less than 1.67 mm/d. In the active stage with rapid subsidence, the subsidence velocity is greater than 1.67 mm/d. In the decline stage with stable subsidence, the subsidence velocity is less than 1.67 mm/d, and the accumulated subsidence is not more than 30 mm for 6 consecutive months. Figure 1 shows the change of surface subsidence with time in a mining area with thick unconsolidated layers. It can be seen that the early stage is very short or nonexistent with slow surface deformation. The decline stage was much longer than that of the active stage. The subsidence amount in the active stage accounted for more than 90% of the total subsidence, indicating that the subsidence was more severe in the active stage and the subsidence curve convergence was slower. Moreover, under the condition of thick unconsolidated layers, the subsidence of the center of the surface movement basin was severe, while the boundary converges slowly. After the surface subsidence stopped, the surface damage scope became larger (Ma et al., 2017). Figure 2 shows the fitting results by the probability integral method (PIM).
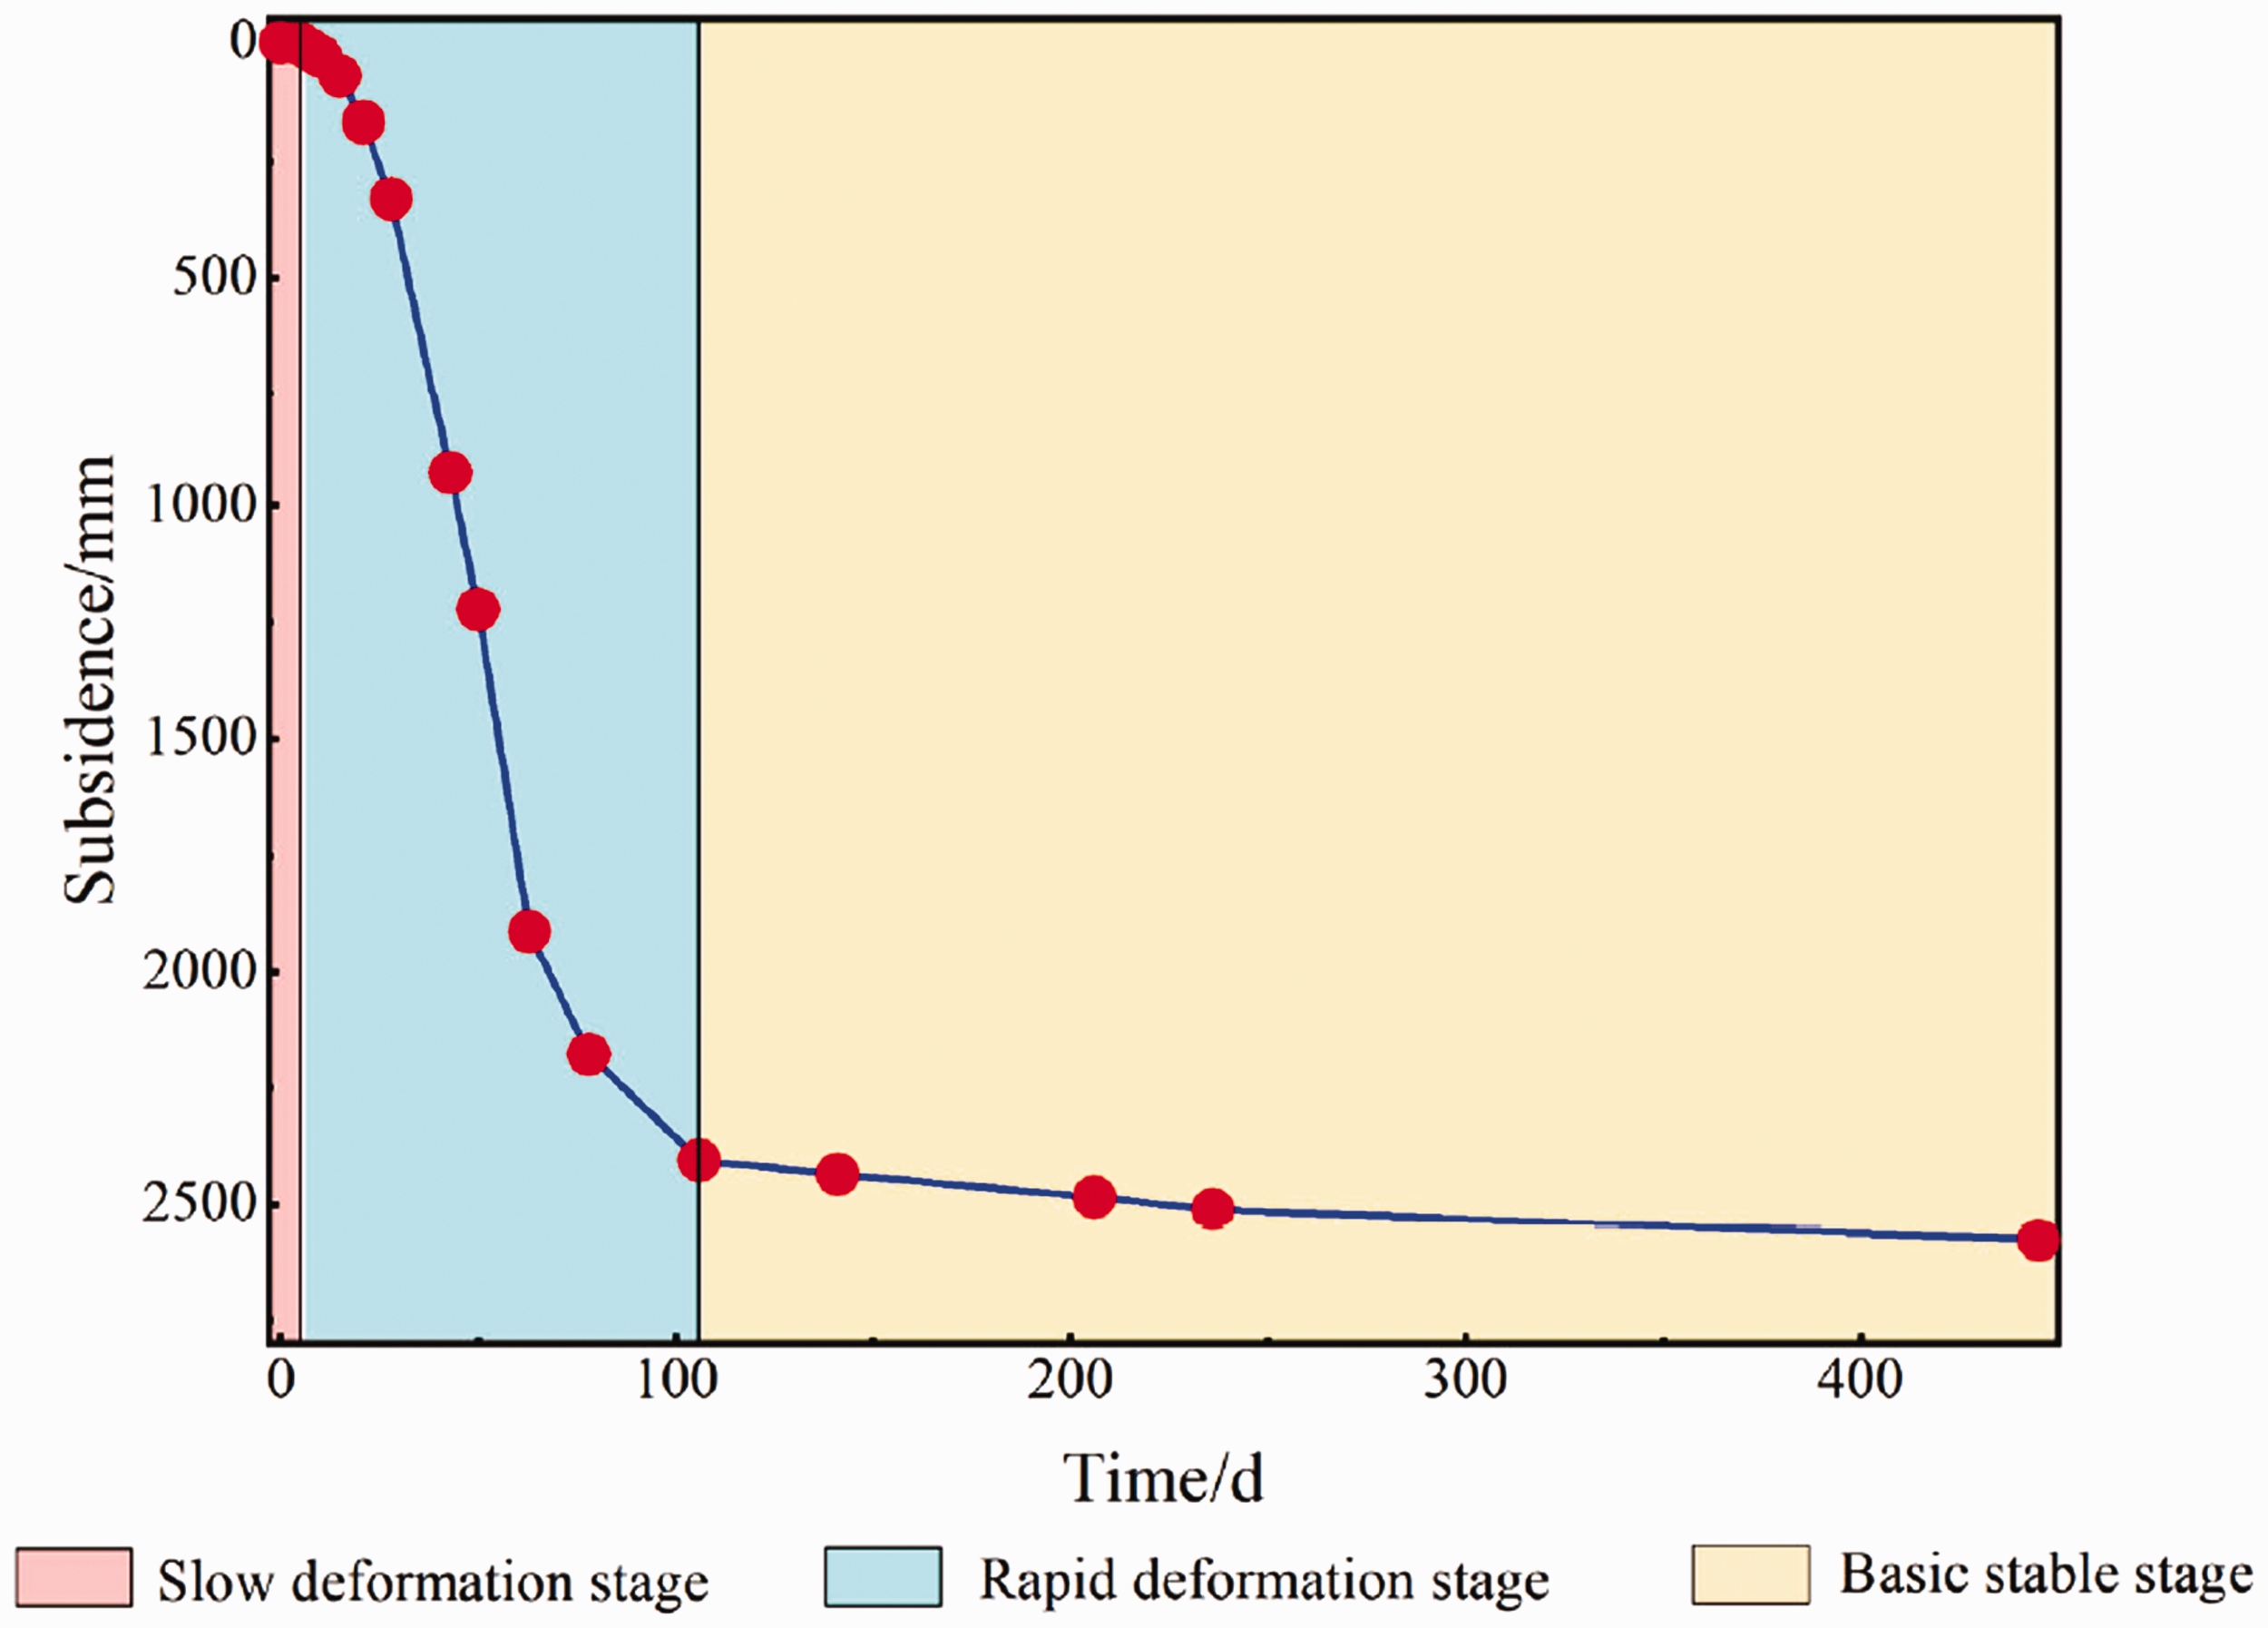
Variation of surface subsidence with time.
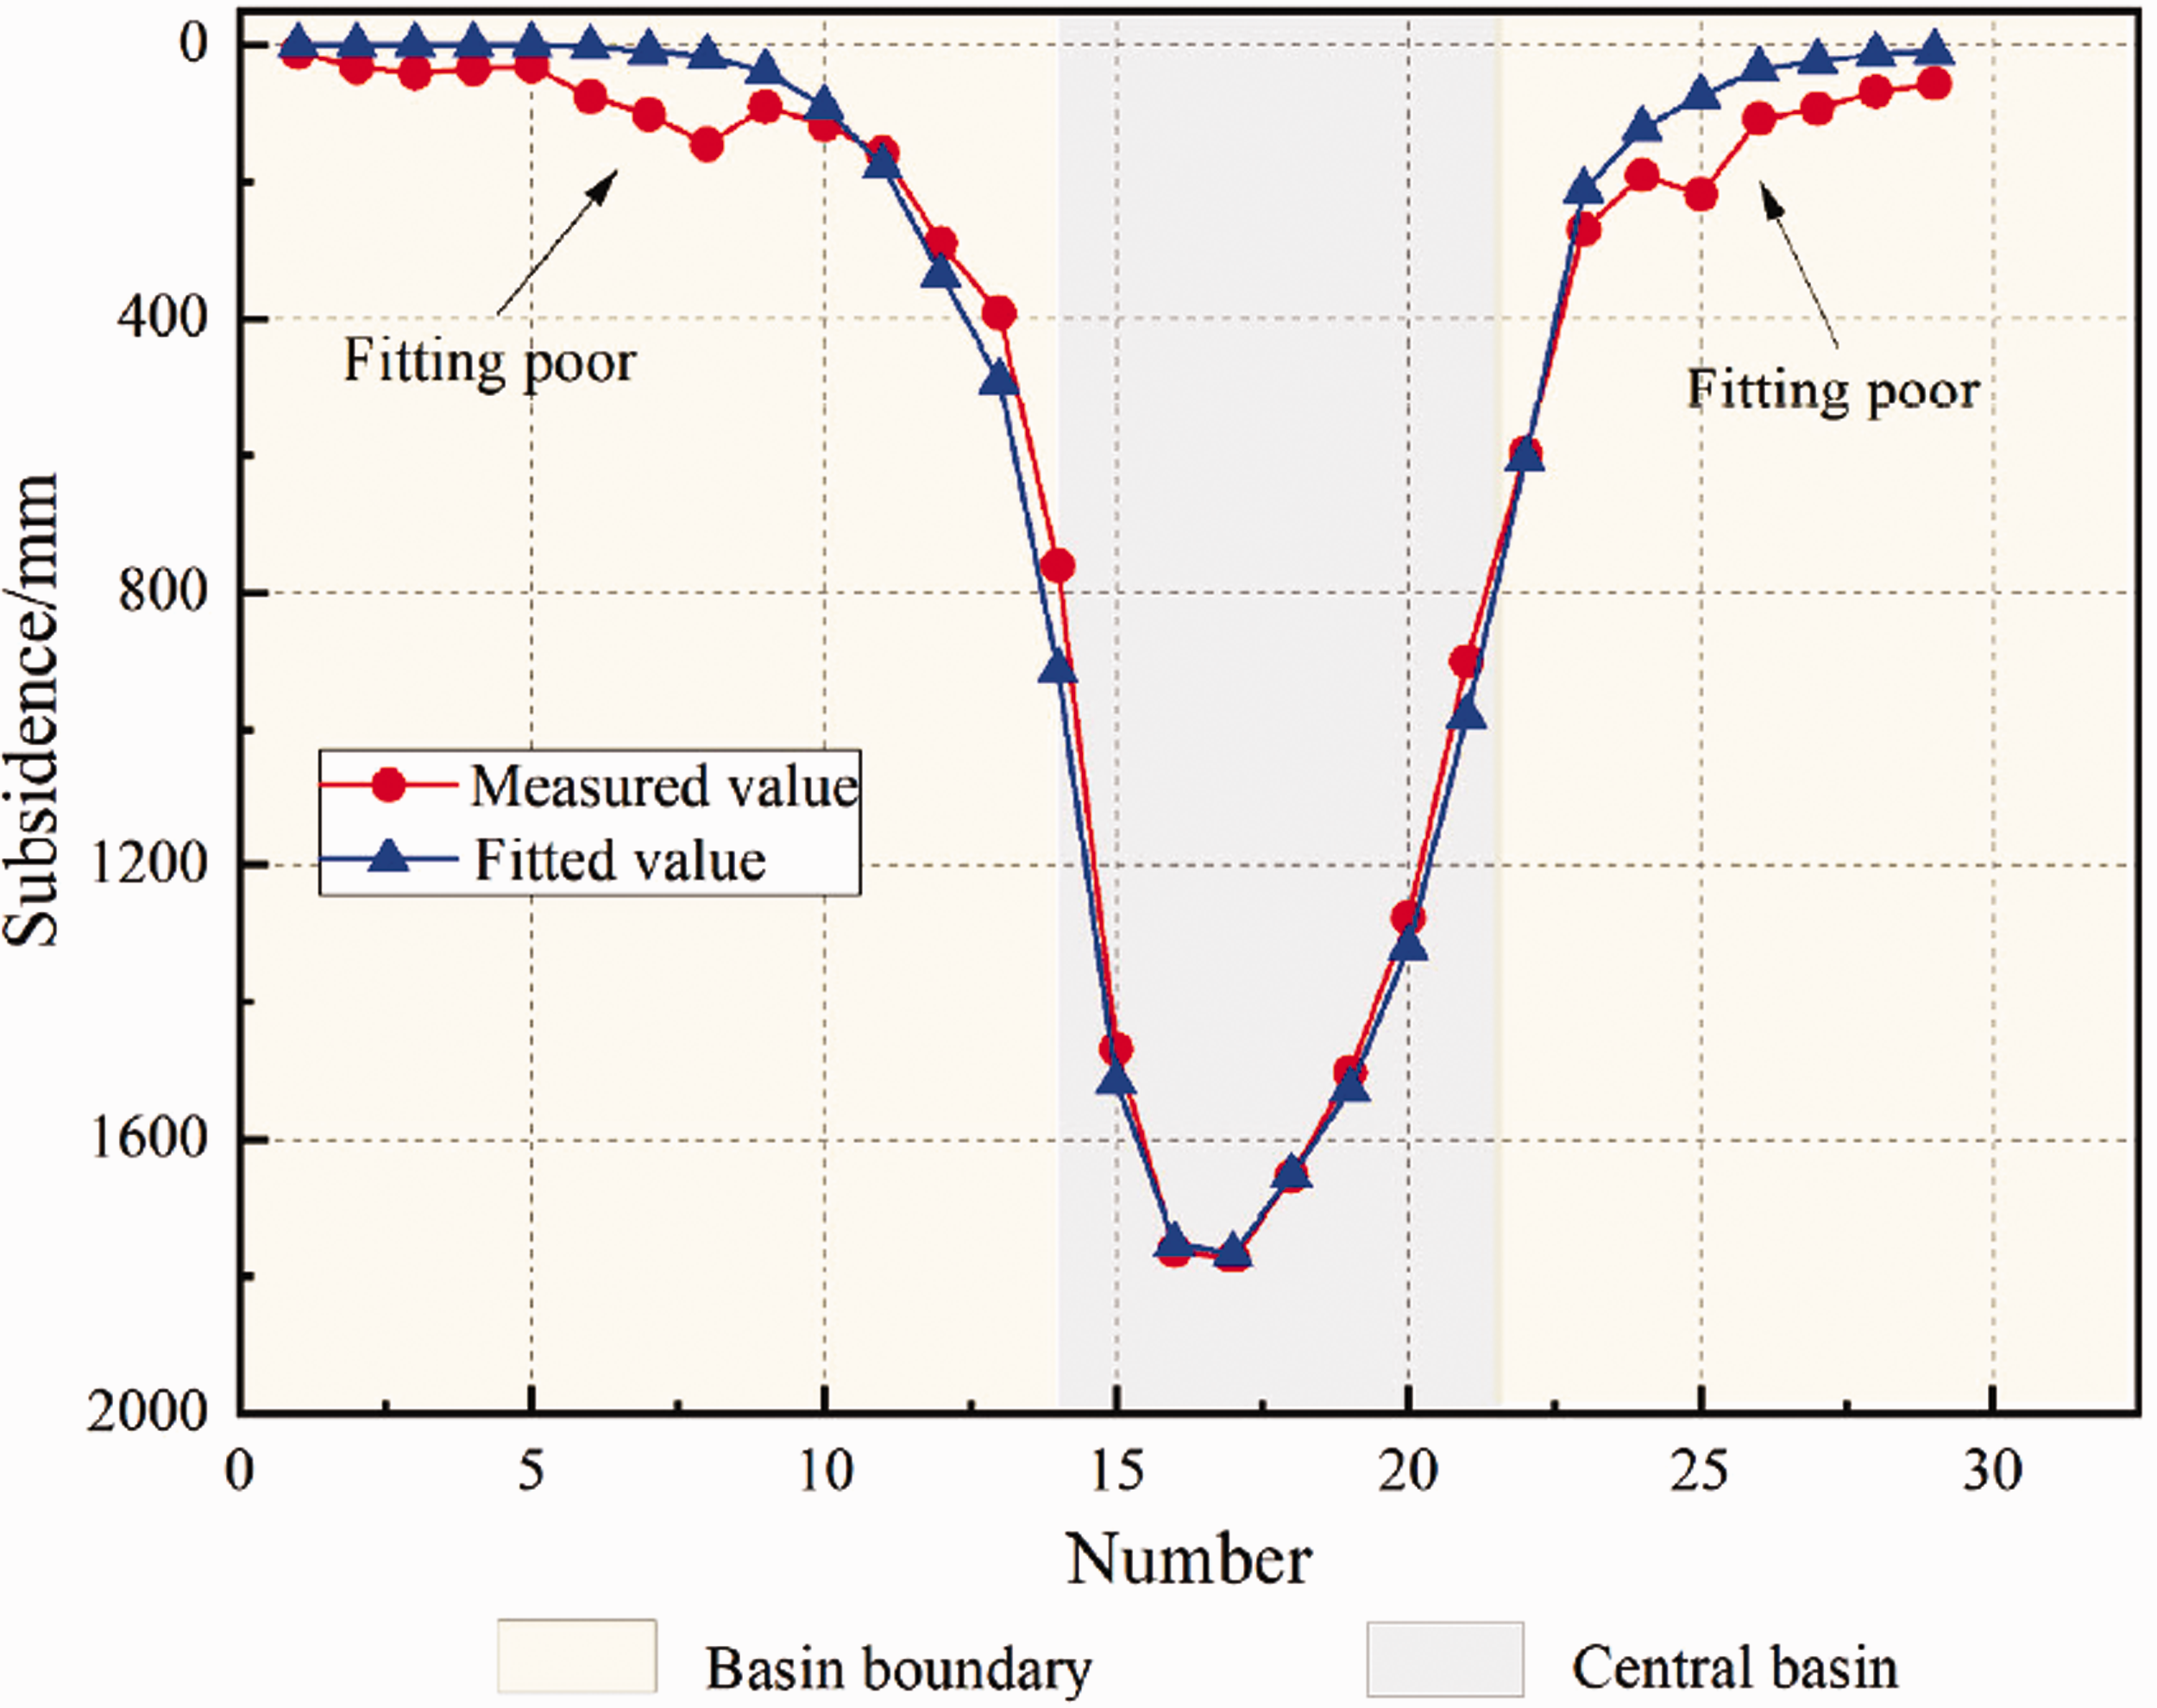
Comparison between the fitted value and the measured value of PIM-based prediction model.
The curve edge convergence was slow and PIM was poor in fitting the edge part. This was mainly caused by the surface subsidence due to water loss of thick unconsolidated layers. However, the existing models can’t properly solve the problem (Zhou et al., 2018).
Construction of an improved Knothe time function model
An improved Knothe time function model
In 1952, a Polish scholar Knothe proposed the time function model of surface subsidence. Its function model is as follows:

Where t is the surface subsidence time; w(t) is the subsidence amount of a surface point at time t; wmax is the maximum surface subsidence; c is the time coefficient, related with mechanical properties of the overlying strata.
Liu obtained the first and second derivatives of equation (1) respectively to obtain the surface subsidence velocity and acceleration (Liu, 2010). The change process of subsidence acceleration indicated that the acceleration at the beginning of the surface movement was the maximum negative. It was shown that the subsidence process described by the Knothe time function gradually decreased, which was inconsistent with the dynamic evolution law of surface mining subsidence and movement. The mining-induced surface movement is a complex nonlinear process, and the Knothe function model of surface strata movement is consistent with Kelvin model of creep characteristics (Chen et al., 2017). Therefore, the time function c can be expressed as a power exponent, namely,

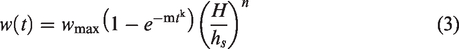
According to deformation characteristics of surface monitoring points under the condition of thick unconsolidated layers, the water loss of unconsolidated layers will lead to additional surface subsidence whose size is related to the thickness of the unconsolidated layers. The surface subsidence is also affected by the thickness of the bedrock. Therefore, it is proposed to multiply a new coefficient (H/hs) n on the basis of formula (2), where H is the mining depth of the coal seam, hs is the thickness of the unconsolidated layer, n is a dimensionless parameter, and H/hs is always greater than one. When H is fixed, the larger the hs, the greater the additional subsidence amount will be. Therefore, the variation degree of the curve can be obtained by adjusting (H/hs)n.
Then the improved time function model can be expressed as follows:
Verification of the model
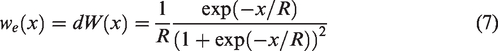
By equation (3), the first and second derivatives of time t were calculated, respectively. Then subsidence velocity and acceleration can be obtained:
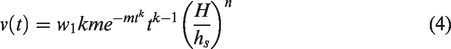

The curves of formulas (3) to (5) were plotted, respectively, as shown in Figures 3 to 5.
It can be seen from Figure 3 that when t = 0, w(0)=0; when t→+∞, w(+∞) = wmax. This showed that the improved model passed through the origin, and there was a maximum subsidence value. It can be seen from Figure 4 that the subsidence velocity was greater than zero, It increased first and then decreased with time. Let a(t) = 0, the following formula could be obtained:
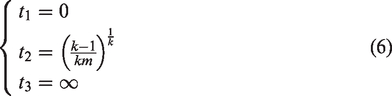
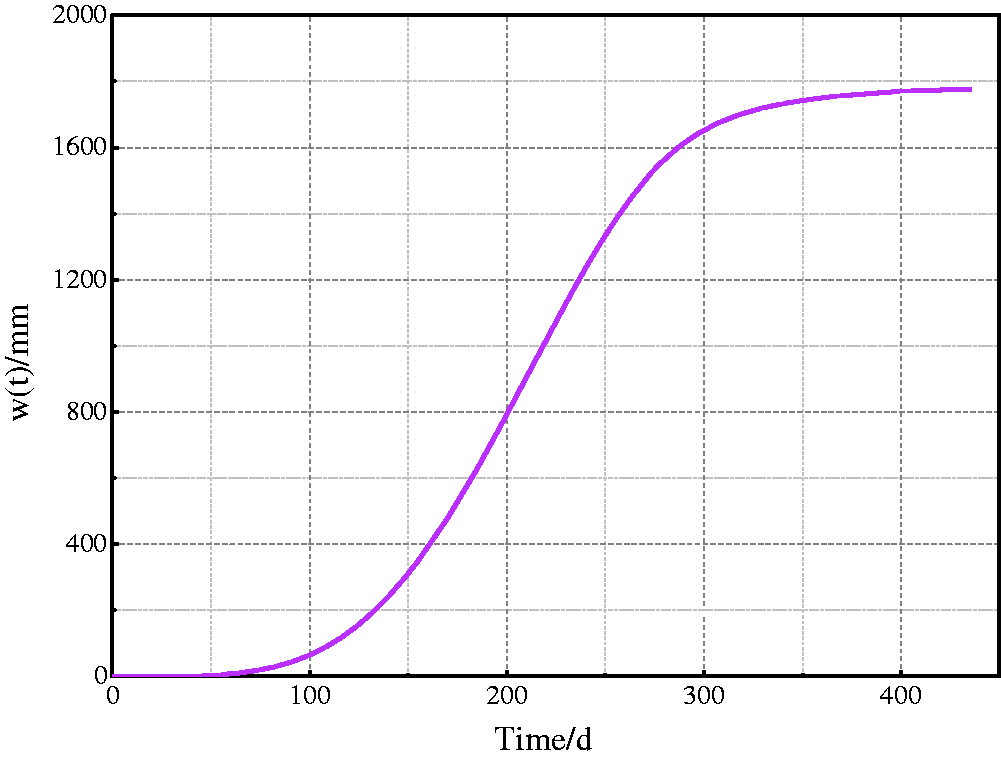
Single point subsidence curve.
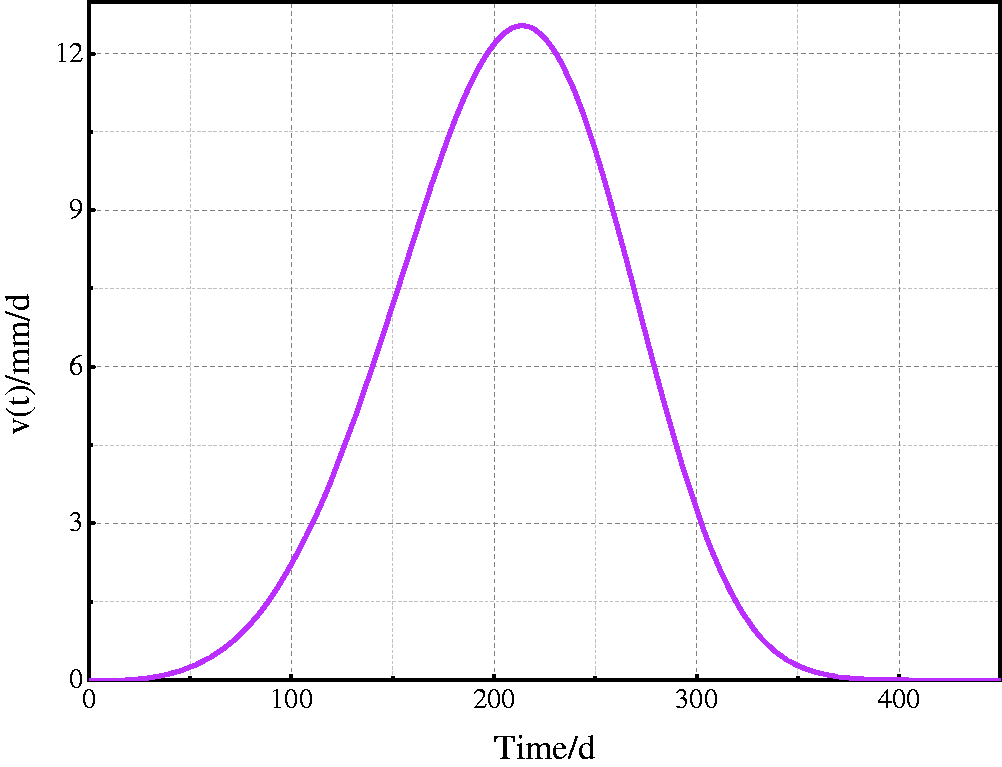
Single point subsidence velocity curve.
In the phase of t1→t2, the subsidence acceleration firstly increased and then decreased, and reached the maximum at t2; in the t2→t3 phase, it was less than zero, and the subsidence velocity gradually decreased to zero. The comparisons among Figures 3 to 5 and the ideal time function curve (Cui et al., 1999) indicated that the subsidence curve, velocity curve and acceleration curve made by the improved Knothe function model basically conformed to the mining-induced surface subsidence process.
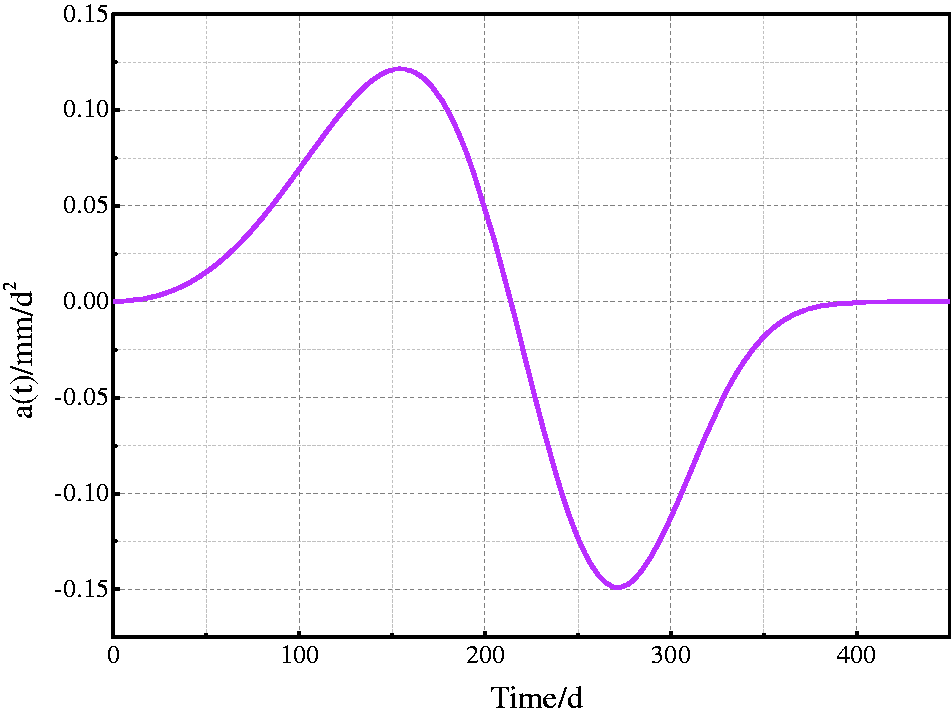
Single point subsidence acceleration curve.
By changing parameters of the dynamic model, the changes of subsidence amount were observed. As shown in Figure 6, m and k had no effect on the initial and final amount of surface subsidence, and only affected the time of reaching the final subsidence. The larger m and k, the shorter the time required to reach stability. n and H/hs didn’t influence the initial surface subsidence, and only affected the size of the maximum value, and had no effect on the time required for the ground to reach stability. As the value of n increased, the value of surface subsidence gradually increased. As H/hs increased, the maximum subsidence value gradually decreased. This was mainly because as the thickness of the unconsolidated layer decreased, the additional subsidence became smaller.
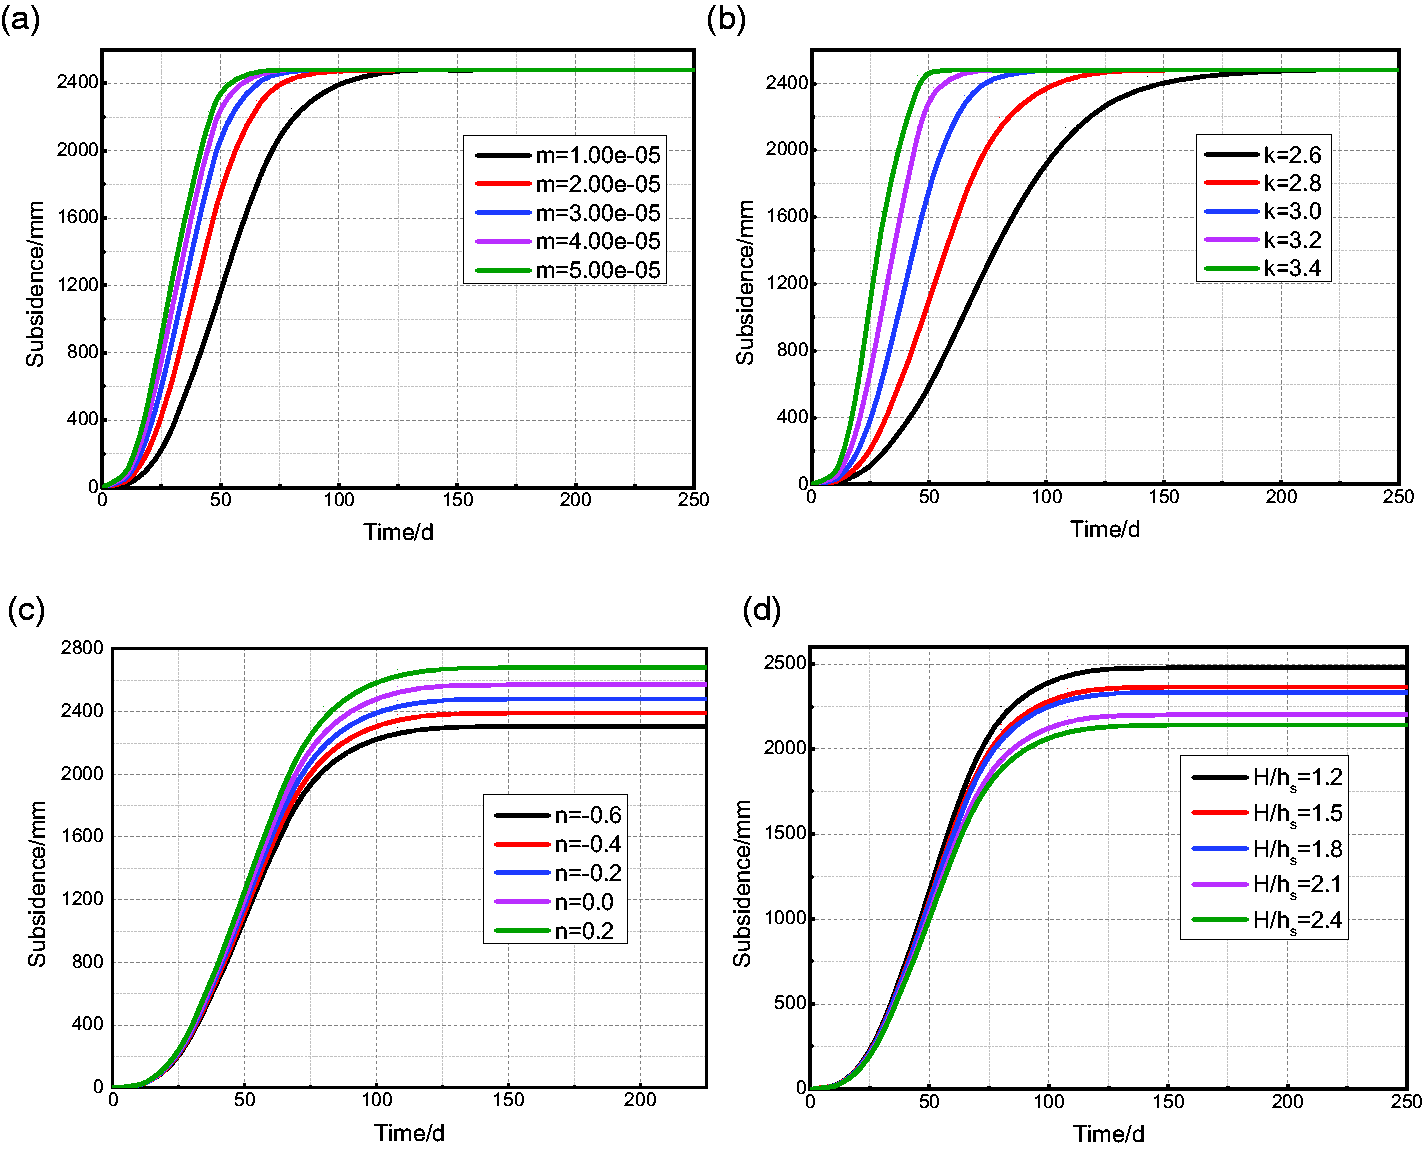
Surface subsidence curves with different parameters.
Prediction model of surface subsidence under thick unconsolidated layers
PIM has poor adaptability in mining areas with thick unconsolidated layers. Even with relatively accurate parameters, the subsidence amount obtained by the PIM-based model still has too fast boundary convergence (as shown in Figure 2). In practical applications, although the Boltzmann function model could solve the problem to a certain extent, the fitting accuracy in the entire basin is smaller than that of PIM-based model in some mining areas. On the basis, an improved Boltzmann function model was developed in this paper.
The paramete influence function of Boltzmann function is (Wang et al., 2012)
Where x is the horizontal distance from the point to the origin of the coordinate, and R is the important radius of influence.
In this paper, the subsidence basin was a combination of two subsidence basins with different parameters R in a certain proportion. Then the prediction formulas of surface movement and deformation were established according to the superposition method, as shown in equation (8):

Where P is the proportionality coefficient, and R1 and R2 are two different important influence radii.
Then the subsidence value caused by semi-infinite mining is as follows:
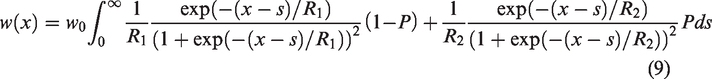
Where w0 is the maximum subsidence value in the subsidence basin, w0=mqcosα, m is the thickness of the coal seam, q is the subsidence coefficient, α is the seam dip angle, and s is the horizontal distance from the surface point to the starting point.
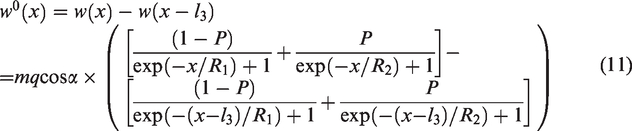
After simplification:

As shown in Figure 7, according to the superposition principle, the subsidence prediction formula of the main section along the strike of the surface moving basin can be obtained as follows:
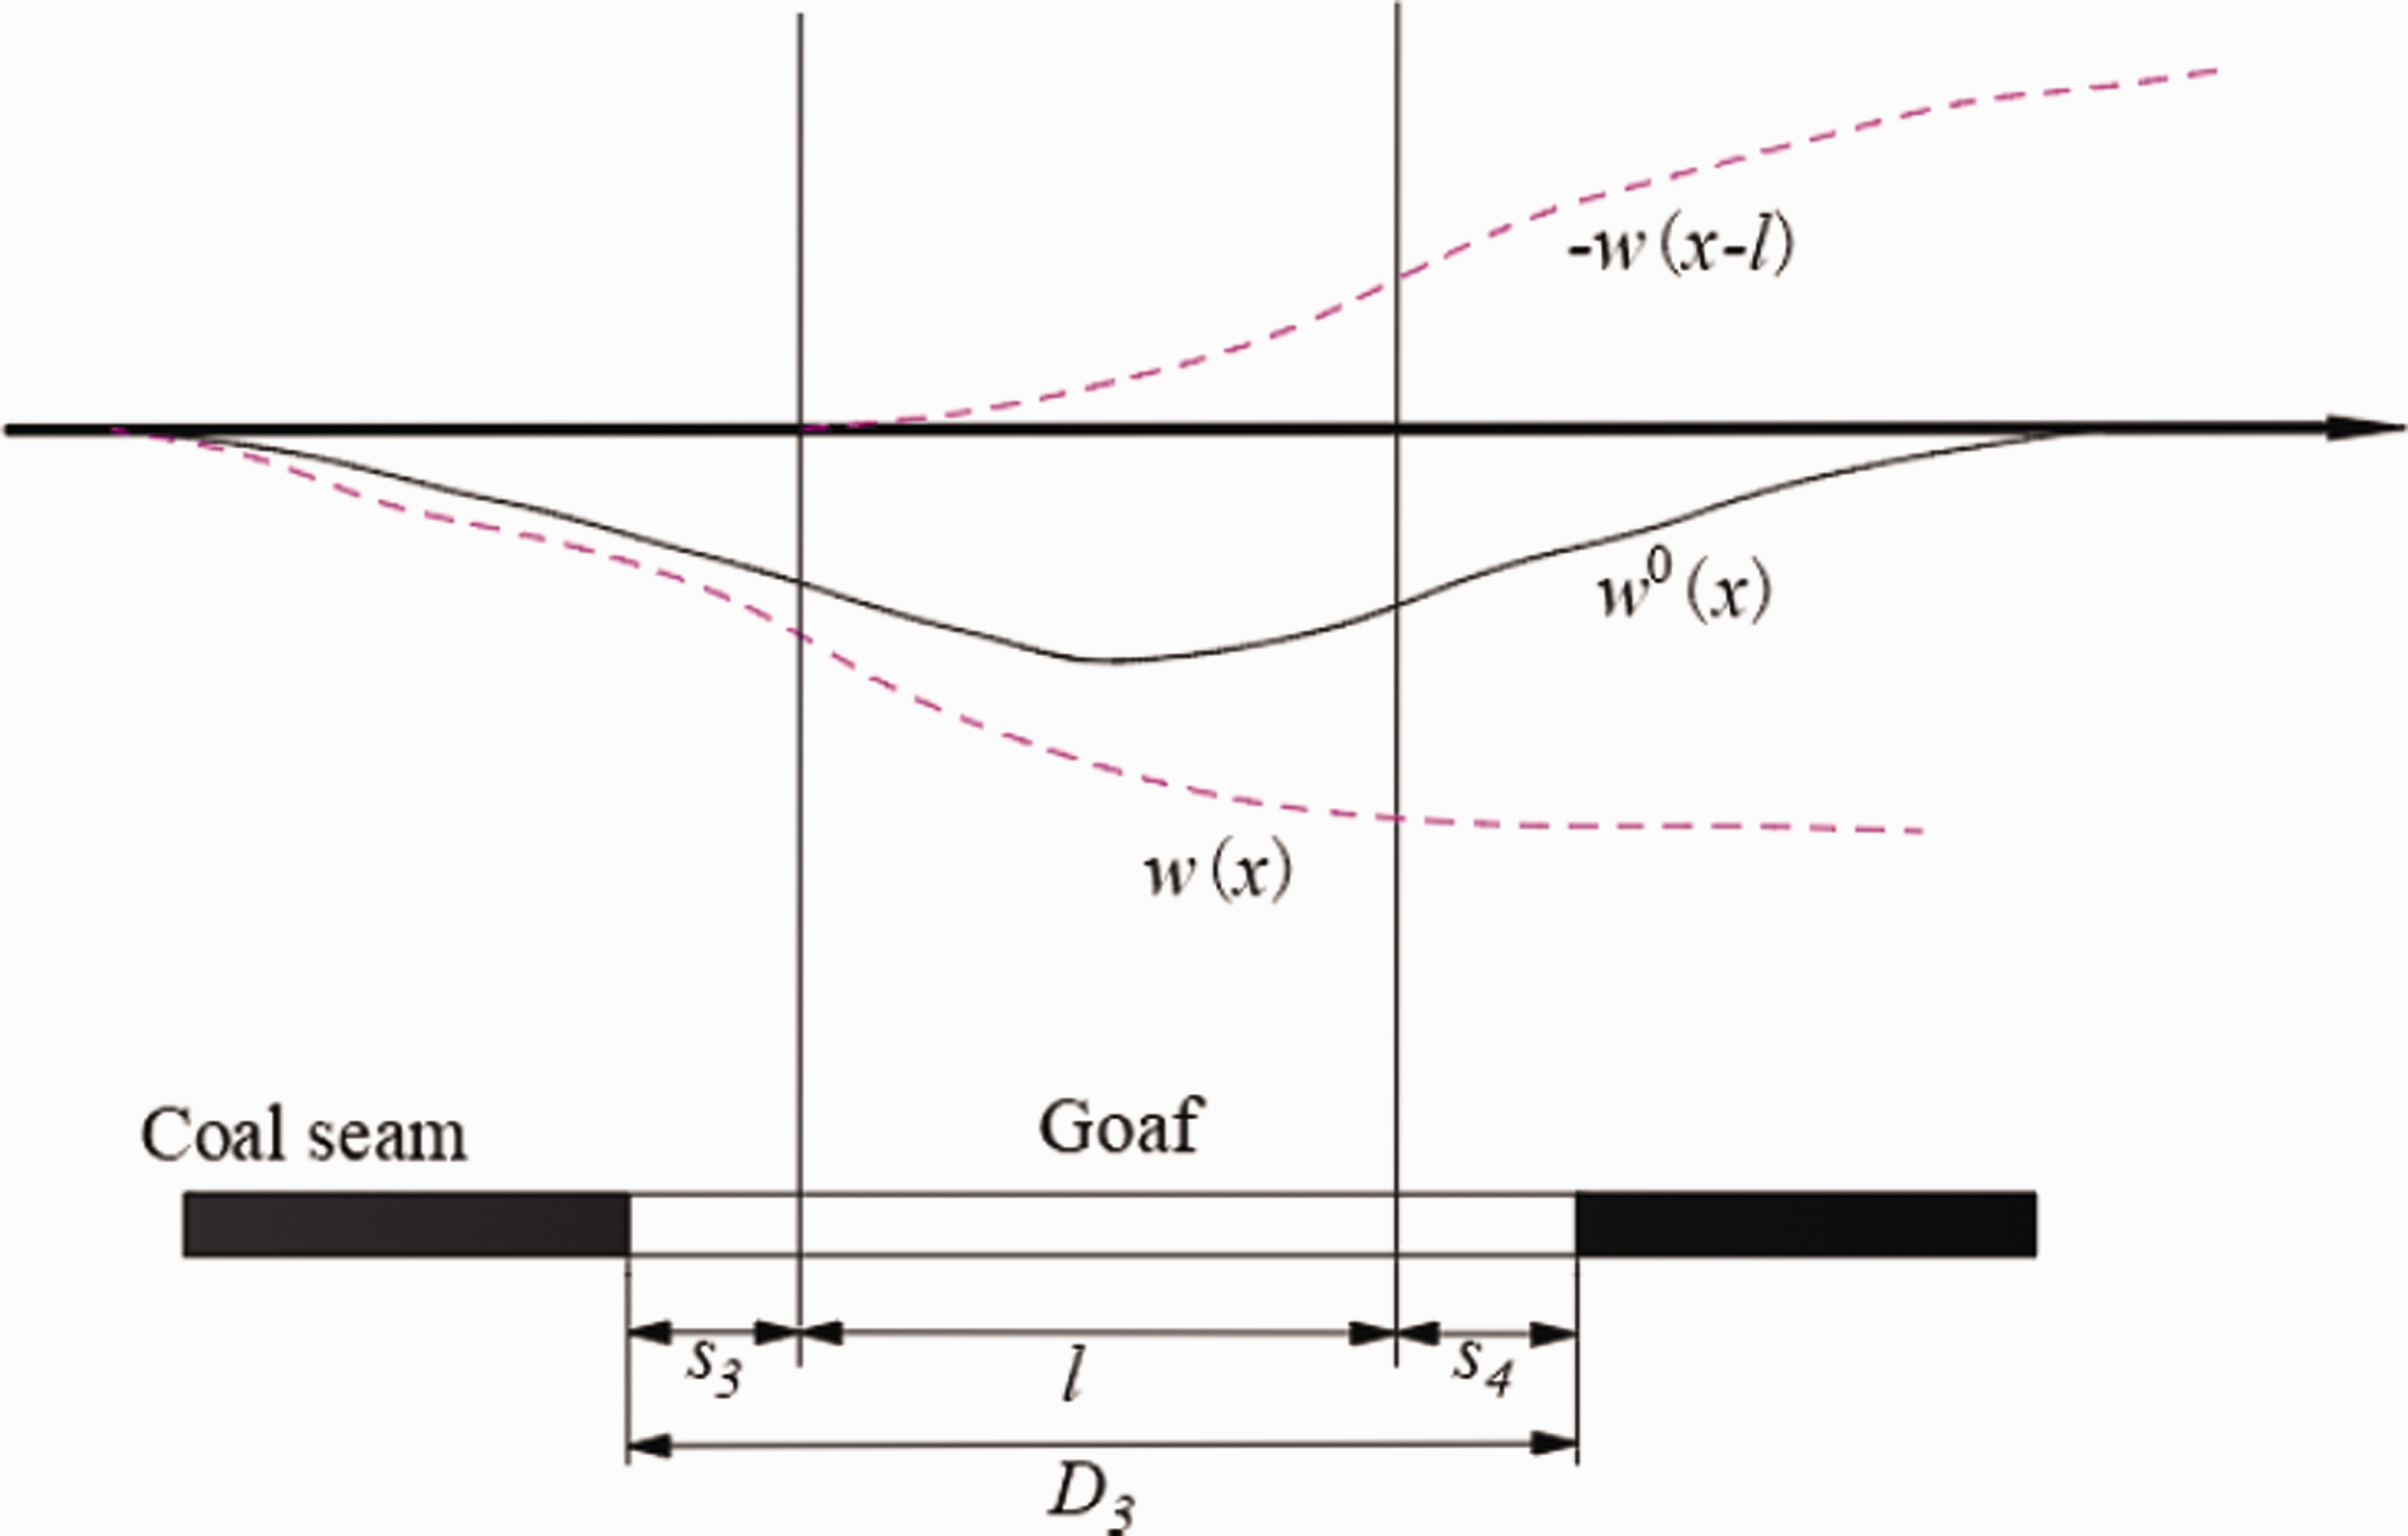
Movement and deformation calculation principle of main section along the strike.
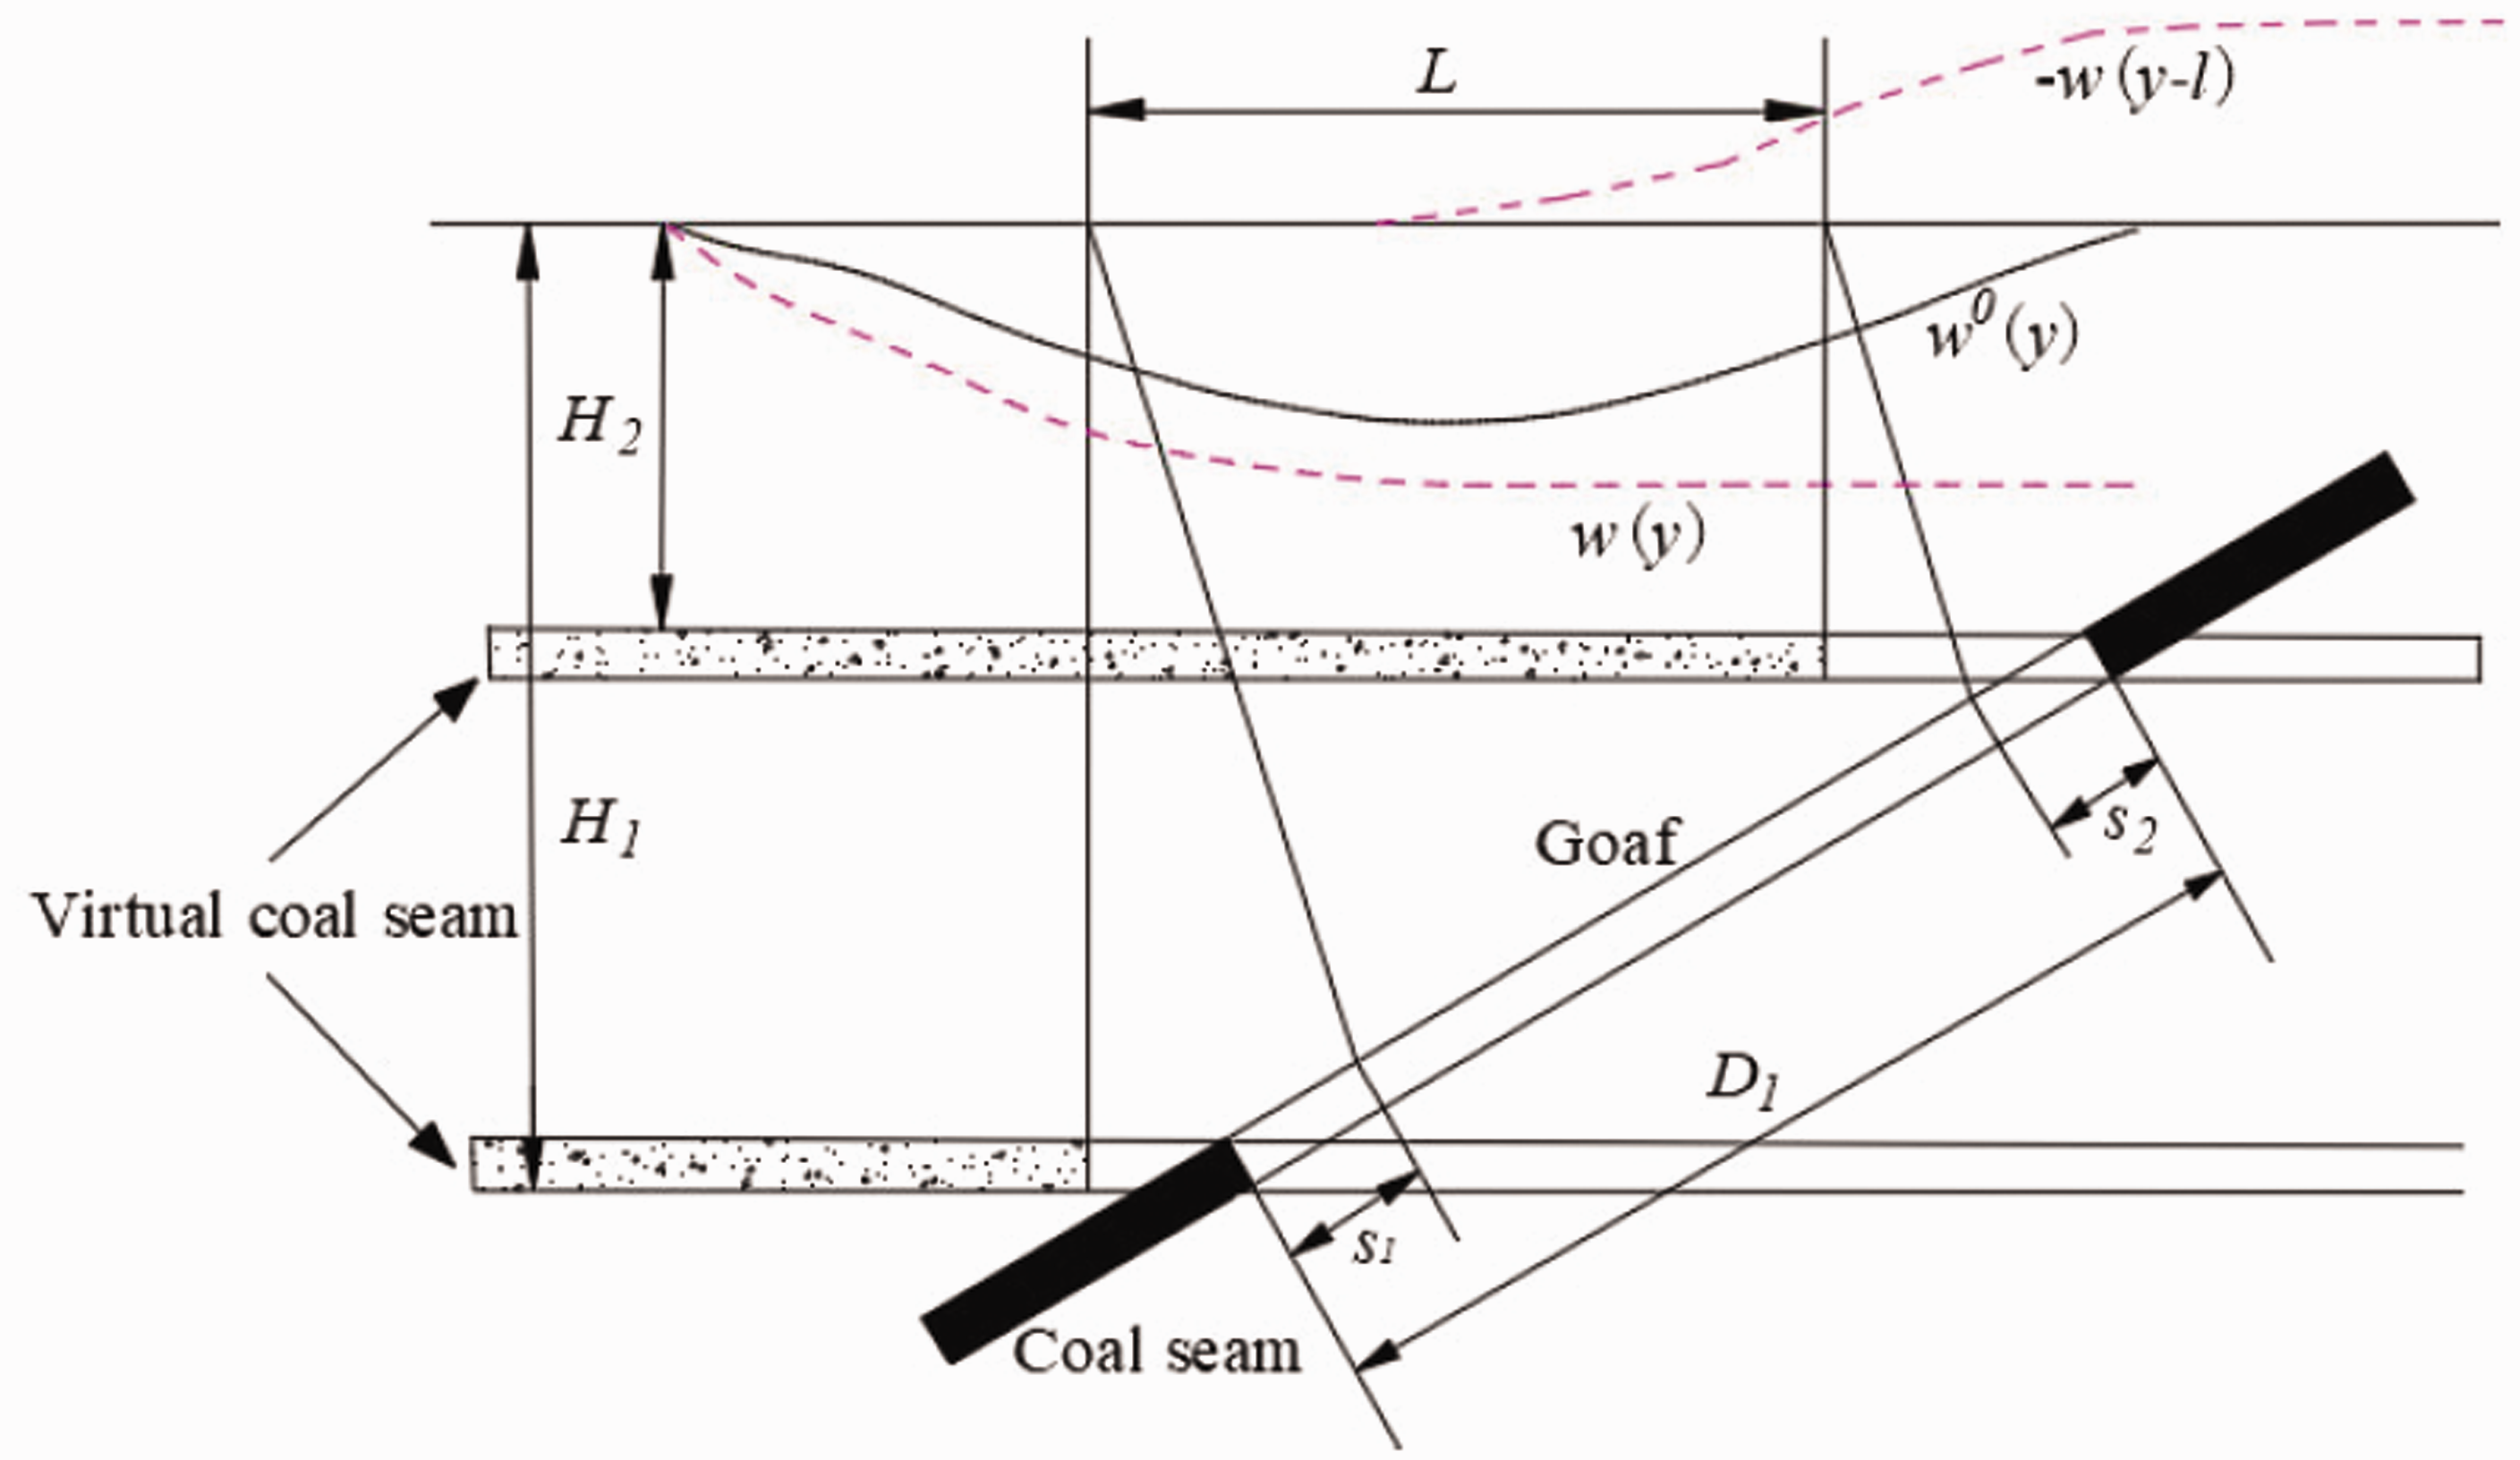
Movement and deformation calculation principle of main section along the inclination.
Where l3 is the calculated length of the finite mining along the strike, l3=D3−s3−s4.
Similarly, the prediction formula of subsidence on the main section along the inclination can be obtained (the principle is shown in Figure 8), as follows:
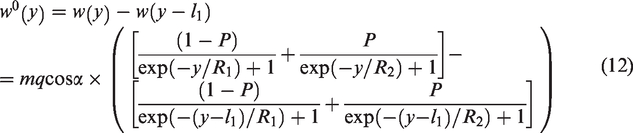
Where l1 is the calculated length along the inclination,
In Figure 9, the coal seam was assumed to be a horizontal coal seam. The horizontal projections of tO1s and xOy coincided. If unit B (s, t) with a width of ds and a length of dt is mined at s, the subsidence value of any point A (x, y) on the surface is as follows:
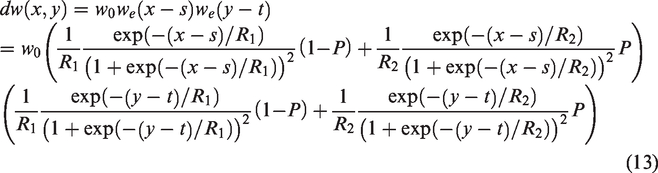
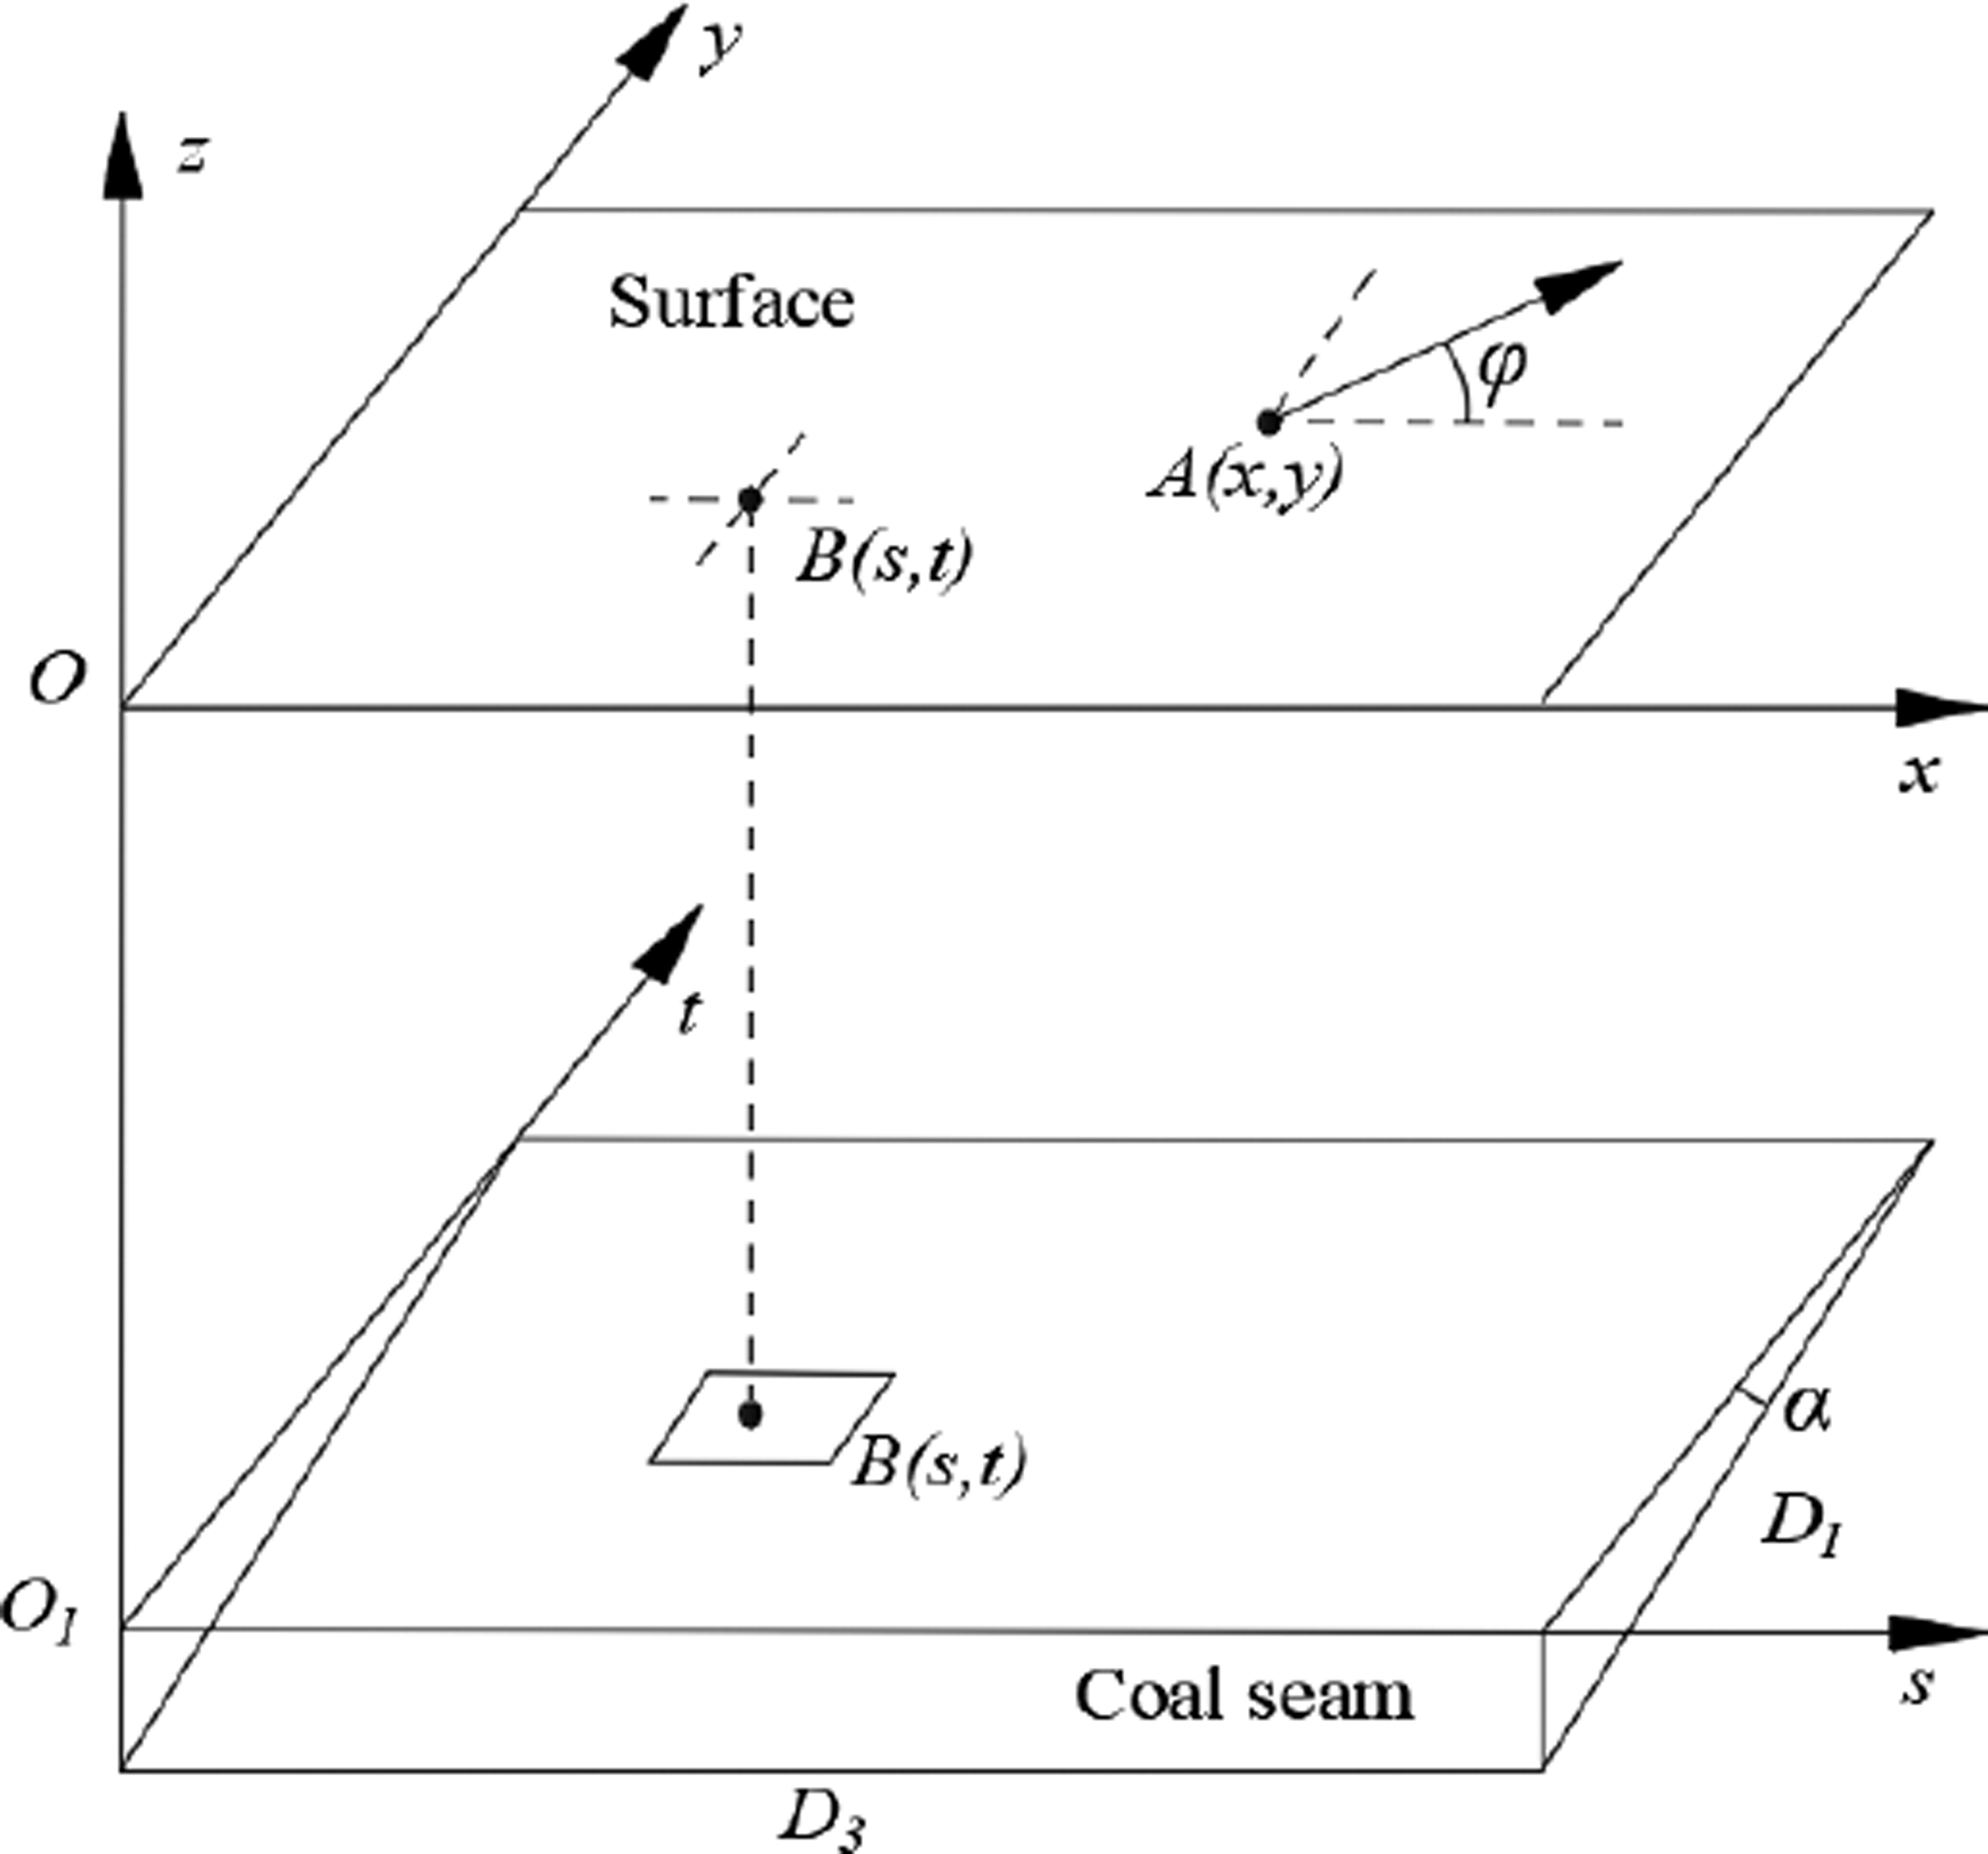
Schematic diagram of arbitrary point calculation.
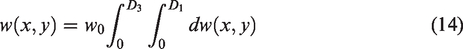
In Figure 9, if the strike length of the mining area is D3 and the inclined length is D1, the mining-induced surface subsidence value of any point A(x, y) can be expressed as follows:

According to the derivation of the above deformation prediction formulas and the coal seam dip angle α, equation (15) can be transformed into:

There are nine parameters in the new model: q, P, θ0, s1, s2, s3, s4, R1, R2. According to the above derivation, the relationship between the predicted subsidence at any point on the surface and the predicted parameters of the subsidence basin can be described as follows:

Where
Assuming that the measured subsidence at any point i is wsi, the estimated subsidence error at this point is:

According to the minimum criterion of the sum of squared errors, the constructed criterion for seeking parameters is:
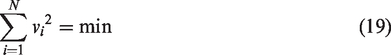
Where N is the number of measuring points.
Then, the genetic algorithm (Aggestam and Nielsen, 2019; Yarmohammadi et al., 2019) was used to obtain prediction parameters of the model.
Establishment of dynamic prediction model and calculation of parameters
Construction of dynamic prediction model
In this paper, the improved Knothe time function model and the improved Boltzmann time function model were combined. Then, the subsidence
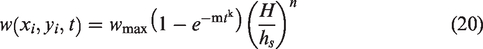
Where
Parameter acquisition
The final subsidence amount
of the points
Within the influence range of mining subsidence of the working face, the final subsidence amount of any point can be calculated by the improved Boltzmann function prediction model. If the subsidence is not stable, the relevant parameters of the improved Boltzmann function prediction model can be given according to the existing fitting parameters of adjacent or close working faces.
Values of m, k and n
In the improved Knothe time function, m, k and n are related to geological conditions of the working face. They can be obtained by optimization methods (genetic algorithm, particle swarm optimization and etc.), and the fitness function is given, as follows:

Where
In the process of case study, it is found that these three parameters are not fixed and are constantly changing. Therefore, they can be fitted according to the measured data to predict the deformation during the next period.
Engineering application
Overview of the study area
This paper took the main section along the inclination of 1414(1) working face of Guqiao Mine in Huainan mining area as an example to establish a dynamic mining subsidence model. The mining of 1414(1) working face started on December 14, 2013, and stopped on November 22, 2014. The fully mechanized mining method was adopted, and all roof caving method was used for roof management. Table 1 shows relevant geological and mining conditions of the working face, and V is the average advance speed.
Geological and mining conditions of 1414 (1) working face.

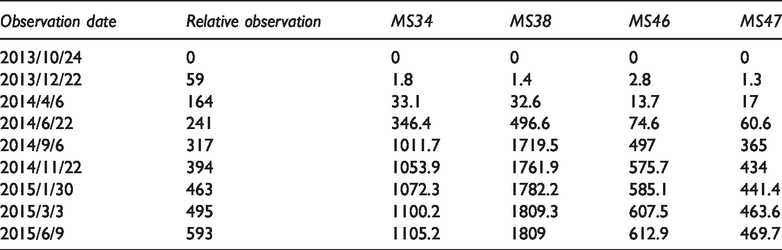
The layout of monitoring points above 1414 (1) working face is shown in Figure 10. The average interval is 30 m. Many points have been damaged or flooded due to complex environment. In this paper, 4 monitoring points (MS34, MS38, MS46 and MS47) were randomly selected to verify the reliability of the established model. The measured subsidence values are shown in Table 2.
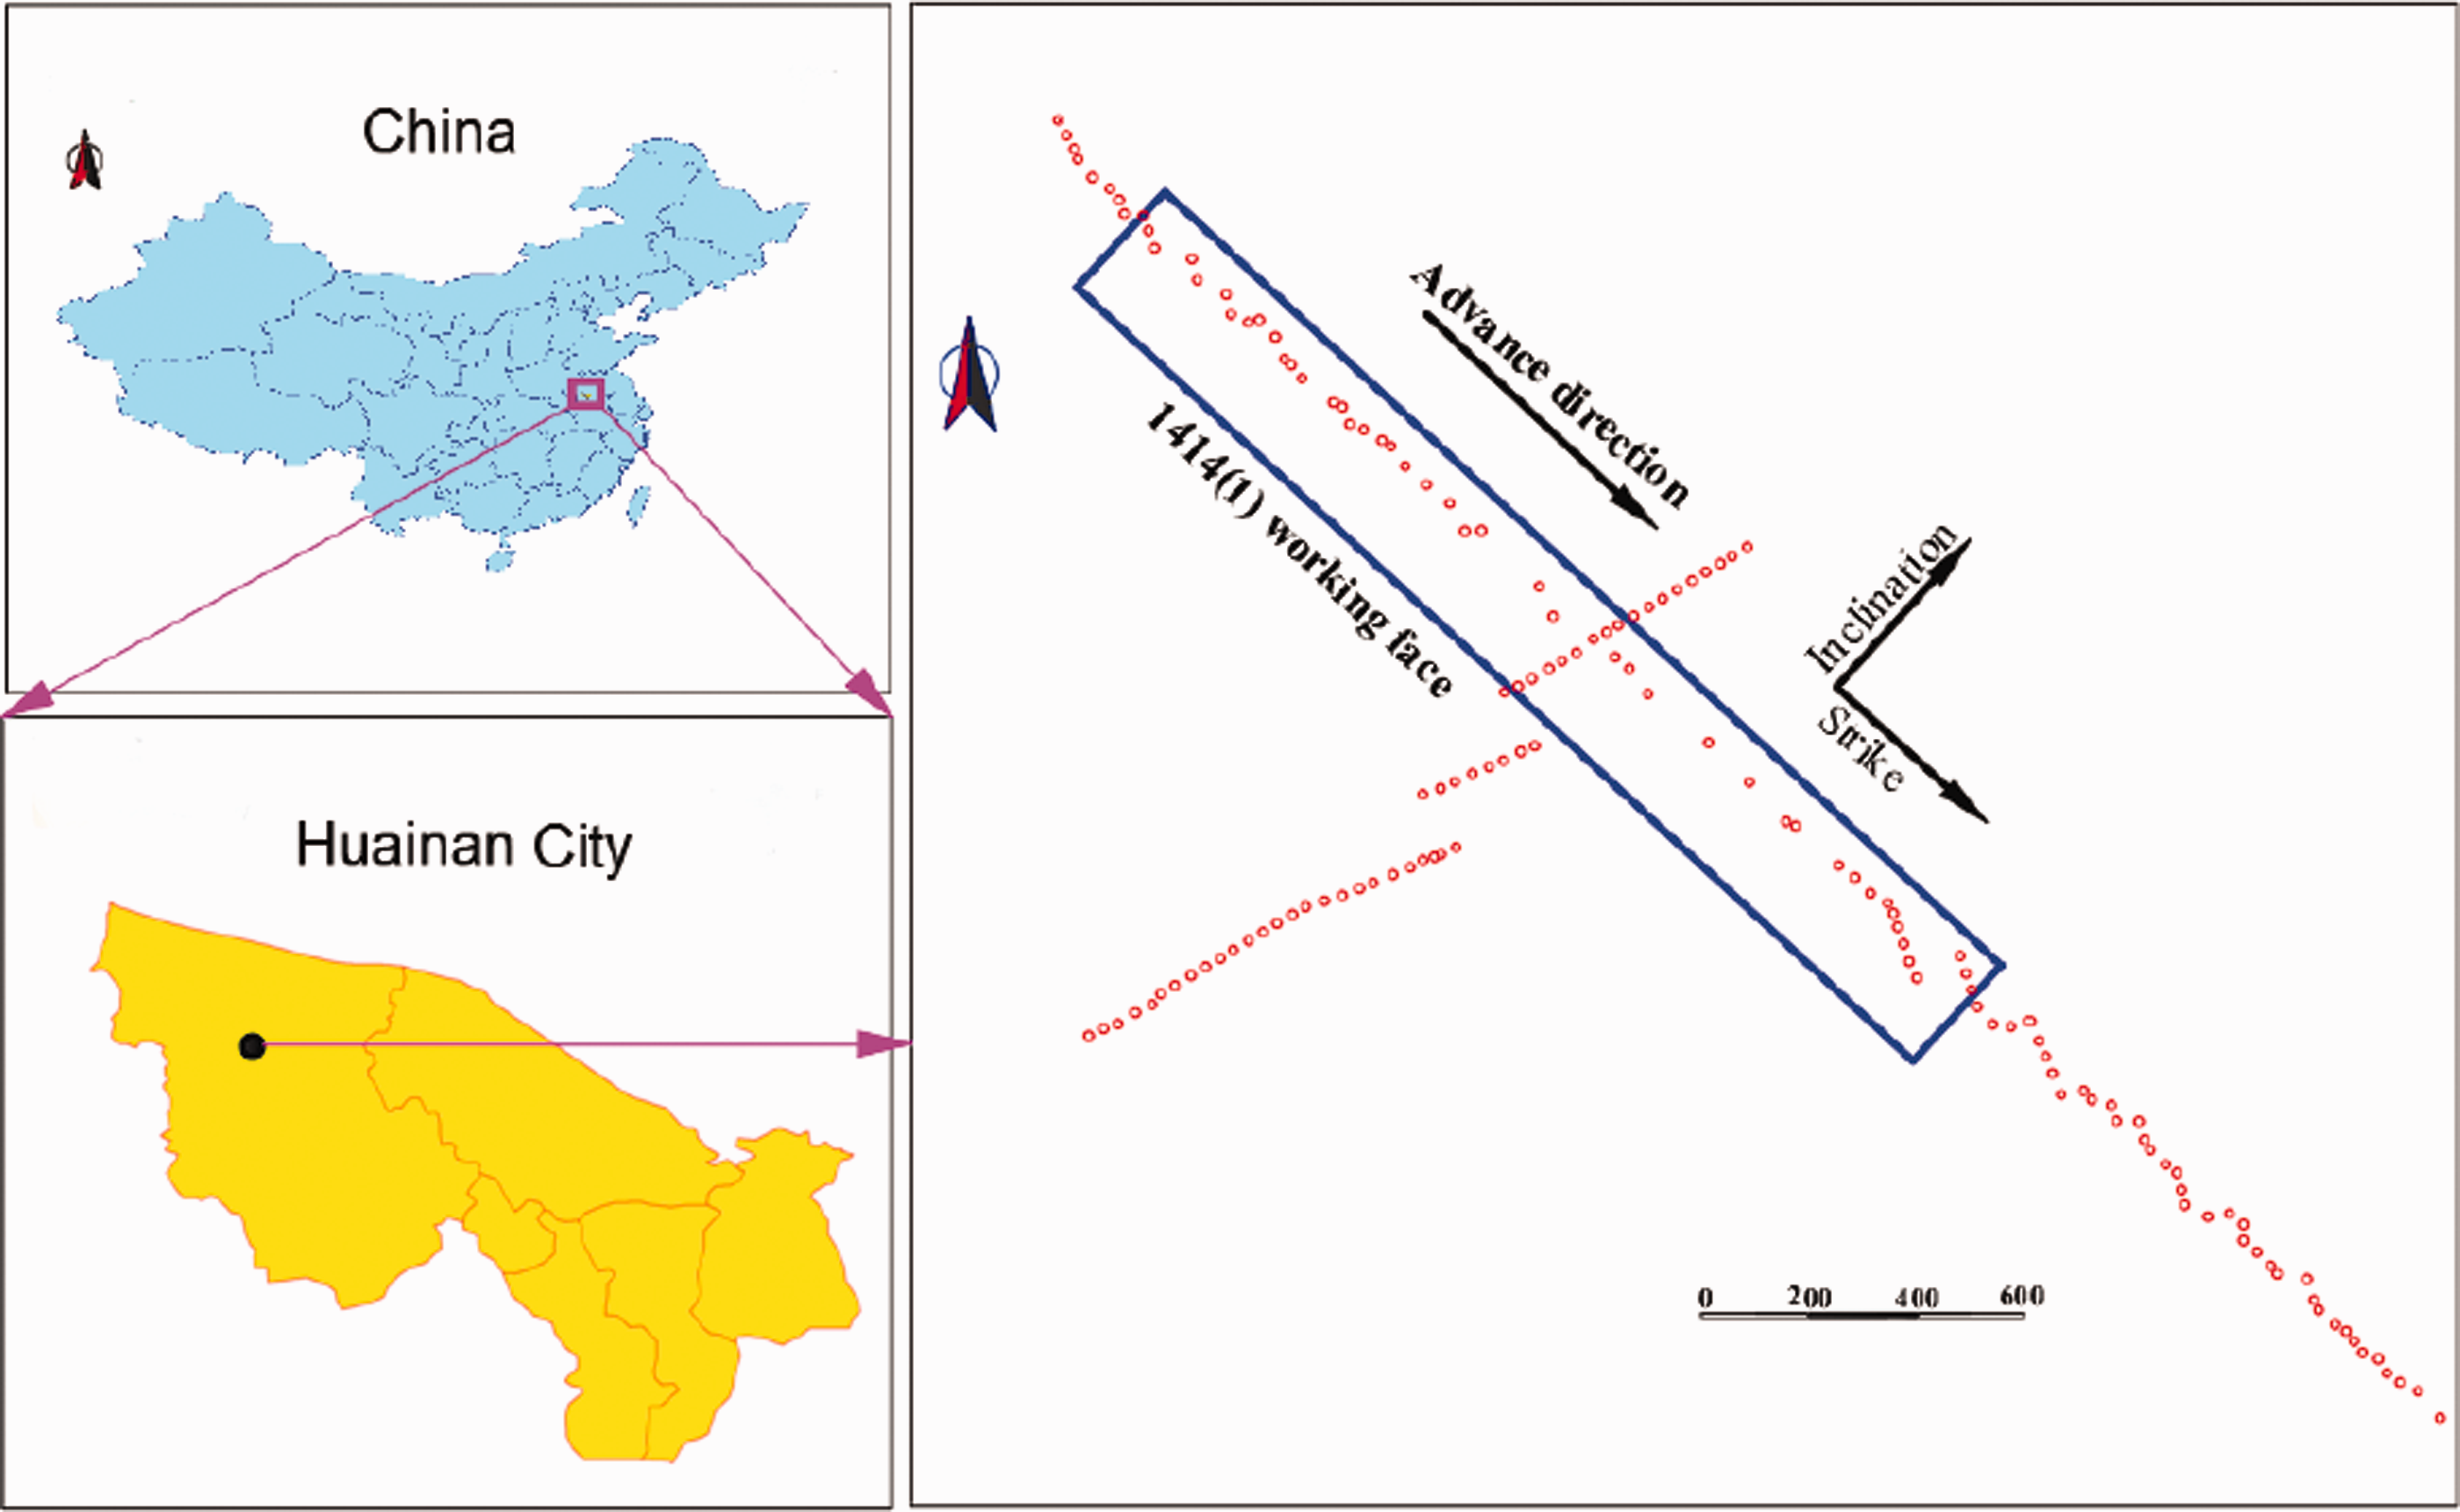
Location and layout of 1414 working face.
Surface subsidence monitoring data of MS34, MS38, MS46 and MS47.
Prediction results analysis
Firstly, it is necessary to calculate the maximum subsidence value
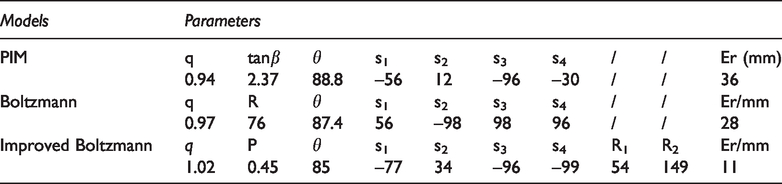
Fitting parameters of the working face.
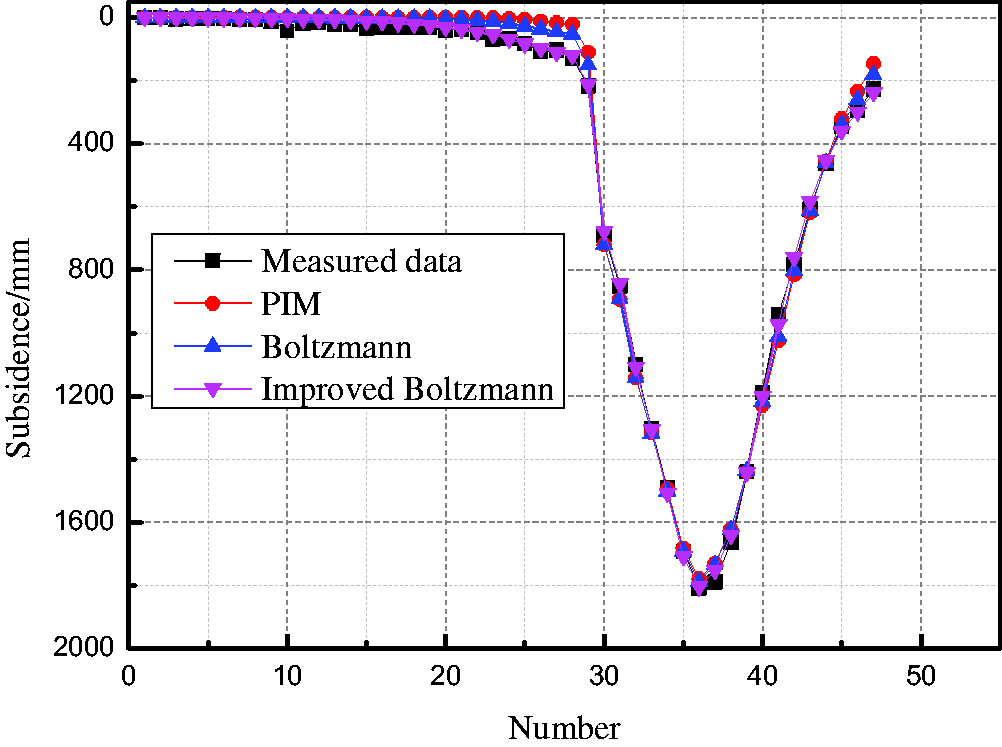
Comparison of fitting data and measured data of 1414 (1) working face.
Table 3 indicated that q and θ changed slightly, and other parameters changed greatly. The fitting accuracy of the improved Boltzmann prediction model was the highest with the mean square error of 11 mm, followed by the Boltzmann prediction model with the mean square error of 28 mm, and the PIM model with the worst fitting accuracy with the mean square error of fitting of 36 mm. The overall fitting accuracy of the improved Boltzmann function model was higher, and the subsidence values at the boundary were in good agreement.
The dynamic parameters of the working face were obtained according to the method in Section Parameter acquisition. The fitting parameters and errors are shown in Table 4. The comparison between the fitting values and the measured values is shown in Figure 12. In Table 4, Er1 and Er2 represent the fitting mean square error of the improved Knothe function and the Knothe function, respectively.
Dynamic prediction parameters and fitting mean square errors of four points.
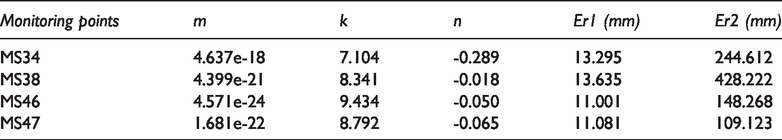
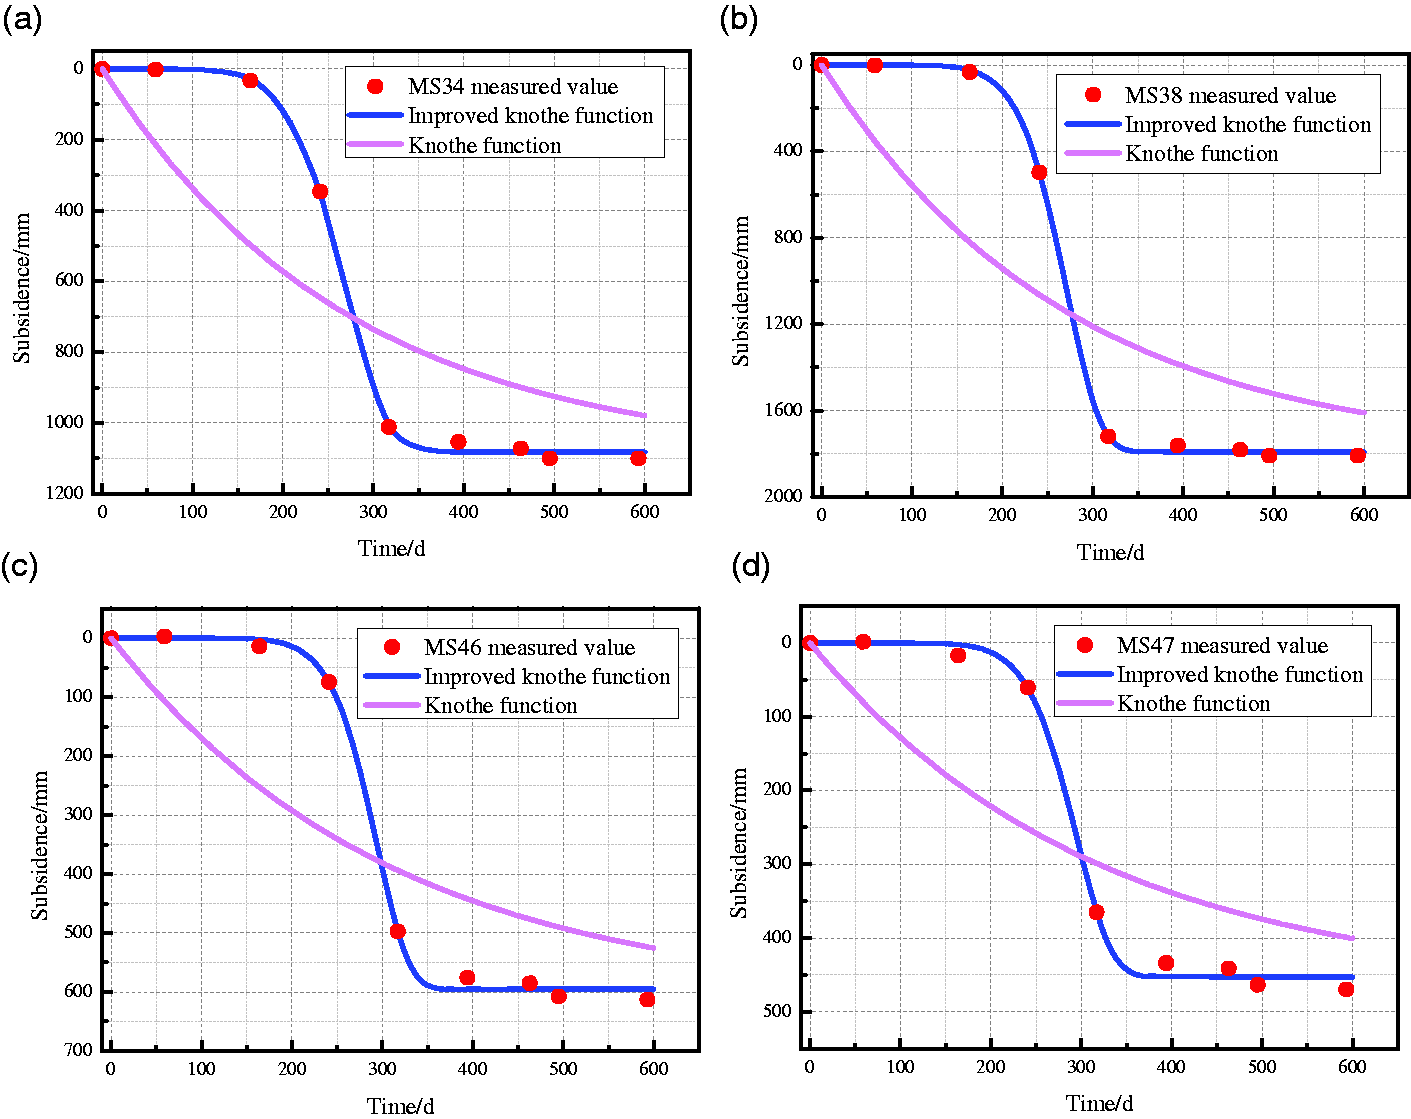
Comparison of two time-function models for surface subsidence prediction: (a) MS34, (b) MS38, (c) MS46, (d) MS47.
Table 4 and Figure 12 showed that the prediction accuracy of the improved Knothe time function model was higher than that of Knothe time function model. The improved Knothe model could better reflect the process of surface subsidence, and the fitting results were in good agreement with the measured results. It can provide some reference for dynamic prediction of surface subsidence and movement in mining areas with thick unconsolidated layers.
Conclusions
In order to overcome the deficiency of the Knothe time function, its influence coefficient was changed into coefficient in exponential form. Moreover, the influence coefficient A prediction model suitable for the surface subsidence basin of thick unconsolidated layers was established. Then a new mining subsidence dynamic prediction model was developed by combining this model with the improved Knothe time function model. The measured data of 1414(1) working face of Huainan mining area were used to verify the rationality of the model. In the 4 monitoring points, the fitting mean square errors of the improved Knothe model were between 11.001 and 13.635 mm, and the fitting mean square errors of the Knothe model were between 109.123 and 428.222 mm. The fitting results show that the improved model can better reflect the dynamic process of mining subsidence, and the prediction data and the measured data were in good agreement.
Footnotes
Declaration of conflicting interests
The author(s) declared no potential conflicts of interest with respect to the research, authorship, and/or publication of this article.
Funding
The author(s) disclosed receipt of the following financial support for the research, authorship, and/or publication of this article: This research is sponsored by the funding from National Natural Science Foundation of China (Grant Nos. 41474026, 52074010, 41602357), and the Natural Science Foundation of Anhui Province, China (Grant Nos.2008085MD114, 2008085QD178).