
Abstract
Ground surface monitoring (GSM) points collect information for mining surface subsidence monitoring and environmental governance. However, GSM points submerge in high groundwater mining areas, preventing the collection of monitoring data. The application of machine learning (ML) algorithms to subsidence prediction ignores the uncertainty and irregularity in subsidence changes. Thus, an innovative GSM point information prediction model, which improves the multikernel support vector machine (GA-MK-SVM) using chaos residual theory commonly used for capturing GSM point information, is proposed. The mean relative errors (MREs) between the predicted and observed results of GA-SVM and GA-MK-SVM were 8.2% and 6.1% during active periods, respectively. The GA-MK-SVM also performed better than the GA-SVM during stable periods. The residual error accumulates as the ML algorithms progress, resulting in imprecise predictions of the GSM points. Thus, the GA-MK-SVM model was improved using chaotic theory (Chaos-GA-MK-SVM), with MREs of 5.0% and 0.9% during the active and stable periods, respectively. The accuracy of the proposed model was improved by 1.1% and 3.2% compared with the unimproved GA-MK-SVM, respectively. The proposed approach provides practical GSM point information for mining subsidence studies and governance in high groundwater mines.
Keywords
Introduction
Coal mines are one of the most basic energy sources worldwide. Coal resources play a significant role in China's energy consumption. Since 1985, China has been the world's largest coal producer, accounting for 76% and 66% of the primary energy production and consumption structure, respectively (Yuan et al., 2018). However, a series of mine geological and environmental disasters, in which the rock stratum movement and deformation after coal mining broke the original stress state of the overlying strata, have occurred. Evidence has demonstrated that mining-induced surface movement causes inestimable damage to the aquifer, subaerial buildings and railways, and croplands. Therefore, establishing a surface subsidence monitoring system is necessary to reduce the impact of geological disasters and provide powerful technical support for ecological environment restoration, damage identification, building protection, and village relocation.
With the advancements in earth observation technologies, synthetic aperture radar interferometry (InSAR) (Hu and Xiao, 2013; Samsonov et al., 2013), real-time kinematics (RTK) (Gao et al., 2011), three-dimensional (3D) laser scanning (Zhou et al., 2014), and digital photogrammetry (Hindistan and Yetişen, 2012) have been used to obtain surface subsidence information. The 3D information of the surface subsidence has also been acquired using phase information derived from complex synthetic aperture radar data. However, Eastern China has a high groundwater level mining area. For example, in Huainan city, the coal-mining subsidence area reached 2.986 × 10⁴ ha in 2017, and nearly half of the subsidence area was submerged by water (Xiao et al., 2014). With water submerged at the surface, the physical composition of the scatter is changed and the microwave signal scattering is weakened. In addition, multipath errors in a large water area near the monitoring station pose a major challenge to RTK for receiving accurate data. The emitted laser pulse of the 3D laser scanning equipment, which acquires 3D information under a water complex, has failed to penetrate the water. Photogrammetry technology has also failed to obtain ground truth images and high-precision navigation positioning and orientation system information within this region. In addition, the measured data of the underwater topographic surveying equipment (i.e. sonar, underwater GPS, and sounder) do not meet the standard of high-level surveying (Hayes and Gough, 2009; Paull et al., 2014).
Traditionally, the commonly used method for researching the subsidence law is applying an established GSM observation station over the mining area. Such stations have been used to monitor the subsidence and deformation of the ground using classical leveling measurements. However, the underwater area frequently does not allow surveyors to walk over dangerous outfields. Thus, the subsidence information must be predicted using historical and precise leveling data. Subsidence prediction methods currently include fuzzy theory (Choi et al., 2010; Malinowska, 2011), empirical methods (Li et al., 2019), and time functions (Gonzalez-Nicieza et al., 2007). Such theories and formulas usually have countless theoretical assumptions, which limit their accuracy. For example, as the rationale behind the Knothe time function (Hu et al., 2015), the surface subsidence velocity is directly proportional to the maximum subsidence value. However, mining-induced surface movement is a complex nonlinear process, complicating the realization of subsidence prediction.
Artificial intelligence (AI) methods have been widely used in different scientific and engineering fields (Alhuyi Nazar et al., 2021; Rashidi et al., 2021, 2022), and ML is one of the important research areas of intelligent methods. As an alternative, GSM point predictive models employing ML algorithms have been applied. ML approaches have shown significant potential and have been applied to a variety of data-driven predictive applications. Ding et al. (2006) designed an artificial neuro-fuzzy inference system for predicting the rise, dip, and center angles and the maximum subsidence. In addition, Zhao and Chen (2011) proposed an artificial neural network (ANN) method for ground subsidence prediction of metal mines, achieving excellent accuracy. These methods fill the gap in incomplete monitoring data in mine ground subsidence and have achieved good results in engineering applications. However, the above models are limited in that the membership function in a fuzzy neural network is subjective and a neural network is likely to be stuck in a locally optimal solution, rendering the result unstable.
The SVM model has shown an outstanding performance with remarkable versatility and robustness against interference when dealing with small data training samples (Guenther and Schonlau, 2016). Furthermore, the multikernel SVM has an advantage over a single-kernel SVM. Yeh et al. (2010) also developed a multikernel learning (MKL) algorithm used in the clustering for multiclass classification. Meanwhile, experimental results on datasets from UCI and Statlog showed that the proposed approach outperforms single-kernel support vector clustering. Tan and Du (2011) improved the accuracy of hyperspectral image classification using a multikernel SVM and concluded the effectiveness of this approach in expanding the interpretation and application for remote image sensing. According to the subsidence law, subsidence becomes less measurable as mining progresses in high-water-level mining areas. Thus, the number of training samples used to predict the subsidence decreases. The MK-SVM model was selected to predict the underwater GSM points considering the benefits of a multikernel SVM in dealing with small training data samples.
ML methods are not usually designed specifically for mining subsidence and ignore domain knowledge regarding the randomness and irregularity of GSM points (Luo et al., 2018). Extracting dynamic information regarding the succession of values in a dataset is necessary for nonlinear time-series data. Among other areas, chaos theory has been widely applied in the medical domain, mechanical or electrical systems, and speech signal encoding (Akhmet et al., 2014; Lipsitz and Goldberger, 1992; Pikkujamsa et al., 1999; Yang et al., 2016). A chaotic system is another universal movement of objective aspects, excluding the period, quasi-period, and steady-state (Labat et al., 2016). Relevant research in the field of mining subsidence is limited. A regular trajectory can be generated to perform the random and irregular time-series analysis, while the strange attractor is detected using the phase space reconstruction method. The future course of a time series was then predicted using a chaotic time-series forecasting algorithm (local or global prediction) (Bradley and Kantz, 2015). Numerous studies have revealed that local prediction has a wide application in small datasets (Meng et al., 2007). In addition, the principle of weighted first-order local prediction algorithms claimed “to find the most similar features in historical and previous data” (Su, 2010, 2011). Thus, this algorithm has a more efficient calculation and higher precision compared with other chaotic prediction models and is suitable for practical applications.
The Gubei and Xieqiao coal mines are located in Anhui Province, Eastern China, which is a typical high groundwater level mining area. The active and stability periods are usually studied separately due to the remarkable differences in the subsidence law. Hence, the 1312(1) working face of the Gubei coal mine (during the active period) and the 2111(3) working panel of the Xieqiao coal mine (during the stability period) were selected. This study applied a weighted first-order local prediction method to analyze the residual sequence (RS) of mining-induced subsidence, and an innovative underwater GSM point prediction model using the chaos theory improved MK-SVM algorithm (Chaos-MK-SVM) was proposed. Moreover, the available data in different periods for the groundwater submerged mining areas were found and discussed using the proposed GSM point prediction model (Chaos-MK-SVM). Finally, the anti-jamming capability of the algorithm against missing GSM points was verified.
Overall, the advantages of SVM in processing small data samples, the generalization capability of MK-SVM, and the significant chaotic and nonlinear properties of underground mining are considered to improve the accuracy and reliability of the surface subsidence prediction results of underwater monitoring points in high water level mining areas. A new prediction model (CHAOS-GA-MK-SVM) is then proposed. The research results of this paper will provide a certain theoretical basis and technical reference for the study of dynamic mining subsidence law in high water level mining areas, dynamic prediction of water resources (including depth of water accumulation in subsidence basins, area of accumulated water, range of accumulated water, volume of accumulated water, and maximum storage capacity), and comprehensive management of the ecological environment and sustainable development in coal mining subsidence areas.
Materials and methods
Study area
The Jianghuai Plain in northern Anhui province is the largest coal deposit in eastern China. The natural elevation is +2, +10 m above mean sea level, with an average of +6 m. Relevant data reveal that the coal resources in Anhui province are mainly distributed in the Huaibei and Huainan coalfields, which are northern China type Carboniferous and Permian coal-bearing strata. Water resources are abundant in this area, and the underground water table is approximately 2–3 m below the soil surface. Most precipitation falls between June and September, with significant inter-annual variability in the precipitation.
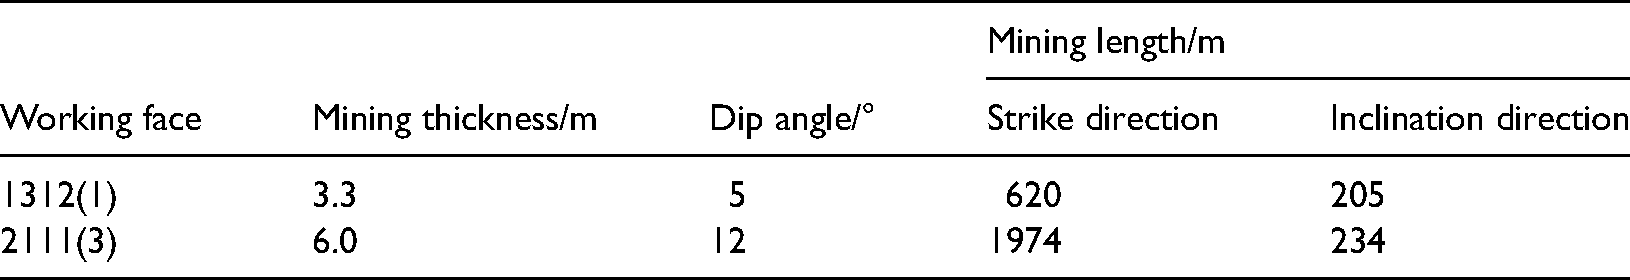
High-quality coal in this region is widely mined by governments to support economic development. Thus, underwater mining subsidence treatment and monitoring are urgently needed to maintain the ecological environment. The Gubei and Xieqiao coal mines are located in the Jianghuai Plain and near the Huai River basin, respectively, which are typically high groundwater level mining areas, as shown in Figure 1. The measured data of the subsidence area in water-uncovered periods were used in the current study to predict the water-covered GSM point information. The geological and mining conditions of the working faces are listed in Table 1.
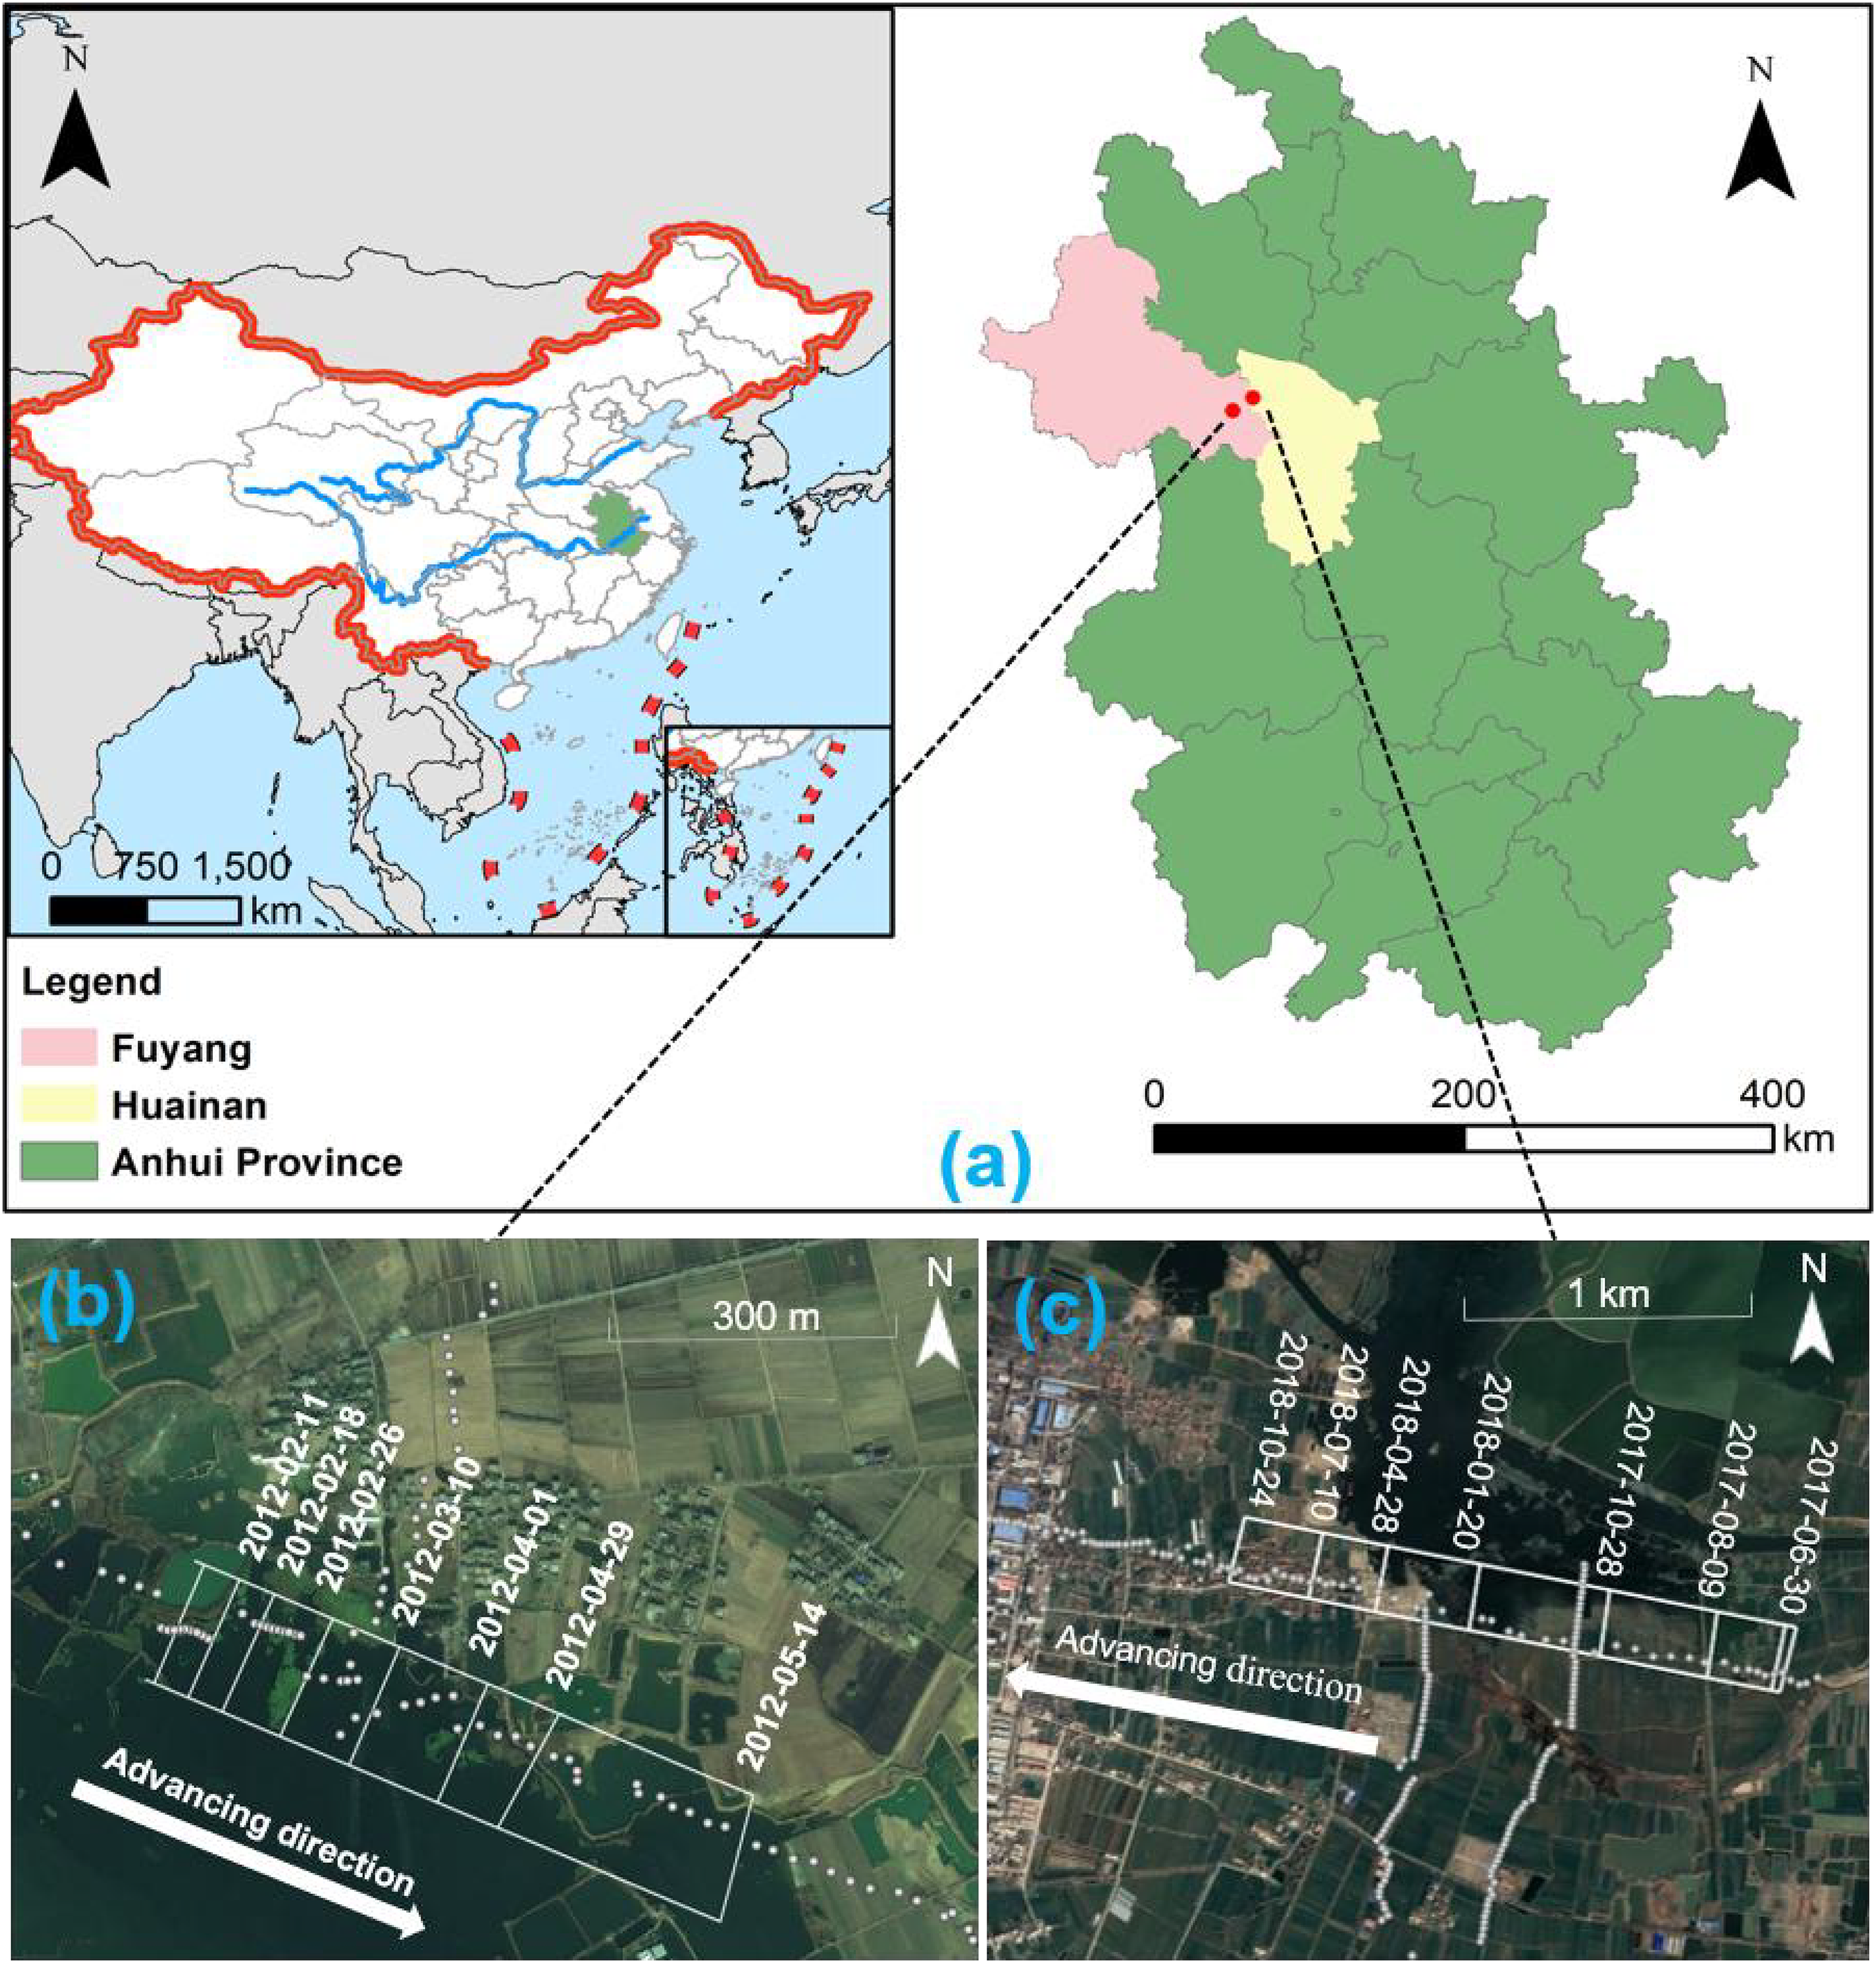
Study area diagram: (a) geographic location of the mining area. (b) Field layout of the 1312(1) working panel and monitoring points, where the white dots denote the GSM points, and the white line segments represent the advancing position of the working panel during monitoring by the surface observation station. (c) Field layout of the 2111(3) working panel and advancing position.
Geological and mining conditions.
Datasets and data preprocessing
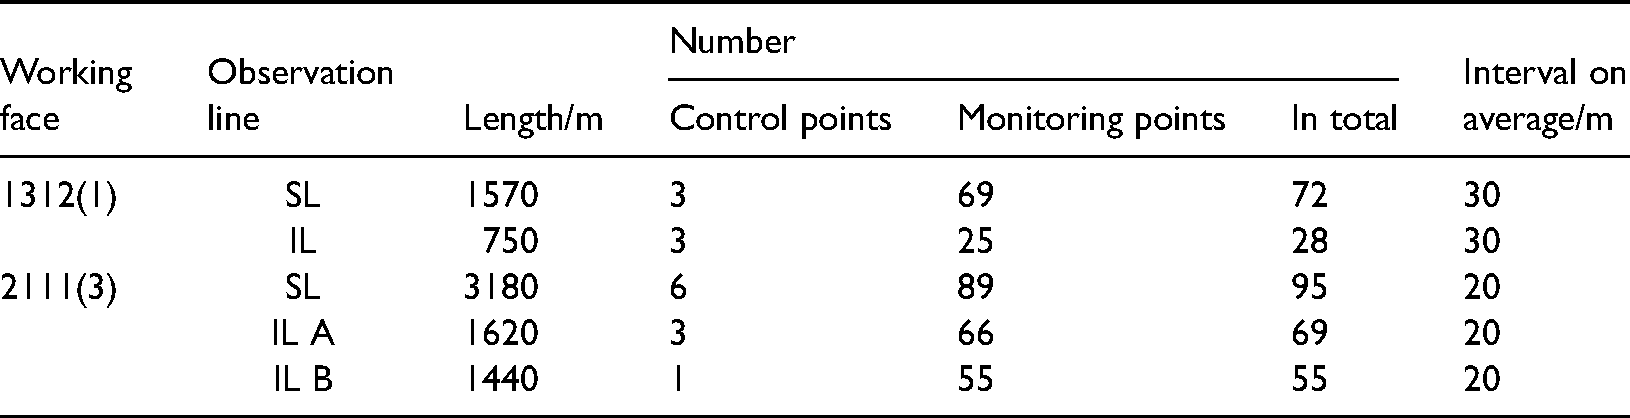
Table 2 shows the layout of the working face observation lines, including the strike line (SL) and inclination line (IL). Specifically, in the Gubei 1312(1) working face, the measurement began on October 15, 2011, and ended on May 1, 2013. The observation took approximately 19 months. In the Xieqiao 2111(3) working face, the measurement began on June 28, 2017, and ended on December 2, 2019. The observation lasted for approximately 29 months. Elevation measurements, patrol measurements, and daily observations were conducted using third-order geometric leveling to meet the engineering requirements for the monitoring accuracy of the observation station.
Layout of the observation line.
Additional data must be obtained through interpolation to improve the accuracy of the ML algorithm. Thus, cubic spline interpolation was conducted for each GSM point (Li et al., 2014). According to the subsidence situation and velocity, different time intervals were conducted to analyze the influence of different data volumes on the accuracy of the model results. Specifically, the 1312(1) SL of the Gubei Coal Mine took five days as a time interval. However, the 2111 (3) IL of Xieqiao Coal Mine took a 15-day interval, and the Xieqiao 2111(3) SL took a 30-day interval because the subsidence speed was slow during the stability period.
Consequently, a GSM point subsidence map was obtained after preprocessing (excluding monitoring points with few subsidence data and large gross errors), as shown in Figure 2. The figure reveals the black and red lines, which represent the interpolation and measured lines, respectively. The monitoring points along the strike directions in the 2111(3) working panel (Figure 2(f)) have serious missing GSM point data.
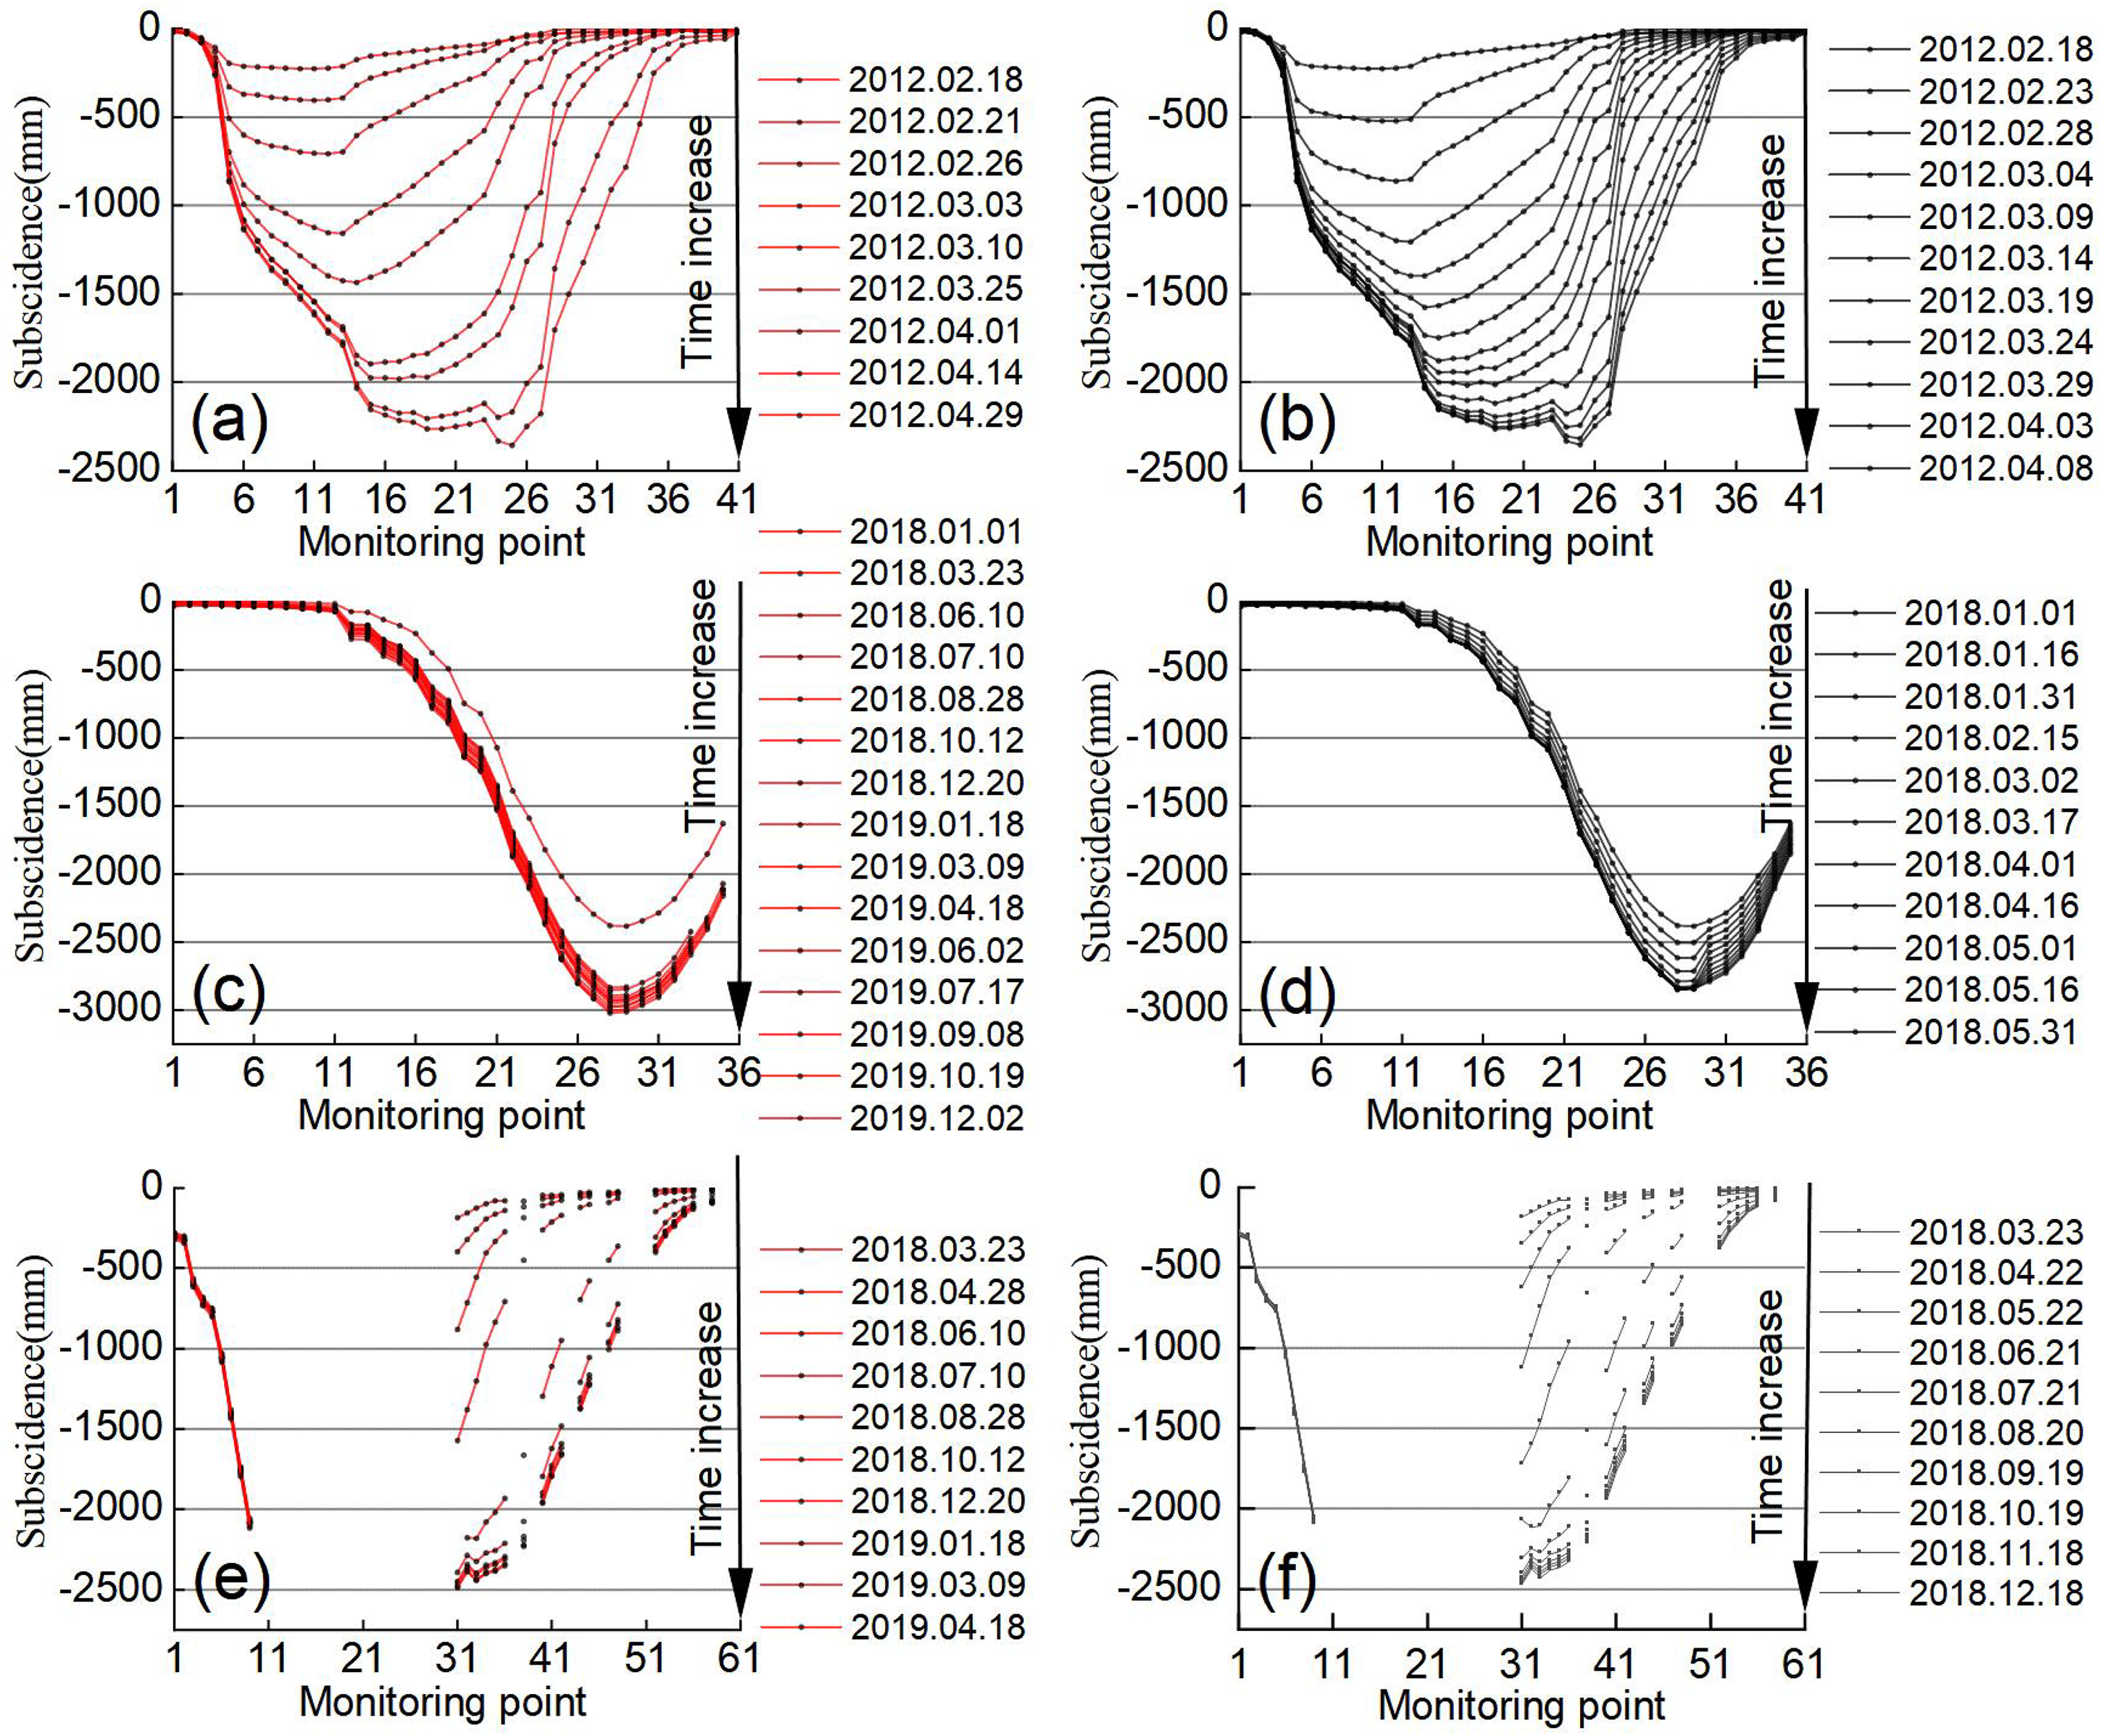
GSM point subsidence map. (a), (c), and (e) The measured subsidence of GSM point along the 1312 (1) SL, 2111 (3) IL, and 2111 (3) SL, respectively. (b), (d), and (f) Interpolated subsidence of GSM point along the 1312 (1) SL, 2111 (3) IL, and 2111 (3) SL, respectively.
Methodology
The minor subsidence changes commonly occur in subsidence boundary areas, resulting in measured subsidence values that are inaccurate. Therefore, the missing observation data were first removed, resulting in a significant gross error. In addition, the data normalization process was adopted due to the considerable difference in the subsidence of the observation data (Step 1). The SVM and MK-SVM algorithms were then performed to realize GSM point information predictions, and particle swarm optimization (PSO) and genetic algorithm (GA) optimization techniques (Assareh et al., 2010) were employed to search the hyperparameters (HPs) of the aforementioned ML model (Step 2). Mining-induced subsidence displays apparent chaos and nonlinearity. Therefore, the model was improved using chaos theory. Chaos prediction was applied to ML algorithms when residuals between the predicted value and the observation data satisfied the chaos theory condition. Otherwise, chaotic prediction is disregarded (Step 3). The law of subsidence is different between active and stability periods; thus, the model accuracy and available data were assessed for different periods under the two applications. In addition, the generalization of the above-mentioned GSM prediction model with the missing dataset was discussed (Step 4). The framework of this scheme is illustrated in Figure 3.
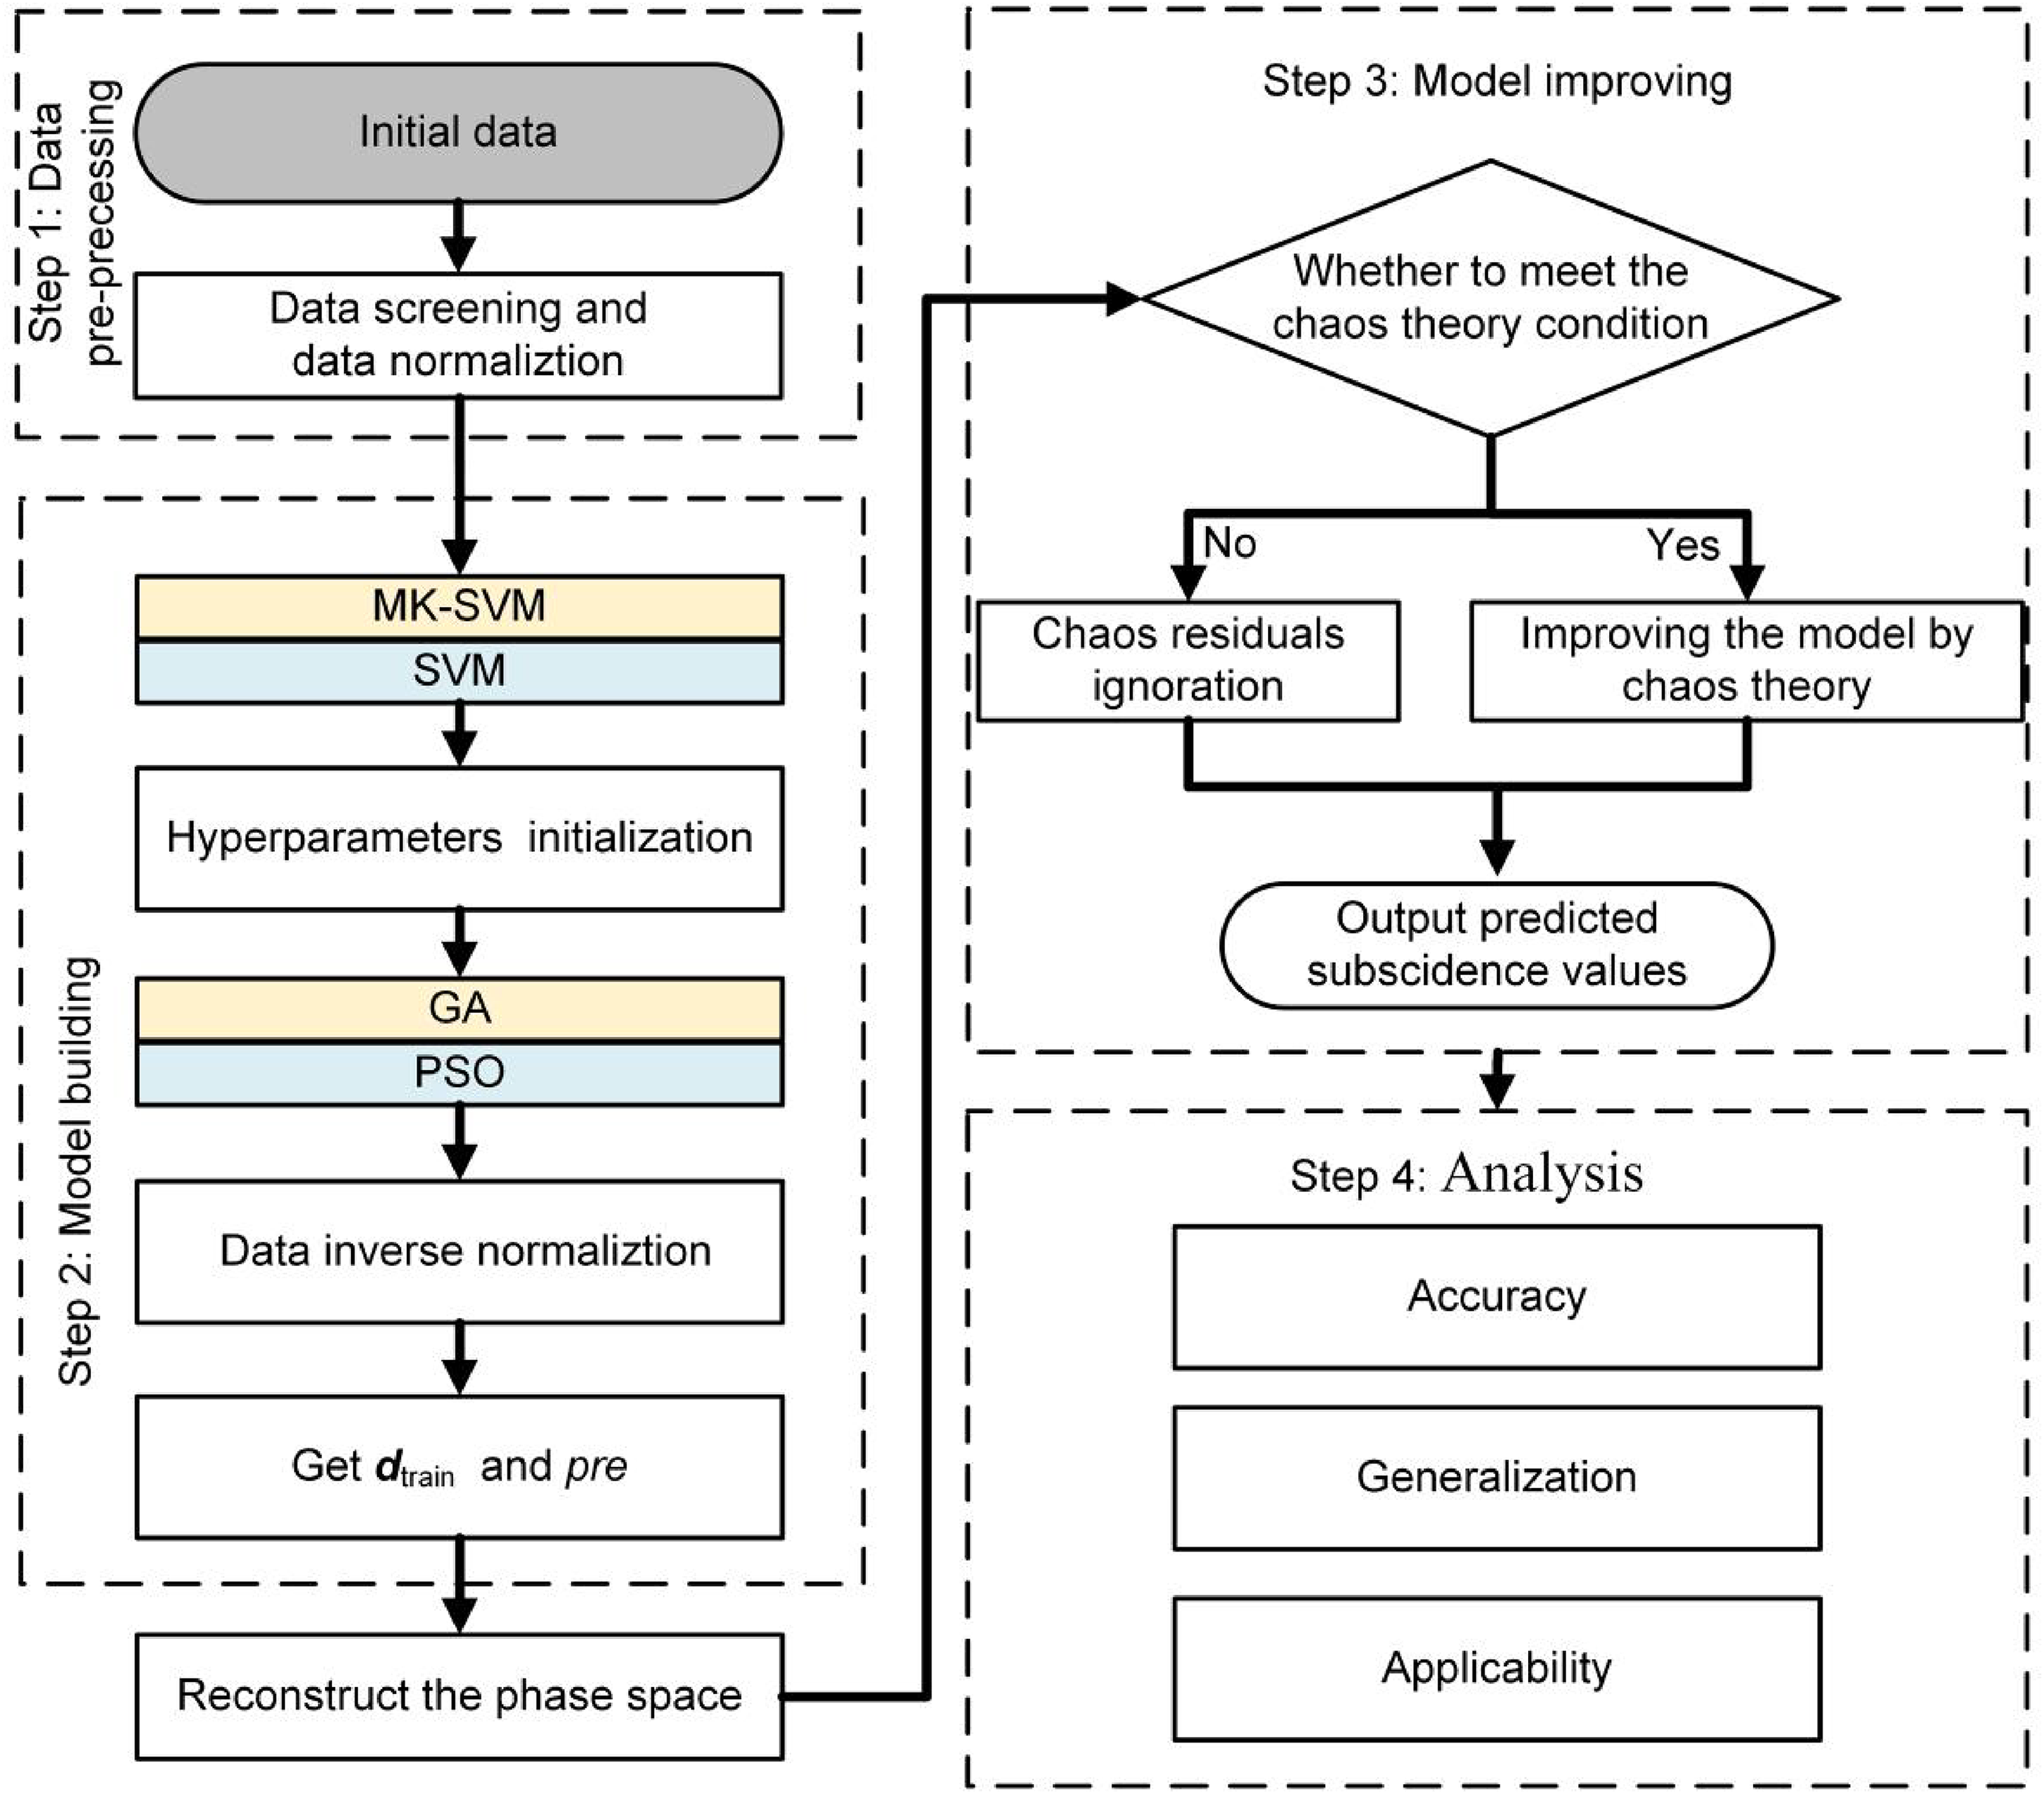
Research workflow.
MK-SVM model building
SVM algorithm
The monitored and cumulative subsidence days vary widely, posing a significant challenge in accurately predicting GSM information. Thus, the observation data must be normalized before taking the coordinates and cumulative subsidence days of the GSM points and subsidence as input and output data, respectively.
SVM sets an “interval” on both sides of the linear function, as shown in Figure 4. The training samples outside or at the edge of the “interval” (red circles) should be penalized. Meanwhile, those that fall into the “interval” (blue circles) should not be punished. Herein,
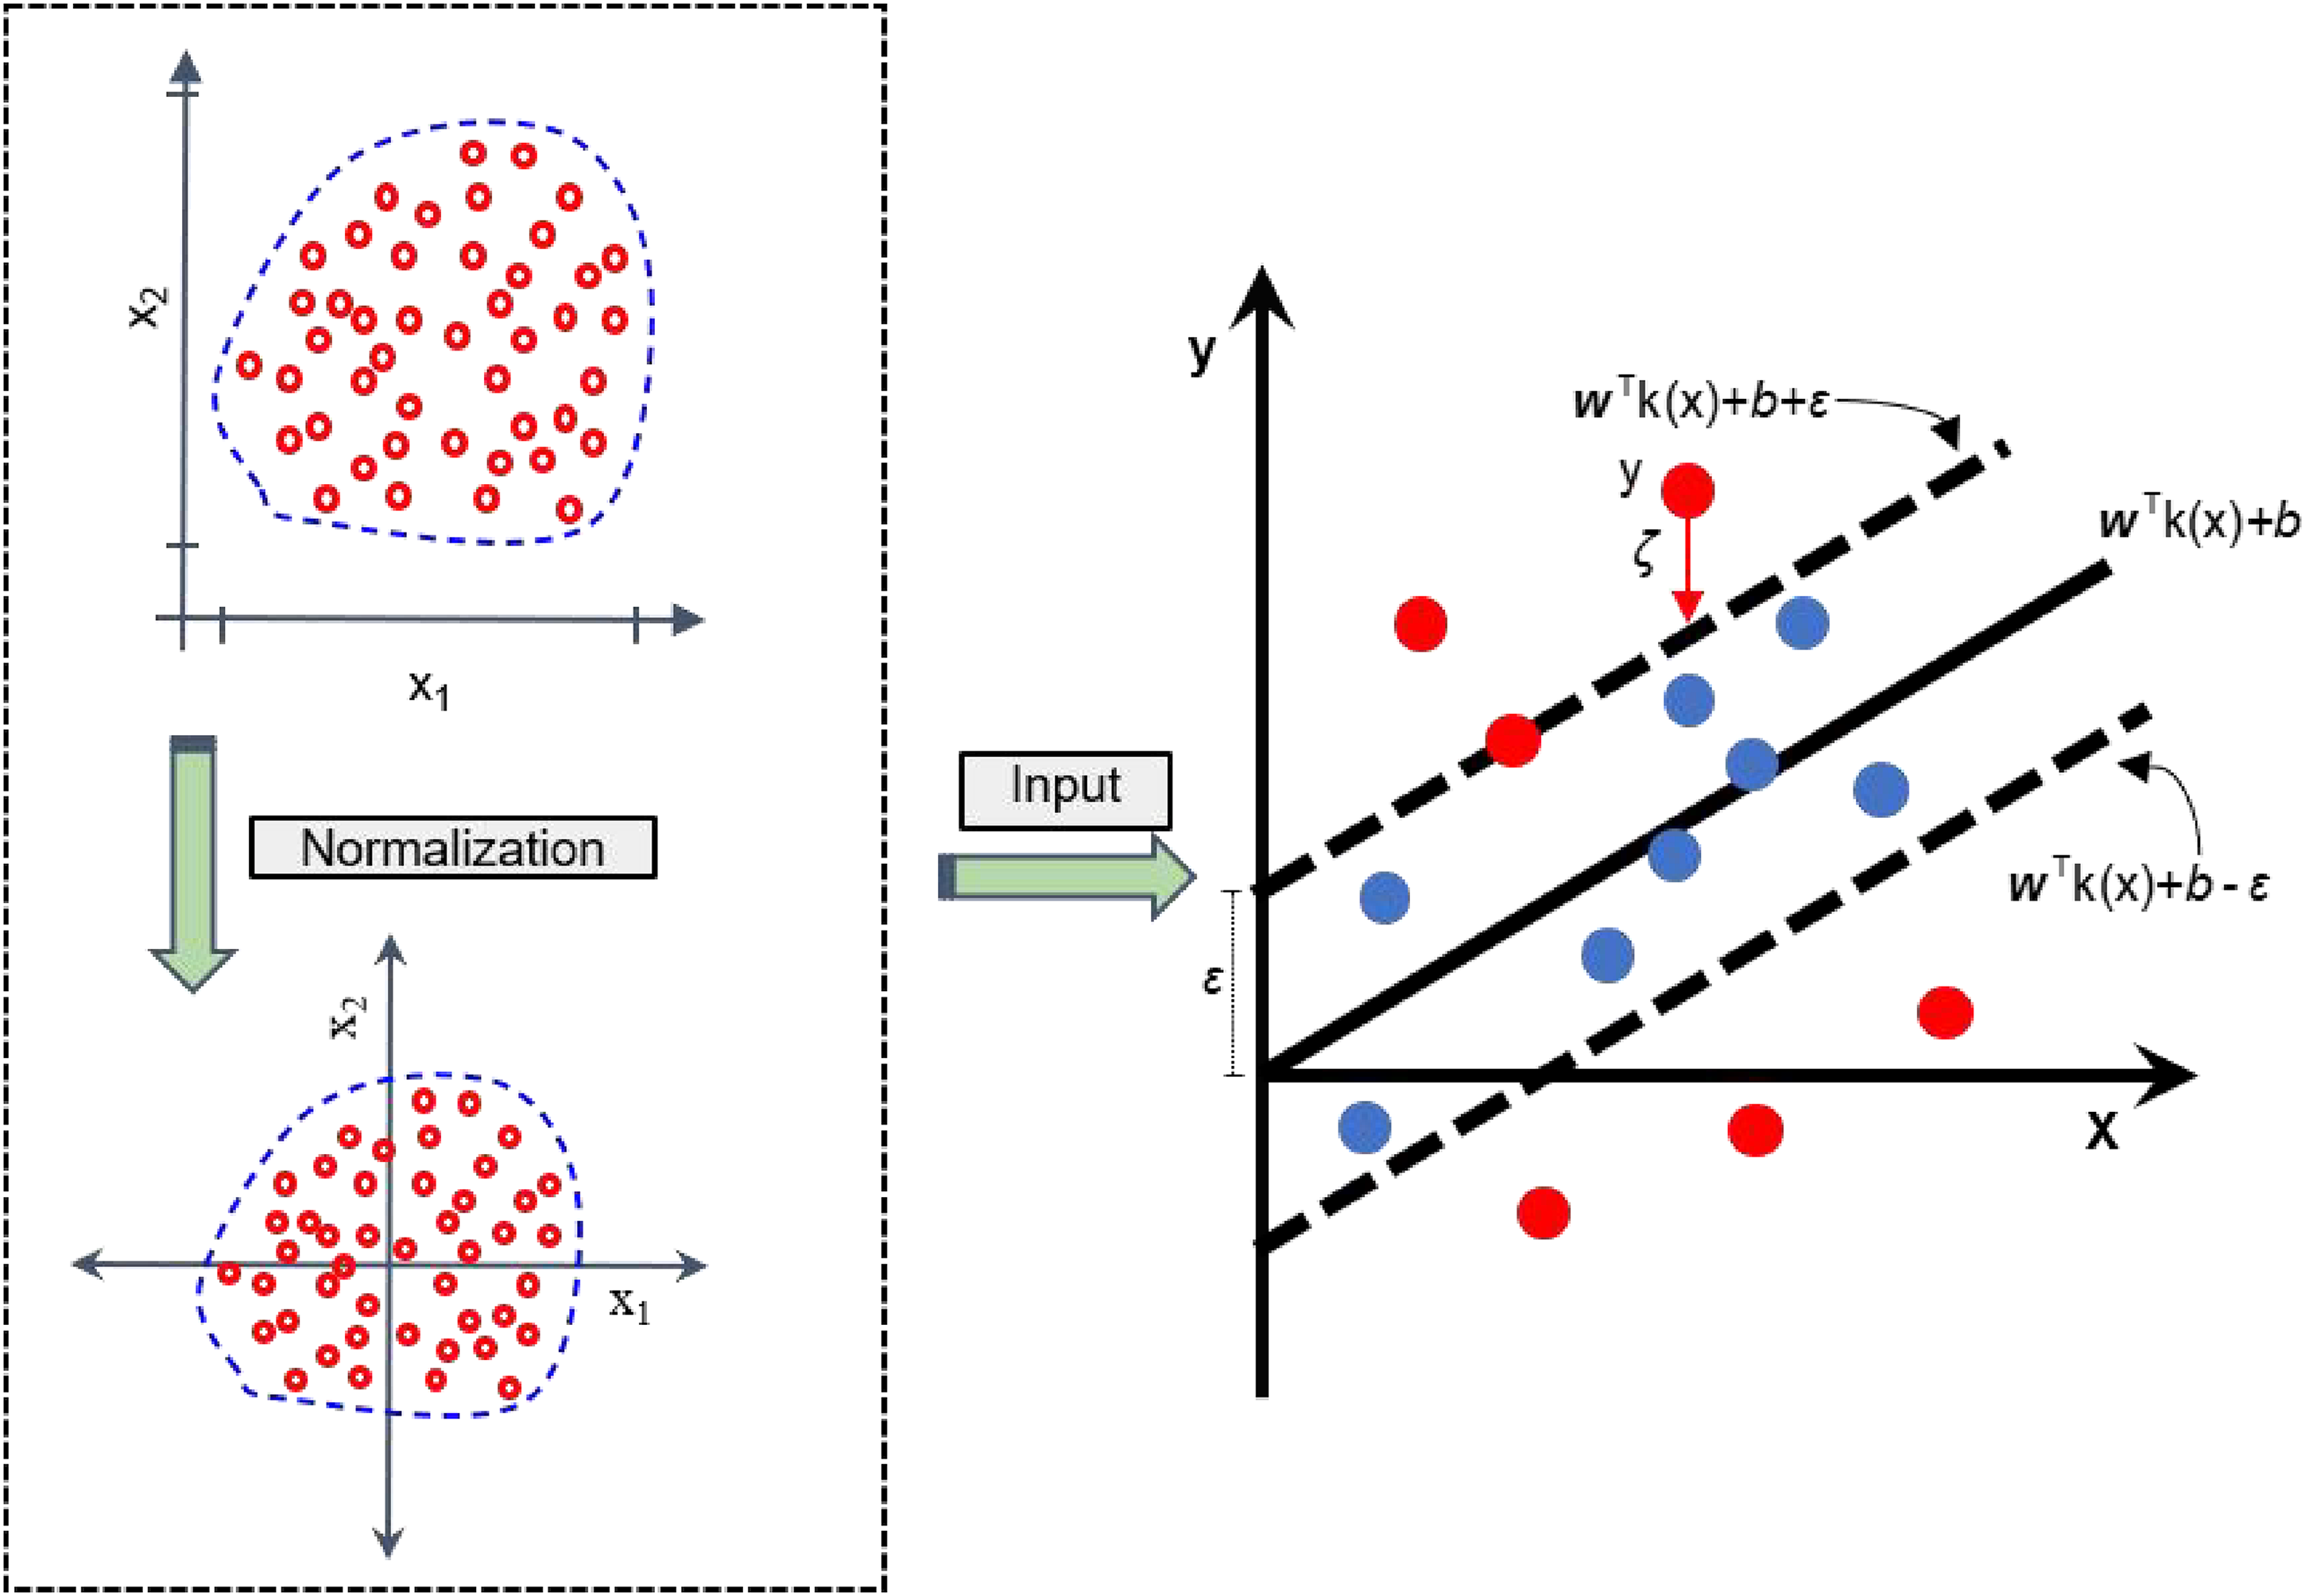
Principle of SVM.
Principle of MK-SVM
The multikernel function was established by combining the polynomial kernel function with the Gaussian kernel function:
The residual of the training set in MK-SVM is the difference between the measured and predicted surface subsidence:
HP searching
The GA and PSO have higher efficiency in searching for HP compared with the grid exhaustion approach. Hence, the GA and PSO were selected to search for the HP of the model. In addition, determining the range of the optimized HP was necessary. Specifically, the penalty factor was determined as C = (0, 100], the width parameter g = (0, 1000], and the threshold was ε = [0, 1] within the SVM HP range. However, MK-SVM had additional HP, the HP ε with a low impact factor was disregarded, and the range of the width parameter in the kernel function was reduced. Hence, the ranges of HP C, g1, g2, and α of MK-SVM were (0, 100], (0, 256], (0, 256], and [0, 1], respectively.
Model improvement with chaos theory
The prediction of the residual chaos sequence was categorized into three steps: a phase space reconstruction of the RS, identification of the chaos characteristics, and a prediction of the residual chaos.
Phase space reconstruction of the RS
The phase space reconstruction theory is the basis of the chaos sequence; this theory can be applied to the chaos sequence through a coordinate delay. An m-dimensional new phase space for the RS {d1, d2, d3, …, dn} was reconstructed as follows: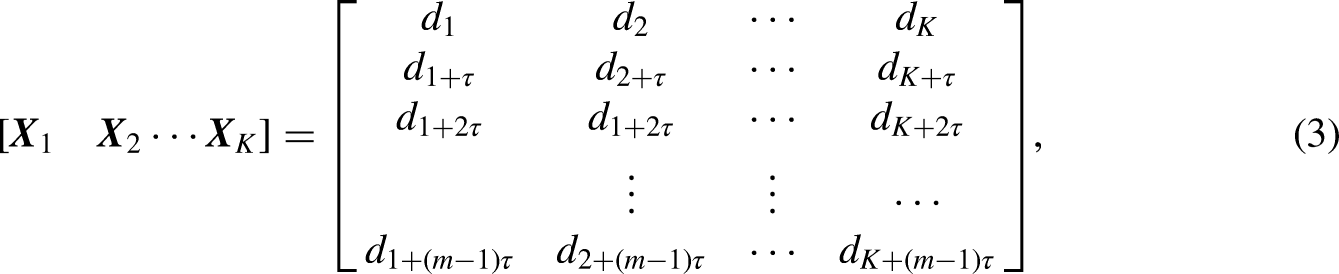
Identification of RS chaos characteristics
The G-P algorithm can obtain the correlation dimension (G) to determine the time-series sequence chaos characteristics. If the correlation dimension is a fraction, then the dynamic behavior of the system may display chaotic characteristics. Thus, a chaotic attractor can be described as long as the dimensions of the phase space reconstruction are sufficiently large, demonstrating the law of motion of the system; traditional methods are incapable of the aforementioned condition. However, a situation in which G is not saturated can also occur in real calculations and may be due to two reasons: 1) m is insufficiently large; thus, m should be increased; 2) no non-characteristic scale is observed within the sequence. Thus, time-series sequences cannot be predicted through chaos theory (Shang et al., 2016).
Weighted first-order local prediction
The local method is based on the rationale of attempting to find the most similar features possible. This method is used to treat the last point in the phase space trajectory as the center point, and the most adjacent points to the center point are regarded as benchmark points. A fitting is applied to these benchmark points, and the trend of the next step is estimated on the basis of such fitting. Finally, the predicted values were separated from the coordinates of the trace points. The center point is assumed to be 
The fitting expression of the weighted first-order method is
In addition, a and b can be calculated by the weighted least squares, which is expressed as follows:
Principles of the Chaos-MK-SVM model
Substituting dtrain obtained from equation (2) into equations (3) and (6) results in a and b, and the residual is calculated using equation (5). Finally, the residual of each GSM point r was added to the predicted values of MK-SVM before pre to the test sets, and the results y were a predictive model based on the Chaos-MK-SVM. The expression of the Chaos-MK-SVM algorithm is as follows:
Assessment method
The relative error (RE) and mean relative error (MRE) were introduced to evaluate the accuracy and feasibility of the experimental results. Specifically, RE evaluates the reliability between the predicted and observed values for the GSM point, and MRE evaluates the viability of the predicted model. The basic formulas are presented as follows:

Results and discussion
Results
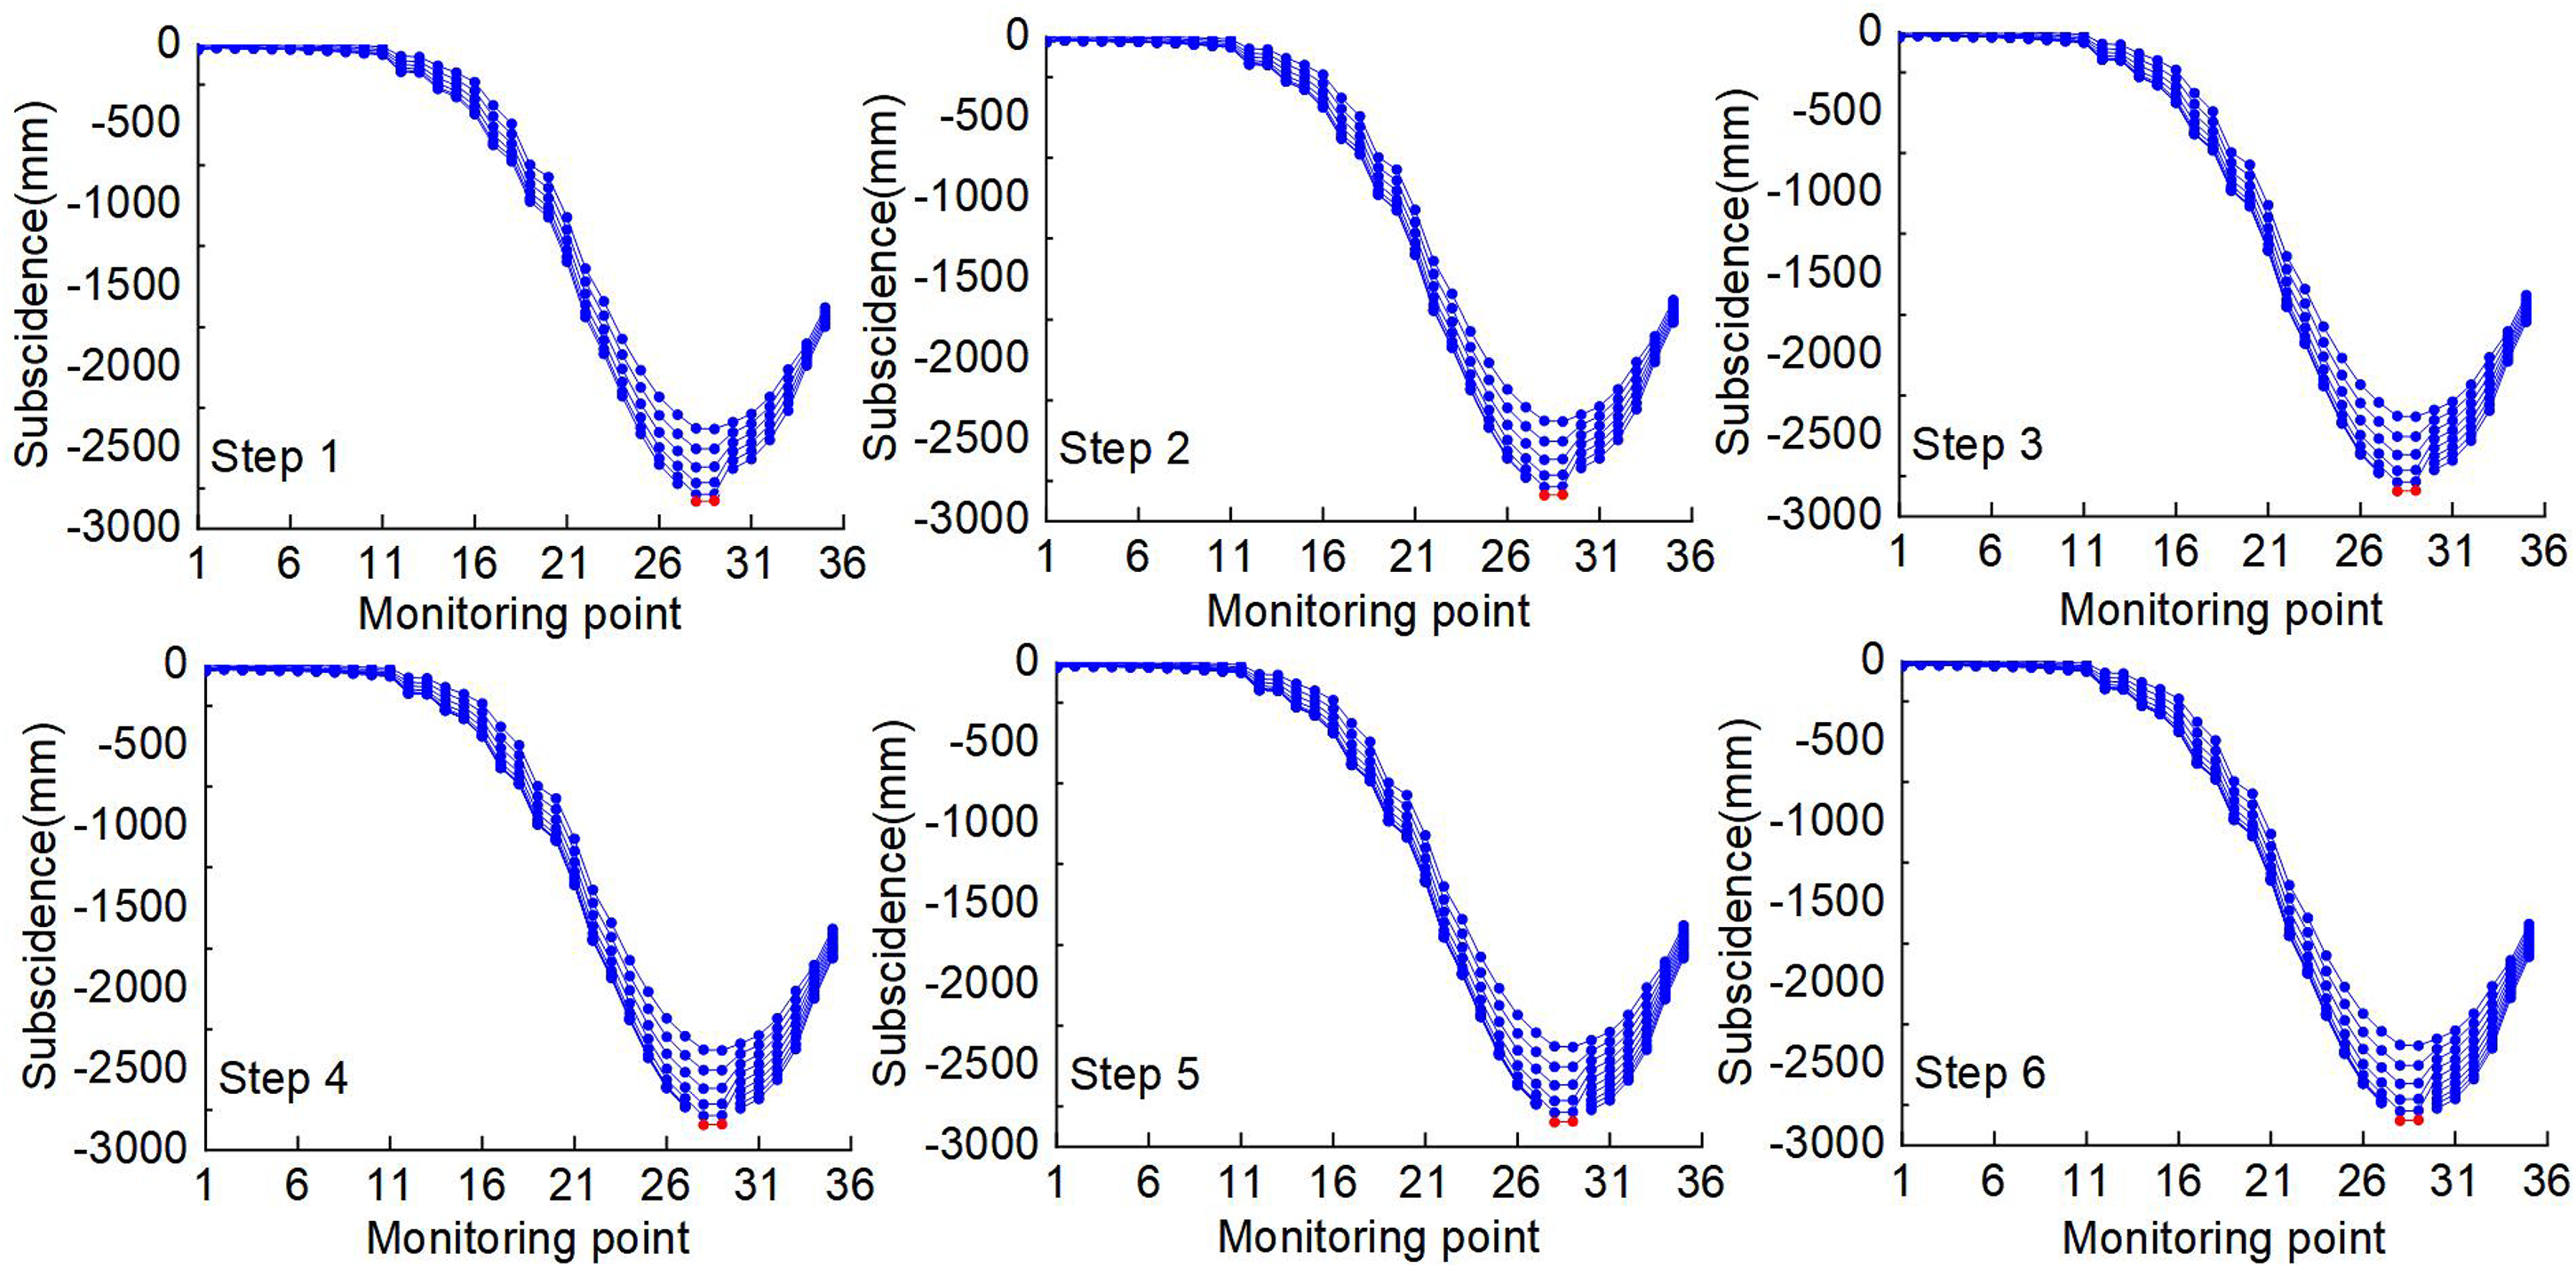
The active and stability periods are studied separately due to the remarkable differences in the subsidence law of the mining area. Specifically, the subsidence velocity is larger and less than 1.67 mm/d during the active stable periods, respectively. Water will submerge the ground surface in a high groundwater area, whereas the ground surface subsidence value reaches 2–3 m, failing to collect GSM point subsidence. The Gubei 1312(1) SL and Xieqiao 2111(3) IL are in active and stable periods, respectively. The calculation steps of the two aforementioned mining areas are shown in Figures 5 and 6, respectively. In Figure 5, the blue points (subsidence values of less than 2000 mm) denote the training data, and the red points (subsidence values of more than 2000 mm) denote the testing data. However, the collected GSM points had a large subsidence value, as shown in Figure 6. Thus, the blue (subsidence values of less than 2800 mm) and red (subsidence values of more than 2800 mm) points denote the training and testing data, respectively.
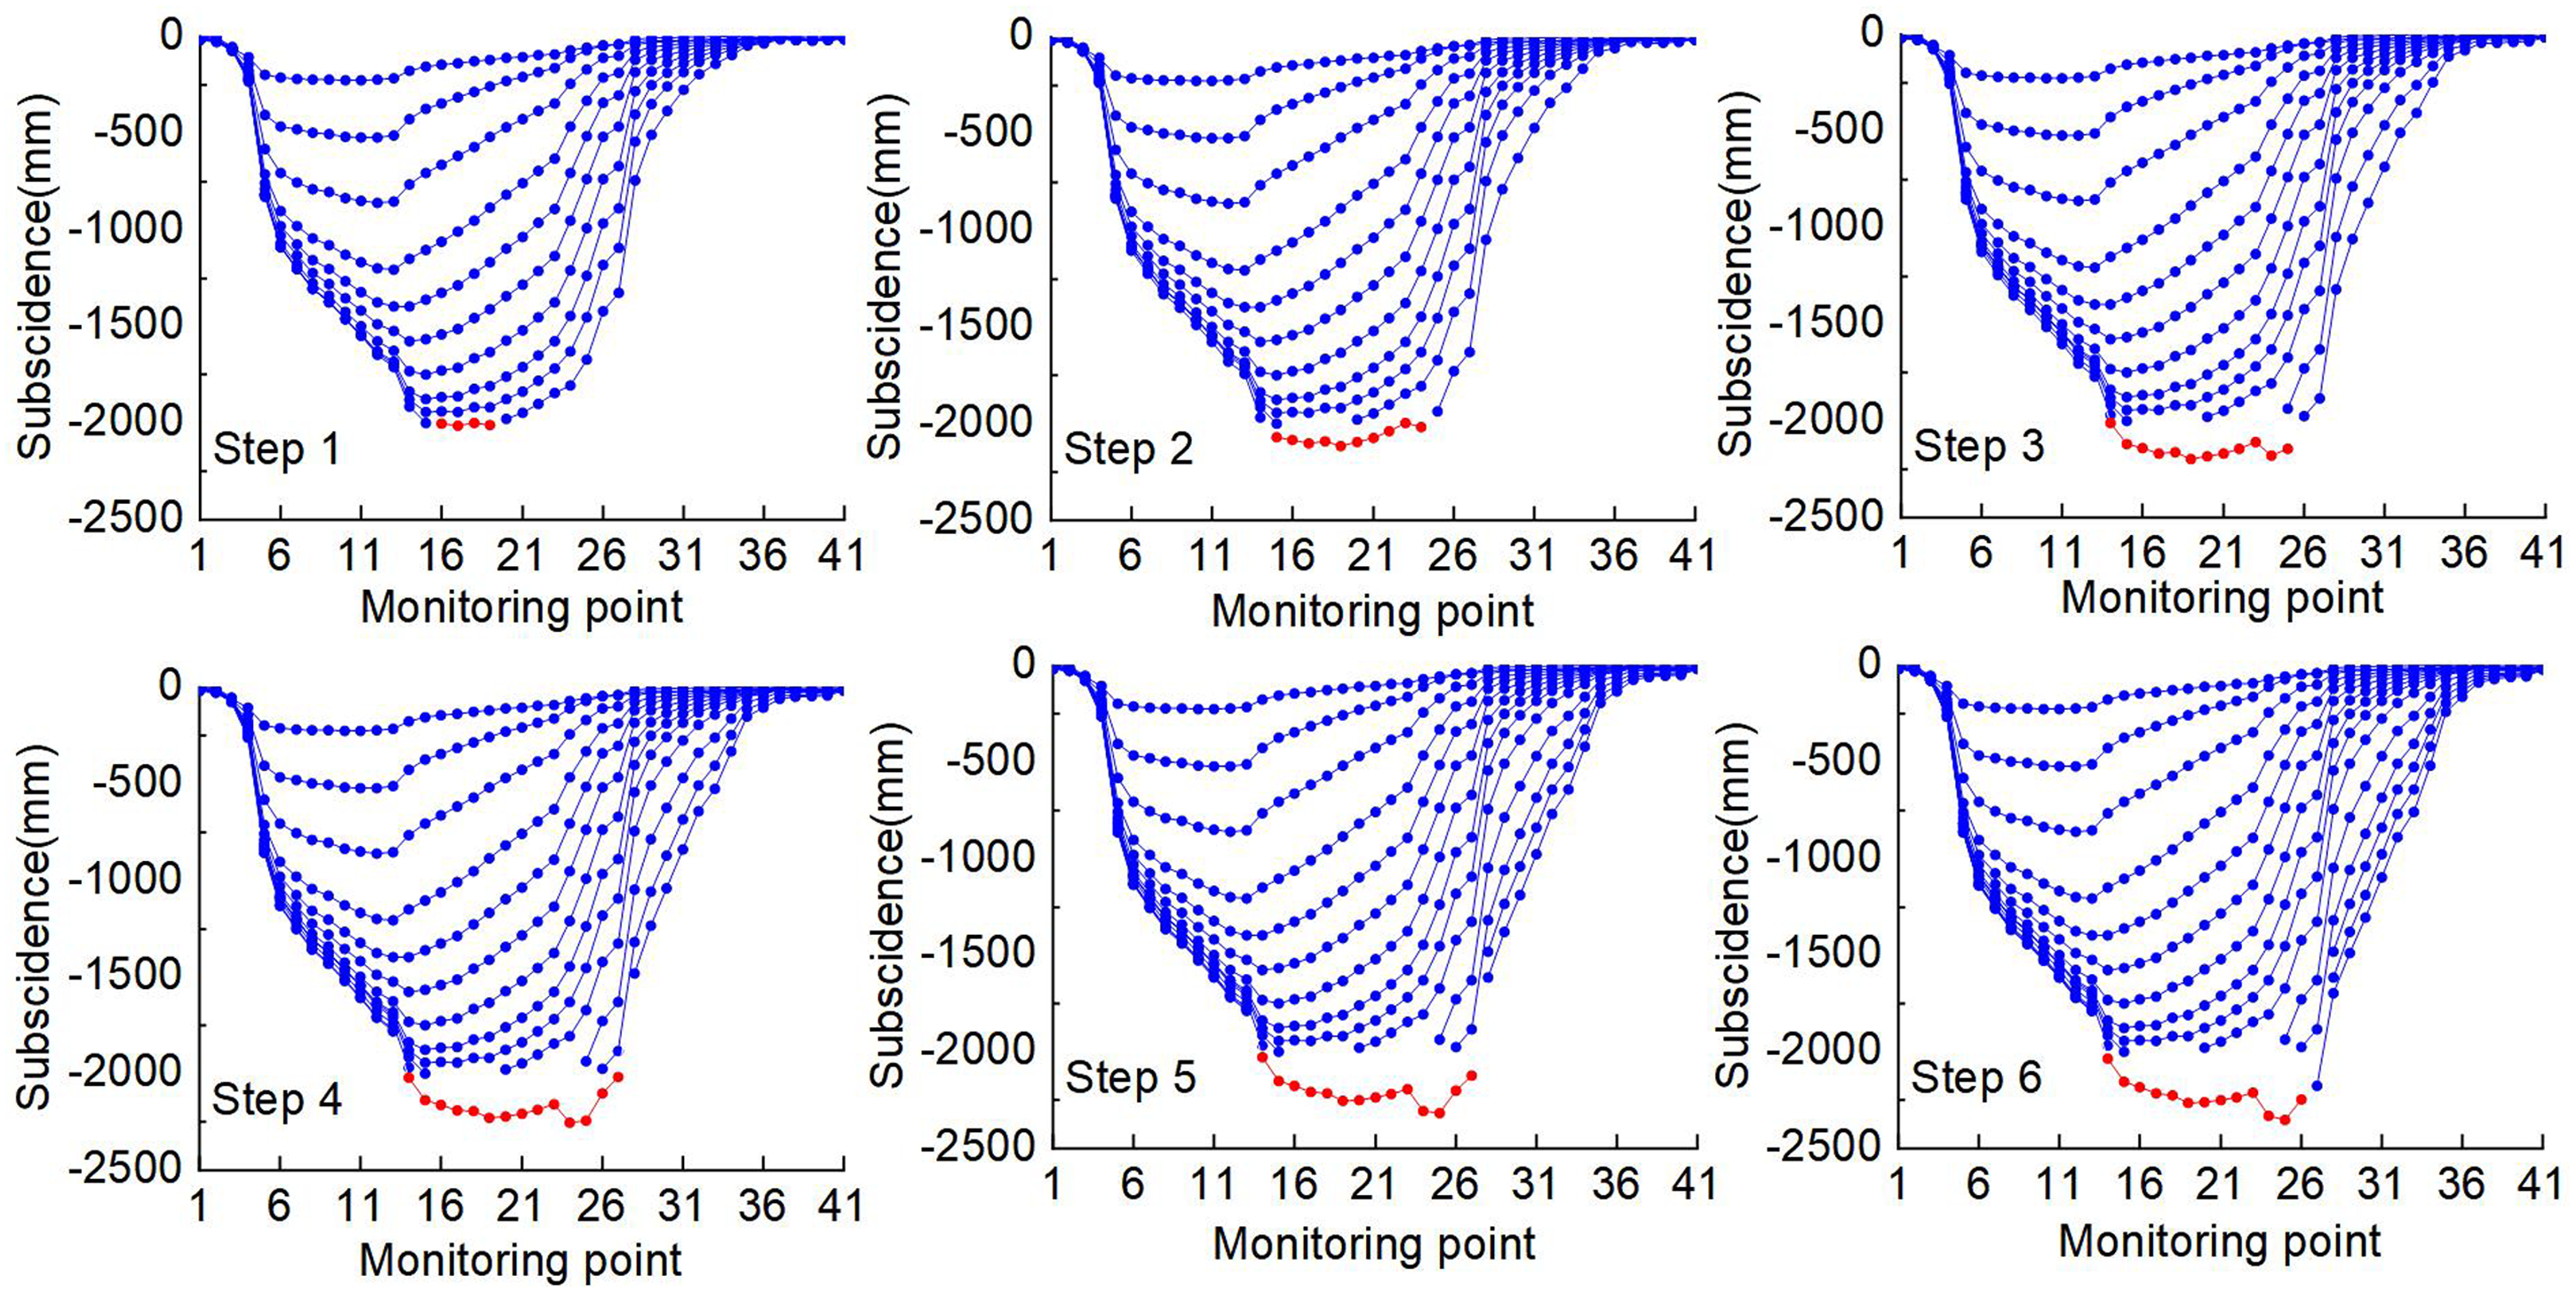
Gubei 1312(1) SL prediction process diagram.
Xieqiao 2111(3) IL prediction process diagram.
The comparison results of the measured and predicted data were divided into five classes to illustrate the viability of the prediction results intuitively. Specifically, the first group had a relative error of < = 2%, as represented by ①. The second group had a relative error of < = 5%, as represented by ②. The third group had a relative error of < = 10%, as represented by ③. The fourth group had a relative error of < = 20%, as represented by ④. Finally, the fifth group had a relative error of >20%, as represented by ⑤. In engineering applications, the predicted data in the first and second groups are accurate and valuable, while those of the fourth and fifth groups are poor and useless. In addition, the following six models were applied in this experiment to demonstrate the superiority of the GA-Chaos-MK-SVM model: PSO-SVM, GA-SVM, GA-MK-SVM, Chaos-PSO-SVM, Chaos-GA-SVM, and Chaos-GA-MK-SVM. Moreover, various assessment reports were obtained in the active and stable periods.
Accuracy assessment of prediction in the active period
In Figure 7, ① and ② are shown in red, ③ is shown in green, and ④ and ⑤ are shown in black. The distribution of the relative errors between the observed data and predicted results in the Gubei 1312(1) SL is also displayed in this figure. Figure 7(f) has the highest values of ① and ② and the least values of ④ and ⑤. In addition, with four periods, the prediction results are valuable and the one-period accuracy is poor.
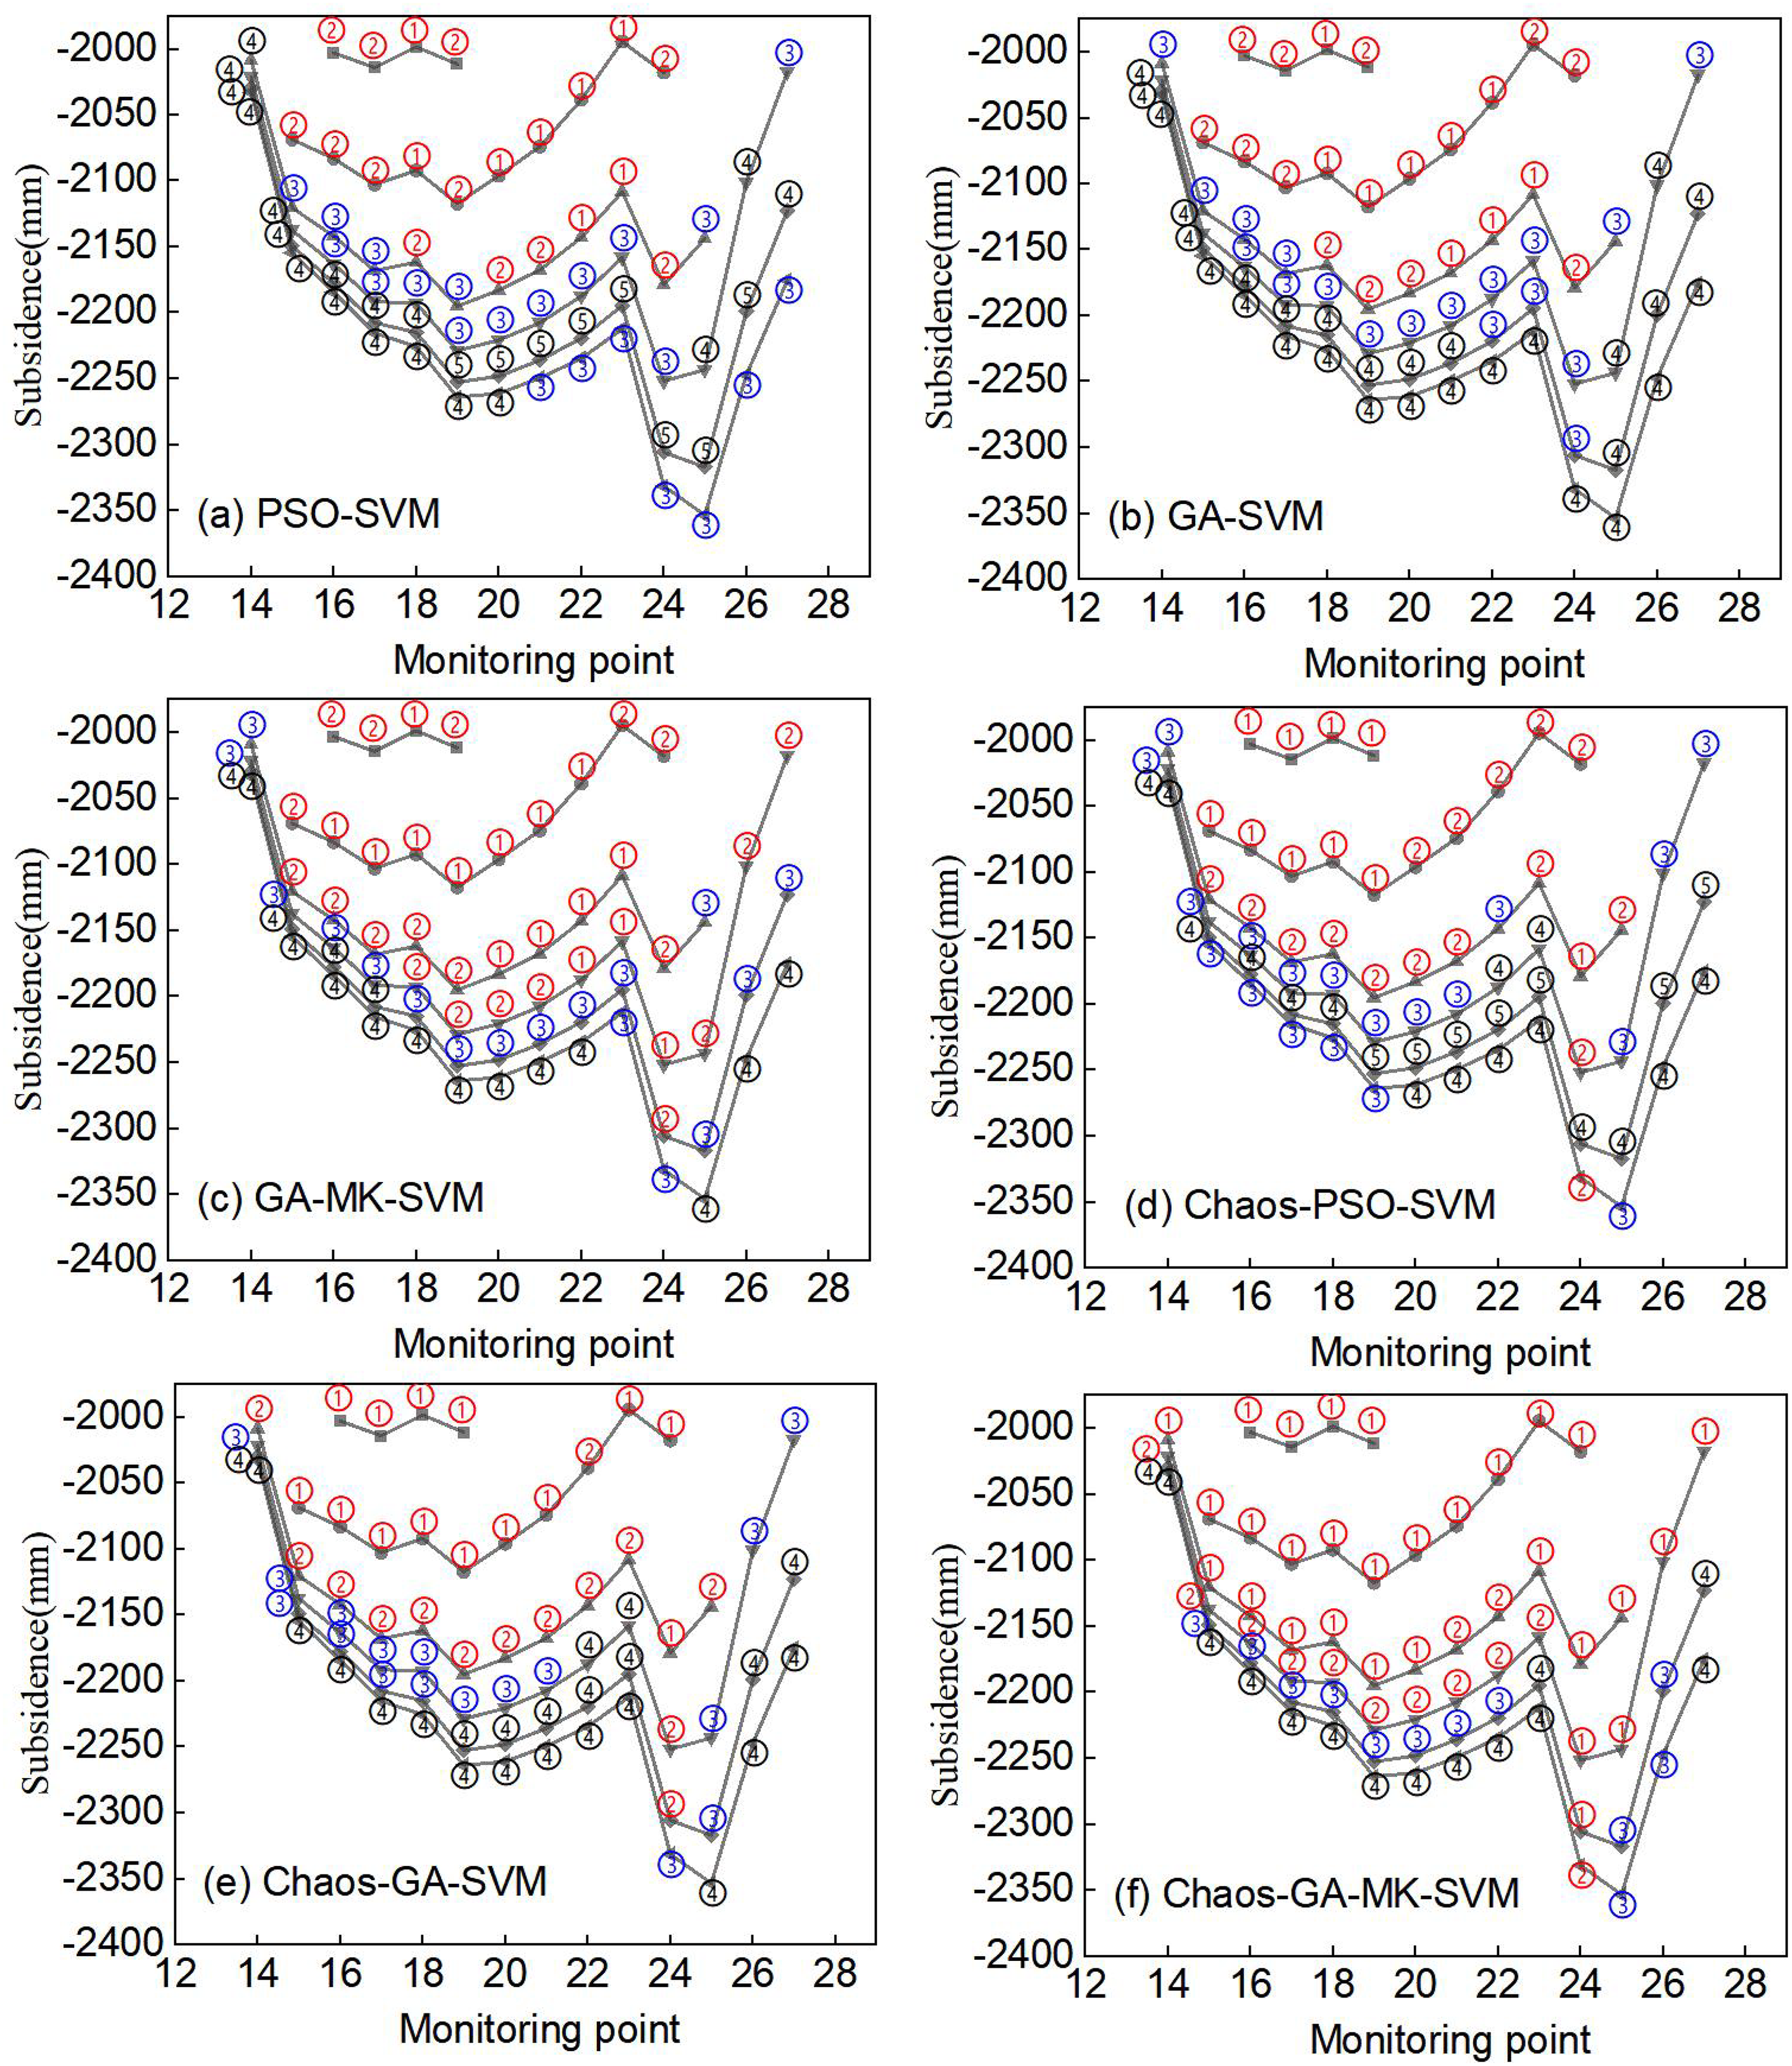
Relative error distribution of six different prediction models in the Gubei Mine 1312(1) SL.
The number of five-class comparison results and the MRE for the aforementioned model are calculated as shown in Table 3 to assess the model accuracy quantitatively. Table 3 shows that the MRE of GA-SVM was improved by 1.3% in comparison to PSO-SVM, and GA-MK-SVM was improved by 2.1% in comparison to GA-SVM. For the model improved using chaos theory, the MREs of Chaos-PSO-SVM, Chaos-GA-SVM, and Chaos-GA-MK-SVM were improved by 0.8%, 0.9%, and 1.1%, respectively, in comparison to the unimproved model.
Relative error distribution of six prediction models in the Gubei Mine 1312(1) SL.
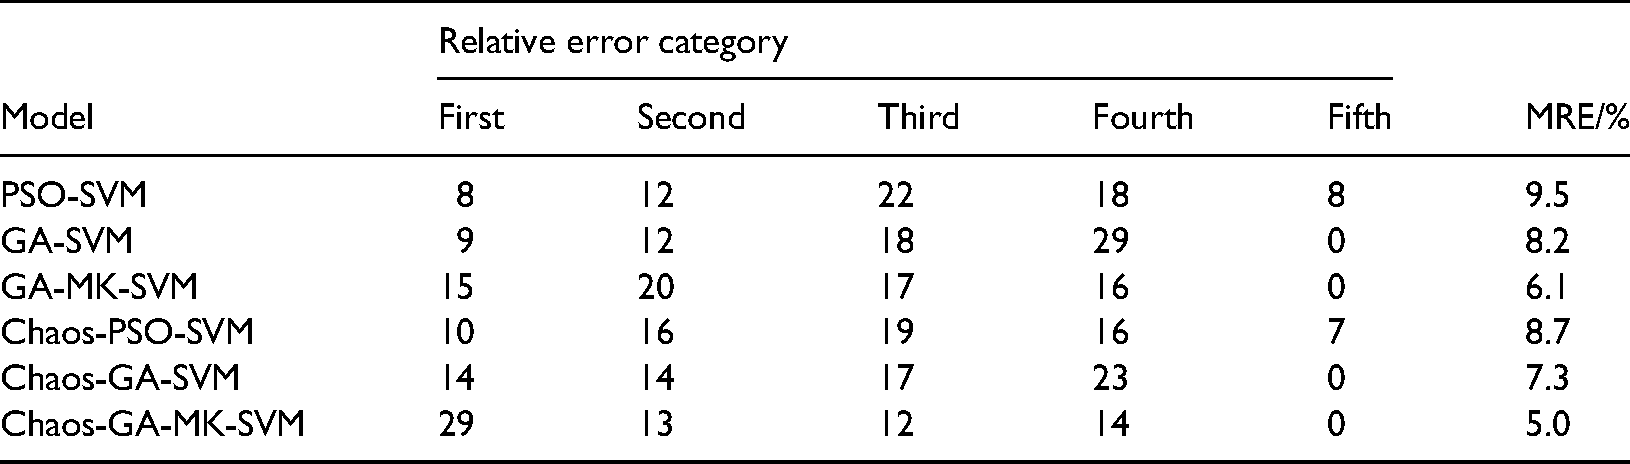
The following conclusions can generally be drawn in the prediction of the active period: the GA algorithm is better than the PSO algorithm, the MK-SVM model performs better than the SVM model, and chaos theory can improve the accuracy of the model. The Chaos-GA-MK-SVM model is the best prediction model among the six prediction models, demonstrating an MRE of 5.0; in addition, the four-period prediction results are valuable, and the one-period accuracy is poor (a total of six periods). Moreover, the overall prediction accuracy of the active period was low, and the four-period prediction results were valuable.
Accuracy assessment of prediction in the stability period
The distribution of the relative errors between the observed data and predicted results in the Gubei 1312(1) SL is shown in Table 4. The table reveals that the MRE of GA-SVM was improved by 0.2% compared with that of PSO-SVM, and GA-MK-SVM was improved by 1.8% compared with that of GA-SVM. Considering the model improved by chaos theory, the MREs of Chaos-PSO-SVM, Chaos-GA-SVM, and Chaos-GA-MK-SVM were improved by 4.6%, 4.3%, and 3.2%, respectively, compared with the unimproved model.
Relative error distribution of six prediction models in the Xieqiao 2111(3) IL.
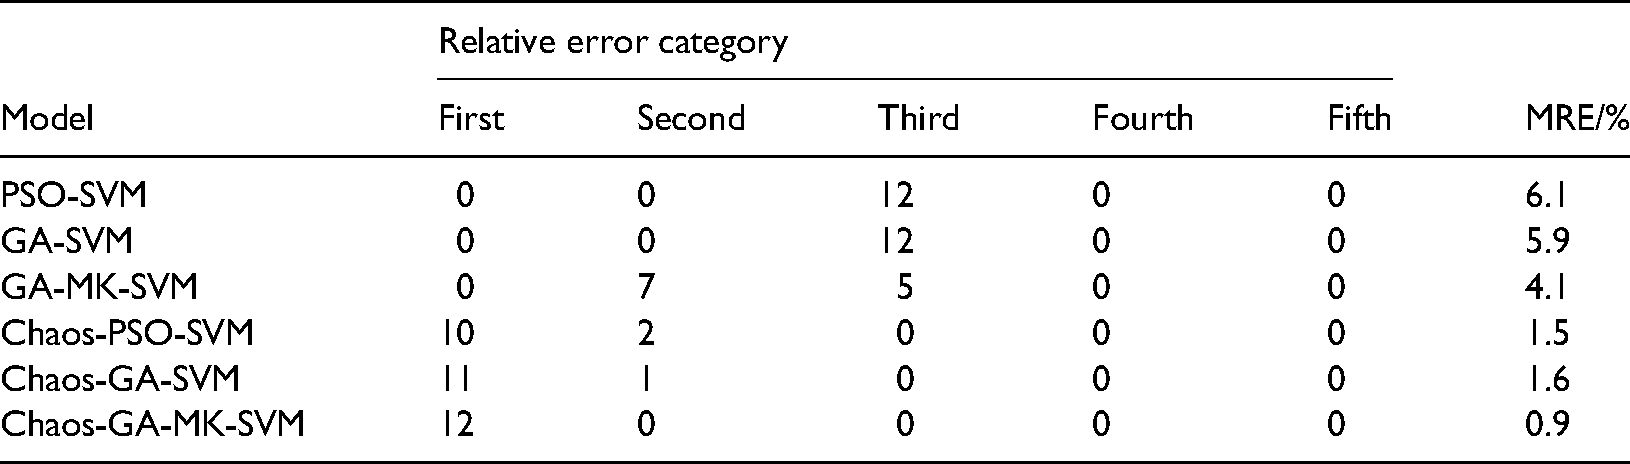
Overall, the following conclusions can be drawn in the prediction of the stability period: the GA algorithm is as good as the PSO algorithm, the MK-SVM model has a better performance than the SVM model, and chaos theory can improve the model accuracy. The Chaos-GA-MK-SVM model is the best among the six prediction models, with an MRE of 0.9. In addition, the overall prediction accuracy of the stability period was high, and the predicted results for all periods were valuable.
Discussion
Complete GSM point training data are utilized in the above-mentioned experiments. However, the suitability of the Chaos-GA-MK-SVM model for extracting the GSM information using the missing GSM point training data should be determined (i.e. the generalization of the proposed model should be verified). In addition, the lack of GSM data will generally affect the accuracy of the GSM information extraction (i.e. the application of the proposed model should also be verified). The two issues are discussed in this section.
Generalization of the model
ML is a data-driven approach, and the number of data significantly affects its accuracy. However, in practical engineering applications, GSM points are usually destroyed and missing, resulting in a reduction in the amount of data. The contradictory point lies in the accurate extraction of the GSM information by the proposed model in the absence of data.
The prediction process of the Xieqiao 2111(3) SL is shown in Figure 8. This figure reveals that the blue points (subsidence of smaller than 2200 mm) and the red points (subsidence of larger than 2200 mm) are the training and testing sets, respectively. The Xieqiao 2111(3) SL has a severe data loss at the left GSM point.
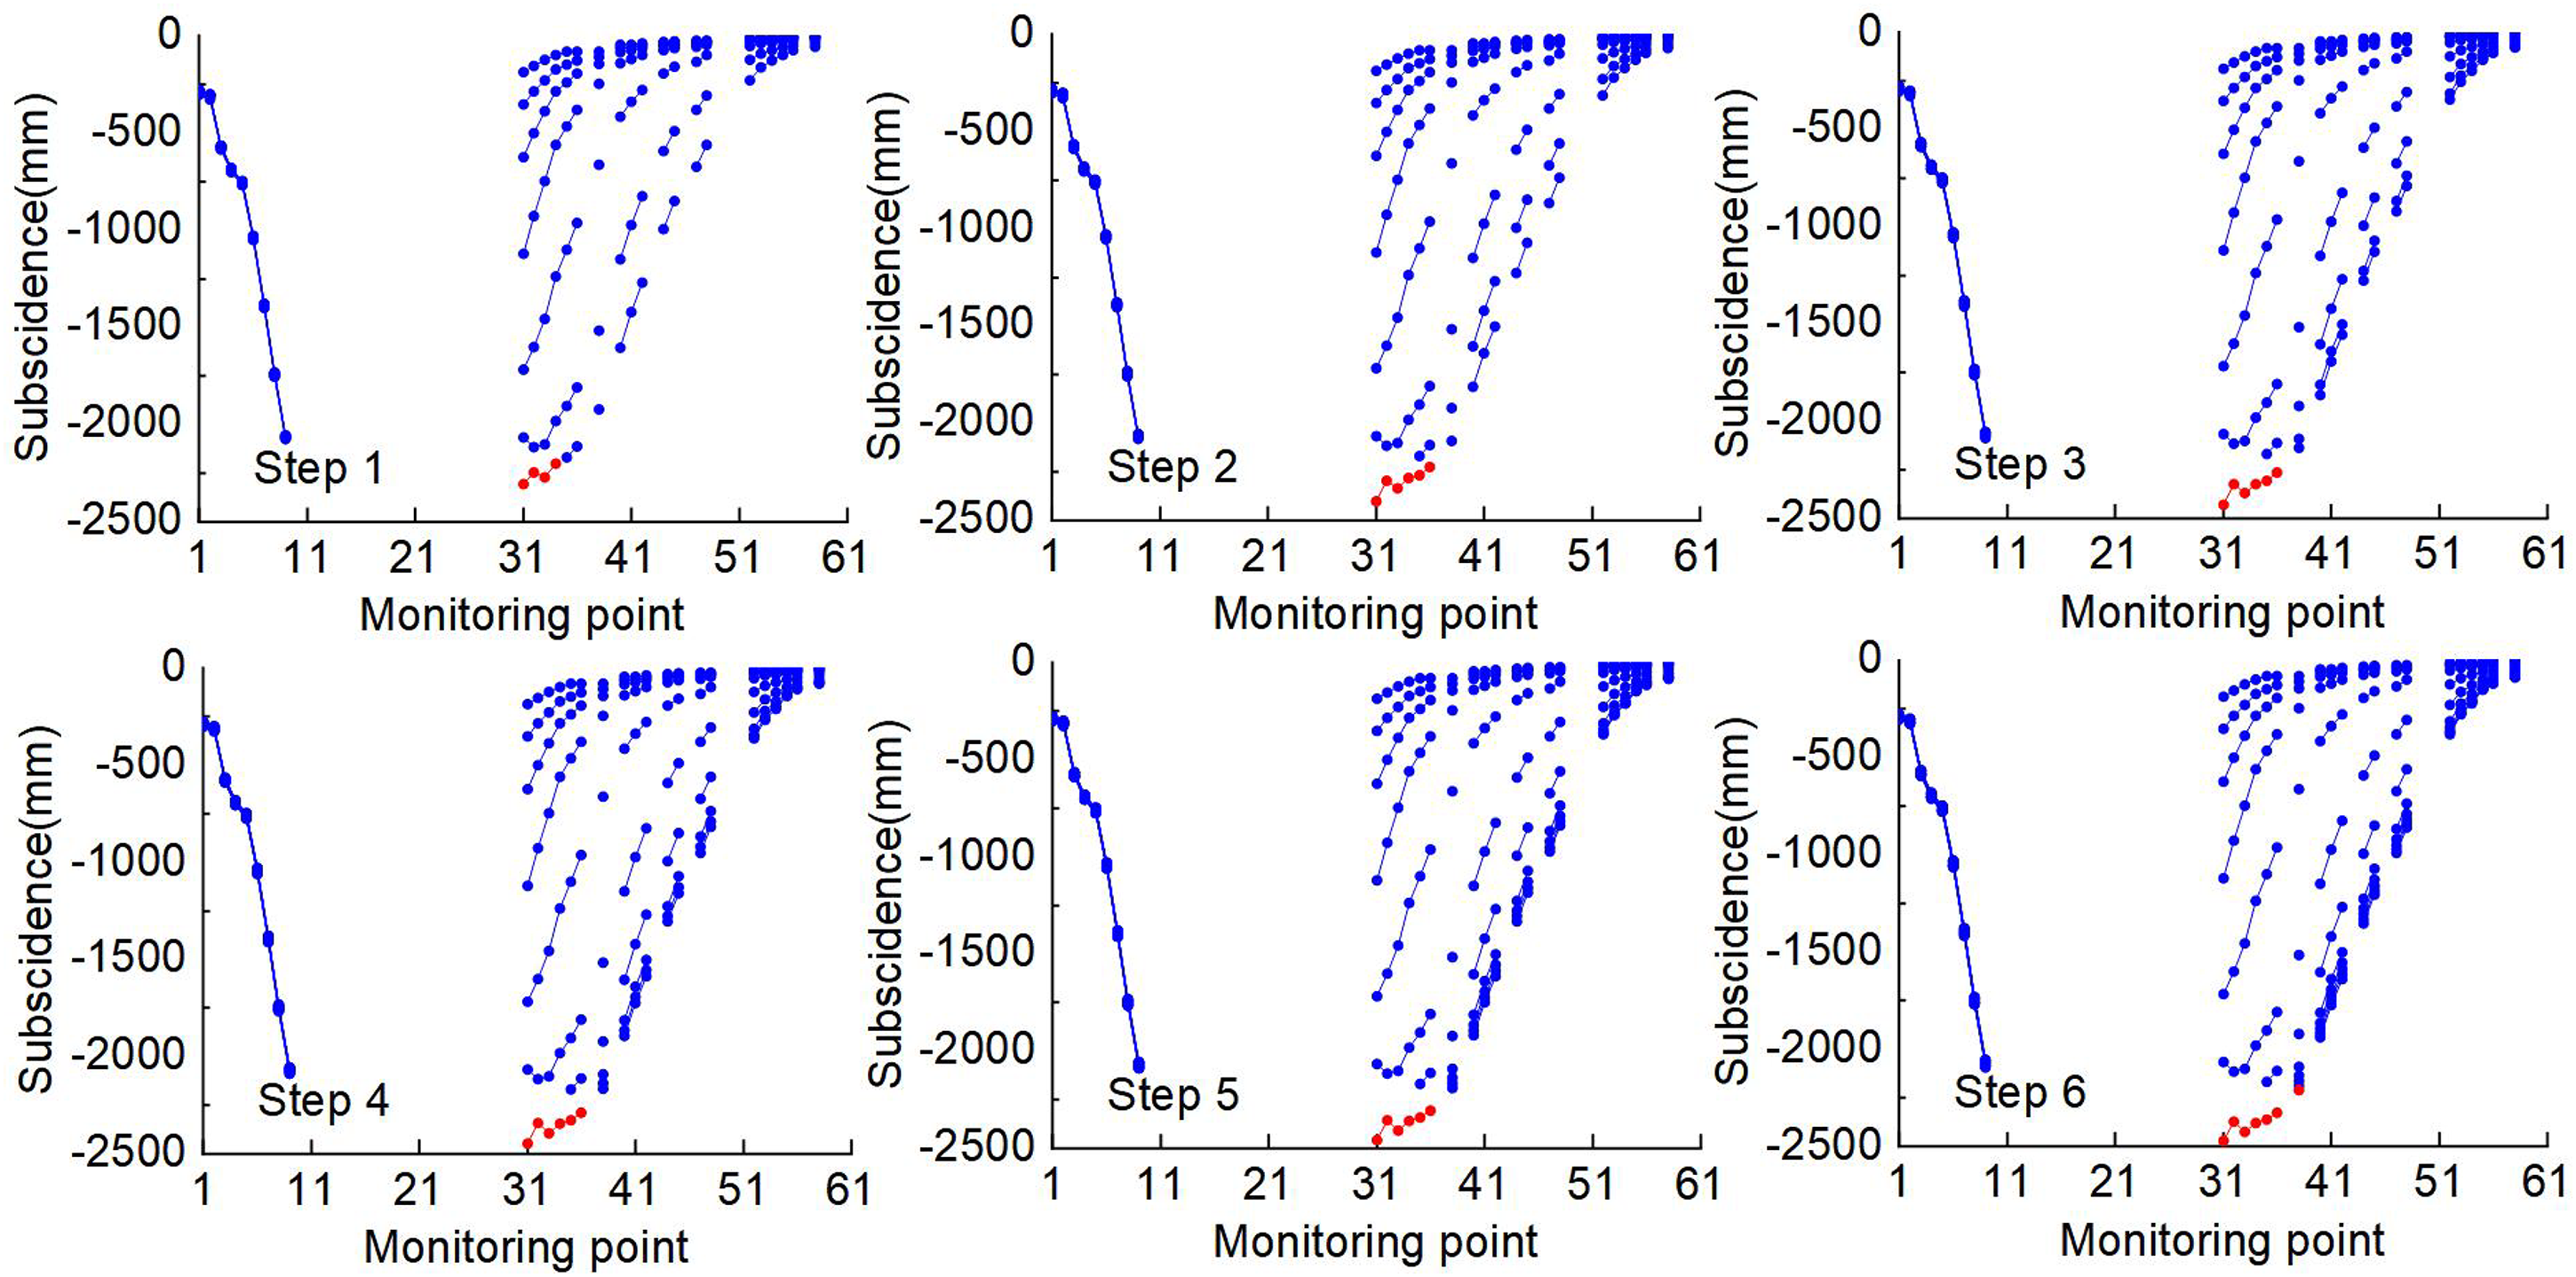
Xieqiao 2111(3) SL prediction process diagram.
The distribution of the relative errors between the observed data and predicted results in the Xieqiao 2111(3) SL is shown in Table 5. The table reveals that the MRE of GA-SVM was improved by 0.5% in comparison to PSO-SVM, and GA-MK-SVM was reduced by 6.2% in comparison to GA-SVM. Considering the model improved by chaos theory, the MREs of Chaos-PSO-SVM, Chaos-GA-SVM, and Chaos-GA-MK-SVM were reduced by 0.8%, 0.7%, and 1.1%, respectively, in comparison to the unimproved model.
Relative error distribution of six prediction models in Xieqiao 2111(3) SL.
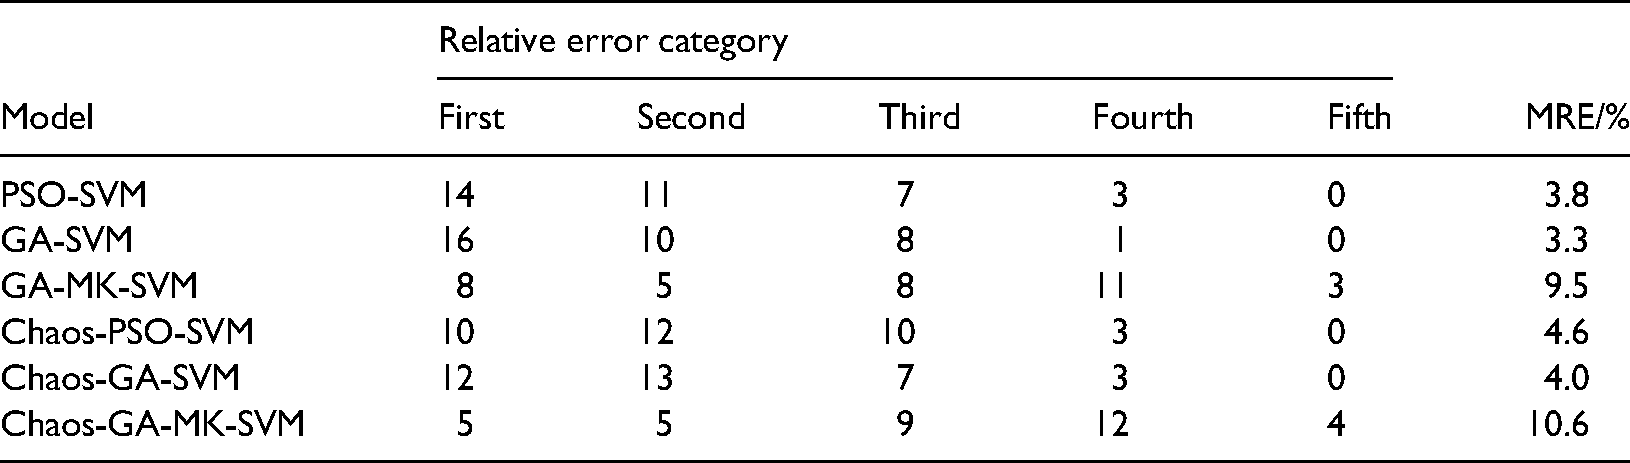
Overall, in the prediction using incomplete data, the GA algorithm is better than the PSO algorithm, the SVM model performs better than the MK-SVM model, and chaos theory cannot improve the accuracy of the model. The Chaos-GA-MK-SVM model is the worst prediction model among the six prediction models, revealing an MRE of 10.6 because the Chaos-GA-MK-SVM model is easy to overfit. The GA-SVM is the best model, which has an MRE of 3.3, and the lack of GSM data will not affect the accuracy of GSM information extraction (SVM is suitable for a small training set). Therefore, the predicted results for all periods are valuable.
Model application
This section first summarizes the application of the proposed model in practical engineering projects and then discusses some limitations of the Chaos-GA-MK-SVM model. A series of contrast experiments were conducted to demonstrate the accuracy and applicability of the six different models. The predicted applicability of the six models is listed in Table 6.
Predicted applicability of the six models.
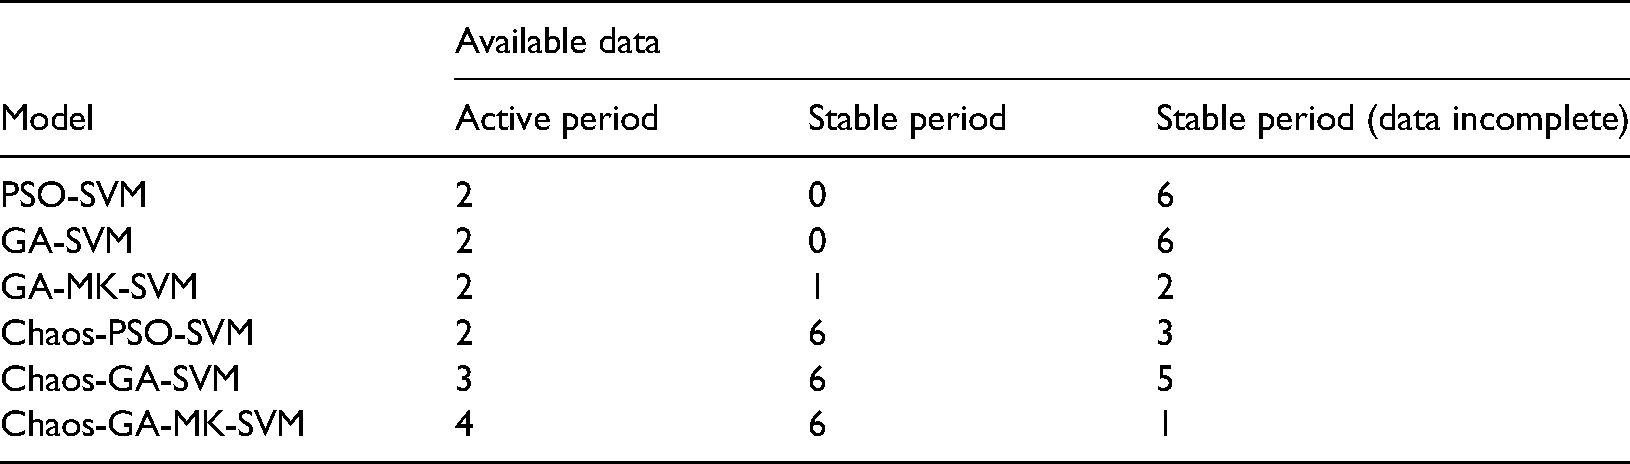
Table 6 shows that the Chaos-GA-MK-SVM model should be applied using complete training data, with four and six periods that are valuable during the active and stable periods, respectively. The GA-SVM model was applied using incomplete training data, with six valuable periods during the stable period.
The Chaos-GA-MK-SVM model has certain shortcomings. 1) This model is easy to overfit using incomplete training data. 2) The Chaos-GA-MK-SVM model predicts GSM points during the active period, but only four periods can be used.
Conclusions
This study was aimed at accurately extracting information from GSM points submerged by water in a high groundwater mining area. A Chaos-GA-MK-SVM prediction model was proposed, and its performance tested was during the active and stability periods. Finally, the anti-jamming capability of the algorithm against missing GSM points was verified. The detailed conclusions are as follows.
The active mining area experiment showed that Chaos-GA-MK-SVM is the best prediction model, with an MRE of 5.0, and four predicted periods are valuable (from a total of six periods). The accuracy of the proposed model was improved by 1.1% in comparison to that of the GA-MK-SVM. In addition, GA-MK-SVM was improved by 2.1% in comparison to GA-SVM. The stability mining area experiment showed that Chaos-GA-MK-SVM is the best prediction model, with an MRE of 0.9, and all predicted periods are valuable. The accuracy of the proposed model was 3.2% higher than that of the GA-MK-SVM. In addition, GA-MK-SVM was improved by 1.8% compared with GA-SVM. In mining areas with missing data, the experiment showed that Chaos-GA-MK-SVM is easy to overfit. GA-SVM is the best prediction model, with an MRE of 3.3, and all predicted periods are valuable. Therefore, the Chaos-GA-MK-SVM and GA-SVM models should be applied using complete and incomplete training data, respectively. The chaos theory improved the accuracy of the ML model, ignoring the domain knowledge of the randomness and irregularity of the GSM points. A regular trajectory was generated using the phase space reconstruction method, and an irregular time-series was then predicted. The MRE of the proposed model was improved by 1.1% and 3.2% compared with the unimproved GA-MK-SVM in the active and stability periods, respectively. The results of this study provide an innovative approach to the study of mining subsidence laws in high groundwater mines and a reference for the acquisition of GSM point information.
Footnotes
Declaration of conflicting interests
The author(s) declared no potential conflicts of interest with respect to the research, authorship, and/or publication of this article.
Funding
The author(s) disclosed receipt of the following financial support for the research, authorship, and/or publication of this article: This work was supported by “Anhui Province Natural Science Foundation (2208085QD115)”, “Key Natural Science Projects of Anhui Provincial Department of Education (KJ2020A0311, KJ2021A0422)”, “Open Fund Project of Coal Industry Engineering Research Center of Mining Area Environmental And Disaster Cooperative Monitoring in 2020 (KSXTJC202005)”, “Key Research and Development Projects of Anhui Province (202104a07020014)”, “Major Special Projects of Science and Technology in Anhui Province (202103a05020026)”, and “Introduction of Talent Research Startup Fund Project of Anhui University of Science and Technology”.