
Abstract
The hydrate reservoir in the Shenhu Area of the South China Sea is a typical clayey-silt porous media with high clay mineral content and poor cementation, in which gas hydrate formation and dissociation characteristics are unclear. In this study, the CO2 hydrate saturation, growth rate, and permeability were studied in sandstone, artificial samples, and clayey-silt sediments using a custom-built measurement apparatus based on the low-field NMR technique. Results show that the T2 spectra amplitudes decrease with the hydrate formation and increase with the dissociation process. For the artificial samples and Shenhu sediments, the CO2 hydrate occupies larger pores first and the homogeneity of the sandstone pores becomes poor. Meanwhile, compared with the clayey-silt sediments, CO2 hydrate is easier to form and with higher hydrate saturation for the sandstone and artificial samples. In hydrate dissociation process, there exists a protection mechanism, i.e. the dissociation near the center of hydrates grain is suppressed when gas pressure drops suddenly and quickly. For permeability of those samples, it decreased with hydrate forms, and increases with hydrate dissociation. Meanwhile, with the same hydrate saturation, permeability is higher in hydrate formation than in dissociation.
Introduction
Natural gas hydrates (NGHs), composed of water and natural gas, are solid clathrate compounds found under relatively high-pressure and low-temperature conditions, such as sub-marine sediments and underneath permafrost ( Klauda and Sandler, 2005; Makogon et al., 2007; Sun et al., 2018 ). The estimated global in place (GIP) of natural gas hydrate gas is on the order of 1015 to 1018 m3, which is almost twice as much as the world’s proven conventional fossil energy reserves (Lerche and Bagirov, 2004; Li et al., 2016; Sloan and Koh, 2007). Therefore, NGHs are believed to be a strategic energy resource with the potential of replacing conventional natural gas in the 21st century.
The China Geological Survey (CGS) performed the first production test on an NGH-bearing silty clay formation in the target Shenhu Area of South China Sea (SCS) in 2017 (Li et al., 2018). Compared to the NGHs in sandstone reservoirs with relatively high permeability (more than 100 mD) and saturation (about 70%) in Japan (generally coarse sand reservoir) and the USA (conglomerate reservoir), the mean median grain size of the sediments is about 12 μm in the NGH reservoir of the Shenhu Area, which leads to low permeability (2–5 mD) and saturation (about 33%) (Li et al., 2018; Ye et al., 2018). Moreover, the high clay mineral content (26%–30%), which is made up mostly of montmorillonite and illite, results in high bound water concentration of more than 65%. To summarize, the hydrate reservoir in the Shenhu Area of the SCS is mainly composed of fine-grained clay silt with low permeability and low NGH saturation, making exploitation and development difficult.
Numerous laboratory NGH formation and dissociation experiments have been conducted to study the permeability (Johnson et al., 2011; Komai et al., 2009; Kumar et al., 2010), the triaxial compressive properties (Miyazaki et al., 2010), and the electrical properties (Li et al., 2012a) of gas hydrate-bearing sediments. However, these experiments are commonly carried out using glass beads, silica sand, sandstone, or various clay minerals (Sun et al., 2015; Yan et al., 2019; Zhou et al., 2008), which are far from natural sediment properties. According to Hyndman and Davis (1992), gas hydrates beneath the seafloor display a wide range of growth habits and distribution within the host sediment (Booth et al., 1996; Ginsburg and Soloviev, 1994). Therefore, it is necessary to perform hydrate formation and dissociation experiments in silt-clay sediments of the Shenhu Area.
In addition, temperature, pressure, and resistivity measurements have been taken to detect the transition of water and methane to the solid phase in order to monitor and model the formation and dissociation processes of NGHs. (Li et al., 2012b; Linga et al., 2009). A number of kinetic studies have been conducted on NGHs where the gas pressure is measured in high-pressure hermetic vessels during hydrate formation and dissociation. (Englezos and Bishnoi, 1988; Katipot et al., 2019; Mekala et al., 2014). Moreover, during the process of gas hydrate formation or dissociation, the resistivity was measured providing insights into conductance changes (Buffett and Zatsepina, 2000). However, sensors installed in the samples causes heterogeneity in the sediments. The intrusion of sensors might lead to uneven nucleation resulting from irregular cooling at the metal boundary of sensors with high thermal conductivity (Linga et al., 2009). Therefore, non-intrusive methods for detecting and modeling NGH characteristics should be encouraged. In recent years, X-ray Computed Tomography (X-CT) has provided a visual technique to depict the spatial distribution of different phases of gas, water, and hydrate phases with different densities (Ai et al., 2017; Kneafsey and Moridis, 2014; Seol and Kneafsey, 2009). However, current X-CT technology is not suitable for rapid measurements in the initial periods of hydrate formation as it requires several hours to obtain high-resolution X-CT images.
Low field nuclear magnetic resonance (NMR) provides a fast, easy, and non-destructive way of detecting hydrogen-bearing fluids. The low field NMR method was used to determine petrophysical characteristics of conventional and unconventional porous media in oil and gas fields, such as porosity, pore geometry, pore connectivity, permeability, and even the saturation of fluids in reservoirs (Liu et al., 2019; Sun et al., 2016; Timur, 1969, 1972). With this in mind, the NMR technique was applied to monitor the dynamic behavior of CO2 hydrate formation and dissociation as well as permeability changes in silt-clay sediments with a series of transverse relaxation time (T2) measurements. In this study, gas hydrate formation and dissociation processes as well as reservoir properties were studied through time using the configurations of T2 spectra distribution changes of the water in the sediments. This process allows for the quantitative evaluation of the gas formation rate, saturation, and permeability at different hydrate saturations, which is applicable for modeling formation and dissociation characteristics of NGHs and successful production operation in the SCS.
Theory of NMR measurement
The NMR used in the petroleum and natural gas industry is tuned to describe the response of the protons within the hydrogen nucleus to an applied magnetic field. Hence, the NMR measurements provide a unique look at the interactions of hydrogen bearing fluids and the characterization of the pores within reservoir rock (Howard et al., 1993; Kenyon et al.,1988). T2 acts as a sensitive indicator to proton response to the applied magnetic field, which is defined by three relaxation mechanisms in rocks: (1) molecular motion in fluids (bulk relaxation), (2) surface relaxivity at the pore wall (surface relaxation), and (3) molecular diffusion in the internal gradients (diffusion relaxation). This can be described as

In addition, NMR measurement responses are associated with not only the status of the fluid (oil, gas, and water) but also the hydrogen content. The quantity of 1H atoms detected by NMR is proportional to the total amplitude of T2 spectra, thus the water content within pores can be obtained from T2 spectra. In this study, the 1H atoms in water molecules are the measurement target. As solid and liquid phase are two different forms of water, the response of the NMR measurements is different as well. After the water molecules freeze, the relaxation speed of 1H becomes so fast that it cannot be detected by the low-field NMR instrument. Thus, the principle for 1H atom in hydrate showing no signal is the same as that of ice. In this study, the total amplitude of T2 was used for quantitative analysis of the water during the formation and dissociation processes of the hydrate.
Equipment and methods
Experimental equipment and procedure
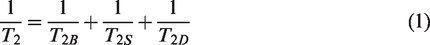
Figure 1 shows a schematic of the design setup used to conduct the in-situ hydrate formation and dissociation experiments. The experimental apparatus system comprises an NMR spectrometer, a core holder, an upstream gas supply system, an upstream water supply system, circulation and refrigeration confining systems, a back-pressure system, and a data acquisition system (Figure 1). The main unit of the apparatus system is the high-pressure thermostatic core holder, which is designed for holding hydrate-containing specimens or sample cell. The core holder is specially designed using nonmetallic and nonmagnetic material. The liquid and gas supply systems pump water and gas to the samples at a constant velocity and pressure, respectively. The confining systems consist of a cooling bath and high-pressure circulating pump for cooling and circulation of fluorinated liquid (confining liquid). The back-pressure system connected to the core holder outlet includes a pressure transducer, a regulator controlled by a pump, and a wet gas flowmeter, which is used to obtain the gas flow rate during permeability measurements.
Schematic diagram of the experimental setup.
Sample preparation and experimental procedure
In this study, three kinds of porous media with different pore size distributions and pore structure were used to study their T2 spectra responses in the gas hydrate formation and dissociation processes. The first sample is a well-consolidated sandstone with a length of 5 cm, a diameter of 2.54 cm, and a porosity of 22.6%. The second sample is an unconsolidated artificial sample consisting of fine sands and clays with grain diameters ranging from 70 to 500 μm. The third sample is a fresh unconsolidated clayey-silt sediment collected from the SCS.
The sandstone sample was polished and cleaned to remove reservoir fluids and drilling mud and then dried for 24 hours at a temperature of 80 °C. For the artificial sample, the sample was dried in a vacuum-oven at 80 °C for six hours then packed into a sample cell. Using the dried sample weight and density, the porosity was quantified and found to be 30%. The sandstone and artificial samples were saturated with distilled water. The clayey-silt sediments were obtained from the Shenhu Area. To prevent the evaporation of water, the fresh samples were carefully packaged in plastic sheeting during transportation. With the T2 spectra measurement, the porosity of the clayey-silt sediments was found to be 38%. For the unconsolidated sediments, they were put into a special made poly-Teflon sample cell for the NMR measurement.
Using the specially designed apparatus, we performed hydrate formation and dissociation experiments with parallel, real-time T2 measurements during each process. In the experimental procedure, the samples were placed into a thermoplastic sleeve and inserted into the holding chamber. Then, fluorinated liquid was injected into the space between the sleeve and the chamber to compress the sample. When the confining pressure stabilized, the cooling bath was switched on to decrease and keep the experiment temperature at 4 °C. The samples were subjected to vacuum to -0.1 MPa, and then the CO2 was injected with low pressure to keep water from being displaced. The T2 spectra were measured from the start of CO2 gas injection until the end of the formation process, when the changes of two adjacent T2 were negligible. Meanwhile, the visual images of samples were obtained using an MRI technique. The NMR spectrometer, manufactured by Niumag Corporation Ltd., China, has a 60 mm diameter magnet coil and a frequency of 23.15 MHz.
Results and discussion
The formation of hydrate
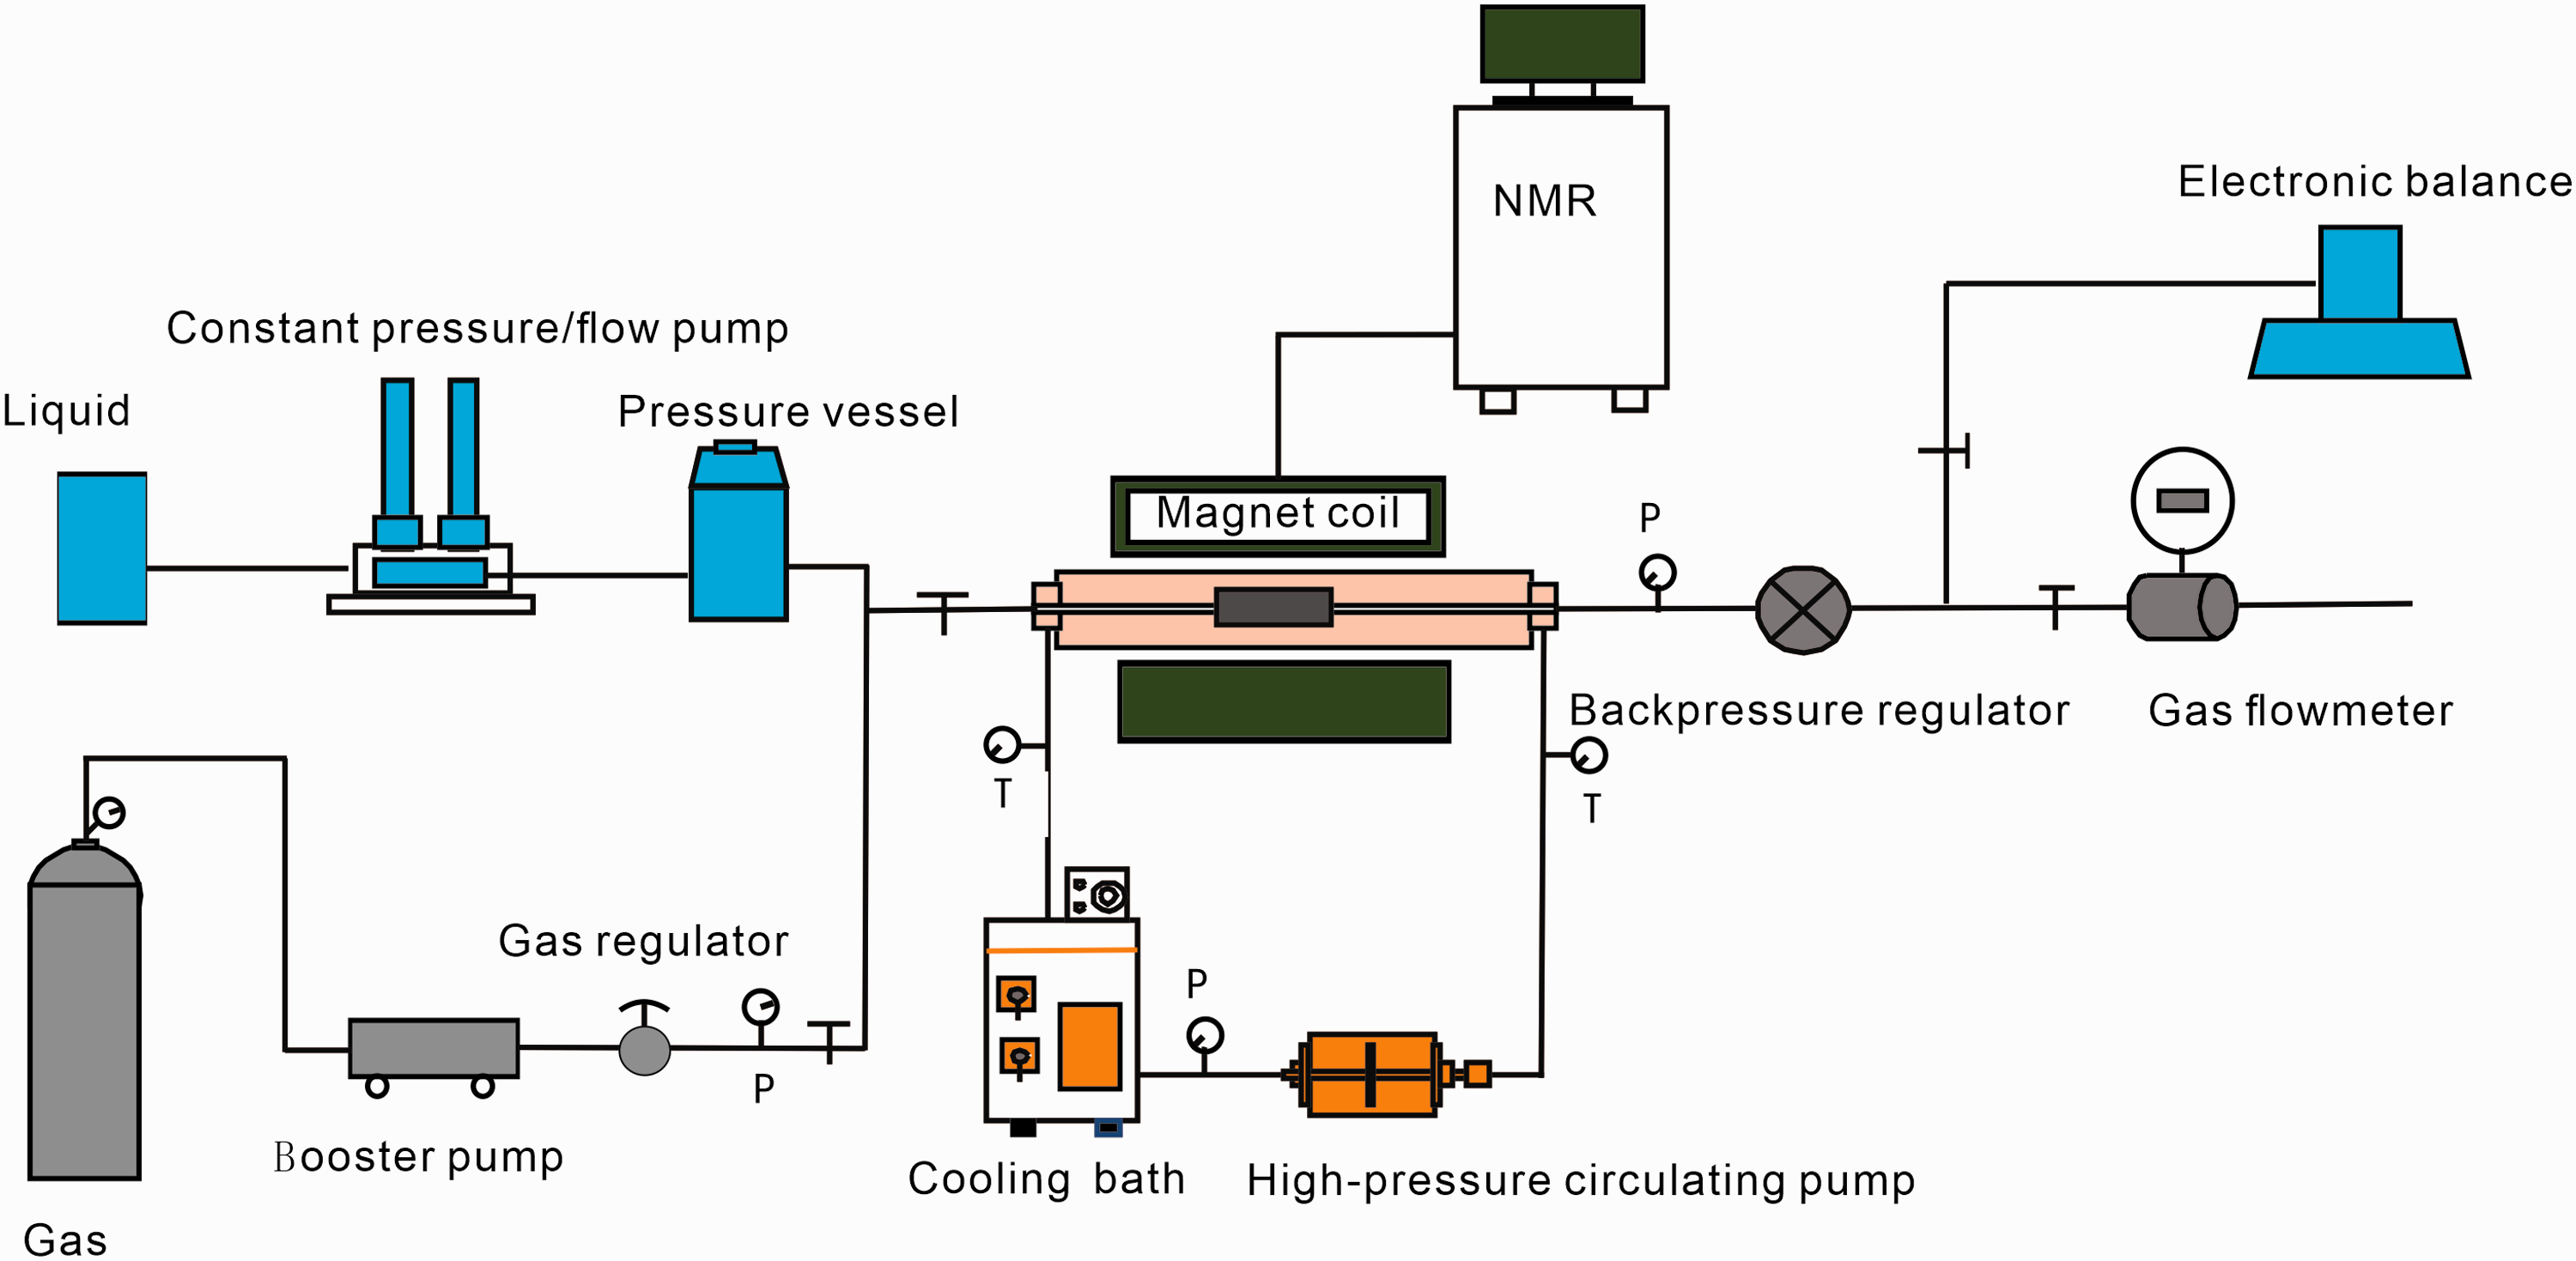
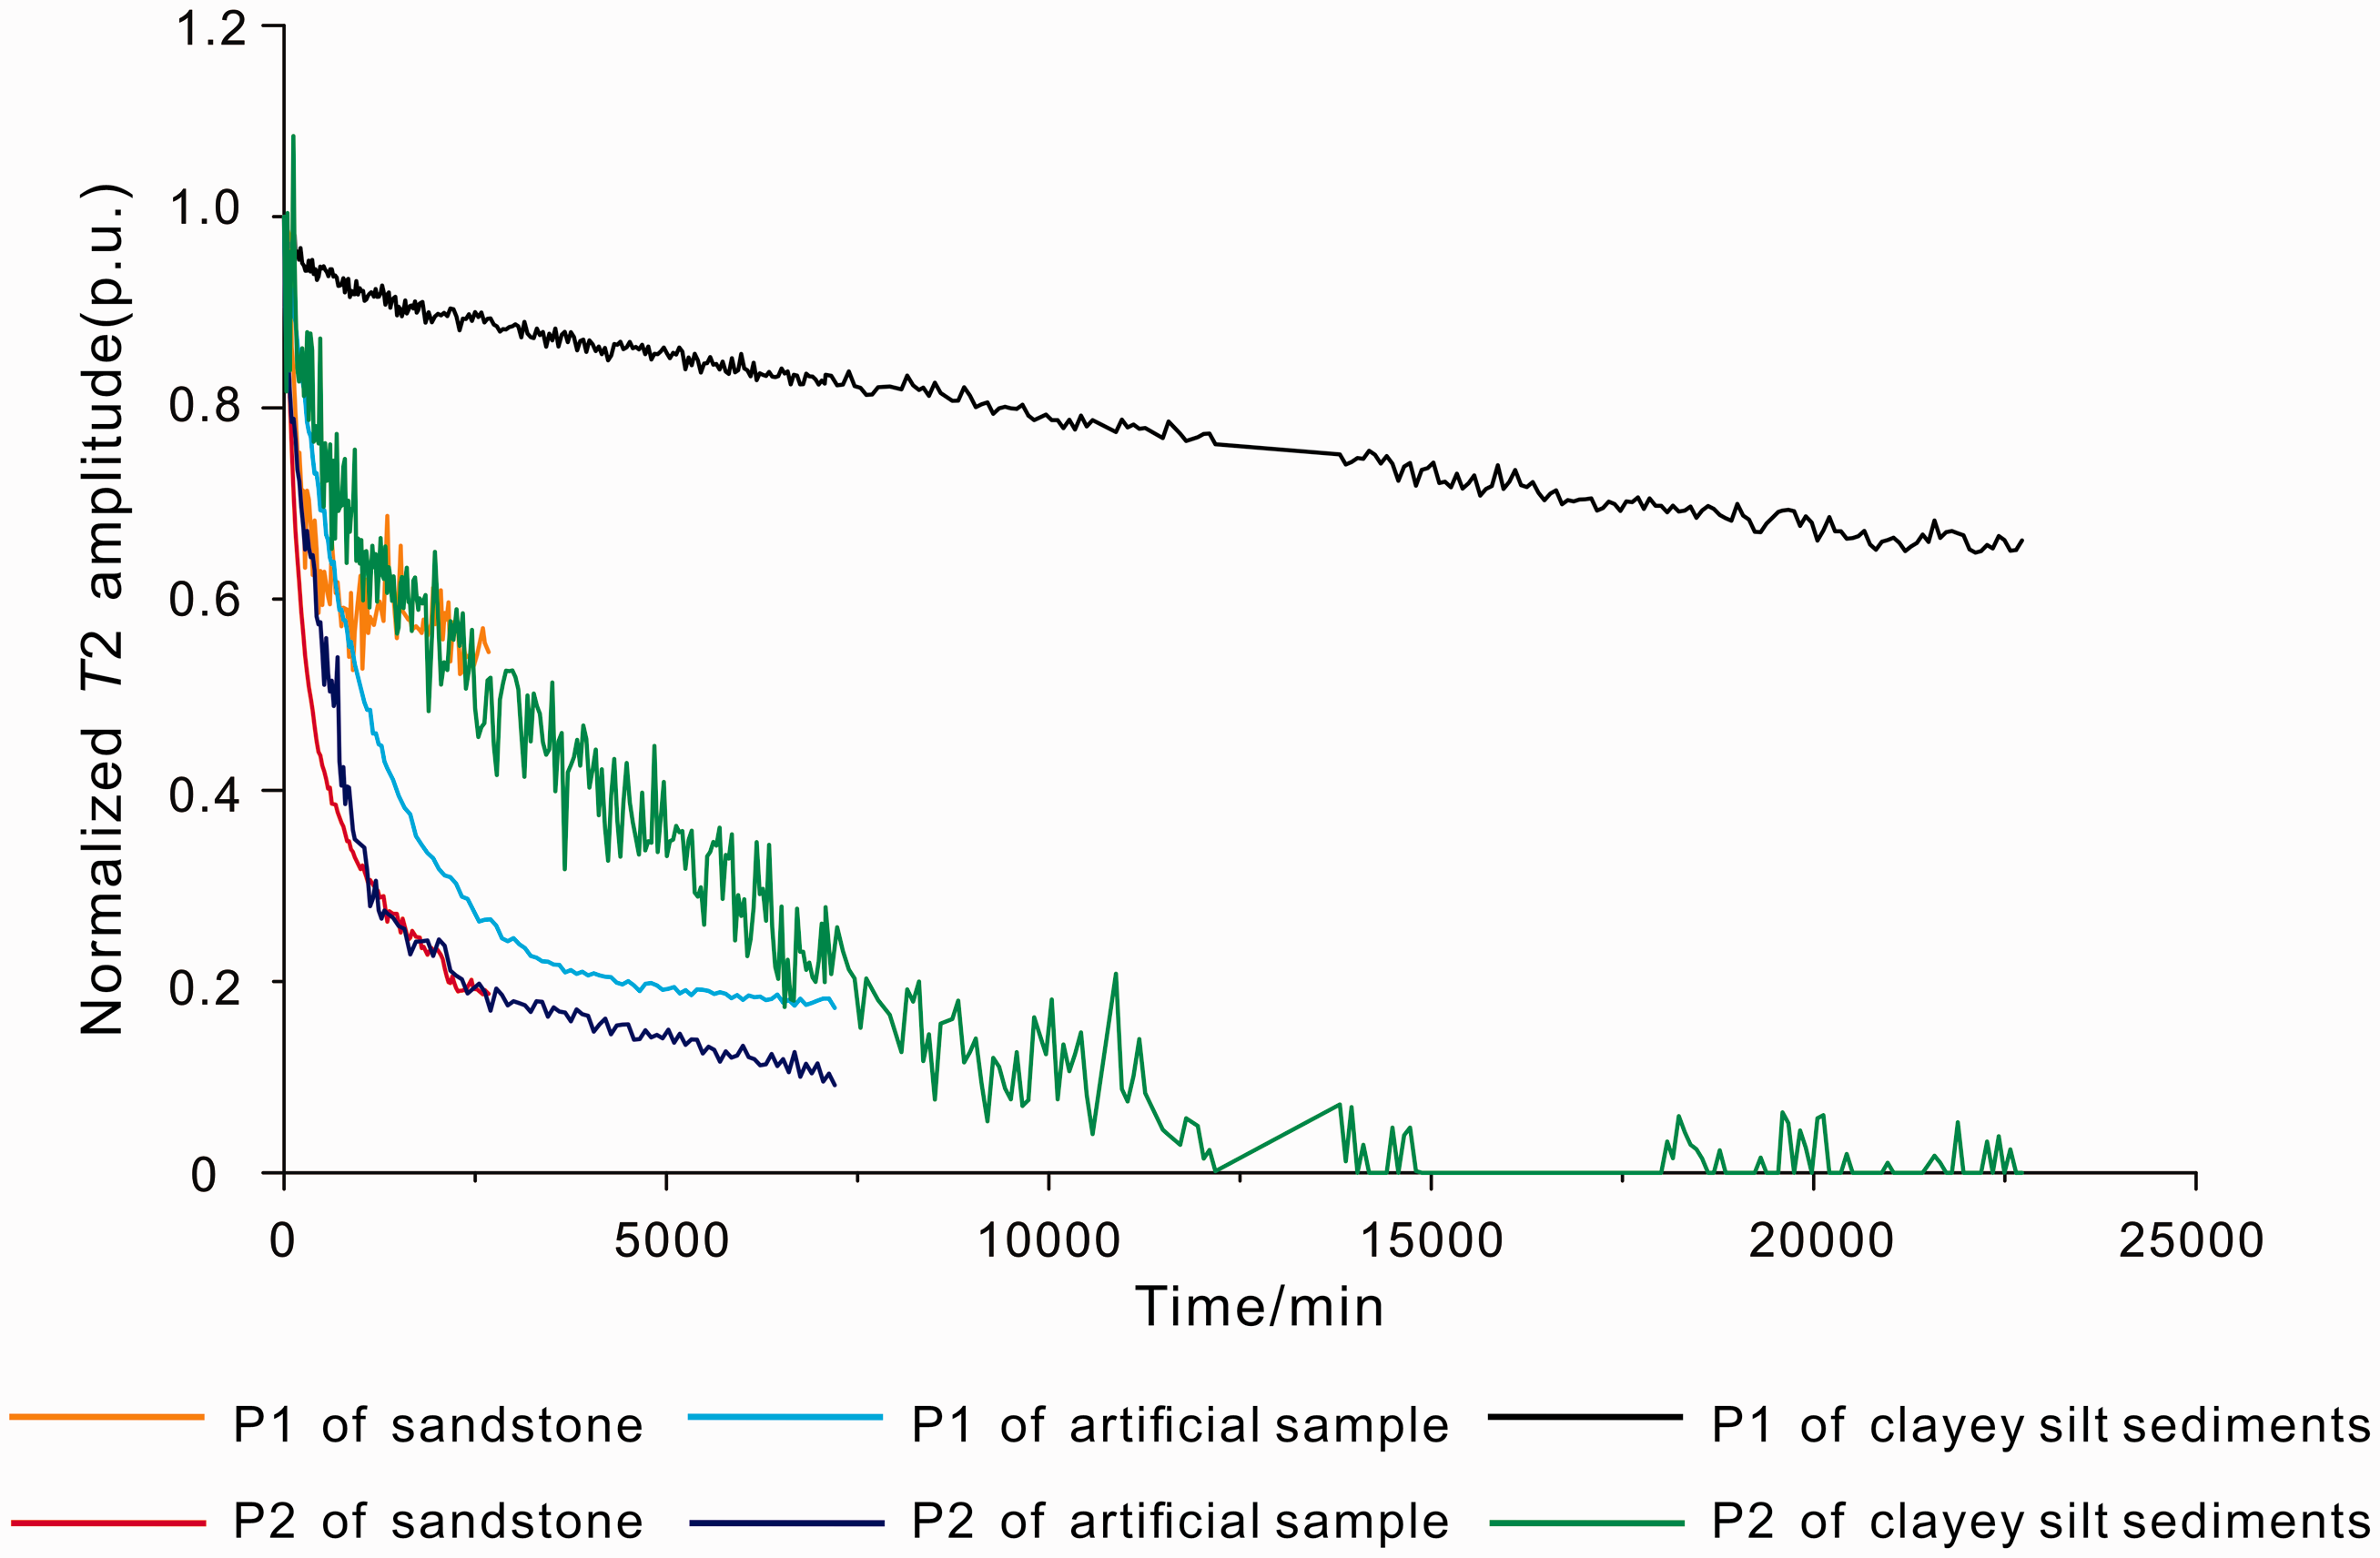
The T2 spectra of samples were measured before the CO2 hydrate formation. As shown in Figure 2, there are three distinct peaks for the samples: the left peak (P1) centered at 0.1–10 ms, the middle peak (P2) at approximately 10–100 ms, and the right peak (P3) at > 100 ms. The configurations of the T2 spectra distributions represent the pore size distribution, with smaller pores having a shorter relaxation time, and a longer relaxation time for larger pores (Yao et al., 2019). Generally, the P3 peaks represent the bulk water content in the corner and surface of the samples. Thus, the “bulk water” peak is unimportant in our research. For the artificial sample that consists of fine sand and clay, it shows three unique peaks resulting from the large pores between the fine sand and the micropores mainly distributed in the clay. For the clayey-silt sediments, the micropores are uniform in size; thus, the T2 spectrum shows a narrow P1 peak centering at small relaxation time. Meanwhile, the P2 peak near 100 ms corresponds to the large pores in the clayey-silt sediments, which is a small proportion of the total pore space.
T2 spectra of different water-saturated samples.
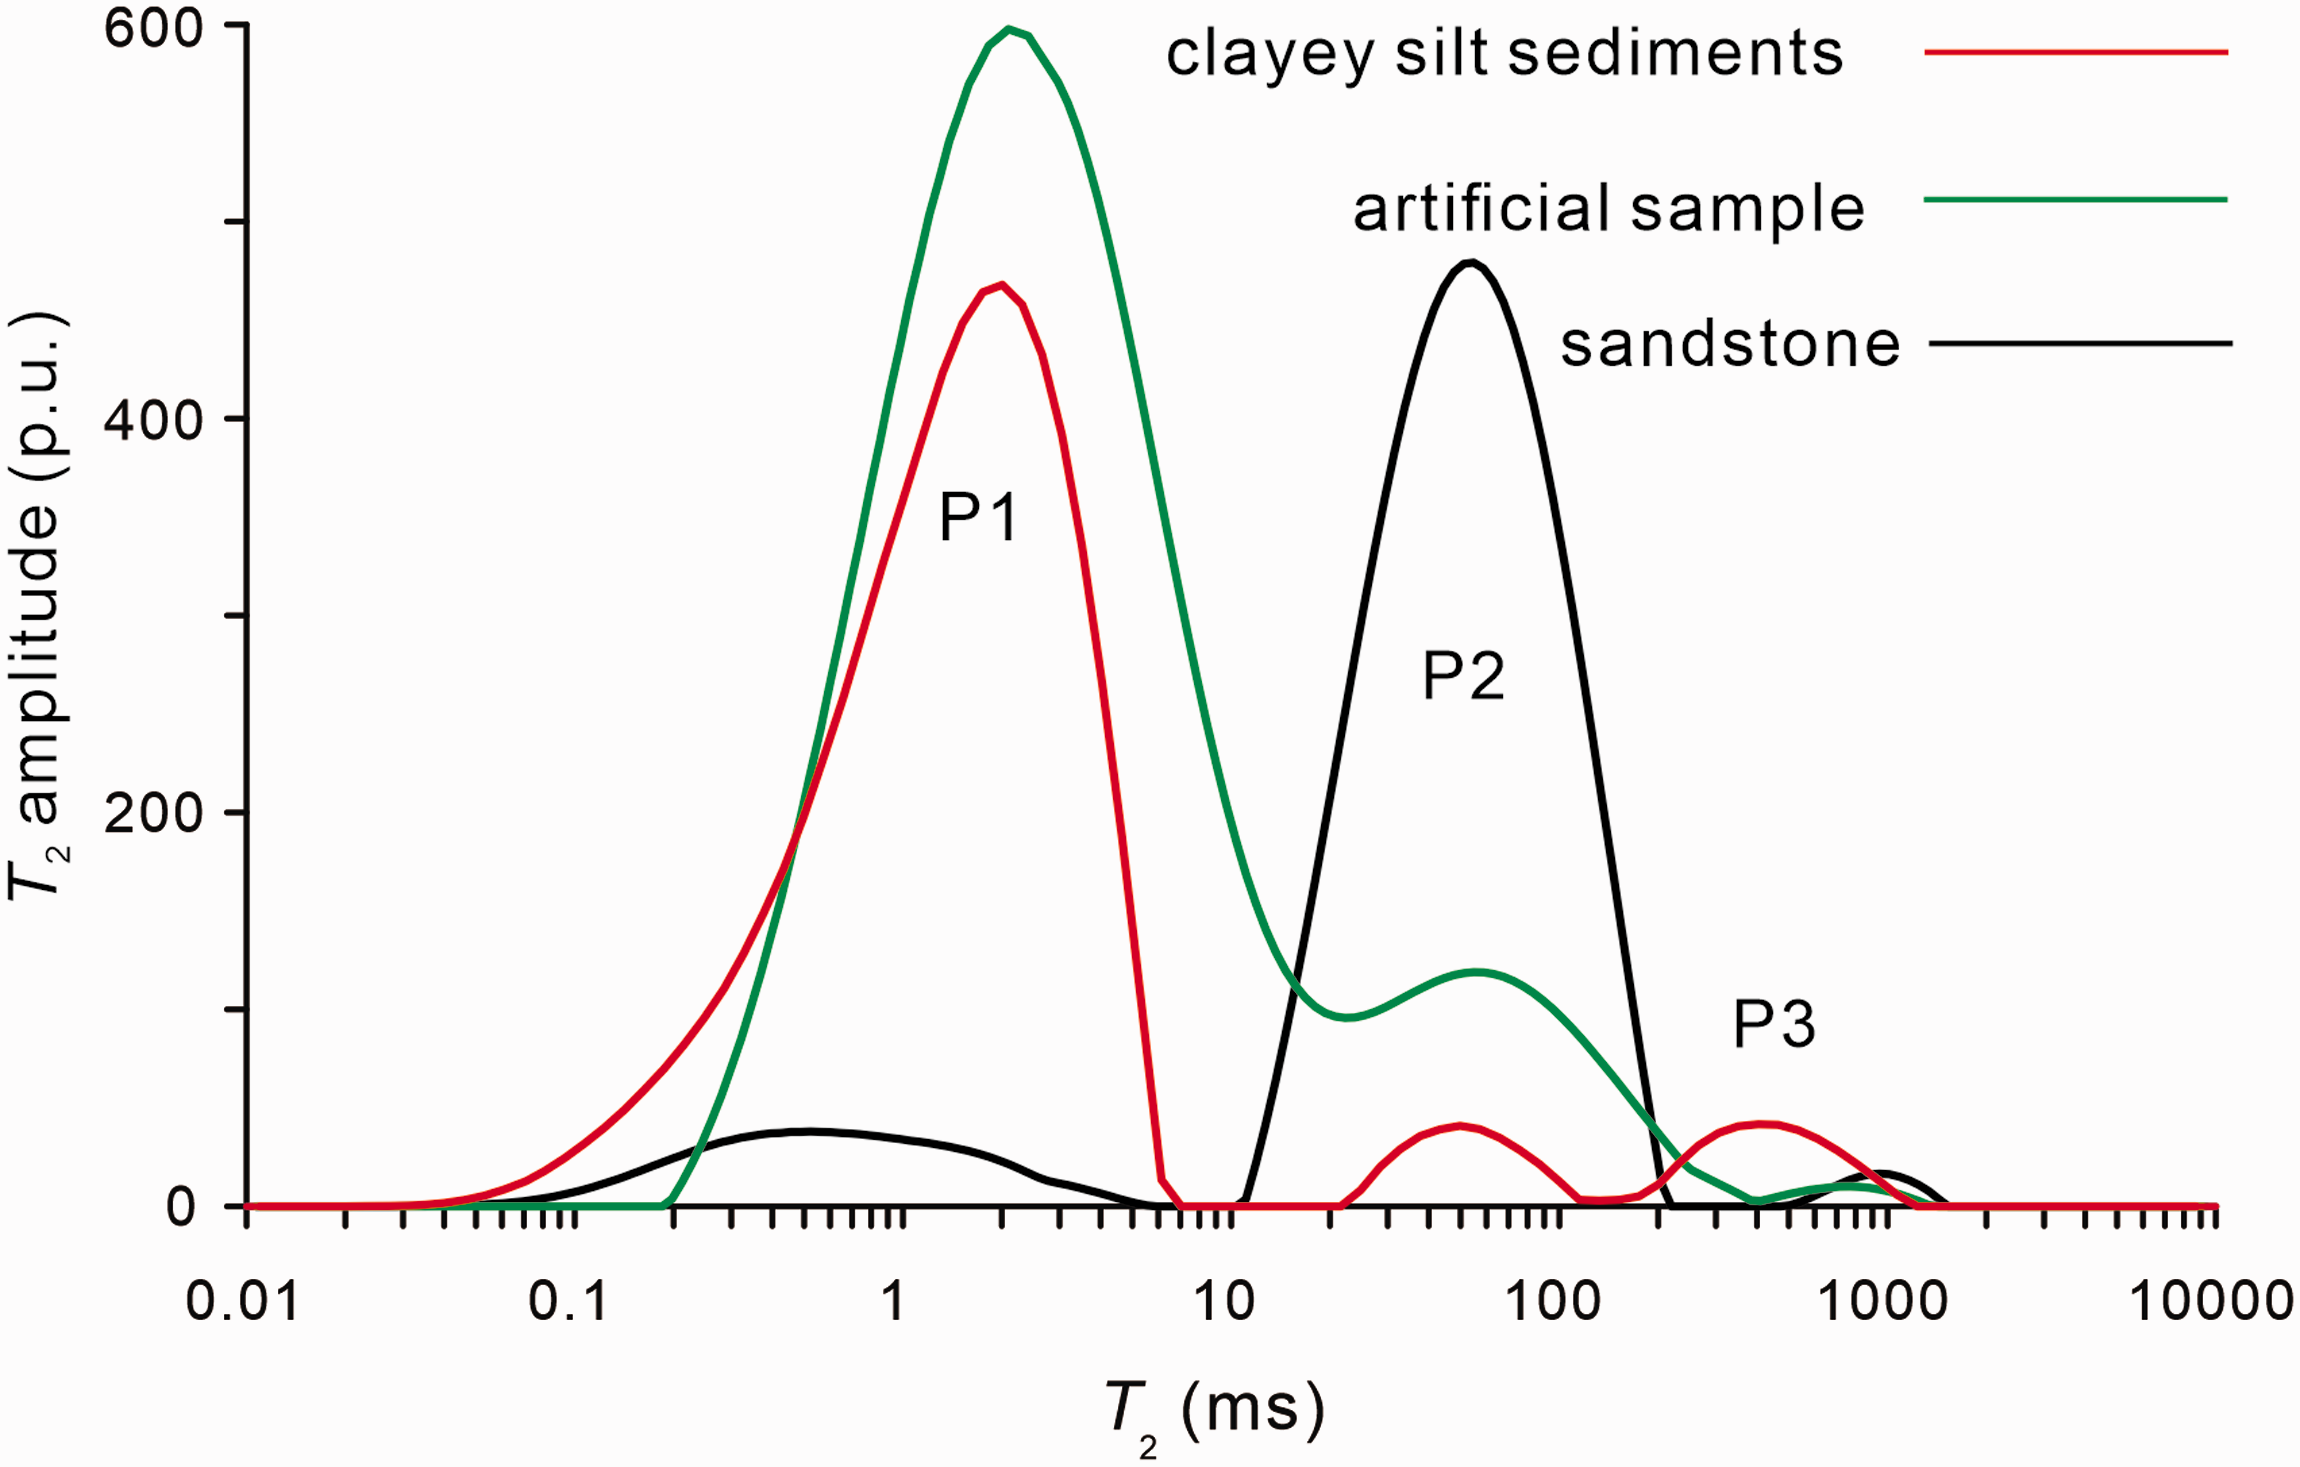
The CO2 hydrate formation experiment results show that there is an observable decrease in the amplitude of T2 spectra corresponding to the formation process, as shown in Figure 3. For the sandstone sample, there is an obvious decrease in P2, whereas there is only a slight decrease in the P1 peak. Moreover, the P2 peaks move towards the left (indicating a faster relaxation time) and then move to the right slightly with the further growth of the gas hydrate. The P2 peaks moving toward the left at the first 200 minutes suggest the growth of hydrate near the pore walls decreases the pore size leading to an increase in the surface-to-volume ratio. With hydrate continuing to grow, some of the water is surrounded by the hydrate resulting in the isolation from the free CO2 gas. It is difficult for the residual water to form hydrate as it is difficult to make contact with the free CO2 gas due to pore plugging. Therefore, the residual water in hydrate with long bulk water relaxation causes the leftward movement of the P2 peak. It is observed that the P2 peak became wider, which corresponds to a wider range of pore diameters. Therefore, the various pore diameters indicate the homogeneity of the sandstone pores becomes poor. The reason for this is the increased complication of pore structure with hydrate growth leading to multiscale pores. For the artificial samples, the P1 and P2 peaks decrease and shift leftward. In addition, for the clayey-silt sediments, the P1 peak decreases with CO2 hydrate formation, and the decreased area is mostly on the right side corresponding to the relatively large pores. For the artificial sample and the Shenhu sediments, the peaks move to the left as the hydrate grows. This indicates that the CO2 hydrate occupies the large pores, and the decrease in porosity leads to the stronger surface relaxation of the small pores. For the artificial sample, the position changes are more obvious than in the Shenhu sediments, which is a result of the multi-scale pore distribution.
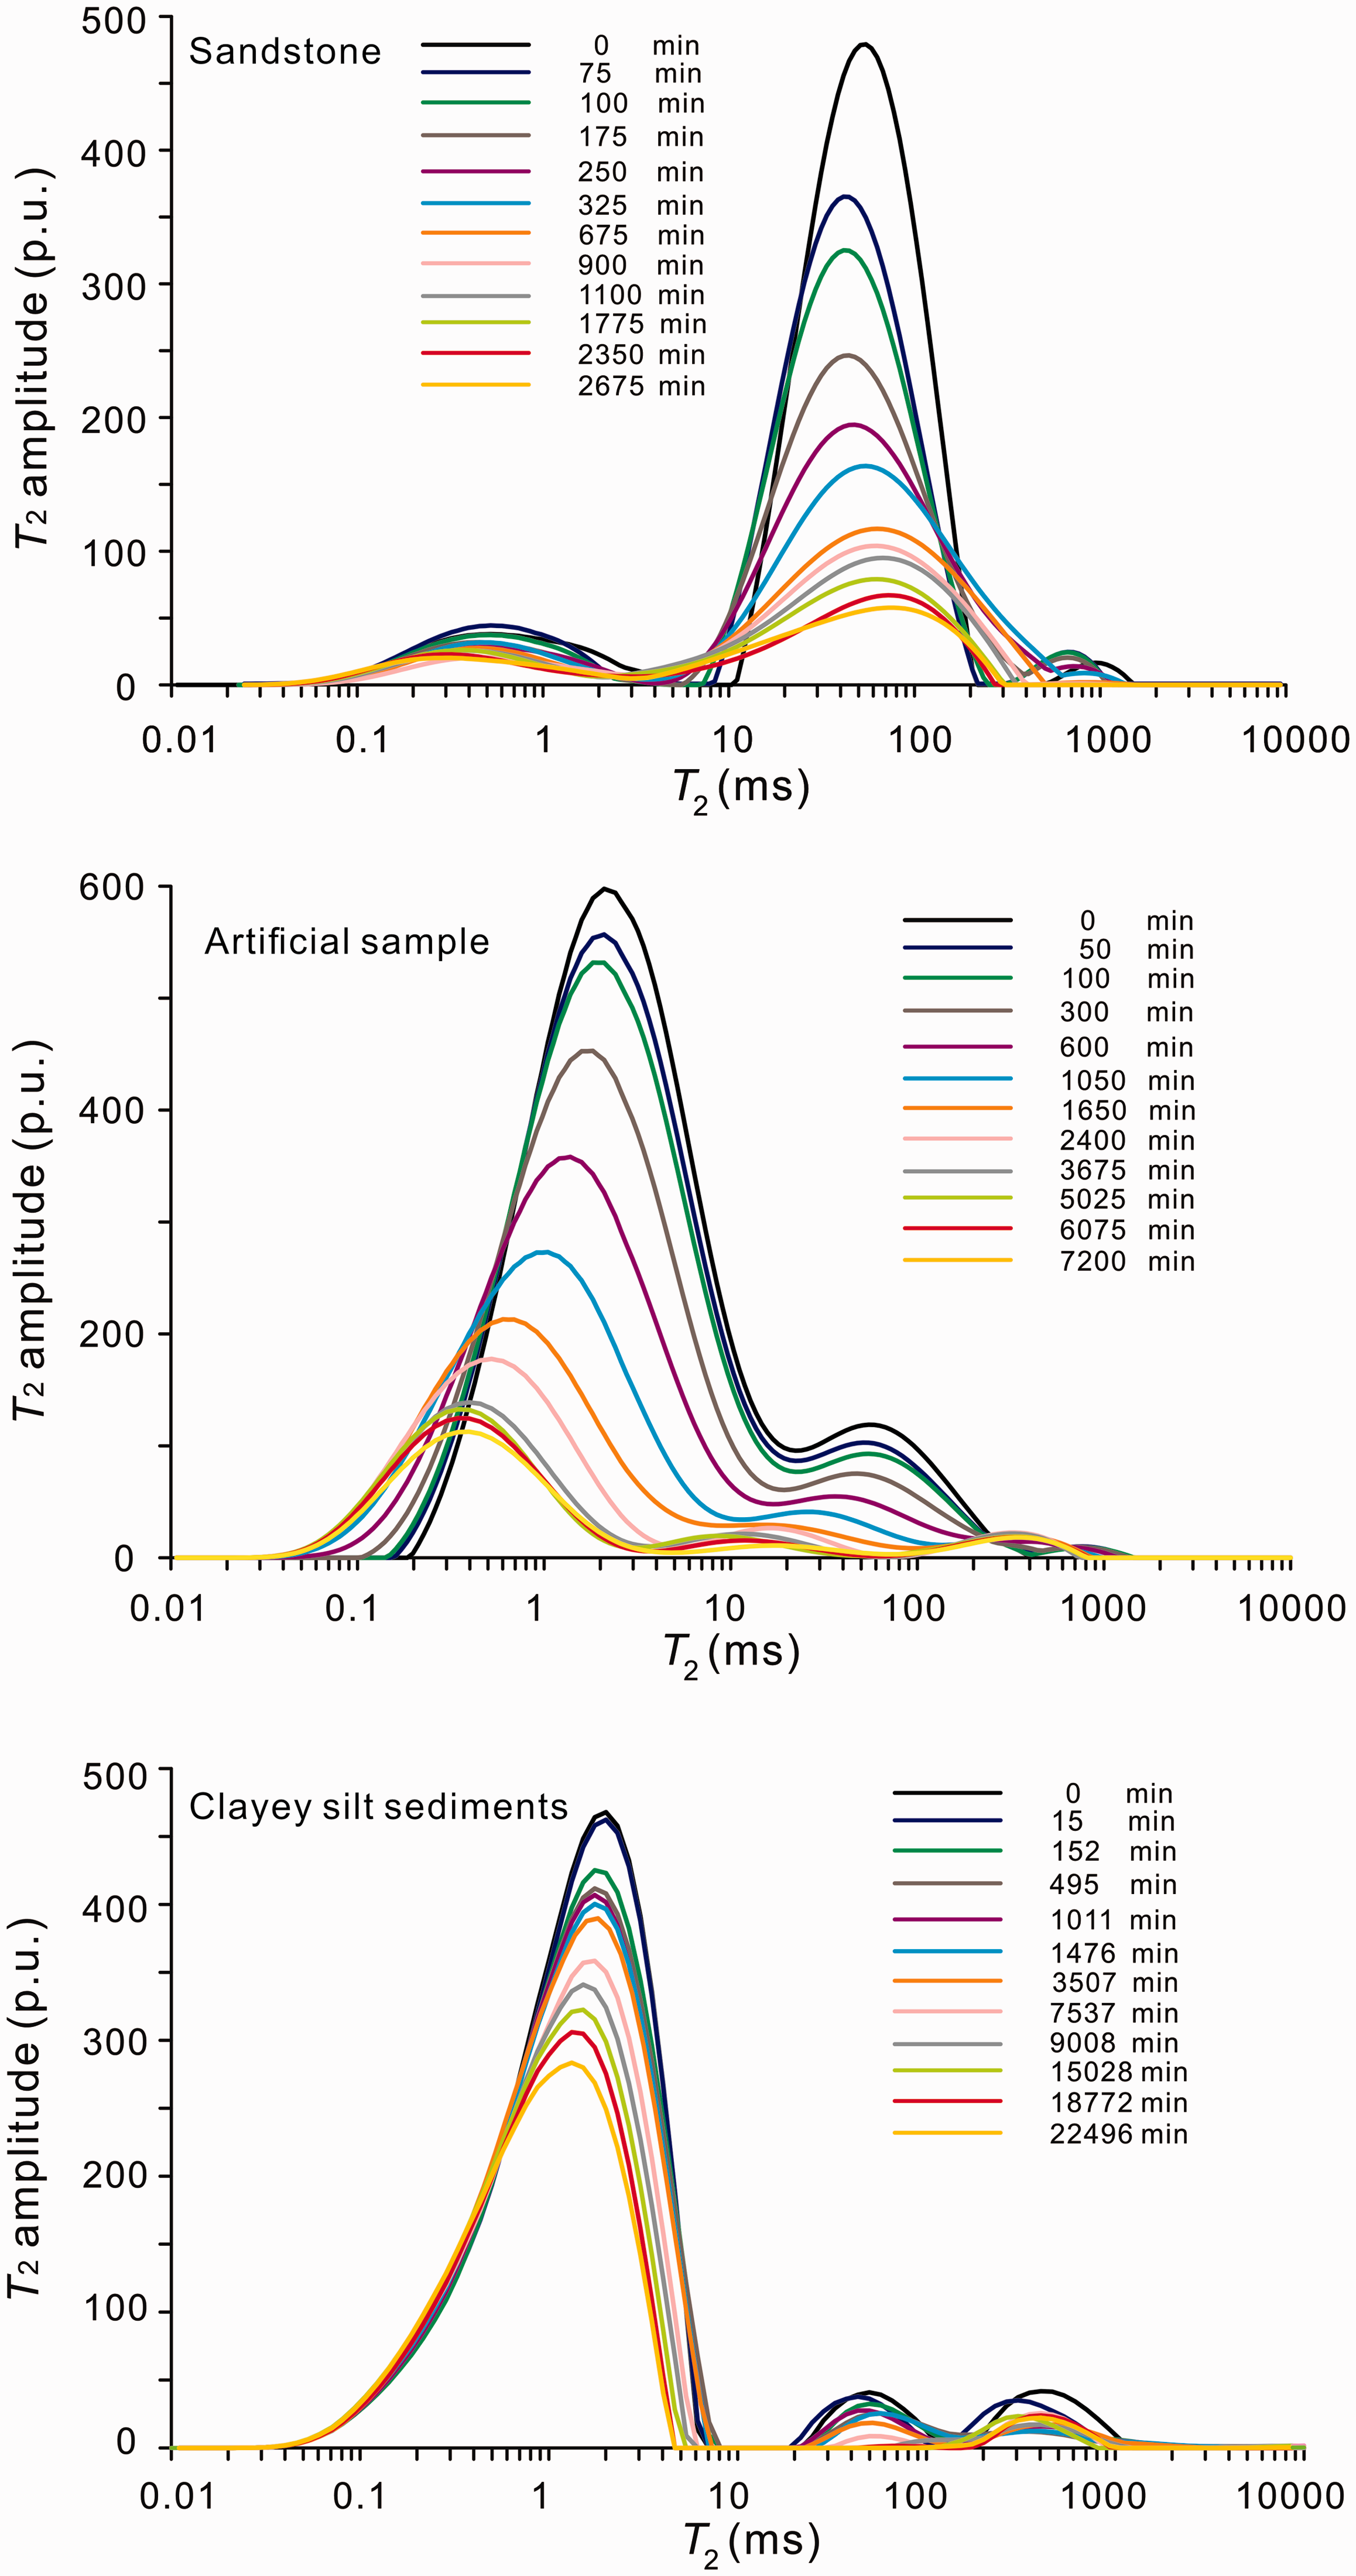
T2 spectra during CO2 hydrate formation experiments for the different samples.
In addition, compared to the Shenhu sediments, the CO2 hydrate is easier to form in the sandstone and artificial samples. For hydrate in the Shenhu clayey-silt sediments with high clay content and small pores, it took four times as long to reach the equilibrium, as shown in Figure 4. As the gas hydrate is undetectable by the low-field NMR and the sample is fully saturated, CO2 exists as a dissolved gas. Thus, in this study,
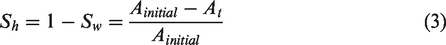
The CO2 hydrate saturation in the formation process for different samples.
The hydrate saturation in clayey-silt sediments is low (about 36.7%), whereas the hydrate saturation is 77.4% in the sandstone sample and 83.8% in the artificial sample. Therefore, it is easier for the gas hydrate to reach an equilibrium state for samples with large pore diameters than those with small pore diameters. The CO2 hydrate formation process in clayey-silt sediments showed a slow formation process and low hydrate saturation as a result of smaller pores. Meanwhile, the hydrate formation rate is limited by CO2 diffusion through water, which is determined by gas pressure, temperature, and the pore structure in water-saturated porous media. For clayey-silt sediments with small grain sizes and pores, the CO2 diffusion is slower than that in the sandstone and artificial samples (Kim et al., 2018).
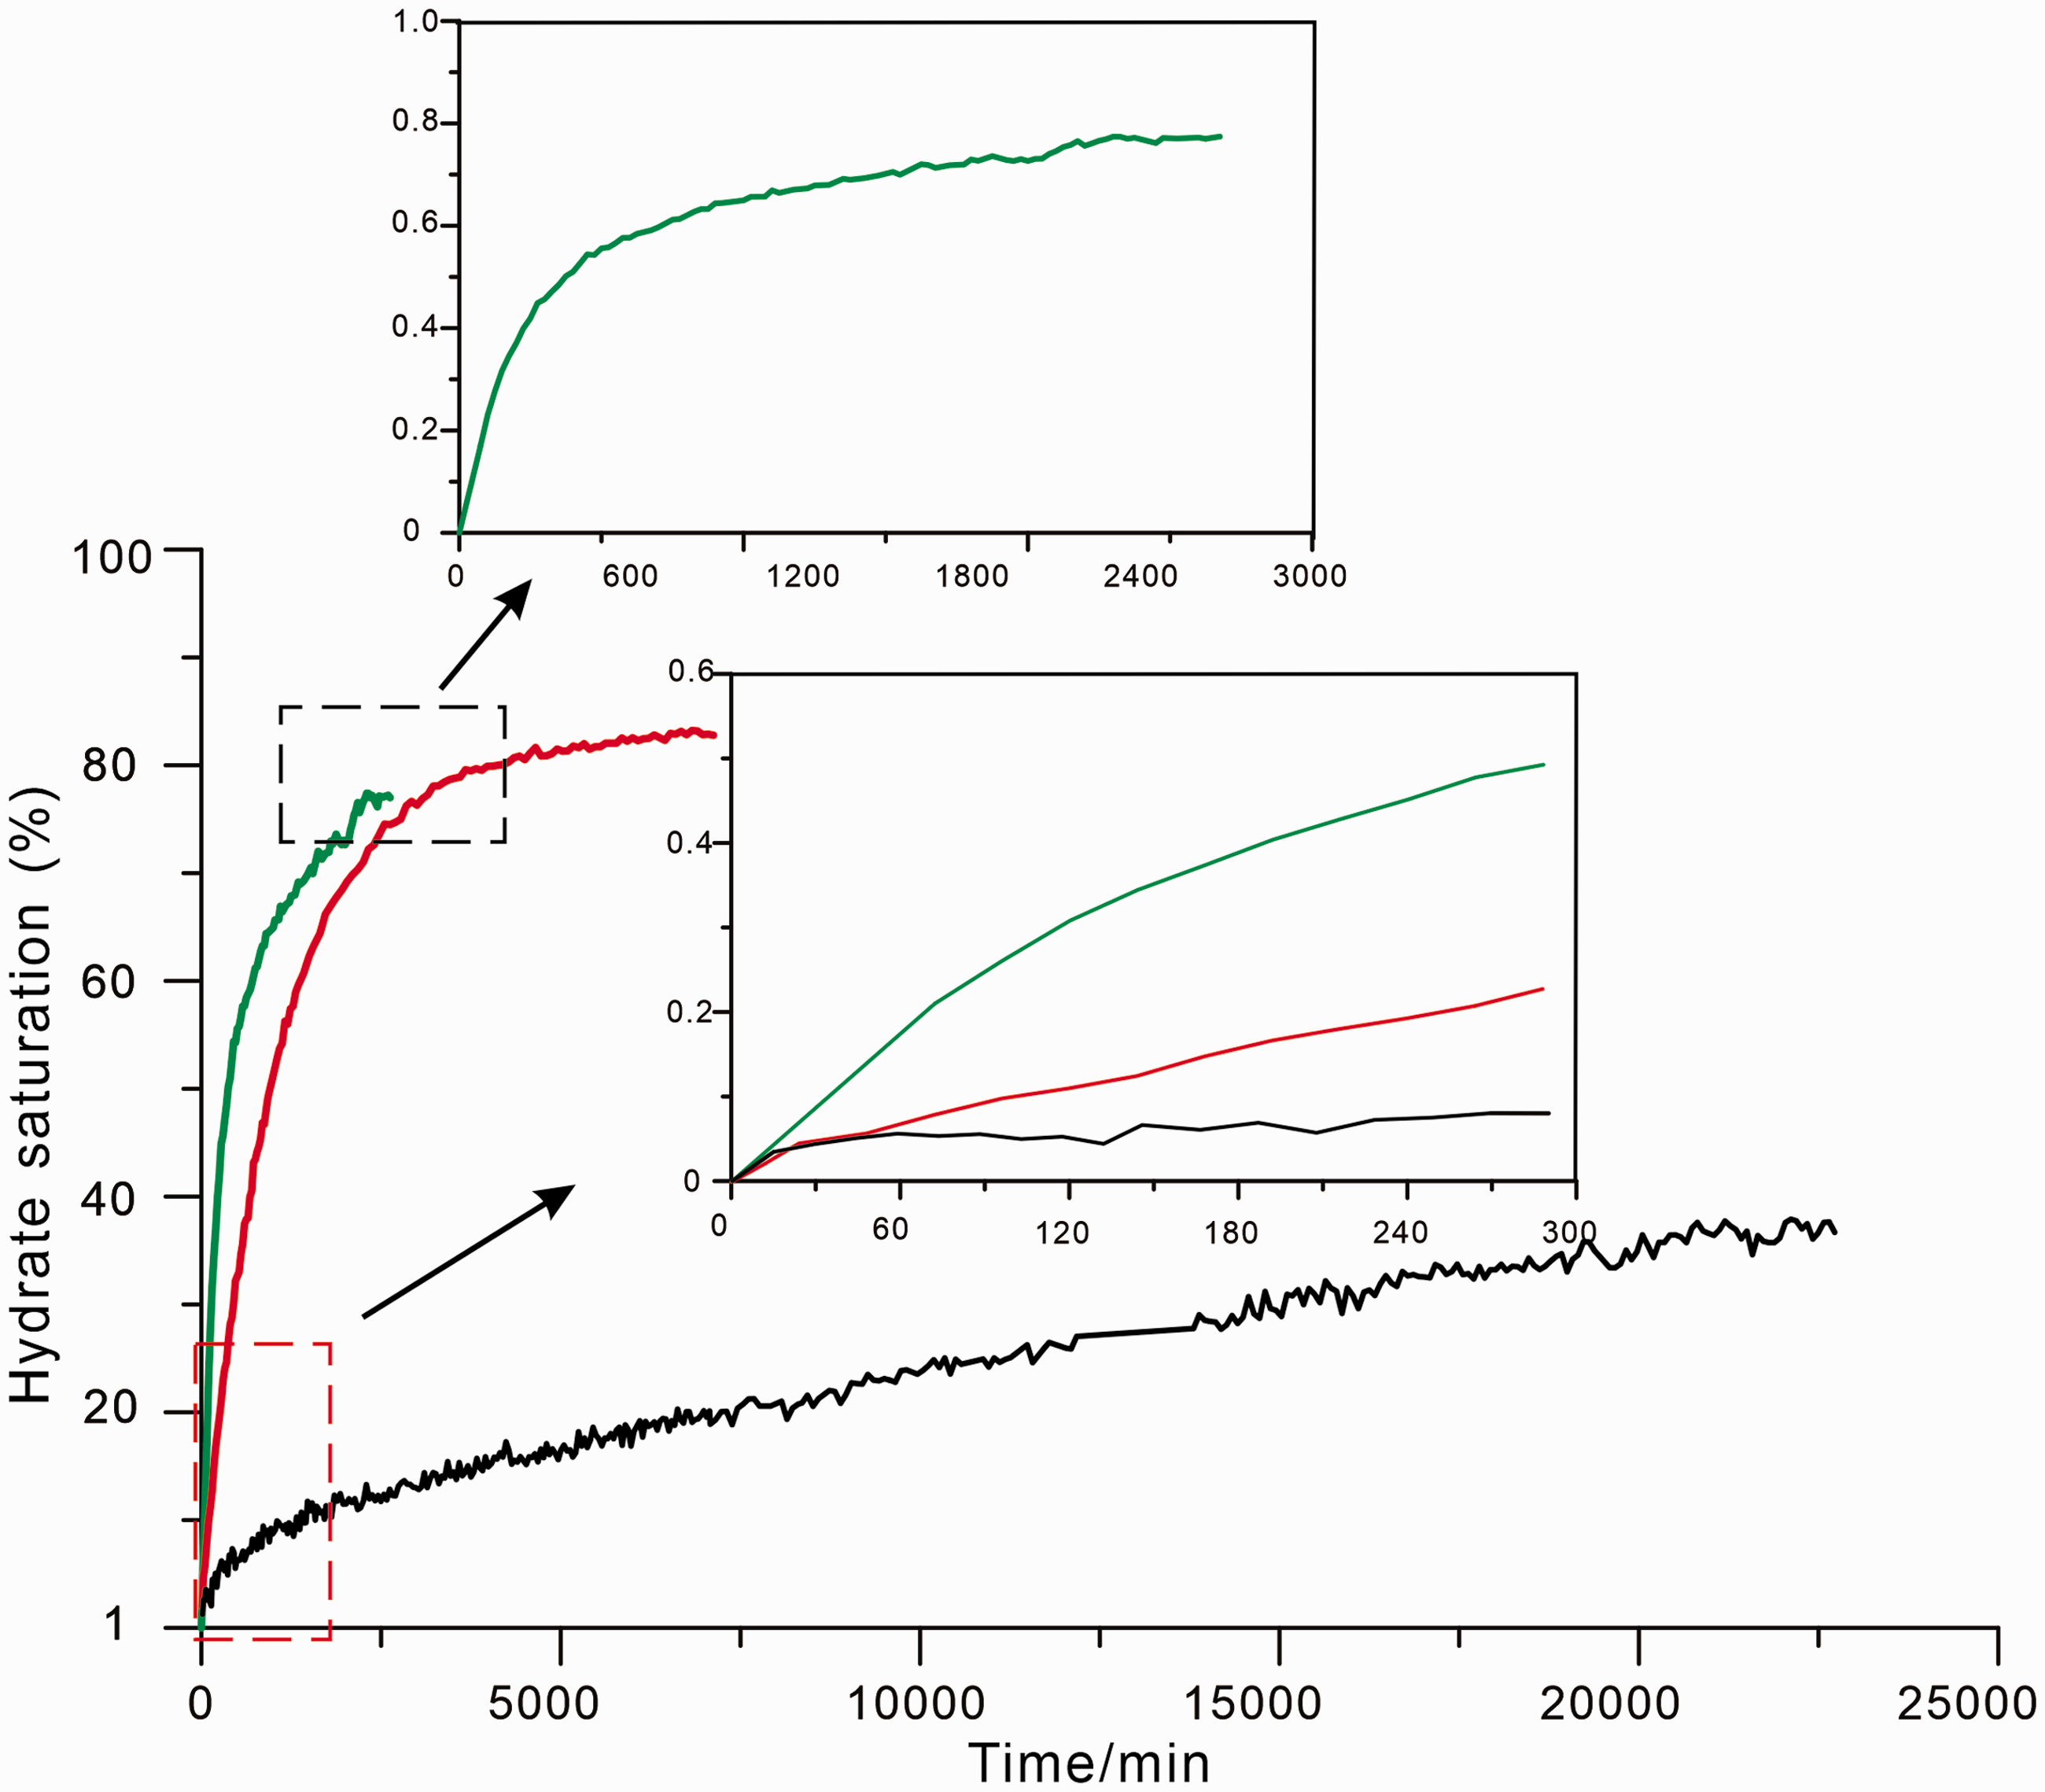
Meanwhile, the experimental results show that the P2 peak of the T2 spectra with longer relaxation time decreased with the formation time, whereas the P1 peak decreased slowly, indicating the gas hydrate forms in larger pores preferentially for all samples, as shown in Figure 5. For the sandstone, 81% of water combines with the CO2 molecules to form hydrate in the larger pores, whereas only 45% of water forms hydrates with CO2 in smaller pores. For the artificial samples, the percentage is 91% in larger pores and 83% in smaller pores. In the clayey-silt sediments, the percentage is about 100% in larger pores and 34% in smaller pores.
The changes of P1 and P2 amplitude for different samples.
The dissociation of hydrates
In this study, the multi-stage depressurization mode (pressure decreased step by step) was used, during which the T2 spectra were measured at every pressure stage. The results show that the T2 spectra peaks increase with hydrate dissociation. At the first stage, where gas pressure dropped to 3 MPa, there is little change in the T2 spectra for the three different samples. As the pressure is above the thermodynamic equilibrium curve, the gas hydrate is in a stable condition. With gas pressure dropping to 2 MPa, the hydrates begin to dissociate. As shown in Figure 6, the area of the T2 spectra begins to increase; however, the hydrates do not dissociate completely, although the pressure is below the thermodynamic equilibrium curve (the equilibrium pressure is about 2.2 MPa under 4 °C in pure water for CO2 hydrate) (Ohgaki et al., 1993). When the pressure dropped to 1.0 MPa, massive hydrate dissociation occurs. Therefore, there is a pressure threshold for abrupt changes in the hydrate dissociation process. However, some hydrate remains, which dissociates with further drops in pressure. The experiment result suggests that although gas pressure drops below the thermodynamic equilibrium curve, hydrate dissociation is incomplete, which is in agreement with the results in previous studies (Kneafsey and Nakagawa, 2011). A sudden and quick depressurization brings hydrate out of the stable P-T zone, which results in a rapid dissociation from the hydrate-gas interface. Meanwhile, hydrate dissociation exhibits a self-protection mechanism in that as temperature behind the interface begins to decrease, hydrate dissociation in the center of the pores is suppressed. For the artificial sample, the P1 peak increases, and then the P2 peaks were observed during hydrate dissociation. For clayey-silt sediments, the P1 peak begins to increase in the left portion of the peak, which is the opposite of the formation process. The peak position changes of these two samples indicate that hydrate dissociation is initiated in the small pores and then in the macropores.
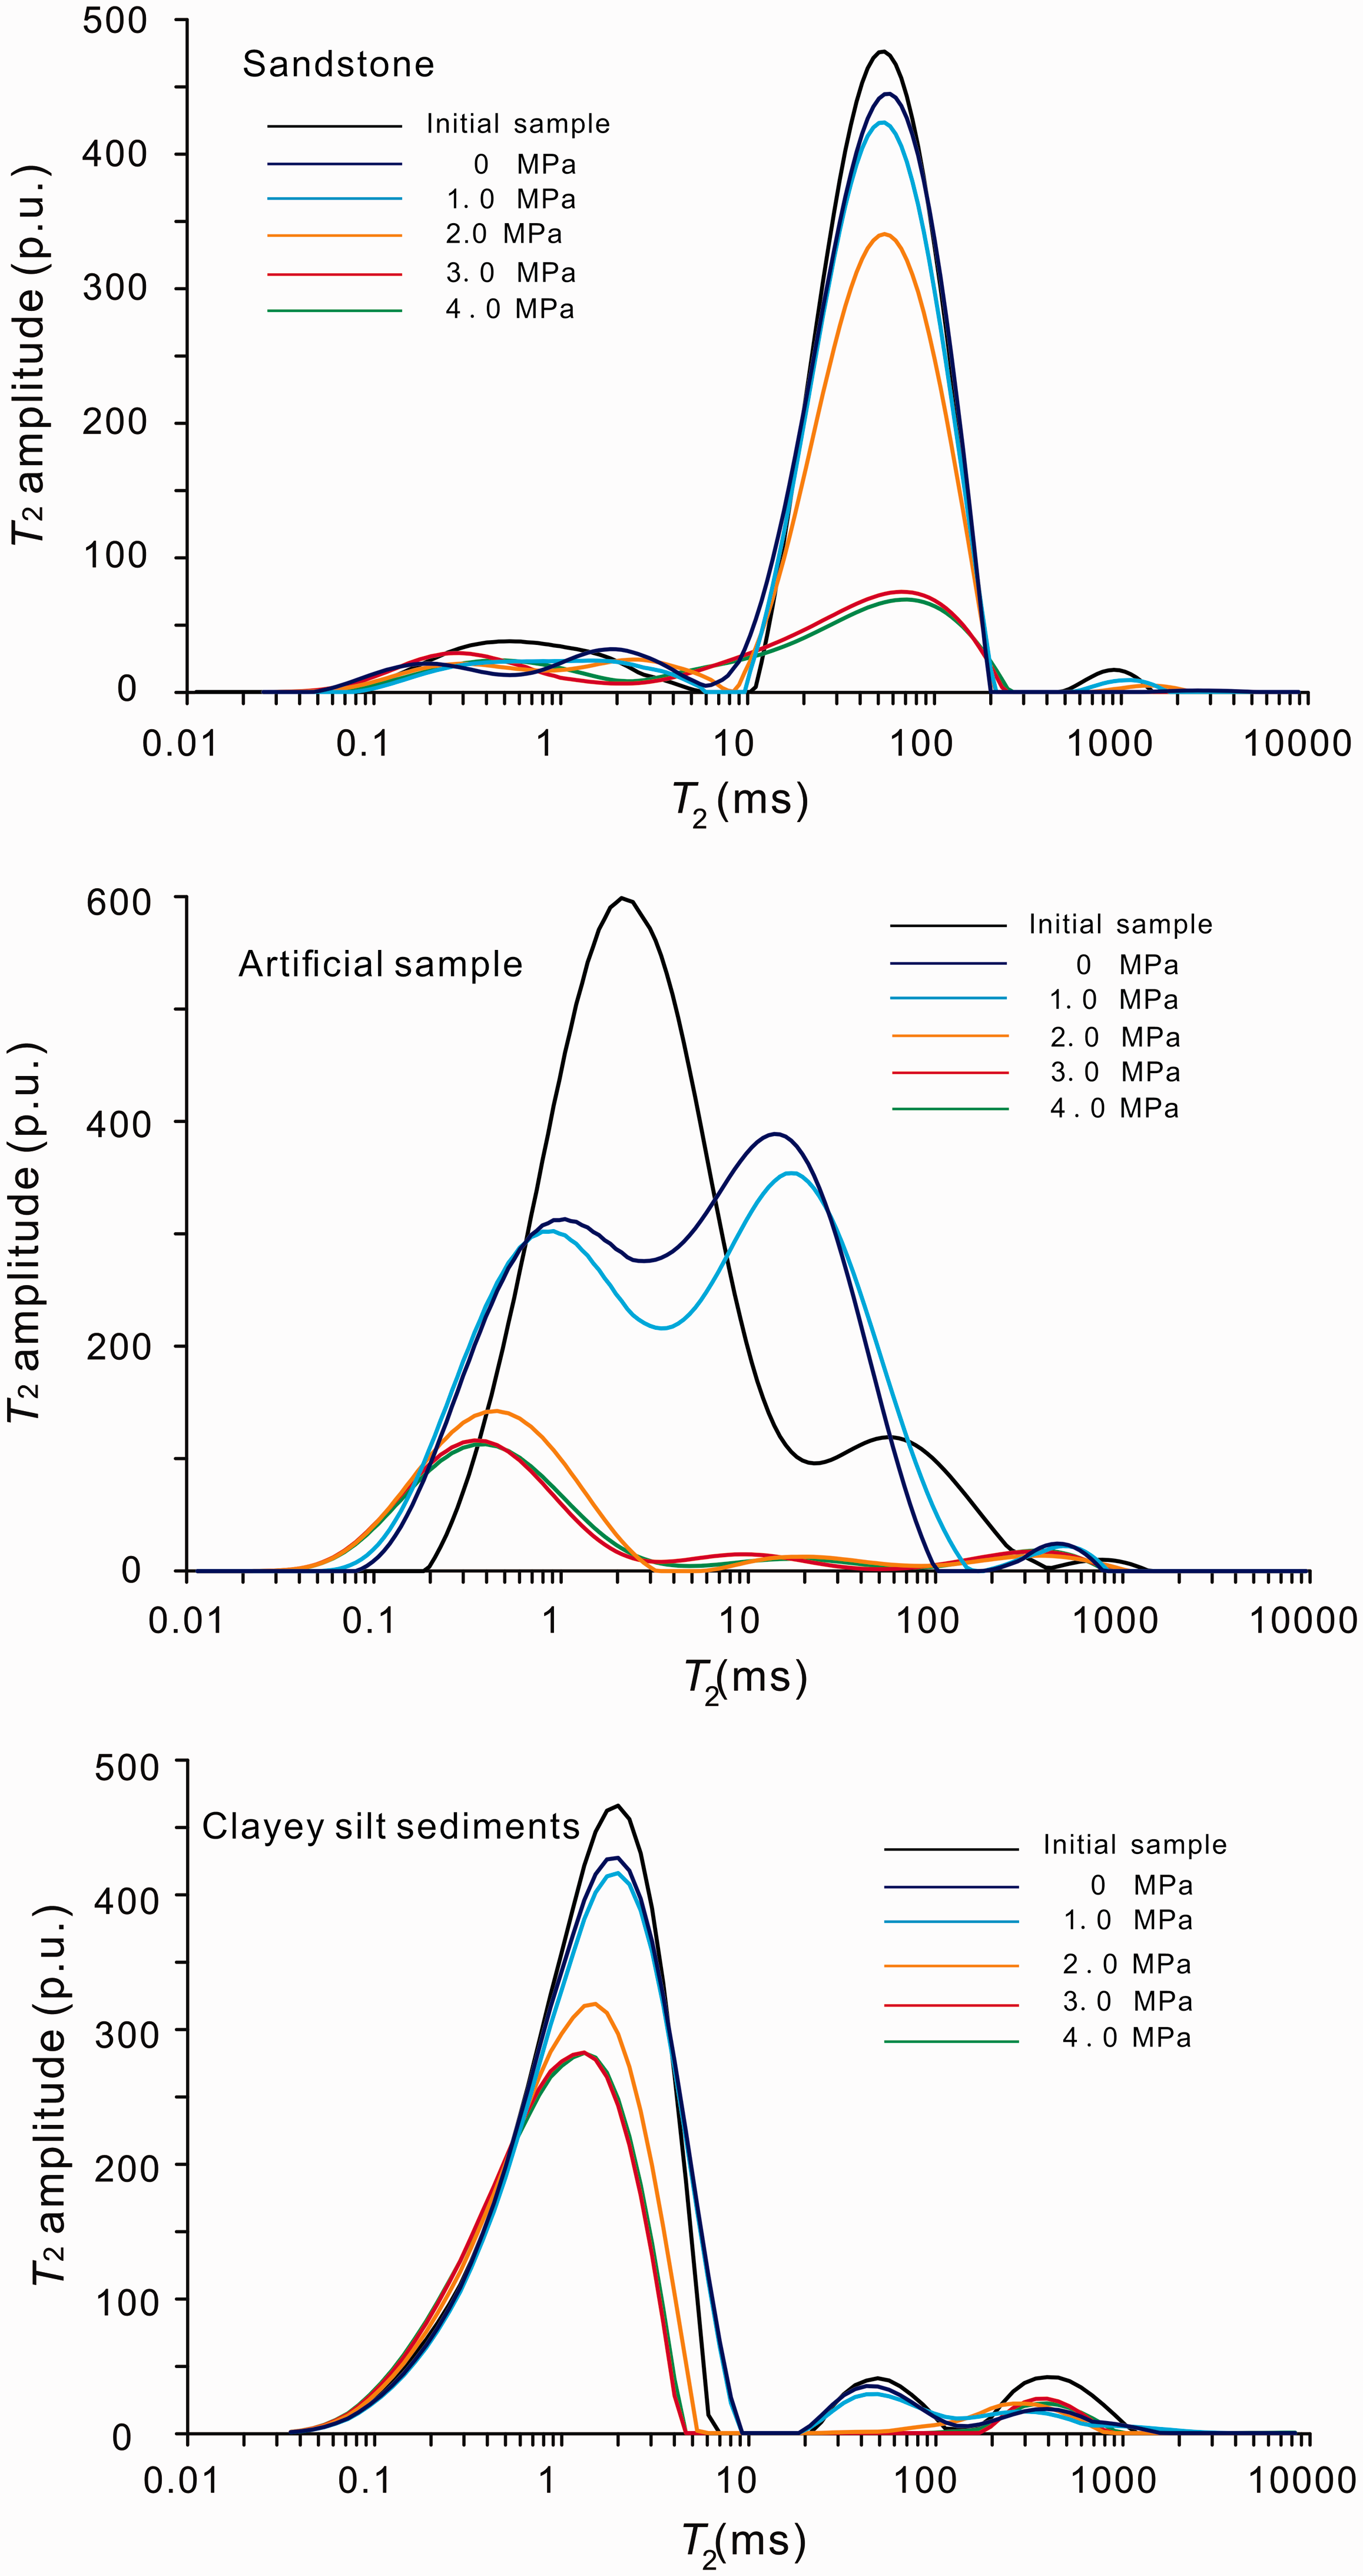
T2 spectra at different pressures for different samples CO2 hydrate dissociation.
However, there is a significant difference between the T2 spectra distribution after hydrate dissociation and from before hydrate formation for artificial sample, where the P1 peak decreases and P2 peak increases. We assume that the redistribution of peaks is a result of the water molecules moving from small to large pores to form hydrate, causing the pore structure to change. Therefore, it is suggested that the formation and dissociation of hydrate changes the pore structure and water distribution of unconsolidated samples. Tian et al. (2019) also observed pore structure changes during hydrate dissociation. Figure 7 shows that the water signal disappears during CO2 hydrate formation and reappears after hydrate dissociation in the MRI images. It also shows that the water in samples is redistributed after CO2 hydrate formation and dissociation. Noticeably, the MRI image or T2 spectra collected by low-field NMR is the composition of the sample along the magnetic field direction. The MRI image is a composite two-dimensional image. Therefore, the distribution of gas hydrate or porosity is an average but not the real three-dimensional distribution.
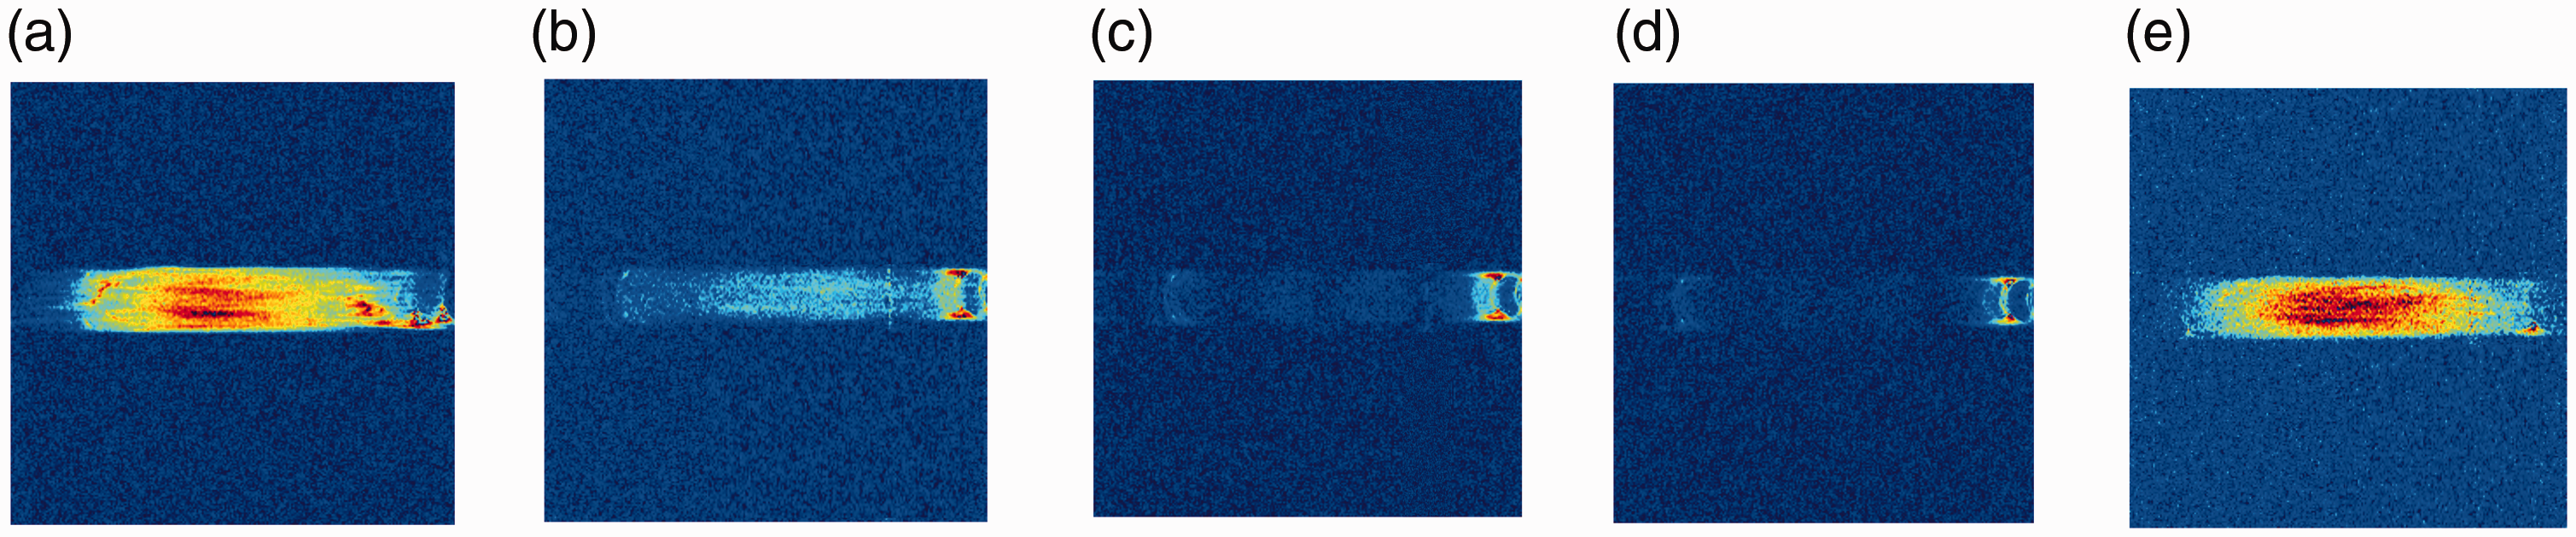
Nuclear magnetic resonance image during CO2 hydrate formation and dissociation in the artificial sample (a→d, the process of hydrate formation, and d→e, the process of hydrate dissociation).
The changes in permeability
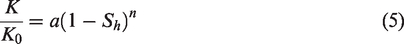
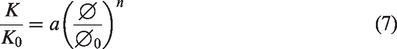
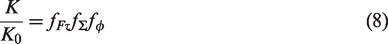
The Shenhu sediments are a poorly cemented porous media, thus it is difficult to obtain permeability using conventional methods (Lei et al., 2020). This is especially true as hydrate grows in the sediments under high pressure and low temperature conditions with water or gas flowing through the sample. Therefore, quantifying permeability changes during hydrate growth in clayey-silt sediments can provide unique insights. There are two primary methods for estimating permeability with NMR results, one is the SDR model based on the estimation of an average pore size, and the other is the Coates model based on irreducible water saturation (Machado et al., 2008). The Coates equation uses the porosity and free-fluid to bound-fluid ratio determined from the T2 distribution to predict permeability (Coates et al., 1991). As we cannot obtain the free-fluid to bound-fluid ratio in the hydrate formation and dissociation processes, the Coates method is not applicable. The SDR method is based on the T2 distribution being a pseudo-pore size distribution of the formation. In this study, the main fluids are water and CO2, thus we can use SDR to measure the permeability. The SDR model is

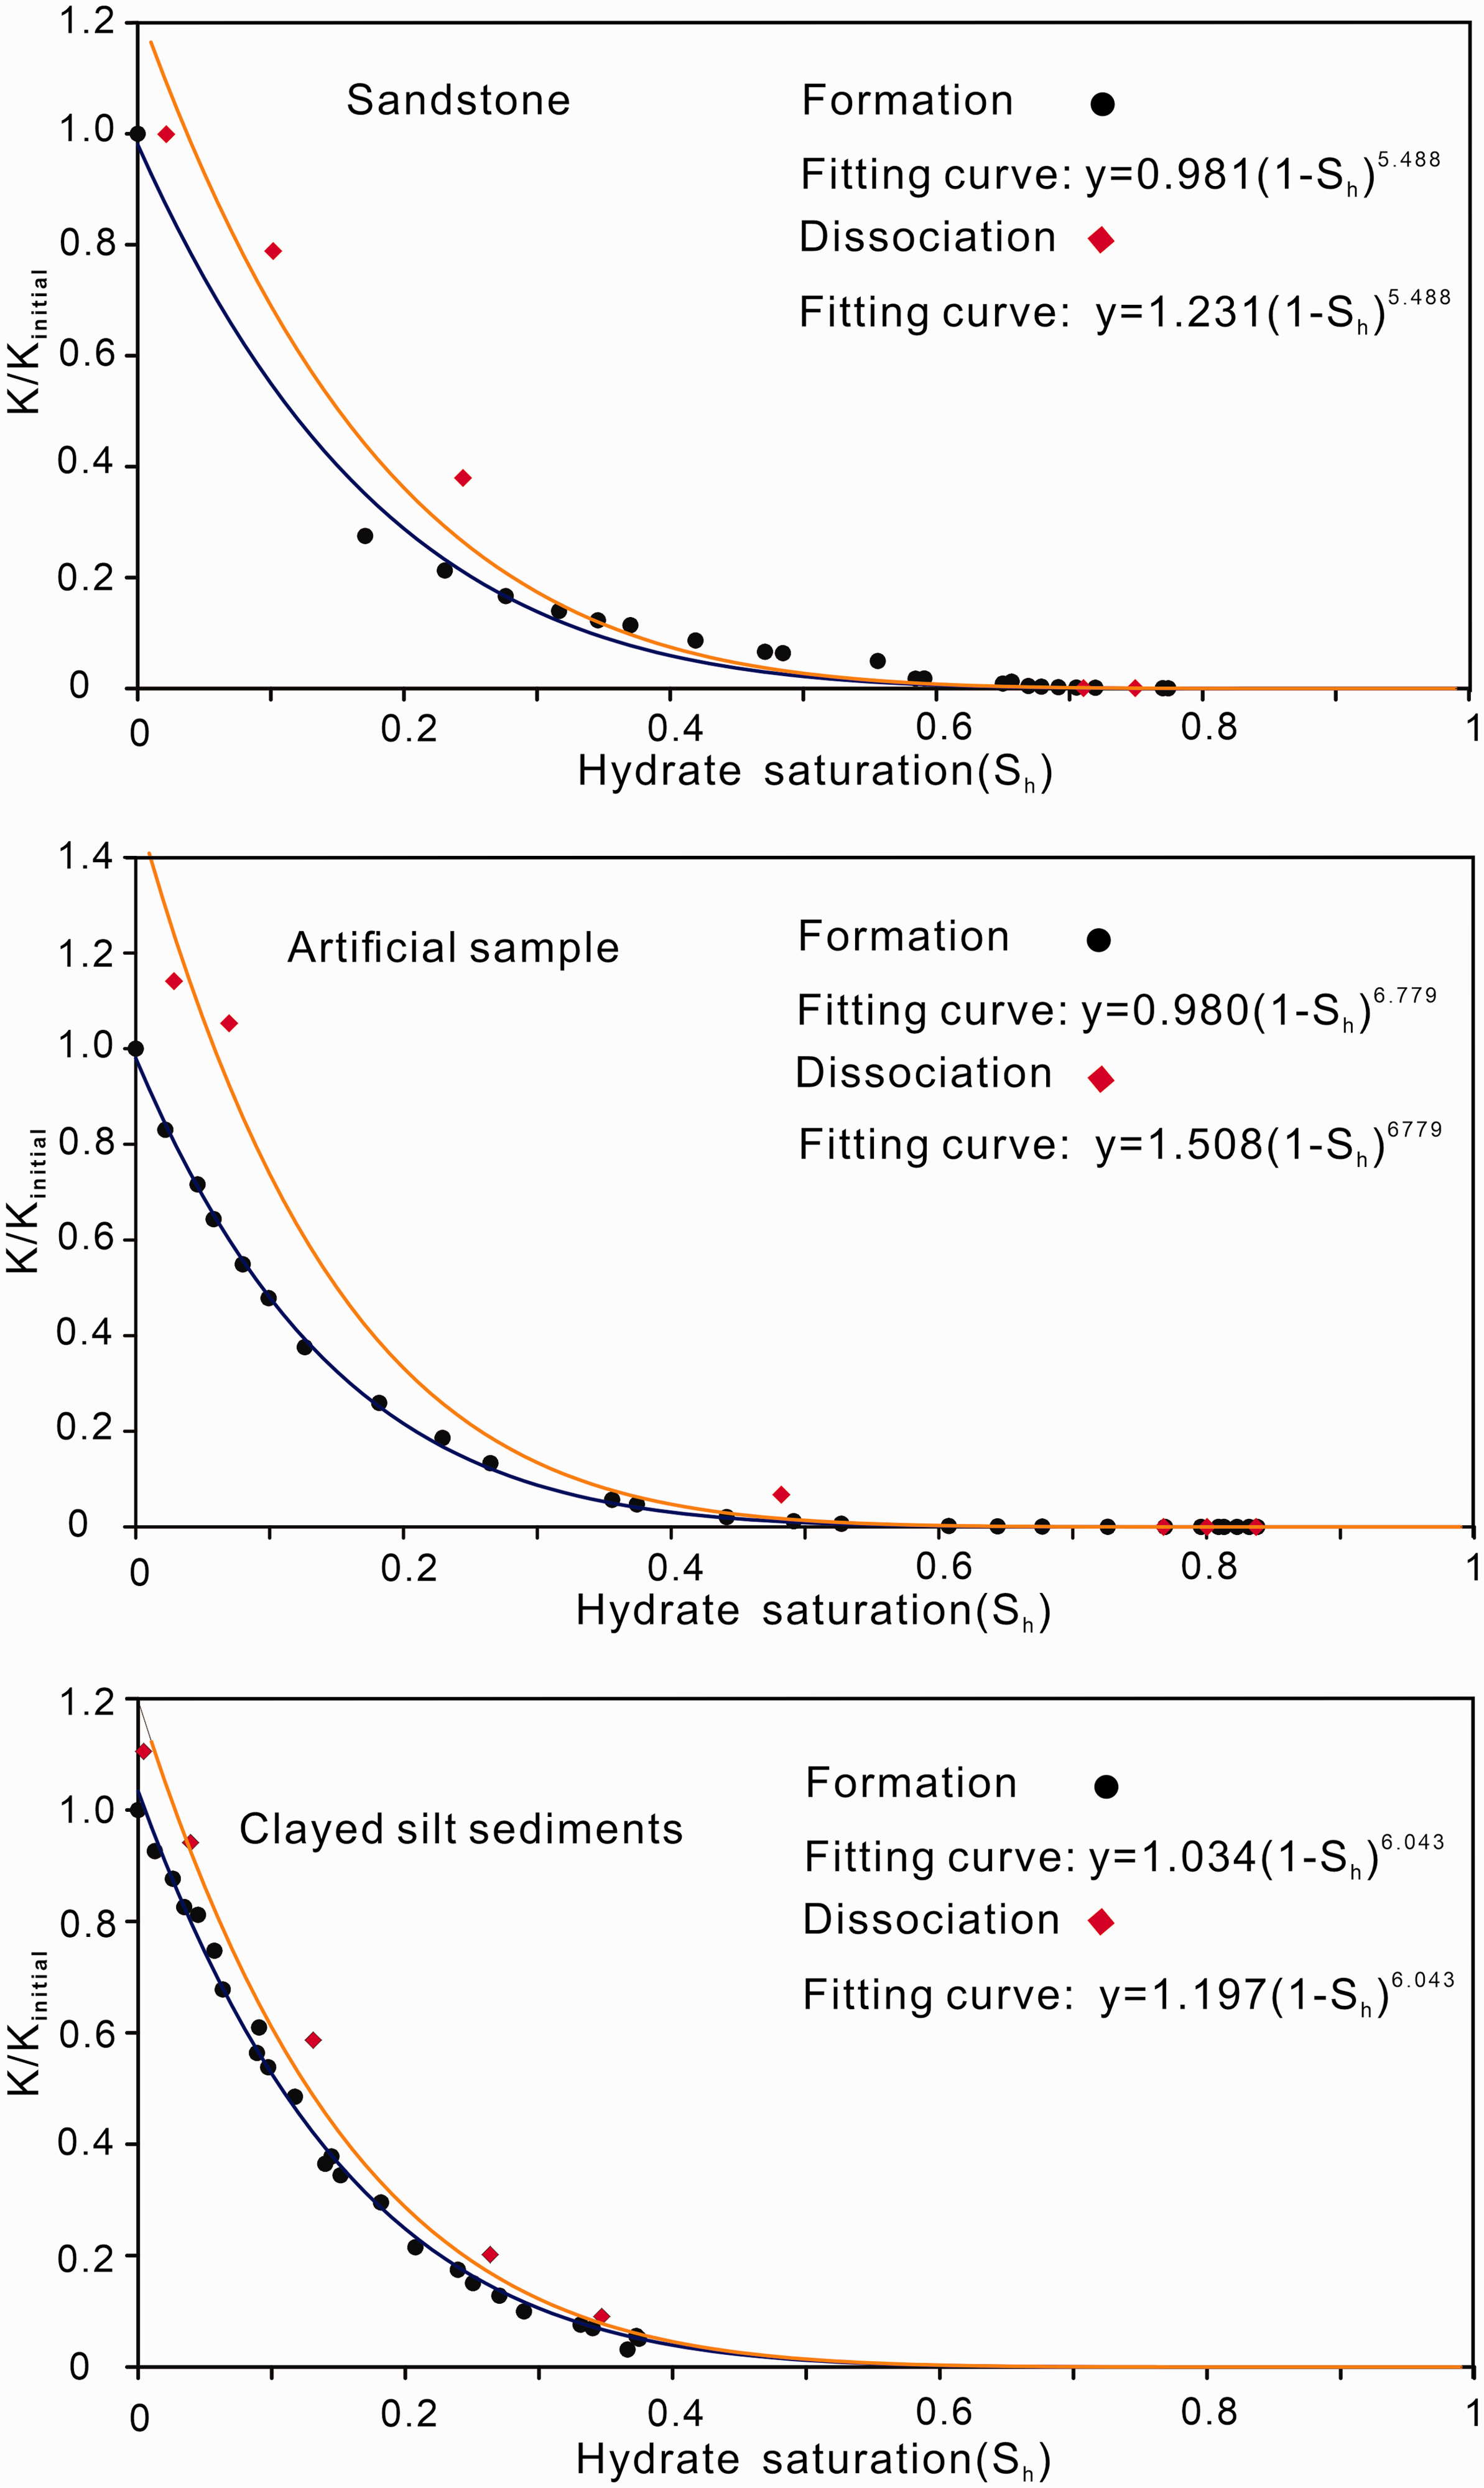
The permeability in hydrate formation and dissociation for different samples.
As mentioned above, since the sample is fully saturated CO2 exists as dissolved gases. Thus, in this study,
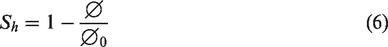
Thus, there is a relationship between permeability and porosity:
For the artificial sample whose structure is not compact, the permeability after complete hydrate dissociation is higher than that of the original condition. Besides the effect of hydrate saturation on the pore structure, the sample’s own structure changes with hydrate formation and dissociation. However, for the unconsolidated clayey-silt sediments sample, the changes of the pore structure are very small. The main reason is that the content of clay is high (about 26%–30%), and the cementation is strong.
When CO2 hydrate growth reaches equilibrium, we tried to measure the gas permeability by decreasing the backpressure to 3.7 MPa. It is worth mentioning that we assumed that there was no hydrate formation during permeability measurements as the hydrate formation has reached equilibrium. However, the experiment results show that there is no gas detected at the outlet of backpressure regulator. This indicates that the porosity and permeability decreased dramatically with the formation of hydrate. The permeability of dry sandstone is 645.6 mD, and the permeability found using NMR is 2 mD after hydrate formation, which is in good agreement with the permeability measurement results. This is just a preliminary experiment for permeability changes, and a series of successor experiments will be performed to study permeability under different hydrate saturations.
Conclusions
In this study, NMR was used to evaluate the CO2 hydrate saturation and permeability changes in sandstone, artificial samples, and clayey-silt sediments during hydrate formation and dissociation. The following conclusions were made.
The T2 spectra representing the water in samples decreases with hydrate formation and increases with hydrate dissociation. The difference in the T2 spectra was used to calculate the hydrate saturation. With hydrate growth, the homogeneity of pores becomes poor, and the CO2 hydrate occupies larger pores first, leading to the leftward movement of the T2 spectra. Compared to the sandstone and artificial sample, the hydrate saturation in clayey-silt sediments is low (37%), and it takes four times as long to reach hydrate growth equilibrium. Moreover, gas hydrate forms preferentially in larger pores for all samples. There is self-protection mechanism in the process of hydrate dissociation in which the complete dissociation is not achieved under the dissociation condition, and the hydrate dissociation initiates in the small pores first and then in macropores. The permeability of the porous media decreases with hydrate formation and increases with hydrate dissociation. With the same hydrate saturation, the permeability during hydrate dissociation is higher than that in hydrate formation.
Footnotes
Acknowledgments
The authors are grateful to Donghui Xing, Lantao Geng, and Chenlu Xu for their participation in performing experiments.
Declaration of conflicting interests
The author(s) declared no potential conflicts of interest with respect to the research, authorship, and/or publication of this article.
Funding
The author(s) disclosed receipt of the following financial support for the research, authorship, and/or publication of this article: This research was funded by the National Natural Science Foundation of China (51991365), the GH Programs of China Geological Survey (No. DD20190232) and the Guangzhou Science and Technology Project (No. 201909010002).