
Abstract
This study focuses on the calculation of carbon emissions during prefabricated component transportation phase, figuring out how to accurately infer the carbon emissions factor according to the changing of external factors. Through tracking and analyzing the differences between prefabricated component transportation phase and ordinary building material transportation phase, this paper explores how to establish a calculation mathematical model of carbon emissions factor to reflect the real prefabricated component transportation phase, that work would critically lower the bias of component transportation carbon emissions factors between in real world and giving in relevant national standards. The research content involved in this paper provides quantitative scale for Architecture Engineering and Construction (AEC), and also helps to establish and popularize carbon sink system of Architecture Engineering and Construction (AEC). In this study, prefabricated component, the basic component of assembled building, is taken as the research object and clue. The real carbon emissions performances of transport vehicles loaded with different number of components are simulated, and the carbon emissions factor and related parameter groups of transport vehicles are measured experimentally. Based on the statistical method, the data parameter selection and regression analysis are carried out by using STATA® 12. The relationship between the three parameters of Load Ratio, Average Speed and Atmospheric Temperature on carbon emissions factor are obtained except the types of vehicles. It is found that there is a linear relationship between the carbon emissions factor and the −0.5 power of the Load Ratio, the square of the Atmospheric Temperature and the reciprocal of the Average Speed, and the R2 value of the fitting formula reaches 90.46%. The result has a good interpretation for the measured data, better reflect the real situation of carbon emissions for assembled building during prefabricated component transportation phase, and improve the accuracy of carbon emissions calculation in this phase. If the Load Ratio and Average Speed can be increased, and the transportation time of prefabricated component at lower temperature can be selected, the carbon emissions can be significantly reduced, that could exert positive influence to the environment.
Keywords
Introduction
The greenhouse gas emissions from the excessive consumption of fossil fuels have led to global warming, which has brought a series of negative impacts on the environment and ecology (Luo et al., 2016). After 2008, China has become the largest carbon dioxide emitter in the world (Xu et al., 2019), especially the carbon emissions of construction industry is much higher than other fields, accounting for 27.9–34.3% of China's carbon emission (Shi et al., 2017). Such a huge amount of carbon emissions has brought great pressure on the Chinese government to reduce emissions (He et al., 2020). Building energy conservation and emission reduction has become the focus of social attention (Sterner, 2007).
Compared with the carbon emission research in the operation and maintenance stage, the carbon emission research in the materialization phase is also important, which has a direct relationship with the construction mode. Assembled building has attracted worldwide attention because of its important role in sustainable urbanization processing (Hong et al., 2018). Prefabrication technology is to make a certain number of building components in a well controlled environment, transport them to the construction site, and finally assemble them into buildings. And it is widely used in many countries and regions (Zhang et al., 2014). Prefabrication is a sustainable construction method to increase quality control and site safety, improve environmental performance, reduce labor demand and construction time (Jaillon and Poon, 2008). Especially for the aging population in China, more and more construction sites are suffering the shortage of construction labors (Ng and Chan, 2018), and assembled building will transfer construction work from the site with bad environment to the factory as much as possible, making more construction labors in the construction site into industrial workers working in the factory, which significantly improves the working environment of the construction site (Heli and Leena, 2005). At the same time, the prefabrication technology has changed the traditional architectural design and construction method. Compared with the traditional cast-in-situ construction technology (Chang et al., 2018), the prefabrication technology has advantages in reducing the damage to the environment, so it is more environmentally friendly (Cao et al., 2015).
The Chinese government has implemented a series of plans to promote assembled buildings as a means of increasing productivity and reducing the resource and environmental footprint associated with construction. From the national, provincial and municipal levels, the government has promulgated policies to promote the development of assembled buildings, and some cities have even enforced the implementation of assembled buildings and provided corresponding preferential policies. For example, Nanjing city of Jiangsu province stipulates that all residential projects within the main urban area must adopt prefabricated technology, and the prefabricated assembly rate must reach more than 50%, but at the same time, they can enjoy an additional 2% plot ratio award, and even start to sell the residential buildings after the foundation construction is completed and the prefabricated components used for the first floor enter the site.
Although assembled building has many advantages in terms of technology and policy, its cost is still higher than that of traditional cast-in-situ construction mode under the current situation, due to small application scale and low standardization degree of components (Wang et al., 2020). Therefore, it is particularly important to research the carbon emissions footprint of assembled building. That could comprehensively evaluate the assembled building system in terms of environment and energy, so as to promote the establishment of reward and punishment mechanism in the materialization phase based on carbon emission, force the upgrading and transformation of industrial technology, and promote the awareness of energy conservation and emission reduction of all participants in the industrial chain, thus reducing the overall carbon of the industry emissions.
Literature review
The materialization phase of assembled building includes five phases: material production, material transportation, component production, component transportation, and construction. The transportation related phase includes two independent phases: material transportation and component transportation (as shown in Figure 1) (Ding et al., 2020). The carbon emissions of assembled building and cast-in-situ building are different due to the different transportation modes. Wen used LCA to analyze the physical and chemical carbon emissions of traditional cast-in-situ and industrial building system (IBS) building in Iskandar Malaysia (Jia Wen et al., 2015). It was found that the carbon emissions of IBS building in the transportation phase was significantly lower than that of cast-in-situ building due to the reduction of transportation distance. Wong reviewed the greenhouse gas emissions of prefabricated component for residential development in Hong Kong and found that although prefabrication reduces building waste, it may generate more greenhouse gas emissions during transportation and manufacturing (Wong and Tang, 2012). Taking a private residential building in Hong Kong as an example, Dong compared the carbon emissions of prefabrication and traditional cast-in-situ construction methods, and found that compared with cast-in-situ construction, the carbon emissions of prefabricated concrete transportation increased by 88%, but its total carbon emissions was far lower than that of cast-in-situ construction (Dong et al., 2015). Mao compared the difference of carbon emissions between prefabrication and traditional construction methods, and found that although the total carbon emissions of prefabricated construction was low, the transportation of prefabricated slabs offset 15.3% of carbon emissions reduction (Mao et al., 2013).
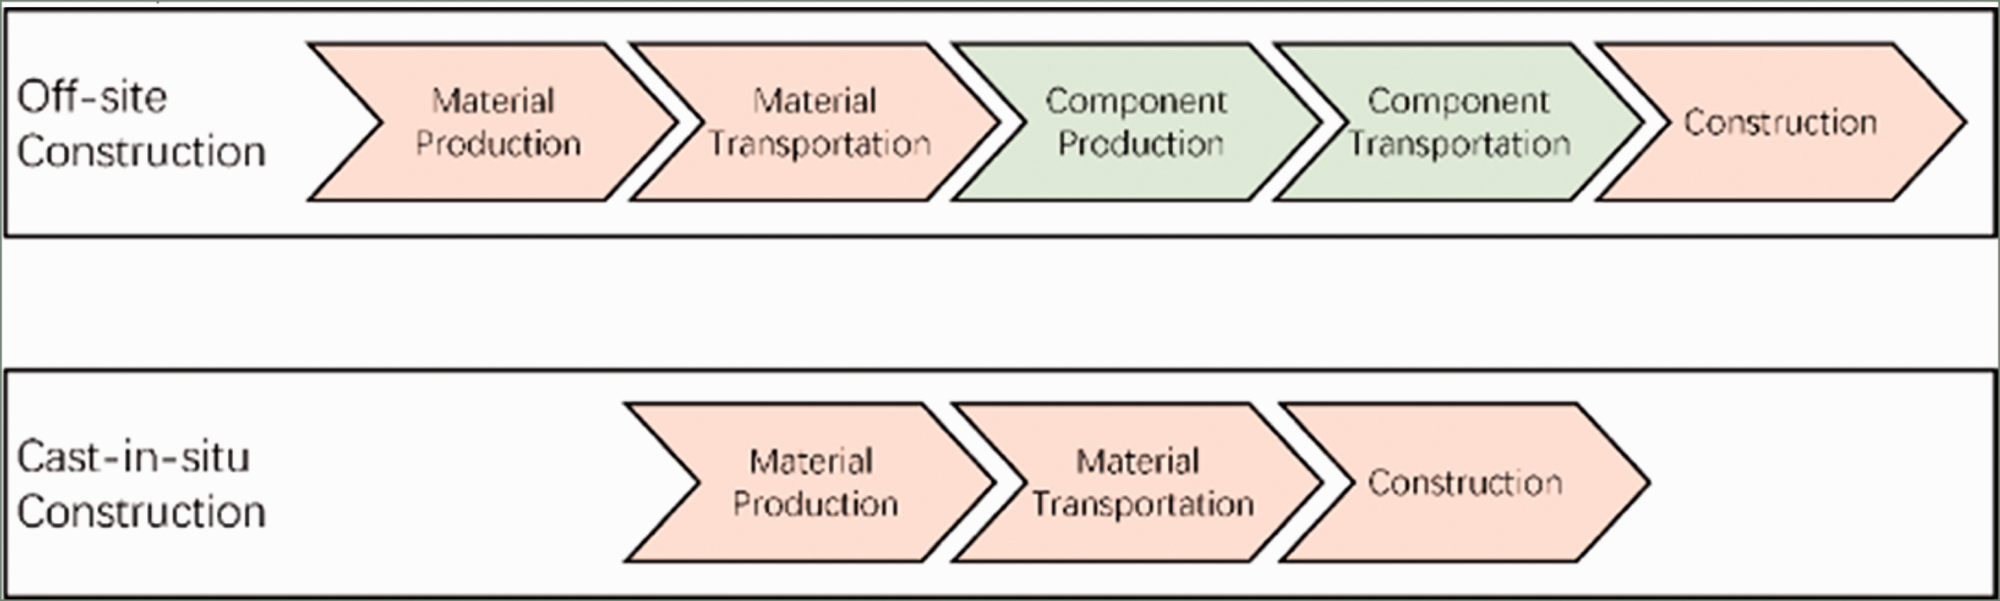
Different phases between off-site construction and cast-in-situ construction.
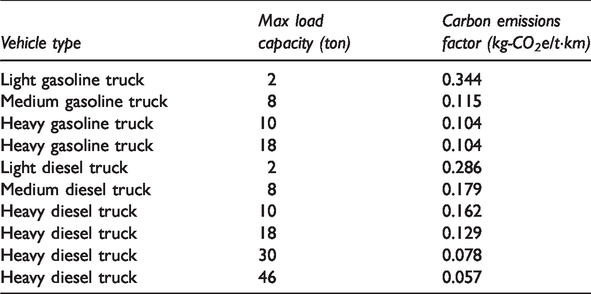
In 2019, China issued Calculation Standard for Carbon Emission from Buildings (GB/T 51366-2019), which stipulates the carbon emissions factor of road transportation of building materials. However, the current provisions are still relatively rough, only from the vehicle load, fuel type classification (as shown in Table 1), the actual load, driving speed and other factors on the impact of transport carbon emissions are not involved. At present, some scholars have begun to pay attention to the impact of other factors on transport carbon emissions. Salehi (2017) studied the trade-off between carbon emissions and cost in transportation (Salehi et al., 2017). In this study, different speeds represented different fuel consumption levels. Turkensteen (2017) made an experimental study on the practicability of assuming that the vehicle ran at a fixed speed in the comprehensive modal emissions model (CMEM) (Turkensteen, 2017). It was found that the CMEM results were sometimes less than half of the calculated results under the actual driving conditions at a fixed speed. Using a questionnaire survey, Léonardi and Baumgartner (2004) found that there was a correlation between vehicle load rate and carbon emissions (Léonardi and Baumgartner, 2004). The amount of pollution a truck emits depends on its load and speed, as well as other factors. Bektaş (2011) proposed the pollution routing problem (PRP), clarified the trade-offs among various parameters, such as vehicle load, speed and total cost, and provided an economical and environmentally friendly vehicle routing (Bektaş and Laporte, 2011). Ubeda et al. (2011) measured fuel consumption for different load factor vehicles in Eroski company (Ubeda et al., 2011). Demir (2011) gives an instantaneous emission model that can be used to calculate vehicle emissions at a given speed, acceleration, load or mass, and road gradient (slope) (Demir et al., 2011). Wong (2018) reviewed truck load utilization and routes, and then analyzed the correlation between truck load utilization and truck capacity, load, fuel consumption, truck size, travel distance, and number of destinations (Wong et al., 2018). A carbon driven multi standard model was developed to realize carbon emissions reduction initiative, time and distance cost penalty, truck number minimization and truck utilization improvement.
Carbon emissions factors for road transportation of building material (GB/T 51366-2019, 2019).
However, most of the above studies analyze the factors affecting transport carbon emissions at the macro level, or adopt the method of over accurate laboratory measurement. Moreover, the above-mentioned studies all take transport vehicles as the direct research object, and directly calculate the carbon emissions of materials or components through the carbon emissions of transport vehicles. This method can not be directly applied to the carbon emission calculation of component transportation stage, the specific reasons are as follows:
First of all, considering the size limit, stacking layer limit and installation sequence (as shown in Figure 2), the prefabricated component cannot reach 100% full load. According to the specification, the number of stacking layers of precast laminated slabs should not be greater than 6 during transportation and storage, and the stacking of too many layers will cause the deformation and cracking of the precast laminated slab, which will affect the structural safety and the building life (Liu et al., 2020). However, since the dead weight of the vehicle will not change, the carbon emissions are not directly proportional to the carrying capacity. For example, in the load test of pure electric vehicles in Macao, the energy consumption only increases by 9% ∼ 11% under full load compared with no-load (Zhou et al., 2016). Even in the case of very low load capacity, the carbon emissions per unit weight and mileage tend to be infinite, so the full load ratio is not linearly proportional to the carbon emissions.
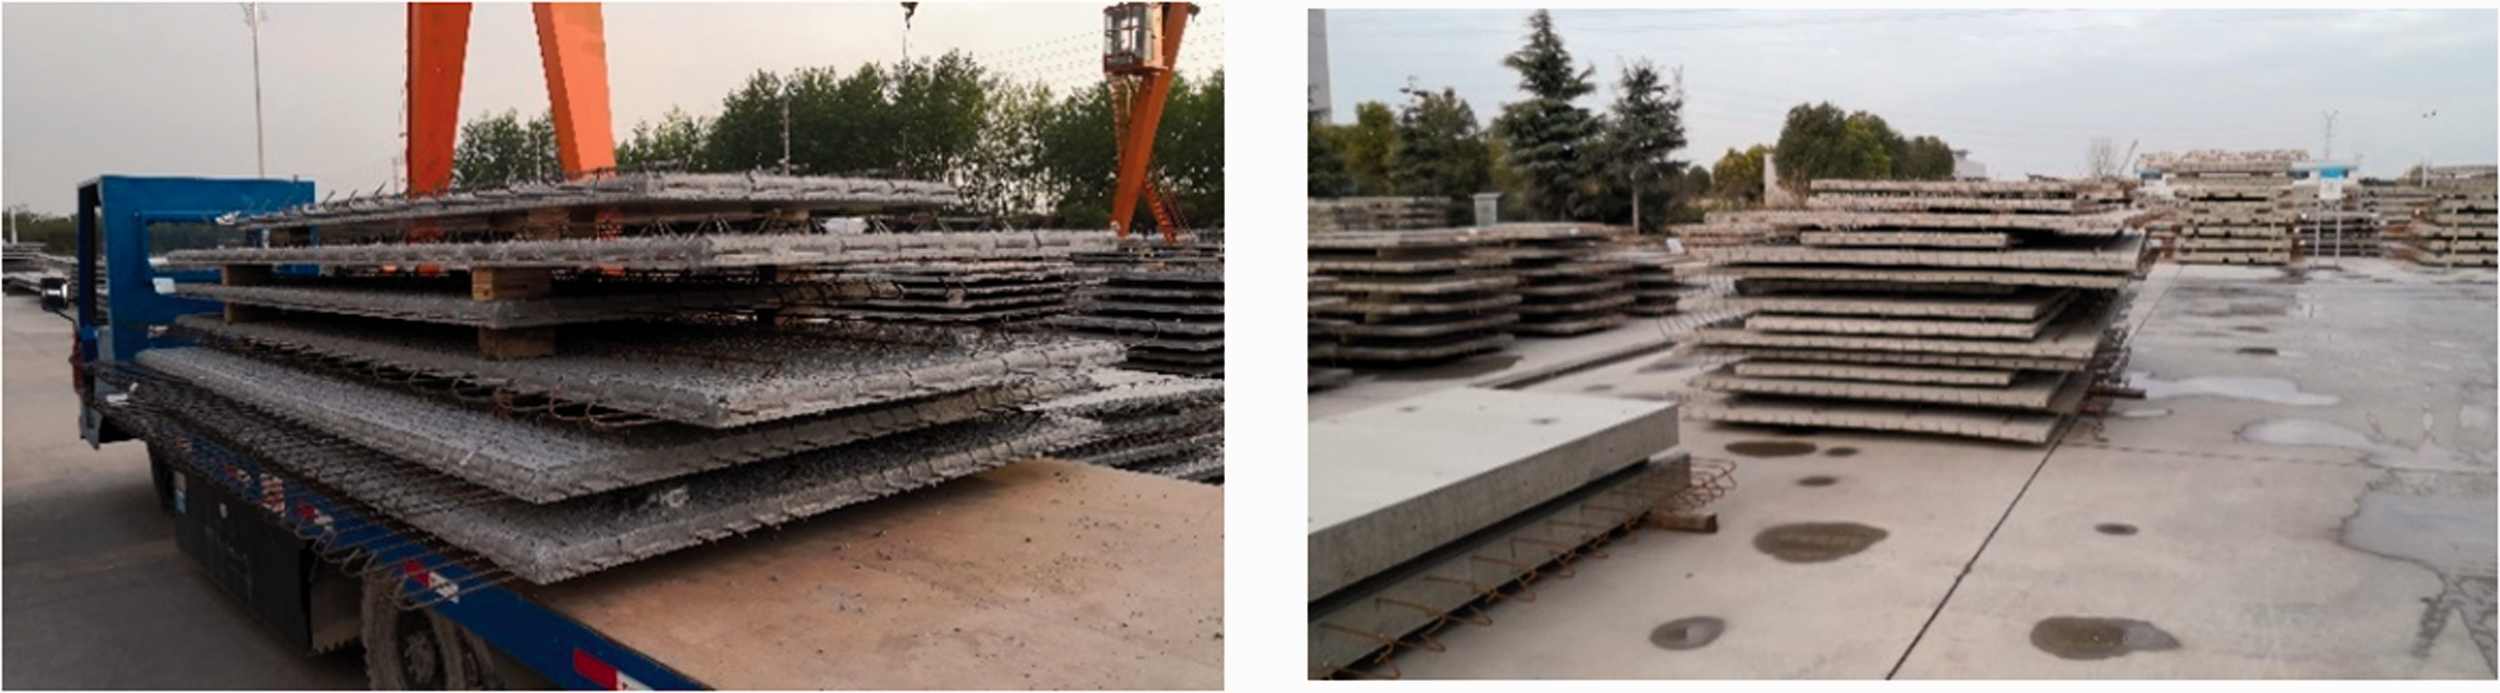
Precast concrete composite slabs in normal transportation and deformation due to excessive stacking layers.
Secondly, considering the service radius and space limitation of construction site (as shown in Figure 3), and due to the precise coordination with the time node of on-site construction process, the transportation of prefabricated component is often carried out in the daytime, even in rush hours, so the average hourly speed varies greatly.
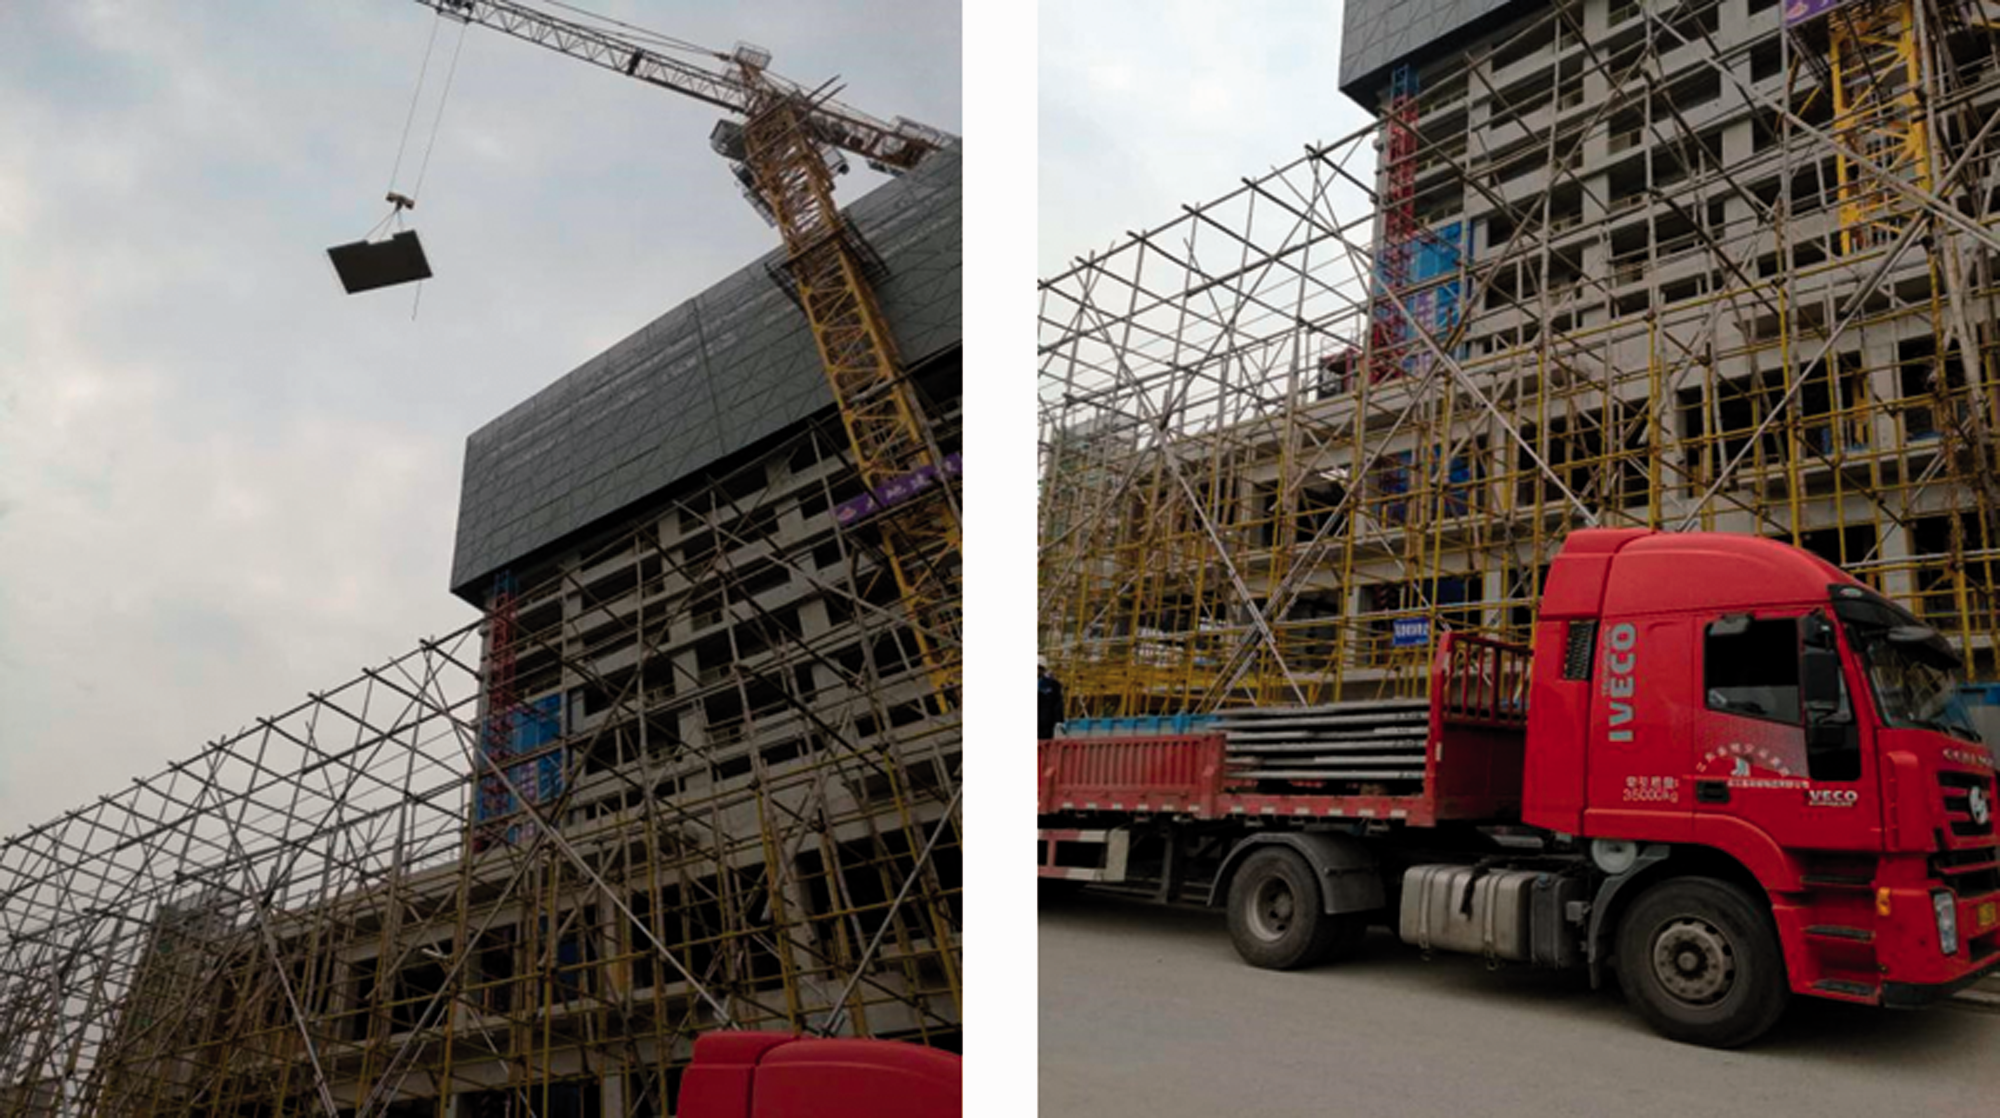
The prefabricated components are directly lifted from the truck when the site is limited.
Thirdly, the difference of atmosphere temperature during transportation, the different working conditions of engine, the different internal friction between gear box and transmission, and the change of rolling friction coefficient between tires and ground will lead to the difference of actual carbon emission (Huang et al., 2020).
Although the automotive and internal combustion engine industry has a complete set of methods for energy consumption and carbon emissions calculation, such as software simulation based on specific engine universal curve or running corresponding standard cycle conditions on chassis dynamometer (Albulescu et al., 2020). But the above-mentioned methods are all used to measure the carbon emissions of vehicles or engines under the coordinate system of unified use environment, and its fundamental purpose is to measure the advantages and disadvantages of vehicles. However, the purpose of carbon emissions calculation research in component transportation phase is to restore the real carbon emissions during component transportation. Therefore, there is a big gap between the method and the field of automobile and internal combustion engine in terms of methods and objectives. Moreover, the input parameters of the above-mentioned software simulation and laboratory measurement methods are too many, which cannot be found one by one in the carbon emissions calculation applicable to the daily transportation of prefabricated buildings.
Therefore, this study takes components as the research object, carries out experimental measurement on carbon emissions and related parameters of the same truck in the transportation phase, and carries out regression analysis through statistical methods, so as to establish a carbon emissions calculation model suitable for prefabricated component transportation, in order to supplement the 2019 edition of Calculation Standard for Carbon Emission from Buildings, which can be more suitable for prefabricated buildings in the transportation phase, better reflect the real carbon emissions in the transportation phase of components.
Research methods
Case introduction
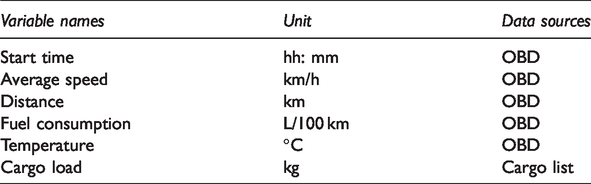
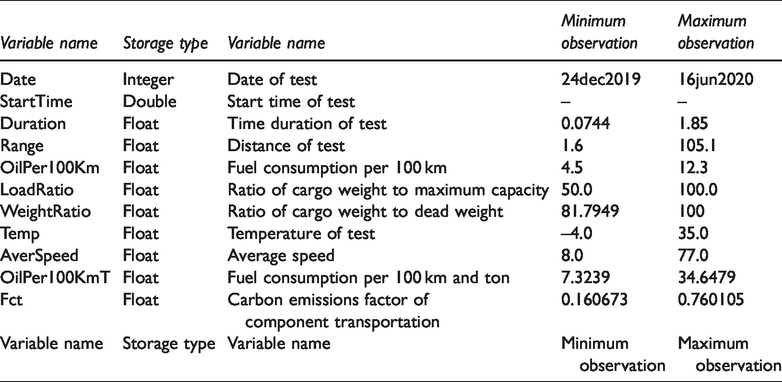
In this study, the real carbon emissions in the process of component transportation are reflected by the actual transportation driving state of heavy vehicles under real road traffic conditions. The test site is located in Nanjing, Jiangsu Province, China. The carbon dioxide emission into the atmosphere is calculated by calculating the fuel consumption. The On-Board Diagnostics (OBD) interface is used to collect the status information of transport vehicles, including start time, average speed, distance, fuel consumption and temperature. In addition, the cargo load data is provided by the cargo manifest data (the specific test parameters are shown in Table 2).
Variables recorded of real-world performance.
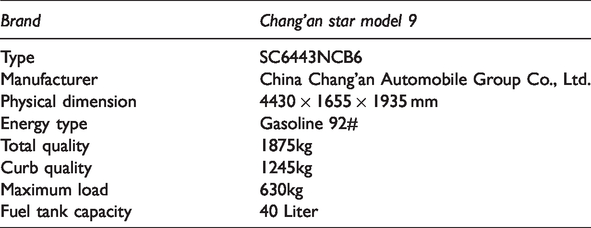
The test vehicle is Chang'an star model 9 type transport vehicle. The total weight of the vehicle is 1875 kg, the curb quality is 1245 kg, the maximum load is 630 kg, and the fuel used is 92# gasoline (the specific test parameters are shown in Table 3).
Test vehicle specific technical parameters.
System boundary
This study focuses on the carbon emissions in the prefabricated component transportation phase, so it only involves the calculation and estimation of carbon emissions under normal conditions in this process.
Assumption 1. Only the carbon emissions in the process of energy consumption, i.e. tank to wheel (TTW), are considered, while the carbon emissions in the process of energy generation and energy rationing transportation, i.e. well to tank (WTT), are not considered. The combination of TTW and WTT constitutes the whole life cycle carbon emissions of energy, that is, well to wheel (WTW). For transport vehicles using gasoline as fuel, both TTW and WTT are directly proportional to the amount of fuel consumed.
Assumption 2. No emergency occurs during transportation, for instance, vehicle engine breakdown, traffic accident, unusual weather environment such as rain, snow, typhoon. Considering that some prefabricated buildings are located in the main urban area, and the transportation time of component is distributed throughout daytime, the traffic jam is considered, which represented as lower average speed and higher carbon emissions under the condition of unit weight and mileage.
Assumption 3. This study is located in Nanjing, Jiangsu Province, with an average altitude of 20–30 meter. Therefore, the impact of oxygen concentration on carbon emissions and the impact of frequently uphill and downhill vehicles on carbon emissions are not considered in the test.
Assumption 4. The density of fuel fluctuates with the change of atmosphere temperature, both applied with gasoline and diesel. The volume is used as the unit in the calculation of fuel injection quantity and the process of fuel filling in the OBD system. Therefore, the influence of fuel density on carbon emissions is ignored in this study (Zheng et al., 2020).
Assumption 5. In this study, the effects of fuel quantity and driver's weight are ignored. The fuel tank volume of the test vehicle is 40 Litre, which is far less than the vehicle's self-weight, and all the testing processes are completed by the same driver, so as to ignore the influence of driving habits on the final experiment.
Assumption 6. The carbon emissions in the transportation phase of prefabricated component does not consider the carbon emissions generated by lifting tools involved in the lifting process of component in the factory and on site. The former is included in the component production phase, and the latter is included in the construction phase.
Calculation model
For the evaluation of transportation carbon emissions in the process of prefabricated building construction, the main body of calculation is the sum of the carbon emissions generated by all prefabricated components from the factory to the construction site (as shown in Formula 1).
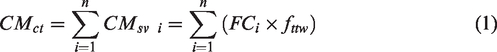
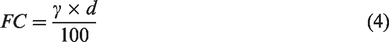
The transport vehicle used in this study uses 92# gasoline and the density is 720–775 kg/m3 at 20 °C (GB 17930-2016, 2016). Considering the convenience of calculation, the approximate median value of 750 kg/m3 is taken. The carbon emission coefficient of gasoline is 2.9251 kg-CO2e/kg, and the final value of
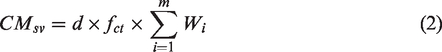
Since each component transport vehicle transports more than one prefabricated component, the transport carbon emissions of vehicles carrying out specific component transportation tasks can be calculated by the following formula (as shown in Formula 2)
Parameters
Formula 3 is obtained by combining Formula 1 and Formula 2:
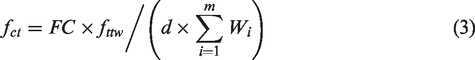
In the actual test process, the fuel consumption 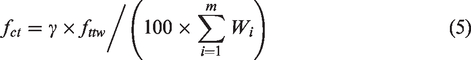
In the test experiment, the calculation formula of load ratio is shown in Formula 6, where 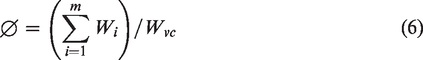
Formula 7 is obtained by introducing Formula 6 into Formula 5. As a single vehicle model is used in this study, 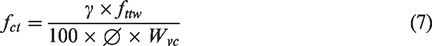
Functional unit
The unit of carbon emission factor of building materials transportation in 2019 edition of Calculation Standard for Carbon Emission from Buildings is kg-CO2e/t· km, and it is only related to weight and driving mileage, and the default transportation distance of concrete is 40 km, and the transportation distance of other building materials is 500 km.
The unit of carbon emissions factor in the transport phase of the components involved in this study is also kg-CO2e/t· km. However, considering the characteristics of prefabricated component transportation, such as the influence of factors such as full load ratio and average speed, it is necessary to determine the carbon emission factor of each vehicle according to the actual situation of each vehicle, and the latter will also be compensated by relevant limiting factors.
Method to figuring out factor of component transportation
In the process of data processing, correlation matrix is used to roughly determine the correlation between compensation parameters (Forrester and Zhang, 2020); scatter plot is drawn to determine whether
Under the above preconditions, the simple linear model is used to carry out regression analysis on
Results
This study was conducted in Nanjing, Jiangsu Province, China. The real-world performance test was conducted with the same vehicle and the same driver. The test vehicle was in good condition and always used the same brand and specification of engine oil during the test. The front tire pressure was 17.0 kPa, the rear tire pressure was 21.0 kPa, the fuel supplier was Sinopec, the oil product was 92# national five non ethanol gasoline, the vehicle age was 4 years, the total vehicle mileage was about 1,10,000 km, and the driver's driving experience was 12 years. The test time span was from December 2019 to June 2020, covering spring, summer and winter.
Preliminary data observations
There are 393 observations and 11 variables involved in this study. Considering that the maximum speed limit of urban roads in China is generally 80 km/h, the number of observations is 372 after ignoring the observation value with average speed greater than 80.0. The specific situation of variable and observation after combing is shown in Table 4.
Statistical list of variables and observations.
Correlation matrix of variables
The correlation analysis of variables is shown in Figure 4 and Table 5, including 10 variables. Among them, Starttime (−0.0668), Duration (0.2268) and Range (−0.2566) were weakly associated with Fct, so their impact compensation on Fct is ignored in subsequent studies.
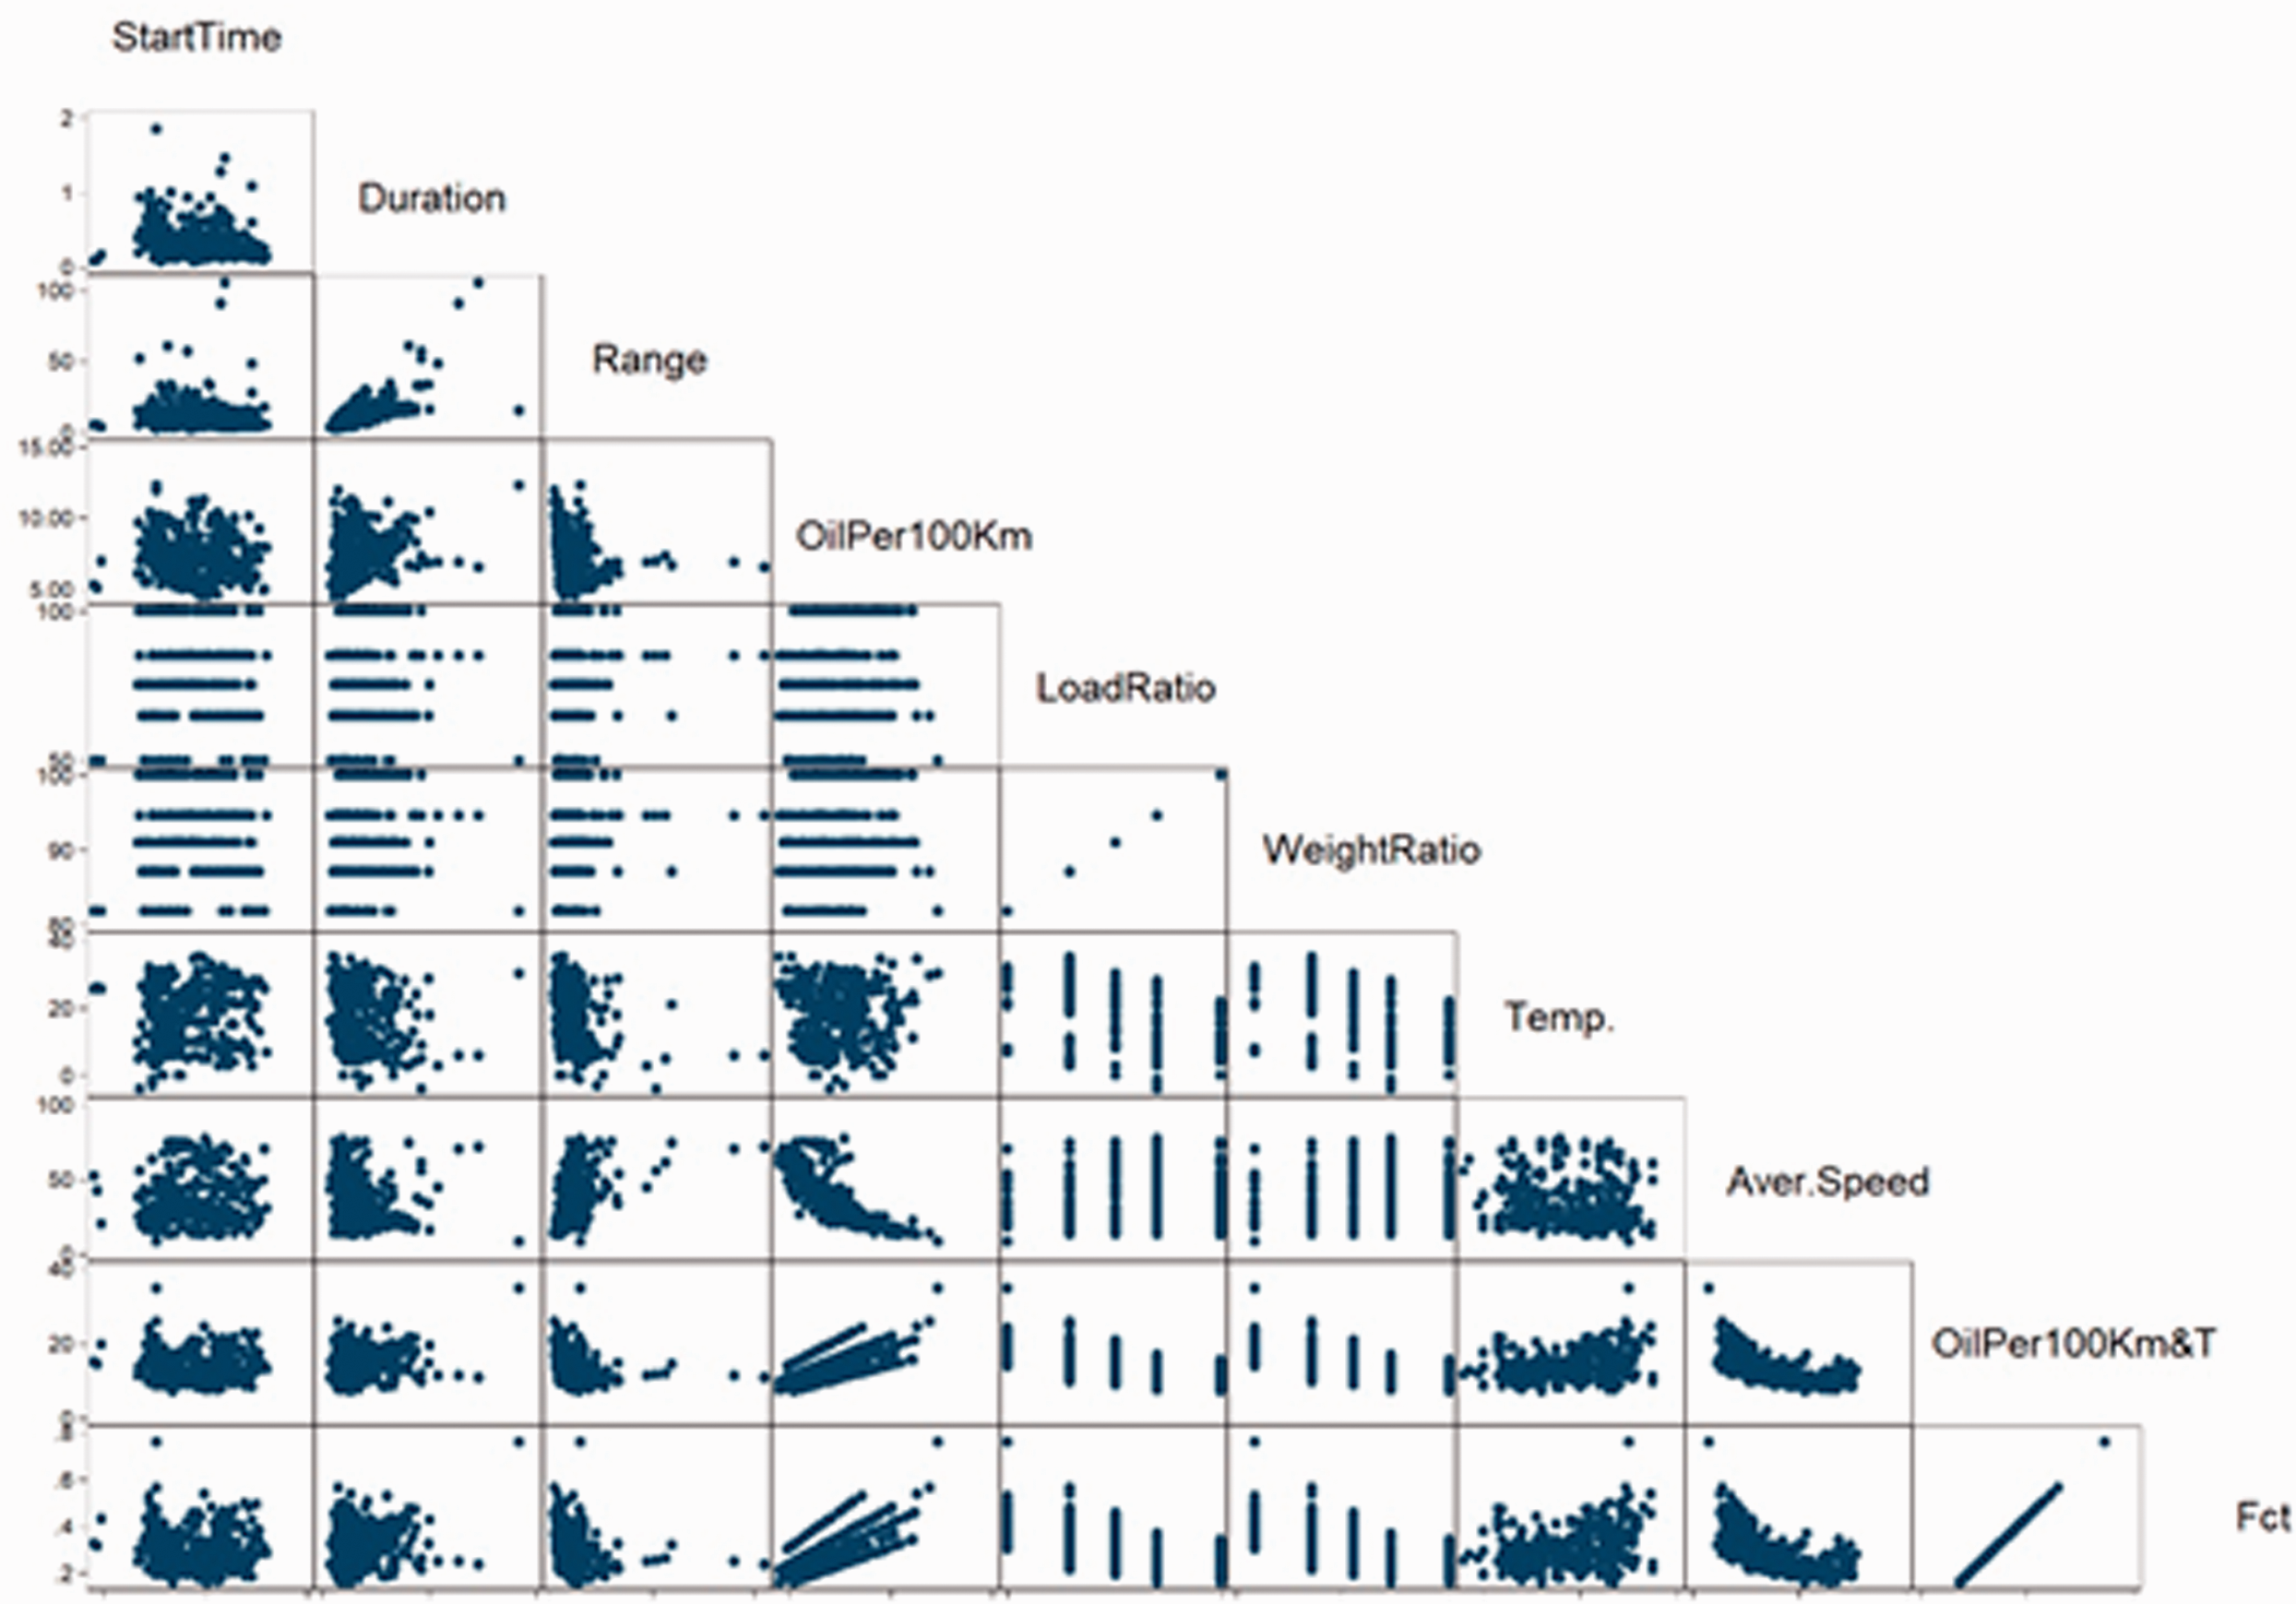
Correlation matrix graph.
Correlation matrix of variables.
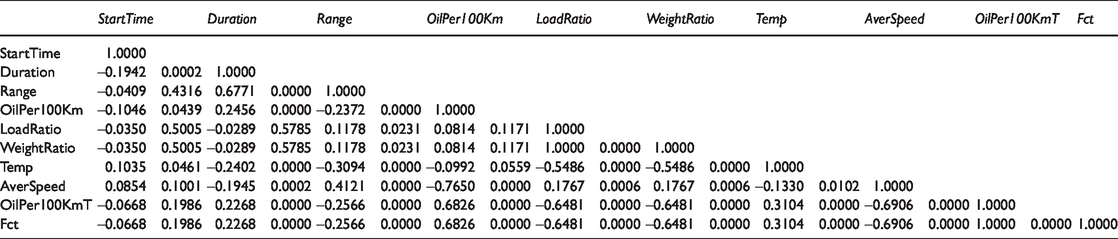
The correlation between the variables LoadRatio and WeightRatio is 1.0, so the correlation ratio of the two variables to Fct is -0.6481 (p-value is less than 0.0001). These two variables have corresponding relationship and can replace each other. Considering that the relationship between LoadRatio and component weight is closer, LoadRatio is used as one of the alternative variables.

The correlation between OilPer100KmT and Fct is 1.0 (p-value less than 0.0001). There is a direct linear relationship between the two variables (as shown in Formula 08), and the value of
The correlation between OilPer100Km, OilPer100KmT and Fct is 0.6826 (p-value is less than 0.0001), and the relationship between OilPer100Km and OilPer100KmT is shown in Formula 9. Since the value of 
Therefore, the three variables, LoadRatio (−0.6481), Temp (0.3104) and Aver Speed (- 0.6906), which have the greatest correlation with Fct, are reserved as the compensation parameters of Fct, and their p-values are all less than 0.0001. In addition, the specific data can be obtained before the actual component transportation starts. LoadRatio can be obtained by component transportation layout scheme; Temp can be obtained by weather forecast; Aver Speed can be obtained by inputting the three parameters of starting position, end position and starting time into navigation software, which can feedback the estimated values with certain accuracy according to the background database and intelligent algorithm.
Variables evaluation
Load ratio
In the test, the full load rates of 50%, 65%, 75%, 85% and 100% were tested respectively. The distribution of Fct variable observation values of carbon emission factor is shown in Figure 5. The observed values of each full load rate interval are normally distributed, and there is no significant abnormal value. Although the full load ratio is divided into five stages in the test, the numerical distribution of the full load ratio meets the requirements of continuous variables, not binary variables or categorical variables.
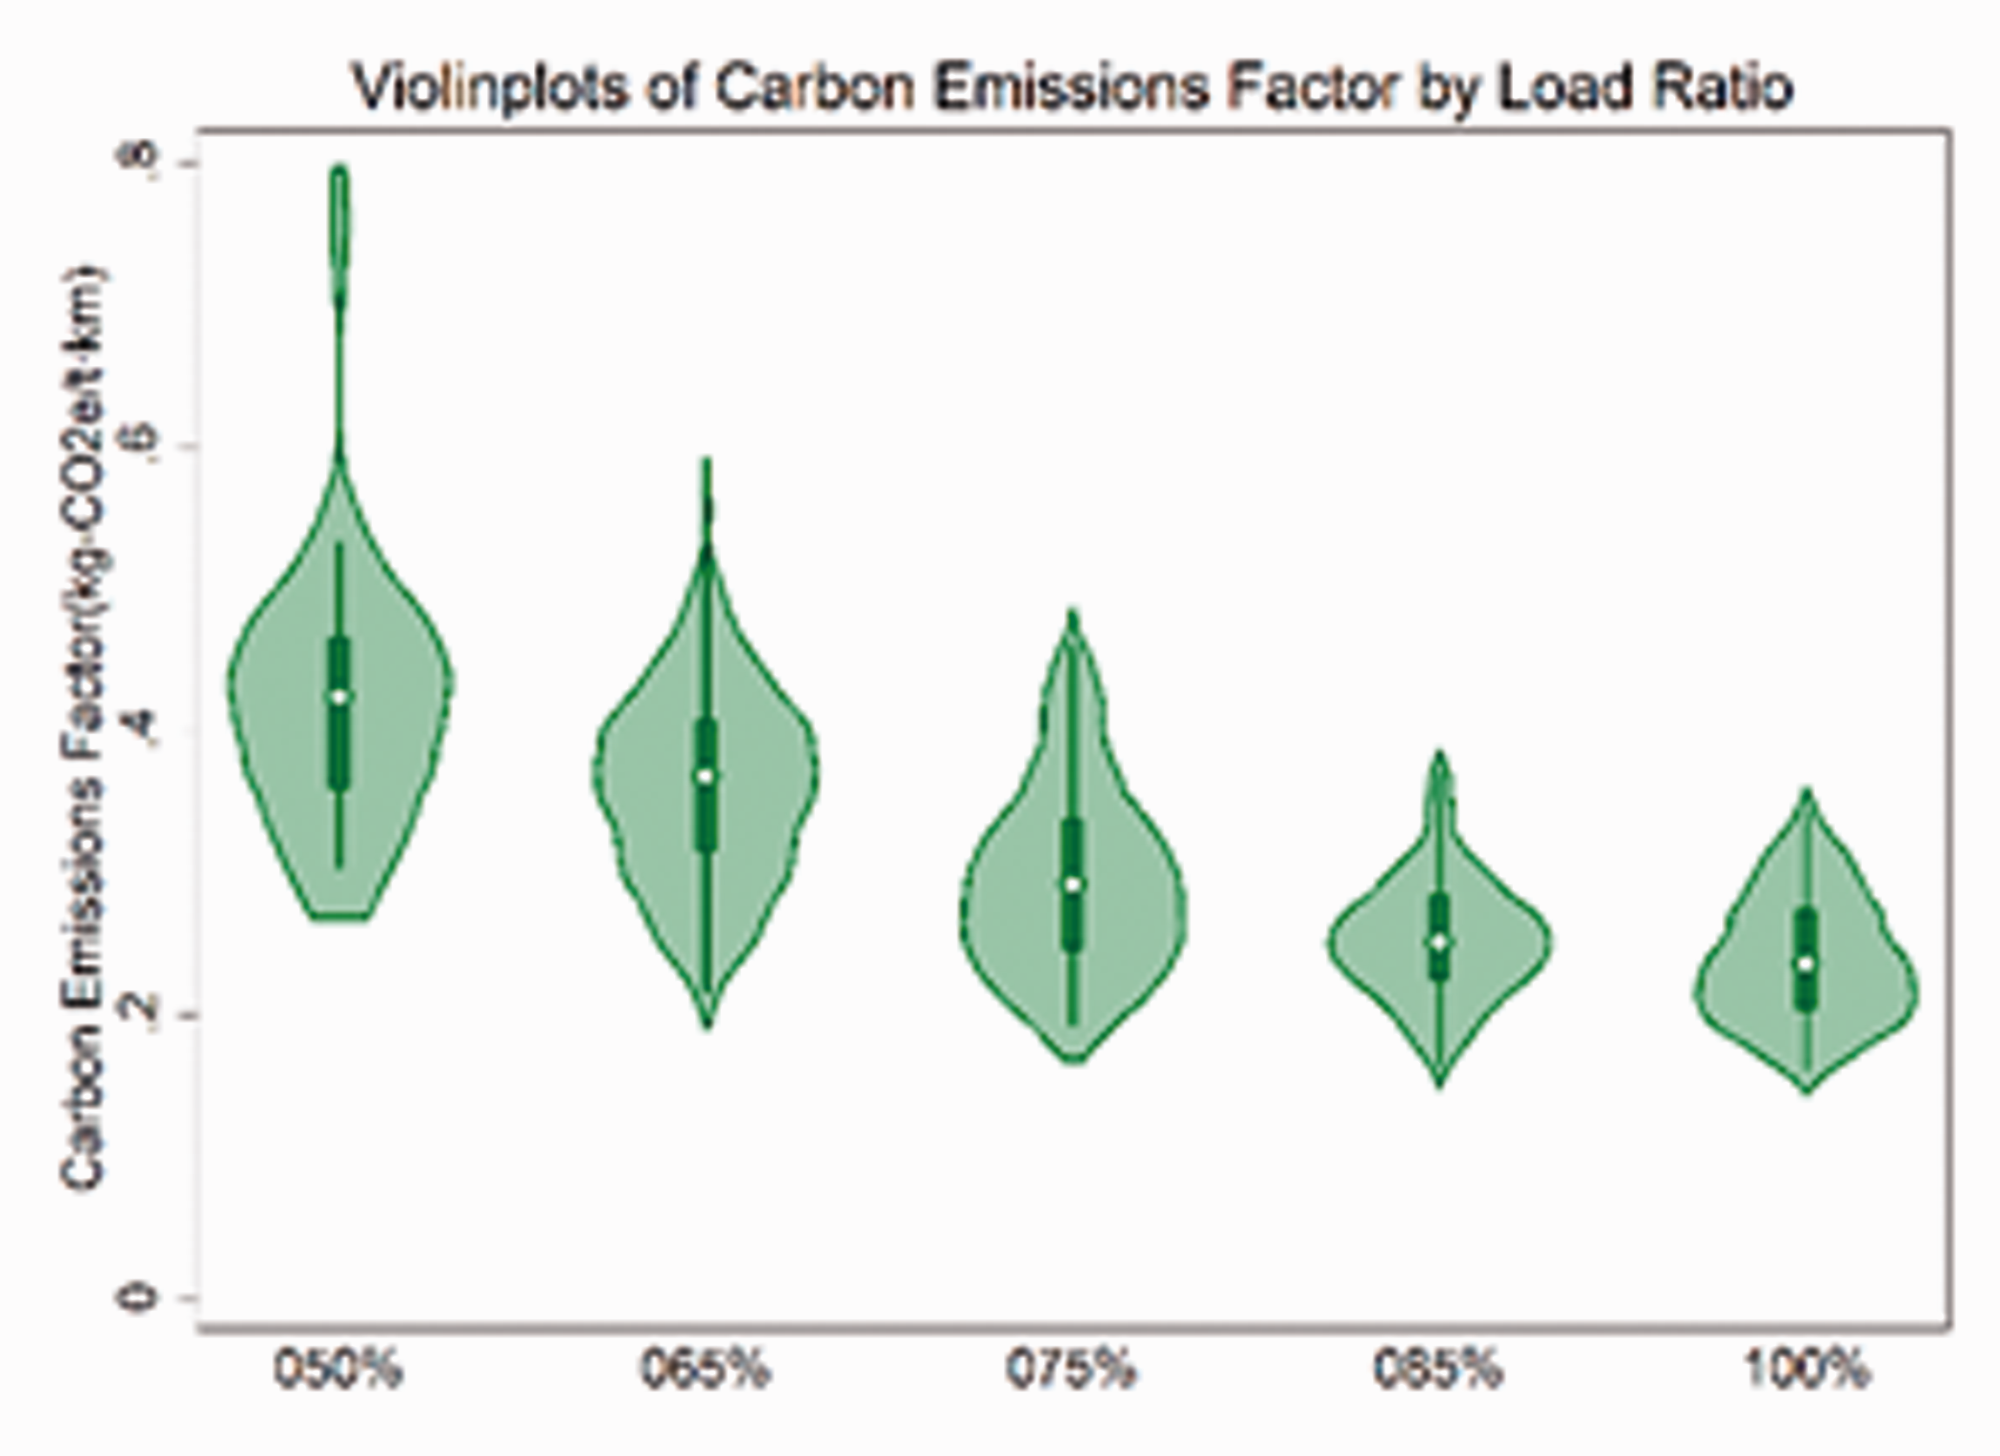
Violinplots of carbon emissions factor by load ratio.
From the distribution of the observed values, it can be seen that there is an inverse correlation between the variables LoadRatio and Fct, which basically conforms to the preconditions of simple linear regression.
Temperature
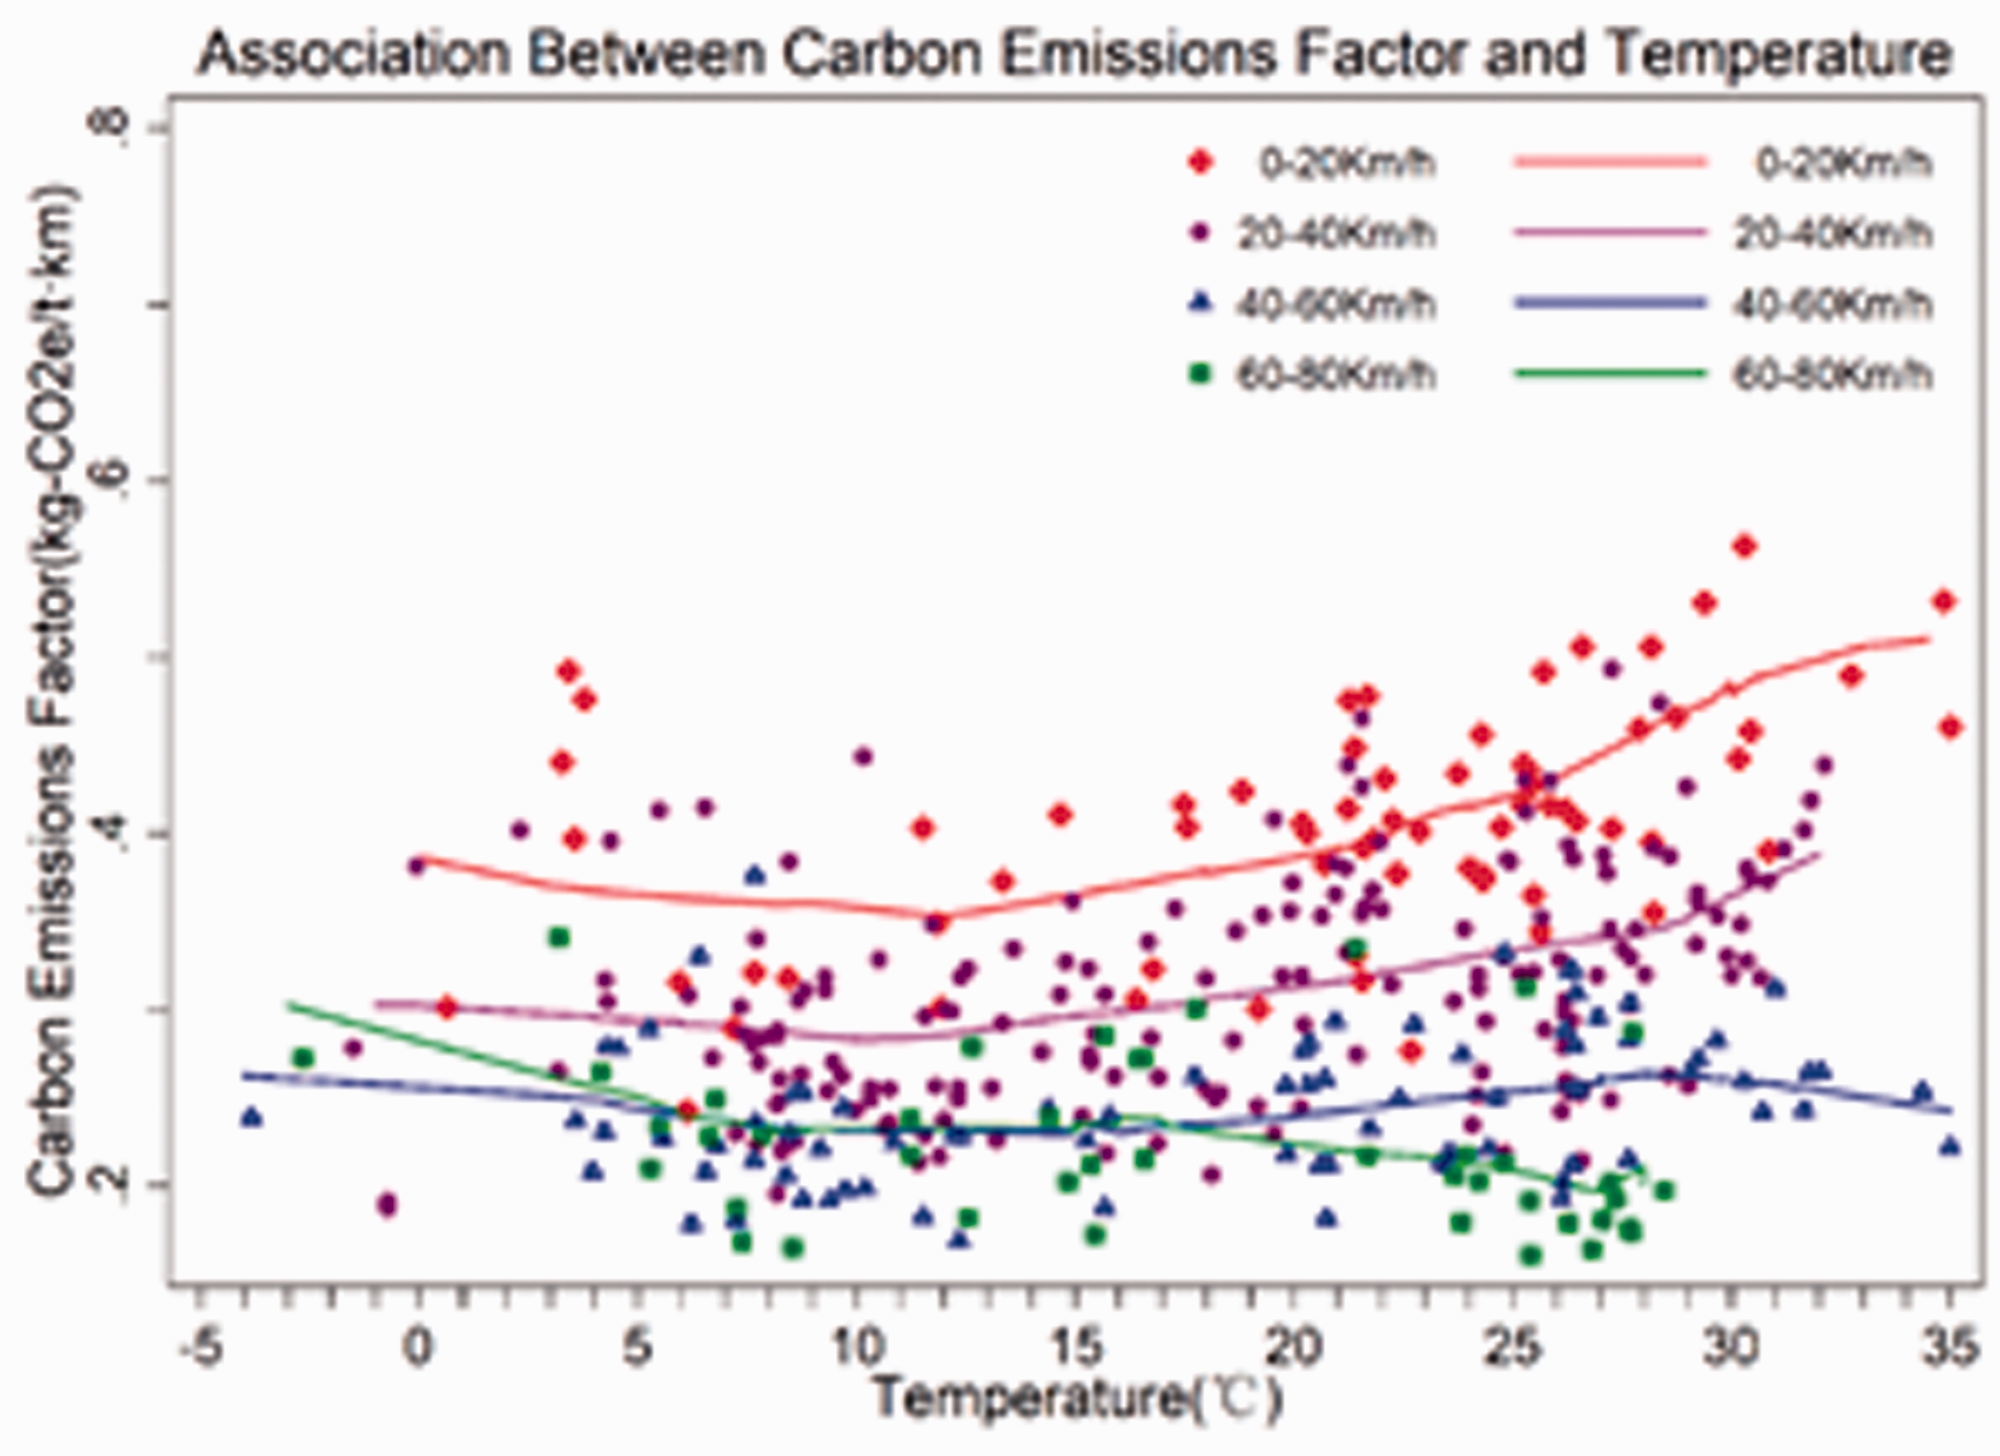
From the distribution of the observed values in Figures 6 and 7, it can be seen that the variables Temp and Fct are continuous variables, and there is almost no outlier, and there is a positive correlation between them, which basically conforms to the preconditions of simple linear regression.
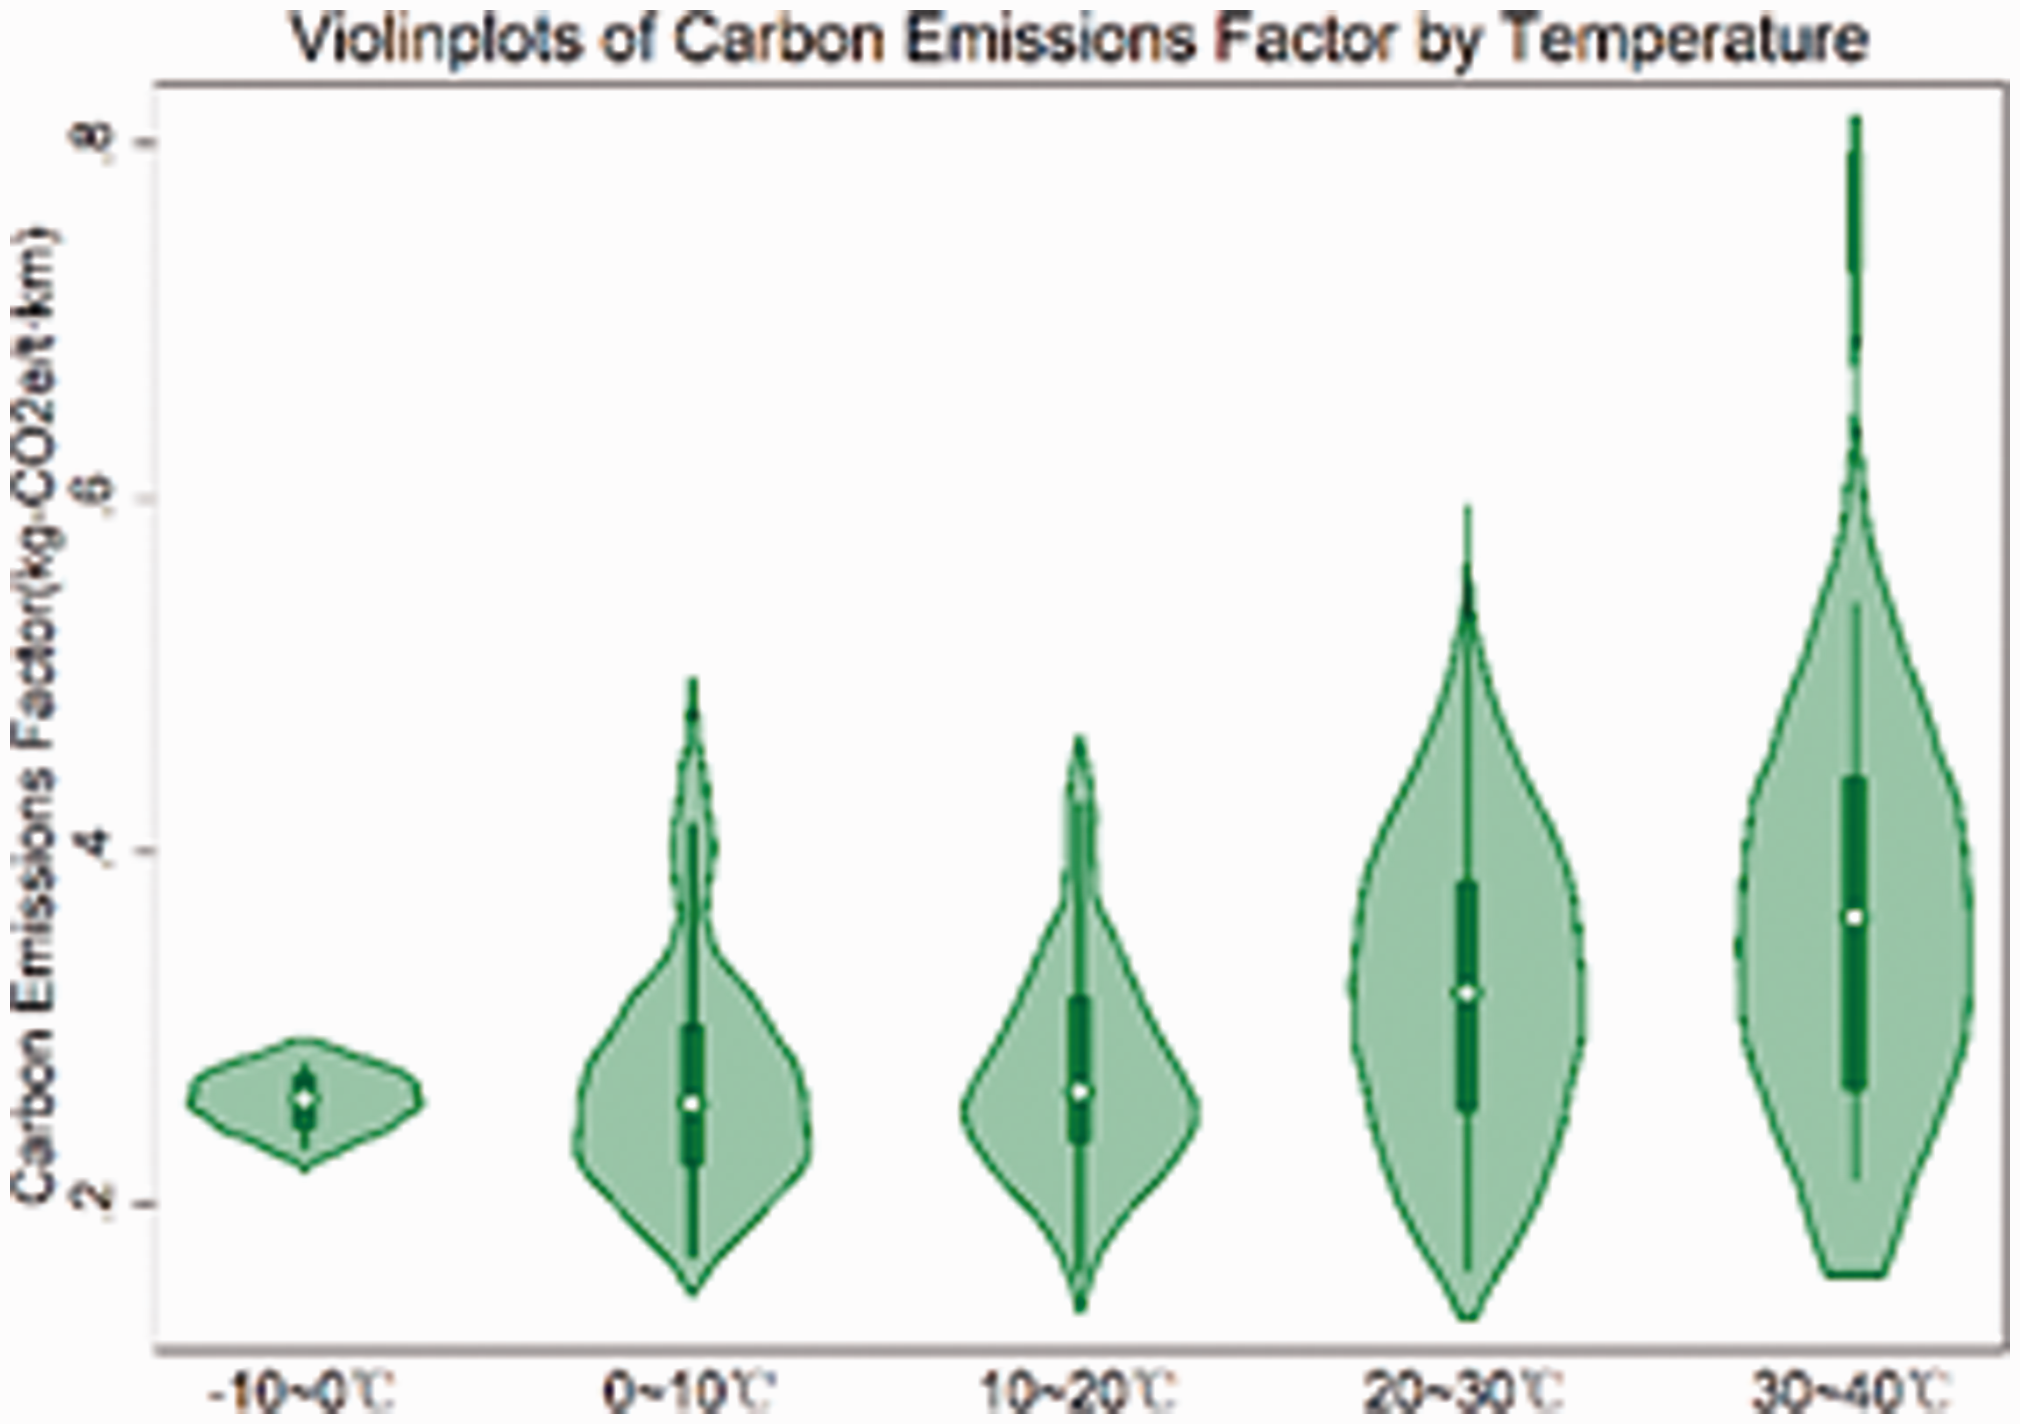
Violinplots of carbon emissions factor by temperature.
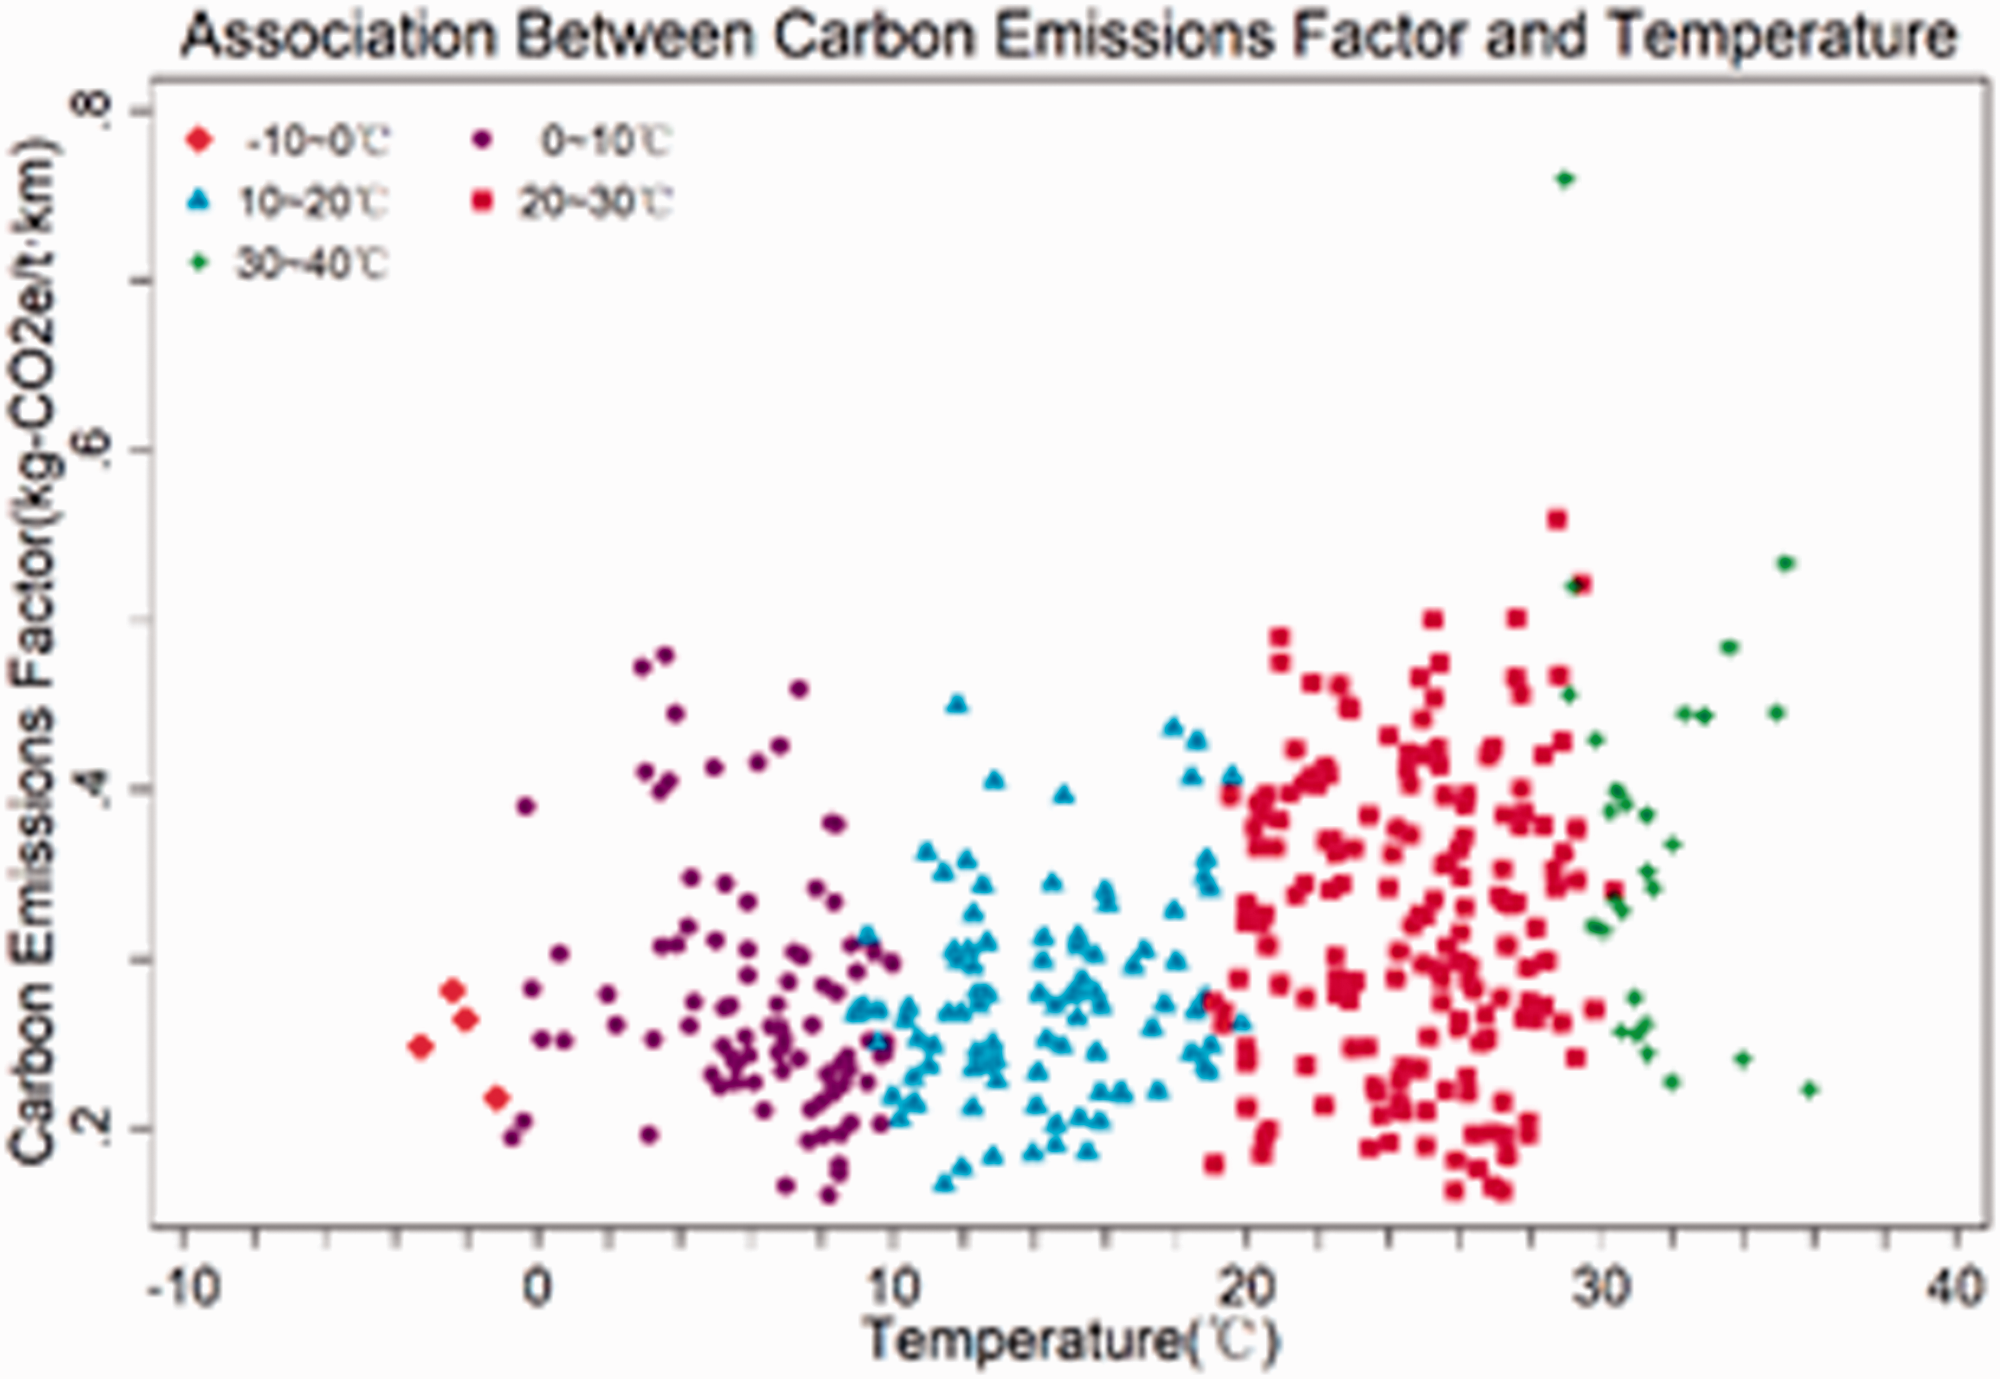
Scatter plot of carbon emissions factor by temperature.
Average speed
From the distribution of the observed values in Figures 8 and 9, it can be seen that AverSpeed and Fct are continuous variables with almost no outliner, and there is inverse correlation between them, which meets the preconditions of simple linear regression.
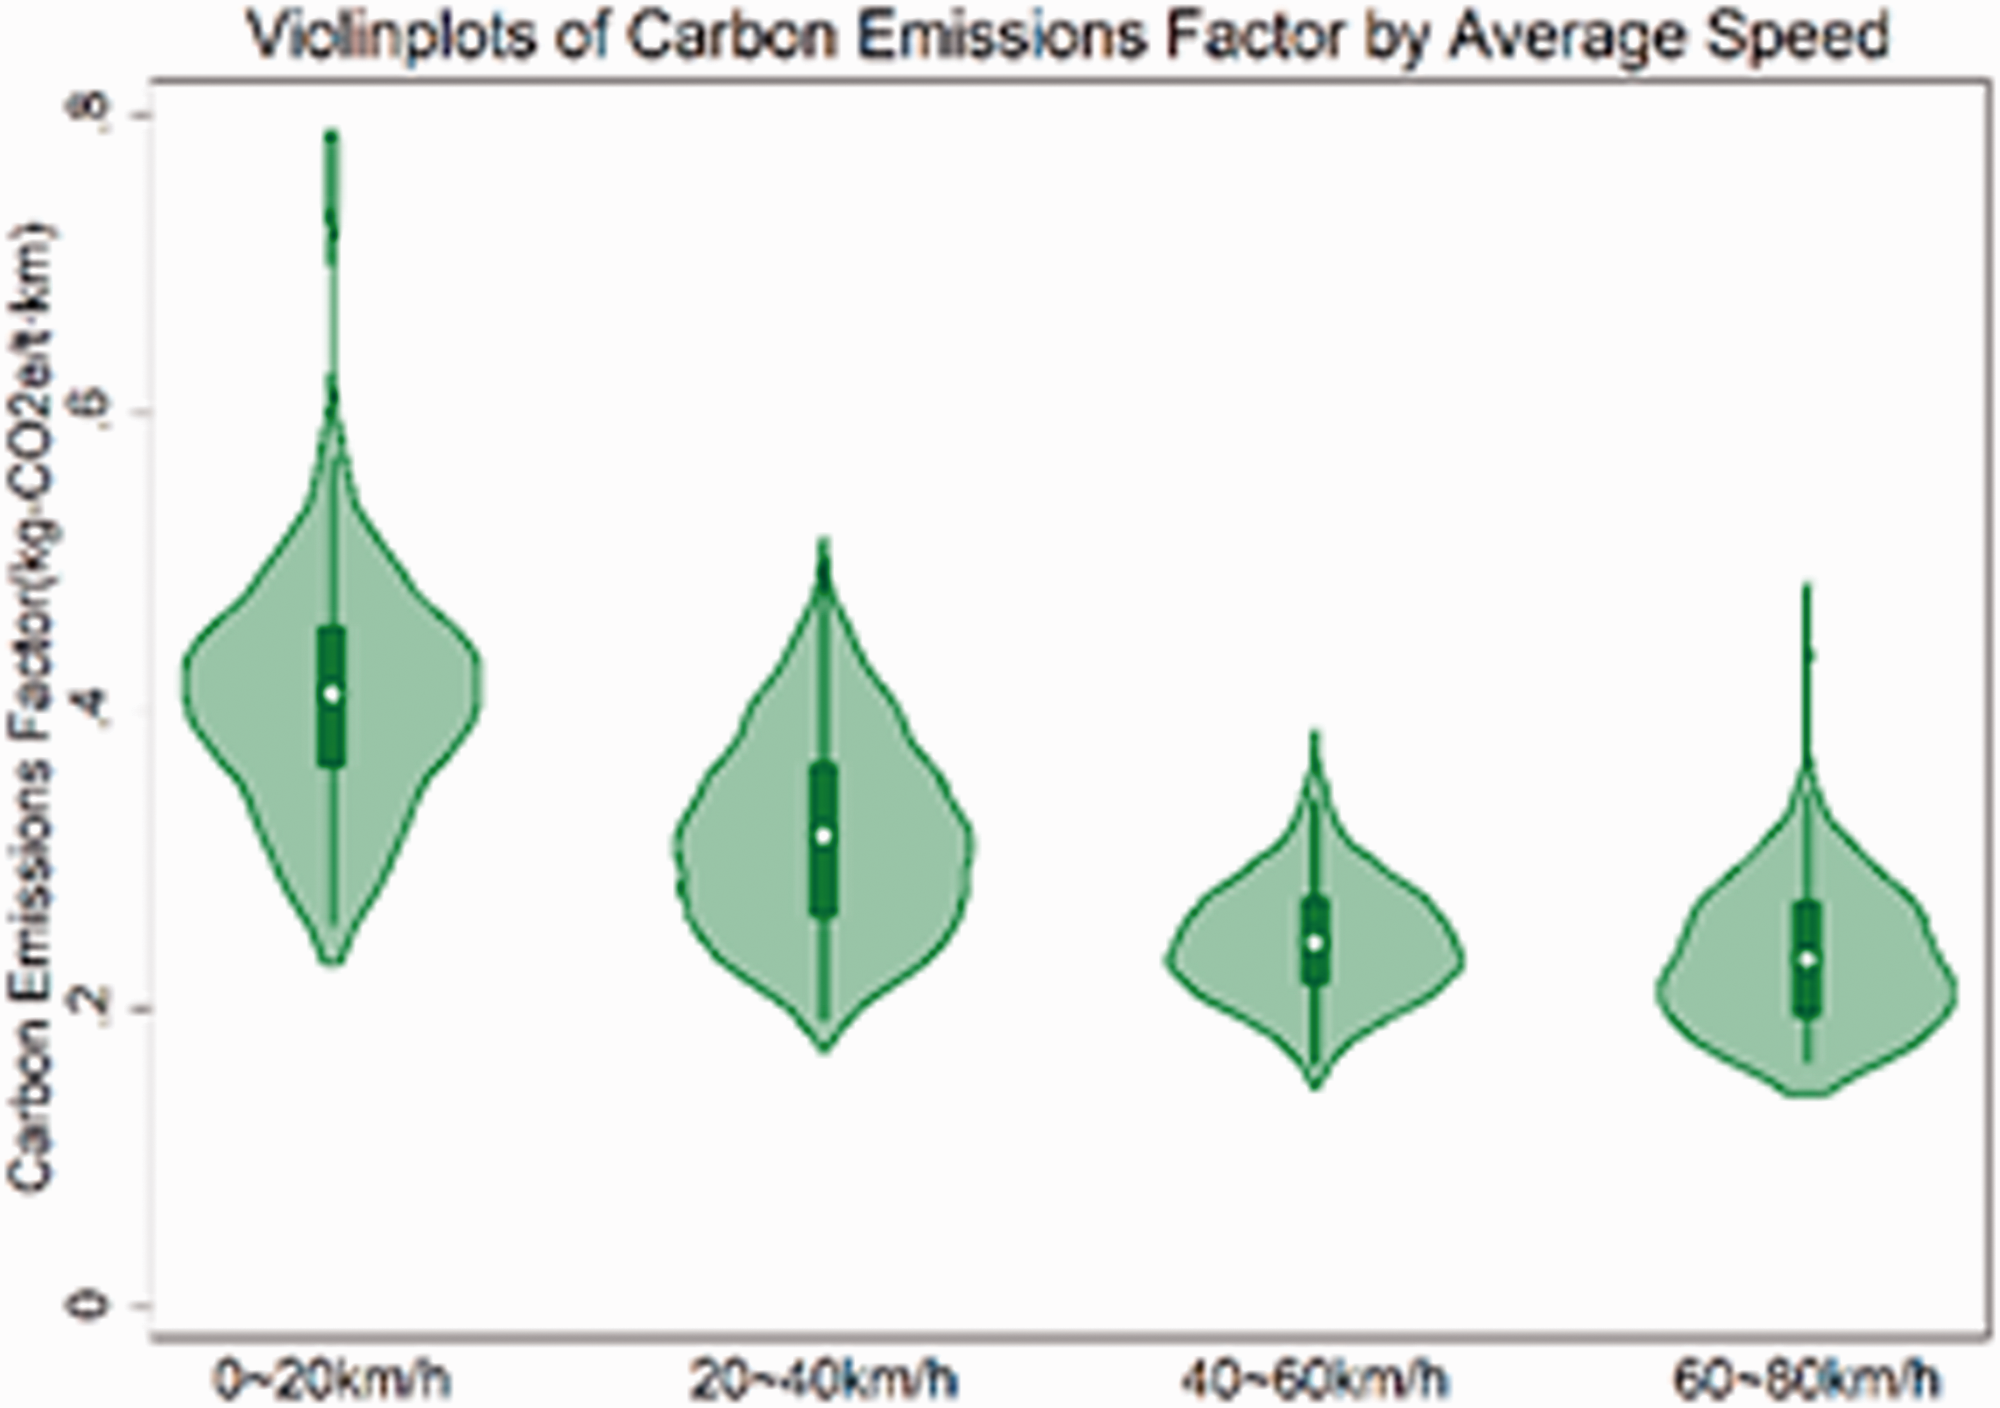
Violinplots of carbon emissions factor by average speed.
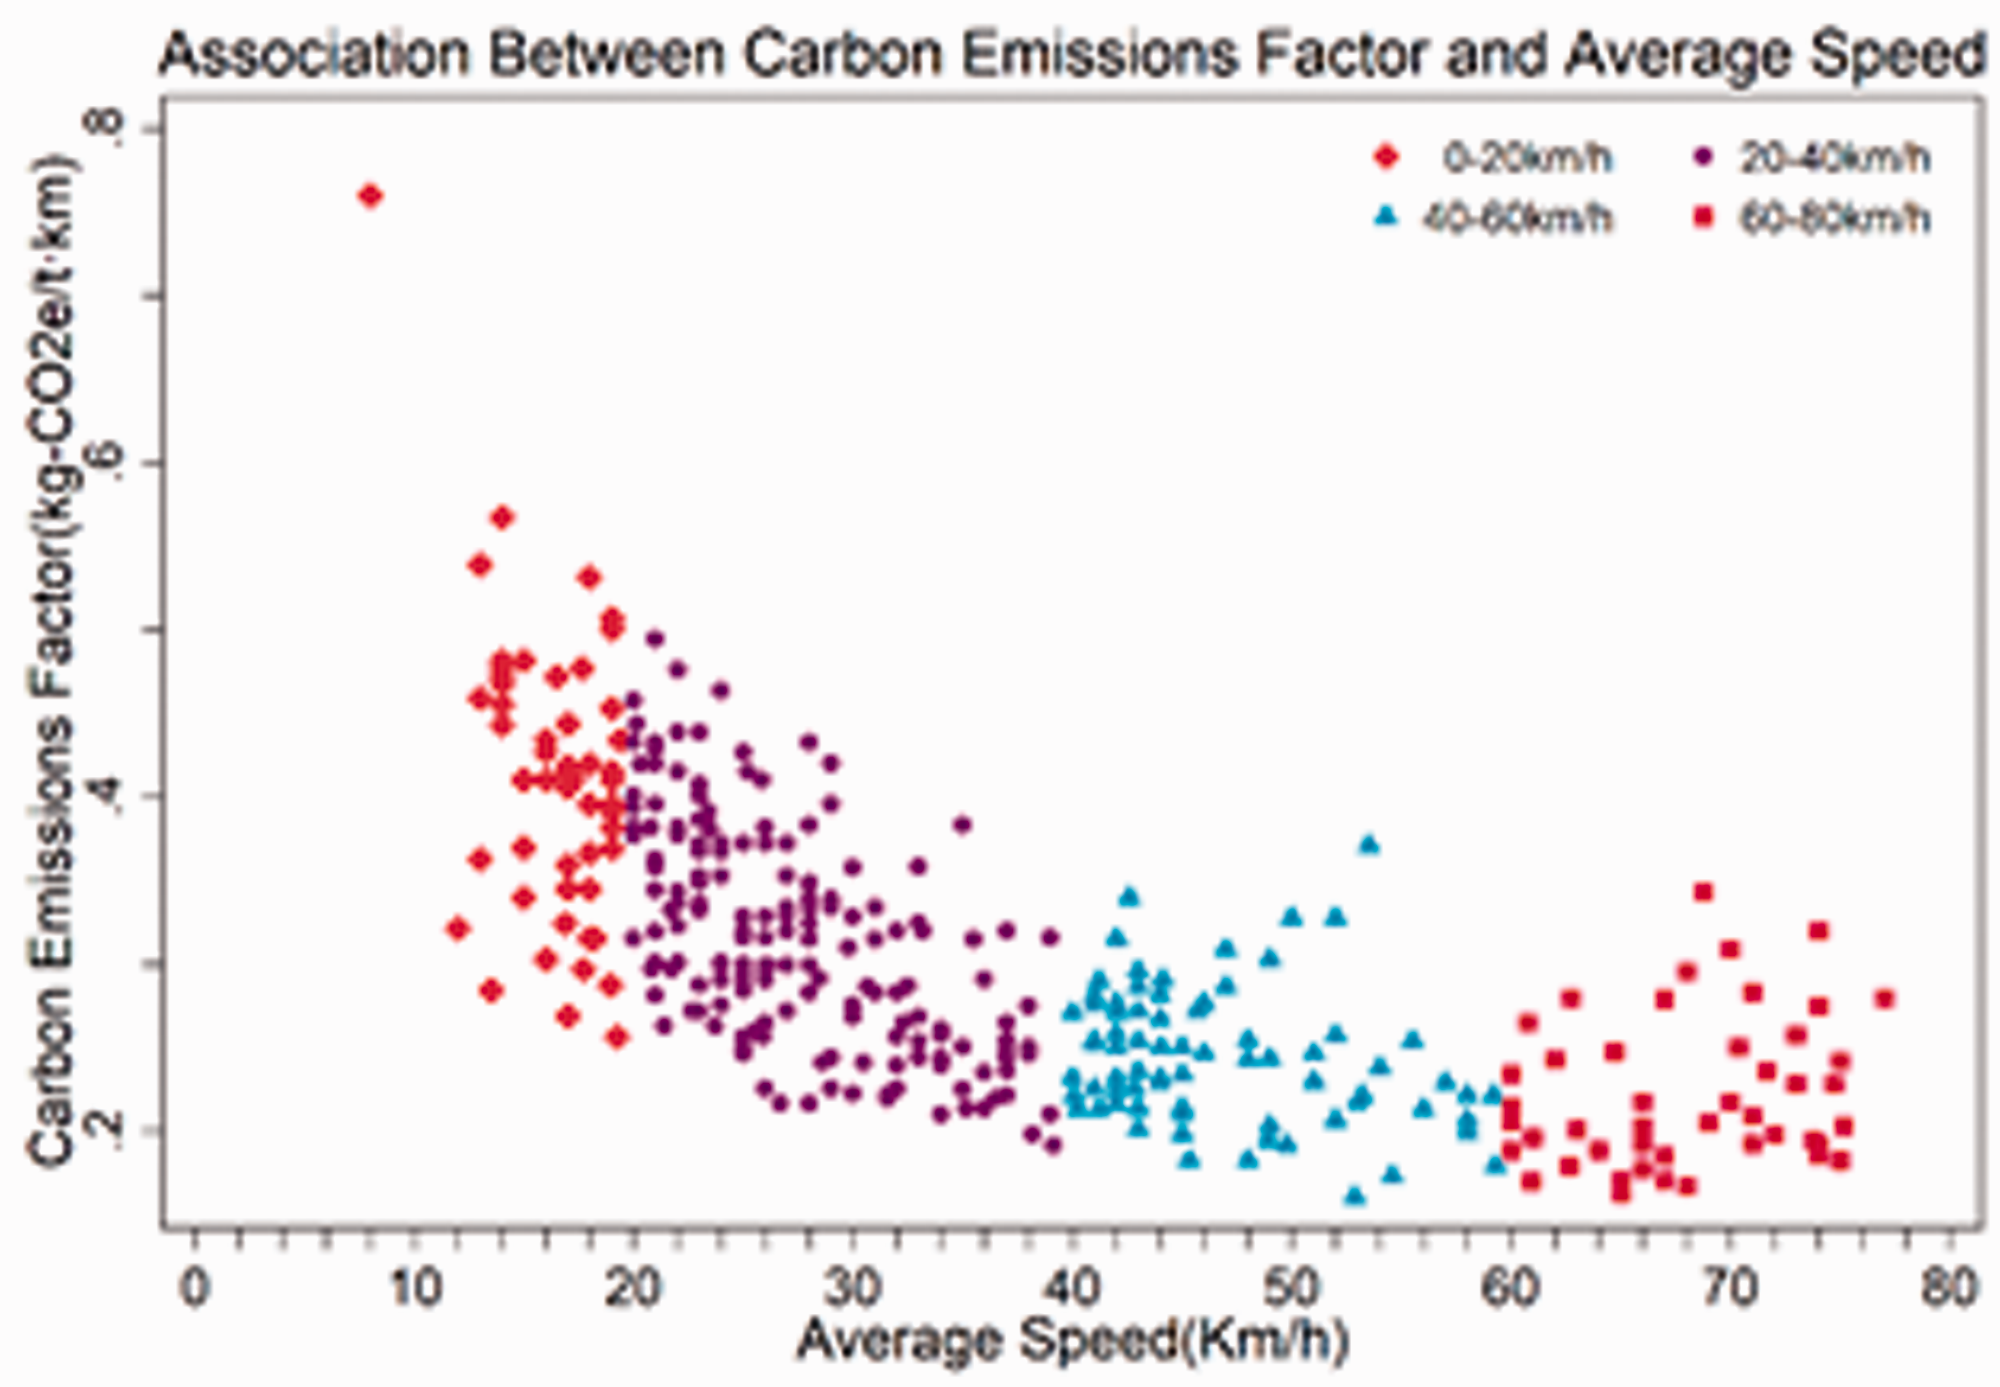
Scatter plot of carbon emissions factor by average speed.
Discussion
Simple linear regression analysis
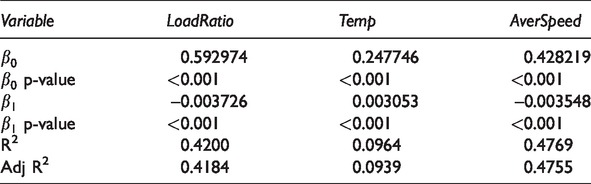
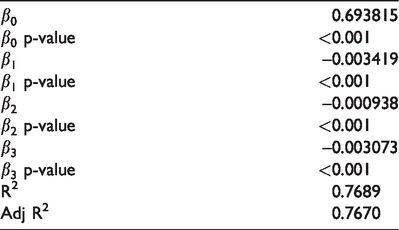
The variables LoadRatio, Temp and AverSpeed are simple linear regression of Fct. The regression formula is shown in Formula 10, where 
Simple linear regression results.
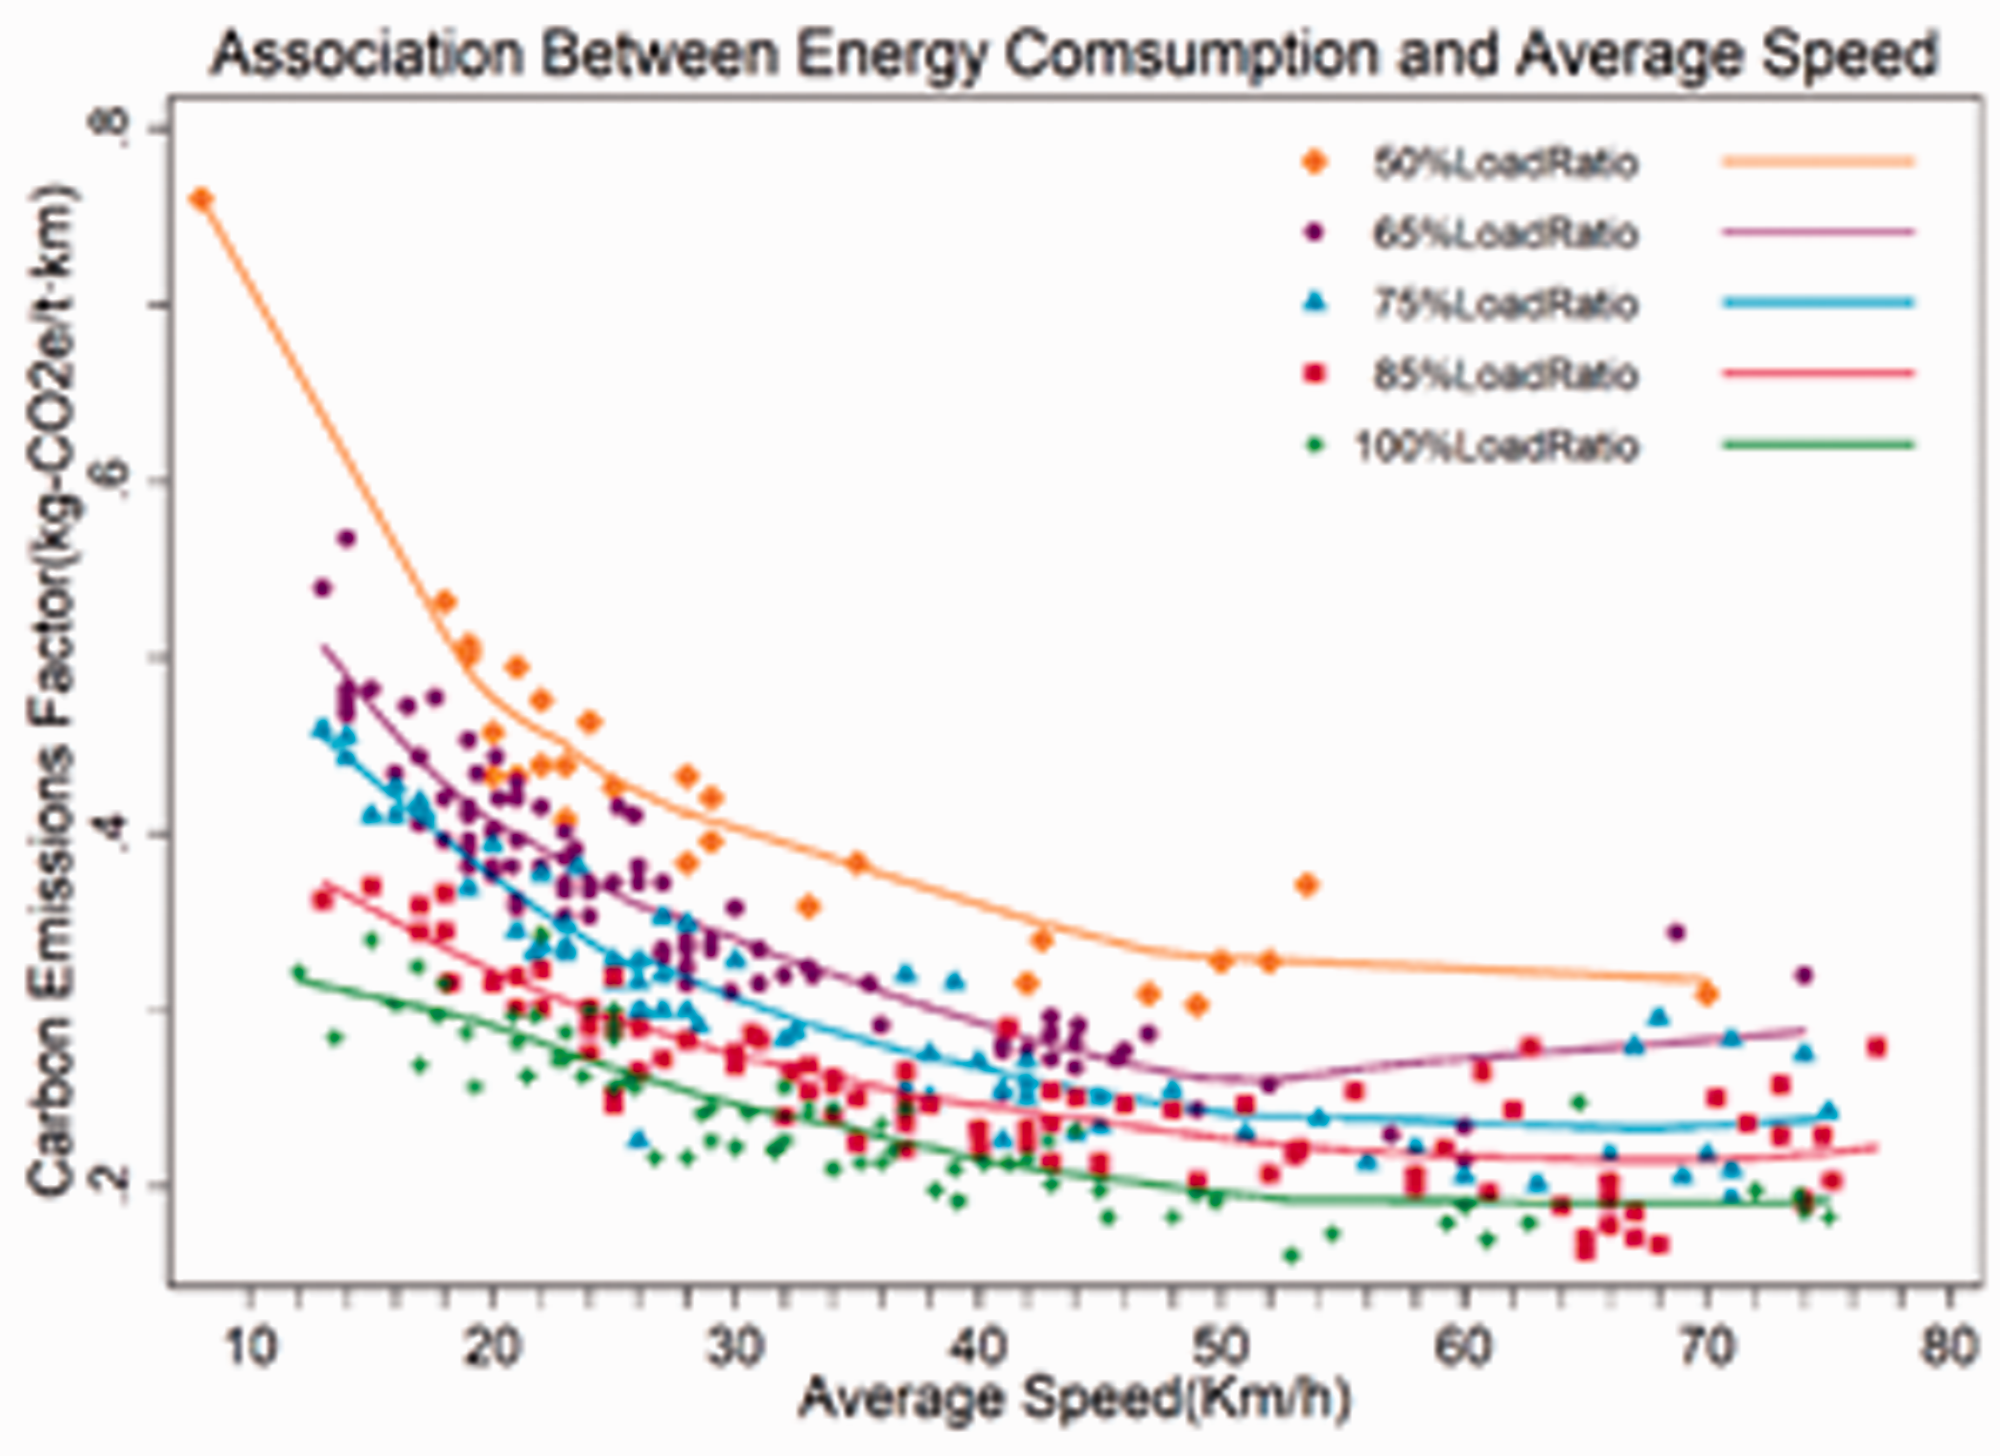
Multiple linear regression analysis
In Figure 10, Lowess curve shows a relatively obvious correlation, and the variables LoadRatio and AverSpeed have a positive correlation effect. Specifically, the smaller the observation value is, the larger the Fct observation value is, and it shows this characteristic under different load ratios.
Relationships between AverSpeed and LoadRatio.
In Figure 11, the Lowess curve shows that Fct is more sensitive to the change of variable temp at lower average speed, while Fct is not sensitive to the change of variable temp at higher speed.
Relationships between Temp and AverSpeed.
From Figures 10 and 11, it can be roughly seen that the variables Load Ratio, Temp and AverSpeed have internal relations with each other in the regression analysis of Fct. Therefore, it is assumed that the combination of the three variables will play a positive role in improving the explanatory power of Fct.
Therefore, multiple linear regression analysis is used to analyze the variables of Fct, LoadRatio, Temp and Aver Speed (the regression formula is shown in Formula 11), where 
Multiple linear regression results.
Optimization of variables’ exponent for regression
Through the regression analysis of different index values of LoadRatio, Temp and AverSpeed with Fct (as shown in Figure 12), the index of [−10,10] interval is traversed with index interval of 1, and the subdivision interval of maximum regression R2 is found. The results show that the maximum values of regression R2 of LoadRatio, Temp and AverSpeed are concentrated in the interval of [−2,2]. Then the interval of [−2,2] index is traversed with the interval of 0.1.
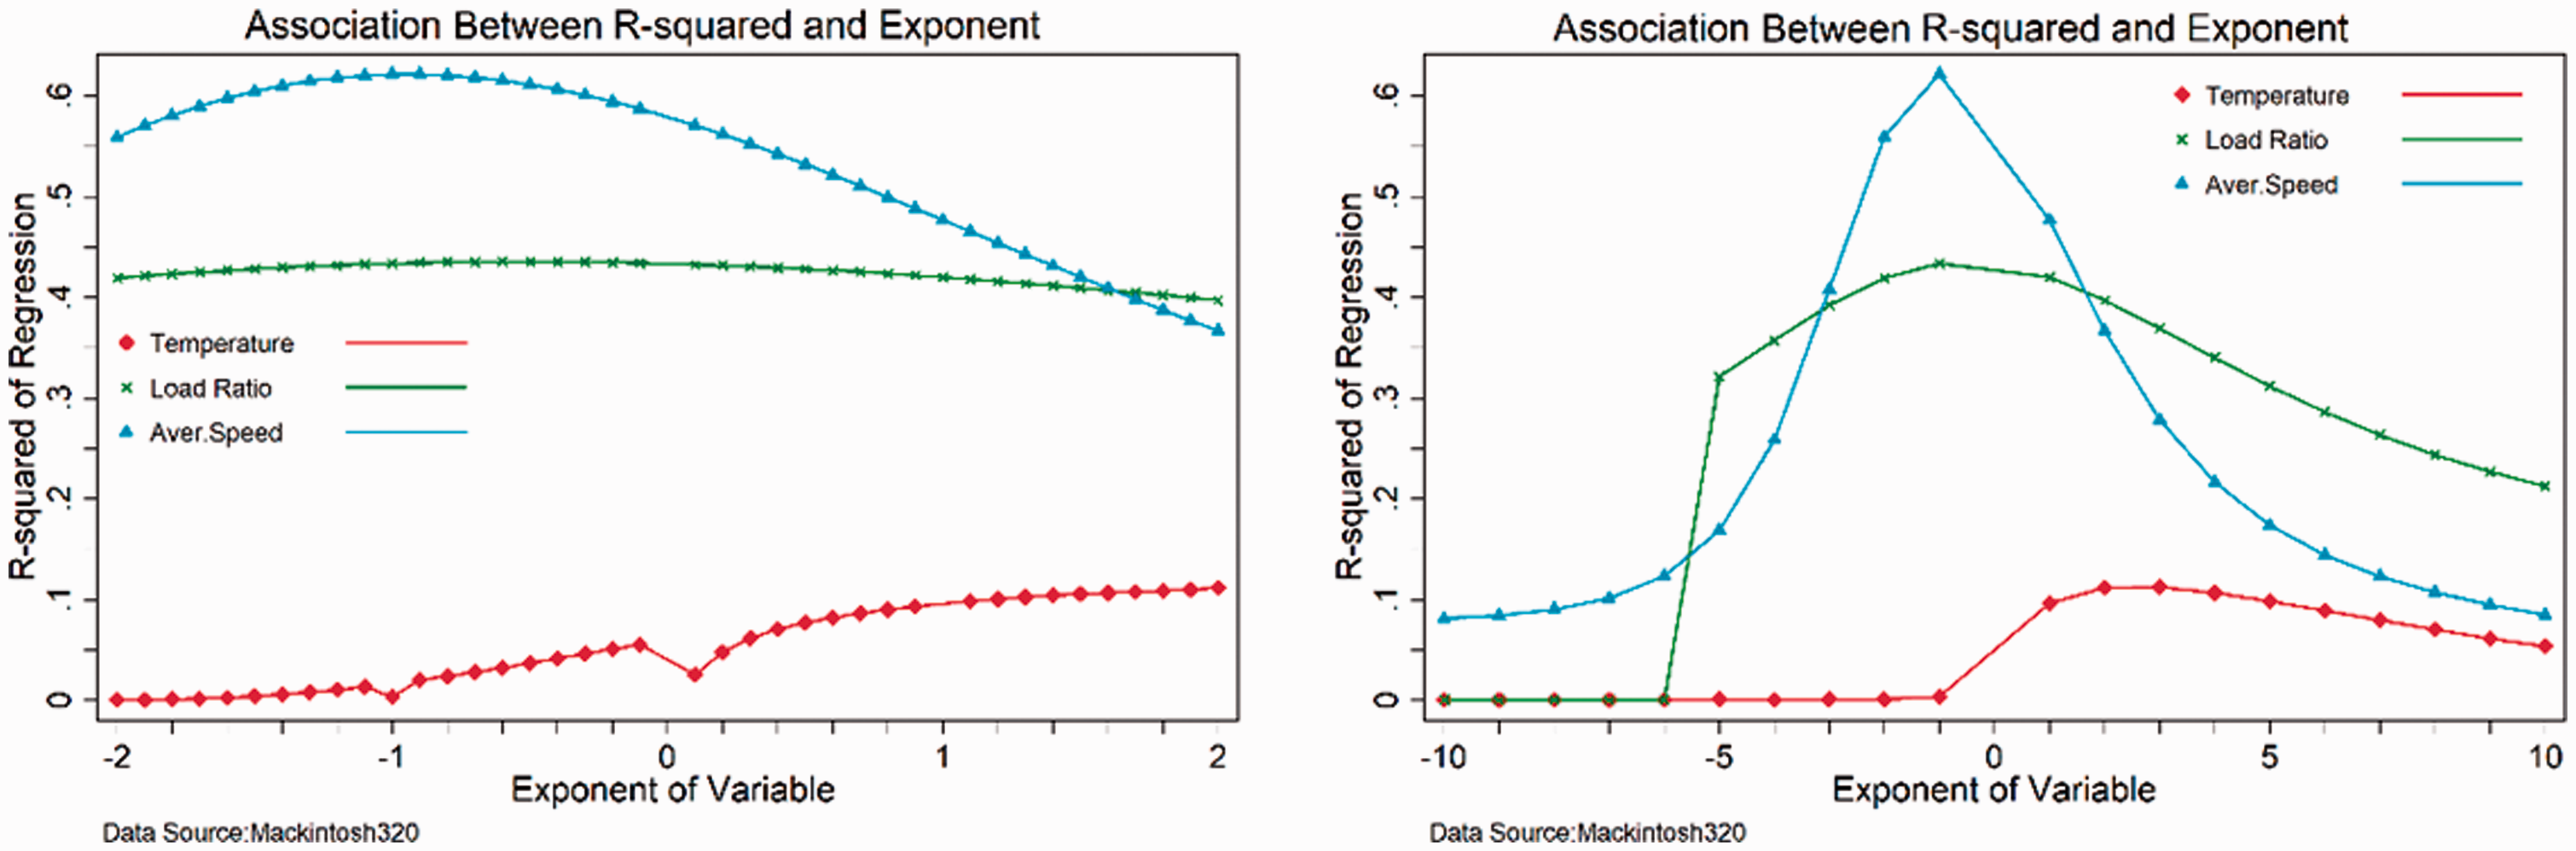
Association between R-squared and exponent.
Finally, the relative accurate values of the optimal indexes are determined as follows: LoadRatio corresponding index −0.5; Temp corresponding index 2; AverSpeed corresponding index −1. As shown in Table 8, R2 and Adj R2 are increased to varying degrees.
Exponents optimization results of regression.
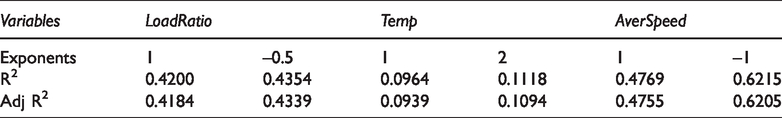
The results of multiple linear regression analysis show that R2 increased from 0.7689 to 0.9046, and Adj R2 increased from 0.7670 to 0.9039. The fitting results are as shown in Formula 12, and the intercept is −0.3212, P < 0.001 (95% CI: −0.3518, −0.2906); slope of 
Contrastive analysis
As shown in Formula 12, the carbon emissions factor
Group contrast
Assuming that the standard control group is 100% fully loaded, the atmospheric temperature is 10 °C and the average speed is 10 km/h, the value of
Under the same other conditions, when the full load ratio is 80%, 60%, 40% and 20%, the values of carbon emissions factor
Under the same other conditions, the values of carbon emission factor
Under the same other conditions, when the atmospheric temperature are 20 °C, 30 °C, 40 °C and 50 °C, the values of carbon emission factor
Parameter contribution analysis
According to the comparative analysis of the above different parameter groups, the contribution of the three parameters to the carbon emission factor is different, so in the actual transportation process, the contribution to energy conservation and emission reduction is also quite different.
The full load proportion LoadRatio has a greater effect on the carbon emissions factor. In the extreme case of small load, the carbon emissions factor even tends to infinity. For example, under the condition of 1% full load, temperature of 10 °C and average speed of 10 km/h,
The effect of average speed is the second. Under the condition of 100% full load and temperature of 10 °C, the value of
Because the number of samples below 0 °C is small, only 4 cases, accounting for 1.018%, this study can only reflect the change trend of carbon emissions factor with atmospheric temperature above 0 °C. Under the condition of 100% full load and average speed of 10 km/h, the value of
Recheck of regression
Equal variance detection
The residual versus fitted plot is used to determine the equal variance of Formula 12. The result is shown in Figure 13. It is basically determined that the residual is basically distributed on both sides of the 0-axis in the y direction, so the equal variance is proved.
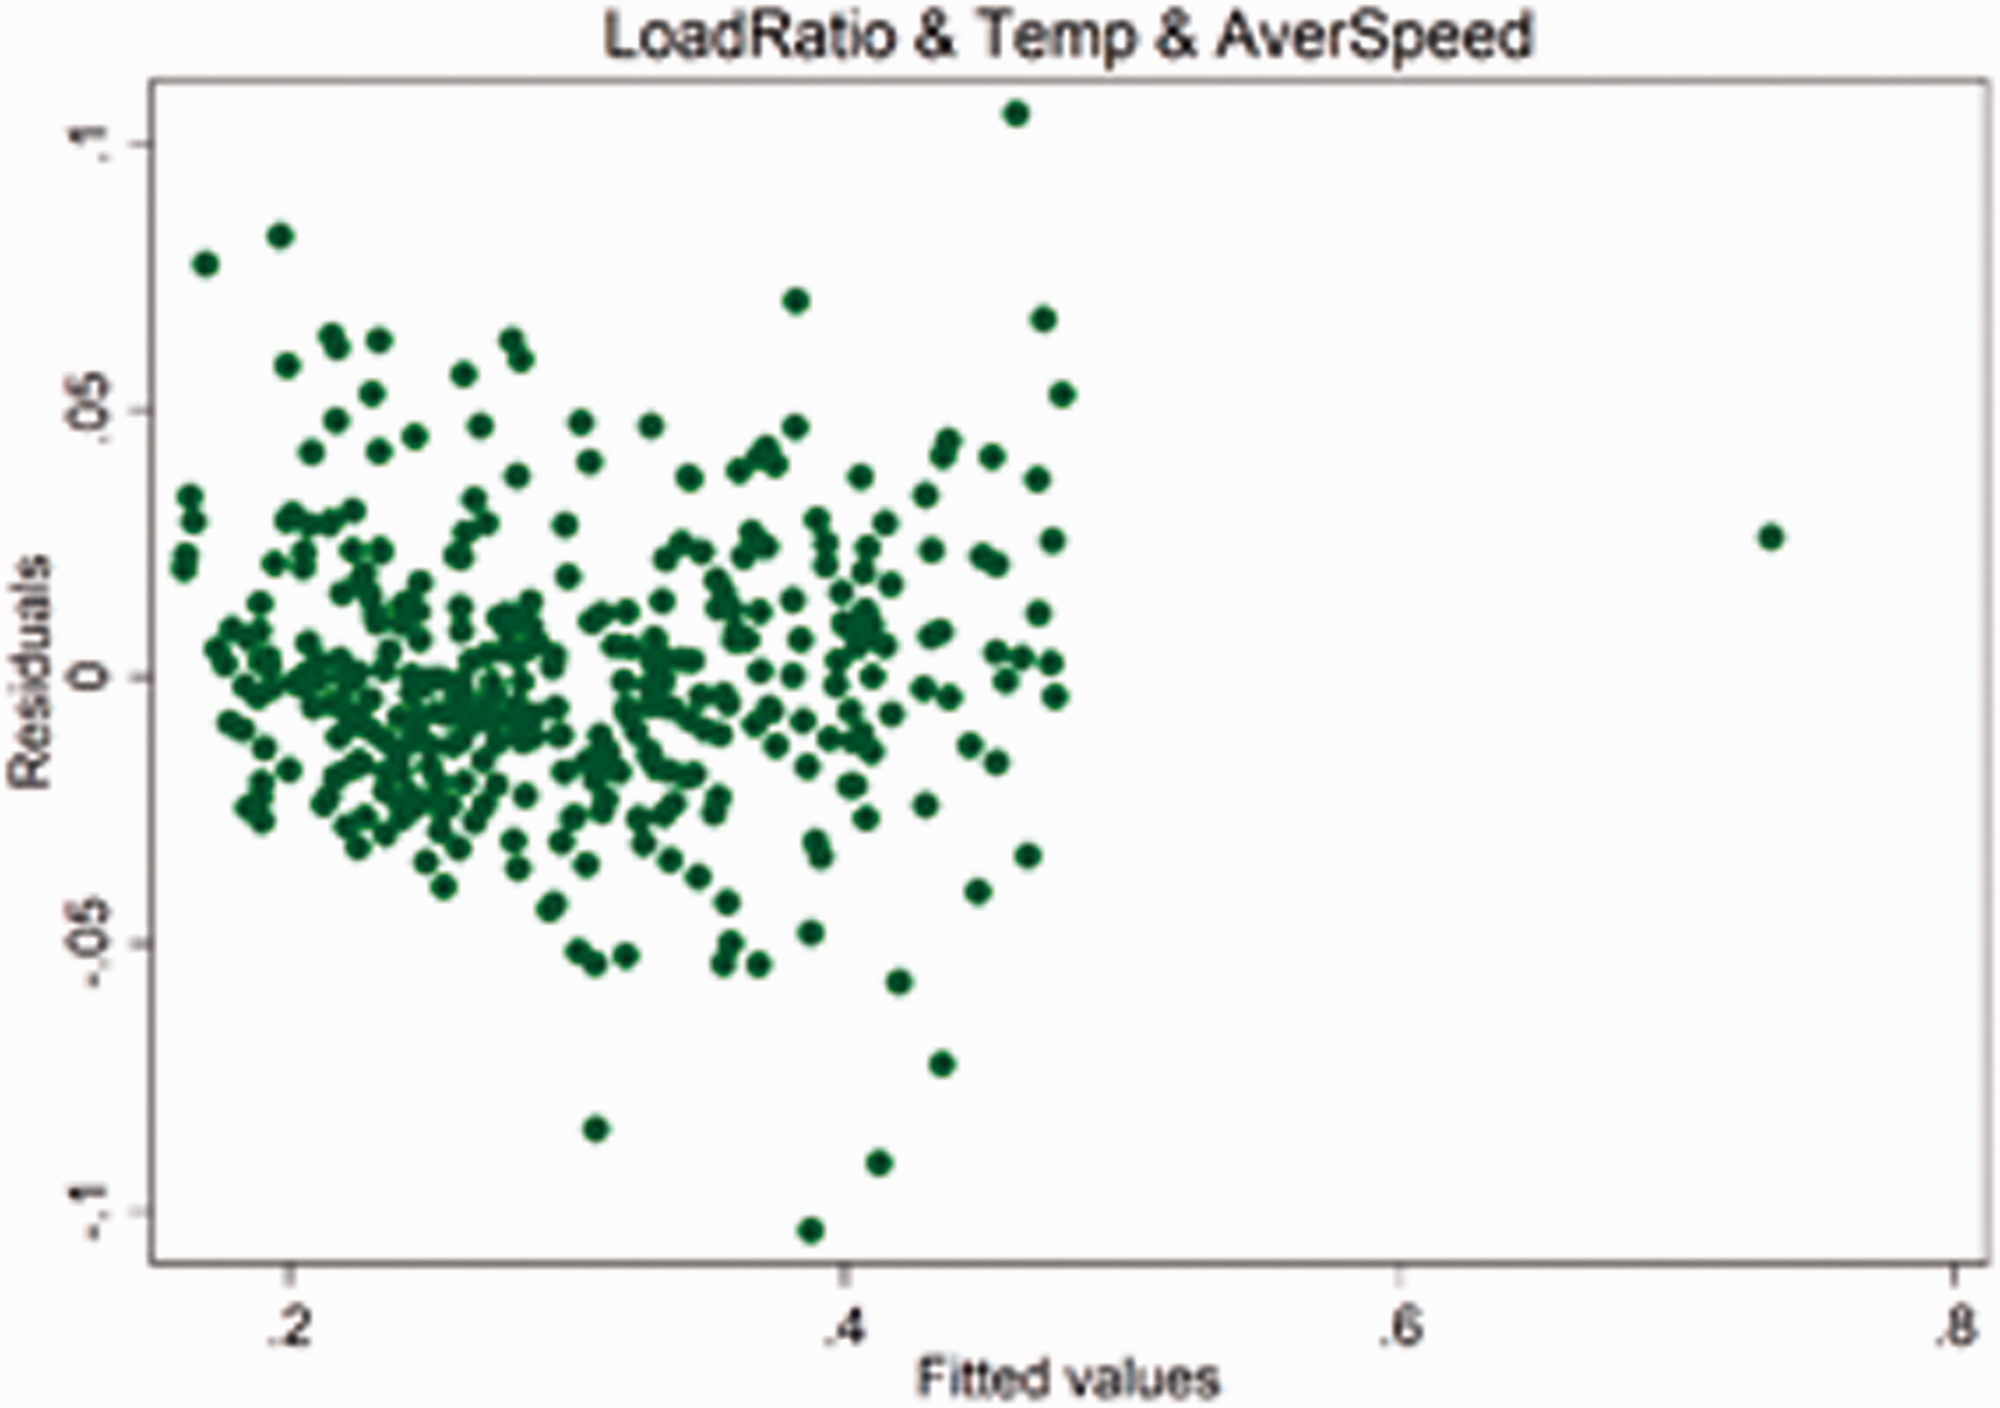
Residual-versus-fitted plot.
Approximate normal regression test of residual
Histogram (Figure 14) and normal quantity plot (Figure 15) are used to test the normal distribution regression of residual. Histogram shows the shape of normal distribution. The points of normal quantity plot basically fit the target oblique line. Skewness-kurtosis test, Shapiro-wilk test and Shapiro-Francia test are used, and the results shows that P values are less than 0.0001, 0.00001 and 0.00001 respectively, which are all less than 0.05. Therefore, residual approximate normal regression are determined.
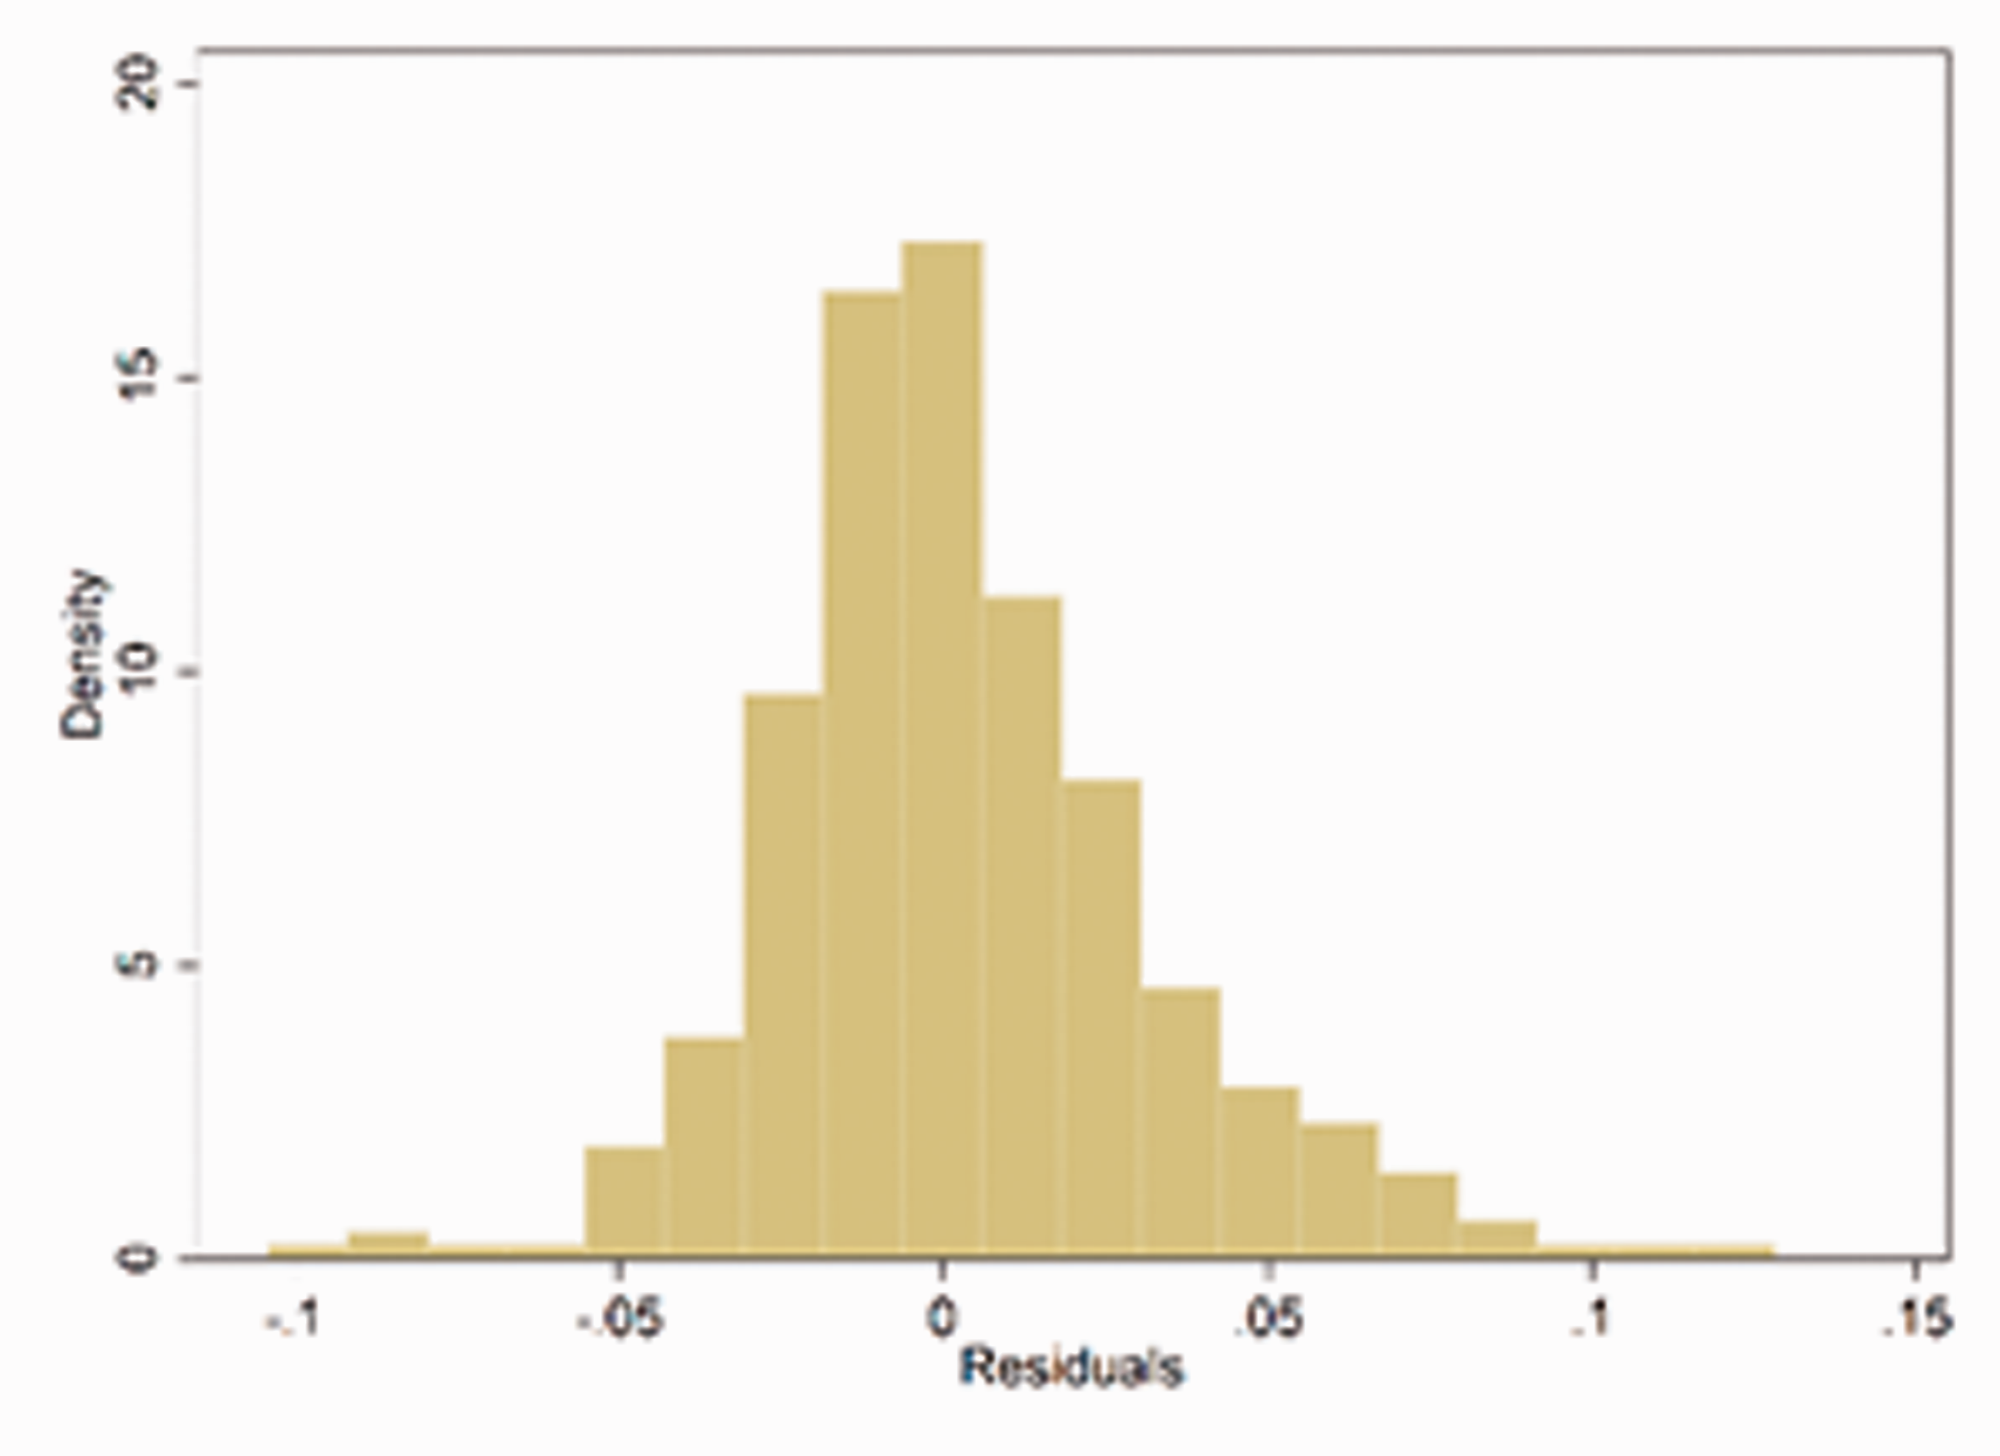
Histogram of residual.
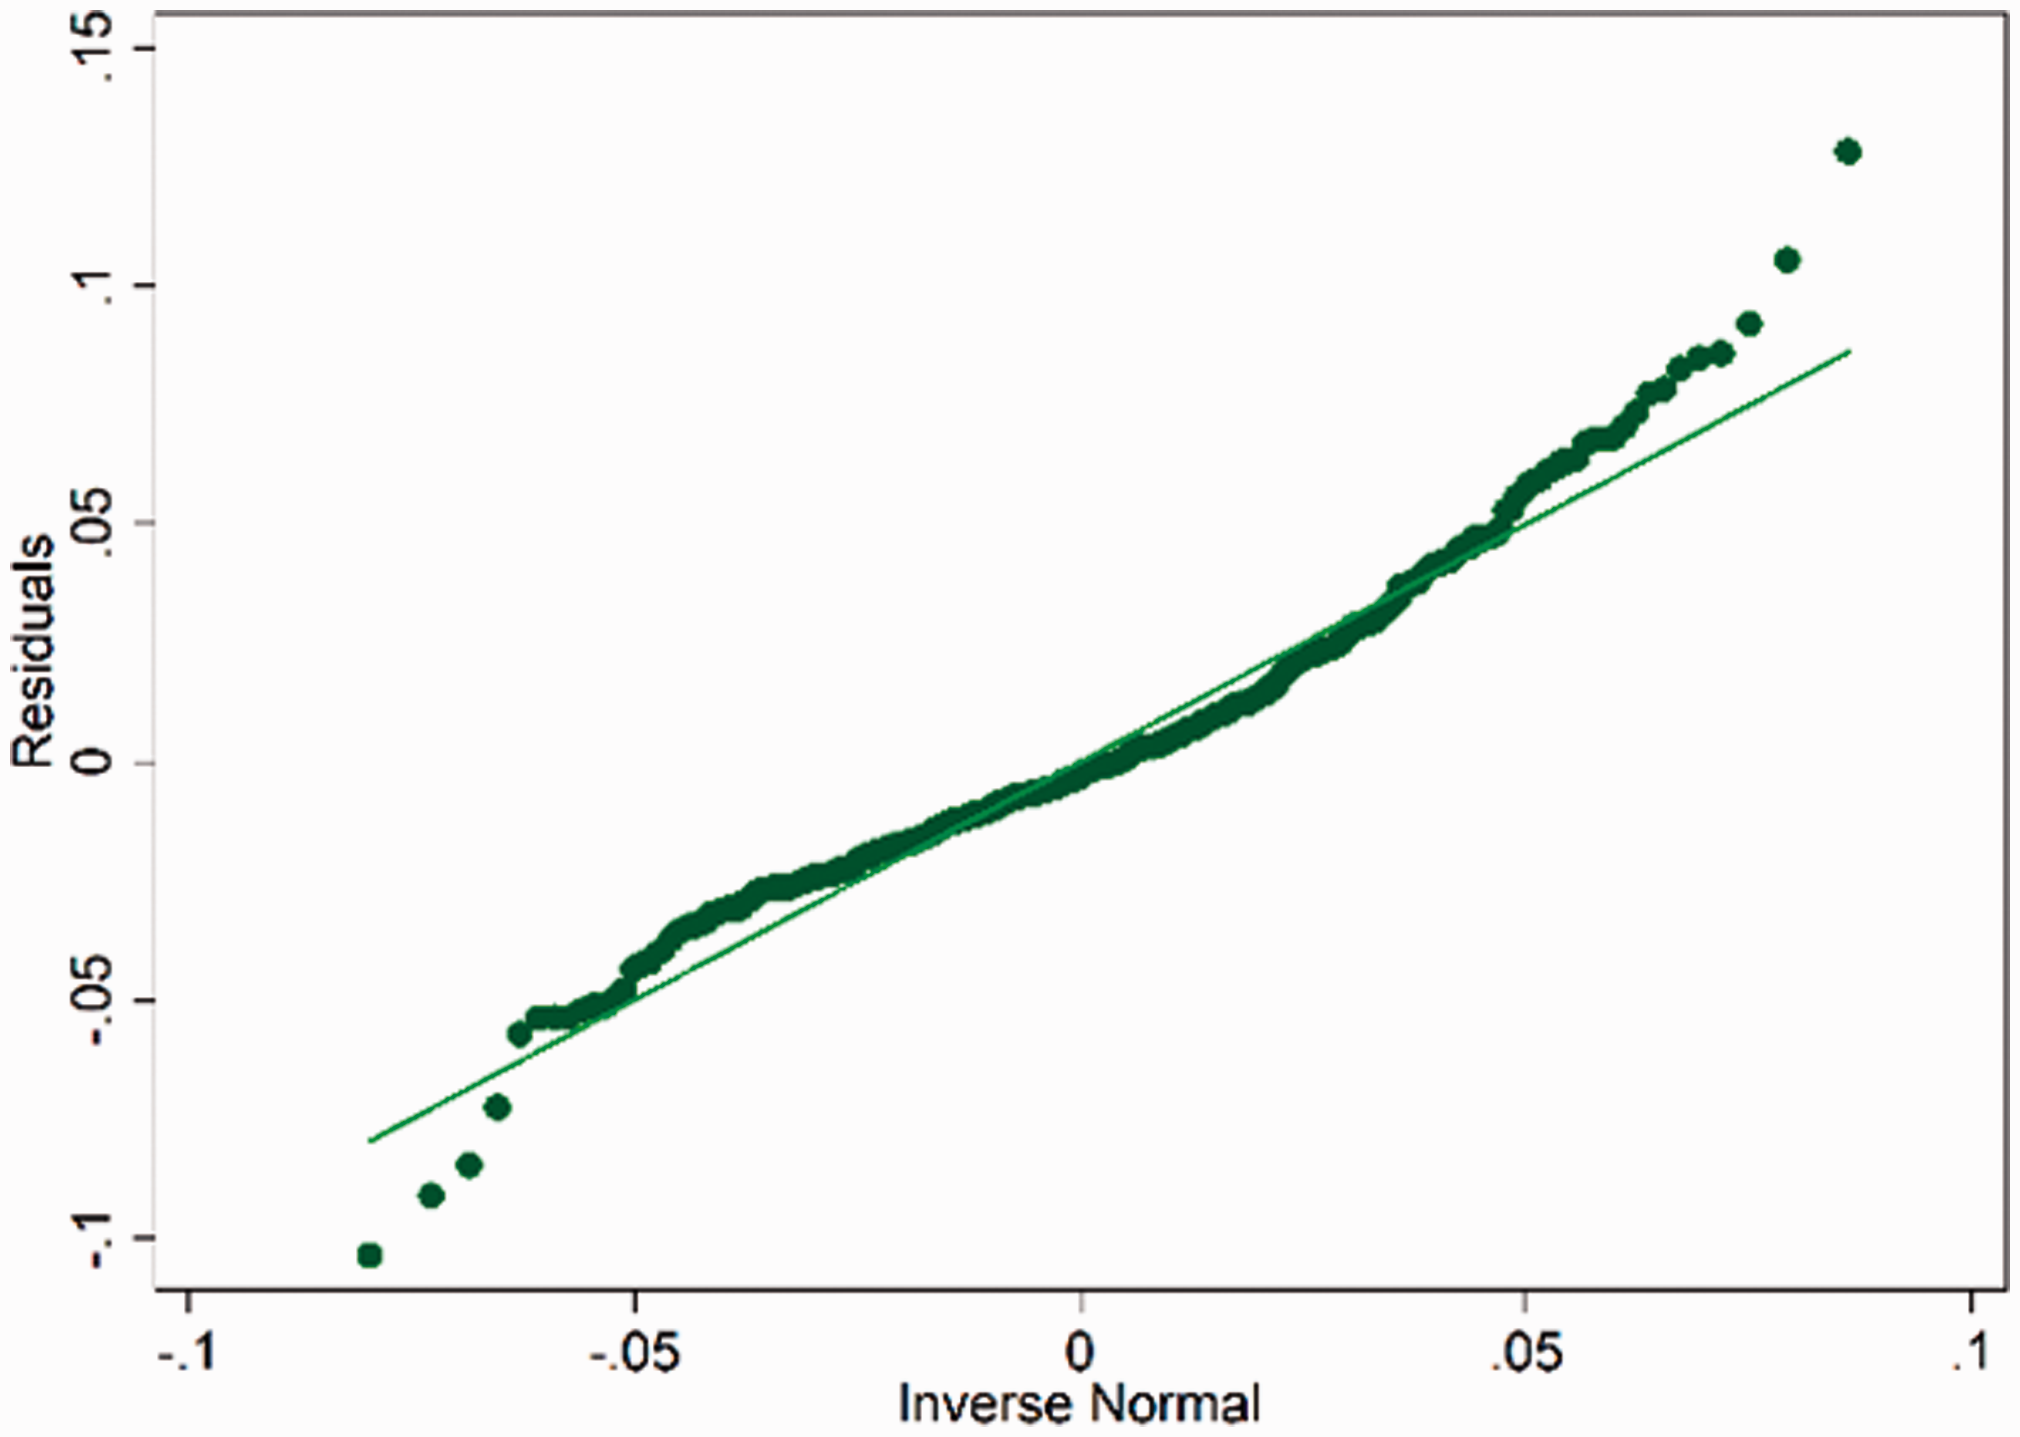
Normal quantile plot of residual.
Through equal variance detection and residual approximate normal regression test, it is proved that Formula 12 can effectively reflect the internal relationship and trend of the observed data, and that the regression analysis has enough fitting degree and credibility.
Limitation
Due to the limitation of objective conditions in the process of this study, there are two limitations in the following two aspects, which will be supplemented in the follow-up study:
The common road transport vehicles are divided into gasoline engine and diesel engine according to the fuel type. The operating efficiencies of the two engines are different. The latter needs to add urea to absorb harmful gases on the premise of meeting the increasingly stringent emission regulations. Therefore, the carbon emissions of transport vehicles with diesel engine need to be increased. Besides, the transport vehicles are also divided into different grades according to the maximum load, so the carbon emissions characteristics of different types of transport vehicles are different. In this study, light transport vehicles are used as experimental tools, although they can reflect the real carbon emissions of prefabricated components transported by light vehicles, but a certain proportion of prefabricated components are medium-sized and heavy-duty transport vehicles, and the maximum load capacity is 8–35 tons. Therefore, this study can not meet all the transportation conditions of prefabricated components.
Therefore, further research needs to be carried out for different load levels and different engine types in order to continuously correct the possible deviation.
2. Because the test sites are concentrated in Jiangsu Province, the average atmospheric temperature in winter is higher than that in northern China, such as northeast China and Hebei Province. There are few samples with atmospheric temperature below 0 °C. Therefore, the calculation model for carbon emissions factor can only reflect the variation characteristics of large temperature above 0 °C. In the follow-up study, we should test and collect more data samples below 0 °C, which can effectively expand the application scope of the carbon emissions factor calculation model of the component in the transportation stage.
Conclusion
Through the observation, collection, analysis and statistical regression of various parameters that may affect the carbon emissions factor in the transportation phase of assembled buildings, the relevant mathematical model of carbon emissions factor is established to estimate the real prefabricated component transportation carbon emissions. The main conclusions are as follows:
Compared with ordinary buildings, assembled buildings increase two phases of component production and component transportation, which are limited by the control of component size, component placement, component delivery time and other factors. Comparing with material transportation, component transportation has a larger changing range of carbon emissions factor. The carbon emissions factor of prefabricated component transportation is greatly affected by three parameters: (a)full load ratio, (b)average speed and (c)atmospheric temperature. The effect of common interval on carbon emissions is 111.10%, 65.50% and 15.68%. The effects of atmospheric temperature, average speed and full load ratio on carbon emission factor increase significantly in turning. Therefore, in the processing of transportation scheme of prefabricated component, it is necessary to increase the full load ratio of vehicles as far as possible while meeting the requirements of component transportation sequence, choose a more smooth route when the distances are close, and avoid transporting components at noon when the temperature is the highest. The study explores the differences between the carbon emissions estimation of prefabricated component transportation phase and that of ordinary construction material transportation with quantitative method. By establishing the mathematical calculation model of carbon emissions factor, it provides an effective tool for more accurate prediction of carbon emissions in prefabricated construction transportation phase.
At the same time, the study also has a certain reference and enlightenment for researchers in related fields. The statistical regression analysis method used in this paper has good applicability for the carbon emissions problem in the transportation phase. With the development of human society and technology, the improvement of global economic level, and the negative growth of population in Asian countries, as a technology that can be used all over the world, assembled building construction technology should be paid more comprehensive attention by the academic community, rather than focusing on the construction technology, material formula and structural safety, such as carbon emission, energy conservation, and so on. It is hoped that more attentions would be paid to environmental protection and sustainability. In the future, more scholars are expected to pay attention to the carbon emissions in the whole life cycle of assembled buildings, including the phases of production, transportation, assembly, maintenance, demolition and reuse.
In theory and former practice, the fitting regression problem involved in the statistical methods used in this study can also be applied by Back Propagation Neural Network (BP) and Convolution Neural Network (CNN). Therefore, in the further study, these two methods can be compared and analyzed to verify the applicability and application prospect of the two methods in the field of carbon emission estimation, so as to provide reference for relevant researchers. At the same time, with the promotion from local government, Electric Vehicles (EV) are becoming more and more popular in China. It is necessary to carry out the carbon emissions research on the prefabricated component transportation of electric transport vehicles, and analyze the comprehensive income generated by the application of clean energy in the component transportation phase.
Footnotes
Declaration of conflicting interests
The author(s) declared no potential conflicts of interest with respect to the research, authorship, and/or publication of this article.
Funding
The author(s) disclosed receipt of the following financial support for the research, authorship, and/or publication of this article: This work was funded by the National Natural Science Foundation of China (No. 51908111): “Research on standardized design method of prefabricated building based on quantitative calculation of structural component standardization ratio”.