
Abstract
The determination of quantitative relationship between soil dielectric constant and water content is an important basis for measuring soil water content based on ground penetrating radar (GPR) technology. The calculation of soil volumetric water content using GPR technology is usually based on the classic Topp formula. However, there are large errors between measured values and calculated values when using the formula, and it cannot be flexibly applied to different media. To solve these problems, first, a combination of GPR and shallow drilling is used to calibrate the wave velocity to obtain an accurate dielectric constant. Then, combined with experimental moisture content, the intelligent group algorithm is applied to accurately build mathematical models of the relative dielectric constant and volumetric water content, and the Topp formula is revised for sand and clay media. Compared with the classic Topp formula, the average error rate of sand is decreased by nearly 15.8%, the average error rate of clay is decreased by 31.75%. The calculation accuracy of the formula has been greatly improved. It proves that the revised model is accurate, and at the same time, it proves the rationality of the method of using GPR wave velocity calibration method to accurately calculate the volumetric water content.
Keywords
Introduction
In the Shenmu area of northern Shaanxi, China. There are a wide range of sand and clay layers which contain precious water resources that play an important role in the growth of surface vegetation. As one of the largest coal reserves in China, the northern Shaanxi coalfield has been widely concerned at both domestic and abroad because of its advantages like thick coal seam, good coal quality and etc. However, the vigorous underground coal mining activities will inevitably affect the shallow soil and change the water resources contained in the shallow soil (Wei, 2009). Various environmental issues related with the shallow soil layer and the vadose zone have already been reported such as groundwater contaminant and heavy metal contaminant (Chen et al., 2020; Nan et al., 2018: x; Zhao et al., 2019). Therefore, the determination of the water content within a certain depth of the ground is of great significance for studying the trend of water resources in this area, and it is also very important for guiding the protection of the local ecological environment.
The measurement of soil water content is divided into direct measurement methods such as drying method, TDR method, neutron method and gas content volume method, and indirect measurement methods such as remote sensing method and GPR method. The drying method is the most basic and accurate method for measuring the moisture content, but this method can only measure the point position and damage the soil. Therefore, it cannot be applied in a large area. TDR method, neutron method and gas content volume method also have the same disadvantages ( Mu et al., 2020; Schafer & Beier, 2020 ). The remote sensing method can be used to estimate the regional moisture content (Ainiwaer et al., 2020), but it can only measure the shallow part of the soil. The GPR method has gained its popularity in recent years due to its none-invasive and high accuracy detection properties. Topp et al. proposed the empirical relationship between water content and dielectric constant in 1980 (Herkelrath, 1991; Topp, 1980), that makes it possible to obtain the water content by the GPR technology. Based on the above theoretical methods, the estimation of the soil moisture content was successfully completed by acquiring the radar wave velocity. Cui et al. (2018) used auto regressive and moving average (ARMA) to complete the estimation of the water content of sandy soil in western China. Hubbard (2002) also completed dense estimates of shallow soil volumetric water content (VWC) in a California vineyard by the ARMA method. Thammathevo et al. (2011) applied GPR ground wave method to measure the variation of dunes in the surface of the soil water content. Di Matteo et al. (2013) completed the study on the change of shallow soil moisture over different EM soil conditions. When conducting large-scale detection work, the common offset method is generally used for detection. Nevertheless, the wave velocity cannot be accurately obtained when using this method. The reason is that the depth of the interface of the underground media cannot be obtained, but using shallow drilling to calibrate the layer interface can solve this problem well.
With the development of artificial intelligence, more and more group intelligent optimization algorithms were applied to handle the nonlinearity problems in the geological field. Because it can quickly and efficiently obtain the advantages of the optimal parameters of the model, it solves many complex geological problems. Darabi et al. (2019) applied genetic algorithm to complete the drawing of flood risk map, Xing and Mazzotti (2019) used genetic algorithm to complete the prediction of near-surface S-wave velocity in complex geological conditions, and Xu et al. (2019) used genetic algorithm to estimate the stability of the slope in the frozen and thawing mountain area. Nematolahi et al. (2018) used particle swarm algorithm to complete the estimation of soil retention and hydraulic conductivity, Fu et al. (2018) used particle swarm algorithm to complete the construction of the soil salt content model, Gu et al. (2019) completed lithology prediction research in petroleum exploration. Choubin et al. (2019) used simulated annealing algorithm to complete the identification of ground fissures, Netto and Dunbar (2019) applied simulated annealing algorithm to complete the inversion of gravity data anomalies, and Tian et al. (2008) used simulated annealing algorithm to complete the prediction of groundwater content in the oil field. Using the above algorithms have achieved good results. In addition, the optimization algorithm also solves a lot of problems in GPR. Abdelkader et al. (2019) employs three evolutionary optimization algorithms to calculate the optimum thresholds in GPR evaluate the condition of bridge decks, Zhao and Al-Qadi (2019)used a nonlinear optimization approach to recover the AC pavement surface reflection for removing the effect of surface moisture on GPR signals during density monitoring, Almeida et al. (2020) completed dielectric permittivity evaluation through the tomographic imaging process using Ant Colony Optimization, Wu et al. (2020) introduced machine learning methods to collaboratively build highly accurate multitask surrogate models for antennas.
After studying the Topp formula, there is a large error in calculation of volumetric water content of certain soils such as clay, and when calculating in different regions, the parameters of the formula need to be readjusted(Černý, 2009; Jacobsen & Schjonning, 1995). In this study, a comprehensive analysis was made of the GPR data and shallow drilling in the Daliuta mining area. Calibrate the position of the formation interface by drilling, and obtain the precise wave velocity, and then calculate the relative dielectric constant values. Combined with the water content measured by drying method, the relative dielectric constant-volume moisture content was accurately modeled using genetic algorithm (GA), particle swarm algorithm (PSO) and simulated annealing algorithm (SA) in the intelligent group algorithm respectively. The classical Topp formula was modified, and verified it in Ningtiaota mining area. The result shows that GA method has a better performance compared with PSO and SA algorithms and can better modify the Topp formula. Therefore, the formula adjusted will be more suitable for calculating the moisture content of sand and clay in western China, especially in the aeolian sand area of northern Shaanxi coalfield. It can better reflect the distribution of water content in shallow media under the conditions of coal resource mining, and better provide guidance for protection and restoration of the local ecological environment.
Study area
In this study, Daliuta and Ningtiaota mining areas were selected as the research areas. Daliuta serves as the main data collection area, and Ningtiaota serves as the verification area. The geographical locations of Daliuta and Ningtiaota are shown in Figure 1.
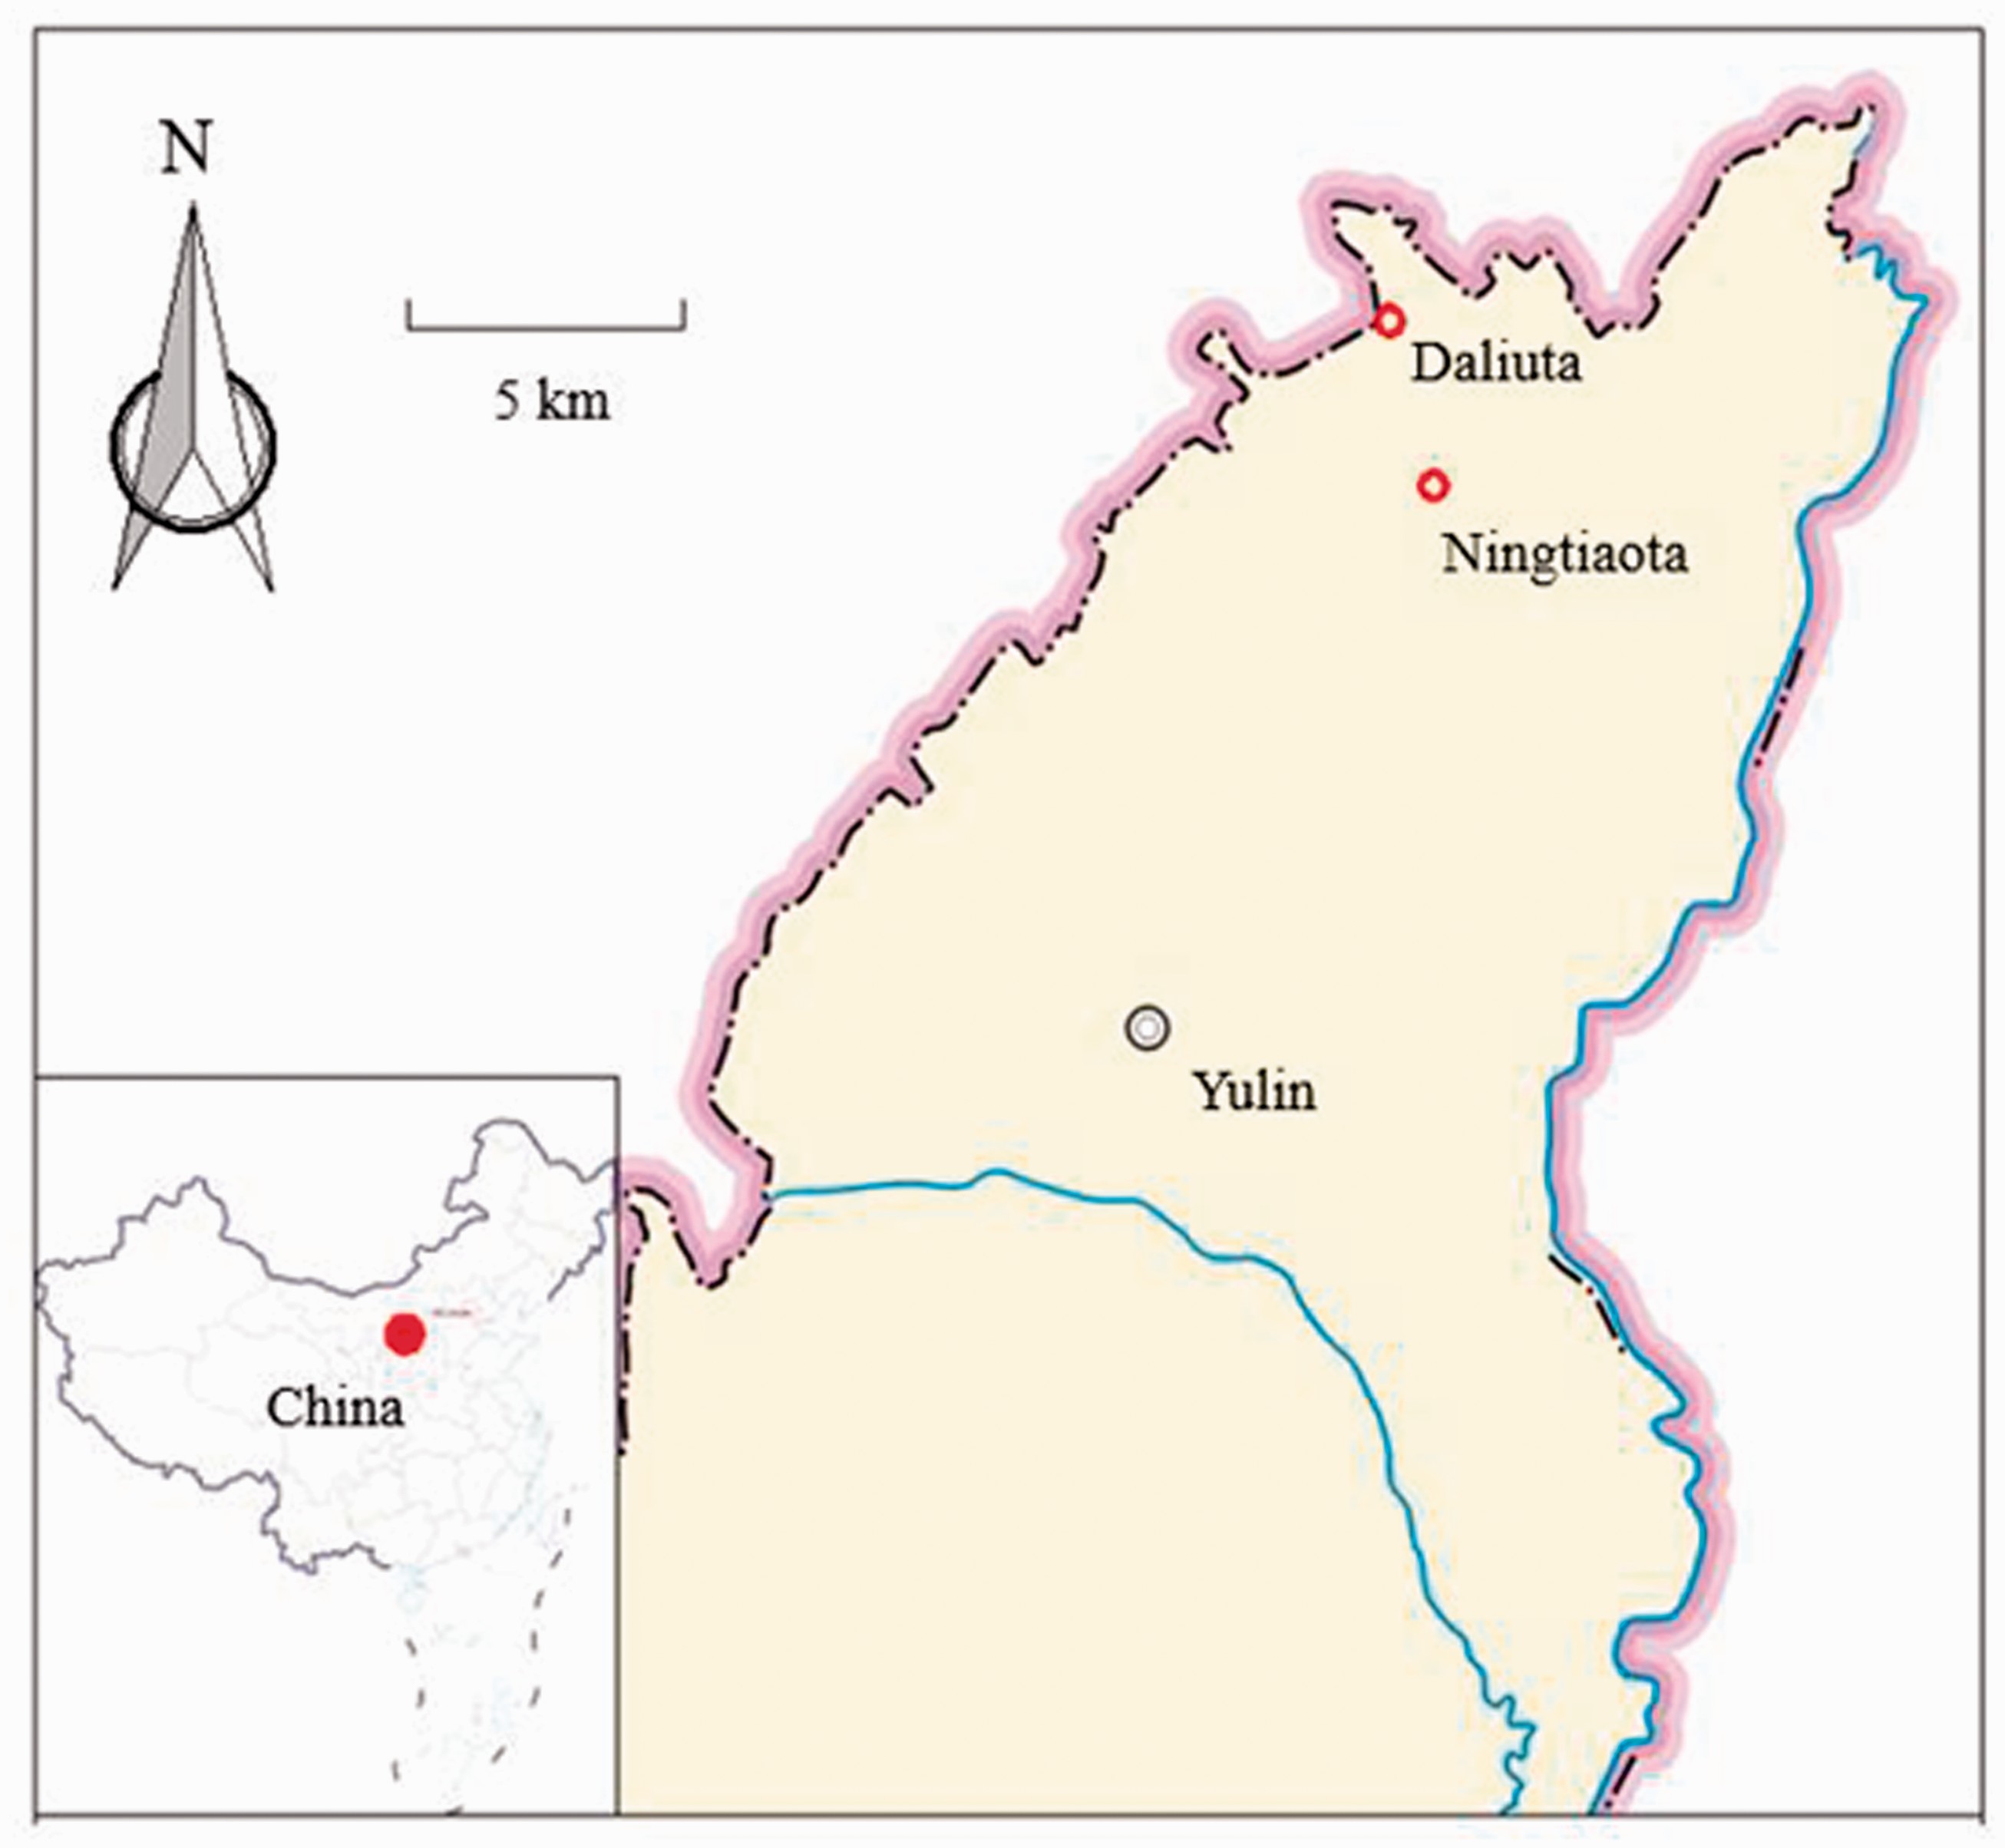
Location map. The red point indicates the study area.
Daliuta is located in the Northern Shaanxi province which belongs to Shenmu County in the north of Loess Plateau in northern Shaanxi, which is located in the southeastern margin of Maowusu Desert. The study area has large local undulations with a maximum elevation difference of 15.2 m. The area is dominated by aeolian sand landforms, the shallow layer is a sand layer, and the clay layer is below the sand layer. Below the study area is the 52305 working face of Daliuta coal mine. The average annual precipitation in study area is only 131–571 mm, the maximum daily precipitation is 135.2 mm (August 1, 1997), the annual rainfall in dry year is 108.6 mm (1965), and the average annual evaporation is 2000–2900 mm. It belongs to a typical arid and rainy area.
Cui et al. (2015) found that the mining of coal has caused great changes in the moisture content of shallow soils through research in the Daliuta area: comparing the distribution of water content before and after mining, it can be known that the water content of shallow soils before mining was relatively small, especially at the beginning and middle positions of the working face. In the coal mining process, the water content decreased overall, and the low water content area became larger. After mining, the water content of shallow soils increased. The area of low water content was gradually reduced, and the water content of the area had increased significantly. In the process of coal mining, two low water content distribution areas had a large increase, and their influence range disappeared after mining.
The Ningtiaota area also belongs to Shenmu County, with flat terrain. The surface layer is covered by aeolian sand, and the clay layer is under it. Below the study area is the 12001, 12002 and 12003 working face of Ningtiaota coal mine. The area is dry and has little precipitation. The rain period is basically concentrated from July to September, and the evaporation is large. The distance between the Ningtiaota and the Daliuta is only about 3 km, and their geological conditions, precipitation conditions, and evaporation conditions are very similar. Therefore, Ningtiaota area is used as the verification area of the revised formula.
Ningtiaota is still in the mining period, and the water content is decreasing. So it has not fully shown the change rule of mining operation on shallow soil moisture content.
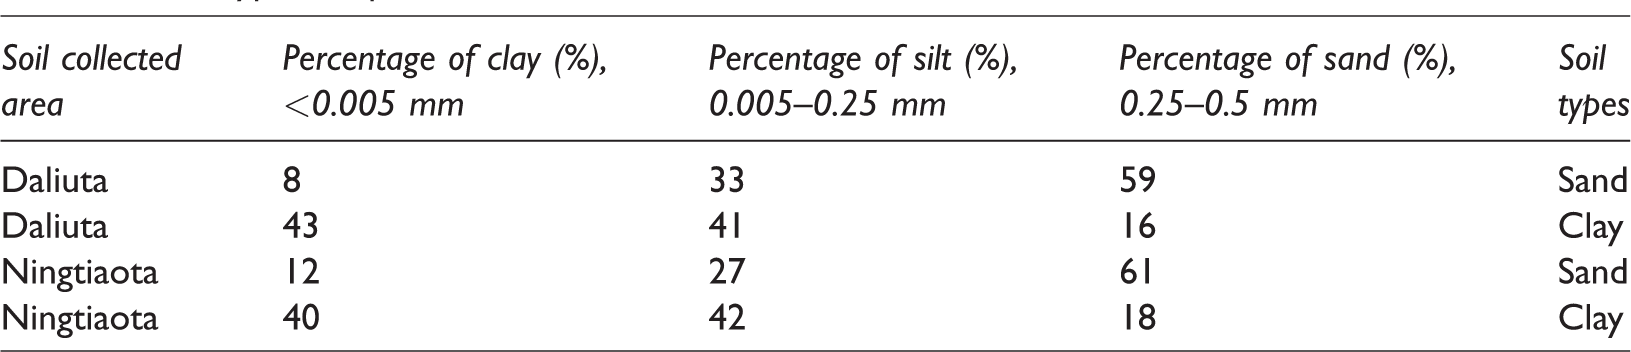
Soil type and particle size distribution of the two research areas are listed in Table 1.
Soil type and particle size distribution of Daliuta and Ningtiaota.
Materials and methods
This study will be based on the GPR data and shallow drilling. The subsurface media will be labeled and sampled through drilling. After that, the radar wave velocity with the calibrated layer depth and the GPR data to obtain the relative permittivity. At the same time, the volumetric water content of the soil sample will be measured. Then, the intelligent group algorithm will be applied to model the relative dielectric constant and volumetric water content, modify the constant term of the classic Topp formula and apply it to other areas for verification (Figure 2).
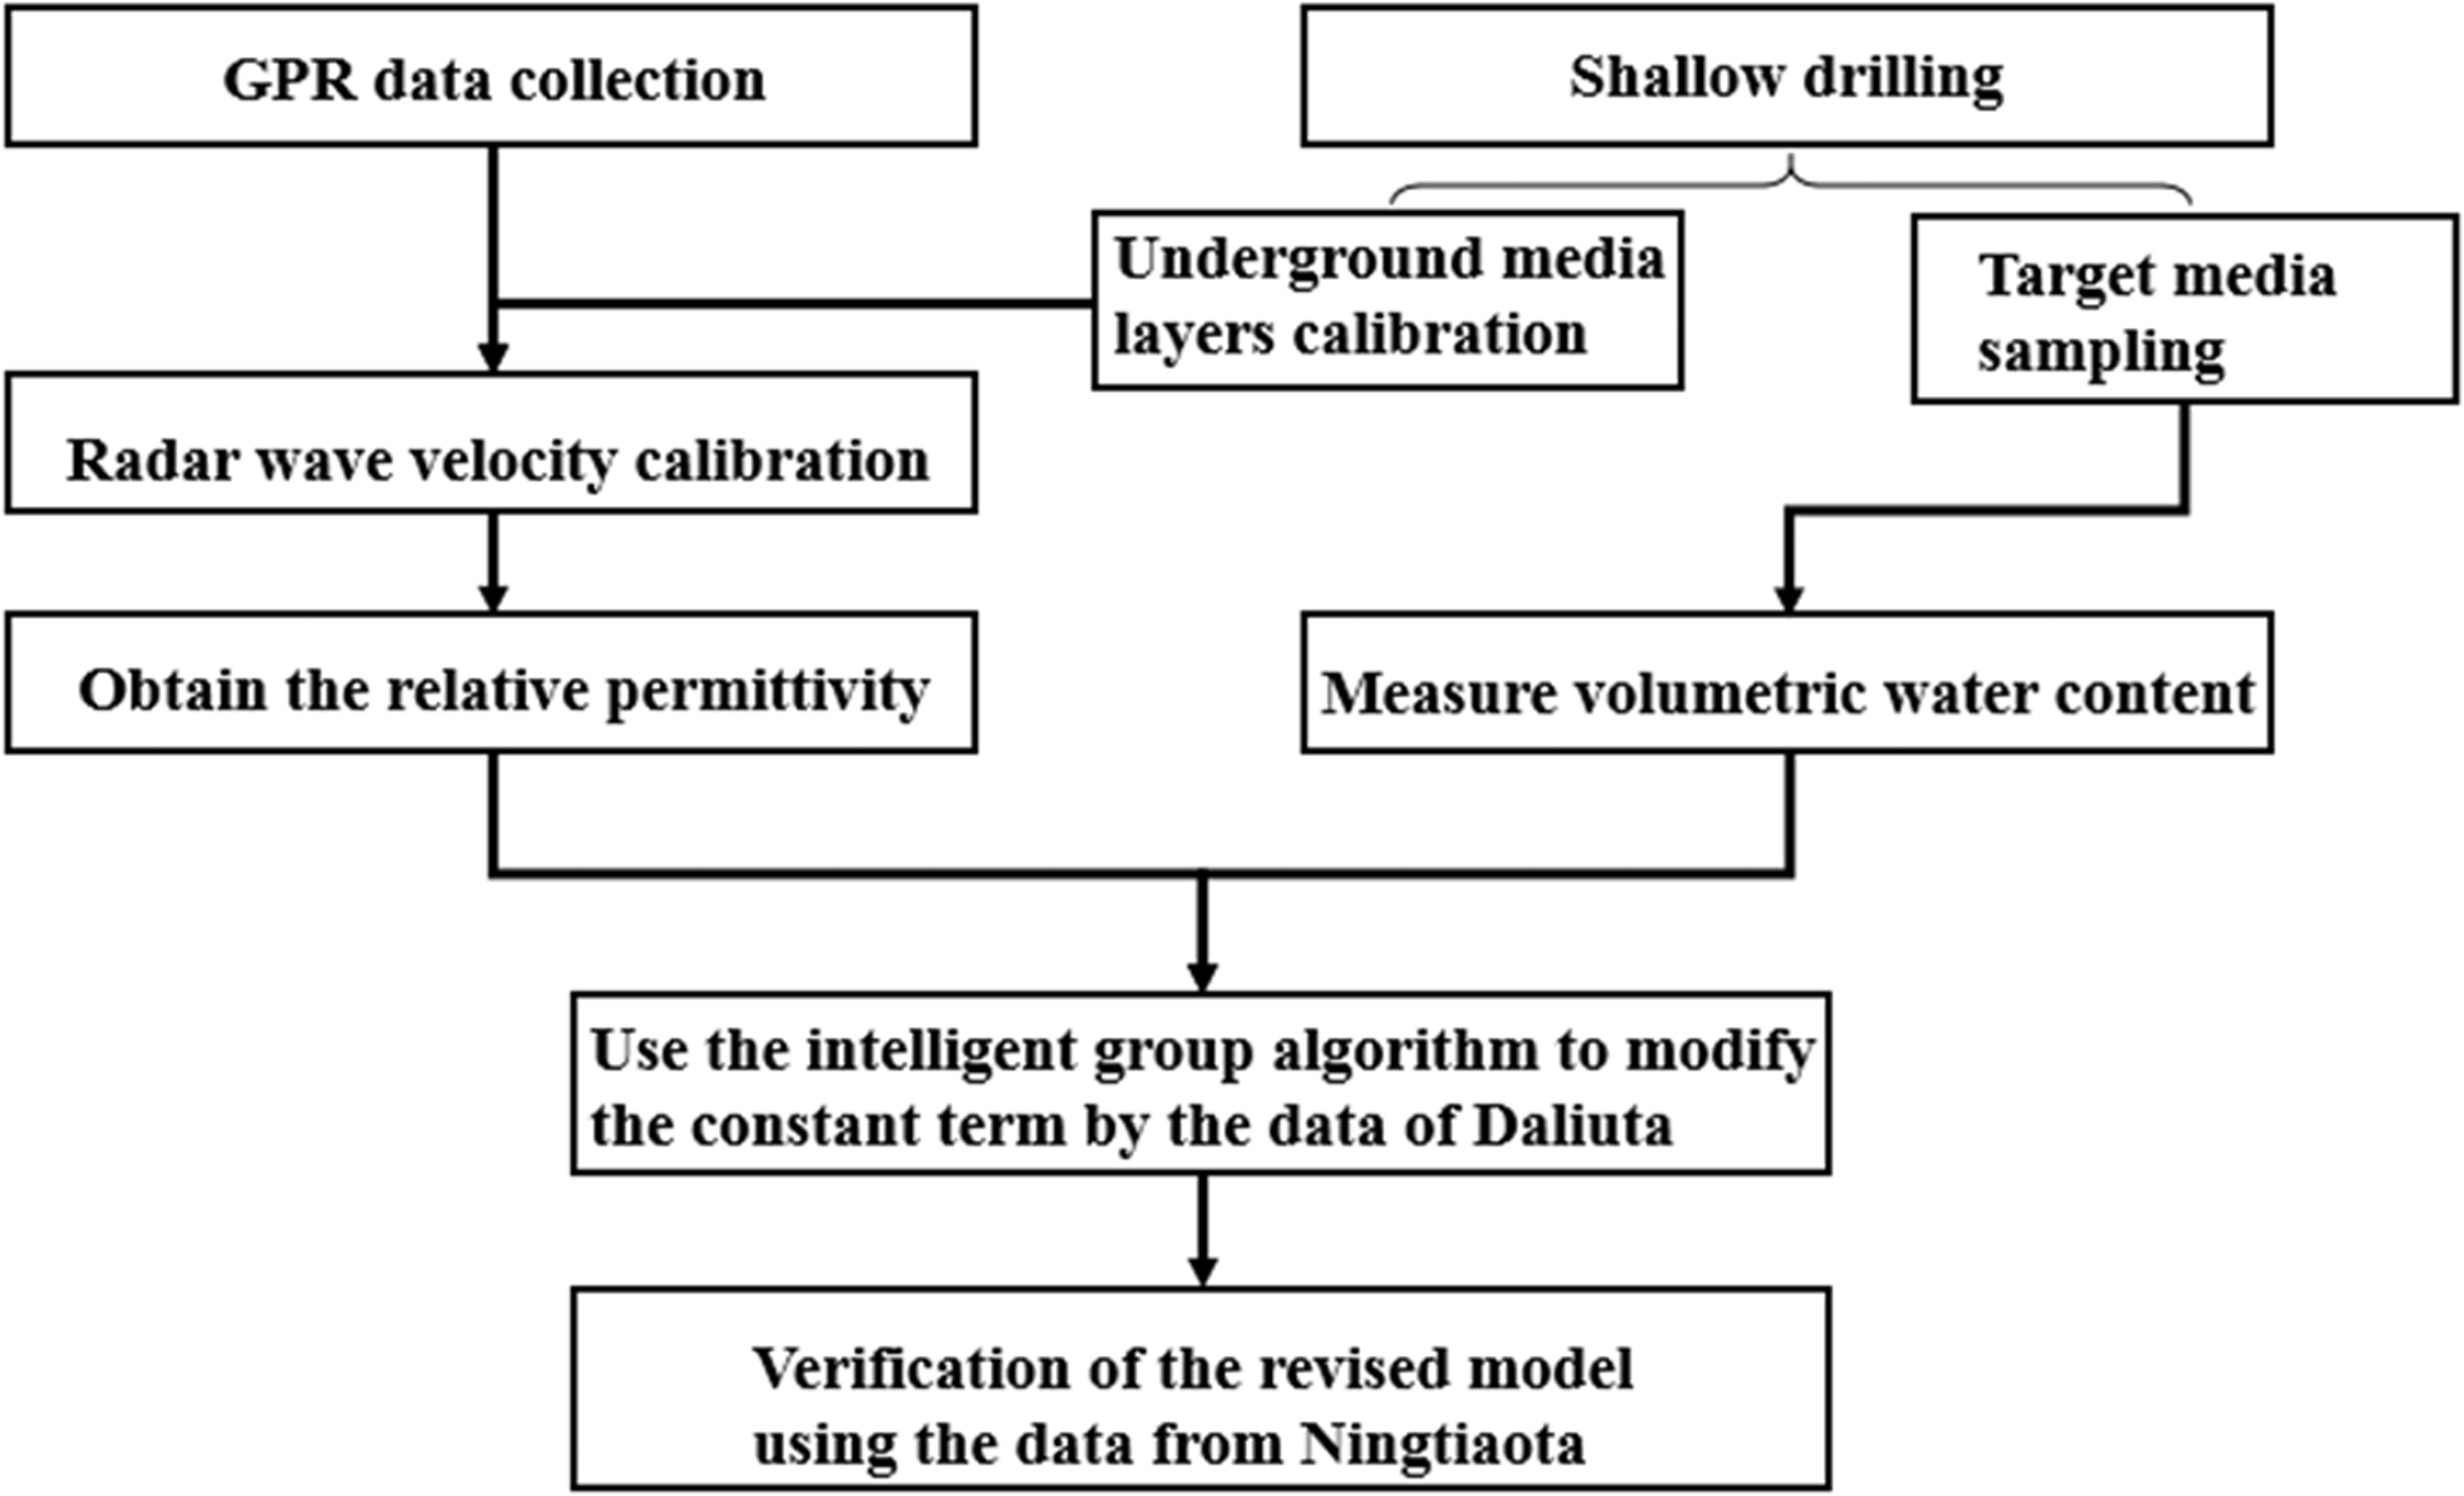
Flow chart of research.
Methodology
Ground penetrating radar
The GPR emits high-frequency broadband electromagnetic waves in the form of pulses to the ground. When the electromagnetic wave propagates in the subsurface media, it will reflect when it encounters the target with different electrical properties, which will be received by the receiving antenna. On the basis of signal processing and analysis, to achieve the detection of underground targets (Yang & Peng, 2010).
During the propagation of electromagnetic waves underground, the relative dielectric constant of the media and the electromagnetic wave velocity satisfy the following mathematical relationship
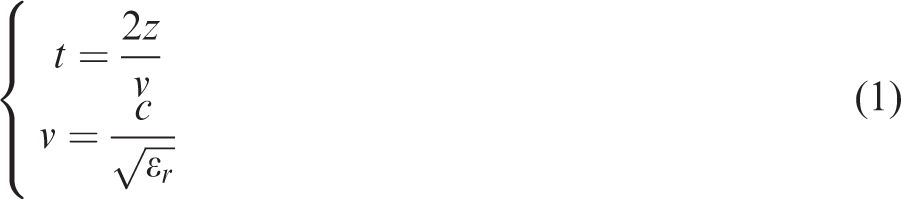
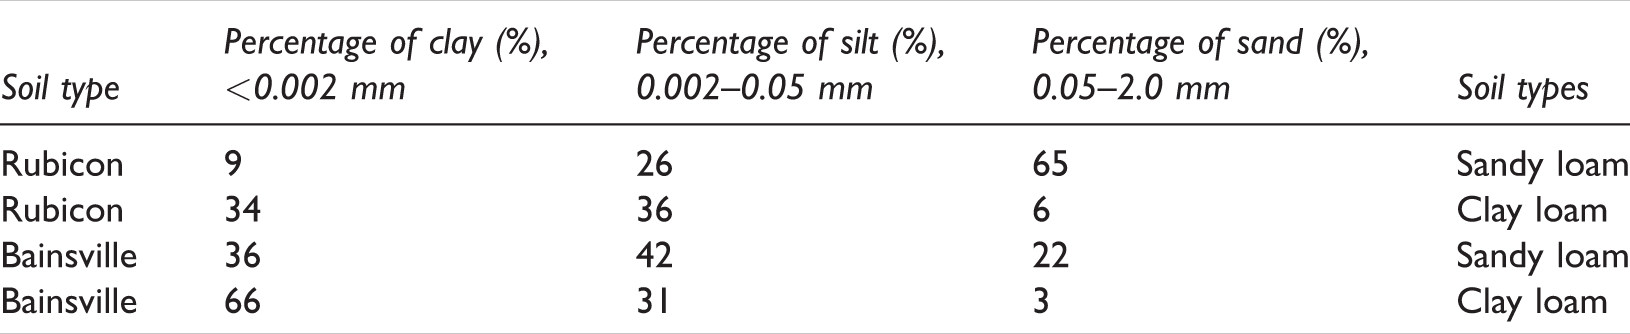
Topp (1980) collected sandy loam, clay loam and heavy clay in Rubicon and Bainsville for experiments. The test were conducted by comparing size or texture, depth in field, dry density during study, solution and water content. The results show that the dielectric constant largely depends on the volume content of water in the soil. In addition, they summarized the relative permittivity-volume water content calculation model which is shown in formula (2)

Soil type and particle size distribution of Rubicon and Bainsville.
Group intelligent optimization algorithms
In order to better predict the soil water content via GPR data in the Northern Shaanxi province. We tested several group intelligent algorithms to adjust the constants of the Topp equation so the mathematical relationship between the relative dielectric constant of the target medium and the volumetric water content can be built. In this study, the genetic algorithm, particle swarm optimization algorithm and simulated annealing algorithm are selected to optimize the constants.
(1) Genetic algorithm strategy
Genetic algorithm is an intelligent optimization algorithm proposed by Holland in 1975 (Holland, 1975). This intelligent algorithm is based on Darwin's "natural selection" theory, the Mendel's genetic theory, and the natural rule of "Survival of the fittest" and genetics. The algorithm that simulates the evolution process and then seeks the optimal solution. To encode the potential solution of the problem and express it in the form of chromosomes, and then select the fitness of the potential solution through crossover, mutation and selection, and finally obtain the optimal solution.
Figure 3 shows an iterative process of genetic algorithm. The total amount of data is n. The overall date are artificially chromosomally encoded so that the source data can have the corresponding phenotype represented by their chromosome. Next, the data volume is selected through the adaptive function, and the data that meet the function are retained and made Crossover and mutation, and generate the next generation of data volume, select the best 10% of the parent data to replace the worst child data, for the next iteration.
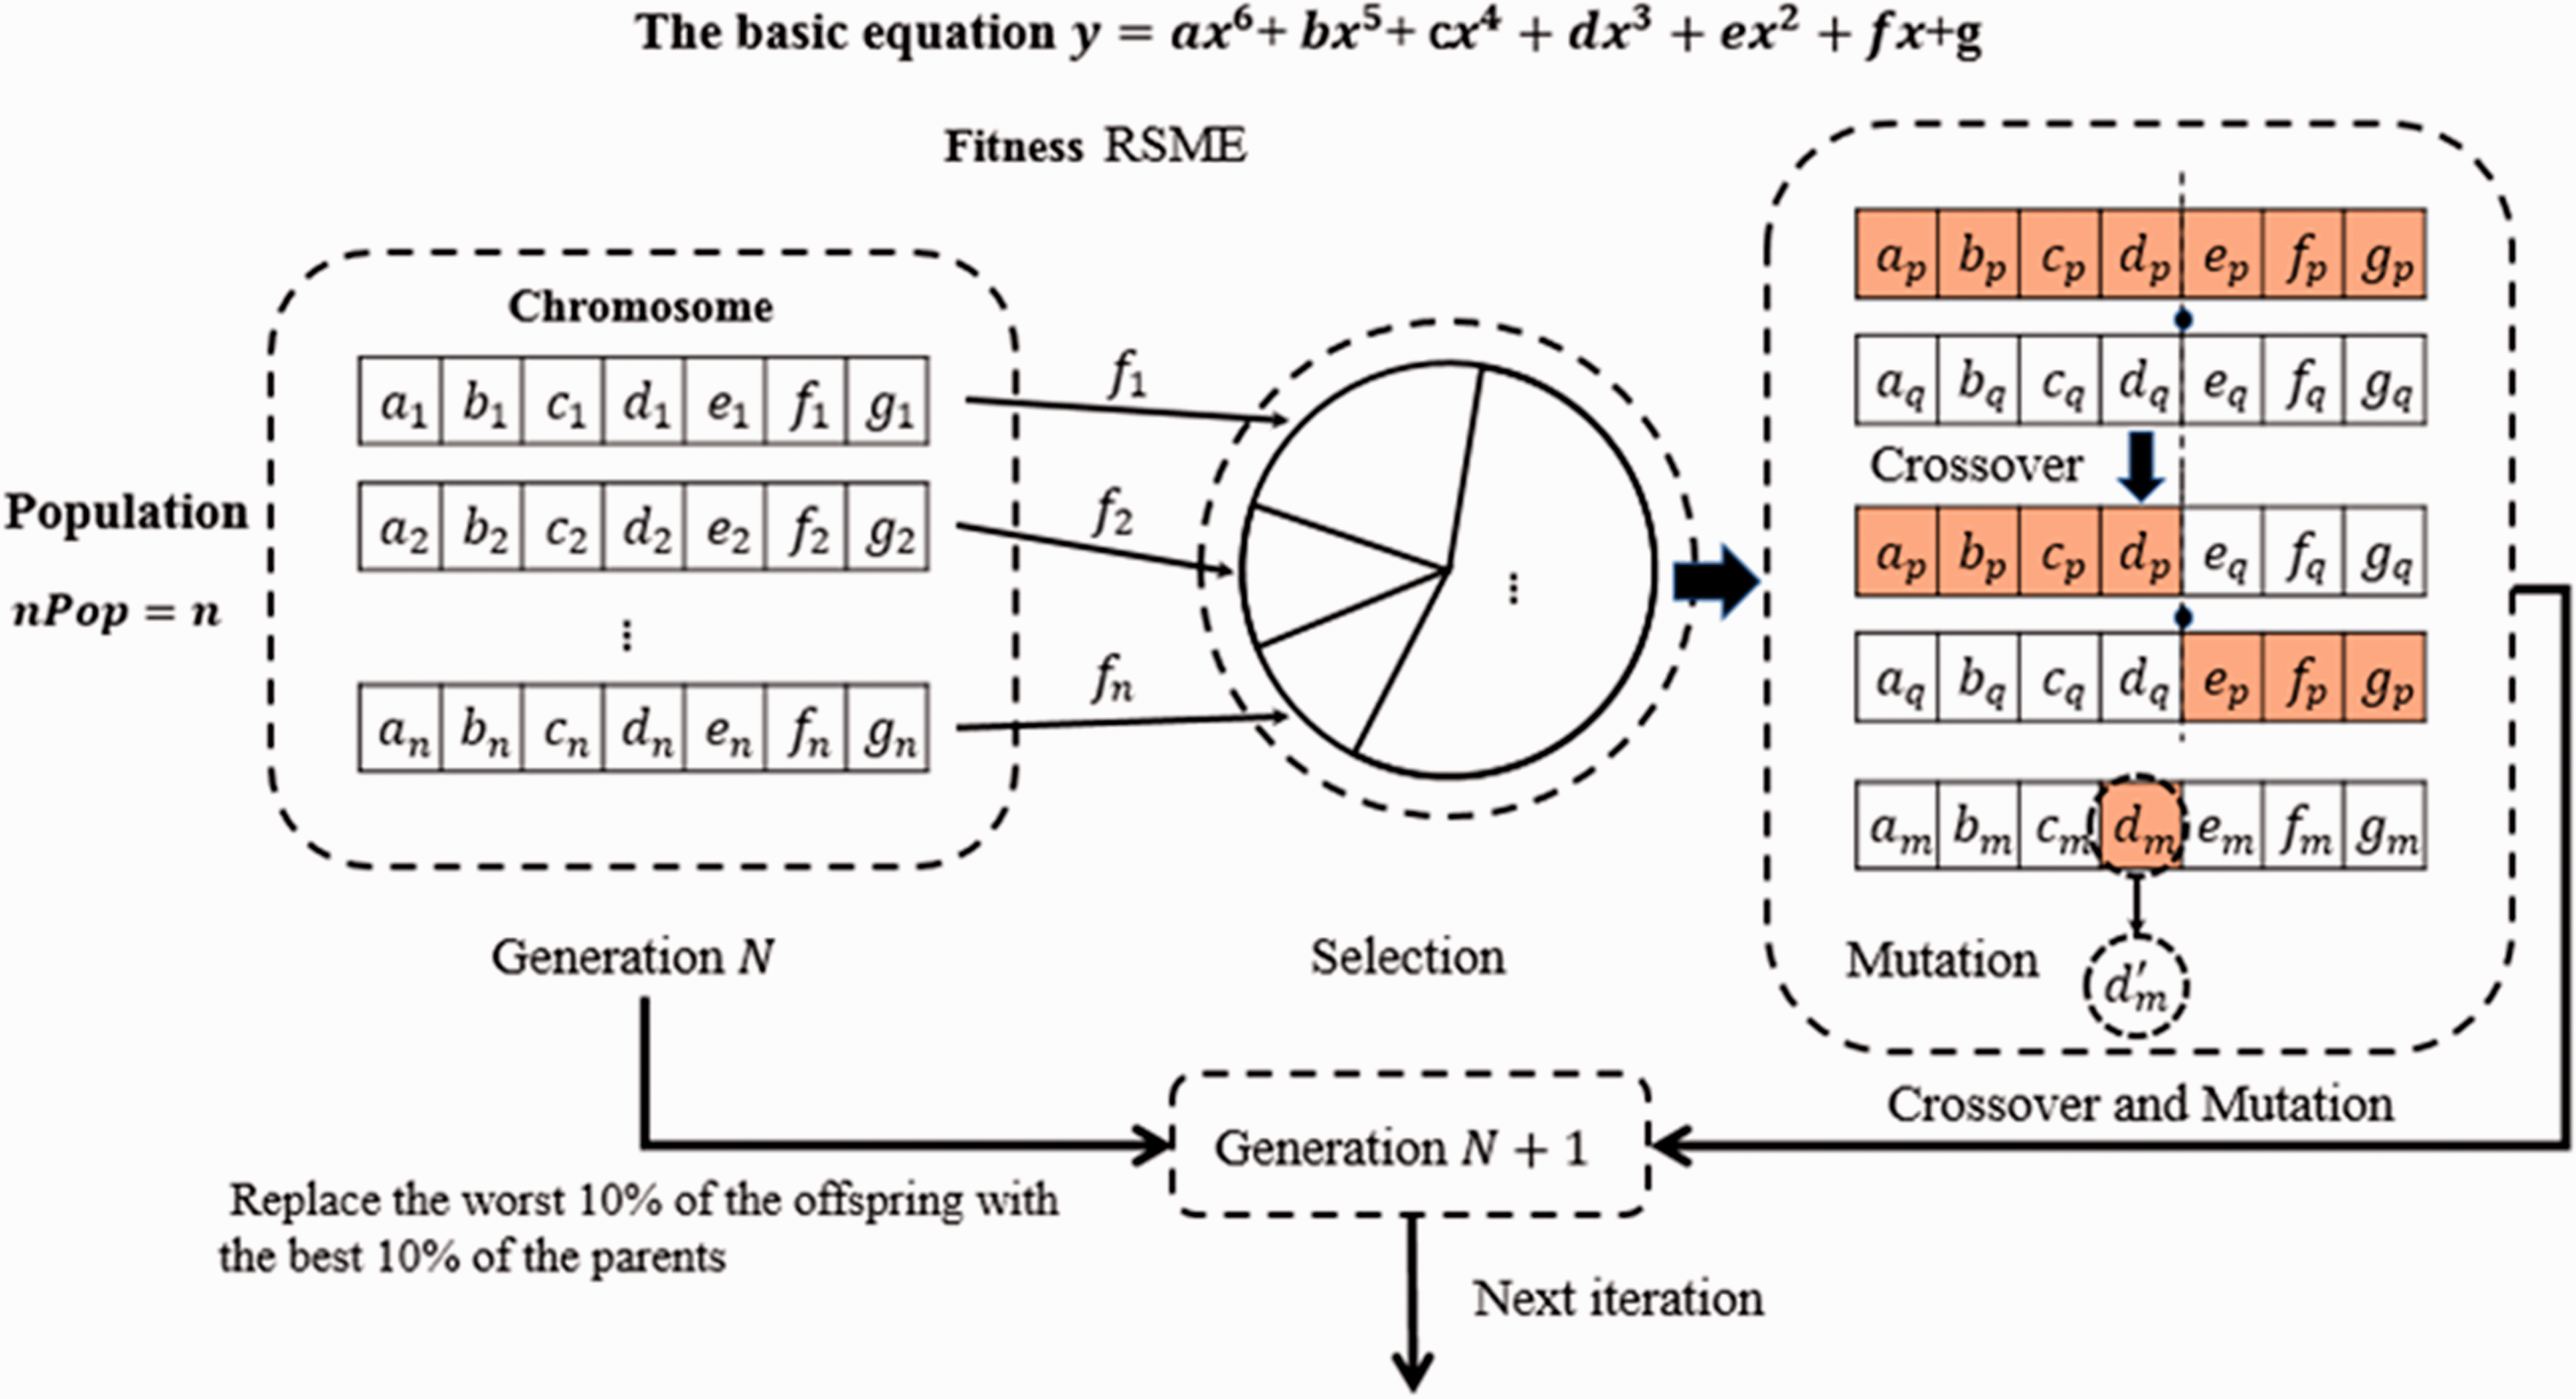
Overview of one iteration of genetic algorithm strategy.
(2) Particle swarm optimization strategy
Particle swarm optimization is an evolutionary algorithm based on stochastic solutions and continuous iterations proposed by Kennedy and Eberhart in 1995 (Eberhart, 1995). This algorithm is inspired by the biological activity of bird swarm predation. The information sharing makes the whole group evolve from disorder to order in space, that is, first initialize a set of random solutions, solve them in the solution space through continuous iterations, and finally obtain the optimal solution.
Figure 4 shows an iterative process of particle swarm optimization. The total amount of data is n, and each single data volume represents a particle, with corresponding speed and position information (vi and pi), and at the same time set the optimal position namely the target position (m), the learning factor (ci) and each particle speed threshold (vmax), after the N generation data, each particle evolves according to the set optimal position and speed threshold, and obtains single particle cognition and group cognition, and generates the next generation particle group, namely N + 1 generation particles, and go to the next iteration.
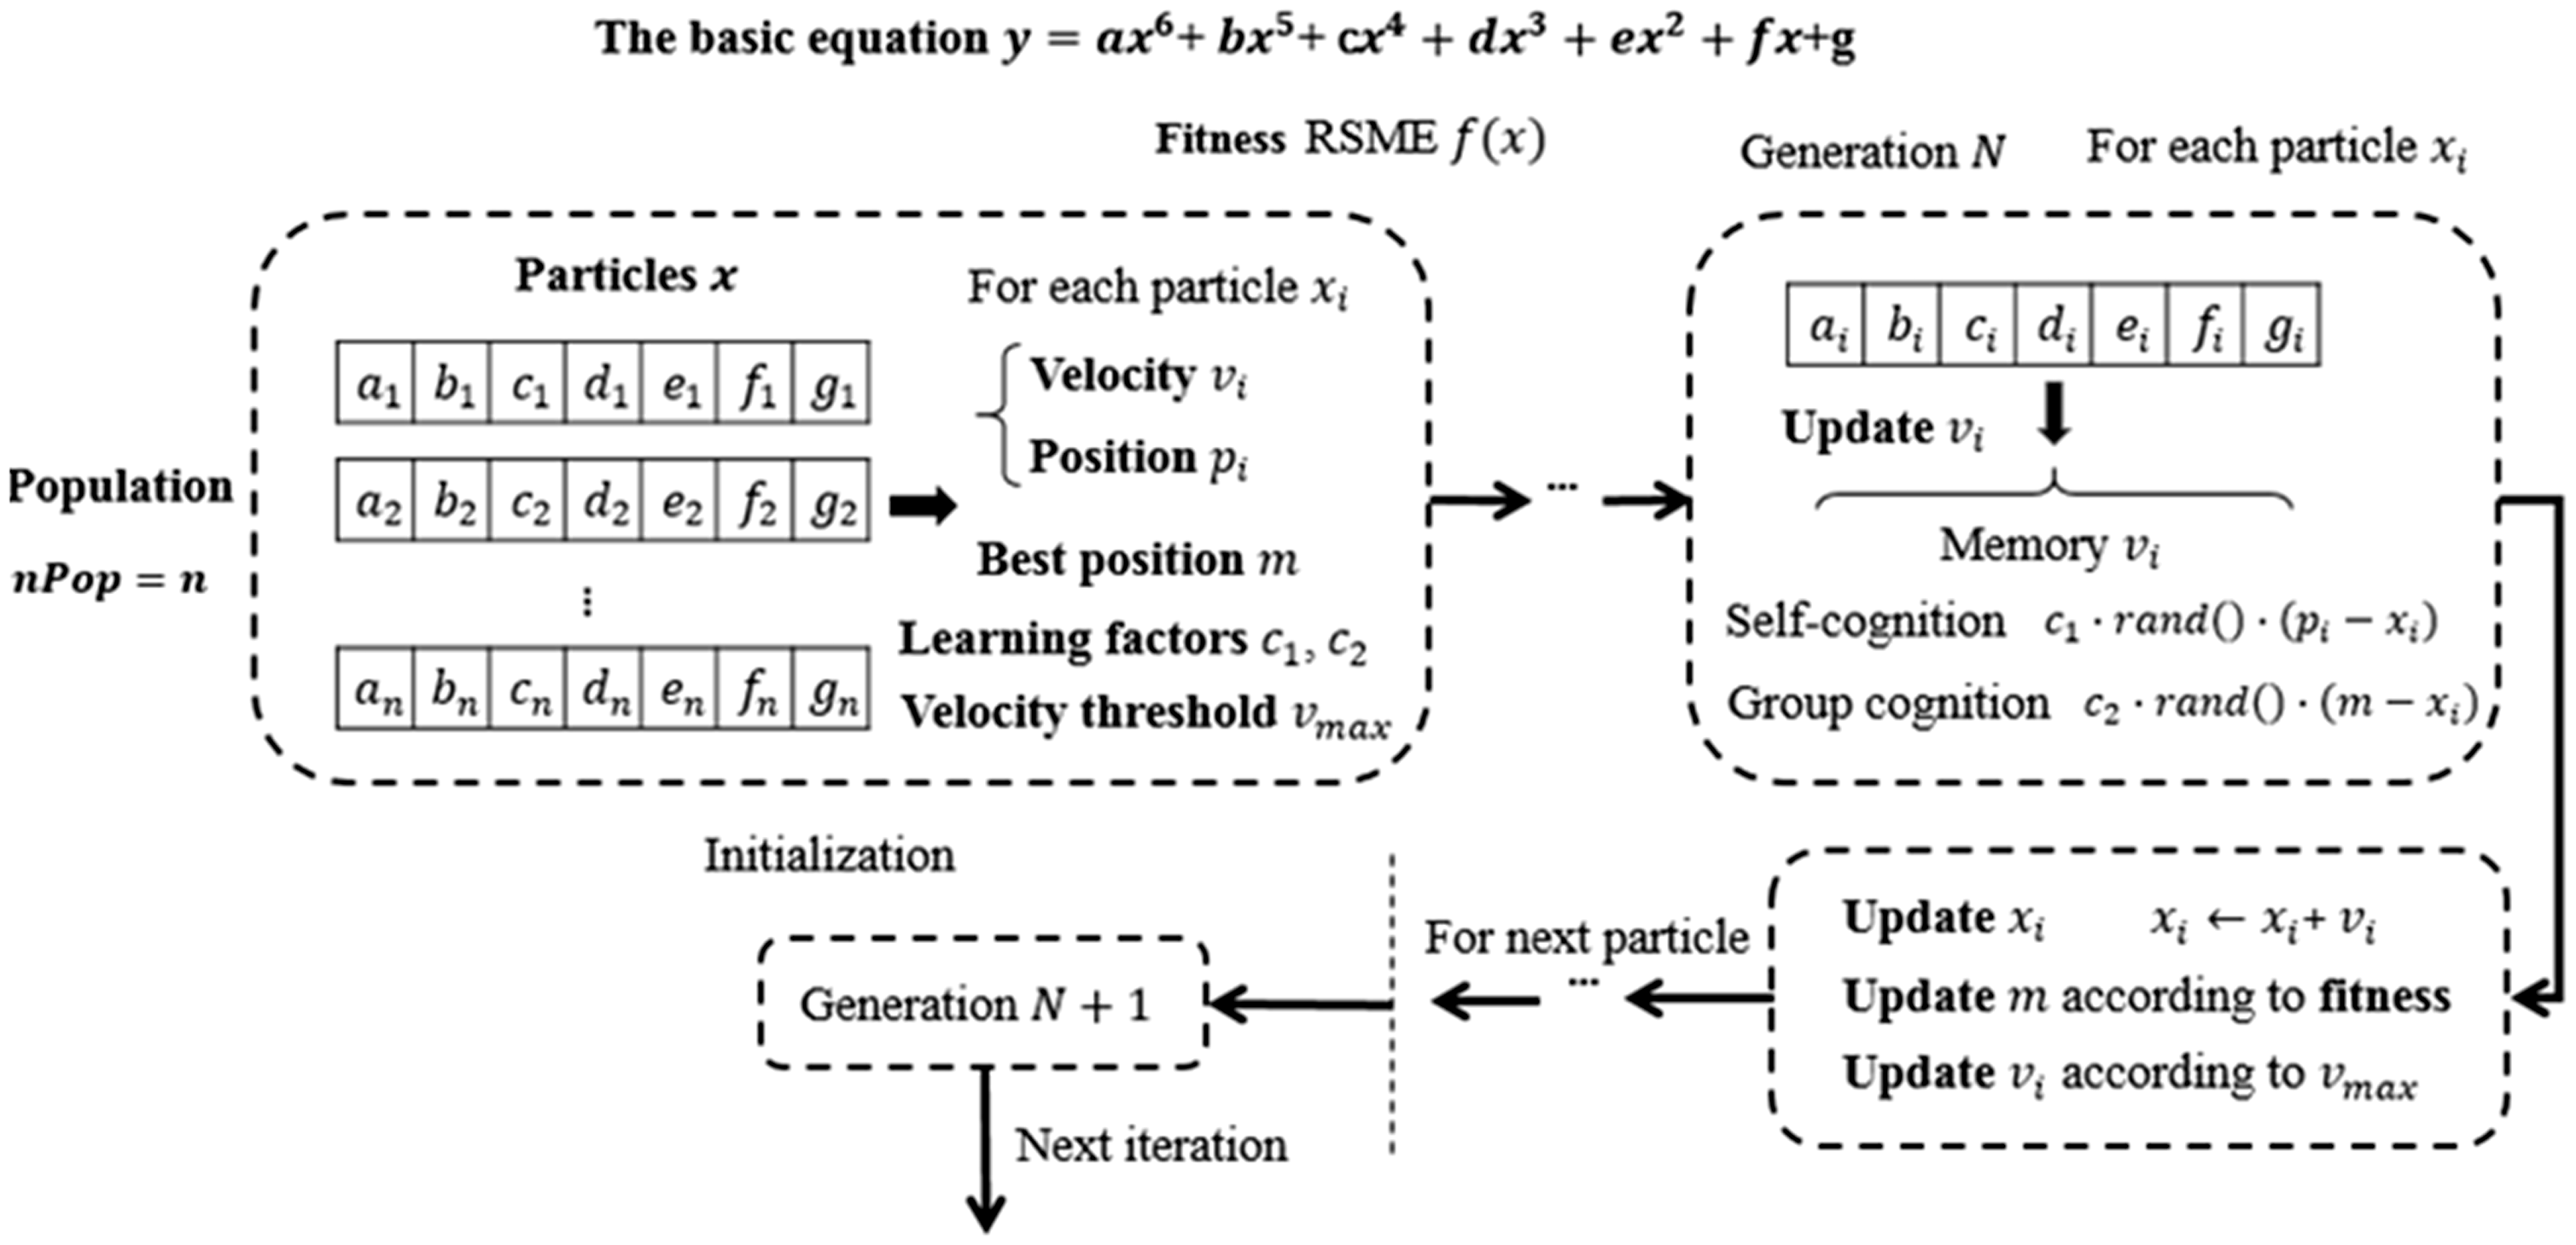
Overview of one iteration of particle swarm optimization strategy.
(3) Simulate anneal strategy
Simulated annealing algorithm is an evolutionary algorithm derived from the principle of solid annealing proposed by Metropolis in 1953 (Kirkpatrick et al., 1983). The simulated annealing algorithm starts with a higher actual temperature. As the temperature parameter decreases, the optimal solution that meets the objective function is randomly sought in the solution space.
Figure 5 shows an iterative process of the simulated annealing algorithm. Each potential solution is x0, with a corresponding initial temperature T0, and a cooling function is set at the same time. After the N generation, each potential solution generates a new potential solution x1. The new potential solution is judged by the judgment function. If x1’s error value is less than x0’s, that is determined to be updated to a new generation of x1 according to the Metropolis criterion, otherwise it returns to x0, and the cooling function is determined to be Ti, and the next iteration process is performed.
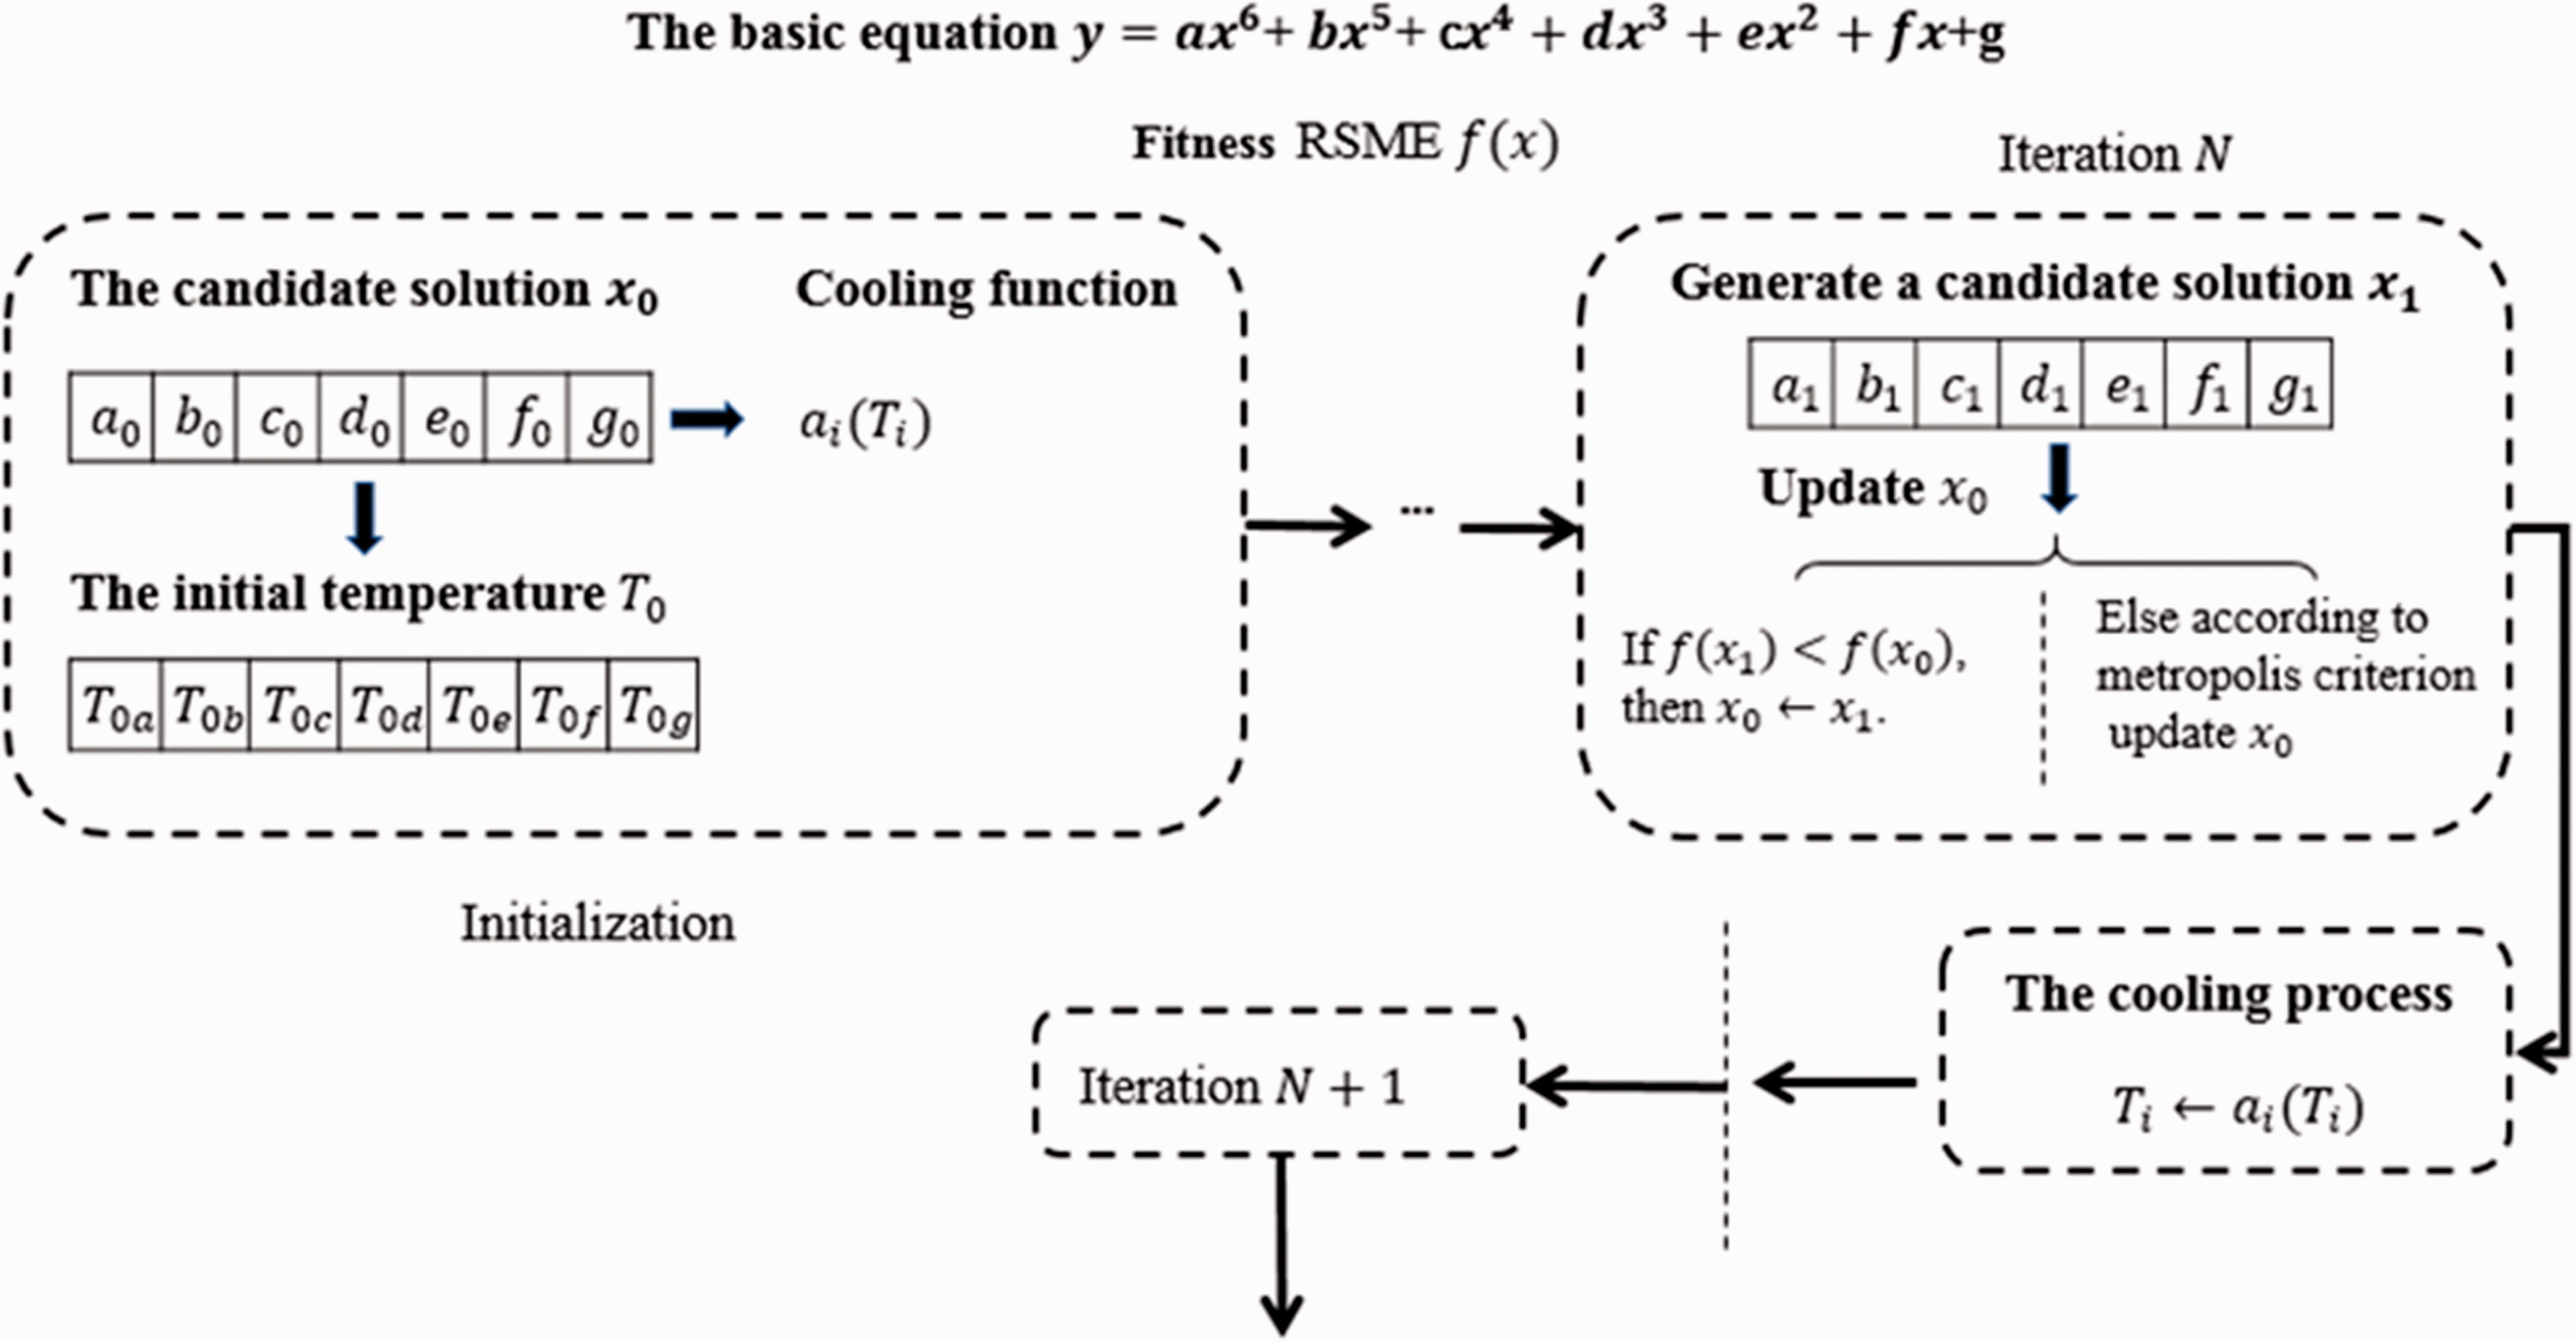
Overview of one iteration of simulate anneal strategy.
Survey line design and data acquisition
Four survey lines with the length of 900 m were laid in the direction of 52305 working face advance in Daliuta. The distance between survey lines 1, 2, and 3 is 100 m, and the distance between survey lines 3 and 4 is 200 m. In Ningtiaota, survey lines 1 and 2 were arranged perpendicular to the direction of 12002 working face advance, and survey line 3 was arranged in the direction of the working face advance. The survey lines 1 and 2 are 950 m and survey line 3 is 1150 m. The layout plan is shown in Figure 6.
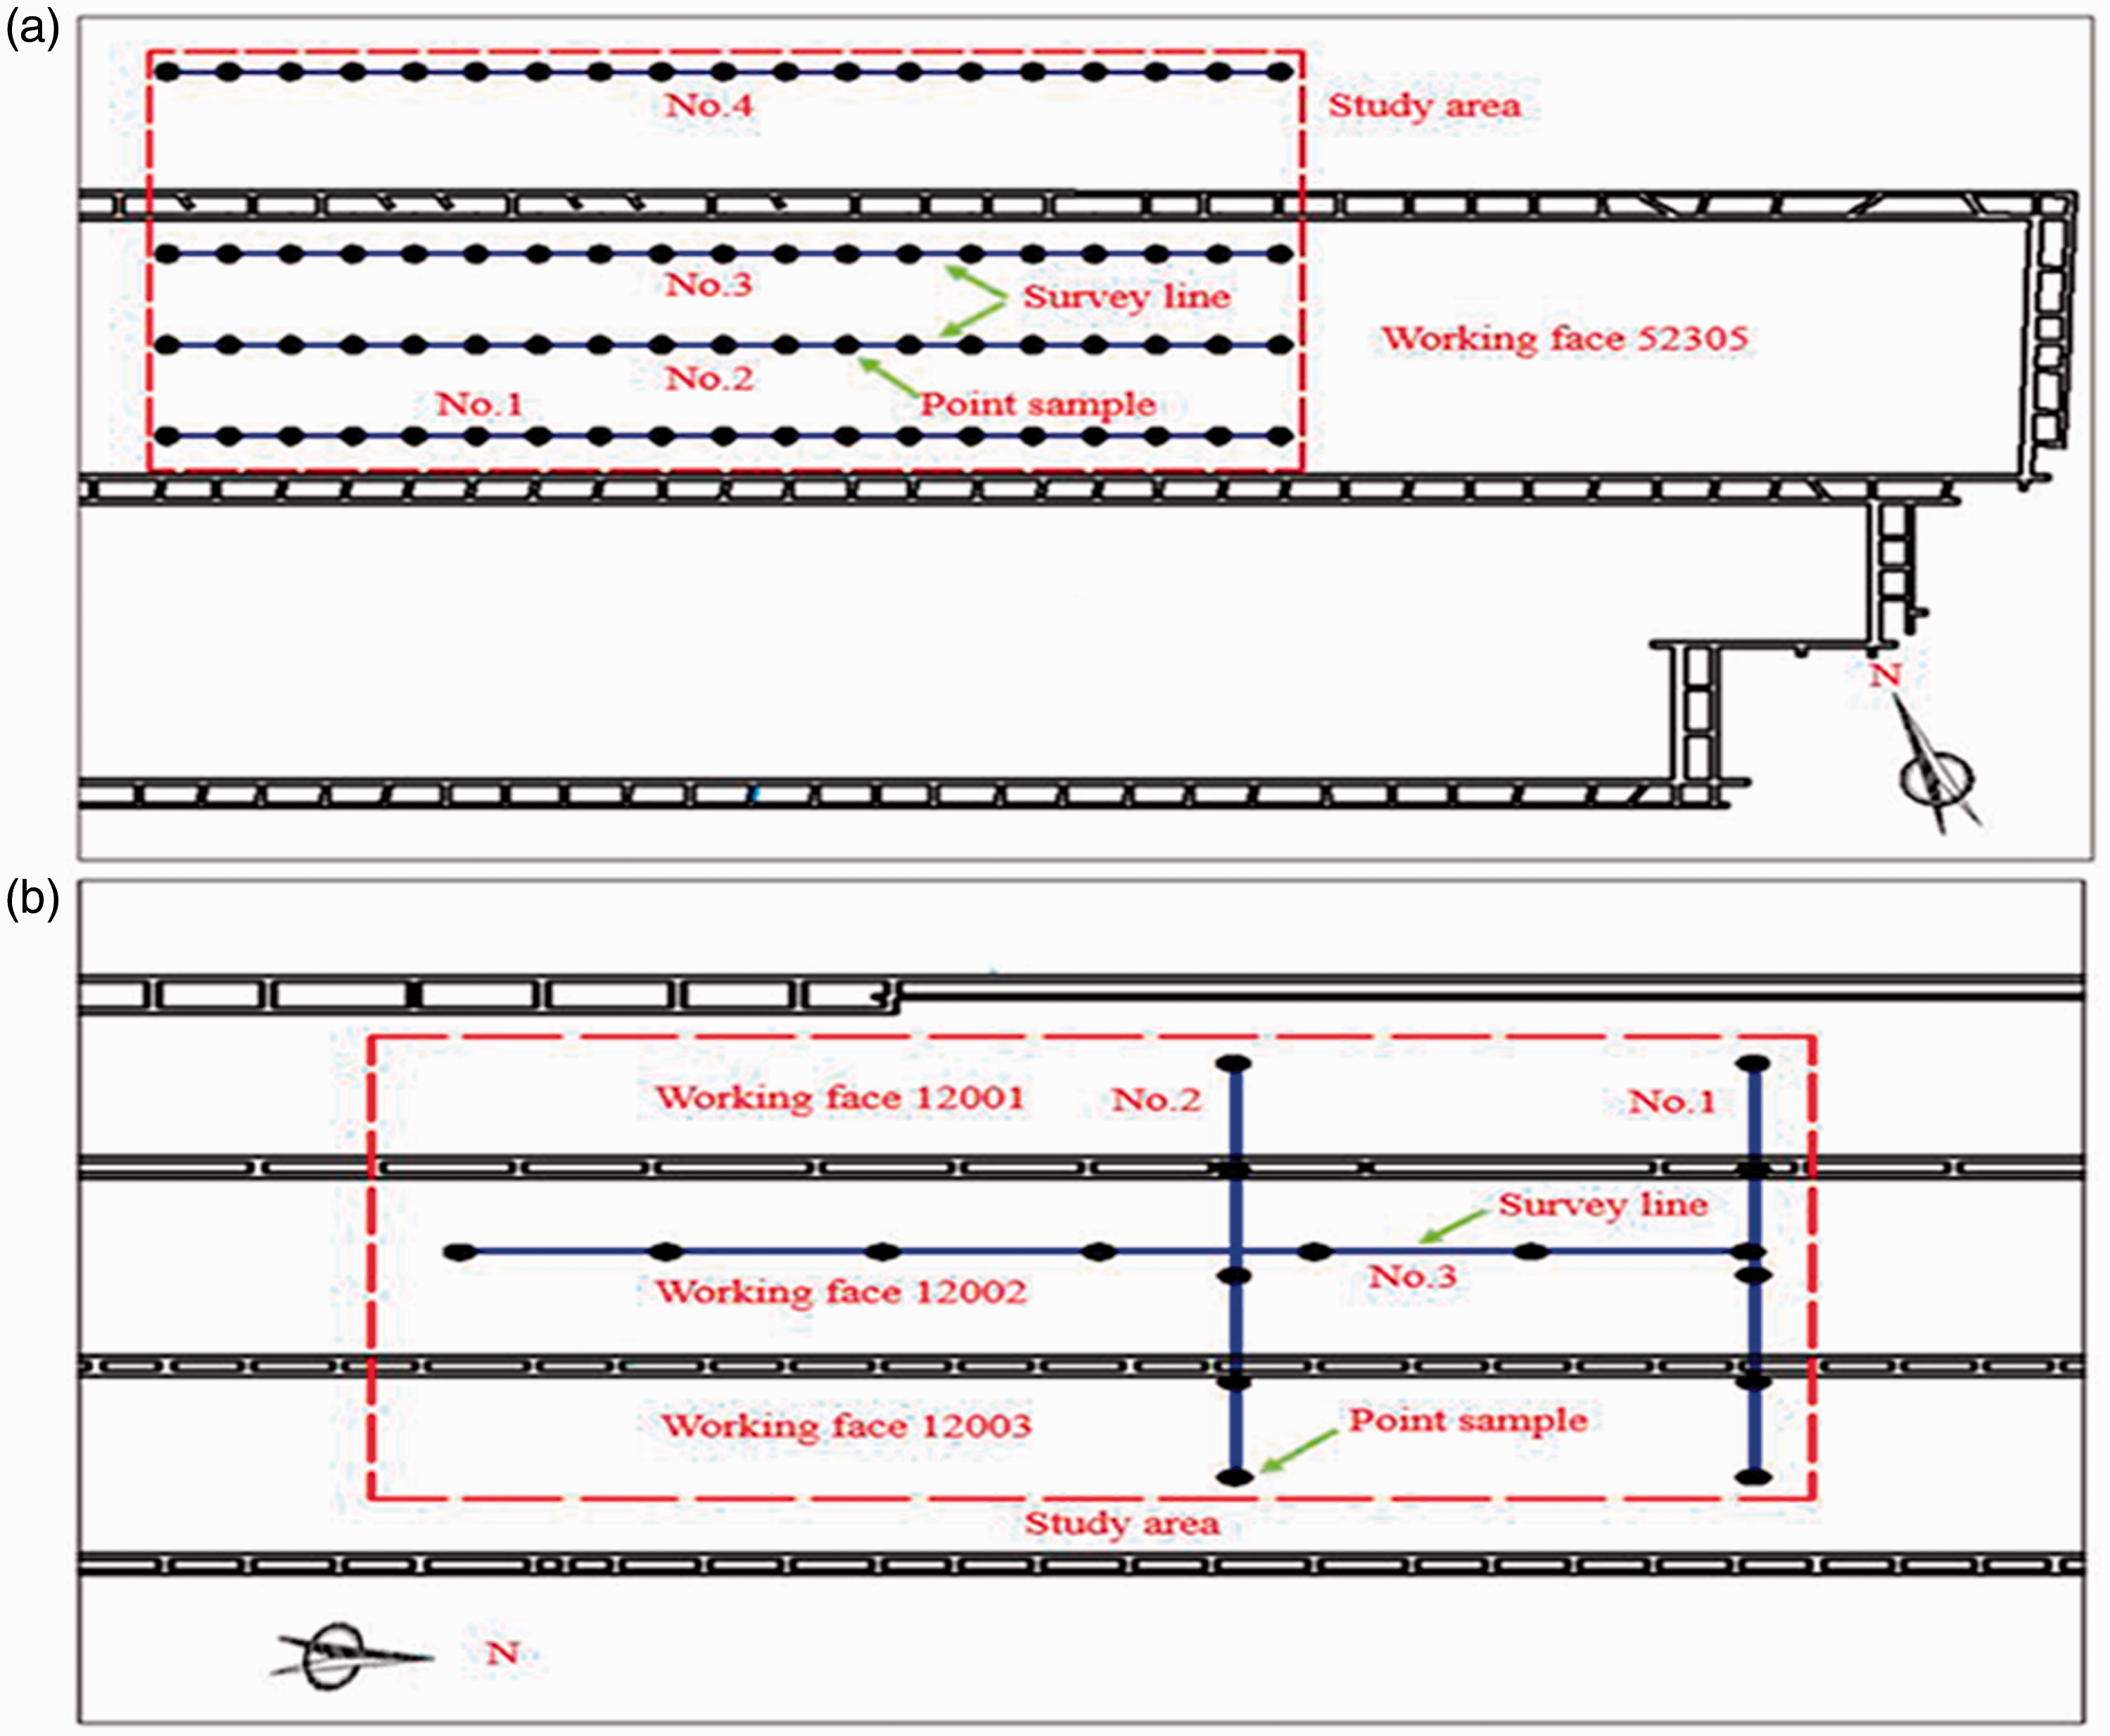
Survey line layout: (a) line layout in Daliuta and (b) line layout in Ningtiaota.
The data acquisition of ground penetrating radar adopts GR radar system of China University of Mining and Technology (Beijing). The GPR system with 100 MHz ground-coupled shielding antenna was used to collect data in each survey line. The actual situation of data acquisition is shown in Figure 7(a). In addition, the sampling points were set at 50 m apart in each Daliuta survey line, and the sampling points were spaced 200 m apart in Ningtiaota. Sampling by shallow stratum drilling: used Luoyang shovel as a tool to drill and sampled the points on each survey line, and took the ring-knife to sample every 0.5 m. To ensure that the physical properties of the soil were not damaged, put it in an aluminum box and sealed it immediately after the soil sample was taken out. A total of 252 sand samples and 140 clay samples were collected in Daliuta. And 30 sand samples and 29 clay samples were collected in the Ningtiaota for verification. The actual situation of sampling site is shown in Figure 7(b).
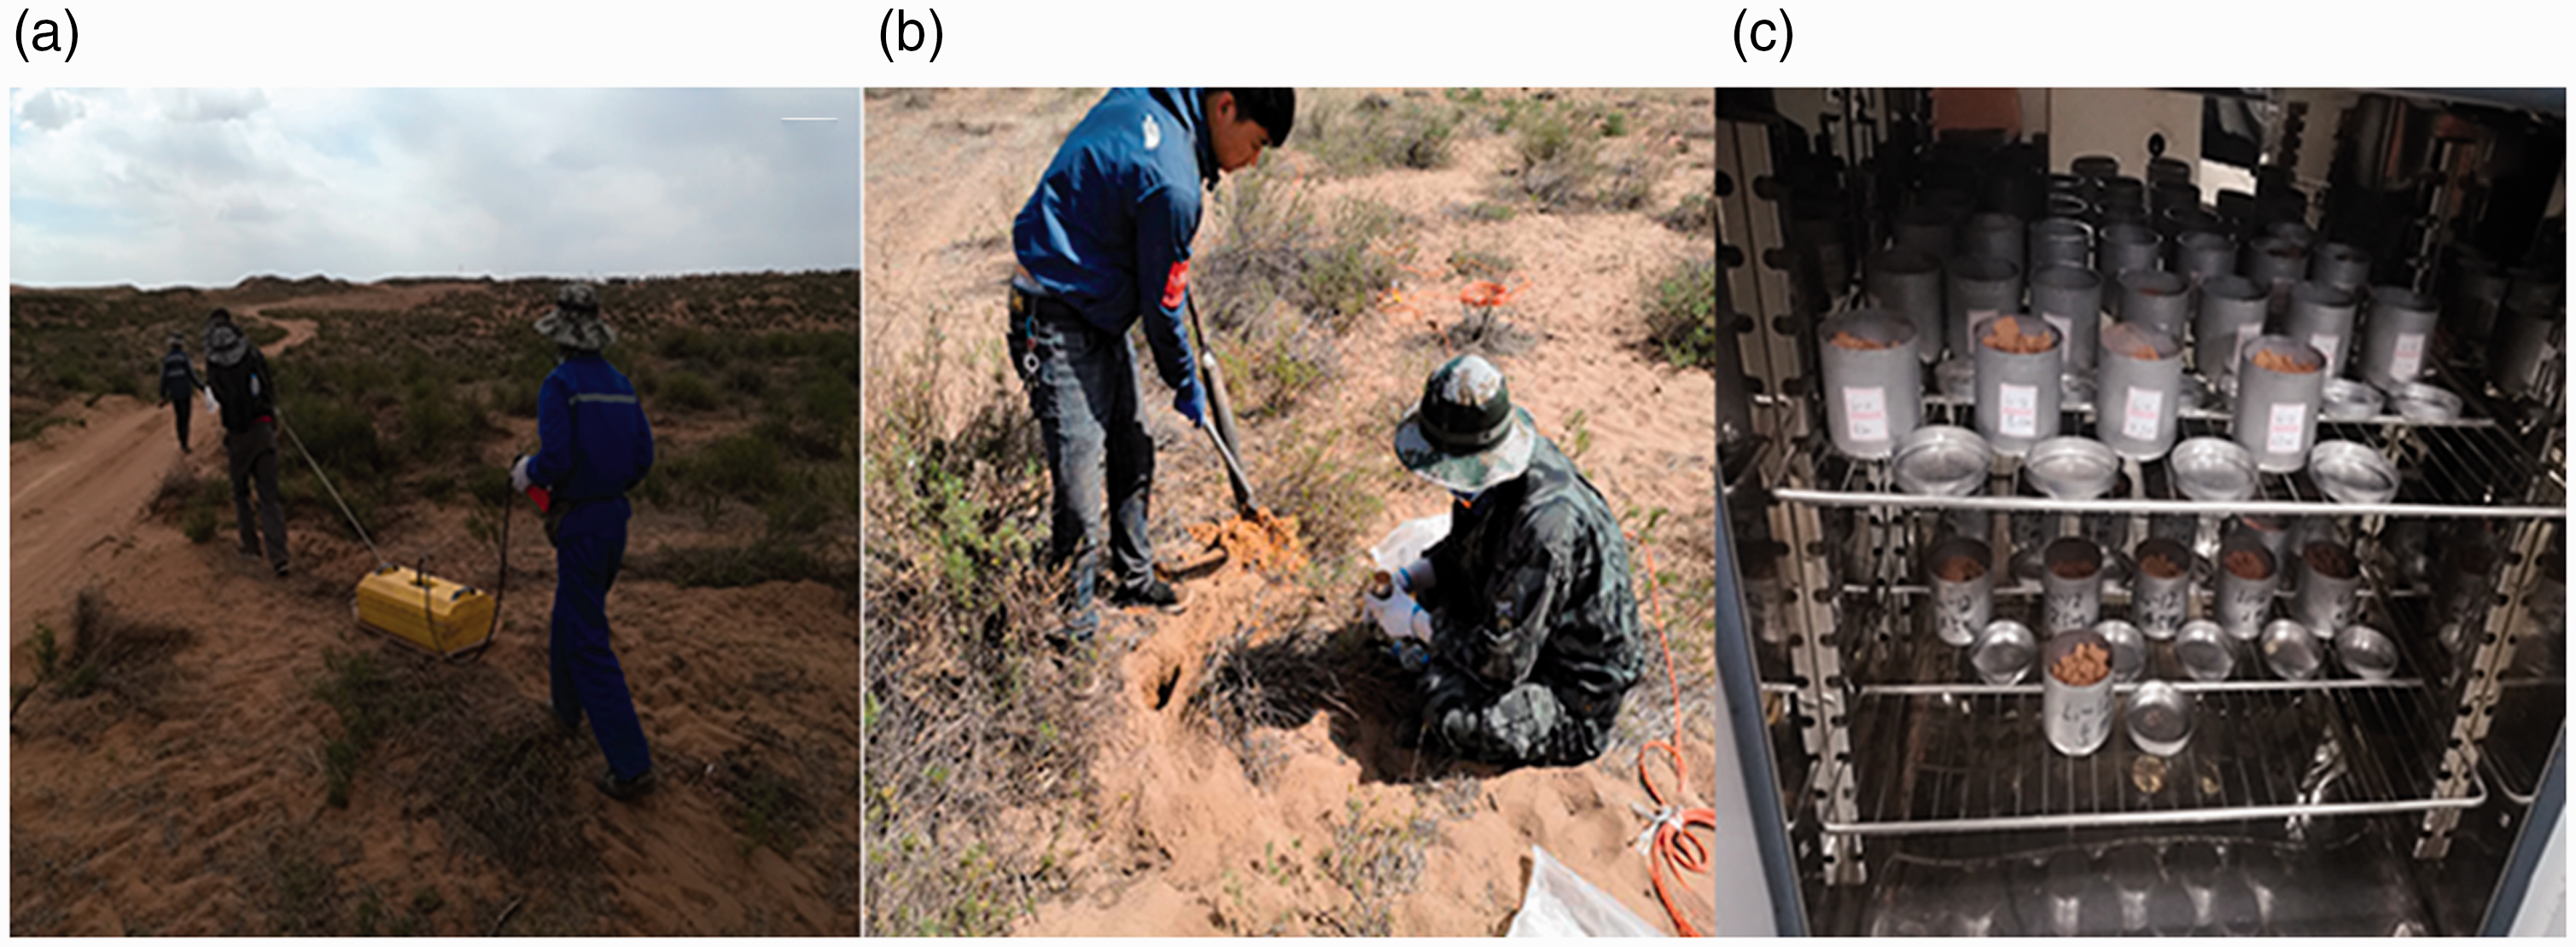
Actual picture of data collection: (a) GPR detection process, (b) drilling and sampling process, and (c) sample drying process.
Determination of volumetric water content of soil samples
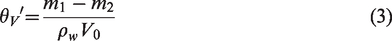
Weighted the soil sample and aluminum box with the balance to obtain m1, and then put it in an oven at 105 °C for about 12 hours until it reached a constant weight and called m2. The actual situation of the sample drying process is shown in Figure 7(c). The size of the ring-knife is Φ50.46 × 50 mm, and V0 is 100 cm3. The formula for calculating the soil water content is shown in formula (3)
GPR wave velocity calibration method
Subsurface media have large differences in their physical properties, resulting in differences in the water content of each medium layer. And different water content of the media cause a great difference in electrical properties. The GPR is based on these differences in media to detect, so the GPR can accurately obtain the reflection surface between different media, that is, the interface between the media.
With a series of data processing and interpretation of the radar data collected in the field, the reflection surfaces of various media can be obtained. Identifying the reflective surfaces of the media in the GPR data and obtaining the travel time of the radar wave reaching the reflection interface. Combining the drilling sampling to calibrate the media positions in the study area, as shown in Figure 8. Then using formula (1) for calculation, the wave velocity in different media can be accurately obtained, and gaining the relative dielectric constant of the clay and sand.
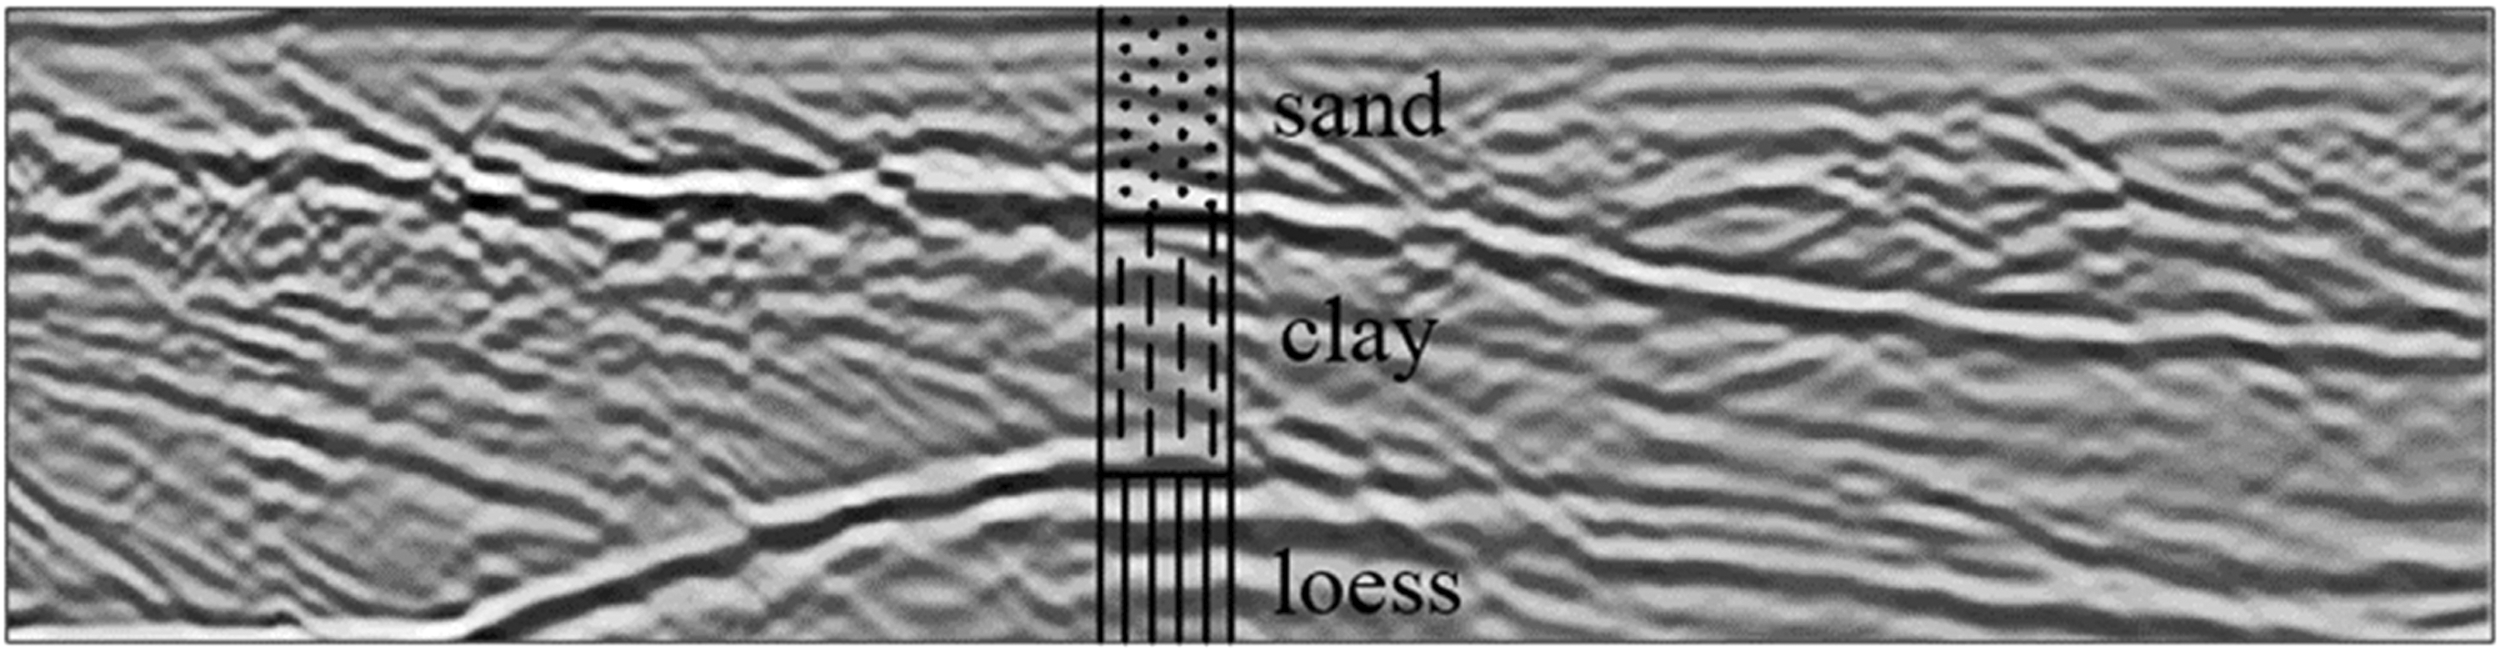
Radar wave reflecting surface.
Results and discussion
Constants modification
Comparing our research areas with the study areas of Topp, it can be found that the constituents of the media are basically the same. However, the percentage of soil types is quite different. In our research area, sand is the main component in sandy loam, followed by silt and clay; in clay loam, clay and silt occupy the same proportion, and the sand content is relatively small. In the bainsville study area of Topp, clay is obviously more than silt in clay loam, silt and clay in sandy loam are also more than sand. Due to the differences in the above composition of the soil, the Topp formula is not suitable for this study area.
Based on experimental moisture content and relative dielectric constant which was calculated from accurate wave velocity. Genetic algorithm, particle swarm optimization algorithm and simulated annealing algorithm constant optimization results are shown in Figures 9 and 10.
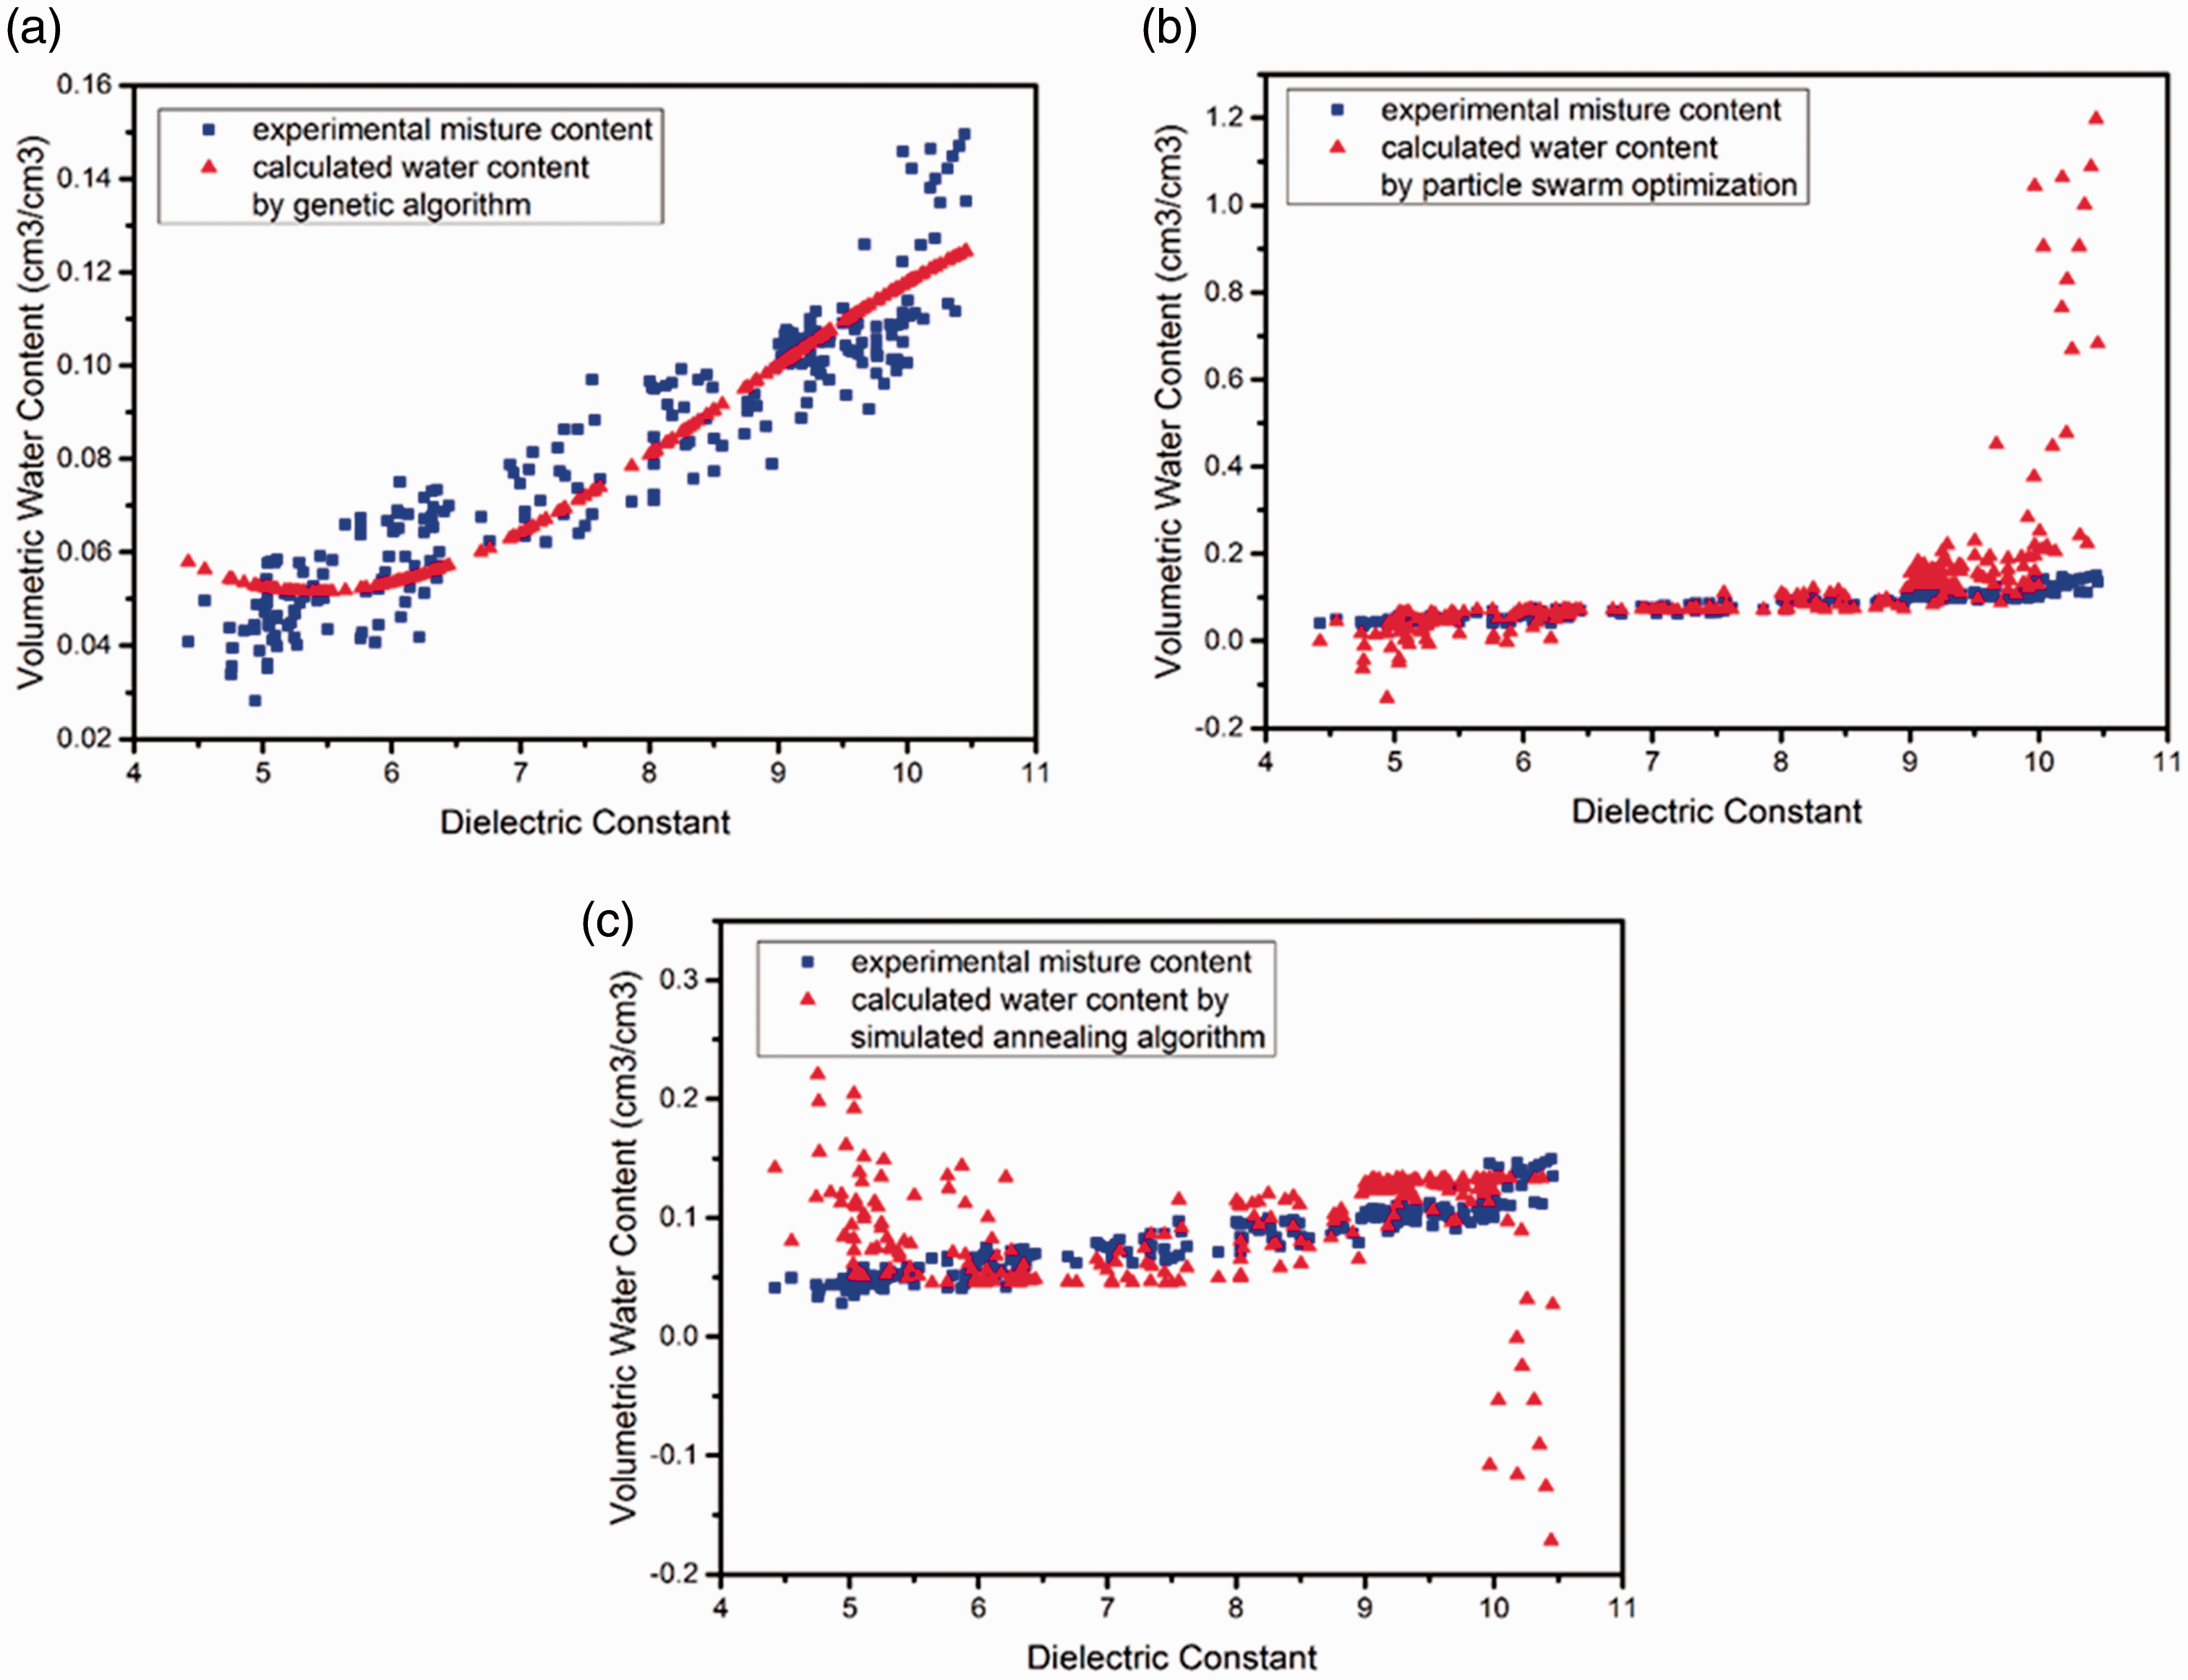
Intelligent group algorithm optimizes results for sand constants: (a) genetic algorithm results for constants of sand, (b) particle swarm optimization results for constants of sand, and (c) simulated annealing algorithm optimized results for constants of sand.
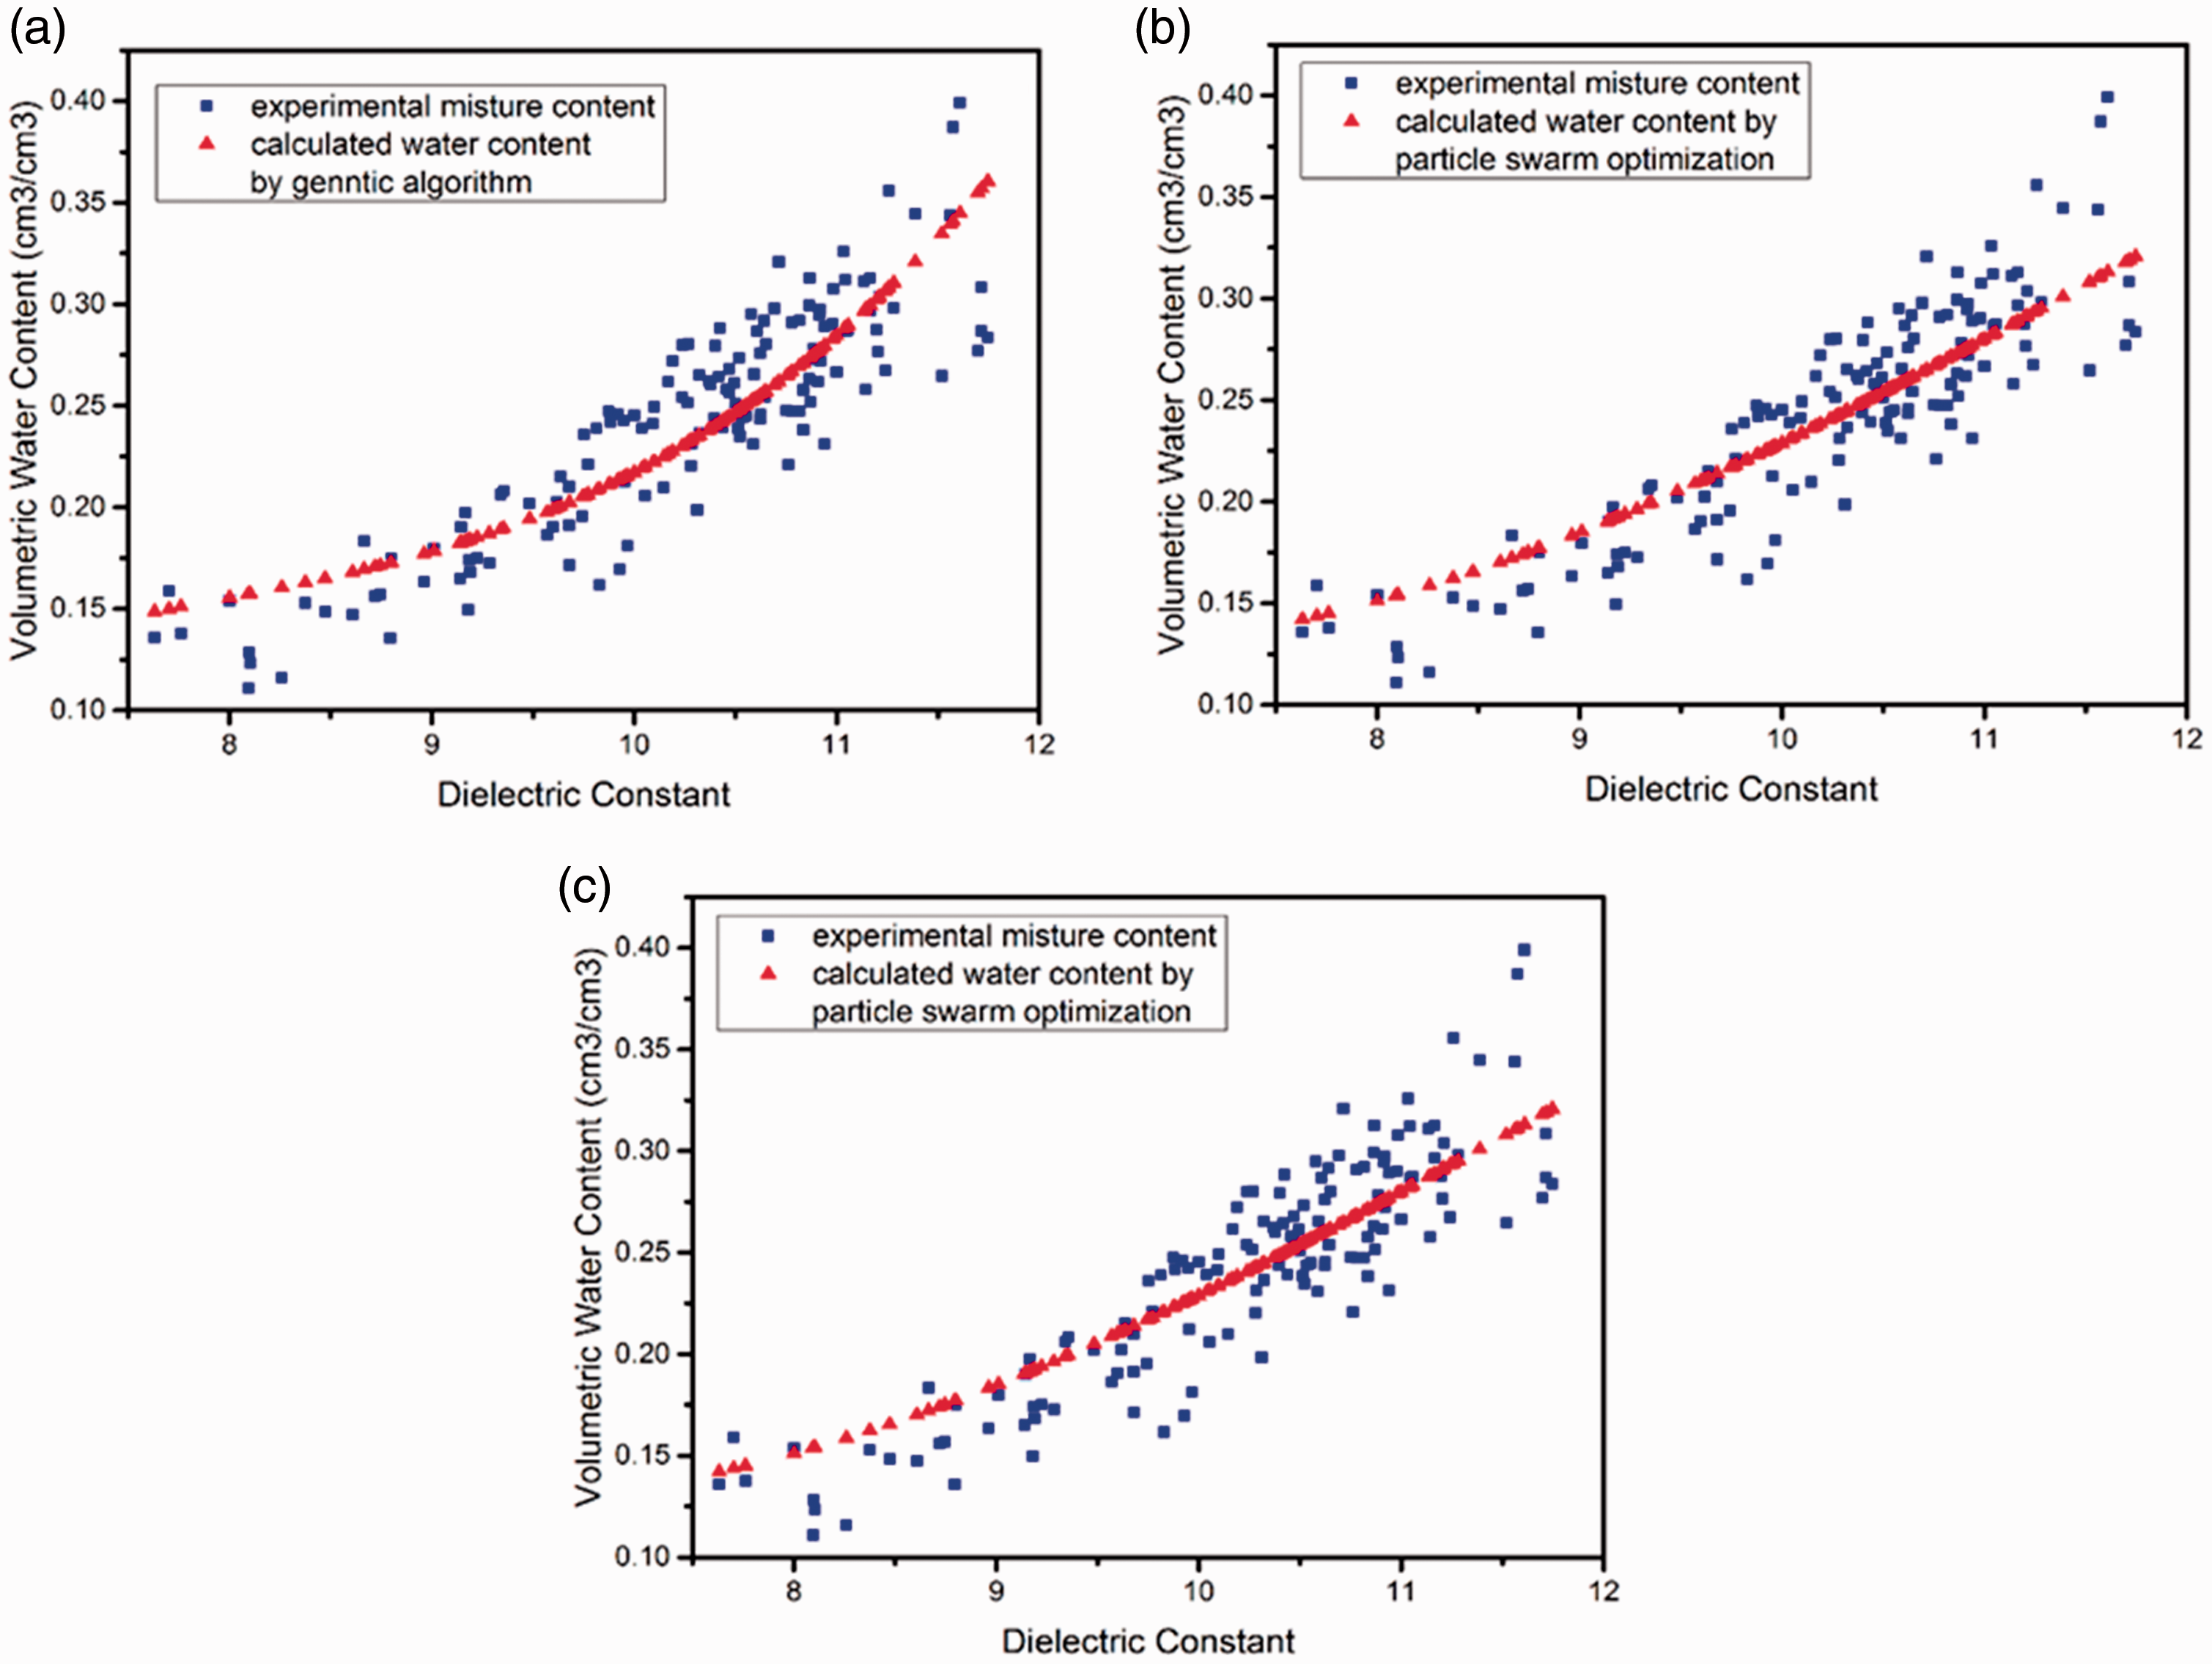
Intelligent group algorithm optimizes results for clay constants: (a) genetic algorithm for clay constant optimization results, (b) particle swarm optimization results for constants of clay, and (c) simulated annealing algorithm optimized results for constants of clay.
Genetic algorithm, particle swarm optimization algorithm, and simulated annealing algorithm all optimized constants. But the optimization effects of three algorithms are very different. When target medium is sand: after genetic algorithm optimizing the constant term, the maximum error value was 0.0286 cm3/cm3, the minimum error value was 0.00003 cm3/cm3, the average error value was –0.00006 cm3/cm3, and the average error rate was –1.98%. Using particle swarm optimization algorithm to optimize the constant term, the maximum error value was 1.0478 cm3/cm3, the minimum error value was 0.00004 cm3/cm3, the average error value was –0.0529 cm3/cm3, and the average error rate was –32.13%. After optimization of the constant term using simulated annealing algorithm, the maximum error value was 0.3211 cm3/cm3, the minimum error value was 0.0003 cm3/cm3, the average error value was –0.0100 cm3/cm3, and the average error rate was –32.51%. When the target medium was clay, after using genetic algorithm to optimize the constant term, the maximum error value was 0.07784 cm3/cm3, the minimum error value was 0.00004 cm3/cm3, the average error value was 0.0008 cm3/cm3, and the average error rate was –1.23%. Using particle swarm optimization algorithm to optimize the constant term, the maximum error value was 0.0858 cm3/cm3, the minimum error value was 0.0004 cm3/cm3, the average error value was –0.0009 cm3/cm3, and the average error rate was –2.35%. Using simulated annealing algorithm to optimize the constant term, the maximum error value was 0.0787 cm3/cm3, the minimum error value was 0.0001 cm3/cm3, the average error value was –0.0005 cm3/cm3, and the average error rate is 2.12%.
Through the analysis of correction of Topp coefficient, when the target media are sand and clay, the optimization effects of three algorithms are different. When the target medium is sand, the optimization effect of genetic algorithm is obviously superior to particle swarm optimization and simulated annealing algorithm. The parameters such as maximum error value, minimum error value, average error value and average error rate after using the genetic algorithm to optimize are far lower than the parameters of particle swarm optimization algorithm and simulated annealing algorithm. When the target medium is clay, the optimization results of three algorithms are close. The parameters such as maximum error value, minimum error value, average error value and average error rate after using genetic algorithm to optimize are slightly better than the optimization results of particle swarm optimization algorithm and simulated annealing algorithm. In order to further analyze the optimization effects and applicability of three algorithms, the algorithms need to be verified separately.
Data validation
In order to ensure the applicability of new mathematical model in a larger range, sand and clay data of Ningtiaota were selected to verify each model, and compared with the classic Topp formula to analyze their accuracy.
The data of Ningtiaota were given to verify the mathematical models optimized by three algorithms, the accuracy of values calculated varies greatly, as shown in Figure 11. The error analysis of the Topp formula and three optimization models is shown in Tables 3 and 4.
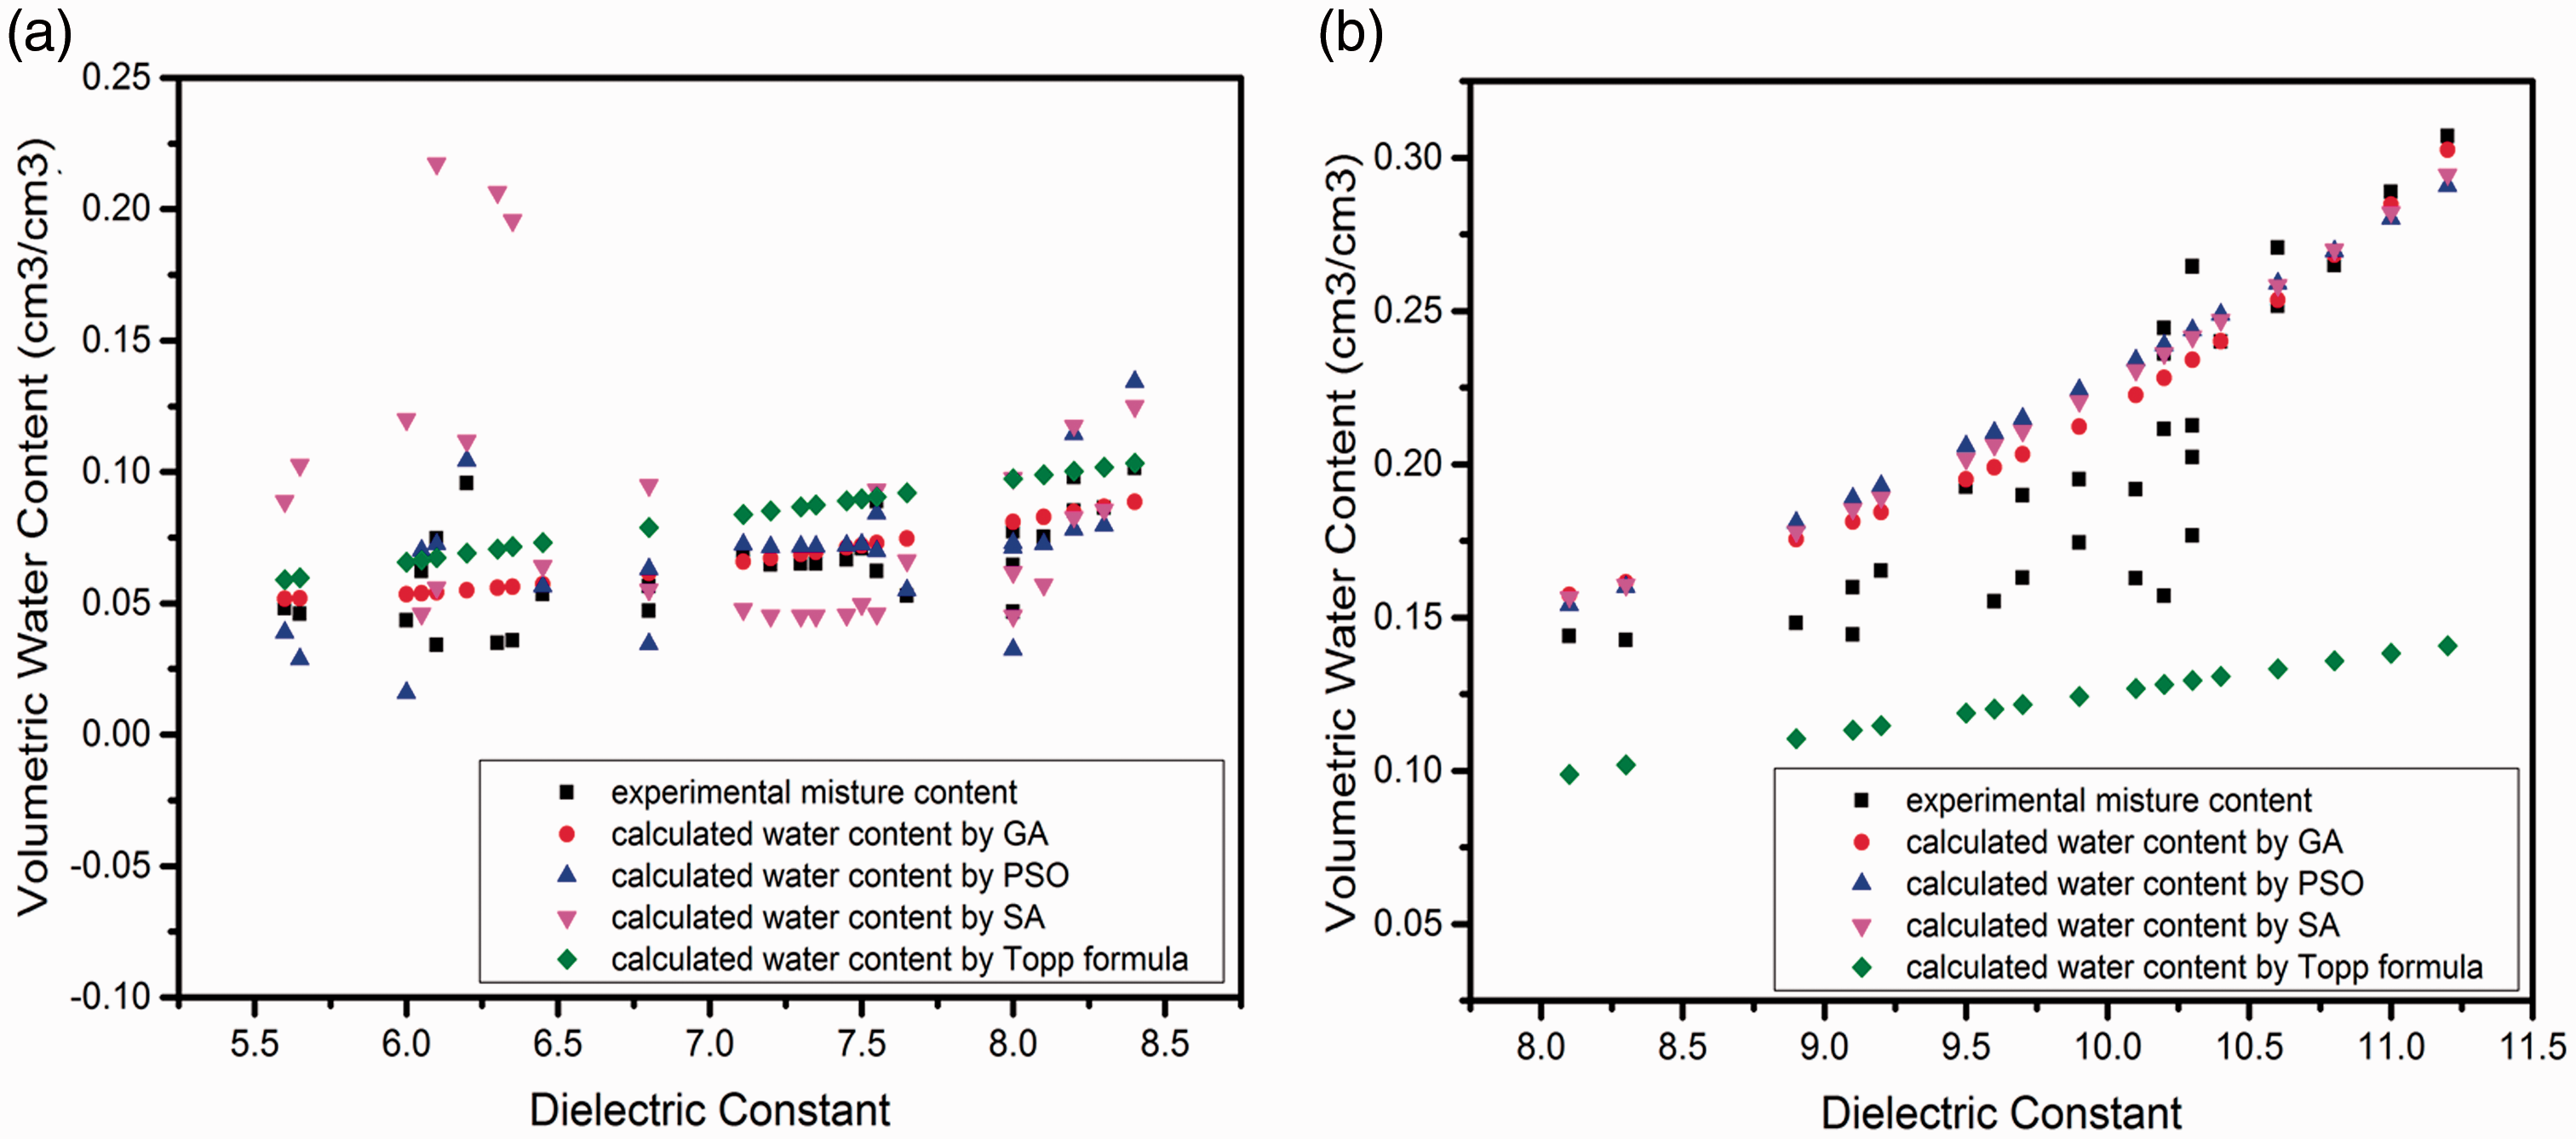
Genetic algorithm verification results: (a) verification results of sand and (b) verification results of clay.
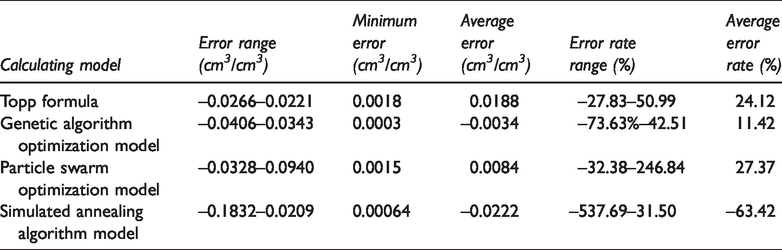
The error analysis of sand calculated by Topp formula and three optimization models.
The error analysis of clay calculated by Topp formula and three optimization models.
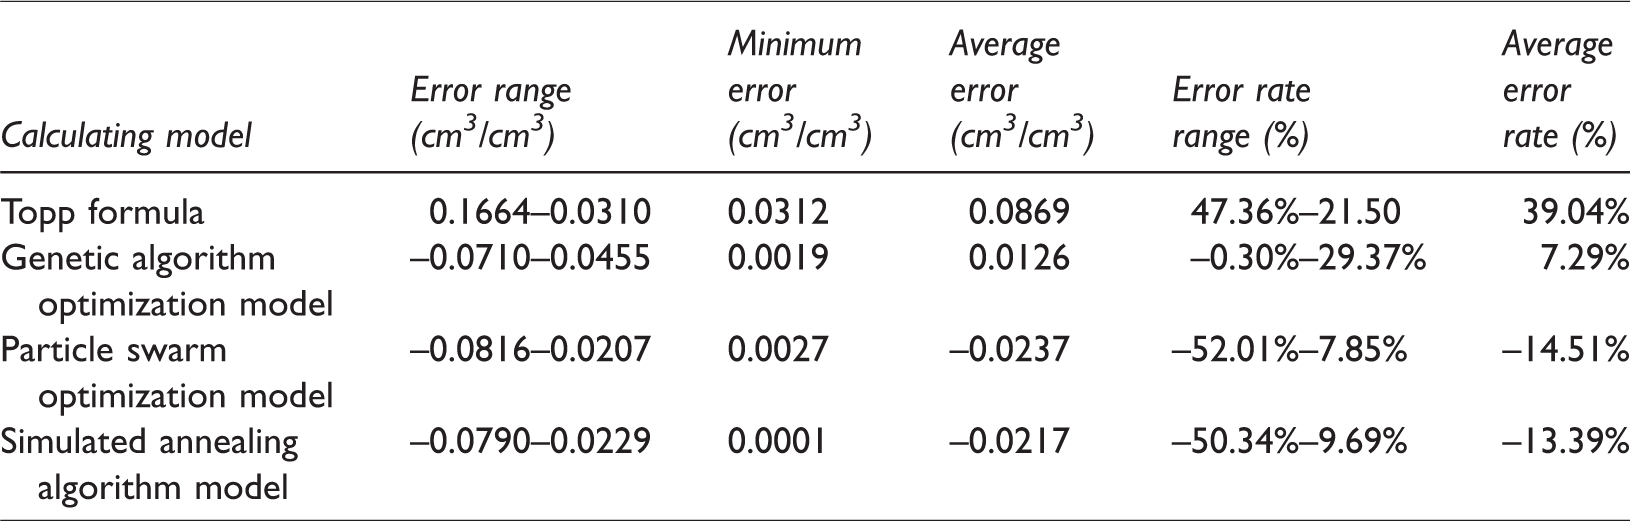
Comparing the verification results of three optimization algorithms, it can be found that the optimization effect of genetic algorithm is better. When calculated the water content of sand, the minimum error values, average error values and average error rates of the model optimized by genetic algorithm are all smaller than the error values of the other two algorithms. When calculated the water content of clay, the minimum error values, average error values, and average error rates of the model optimized by genetic algorithm are also smaller than the others.
At the same time, compared with the calculation value of the classic Topp formula, it can be found that the calculated values of sand model after genetic algorithm optimization: the minimum error value was reduced from 0.00181 cm3/cm3 to 0.00035 cm3/cm3, the average error was reduced from 0.01888 cm3/cm3 to –0.00345 cm3/cm3, and the maximum error rate was reduced from 50.99% to 37.70%, the average error rate was reduced from 24.12% to 11.42%. The calculated values of clay model after genetic algorithm optimization: the maximum calculation error value was reduced from 0.03102 cm3/cm3 to 0.03052 cm3/cm3, the minimum calculated error value was reduced from 0.0312 cm3/cm3 to 0.00199 cm3/cm3, and the average error was reduced from 0.0869 cm3/cm3 to –0.0164 cm3/cm3, the average error rate was reduced from 39.04% to –10.60%. The calculation accuracy is better than the calculation results of the classic Topp formula. However, the new calculation model also has some problems, that is, the maximum calculated error of sand is not lower than that before correction, but have increased.
Although the new relative permittivity-volume water content model is less effective than the classic Topp formula in some parameters, it is significantly better than the classic Topp formula in more parameters. So the new calculation model still has high accuracy. Therefore, the mathematical model optimized by genetic algorithm is used as the new model for calculating volumetric water content. The revised calculation formula is shown as formula (4).
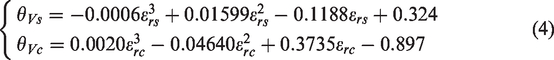
Comparing the coefficient of the optimization model with Topp formula, it can be found that different regions and different soil types have great influences on the coefficient of the formula. And the formula coefficients are also affected if same soil type contains different mineral contents and particle size distributions. Thus, there is some deterministic relationship between Topp coefficient and soil properties. But soil is a complex combination of multiple media, mineral contents, soil particle size distributions and organic matter, and these factors will have an impact on the soil properties and Topp coefficient. So Topp coefficients will be what kind of changes because of the various soil properties, which is the key content of our next research.
Conclusions
In this project, based on the measured water content of sand and clay in Daliuta mining area in northern Shaanxi, China, an optimal solution of the mathematical model of relative permittivity-volume water content is obtained by group intelligent algorithms. And the model was validated by the data collected from Ningtiaota mining area. The results show that under the comparison of various parameter indexes such as minimum error value, average error rate, average error value, the calculation model using genetic algorithm to modify the constant term is significantly better than the model modified by particle swarm optimization and simulated annealing algorithm. That is, compared with the other two optimization algorithms, genetic algorithm is more suitable for the optimization of relative permittivity-volume water content calculation model of sand and clay in the aeolian sand area of the coalfield in northern Shaanxi, China. And compared with the classic Topp formula, when the model is used to calculate volumetric water content of sand and clay, the error value and error rate are basically maintained in a relatively small range, indicating the accuracy of new calculation model. It can more accurately calculate the slight changes of soil volumetric water content during the mining period of coal, and provides a better guidance to protect and restore local mining area's ecological environment. It also shows the rationality of applying GPR wave velocity calibration method to calculate volumetric water content.
The analysis of applicability of calculation models shows that new model can be applied to the calculation of volumetric water content of sand and clay in the Ningtiaota and Daliuta, Northern Shaanxi. However, due to the large differences in the physical properties of media in other regions, the model still needs further verification. However, the analysis method of GPR data and measured water content value of soil samples is not limited to soil types and physical properties of media, so this analysis method has broad application prospects.
Footnotes
Declaration of conflicting interests
The author(s) declared no potential conflicts of interest with respect to the research, authorship, and/or publication of this article.
Funding
The author(s) disclosed receipt of the following financial support for the research, authorship, and/or publication of this article: The project was financially supported by the Major Project of Shaanxi Coal and Chemical Industry Group Co. Ltd: Protection and Utilization of Water Resources & Research and Demonstration of Key Technologies for Ecological Reconstruction in Northern Shaanxi Coal Mining Area (2018SMHKJ-A-J-03) and the 2030 Pilot Project of CHN ENERGY Investment Group Co. Ltd: Research on Ecological Restoration and Protection of Coal Base in Arid Eco-fragile Region (GJNY2030XDXM-19–03.2) and Beijing Outstanding Young Scientist Program (BJJWZYJH01201911413037).