
Abstract
For the sake of explaining the organic geochemical characteristics of the hydrocarbon source rocks (SRs) around Karamay, such as thermal maturity (TM) (evidences from the temperature of maximum pyrolysis yield (Tmax), the Carbon Preference Index (CPI) and Odd to Even Preference (OEP) values, the C30 M/H versus Tm/Ts, the C29 ββ/(ββ + αα) versus C29 20 S/(20 S + 20 R)), hydrocarbon potential (HP) (evidences from total organic carbon (TOC) and rock pyrolysis (RP)), organic matter (OM) source input (evidences from n-Alkane distribution, the relative quantity of C27-C28-C29 steranes, the (C19 + C20)/C23 tricyclic terpane (TT), and the Terrigenous/aquatic ratio (TAR)) as well as paleoenvironment (evidences from the pristane/phytane (Pr/Ph) and the Gammacerane index), and in order to analyze the biodegradation degree and source of oil sand (OS) oil, 55 core samples of SRs in all were selected to measure TOC and RP. 14 core samples of SRs and 3 OS samples were selected for gas chromatography–mass spectrometry (GC-MS) analysis. 11 core samples of SRs and 3 OS samples were used for organic carbon isotope (OCI) analysis. The results indicate that except the SR from Fengcheng formation (P1f) which is in the stage of high or over evolution, the other SRs are in mature stage. OM type of Carboniferous (C) SRs are type Ⅱ kerogen, with the largest abundance. OM type of the SRs in Wuerhe formation (P2w) and Jiamuhe formation (P1j) are type Ⅲ kerogen with good and medium OM abundances. Almost all SRs were formed in the reduction environment of high salinity, and the main OM source input is the lower aquatic plants. Karamay formation (T2k) and Badaowan formation (J1b) oil sands (OSs) around Karamay have undergone serious biodegradation. It is suggested that OS oil are mainly from P1f SRs (evidences from the tricyclic terpanes (TT), triarysteranes, pregnane, homopregnane and OCI).
Keywords
Introduction
Junggar basin is the basin with the most abundant OS resources in China. OS is mainly distributed in the northwest edge of the basin from Kebai fault zone to Wuxia fault zone. The OSs, which are mainly found in Middle Triassic T2k, Upper Jurassic J1b and Cretaceous Tugulu group, have such characteristics: there are many oil-bearing sand layers (3–14 layers); the thicknesses are large (1.5–26.15 m), and the oil contents are high (3%–18%). Among them, the geological resources of OS with burial depth of 0–100 m are 5.1 × 10⁸ t, and the recoverable resources are 3.43 × 10⁸ t; the geological resources of OS with burial depth of 100–500 m are 9.2 × 10⁸ t, and the recoverable resources are 5.52 × 10⁸ t. However, exploring and developing OS resources in this area has not been paid enough attention to. It was not until 2012 that China's first barrel of OS oil was processed and produced from the OS in Wuerhe area in the north of Karamay. In 2013, PetroChina and the local government jointly established Xinjiang Jingobi OS Mine Development Company and built development project of OS mine in Wuerhe area.
Analyzing the geochemical characteristics of OS oil can solve the source problem of OS oil and provide help for exploring and developing OS resources efficiently. However, the distribution of OSs in the surface and near surface environment is inevitably affected by biodegradation, and then some commonly used oil source contrast biomarkers are consumed, which makes it difficult to study the source of OS oil. Firstly, the degree of biodegradation of OS oil should be judged according to the geochemical characteristics. Volkman et al. (1983), Connan (1984), Williams et al. (1986), Wenger et al. (2002), Bao et al. (2007), Larter et al. (2012) sequenced the biomarkers of anti-biodegradation ability from weak to strong based on the experiment and crude oil sample analysis: n-Alkane, i-Alkane, isoprenoid alkane, bicyclic sesquiterpene alkane, hopane (25 - norhopanes formed after degradation), sterane, hopane (25 - norhopanes not formed after degradation), rearranged sterane, aromatic sterane and porphyrin. Peters and Moldowan (1993) classified the degree of biodegradation into 10 levels. Secondly, different oil source comparison methods are selected according to the degree of biodegradation. For crude oil subject to slight biodegradation, the method of comparison of chromatographic characteristics of saturated hydrocarbon in crude oil and SR extract can be applied, which includes the distribution features of n-Alkane and i-Alkane, the main peak carbon number of n-Alkane, odd and even dominant values, pristane/phytane (Pr/Ph), etc. For crude oil with medium biodegradation degree, such as n-Alkane, i-Alkane and isoprene alkanes, which have been modified by microorganisms, the geochemical characteristics of steranes and hopanes can be used for comparison (Peters and Moldowan, 1993). The commonly used parameters include: the Gammacerane index (Ga/C30H = Gammacerane/17αβ C30hopane) reflecting the sedimentary environment of the SRs, the relative contents of C27-C28-C29 steranes reflecting the type of the SRs, the C29 20 S/(20 S + 20 R) (C29(ααα20 S + αββ20 S)/(ααα20 S + αββ20 S + ααα20 R + αββ20 R) steranes), the C29 ββ/(αα + ββ) (C29(αββ20 R + αββ20 S)/(ααα20 S + αββ20 S + ααα20 R + αββ20 R) steranes), the C29M/C29H (C29 moretane/norhopane) and the C31 22 S/(22 S + 22 R) representing the maturity, etc. For crude oil which have suffered from serious biodegradation and whose steroids and hopane have been damaged to different degrees, aromatic steroids (such as triarysteranes) with stronger biodegradation ability can be used for oil source comparison (Seifert et al., 1984). TT and pregnane + homopregnane have strong anti-biodegradation ability, which is also a good method for oil source comparison of severely biodegradable crude oil (Anders and Robinson, 1971; Li et al., 2012; Peters et al., 2007; Reed, 1977; Wang et al., 2008). In addition, OCI is often used for oil source comparison. For light biodegradation crude oil, the carbon isotopes of n-Alkane can be used for oil source comparison. For medium biodegradation crude oil, the carbon isotopes of terpenes can be used for oil source comparison. For serious biodegradation crude oil, the carbon isotopes of the whole oil are generally used for oil source comparison (Atlas, 1981; Kennicutt, 1988; Stahl, 1980).
Geological setting
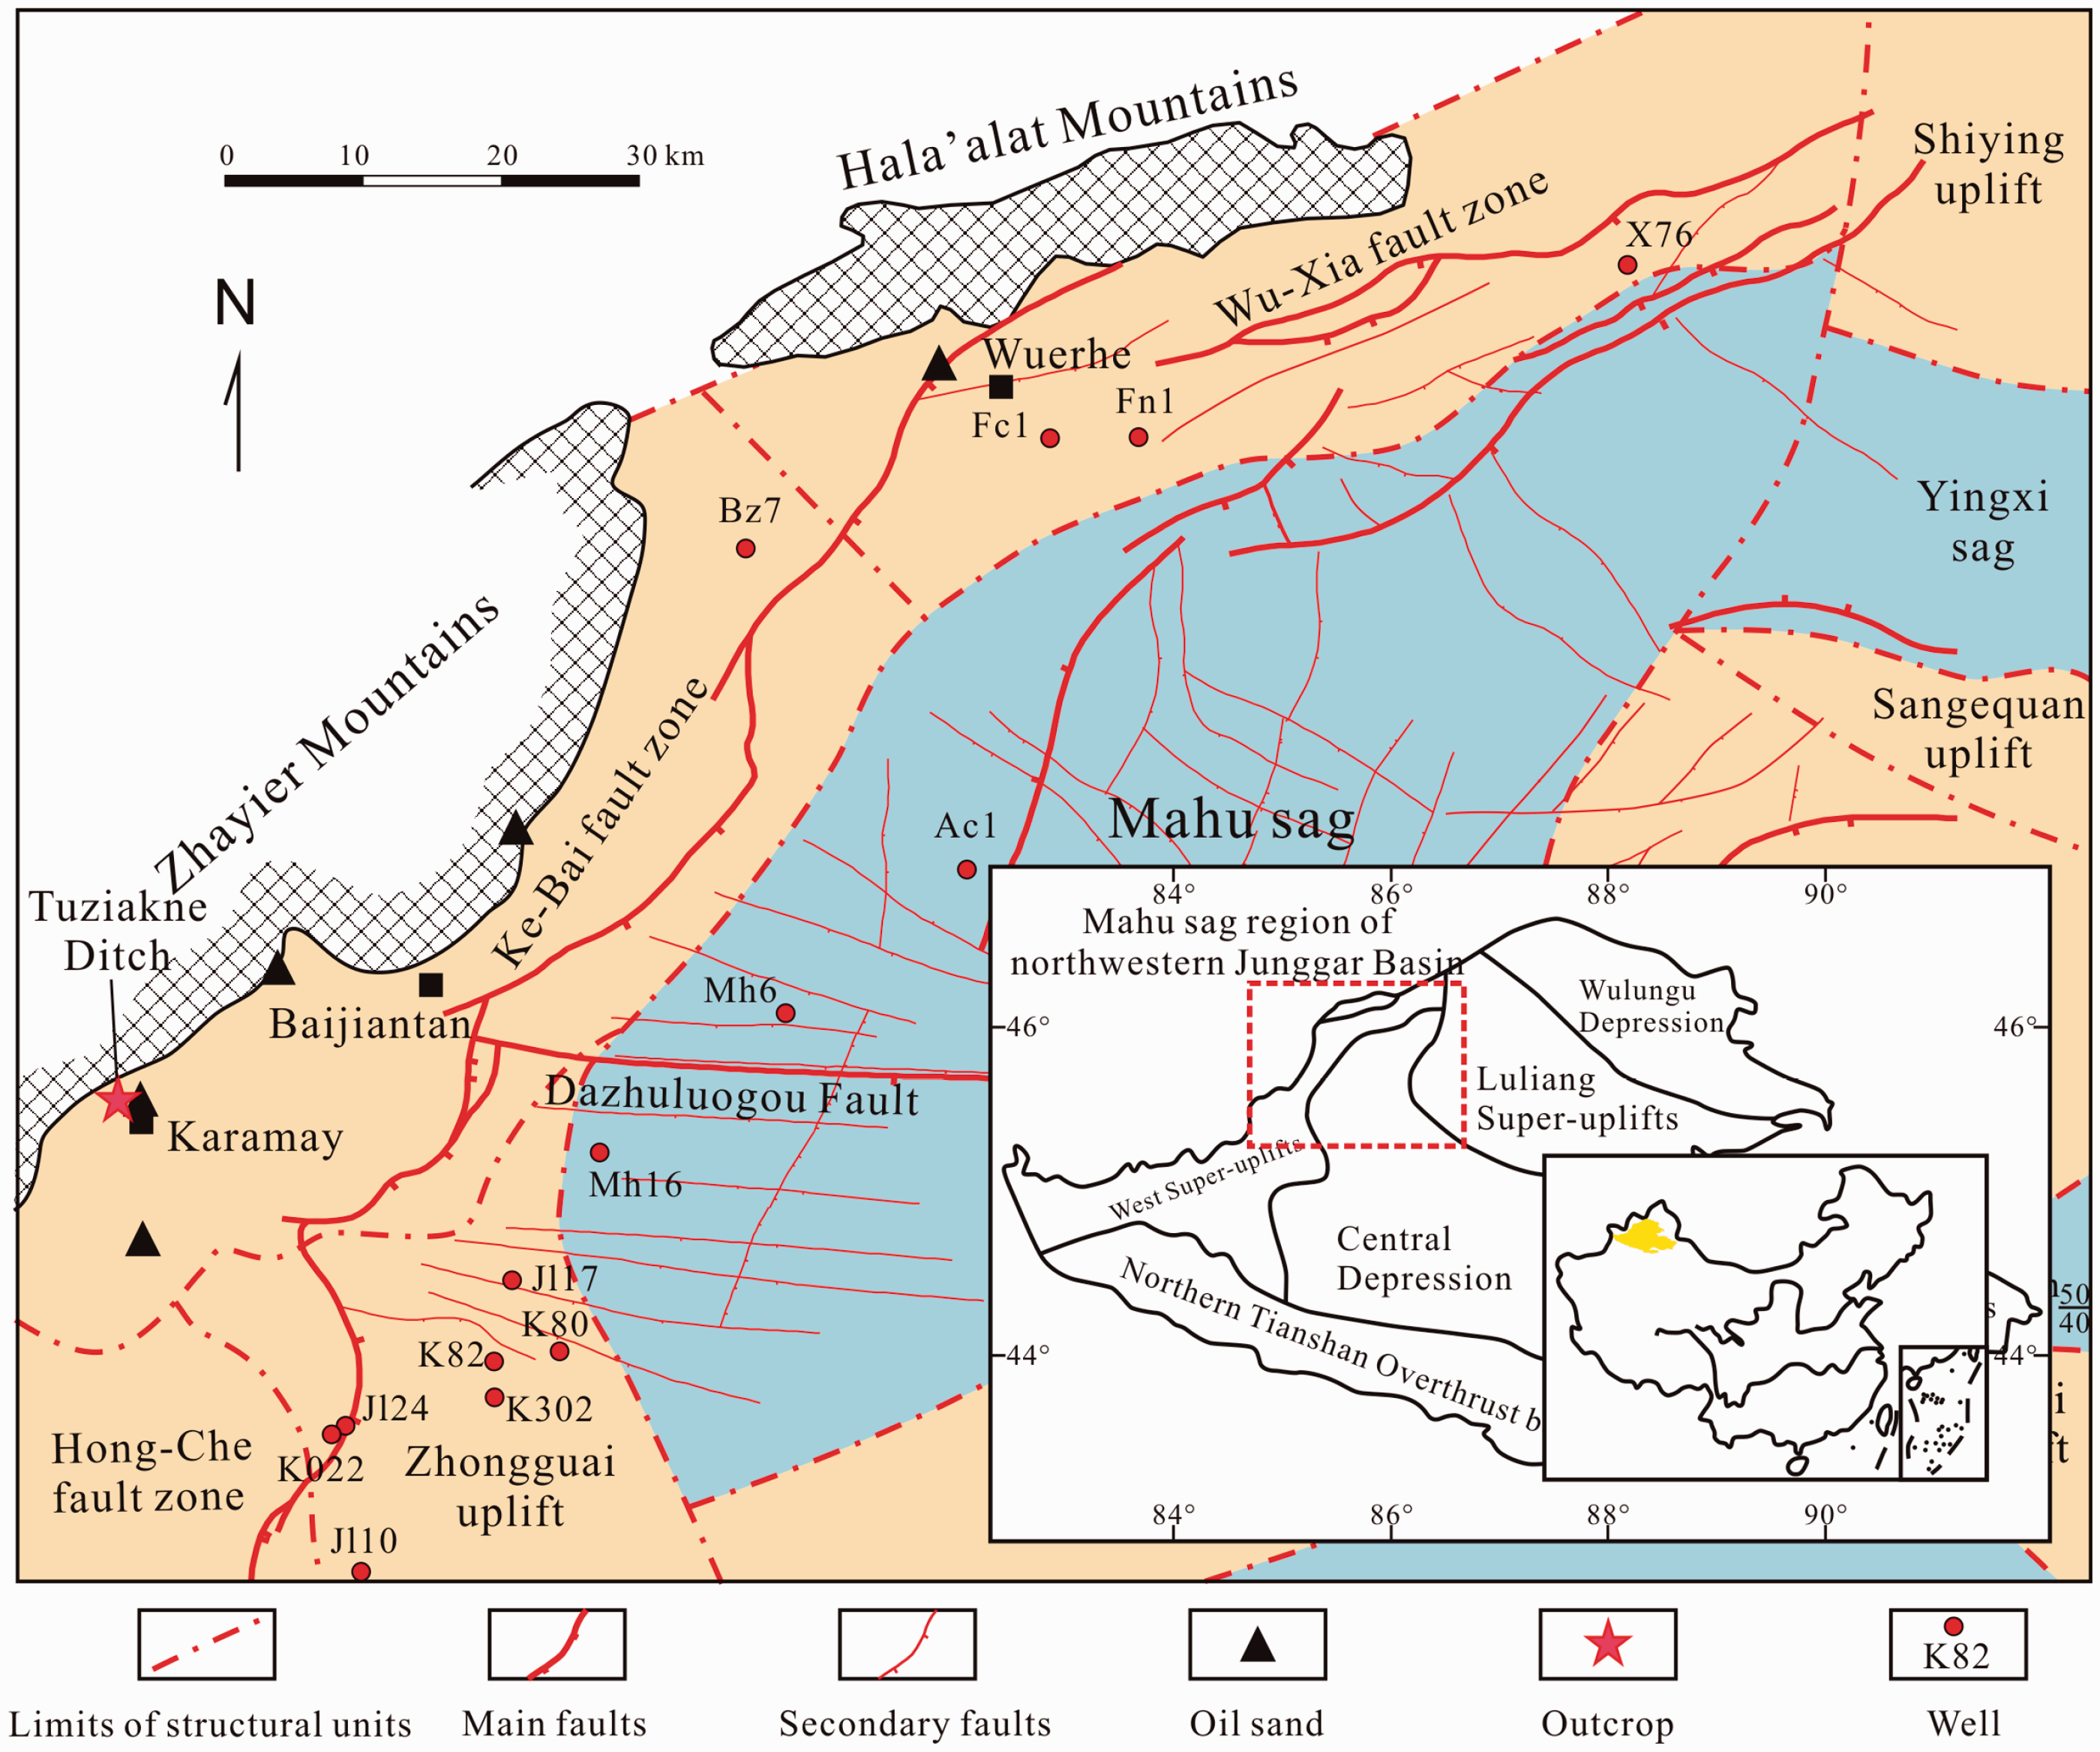
Karamay is located near the Kebai fault zone and the southwest edge of Mahu Sag. The faults and stratigraphic unconformities have been developed a lot (Figure 1
There are four sets of strata that can be used as SRs in Mahu Sag (Figure 2
Stratigraphic columns (a and b), sections and OS samples, by referring Tao et al. (2016), Liu et al. (2016), Mao et al. (2020), Wang et al. (2020) and Feng et al. (2019, 2020a).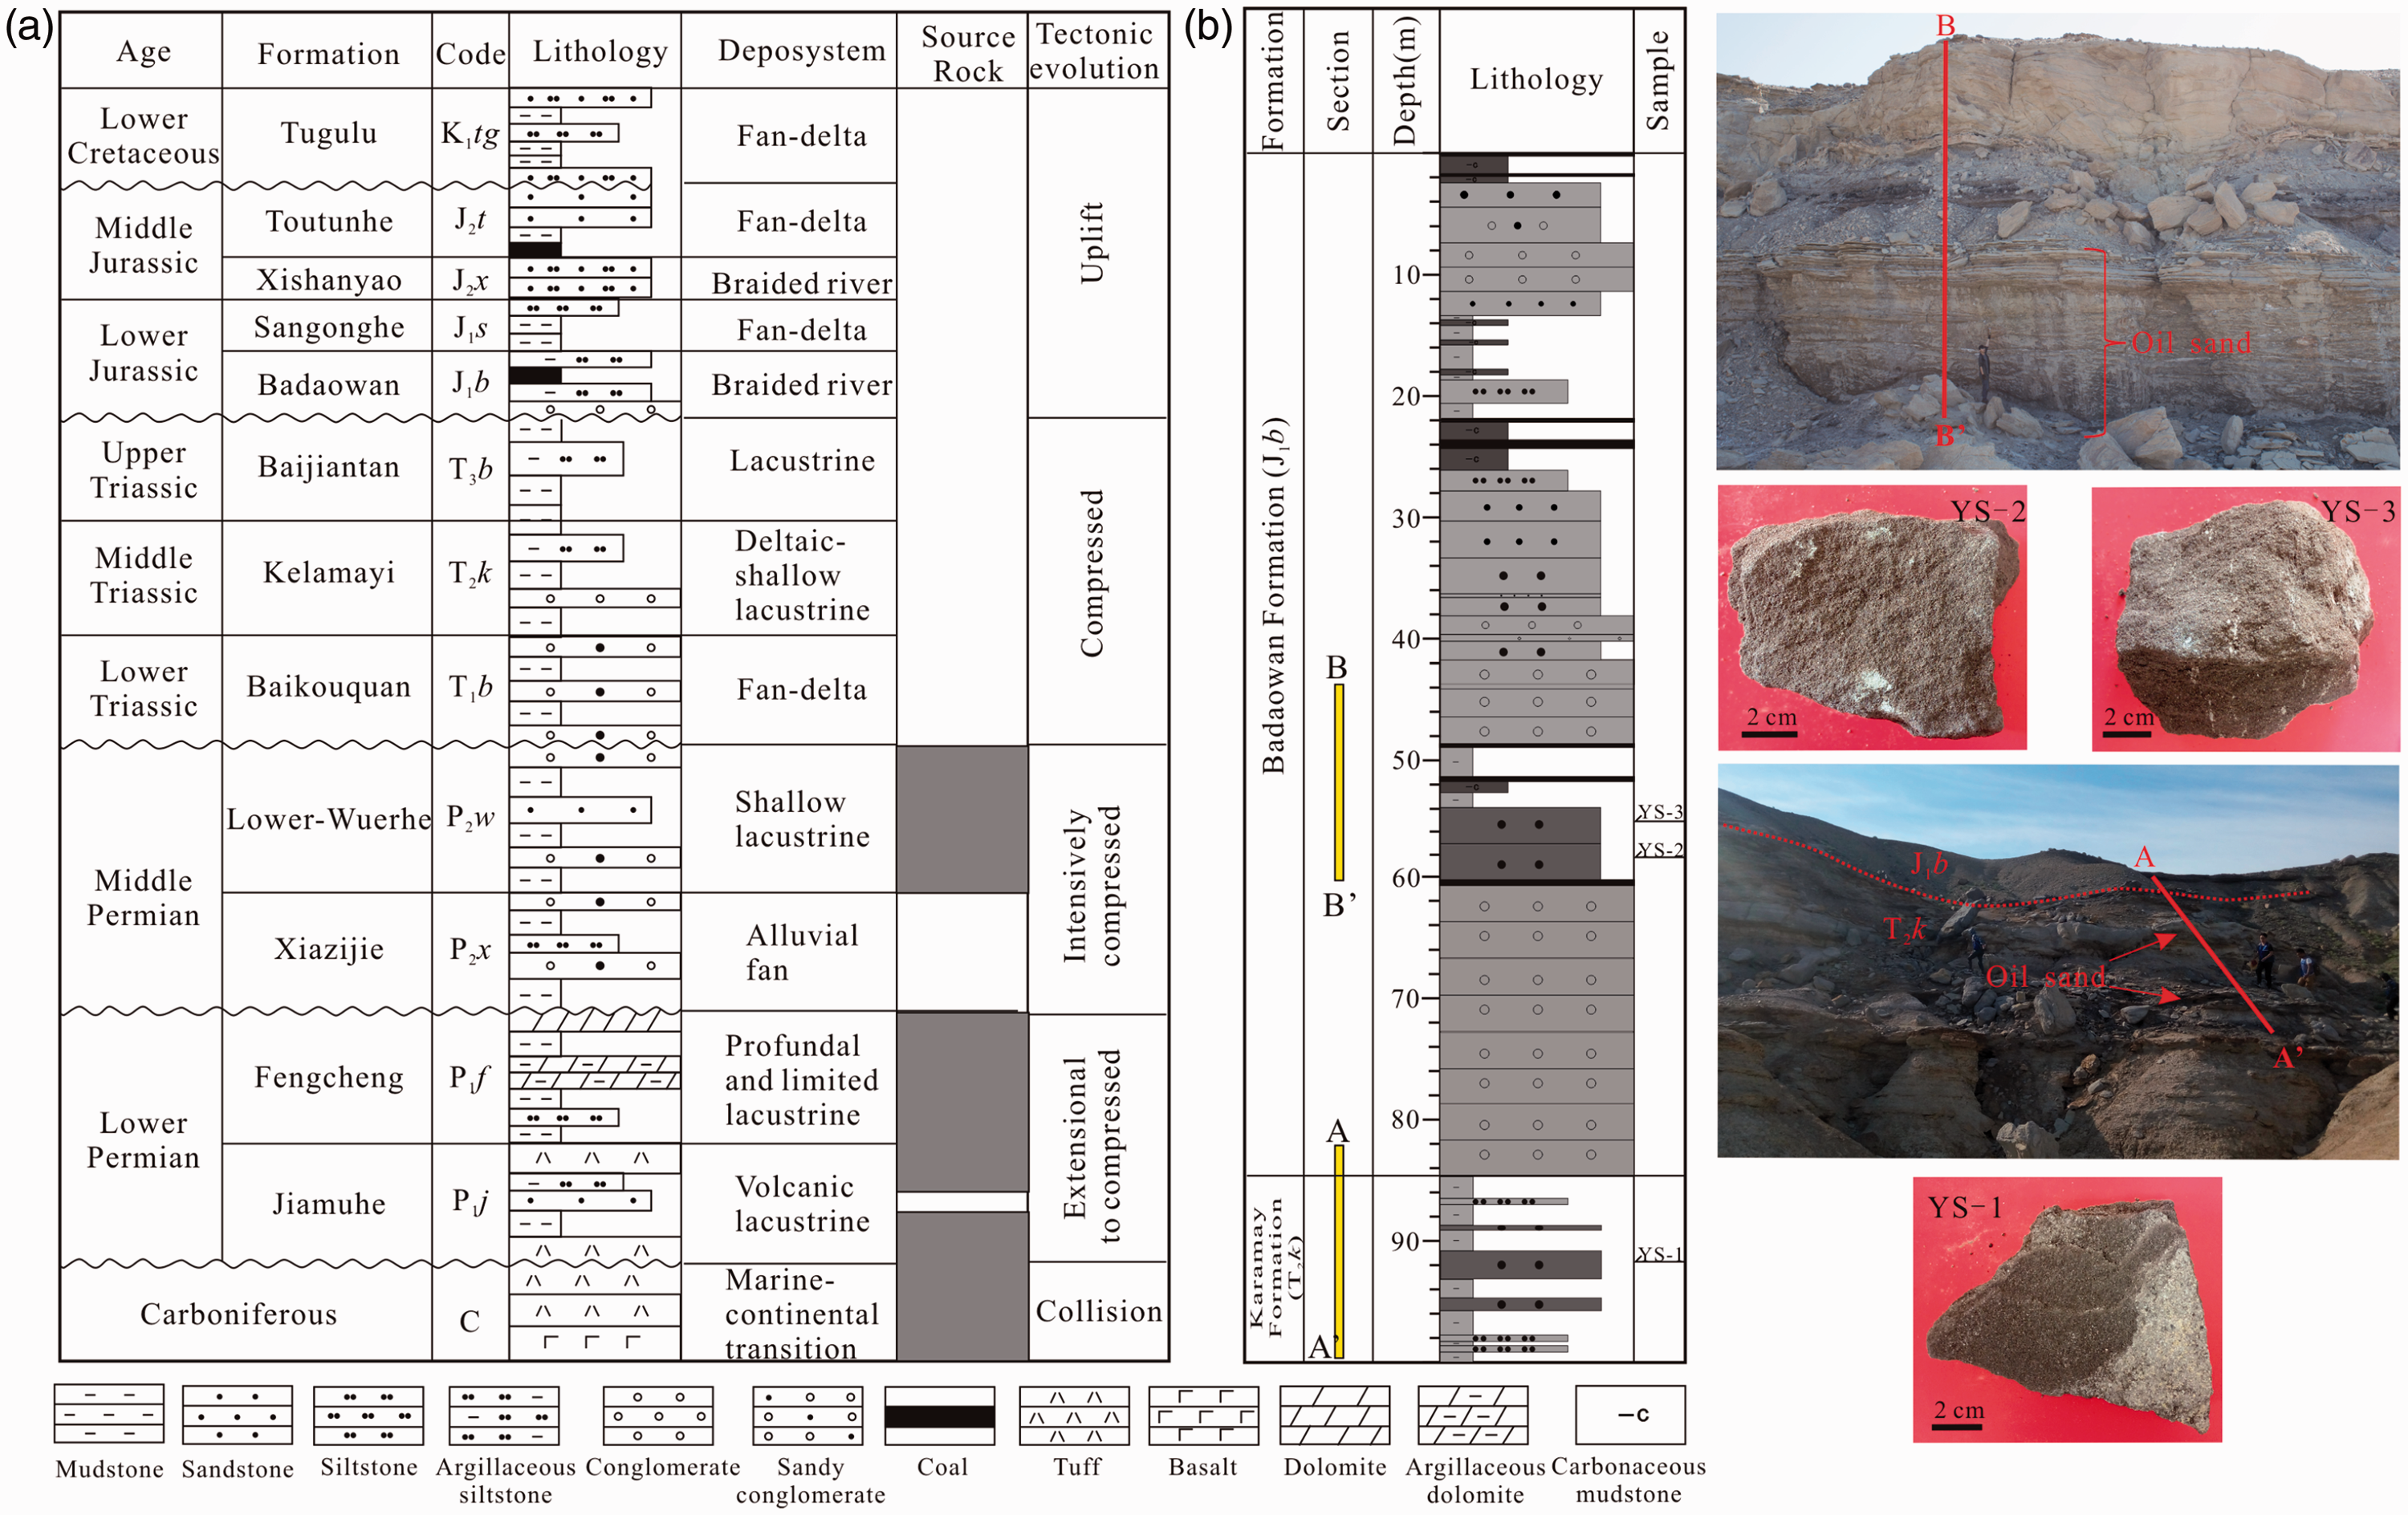
In order to analyze the source of OS oil around Karamay, it is necessary to analyze the geochemical characteristics of OS oil. OS samples come from the top of T2k and the bottom of J1b in Tuziakne Ditch, northwest Karamay (Figures 1 and 2(b)). The T2k and J1b in this area are in unconformity contact. Their sedimentary environments are all braided river delta, and the OSs are mainly coarse sandstones (Figure 2(b)). Due to long-term exposure to the surface, the sandstones have been subject to weathering and the densities are reduced (Figure 2). Among them, the OS oil must have undergone a strong biodegradation, which brings difficulties to the study of the source of OS oil. It is necessary to comprehensively analyze the geochemical characteristics of OS oil and make a comparative study of oil sources on the basis of evaluating the degree of biodegradation.
Sampling and methodology
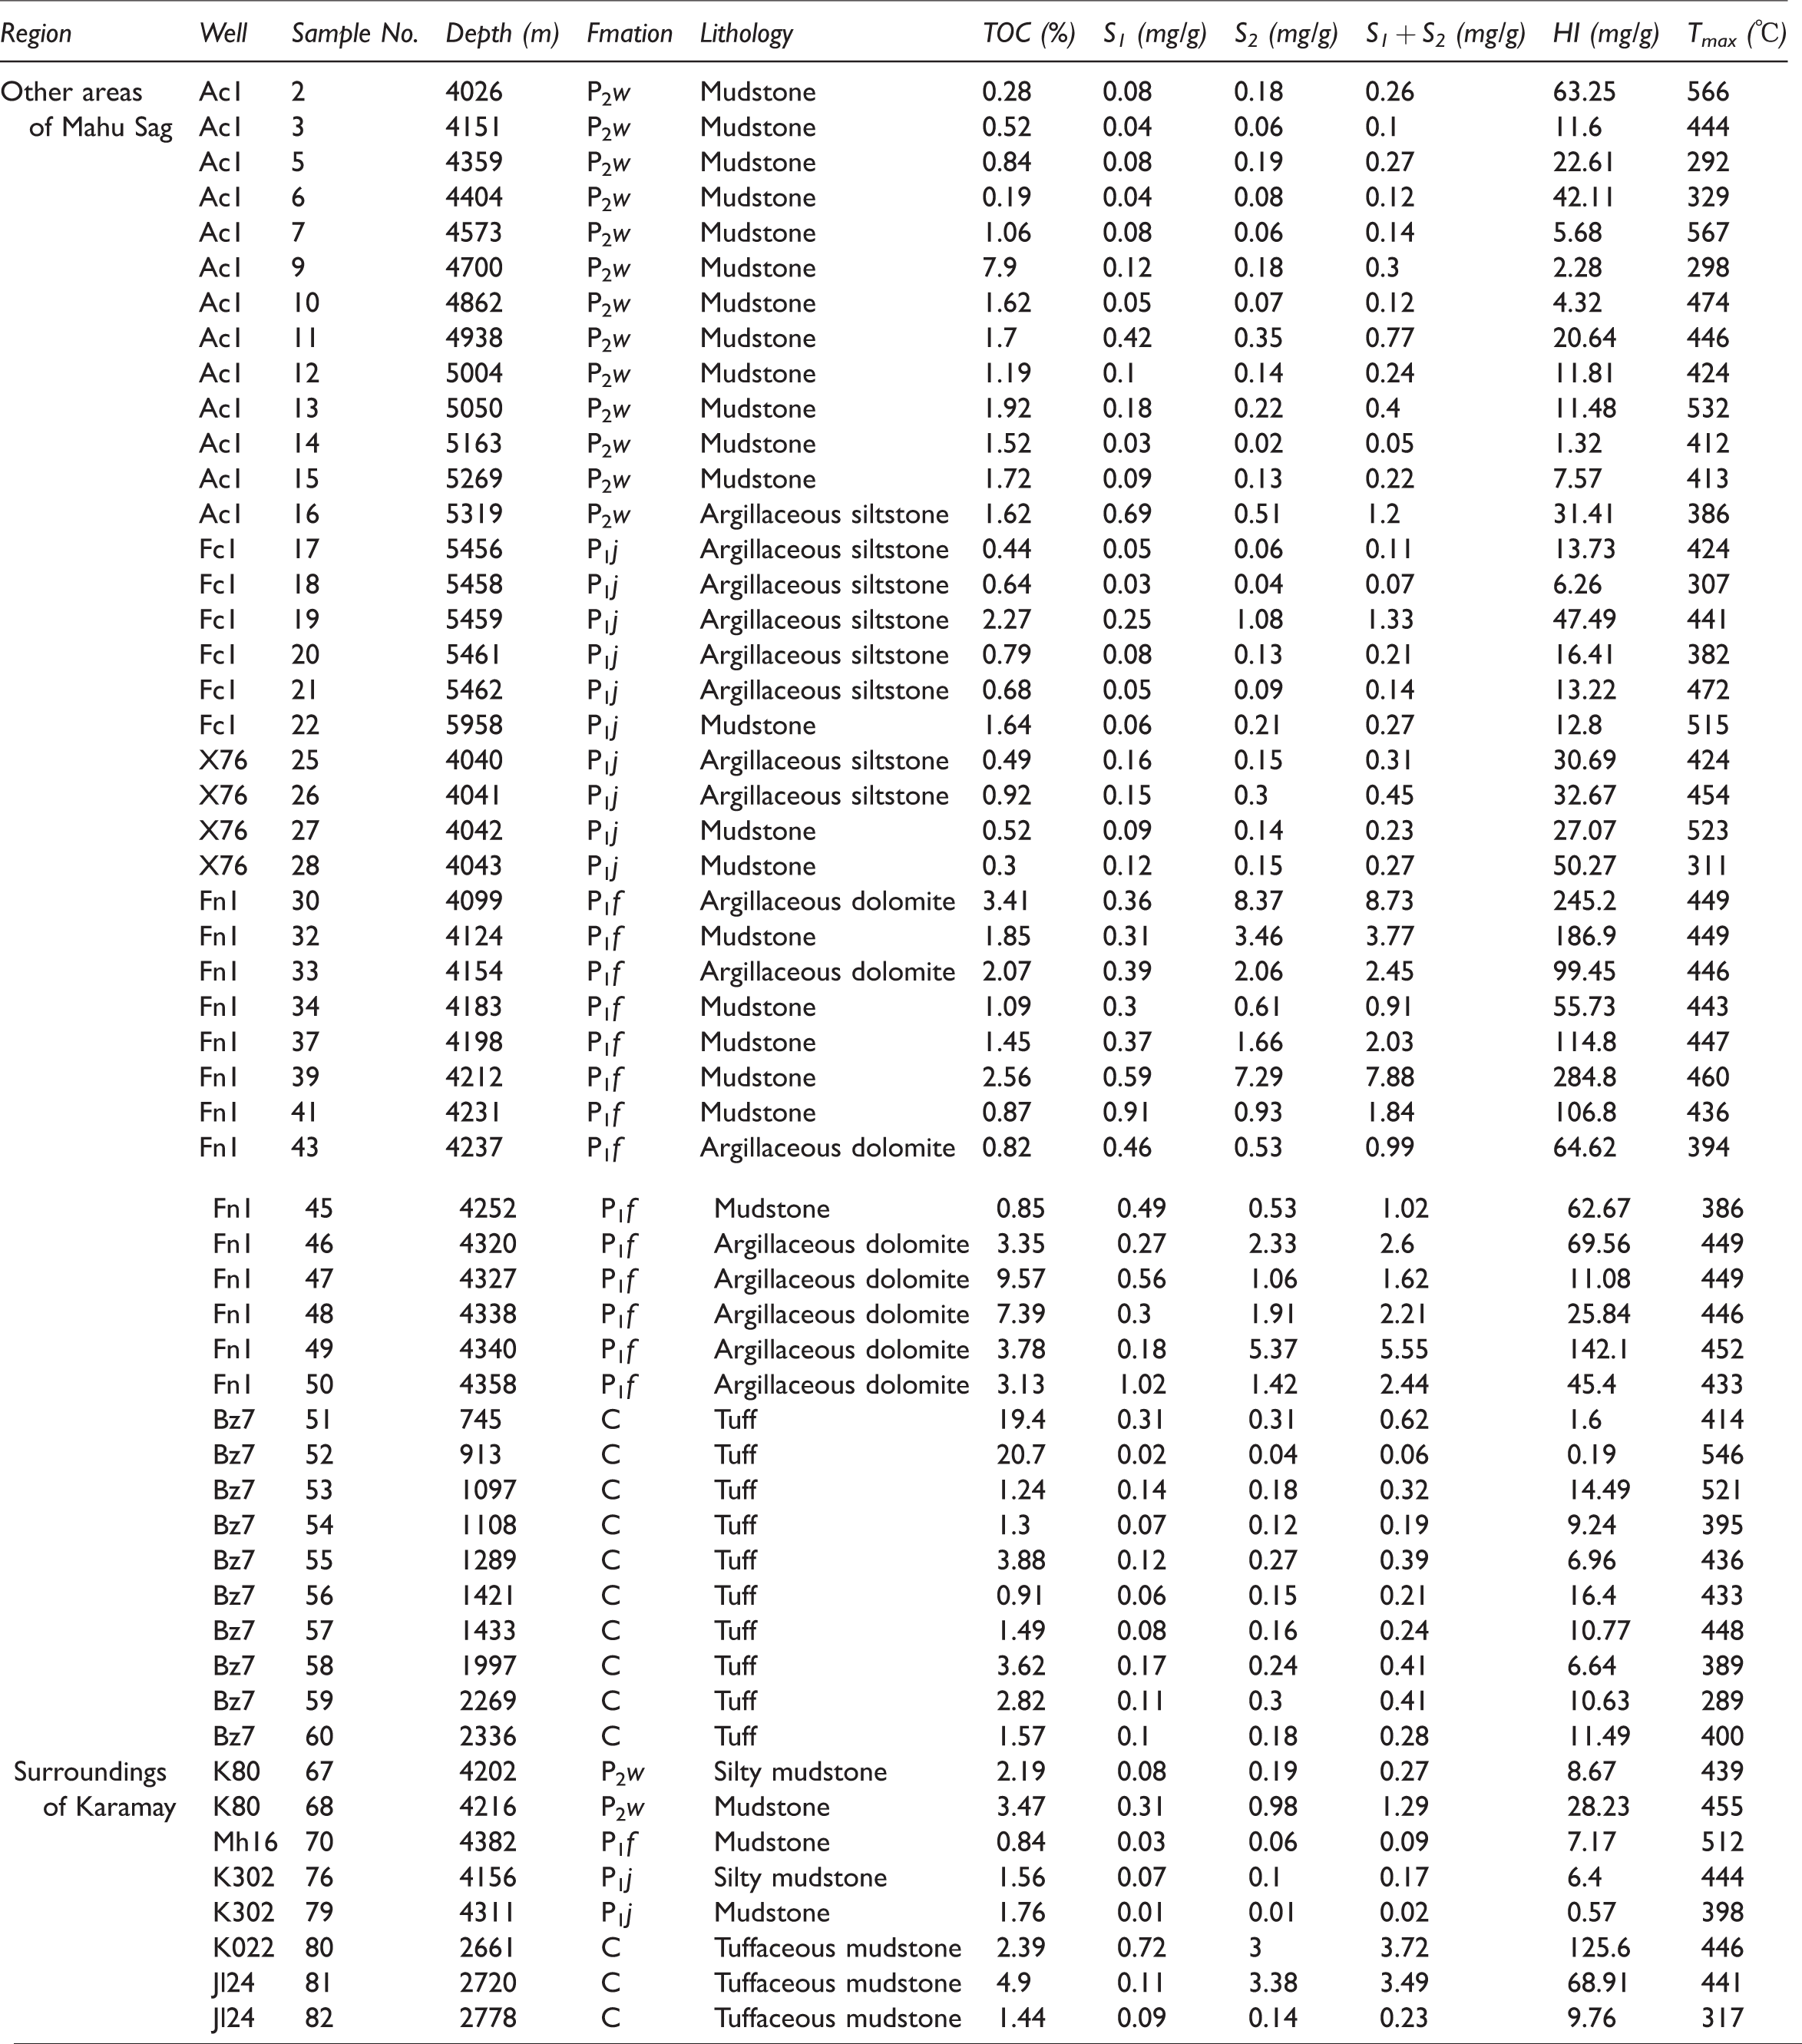
TOC and RP results of the SRs in the study area and the northern part of the study area.
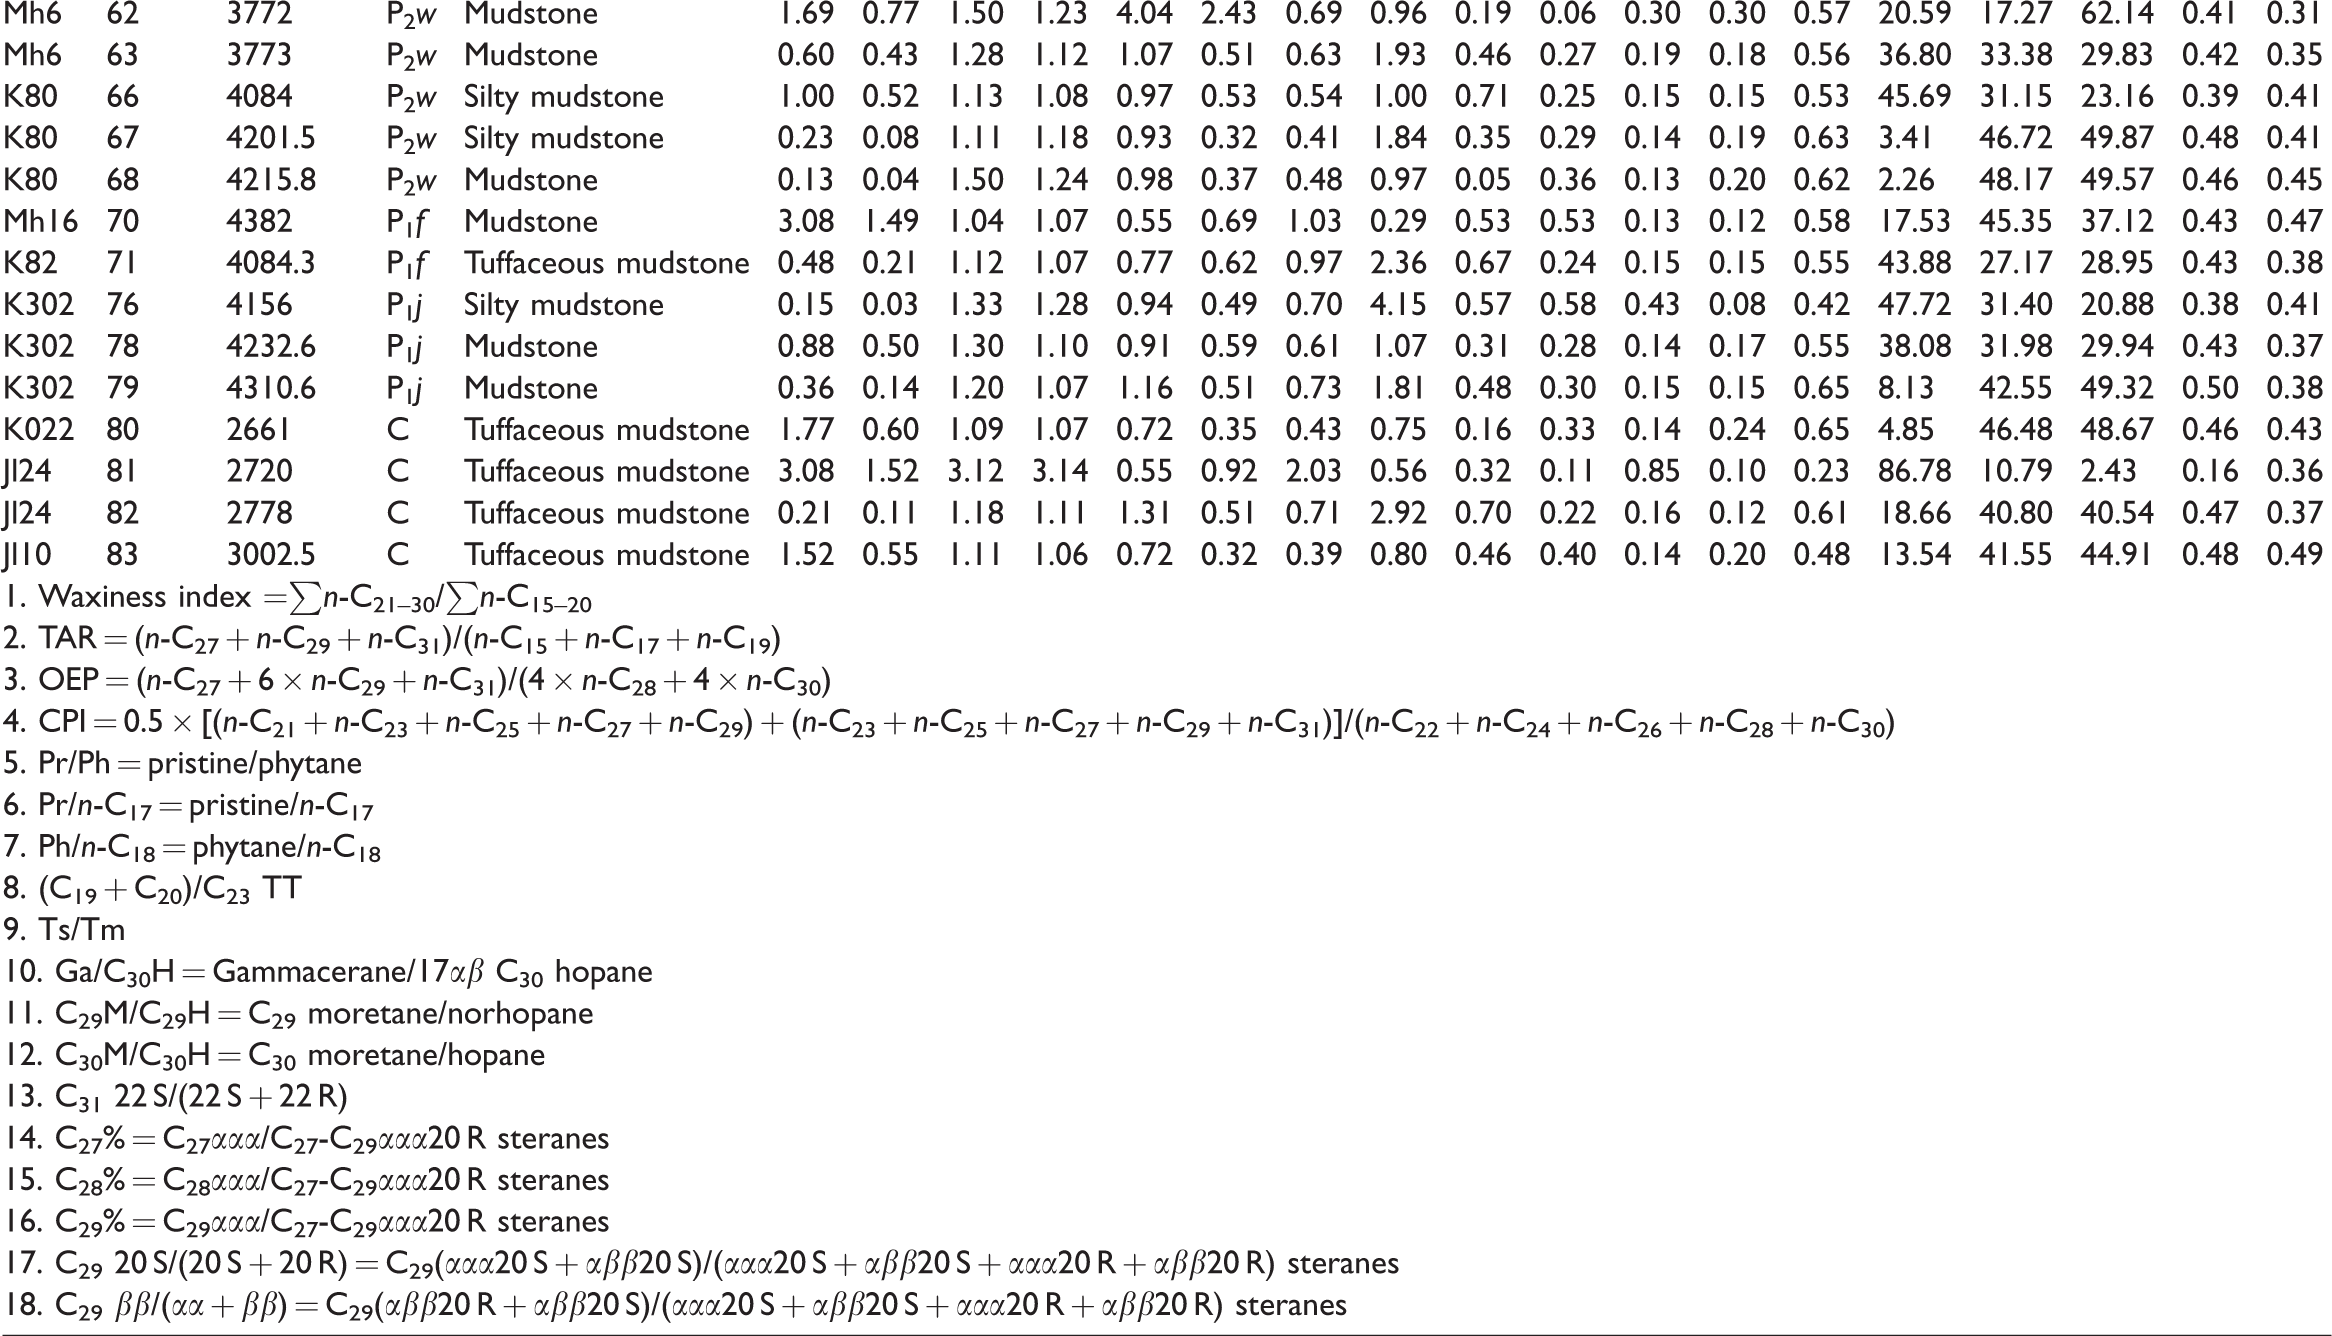
The SR samples’ aliphatic ratios in the study area.
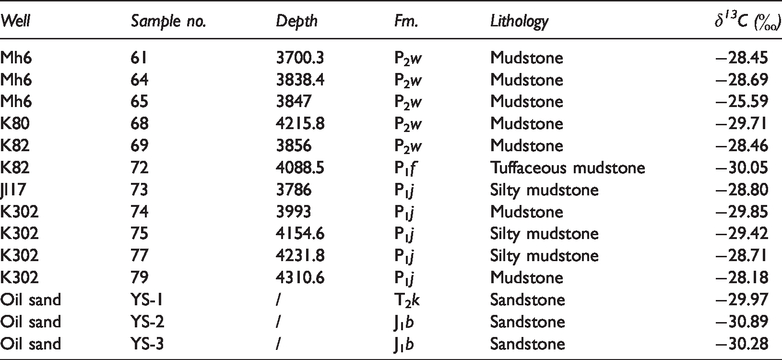
The δ13C values of the representative SR and OS samples.
TOC was tested by the LECO cs-230 analyzer. The OGE–II oil evaluation station was used for RP experiment. Soxhlet apparatus was used to separate aliphatic hydrocarbons and aromatic hydrocarbons, and then GC-MS analysis was carried out. See Feng et al. (2020a) for the process of these experiments.
The carbon isotopic compositions of SR extracts and OS oil were measured by the Finngen-MAT252 Mass Spectrometer. The process was as follows: firstly, CCl4 was used to dissolve the sample; then the sample was burned at 800°C; then it was reduced at 250°C; and finally, it was measured after being cooled by liquid nitrogen. The error range of stable carbon isotope composition is ±0.1 ‰, and the output standard of δ13C value is V-PDB.
Results
Characteristics of SRs
TOC and RP results of SRs can reflect the abundance, type and maturity of organic matter. Of the SR samples for TOC and RP experiments, 8 samples from the study area and 47 samples from the north of the study area are selected for supplement and comparison. Among these SR samples, the TOC from C is the highest (average TOC = 2.91%, standard deviation (SD) = 1.46%), followed by the TOC of P2w (average TOC = 2.83%, SD = 0.46%) and P1j (average TOC = 1.66%, SD = 0.1%), and the TOC of P1f is the lowest, with the TOC value being 0.84% (Table 1 and Figure 3
TOC and S1 + S2 values of the SRs in the study area and the north of the study area.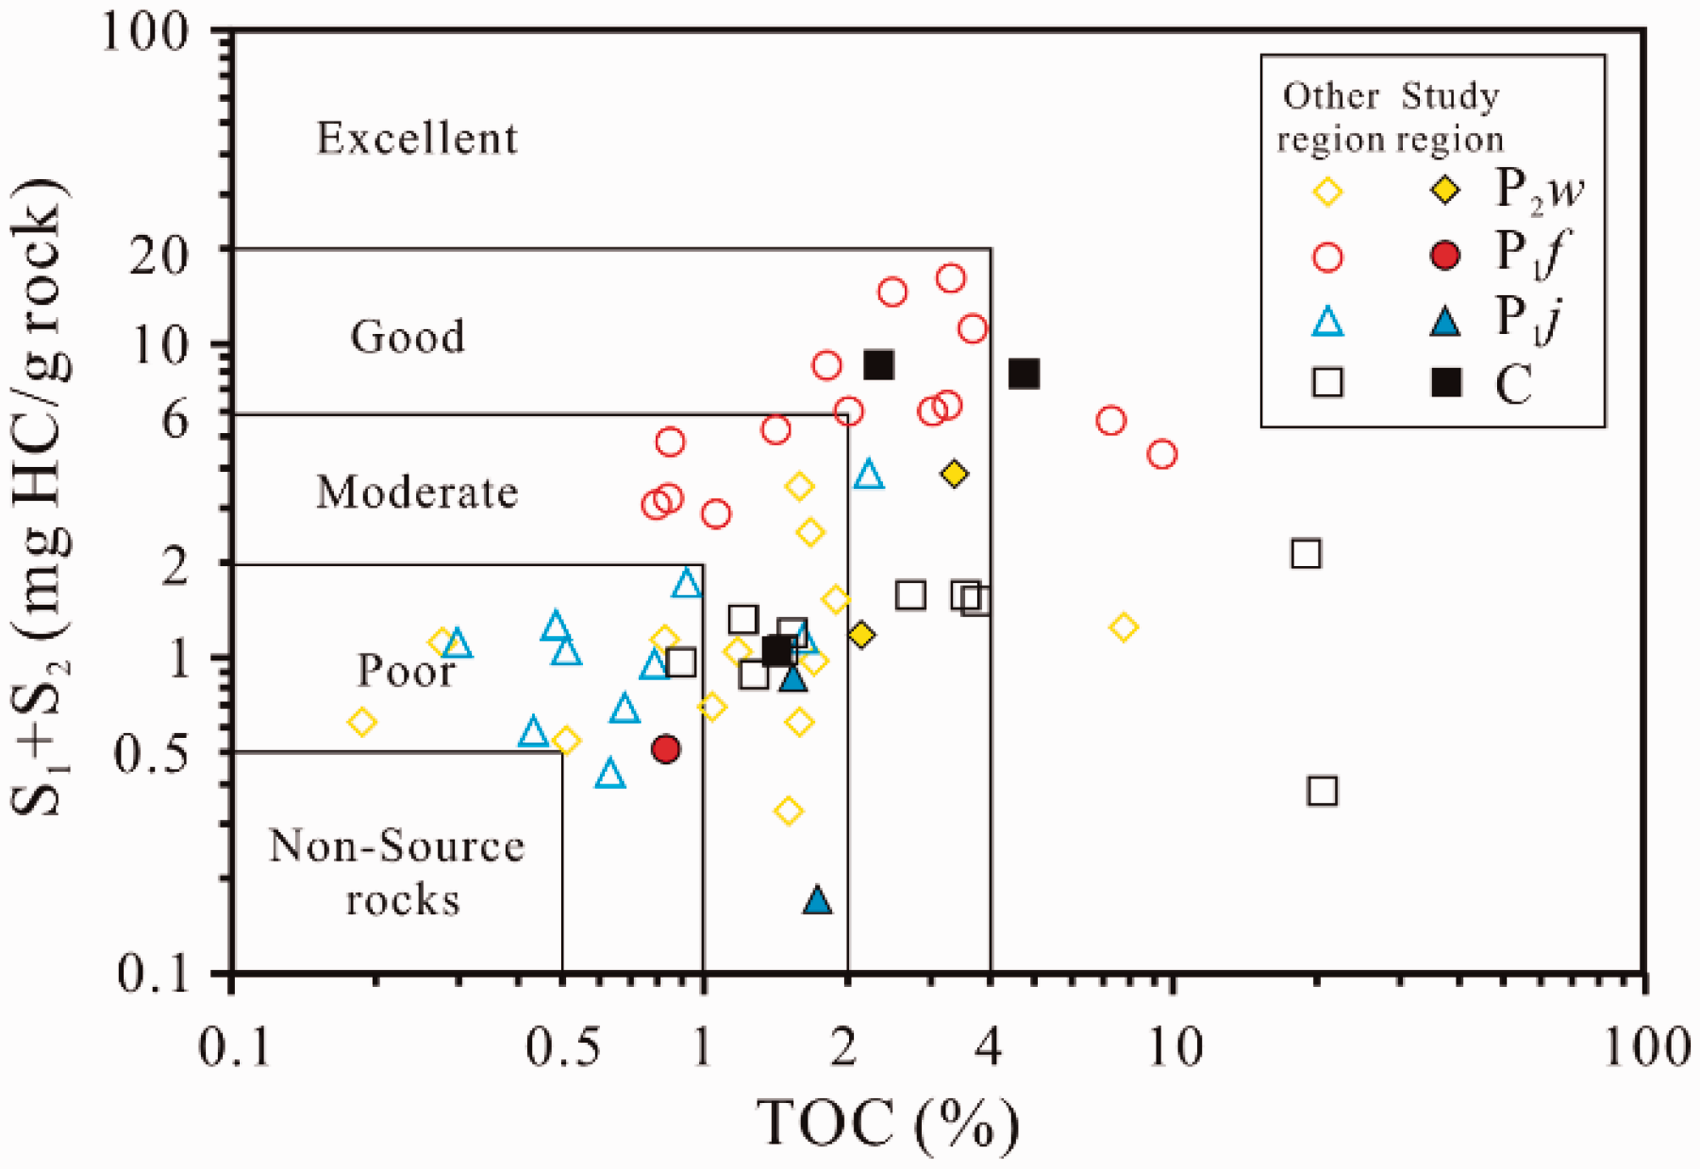
Hydrogen index (HI) and temperature of maximum pyrolysis yield (Tmax) are of great significance to determine the type and maturity of organic matter in SRs. Among the SR samples in the study area, the average value of HI of samples from C is the largest, which is 68.10 mg HC/g TOC, and its range is also large, being between 9.76 and 125.64 mg HC/g TOC; the average value of HI of the samples from P2w is the second largest, being 18.45 mg HC/g TOC; the average HI value from P1f is 7.17 mg HC/g TOC; the lowest average value of HI is 3.49 mg HC/g TOC, which is from P1j (Table 1). The highest Tmax is 512°C from P1f; the second highest is 447°C from P2w (ranging from 439°C to 455°C); the Tmax from P1j is ranging from 398°C to 444°C (average = 421°C); the Tmax from C is ranging from 317°C to 446°C (average = 401°C) (Table 1).
Aliphatic hydrocarbons characteristics
The m/z 85 mass chromatograms (MCs) can reflect the n-Alkane distributions. The n-Alkane distribution of C SRs includes two types (Table 2 and Figure 4
The m/z 85 MCs of the representative SR and OS samples.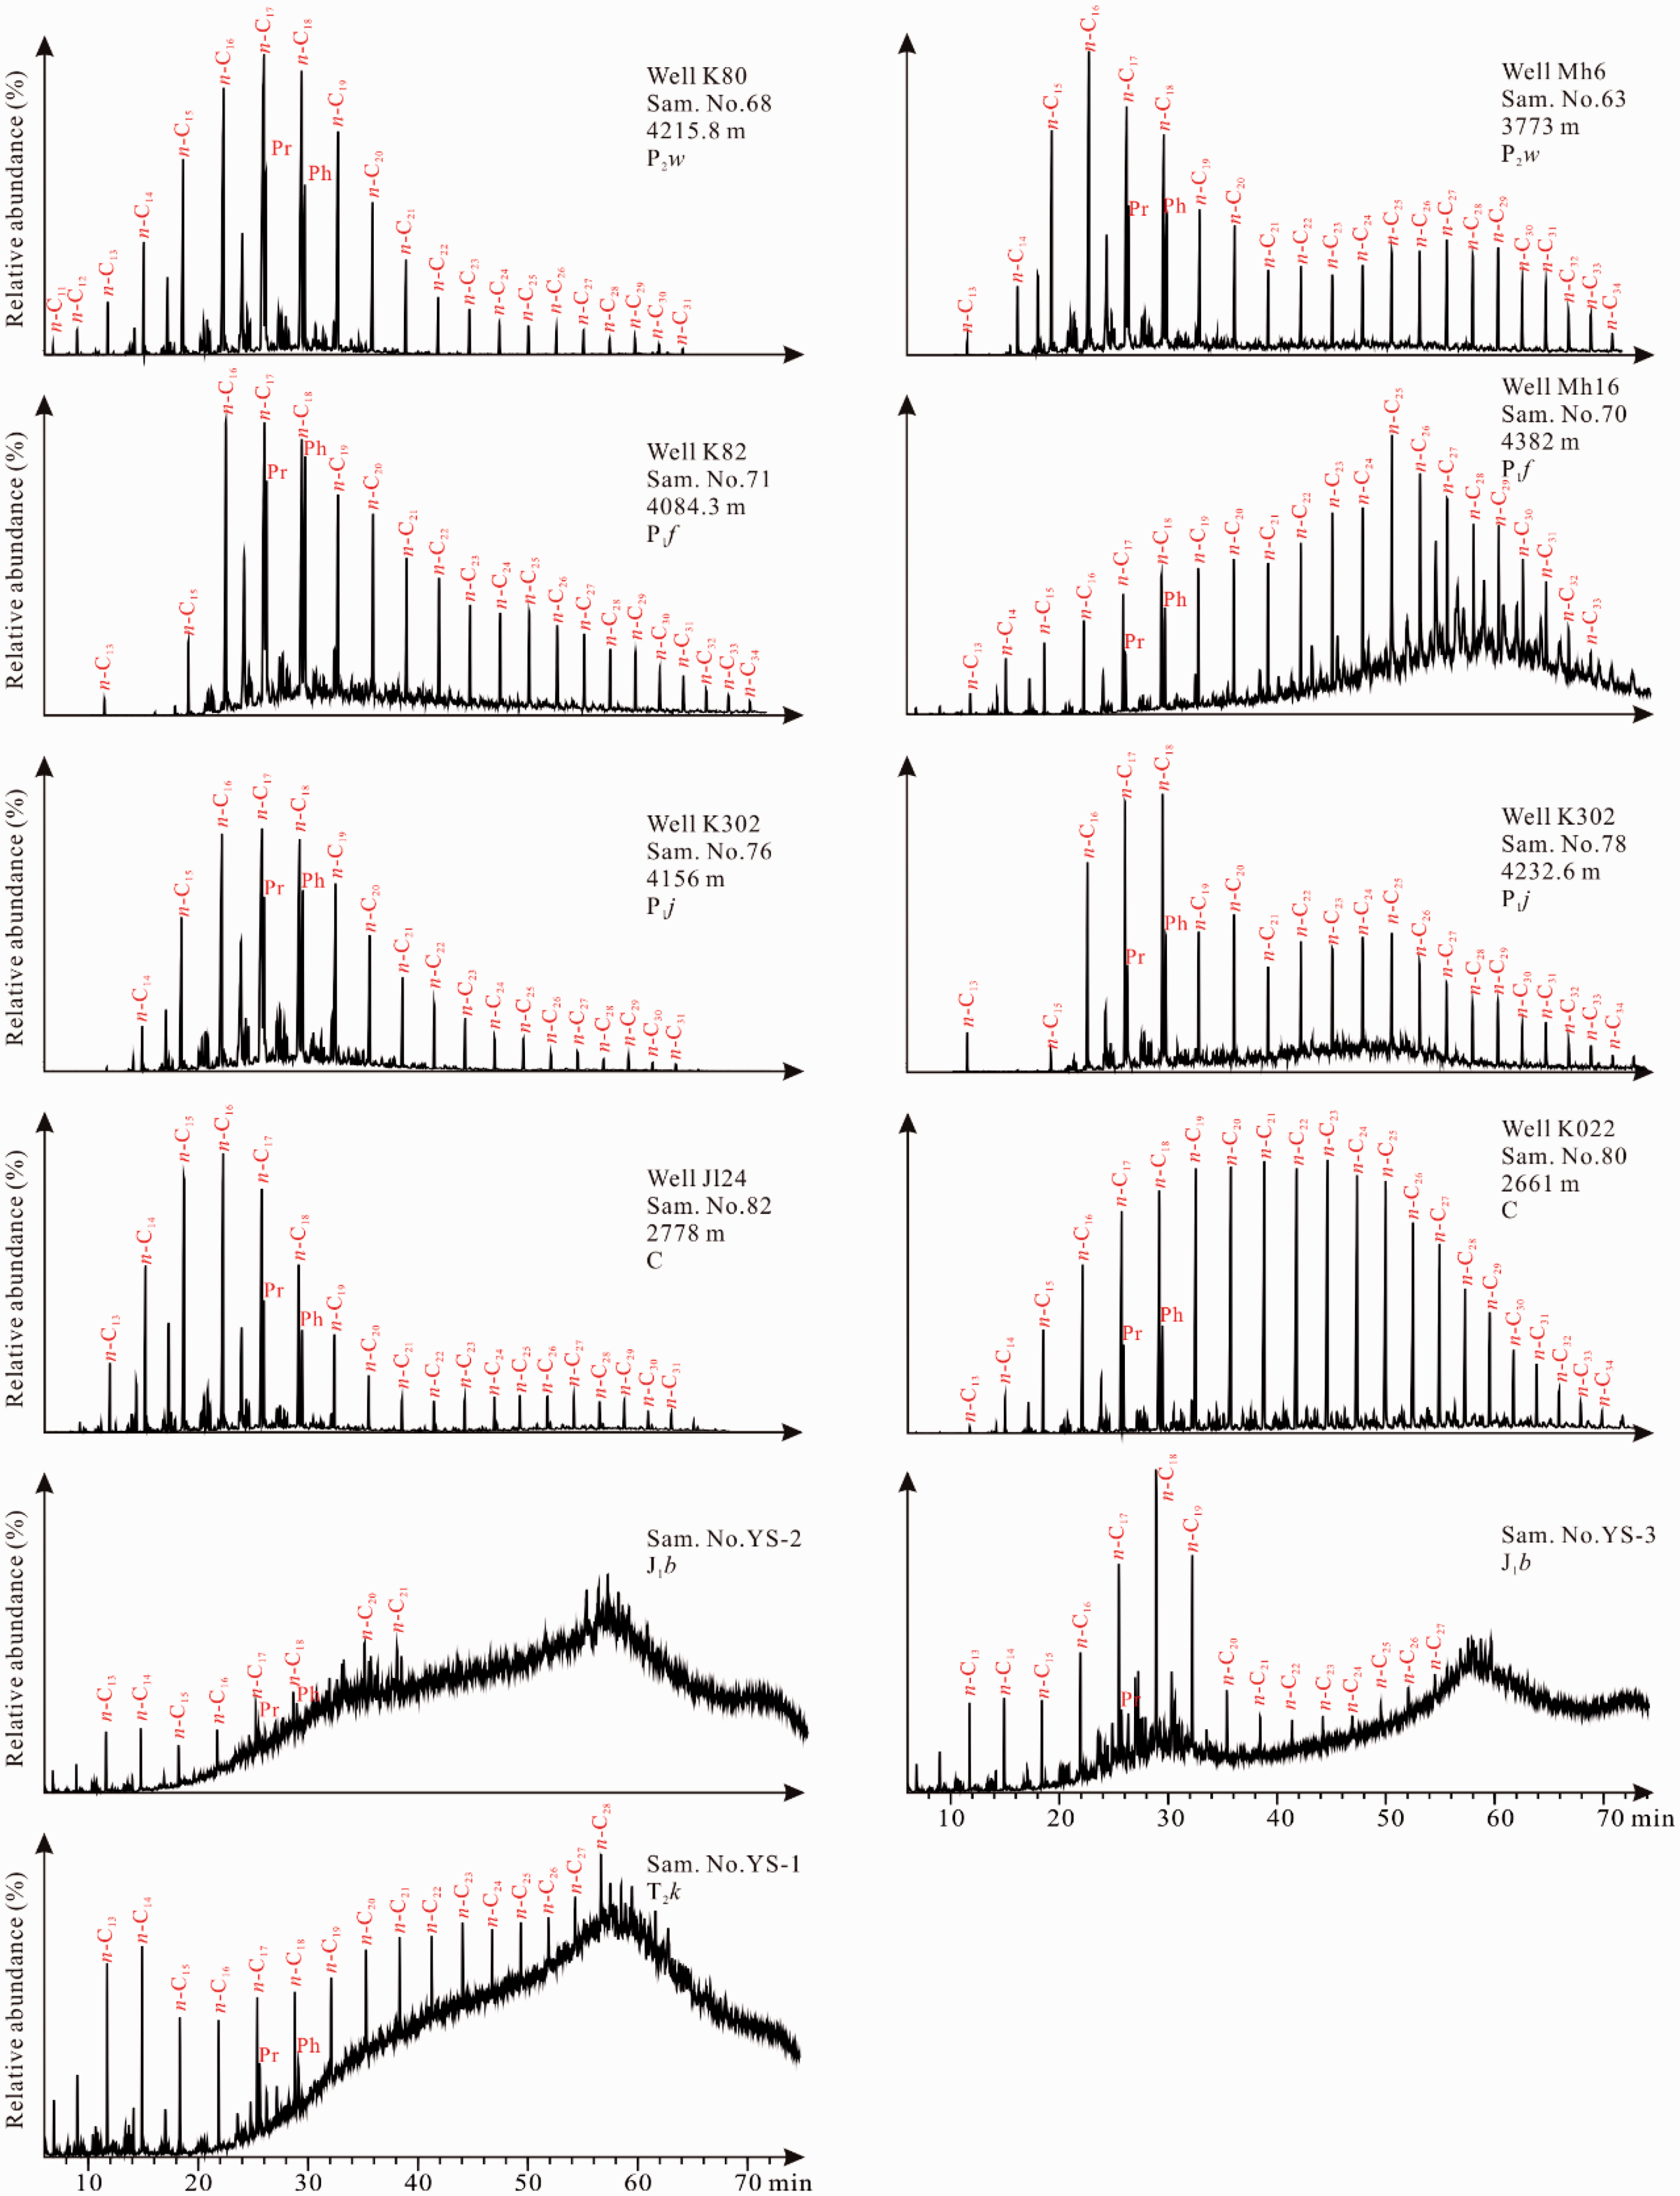
The n-Alkane distribution of P1j SRs includes two types (Table 2 and Figure 4): the first type is pre unimodal, and the main peak carbon is n-C16 or n-C17, for example, Samples 76 and 79. Low WI (0.15 and 0.36) and TAR (0.03 and 0.14) indicate that the low MW n-Alkane is dominant, and low OEP (1.33 and 1.20) and CPI (1.28 and 1.07) values indicate that there is no obvious OCNP. The second type is bimodal, and the main peak carbons are n-C18 and n-C25. For example, Sample 78. Low WI (0.88) and TAR (0.50) indicate that the low MW n-Alkane is dominant, and low OEP (1.30) and CPI (1.10) value indicates that there is no obvious OCNP.
The n-Alkane distribution of P1f SRs also includes two types (Table 2 and Figure 4): the first type is pre unimodal, and the main peak carbon is n-C17, for example, Sample 71. Low WI (0.48) and TAR (0.21) indicate that the low MW n-Alkane is dominant; low OEP (1.12) and CPI (1.07) values indicate that there is no obvious OCNP. The second type is post unimodal, and the main peak carbon is n-C25, for example, Sample 70. High WI (3.08) and TAR (1.49) indicate that the high MW n-Alkane is dominant; low OEP (1.04) and CPI (1.07) values indicate that there is no obvious OCNP. Different from other SR samples, the m/z 85 MCs baseline of Sample 70 slightly uplifted, indicating that it suffered slight microbial degradation and some unresolved complex mixture (UCM) were formed.
The n-Alkane distribution of P2w SRs also includes two types (Table 2 and Figure 4): the first type is pre unimodal, and the main peak carbon is n-C17, for example, Samples 67 and 68. Low WI (0.23 and 0.13) and TAR (0.08 and 0.04) indicate that the low MW n-Alkane is dominant; low OEP (1.11 and 1.50) and CPI (1.18 and 1.24) values indicate that there is no obvious OCNP. The second type is bimodal, and the main peak carbon is n-C16 or n-C17 and n-C25 or n-C27, for example, Samples 62, 63 and 66, in which the low WI (0.60 and 1.00) and TAR (0.43 and 0.52) of Samples 63 and 66 show that the low MW n-Alkane is dominant; the high WI (1.69) and TAR (0.77) of Sample 62 show that the high MW n-Alkane is dominant. These samples all have low OEP (1.13–1.50) and CPI (1.08–1.23) values, indicating that there is no obvious OCNP.
The m/z 85 MCs of the three OS samples all showed obvious baseline uplift, indicating that they all suffered from strong biodegradation (Figure 4).
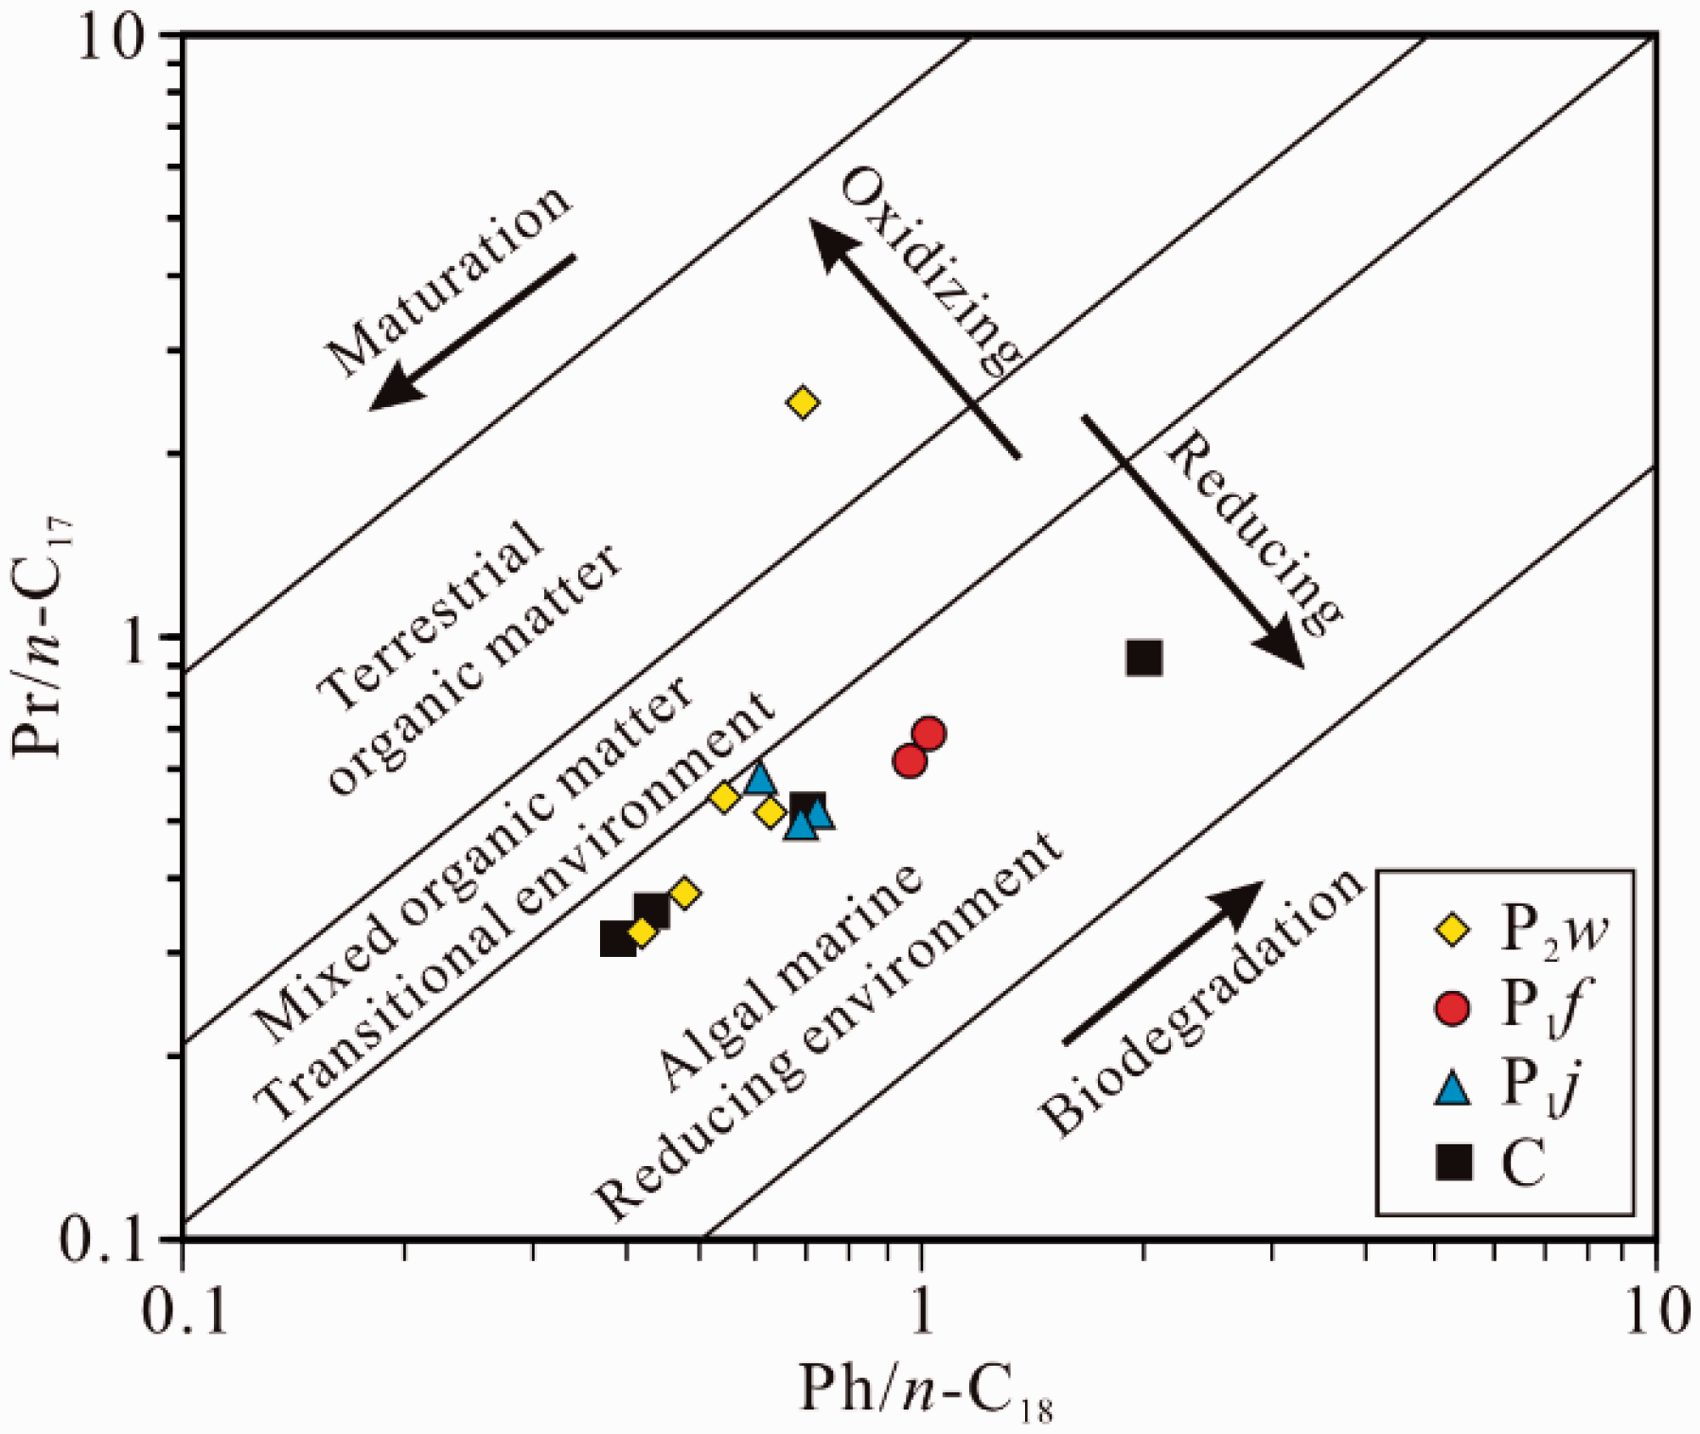
Pr/Ph ratio can reflect the redox conditions of sedimentary environment. The Pr/Ph ratios in the study area range from 0.55 to 4.04 (Table 2). There are four samples with Pr/Ph ratios greater than 1, including Samples 62, 63, 79 and 82. The Pr/Ph ratio of Sample 62 is the largest, which is 4.04. The Pr/n-C17 ratio of Sample 62 is also the largest, which is 2.43. The Pr/n-C17 ratios of the other samples are 0.32 – 0.92 (Table 2). The Ph/n-C18 ratios of all the SR samples are 0.39 – 2.03 (Table 2).
The distribution of TT can be seen from m/z 191 MCs of aliphatic hydrocarbons (Figure 5
The m/z 191 MCs of the representative SR and OS samples, displaying the distribution of tricyclic terpanes and hopanes.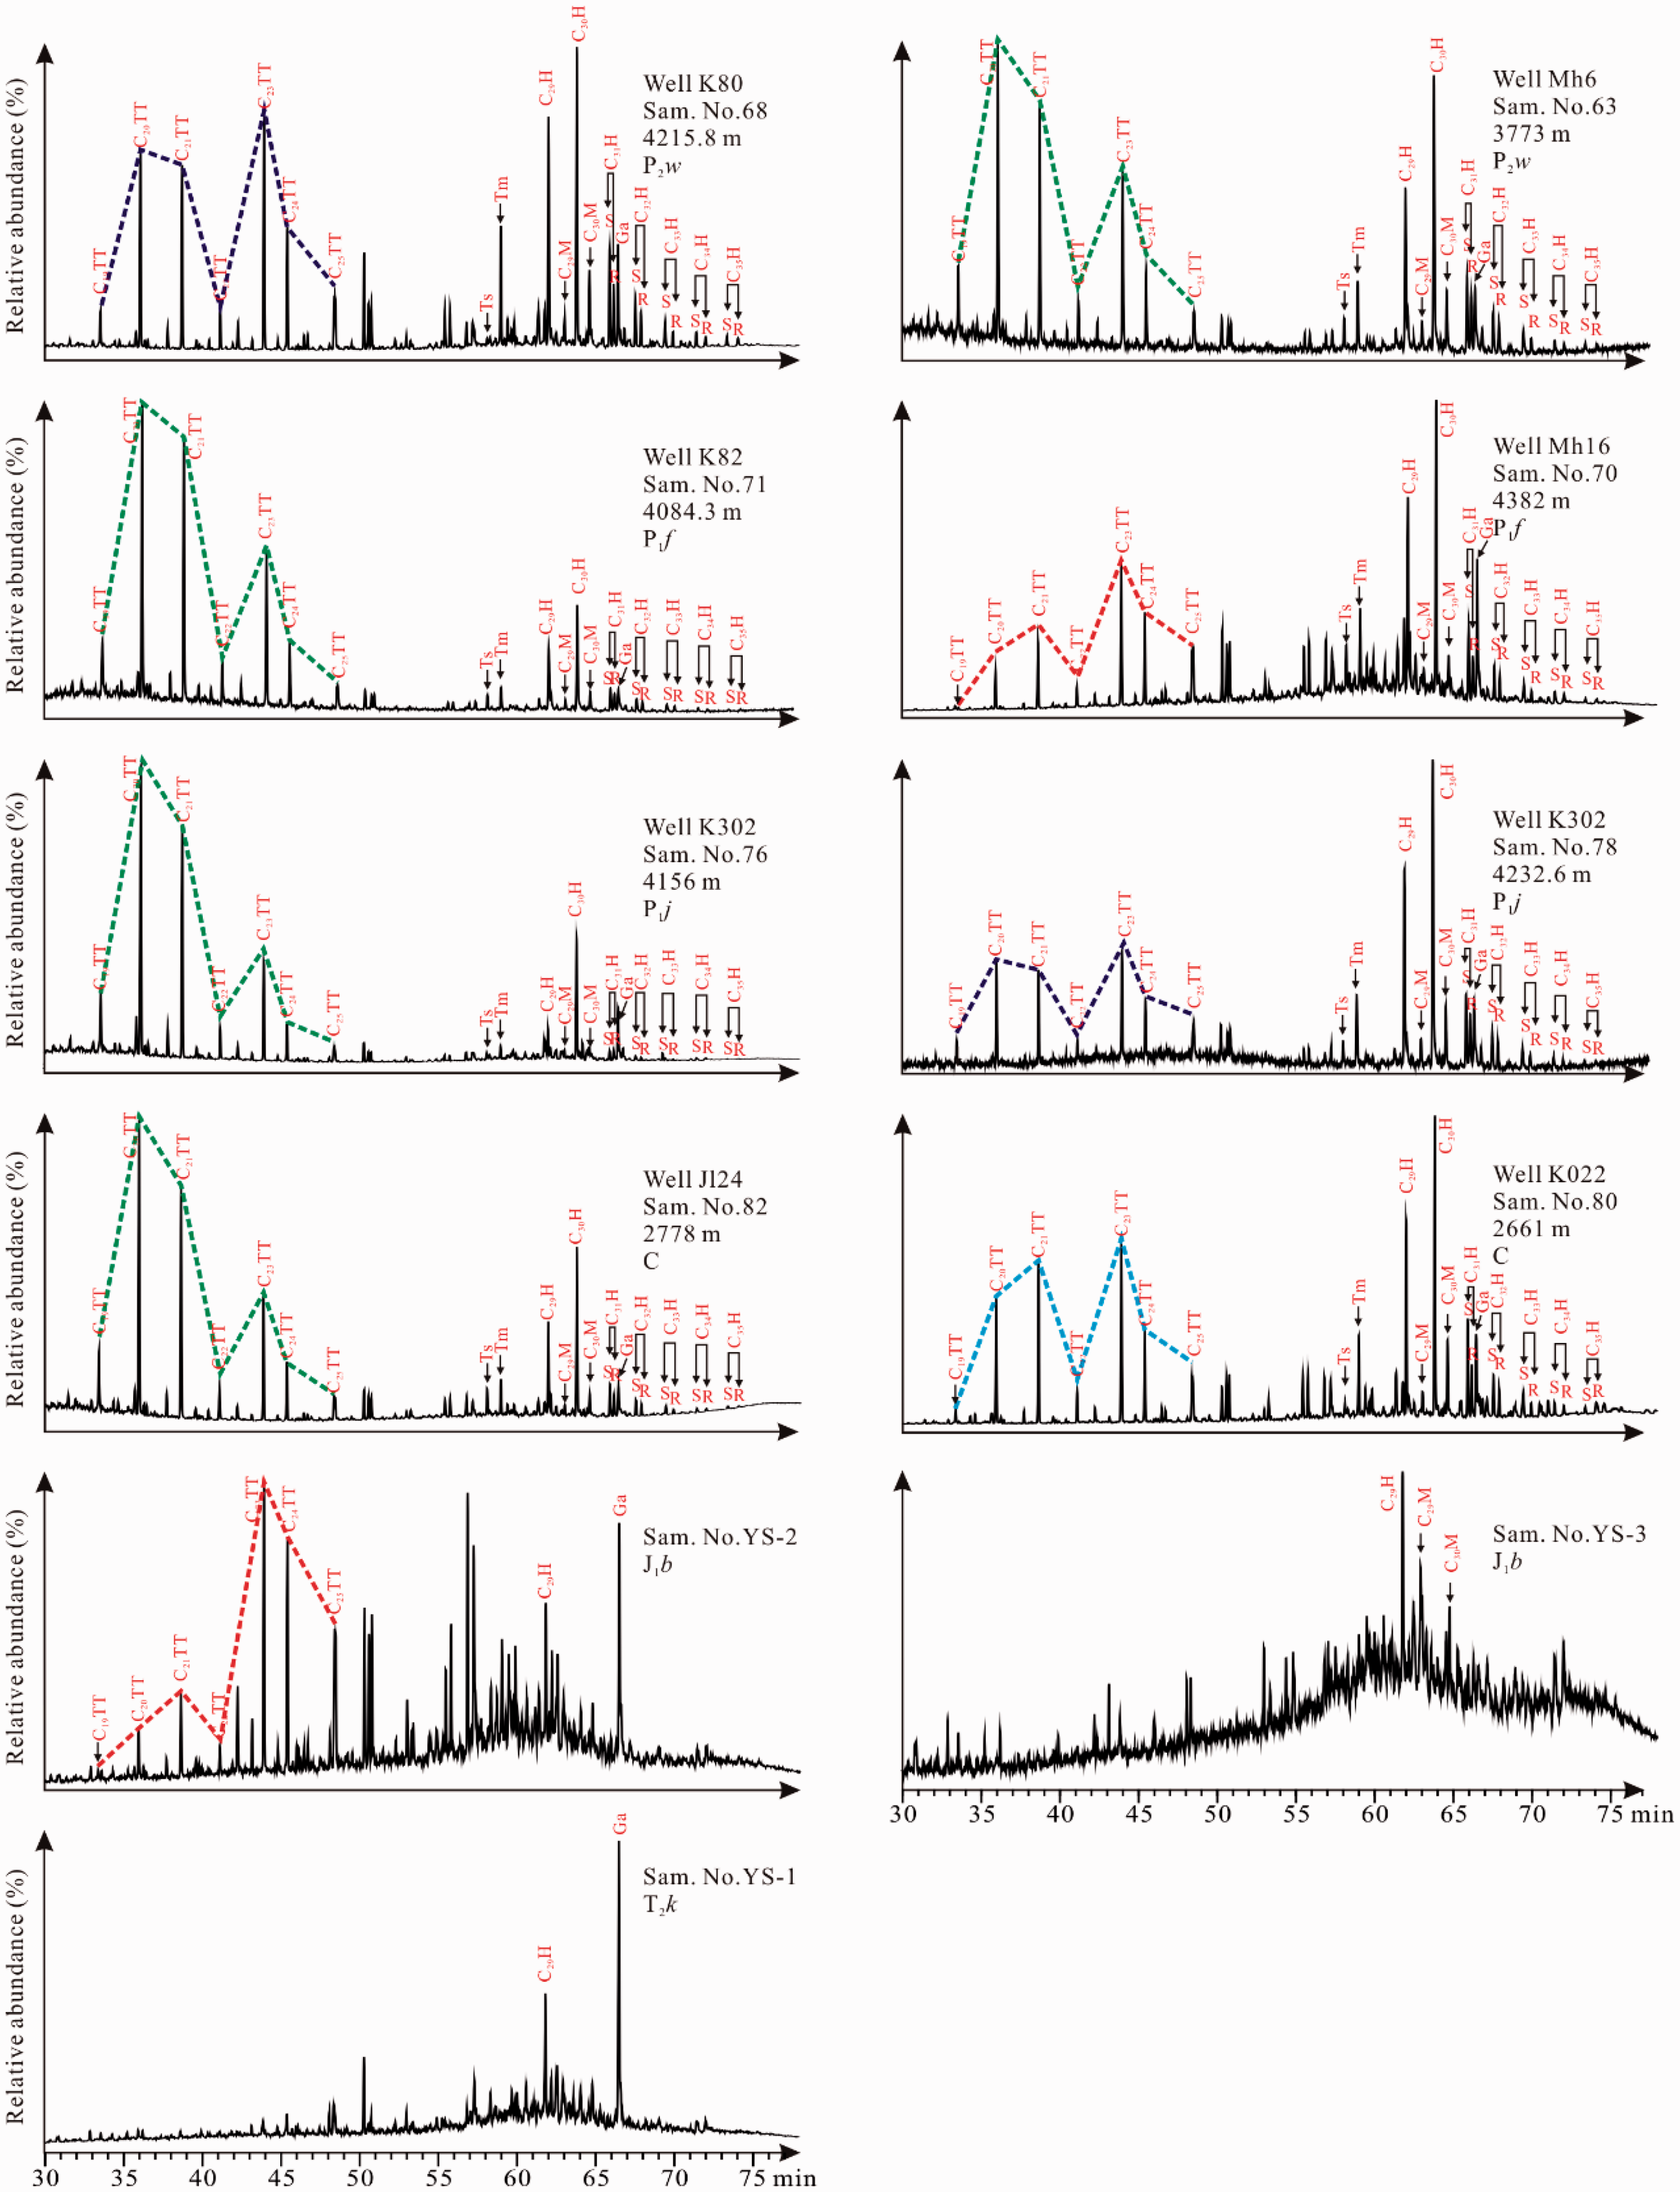
Hopanes evolved from the bacteriohopanepolyols precursors which came from the bacterial membranes (Peters et al., 2005). The m/z 191 MCs of aliphatic hydrocarbons also show the distribution characteristics of hopane (Figure 5). C30 αβ hopane (C30H), C29 αβ hopane (C29H), C31H to C35H of all SR samples can be detected, and the relative contents gradually decrease. Almost all samples’ 22 S isomers of C31H to C35H are more enriched than 22 R isomers. Relevant parameters of hopane have also been calculated (Table 2), including the C29M/C29H ratio, the C30M/C30H ratio, the Gammacerane index, the Ts/Tm and the 17αβ C3122S/(22 S + 22 R) value. It is difficult to distinguish the hopane in the OS samples, but C29H can still be detected (Figure 5).
The distribution of steranes and diasteranes are shown in m/z 217 MCs. In this study, C27 ααα 20 R cholestanes, C28 ααα 20 R cholestanes and C29 ααα 20 R cholestanes exhibit two types of distribution (Figure 6
The m/z 217 MCs of the representative SR and OS samples, displaying the distribution of steranes, pregnanes and homopregnane.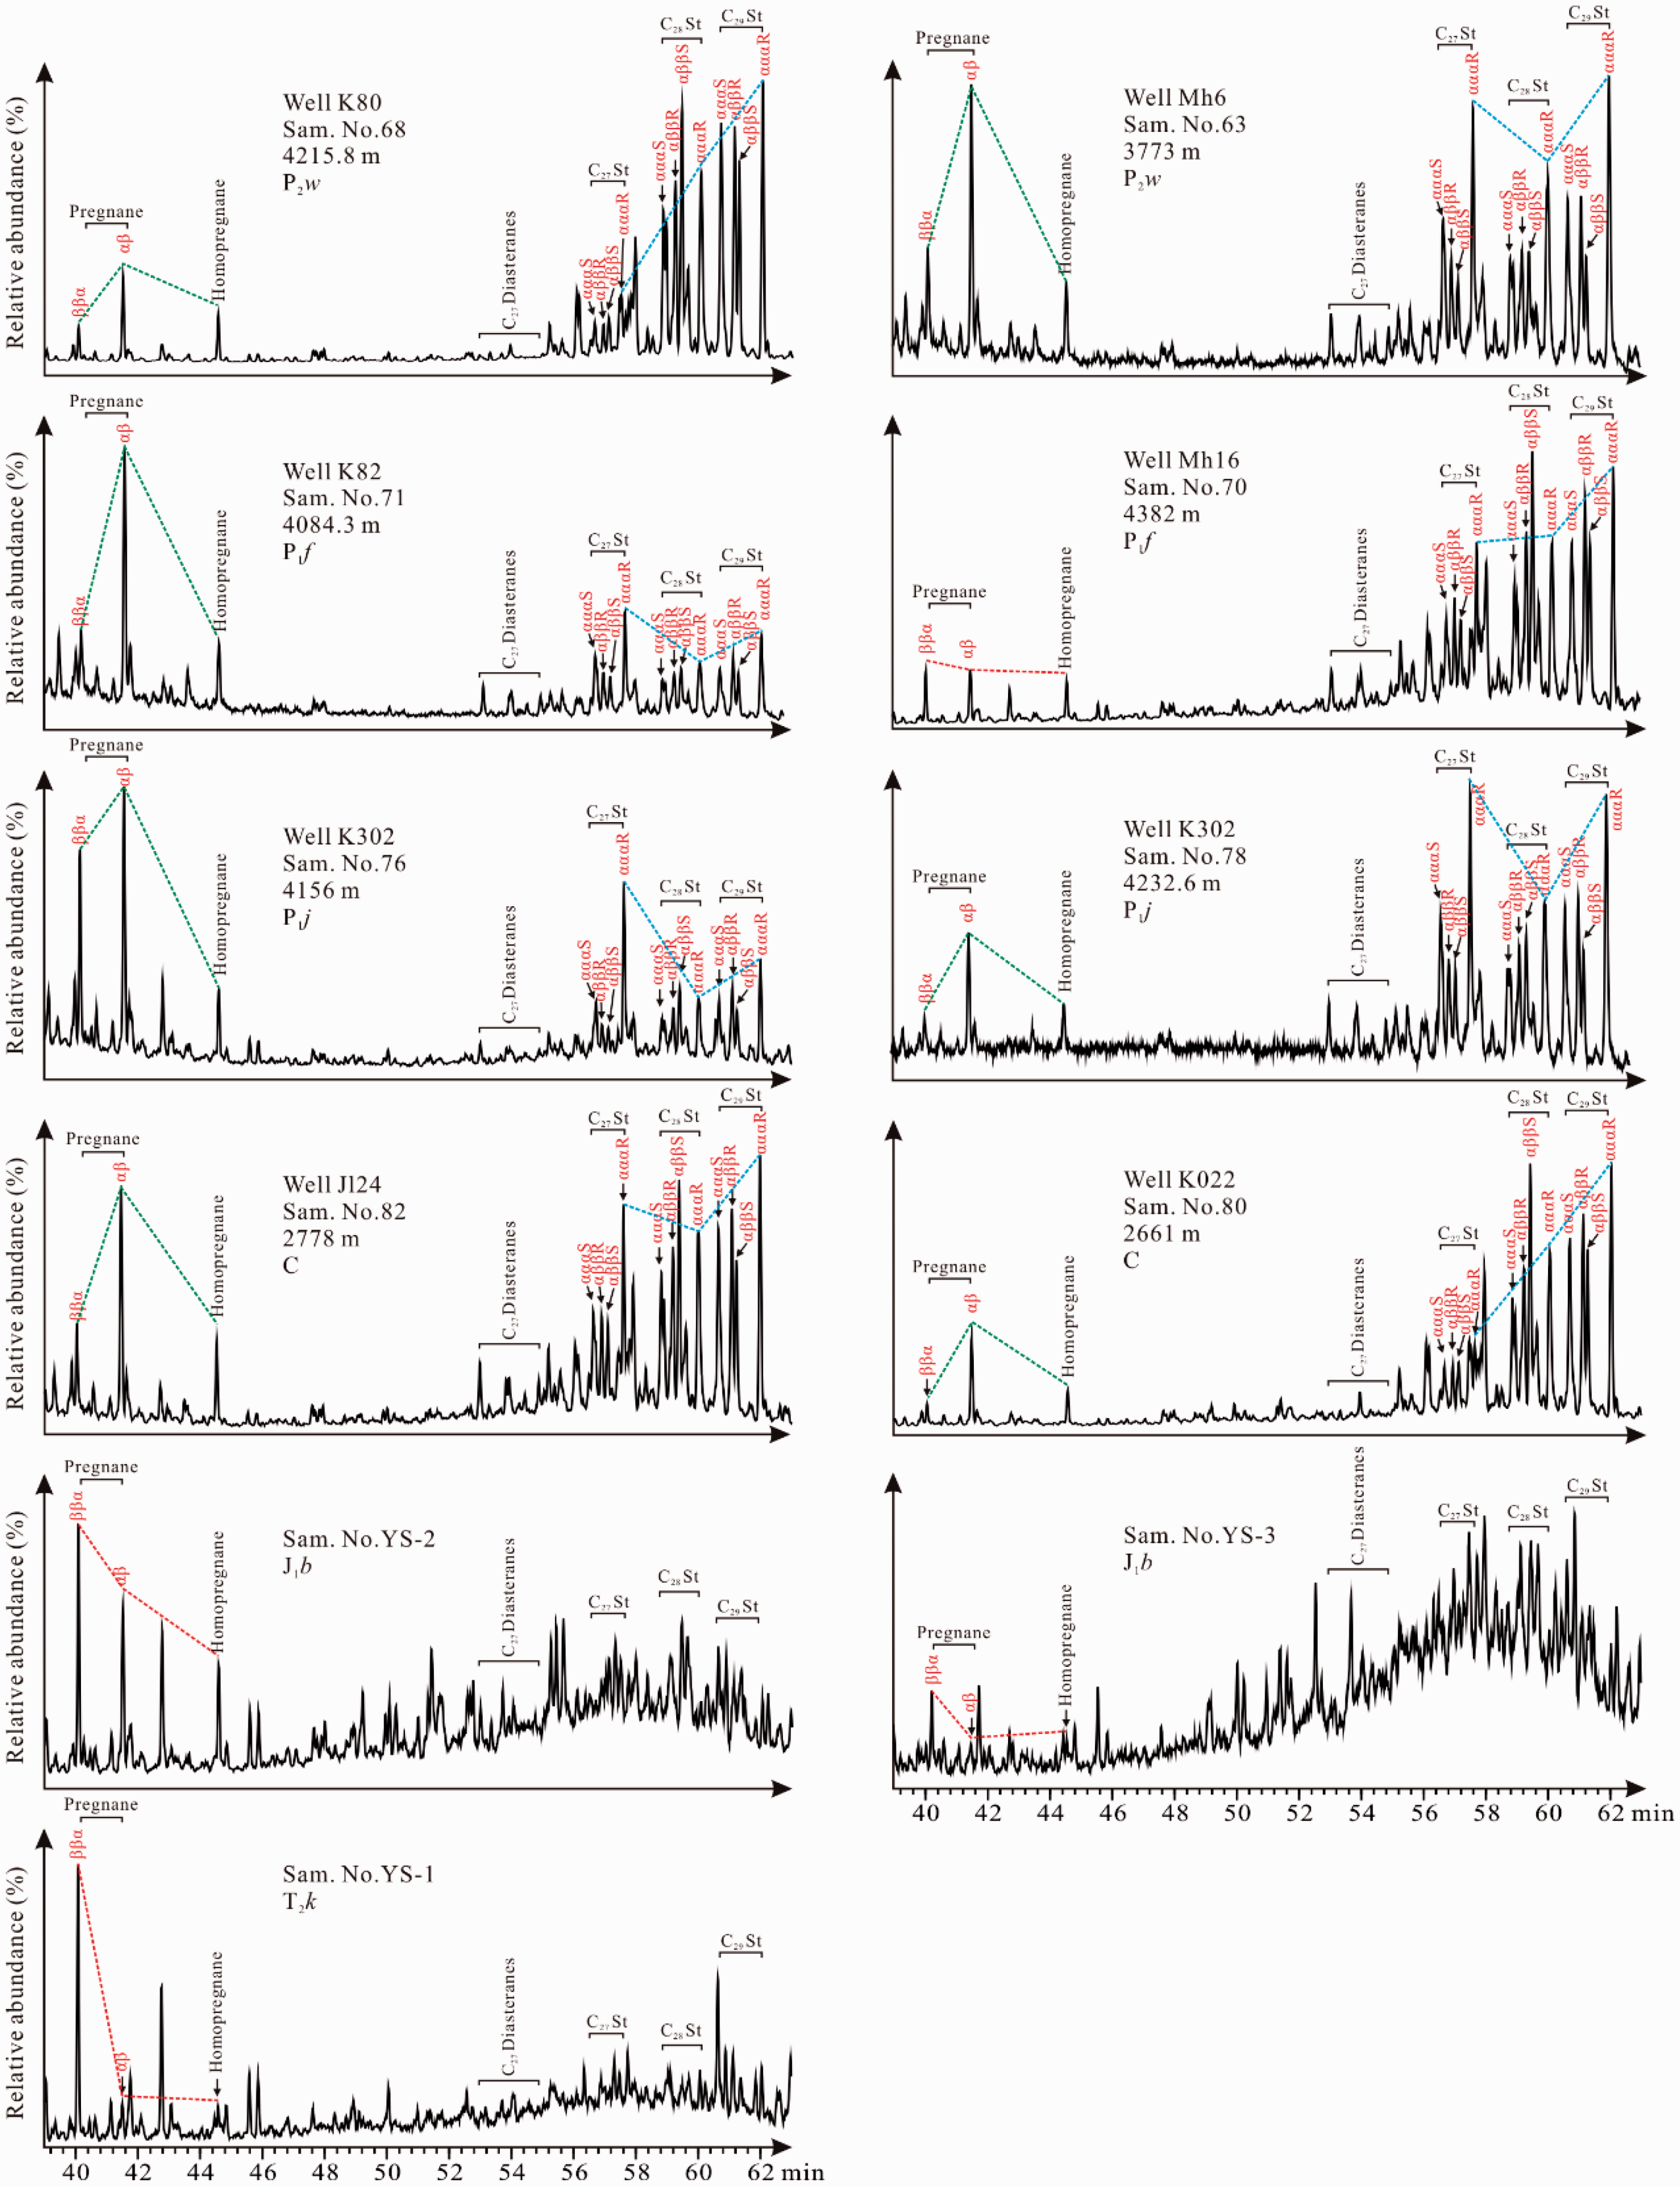
Characteristics of triarysteranes
Triarysteranes in aromatic hydrocarbons have strong anti-biodegradation ability, which is of great significance to the oil source comparison of severely degraded crude oil. The distribution characteristics of triarysteranes can be seen from the m/z 231 MCs of aromatic hydrocarbons (Figure 7
The m/z 231 MCs of the representative SR and OS samples, displaying the distribution of triarysteranes.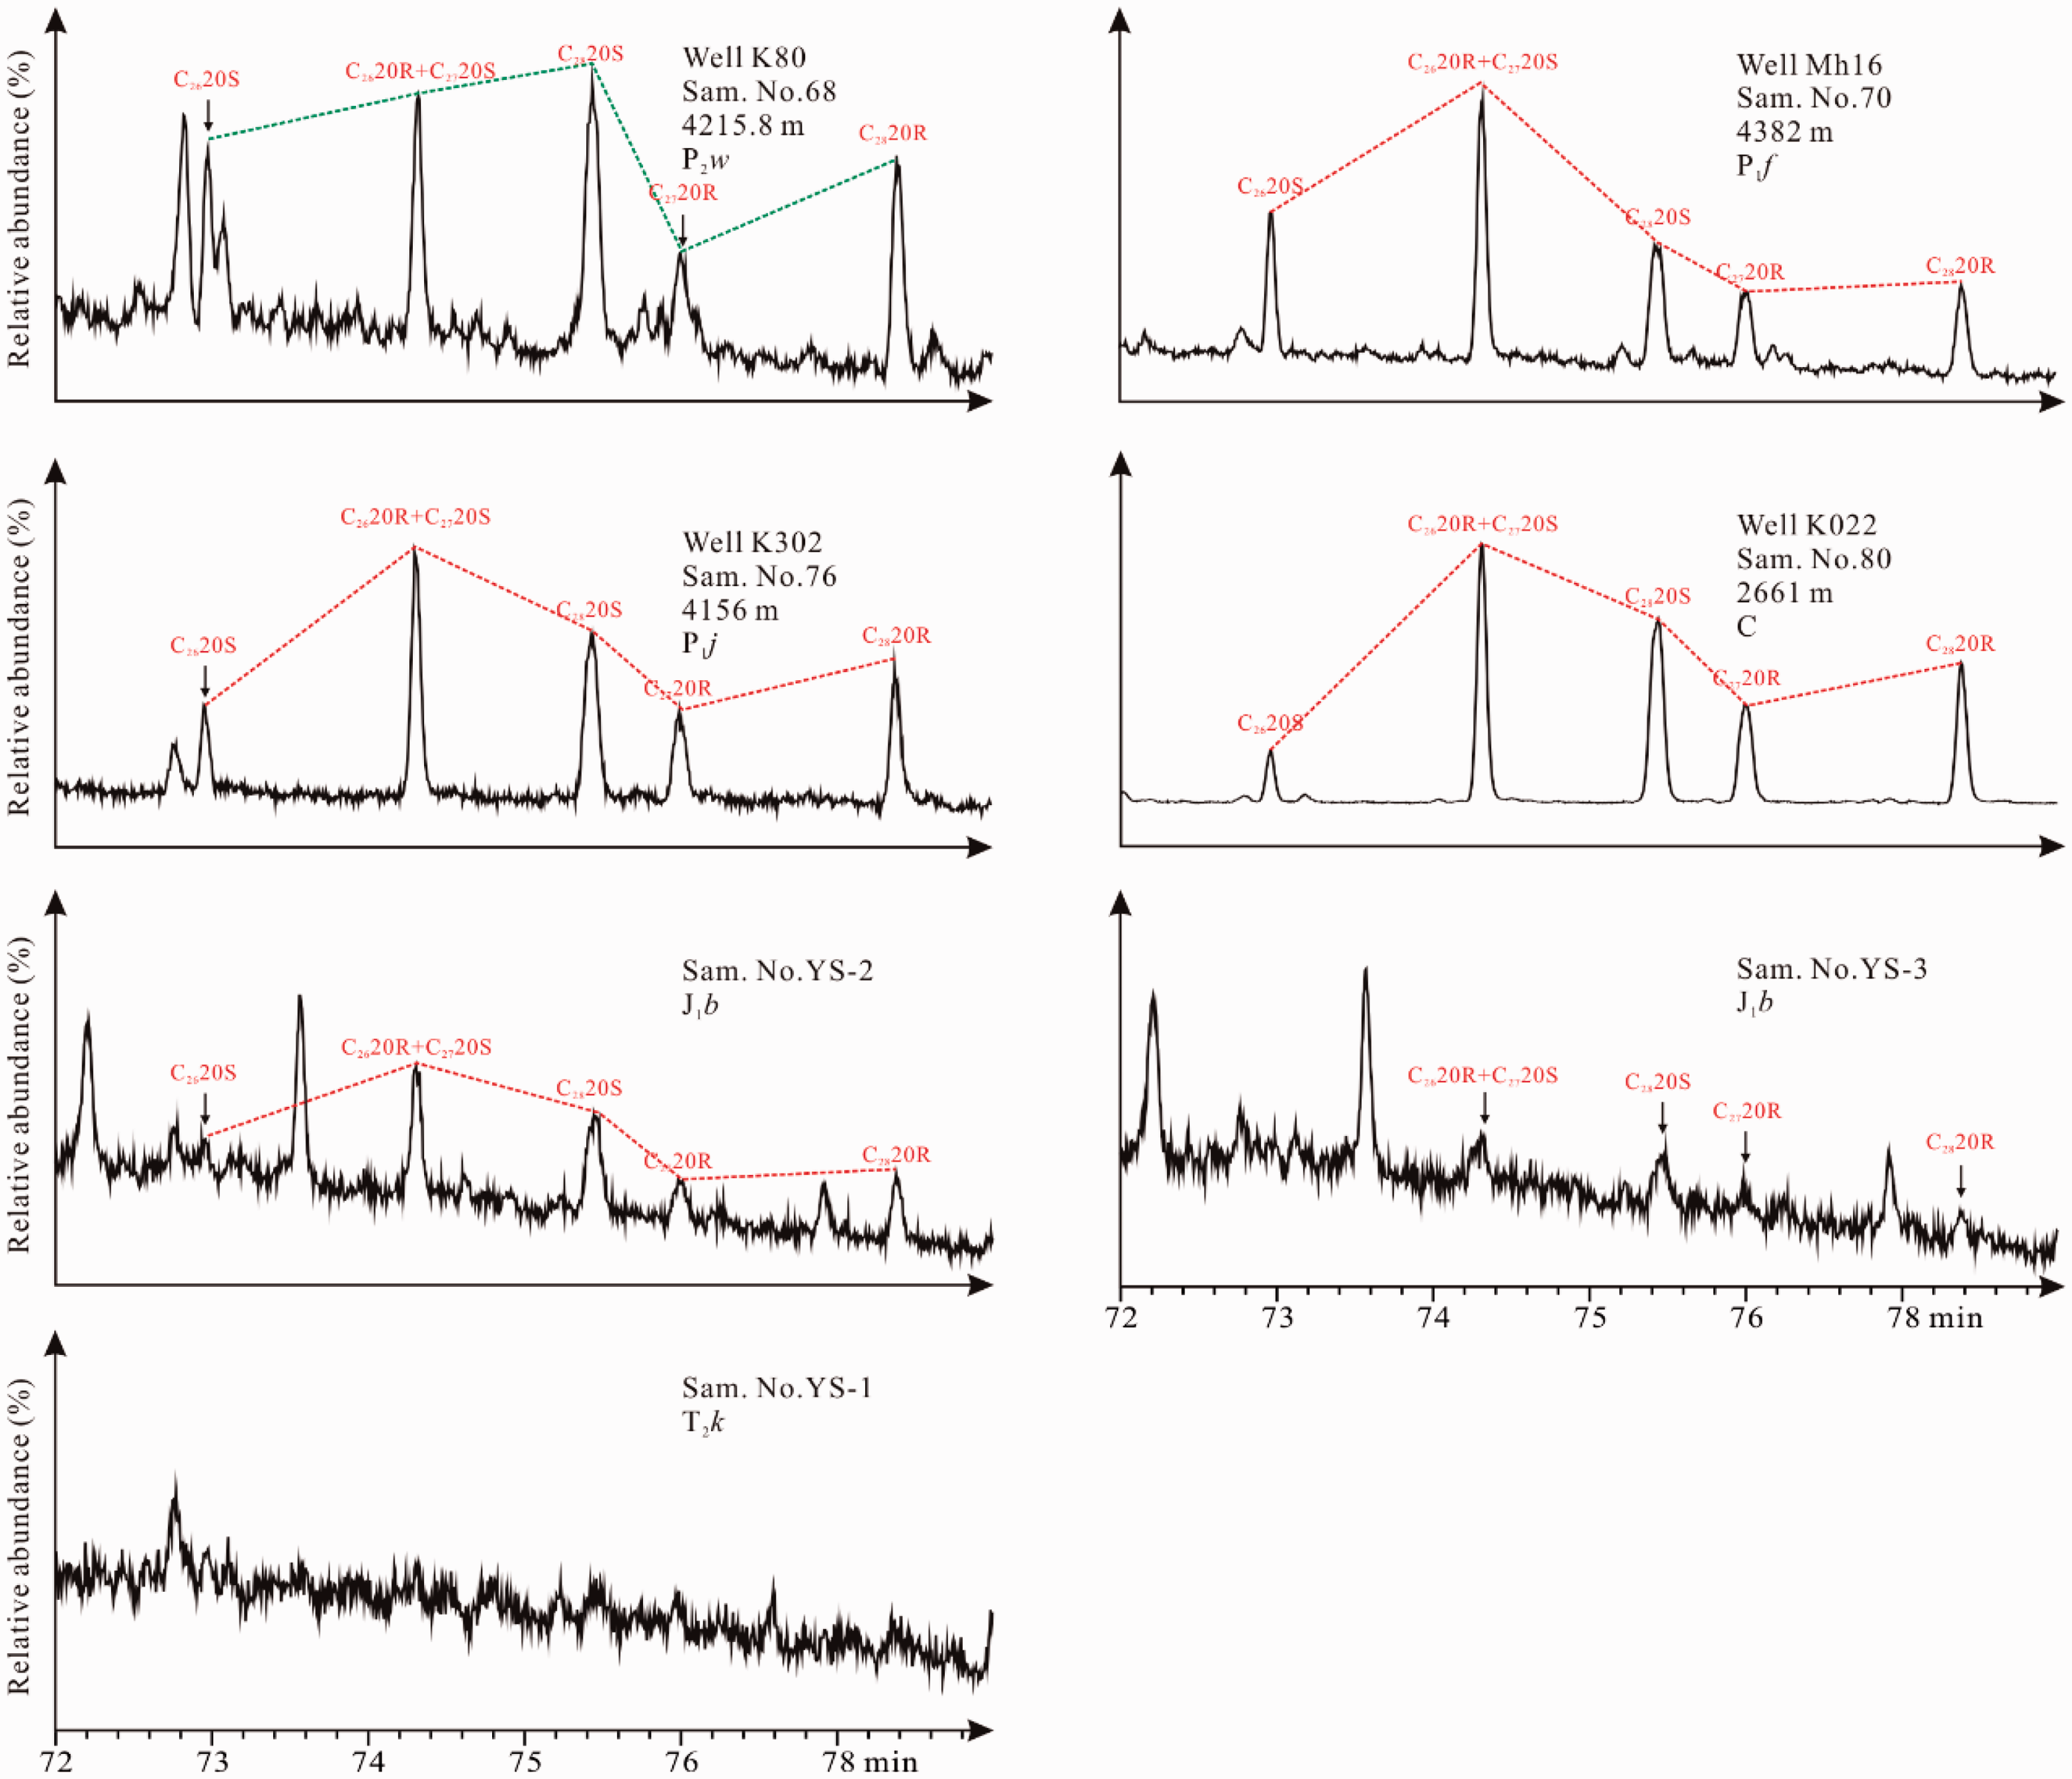
Characteristics of OCI
The OCI of the extracts from the SRs in the study area are similar (Table 3). The distribution of δ13C is between −30.05‰ and -25.59‰. Among them, the OCI of the SRs from P1f are the lightest, and δ13C is −30.05‰; the OCI of the SRs from P1j are lighter, and δ13C is between −29.85‰ and −28.18‰ (average = −28.99‰, SD = 0.58‰); the OCI of the SRs from P2w are the heaviest, and δ13C is from −29.71‰ to −25.59‰ (average = −28.18‰, SD = 1.38‰); the OCI of the SRs from C are not measured. The OCI of OSs is very light, and δ13C is between −30.89‰ and −29.97‰ (average = −30.38‰, SD = 0.38‰).
Discussion
Organic geochemical characteristics of SRs
TM of SRs
The TM of SRs can be estimated by some parameters from RP and aliphatic hydrocarbon (Flannery and George, 2014; George et al., 1994, 1997; Geršlová et al., 2015; Luo et al., 2016a, 2016b, 2017; Peters et al., 2005).
Hl and Tmax can reflect the TM of SRs (Peters and Cassa, 1994). It can be seen from Figure 8
HI and Tmax of the SRs in the study area and the North.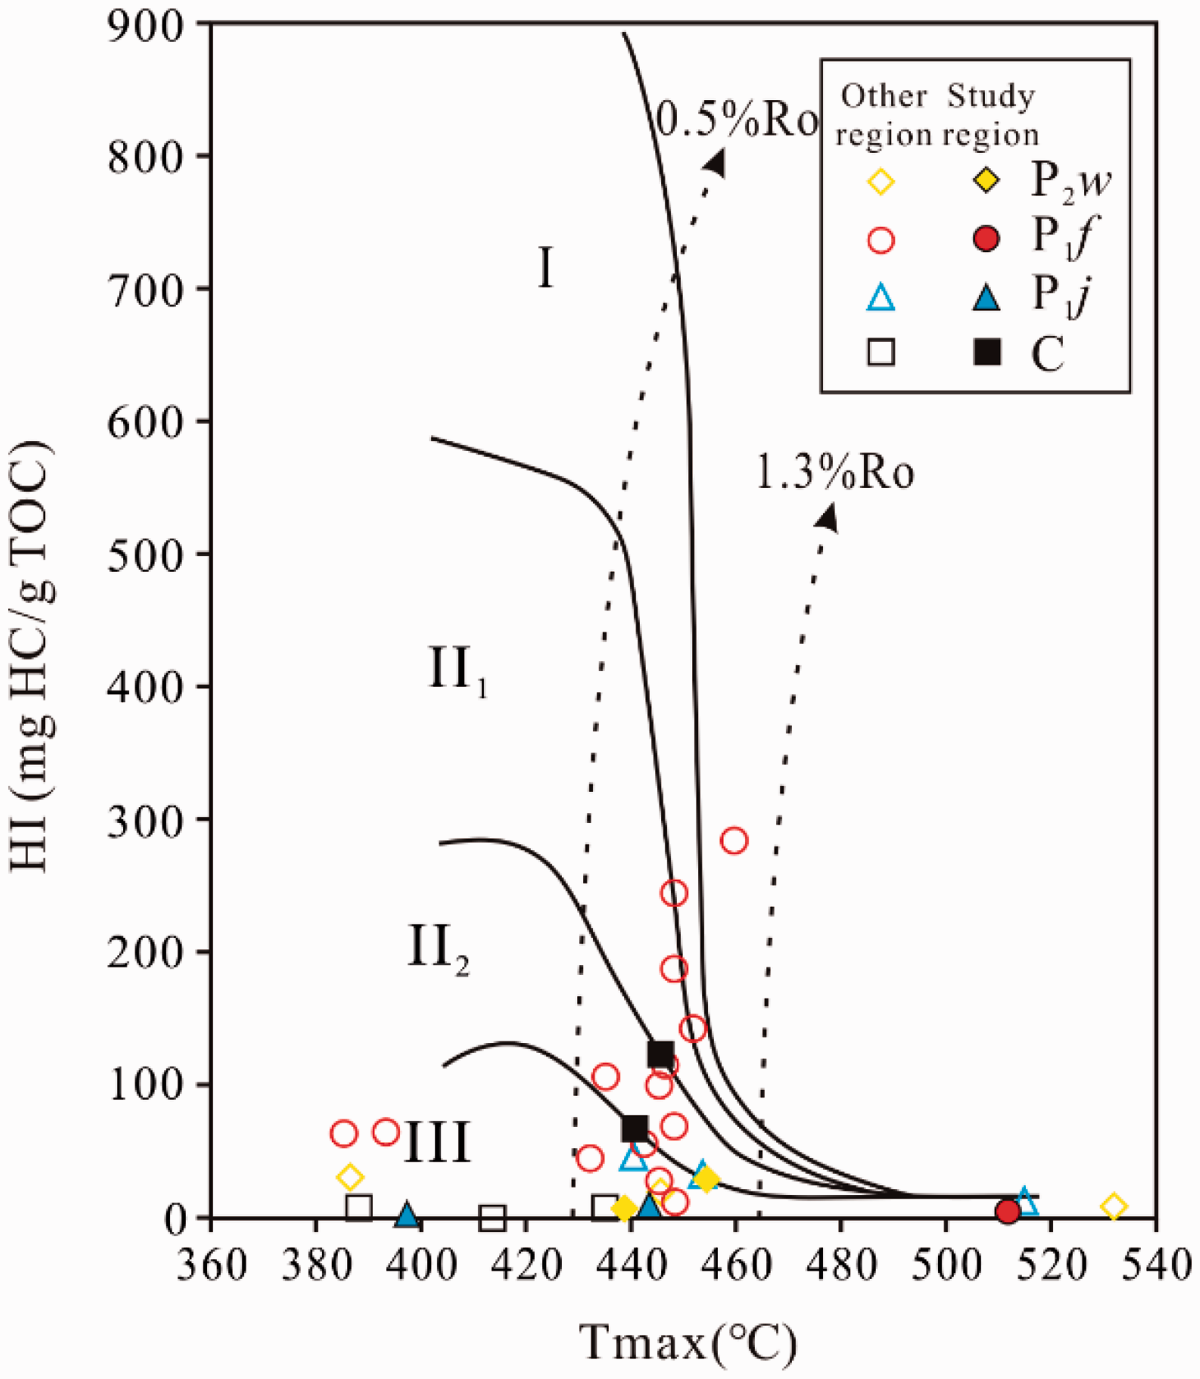
With the increase of the TM, C30M/C30H in hopanes decreases gradually, while Ts/Tm increases gradually (Peters et al., 2005). As shown in Figure 9
Plot of C30M/C30H versus Tm/Ts can determine the TM.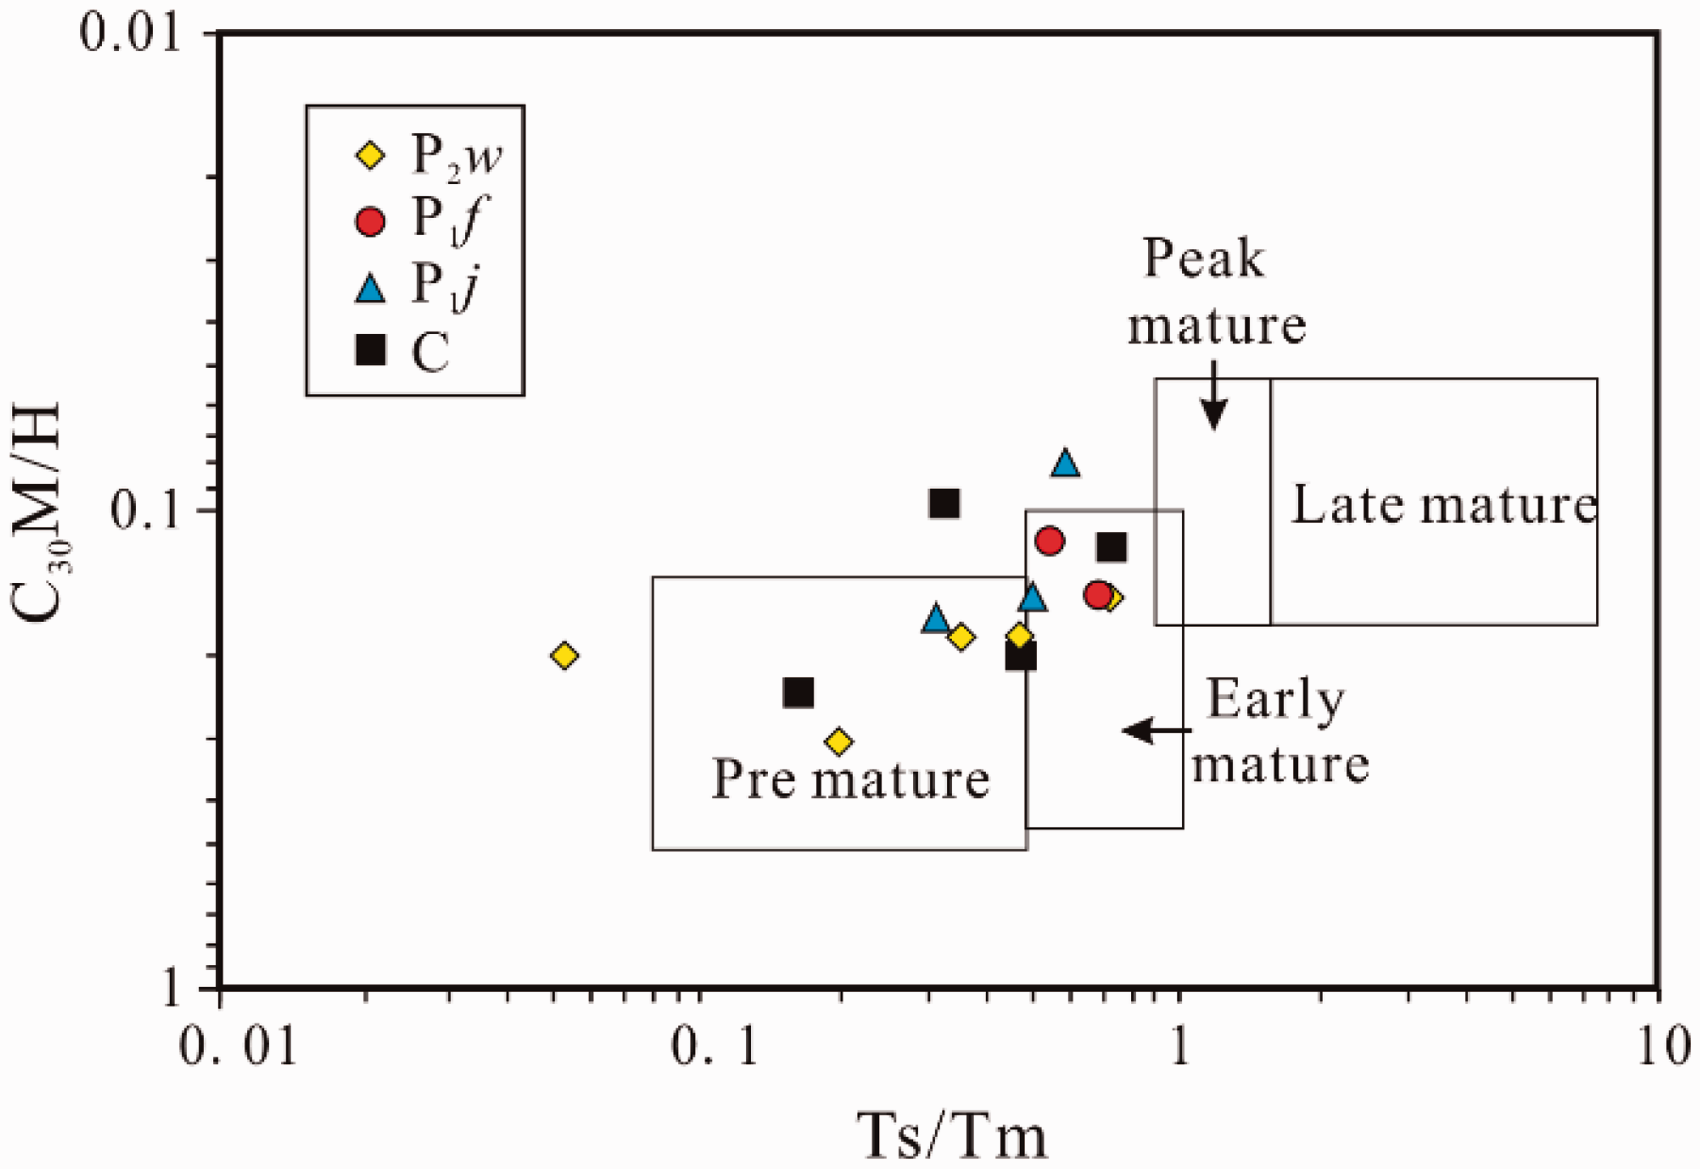
The C29 20 S/(20 S + 20 R) and C29 ββ/(ββ + αα) can reflect the TM of OM (Peters et al., 2005). With the increase of the TM, the C29 20 S has gradually increased compared with C29 20 R (equilibrium point C29 20S/(20S + 20 R) = 0.52 – 0.55) and the C29 ββ has gradually increased compared with C29 αα (equilibrium point C29 ββ/(ββ + αα) = 0.67 – 0.71) (Seifert and Moldowan, 1978). From Figure 10
Plot of C29 ββ/(ββ + αα) versus C29 20 S/(20 S + 20 R) can determine the TM.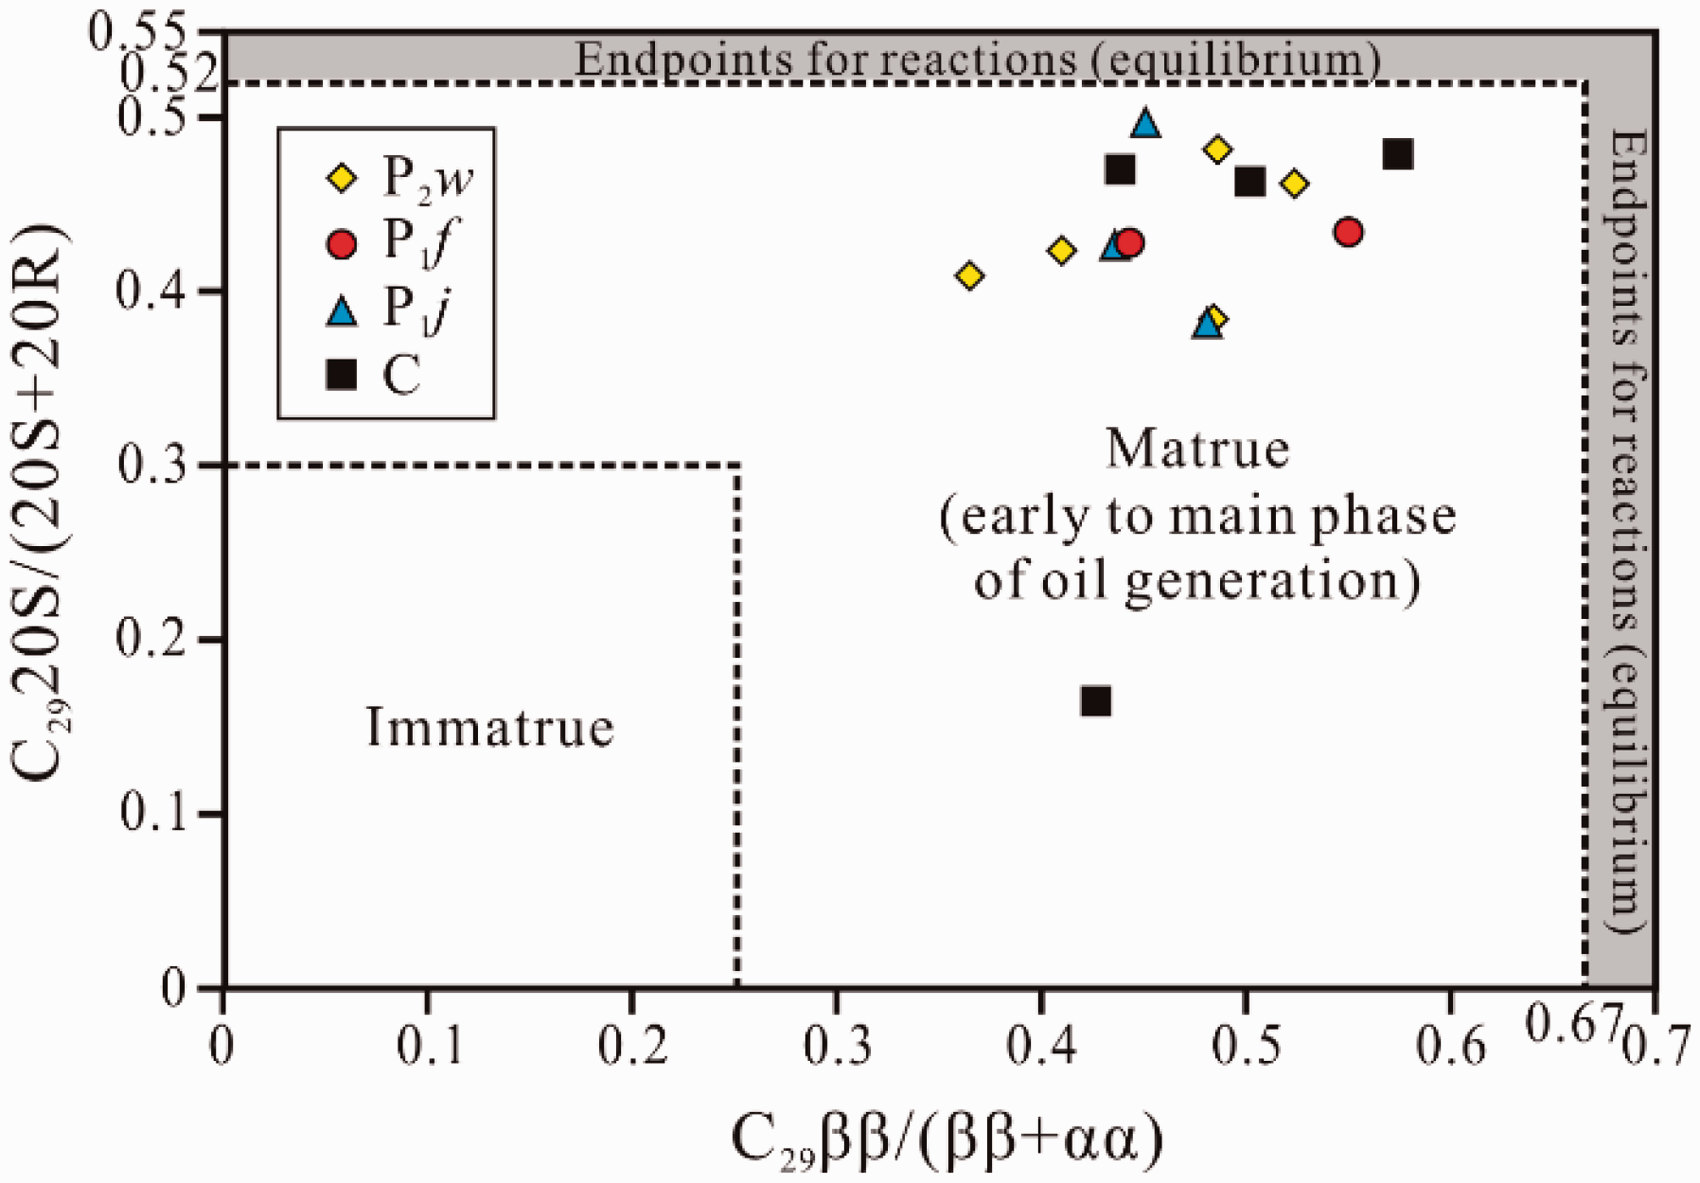
In conclusion, almost all the SR samples are in mature TM stage, while only 70 samples from P1f are in high - over mature TM stage and 82 samples from C are in immature TM stage.
OM and sedimentary paleoenvironment of SRs
The relative content of Pr and Ph can reflect the redox conditions of the ancient water body when the SR was deposited (Powell and Mckirdy, 1973). Didyk et al. (1978), Peters et al. (2005) thought that if Pr/Ph is <1.0, the environment was in reduction condistions; if Pr/Ph is >3.0, the environment was in oxidation conditions. It can be seen from Figure 11
Plot of Pr/Ph and Ga/C30H can reflect the paleosedimentary environment of the SRs. Plot of Pr/n-C17 versus Ph/n-C18 can reflect the paleosedimentary environment of the SRs.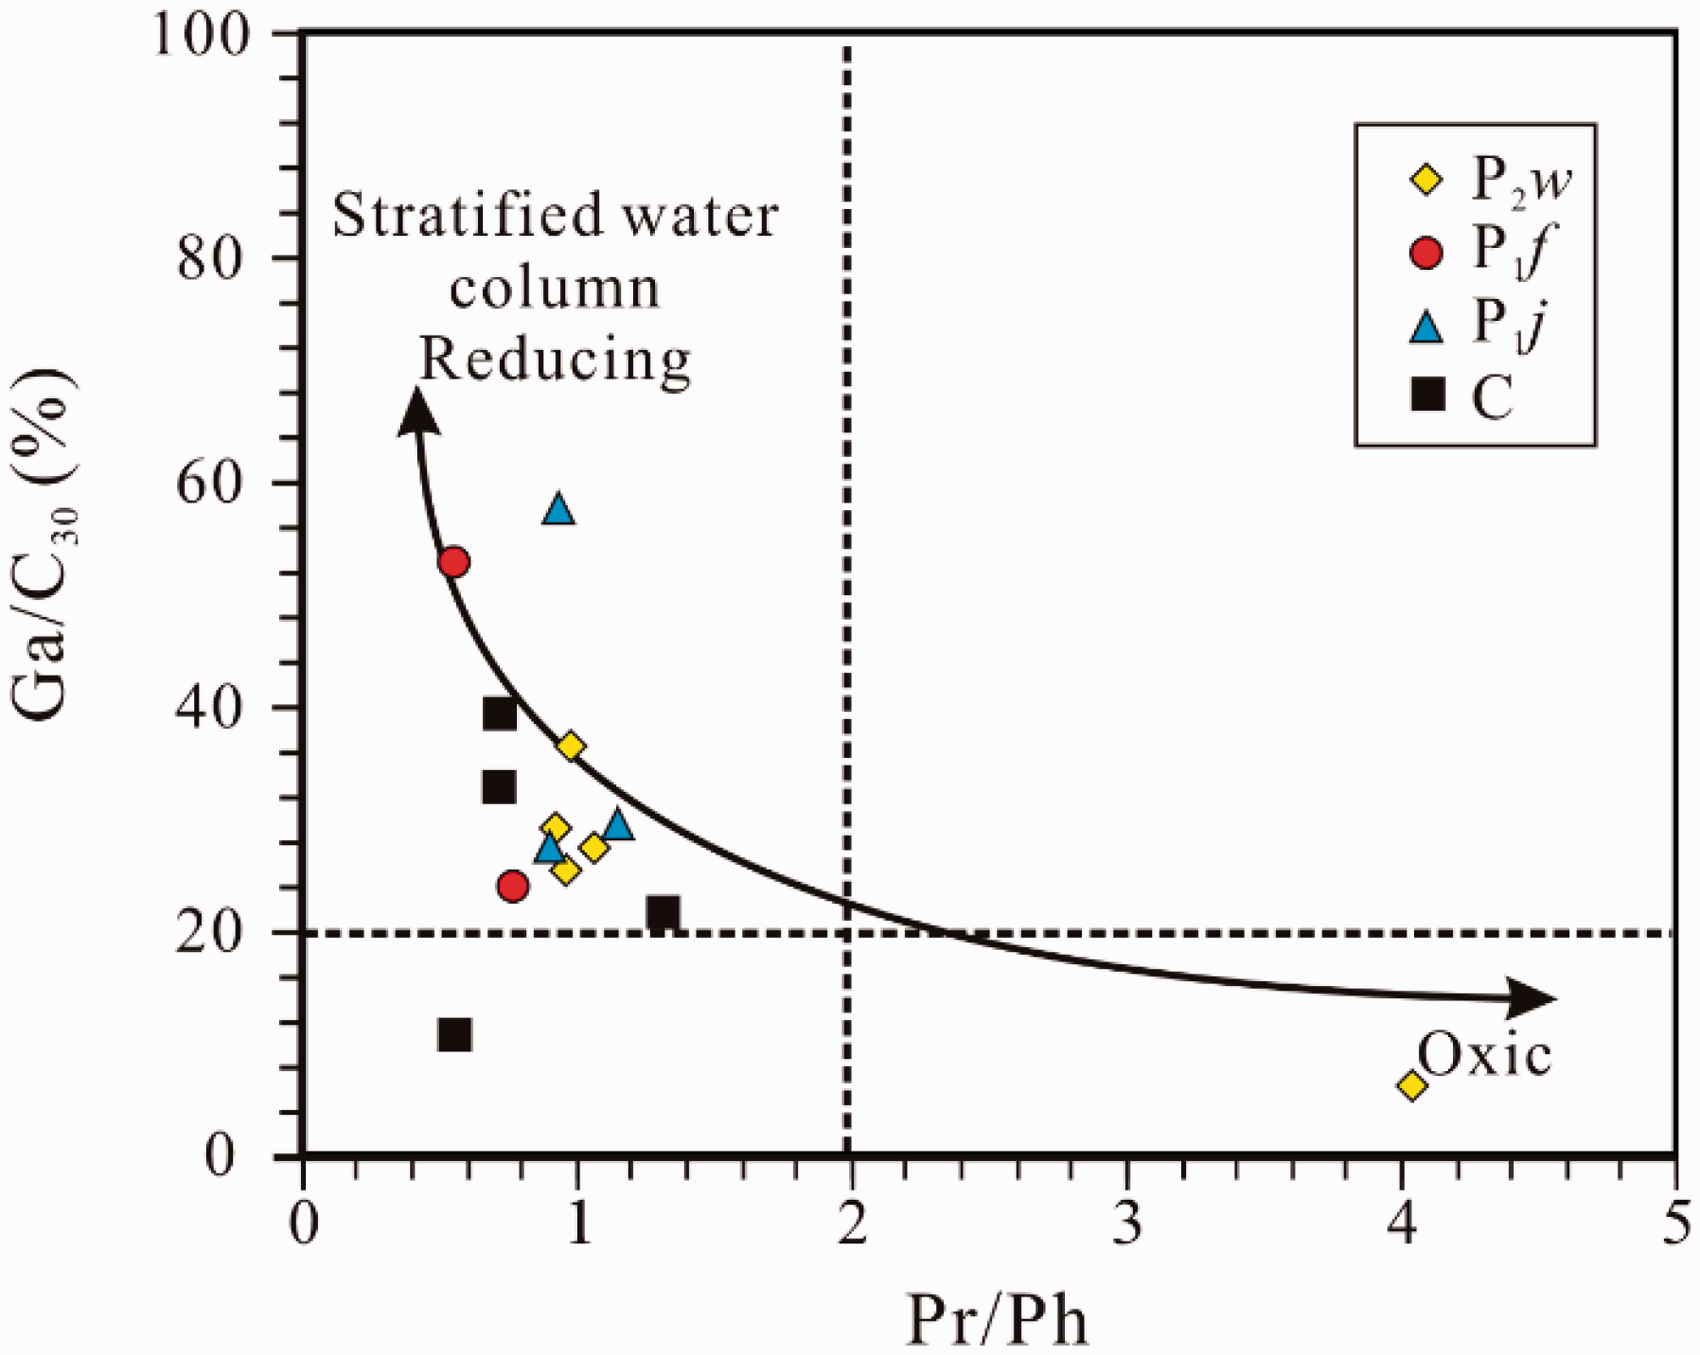
The SRs deposited in high salinity water have high Gammacerane content (Damsté et al., 1995). It can be seen from Table 2 and Figure 11 that almost all SR samples have the characteristics of high Gammacerane index, which indicates that they were formed in the environment of saliency qualified water column with reduction. Only Sample 81 from C and Sample 62 from P2w have low Gammacerane indexes (Table 2 and Figure 11).
The relative contents of C27, C28 and C29 steranes can indicate the input of OM. If the OM is from higher plants, the relative content of C29 sterane is higher (Huang and Meinschein, 1979). Otherwise, the indicator OM mainly comes from the prokaryotic organizations (Isaken, 1991). According to the relative contents of C27, C28 and C29 steranes, most of the SR samples in the study area can be divided into two types (Figure 13
The relative contents of C27-C28-C29 steranes.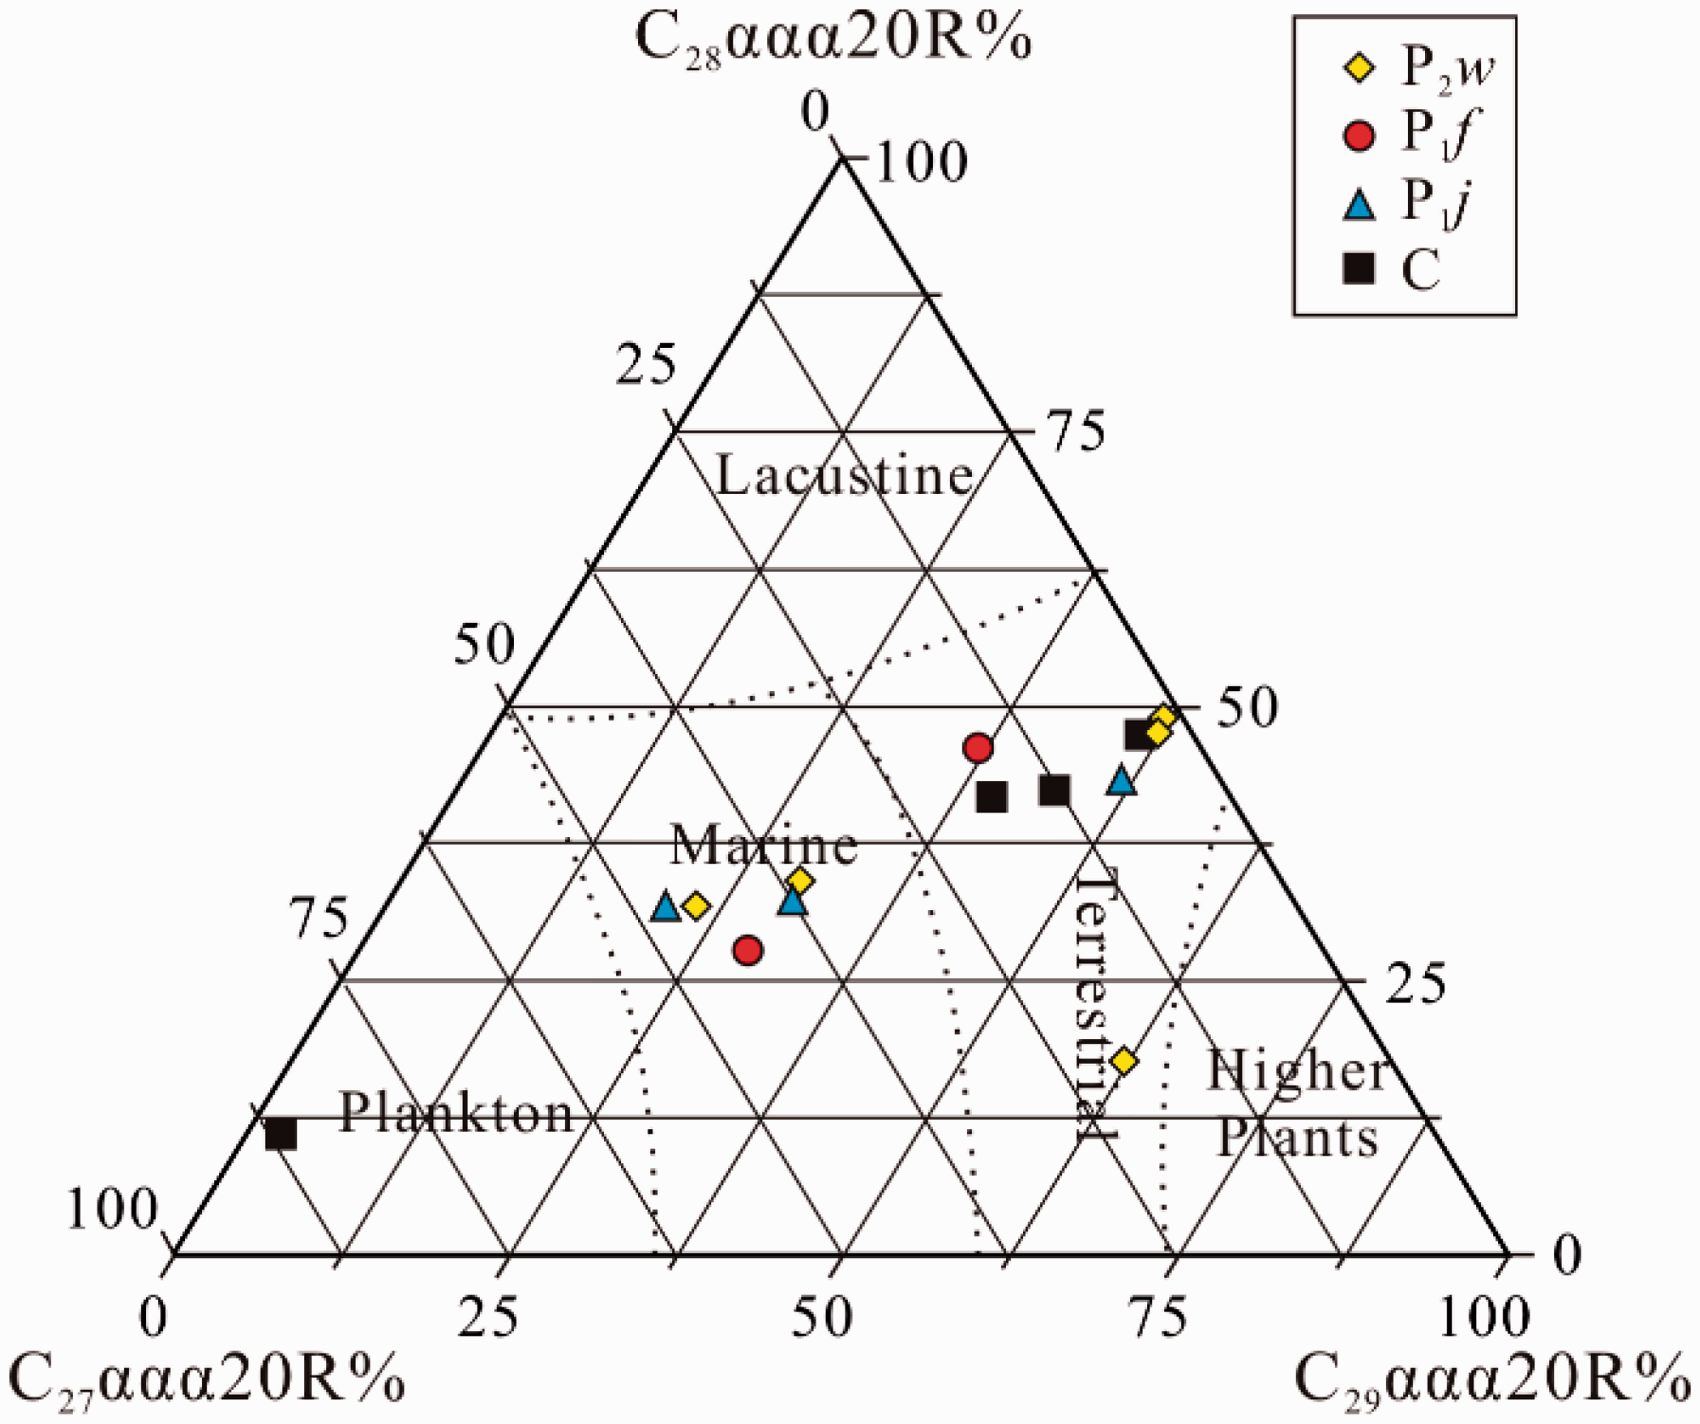
The (C19 + C20)/C23 TT and the TAR can also reflect the input of OM (Bourbonniere and Meyers, 1996; Meyers, 1997; Peters & Moldowan, 1993; Tao et al., 2015). The ratio of (C19 + C20)/C23 TT and the TAR are small for most SRs in the study area, which also indicate that the amount of terrestrial OM is small (Table 2 and Figure 14
TAR versus (C19 + C20)/C23 TT shows the contributions of the OM input.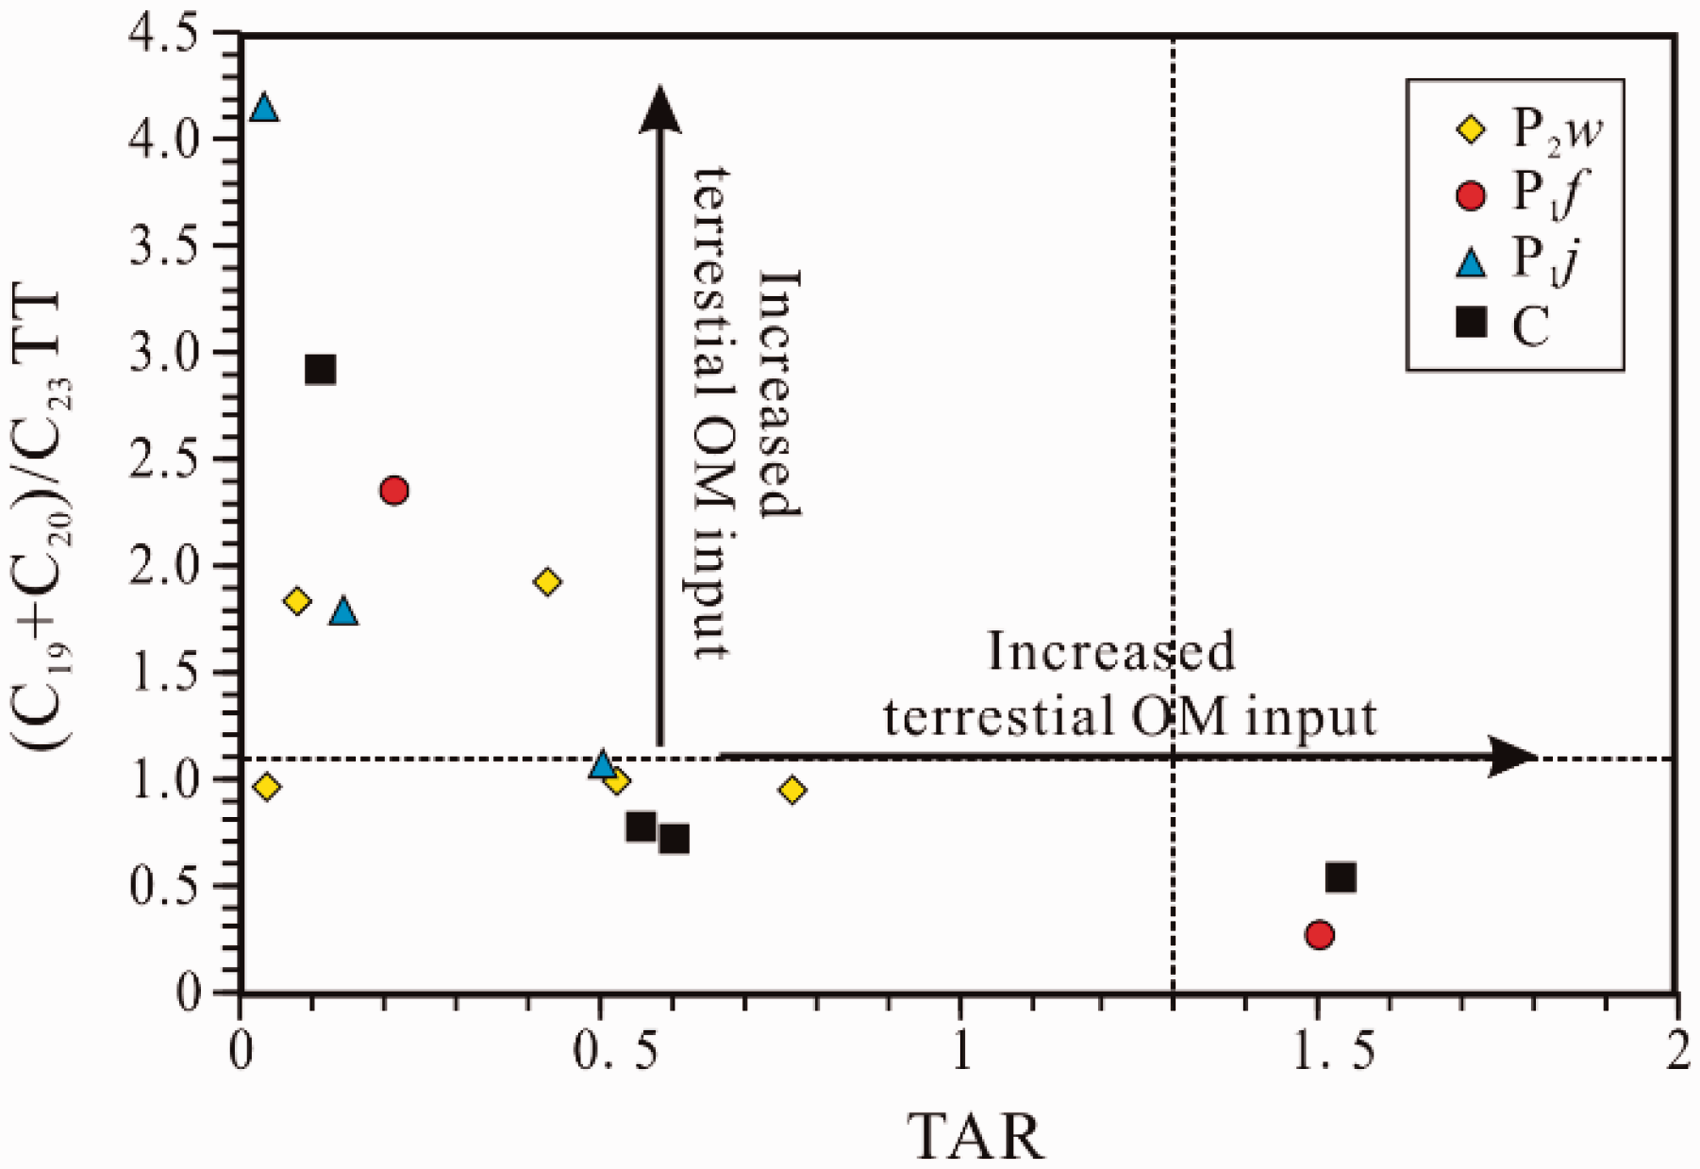
In conclusion, almost all the samples are formed in water with high salinity and reduction environment, and terrestrial higher plants are not the main input of OM. Sample 62 from P2w and Sample 81 from C are totally different from the other samples. Among them, Sample 62 has relatively high content of C29 sterane, and its n-Alkanes have bimodal characteristics, with the high molecular weight of n-Alkanes content being large, which indicates that the OM has a large proportion of terrestrial higher plants, combined with the characteristics of low Ga content and high Pr/Ph. It is speculated that Sample 62 was deposited in the freshwater oxidation environment near the lake estuary. For Sample 81, the relative content of C27 sterane is high, but the high molecular weight of n-Alkane is high (TAR value is large); the contribution of terrestrial higher plants may be large, and the content of Ga is also low, while Pr/Ph is less than 1, indicating that Sample 81 might be in an environment of freshwater deep-water lake.
Hydrocarbon generating capacity of SRs
According to the Tmax of RP test and some parameters from hopane and sterane (Table 2 and Figure 8 to 10), except for one sample of P1f which is in the stage of high - over TM, the other SRs are in the mature stage. According to the RP results, the kerogen type of C SRs is the best, which is type Ⅱ; the kerogen type of P1j and P2w SRs is type Ⅲ; however, the thermal evolution of P1f is too high to judge the kerogen type. According to the n-Alkane distribution (Figure 4) and the elative quantity of C27-C28-C29 steranes (Figure 13), the SRs of all strata have the input of terrigenous higher plants, but terrigenous higher plants are not the main source of OM. According to the TAR (Figure 14), the terrestrial higher plants’ contribution to Sample 62 of P2w and Sample 81 of C is obvious.
According to TOC and S1 + S2 (Figure 3), the OM abundance of C SRs is the largest, reaching good to excellent level; the OM abundance of P2w SRs is large, reaching good level; the OM abundance of P1j SRs is moderate level; the OM abundance of P1f SR is the least, possibly affected by its high TM.
According to the Pr/Ph (Figure 11 and Table 2) value, the Gammacerane index (Figure 11 and Table 2) and the Pr/n-C17 versus Ph/n-C18 (Figure 12) value, it is believed that almost all the samples were formed in the water body of high salinity and reduction environment, while the Pr/Ph value of Sample 62 from P2w is greater than 3, and the Gammacerane content is low, which was fresh water oxidation environment. The Gammacerane content of Sample 81 from C is also very low, which is speculated to be fresh water environment.
Finally, the SRs of C are considered the best; the P2w SRs are good, and the P1j SRs are medium. Although P1f SR has a high TM and has been subjected to biodegradation, it is considered that the hydrocarbon generation capacity of P1f SRs were also very good in the reservoir forming period, compared with the north of the study area.
Biodegradation degree of OS oil
Biodegradation of crude oil is a step-by-step process. Through experiments and analysis of crude oil samples, Volkman et al. (1983); Williams et al. (1986); Wenger et al. (2002); Larter et al. (2012) have sequenced the biomarkers of anti-biodegradation ability from weak to strong: n-Alkane, i-Alkane, isoprenoid alkane, bicyclic sesquiterpene alkane, hopane (25 - norhopanes formed after degradation), sterane, hopane (25 - norhopanes not formed after degradation), rearranged sterane, aromatic sterane and porphyrin.
The m/z 85 MCs of aliphatic hydrocarbon reflect the n-Alkane distributions. It can be seen that the baseline of m/z 85 MCs of the three OS oil samples has obvious uplift (Figure 4). It shows that n-Alkane has been strongly biodegraded and a large number of UCM has been formed.
From the m/z 191 MCs of aliphatic hydrocarbon, the distribution characteristics of hopane and TT can be seen (Figure 5). The baselines of m/z 191 MCs of the three OS oil samples in the distribution range of hopanes are significantly raised, and C30H to C35H and 25 - norhopanes could not be detected, but C29H and Ga could be detected. On the one hand, it shows that the OS oil has experienced strong biodegradation, and hopanes are destroyed due to degradation (Bennett et al., 2006; Rullkötter and Wendisch, 1982; Seifert et al., 1984; Wang et al., 2010; Wenger et al., 2002); on the other hand, it shows that C29H and Ga have stronger anti-biodegradation ability than C30H to C35H and 25 - norhopanes. C19TT to C25TT of Sample YS-2 can be detected, but that of Sample YS-3 and Sample YS-1 cannot be detected. This shows that the biodegradation of Sample YS-3 and Sample YS-1 is more serious than that of Sample YS-2.
The distribution characteristics of regular steranes, diasteranes and pregnanes in OS oil can be seen from m/z 217 MCs of aliphatic hydrocarbons (Figure 6). In the distribution range of regular steranes and diasteranes, the baseline has obvious uplift. Compared with the SR samples without biodegradation, regular steranes are more difficult to identify and their relative contents are significantly reduced, which indicates that regular steranes have been subject to obvious biodegradation. Compared with C27-C28-C29 regular steranes, the relative contents of diasteranes in the three OS samples did not increase significantly, which indicates that diasteranes may also have been subject to biodegradation. The pregnane and homopregnane of the three OS samples can be detected well, which shows that the anti-biodegradation ability of pregnane and homopregnane is better than that of regular steranes and diasteranes. Compared with the TT of Sample YS-3 and Sample YS-1, it can be inferred that the anti-biodegradation ability of pregnane and homopregnane is better than that of TT.
From the m/z 231 MCs of aromatic hydrocarbons, the distribution characteristics of triarysteranes can be seen (Figure 7). Triarysteranes can be identified well in Sample YS-2, which shows that the biodegradation degree of triarysteranes is light. Some triarysteranes can be identified in Sample YS-3, which indicates that triarysteranes have been biodegraded. Triarysteranes could not be detected in Sample YS-1, which indicates that all triarysteranes have been consumed by biodegradation. It can be seen that the biodegradation order of the three samples from weak to strong is Sample YS-2, Sample YS-3 and Sample YS-1. By comparing the pregnane, homopregnane and triarysteranes of Sample YS-1, it is concluded that the anti-biodegradation ability of pregnane and homopregnane is stronger. By comparing the TT and triarysteranes of Sample YS-2, it is concluded that triarysteranes have stronger anti-biodegradation ability.
In a word, regular steranes, hopanes (no 25 - norhopanes formed after degradation) and diasteranes of Sample YS-2 have been biodegraded obviously, while TT, triarylosanes, pregnane and homopregnane have no obvious biodegradation; regular steranes, hopanes (no 25 - norhopanes formed after degradation), diasteranes and TT of Sample YS-3 have been biodegraded obviously, while triarylosanes have suffered slight biodegradation, and pregnane as well as homopregnane had no obvious biodegradation; regular steranes, hopanes (no 25 - norhopanes formed after degradation), diasteranes, TT and tricyclic of Sample YS-1 have been biodegraded obviously, while pregnane and homopregnane have suffered slight biodegradation.
On the one hand, the recognition shows that the degree of biodegradation of all OSs are very serious, and the order of biodegradation can be further identified from weak to strong as Sample YS-2, Sample YS-3 and Sample YS-1. On the other hand, it shows that the order of biomarker compounds with complete anti-biodegradation ability from weak to strong is speculated as: n-Alkane, i-Alkane, isoprenoid alkane, bicyclic sesquiterpene alkane, hopane (25 - norhopanes formed after degradation), sterane, hopane (25 - norhopanes not formed after degradation), rearranged sterane, TT, aromatic sterane, pregnane and homopregnane.
Source of OS oil
According to the degree of biodegradation, the relative contents of TT, aromatic sterane, pregnane and homopregnane can be used to analyze the source of OS oil. Bost et al. (2001) thought that in TT, except C20TT, the lower the carbon number, the easier the biodegradation. However, according to the distribution characteristics of TT in SRs and OS Sample YS-2 (Figure 5), the relative content of C20TT is lower than that of C21TT in severely biodegradable OS Sample YS-2, which is significantly different from most of the non-biodegradable SRs except for Samples 70 and 80, which shows that the TT distribution characteristics are mainly controlled by the source of crude oil and can be used for oil source comparison. The TT distribution of Sample YS-2 is similar to that of SR Sample 70 from P1f. The OS oil may come from the SRs of P1f. According to the distribution characteristics of pregnane and homopregnane in SRs and all OSs (Figure 6), the distribution characteristics of pregnane and homopregnane in Samples YS-2, YS-3 and YS-1 are similar, and they are only similar to those of SR Sample 70 from P1f. According to the distribution characteristics of triarysteranes in SRs and OS Sample YS-2 (Figure 7), the distribution characteristics of triarysteranes in OS Sample YS-2 are similar to those of SR Sample 70 from P1f, SR Sample 76 from P1j and SR Sample 80 from C. Based on the above biomarkers, it is considered that the OS oil may mainly come from P1f SRs.
The OCI can further determine the source of OS oil. The biodegradation experiment of crude oil has shown that (Atlas, 1981; Kennicutt, 1988; Stahl, 1980) light carbon isotope 12C was preferentially used by microorganisms, resulting in the enrichment of heavy carbon isotope 13C by residual saturated hydrocarbon. The addition of microbial degradation products resulted in the enrichment of light carbon isotope 12C by non-hydrocarbon and asphaltene, with almost no change in aromatics δ13C value, but little change in total oil δ13C value. In the process of biodegradation, the transfer of organic acid and carbon dioxide may be beneficial to the enrichment of heavy isotope 13C. Only the total oil carbon isotope δ13C values of the SR samples from P2w, P1f as well as P1j and the three OS samples were measured (Table 3). Due to the lack of samples, the results of previous carbon isotope tests of the SRs in the adjacent area were supplemented (Chen et al., 2016) (Figure 15). It is found that the δ13C values of P2w and P1f in the study area are similar to those measured by predecessors, while the δ13C values of P1j in the study area are obviously lighter. The δ13C values of the three OS samples are almost the same, indicating that they were from the same SR. These values are all distributed in the OCI range of P1f SRs, and they are obviously lighter than the OCI values of P2w and P1j SRs. This further proves that the OS oil came from P1f SRs. However, considering the carbon isotope fraction during the process of kerogen thermal degradation and hydrocarbon generation, this does not mean that P2w and P1f SRs have no contribution.
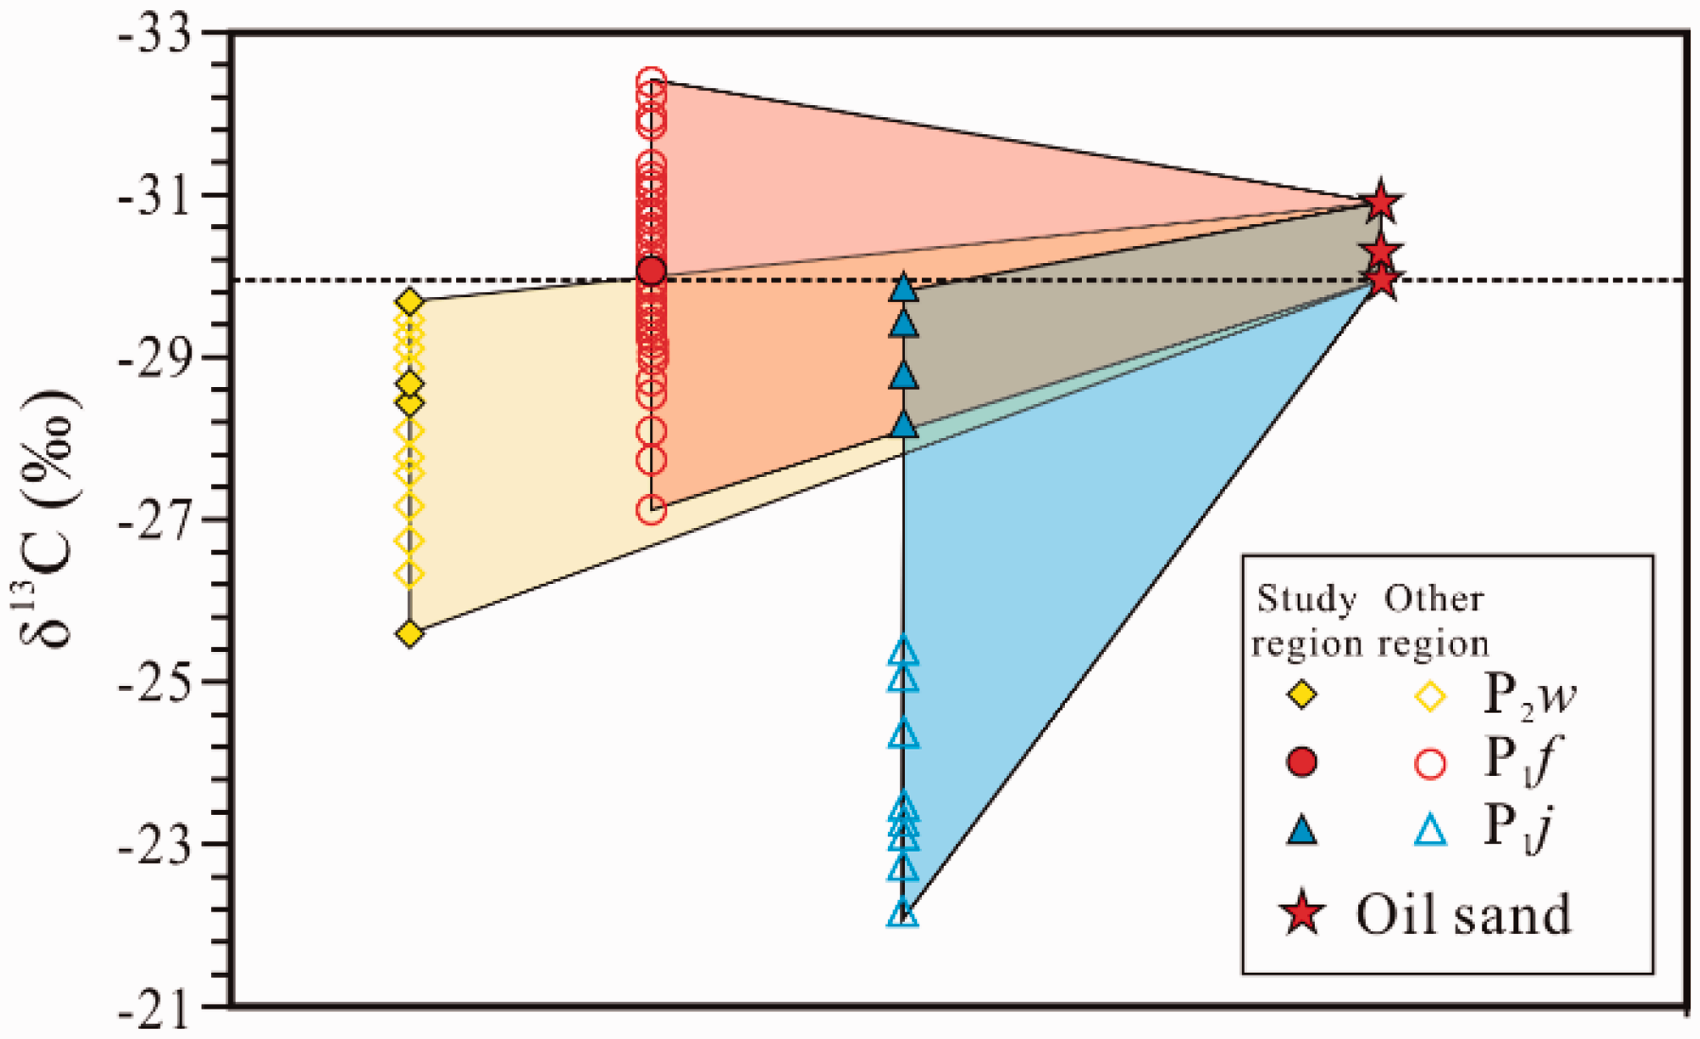
The δ13C values of other region are from Chen et al. (2016).
Conclusions
According to the organic geochemical characteristics of the SR samples from P2w, P1f, P1j, and C around Karamay: P1f SR is in high - over mature stage now, and the others are in the mature stage; C SRs are of Type Ⅱ kerogen with the largest OM abundance, and the P2w and P1j SRs are of Type III kerogen with the good and medium OM abundances; besides, a few of P2w and C SRs were formed in the fresh water oxidation and reduction environment respectively. All the SRs were formed in the water body of high salinity reduction environment.
According to the biomarker characteristics of OS samples from T2k and J1b around Karamay, it is concluded that all OSs have experienced a very serious biodegradation, and the biodegradation order from weak to strong is Sample YS-2, Sample YS-3 and Sample YS-1. It is speculated that the complete biomarker sequence of anti-biodegradation ability is: n-Alkane, i-Alkane, isoprene like alkane, bicyclic sesquiterpene alkane, hopane (25 - norhopanes formed after degradation), sterane, hopane (no 25 - norhopanes formed after degradation), diasterane, tricyclic terpanes, aromatic sterane, pregnane and homopregnane.
The biomarker characteristics of the OS oil samples in the surrounding area of Karamay are similar to those of the P1f SR samples. The OCI of the OS oil samples, which is distributed in the OCI range of the P1f SRs, is obviously lighter than the OCI of the SRs of P2w and P1j. It is speculated that the OS oil mainly comes from the P1f SRs.
Footnotes
Declaration of conflicting interests
The author(s) declared no potential conflicts of interest with respect to the research, authorship, and/or publication of this article.
Funding
The author(s) disclosed receipt of the following financial support for the research, authorship, and/or publication of this article: This work was supported by the Xinjiang Uygur Autonomous Region Scientific Research Program in Colleges and Universities (XJEDU2017I011), and the Innovative Talent Project of Karamay City, Xinjiang Uygur Autonomous Region, China (2020CXRC0002).