
Abstract
Shale oil reservoirs are usually developed by horizontal wells completed with multi-stage hydraulic fractures. The fracture interference between clusters in a single stage and between consecutive stages has an impact on the stimulation quality in terms of fracture geometries and fracture widths. This study introduces a non-planar hydraulic fracture model based on the extended finite element method and its use in quantifying the effects of relevant parameters on multi-stage fracture quality in a realistic shale oil scenario. The numerical model is validated with field diagnostics based on vertical seismic profiling. Relevant parameters including stress contrast, fracturing fluid viscosity, cluster density, and fracturing in consecutive stages are quantitatively analyzed in the numerical study. Results show that effects of stress contrast on fracture quality are greater than those of fracturing fluid viscosity, while the effects are more significant in outer fractures instead of the inner fracture. Denser cluster design leads to greater inhibition for the growth of inner fractures which eventually divert them transversely. In fracturing for consecutive stages, the opening of fractures in the subsequent stages is inhibited and the fracture geometries are also altered by the inter-stage interference caused by the previous stage. Based on field data and numerical modeling, this study identifies key parameters and quantifies their effects on inter-fracture and inter-stage interference in multi-stage hydraulic fracturing in horizontal wells.
Keywords
Introduction
Shale oil reservoirs are widely distributed globally in countries such as the United States, China, and Argentina (Kerr, 2010; Lindsay et al., 2018; Weijermars et al., 2017). They are important for the supply of hydrocarbons. Since the mobility of shale oil is not always the optimum, horizontal wells completed with multi-stage hydraulic fractures are usually employed to improve the production performance of shale oil. Thus, the effectiveness of the development of shale oil largely depends on the quality of hydraulic fracturing in horizontal wells. Hydraulic fracturing is related to key parameters including reservoir geomechanics, fracture mechanics, fracture fluids, and fracture design parameters (Guo et al., 2018; Hou et al., 2019; Weng, 2015). Therefore, to evaluate the efficacy of hydraulic fracturing in shale oil reservoirs, it is critical to conduct parametric investigation of relevant parameters so that the quantitative understanding of factors affecting hydraulic fracturing can be improved, and the proper modeling of hydraulic fracture propagation becomes important in this process (He et al., 2020).
Researchers have proposed mathematical models for the simulation of hydraulic fractures. The classic analytical fracture propagation models, the KGD model and the PKN model, calculate the two-dimensional planar fracture geometries and quantify the fracture width distributions (Geertsma and de Klerk, 1969; Khristianovich and Zheltov, 1955; Nordgren, 1972; Perkins and Kern, 1961). Other 2 D or 3 D models were then proposed to take into account the effects of in-situ stress, fracture flow and pressure gradient (Fung et al., 1987; Rungamornrat et al., 2005; Settari and Cleary, 1986). As the commercial development of shale gas reservoirs and shale oil reservoirs became pertinent, fracture models were extended to consider the fracture mechanisms in shale reservoirs (Wu and Olson, 2015a, 2015b). Advanced numerical methods including the displacement discontinuity method, the finite difference method, the finite element method, and the extended finite element method are employed for the numerical modeling of hydraulic fracture propagation processes in these unconventional reservoirs. One of the key characteristics for the simulation of fracturing in shale is the simultaneous growth of multiple fractures, as horizontal wells in shale reservoirs are usually completed with multi-clusters and multi-stages. Based on the displacement discontinuity theory, researchers indicated that the propagation pattern of hydraulic fractures can lead to complex fracture networks geometries, and the sequential propagation and simultaneous propagation strategies lead to various non-planar fracture paths (Guo et al., 2019a, 2019b; Olson and Wu, 2012; Wu and Olson, 2015a, 2015b). Cheng et al. (2017) then proposed a numerical model which considers the closure of hydraulic fractures in a multi-stage fracturing scenario. They concluded that sequential stimulation of individual fractures can lead to non-uniform propagation of fractures in a multi-stage case, and the fractures stimulated later on generally meet stronger resistance and are repelled by fractures propagated previously. Zhang et al. (2017) proposed a novel scheme that involves a hybrid discrete-continuum method to simulate the interaction between hydraulic fractures and pre-existing natural fractures, and they observed a positive correlation between the complexity of pre-existing natural fractures and the complexity of propagated hydraulic fractures. Tang et al. (2018) and Tang et al. (2019a, 2019b) derived a displacement-discontinuity based fracture model for the investigation of non-orthogonal and orthogonal interactions between hydraulic fractures and weak bedding planes, and they quantified the influences of parameters including pumping rate, elastic modulus, and stress contrast. Phase-field was employed by Lee et al. (2018) to calculate a four-field problem of pressure, saturation, phase-field-displacements, and fracture width, where fixed-stress splitting was used in the coupling of the flow problem and the solid problem. Huang and Liu (2018) introduced a three-dimensional planar fracture model considering water loss, vertical water flow and bedding plane effects.
Based on fracture modeling techniques, researchers noted that the mechanical interference induced between fracture clusters and fracture stages is not negligible and can affect the efficiency of hydraulic fracturing along horizontal wells. Roussel and Mukul (2011) introduced a study to understand the fracture mechanism for the stimulation of a horizontal well, and discussed on the selection of minimum fracture cluster spacing with the guarantee of insignificant inter-fracture spacing. Wu et al. (2017) then proposed a numerical model to analyze how to obtain evenly propagated hydraulic fractures during a multi-fracture stimulation. Their work offers insights on how to control the inter-fracture mechanical interference and how to mitigate stress shadow. Safari et al. (2017) presented a parametric study for stress anisotropy, fluid mobility, pore pressure, and Biot constant and they identified the optimal design parameters in a field case based on the parametric study. Guo et al. (2018) numerically analyzed the effects of in-situ stress evolution, number of fracture clusters, and the timing of hydraulic fracturing on the resulting fracture network and provided an optimization scheme to improve the contact area between the shale reservoir and fractures. Both Safari et al. and Guo et al. treated the production of existing wells as a key factor. Tang et al. (2019a, 2019b) quantified the stress interference between simultaneously propagated fractures using a three-dimensional displacement discontinuity model and identified cluster spacing and fracture shapes as the controlling parameters. Then, Qin et al. (2019) proposed a well-test model to quantify the fracturing interference between wells and hydraulic fractures, which can be used to analyze the magnitude of inter-fracture interferences in hydraulically fractured wells.
Many efforts have been put into the numerical investigation of simultaneous growth of hydraulic fractures, while it lacks a field-case-based numerical investigation of both inter-cluster and inter-stage fracture interference and the corresponding parametric study quantifying impacts of relevant factors. This study introduces a non-planar fracture propagation model based on the extended finite element method (XFEM) and its use in a parametric study identifying the critical parameters affecting the fracture geometries in single-stage and multi-stage fracturing in a realistic shale oil case in Northwestern China. The numerical model is validated against field diagnostics and sensitivity analyses are then carried out for the parametric study. This study presents a quantitative understanding of parametric impacts on stress interference induced by hydraulic fracturing and provides insights on the optimization of fracturing-related parameter design in the development of shale oil resources.
Methodology
Since this study is targeted at the modeling of simultaneous growth of hydraulic fractures within a stage and in stages sequentially stimulated, it is important to consider the coupled problem of fracture fluid transport, rock deformation, and rock failure.
In solid mechanics, rock deformation can be expressed by the momentum balance using a Cauchy stress tensor:

The linear elastic relationship based on the stress-strain constitutive equation is written as:

The strain tensor in equation (2) can then be equated to the arithmetic mean of the symmetric gradient of the displacement tensor:

The boundary condition for the rock deformation problem is exerted on three boundaries: the stress boundary for external tractions, the pressure boundary for fracture fluid flow, and the displacement boundary. They are presented respectively:


Based on the Griffith theory, the Mode I fracture considering the Irwin’s modification of
Except for the solid mechanism and fracture mechanism, it is also important to incorporate the fracture flow in the one-dimensional domain for hydraulic fractures. Since the path for the fracture flow meets the requirement that
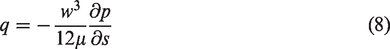
Based on the Poiseuille’s Law, the relationship between pressure, flow rate, and the location in the arc coordinates for hydraulic fractures can be expressed as
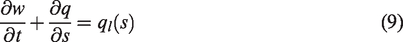
The mass conservation for fracture flow is formulated as

Combining with the Poiseuille’s equation, the mass conservation equation can be extended to
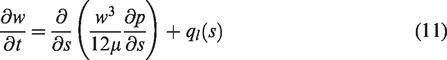
Thus, the fluid transport within hydraulic fractures and the fluid leak-off from fractures to the matrix can be computed.
When there are multiple hydraulic fractures with simultaneous growth, the frictional loss for fluid pressure cannot be neglected. The frictional loss exists in the wellbore, at the perforations, and in the near-well regions, which affects the distribution of wellbore pressure and fluid flow distributions among different fractures. The frictional loss for pressure is presented as

The boundary condition for the fluid flow can be prescribed as:


The governing equations for the coupled problem of fracture fluid transport, rock failure, and rock deformation in hydraulic fracturing are presented above. Since the fracture mechanism is essentially involved with discontinuities, the extended finite element method (XFEM) is used in the numerical solution of these equations as it can efficiently deal with such discontinuity problems (Medinas, 2015; Salimzadeh and Khalili, 2015). The XFEM discretization of the solid problem can be represented as

Finite element methods are used to obtain numerical solutions for the fluid flow in the fractures. The flow is treated as the combination of the tangential flow which is within the fracture elements and the normal flow across the fracture element surfaces. The weak form of the fracture flow can be represented as

Field data for the study area
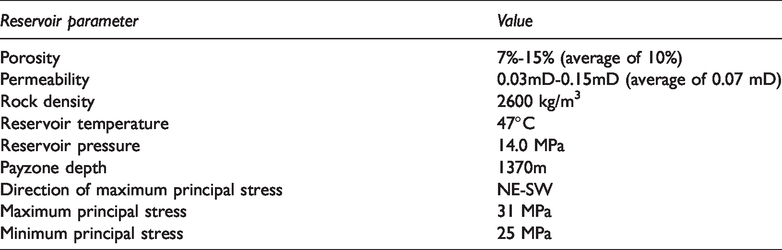
The Jimsar Field is in Jimsar County, Xinjiang in northwestern China. It is located around 100 km to the east of the provincial capital of Urumqi. Jimsar Field is one of the first Chinese shale oil plays under commercial development and a successful pilot study is critical and meaningful for future development in this area. The areas of interest in this study are located on the East slope of the Jimsar Sag in the Junggar Basin. Major payzones investigated in this hydraulic fracturing study are identified in a Permian Formation with a thickness of 15 m and the buried depth is 1370 m. The specific location of the study area is shown in Figure 1 and the typical reservoir properties are recorded in Table 1. Figure 2 presents the geological background of the study area and the lithology of the Permian formation is shown in Figure 3. It is indicated that the fault regime is reverse fault and the target formation is the Upper Permian Wutonggou Formation.
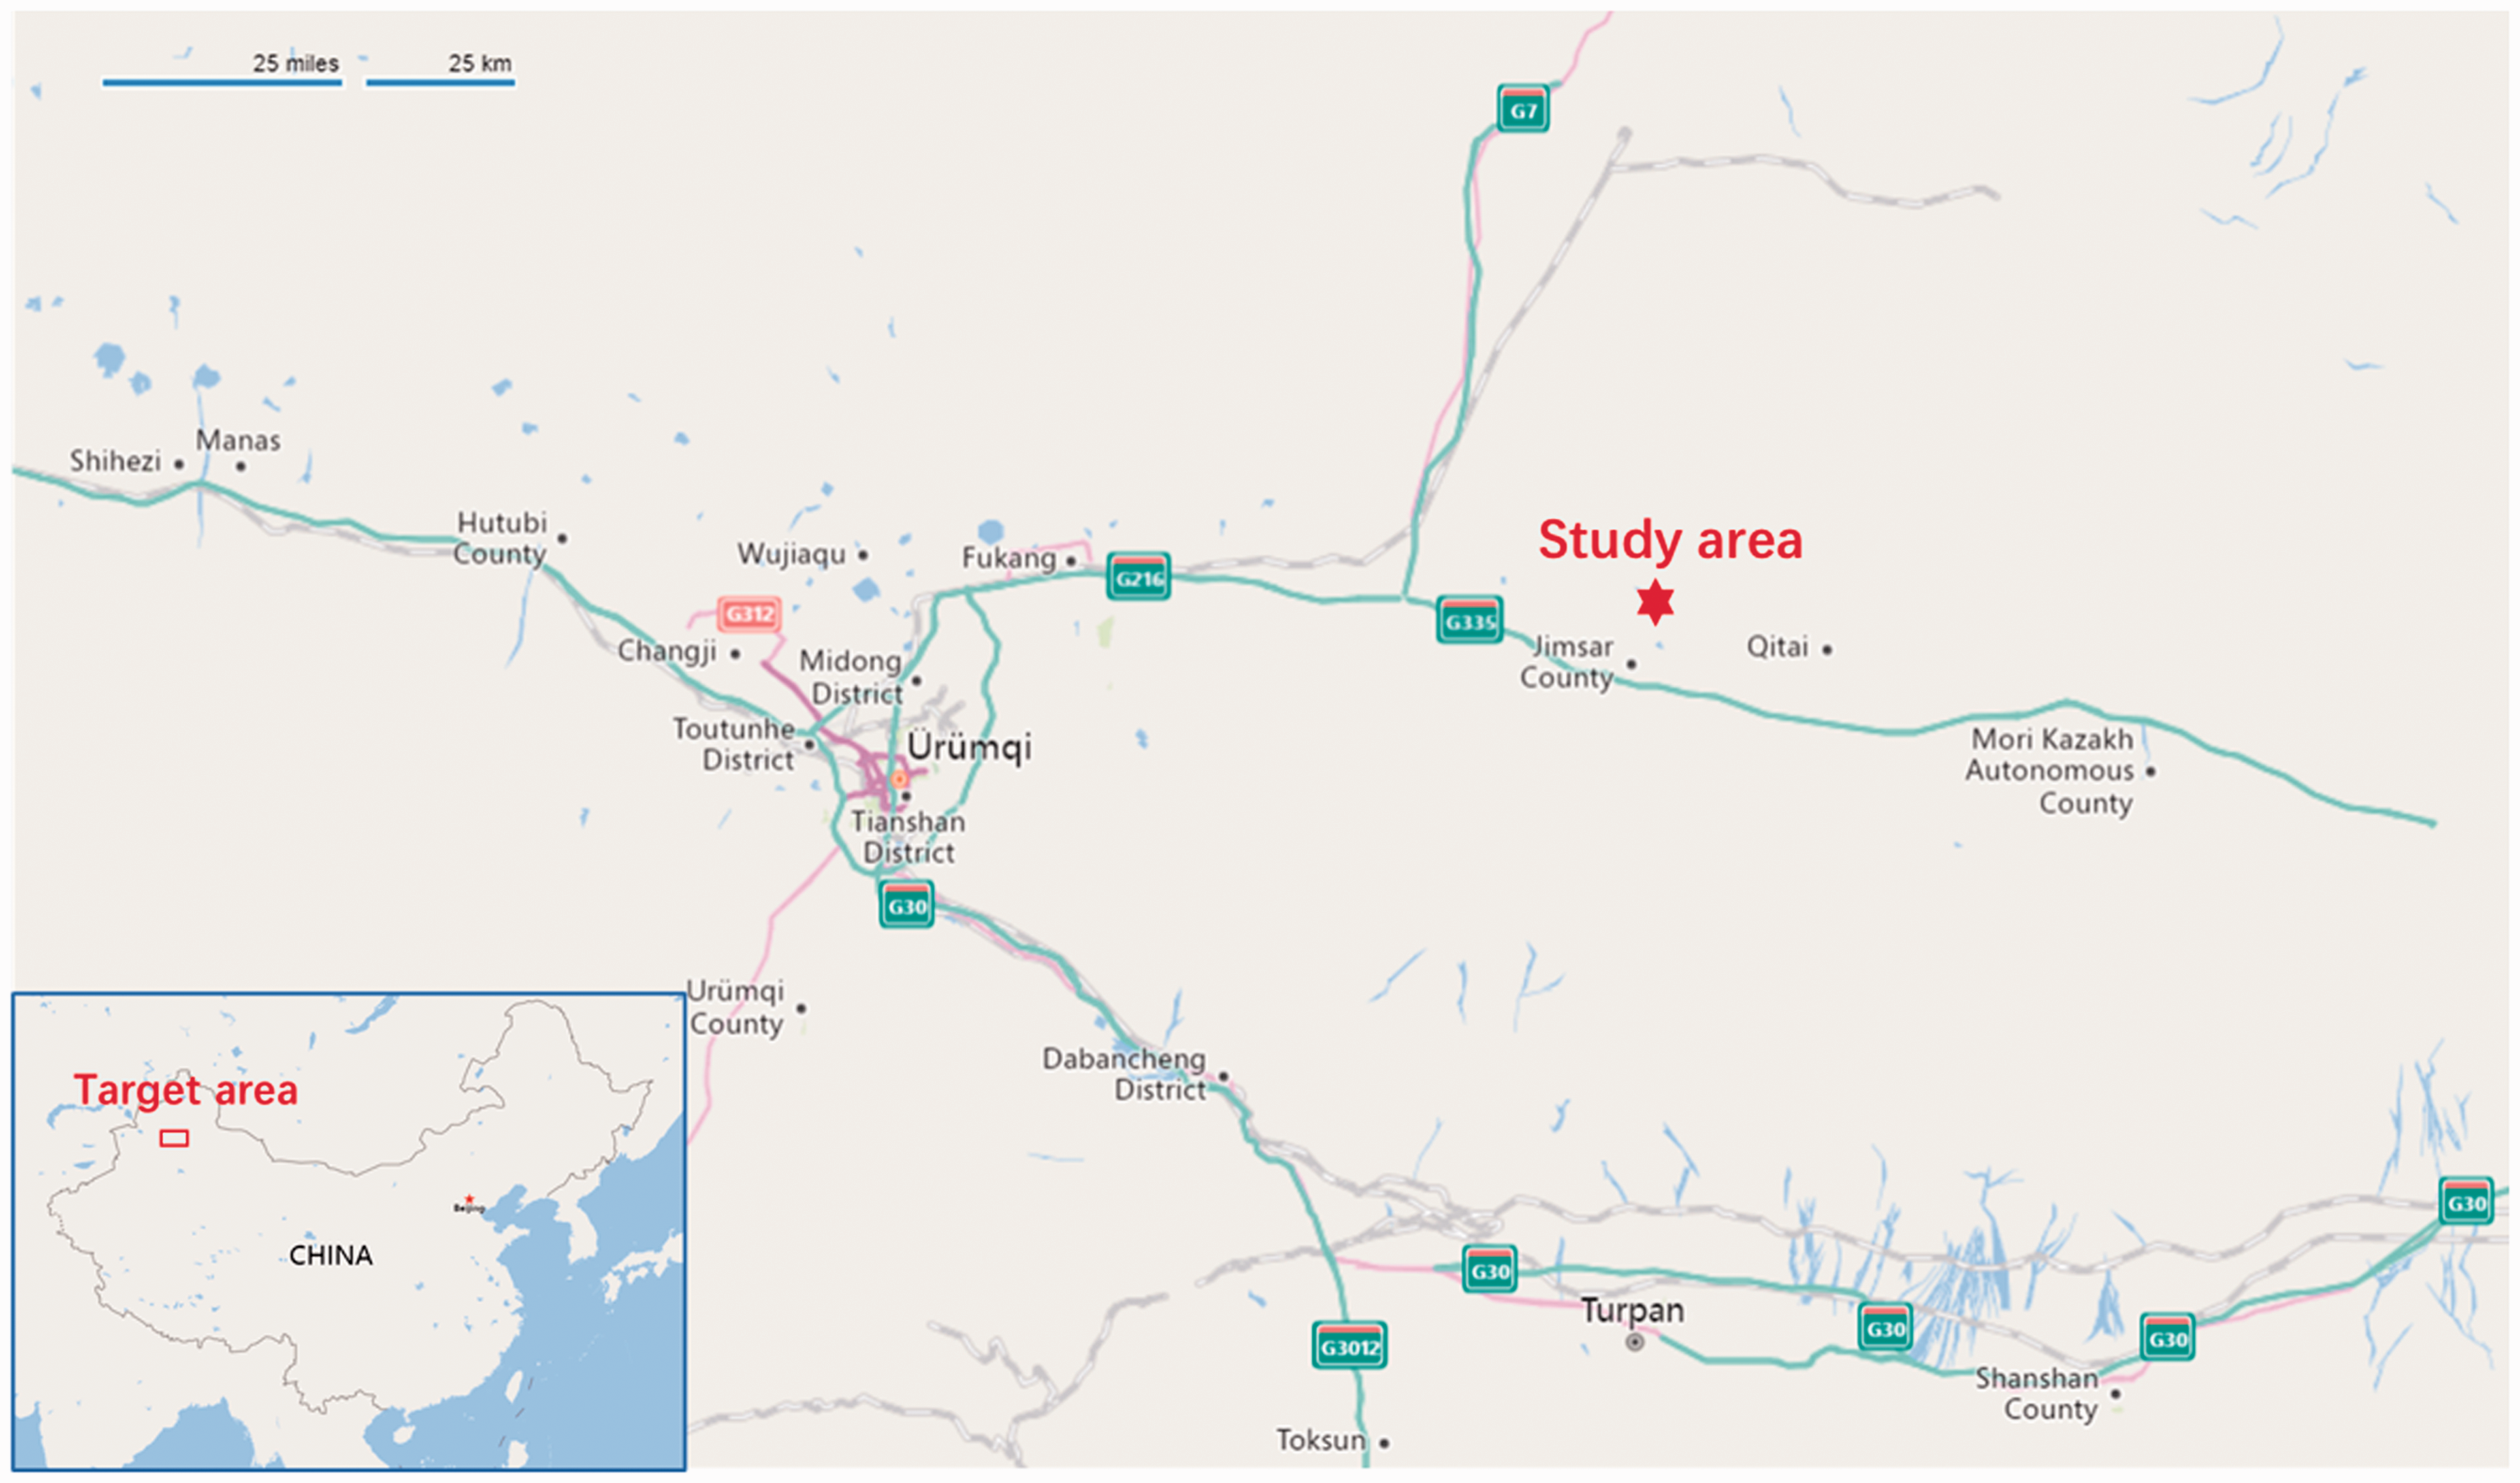
The geographical location of the study area (Microsoft Corporation and Navinfo, 2020).
Reservoir parameters of the payzone.
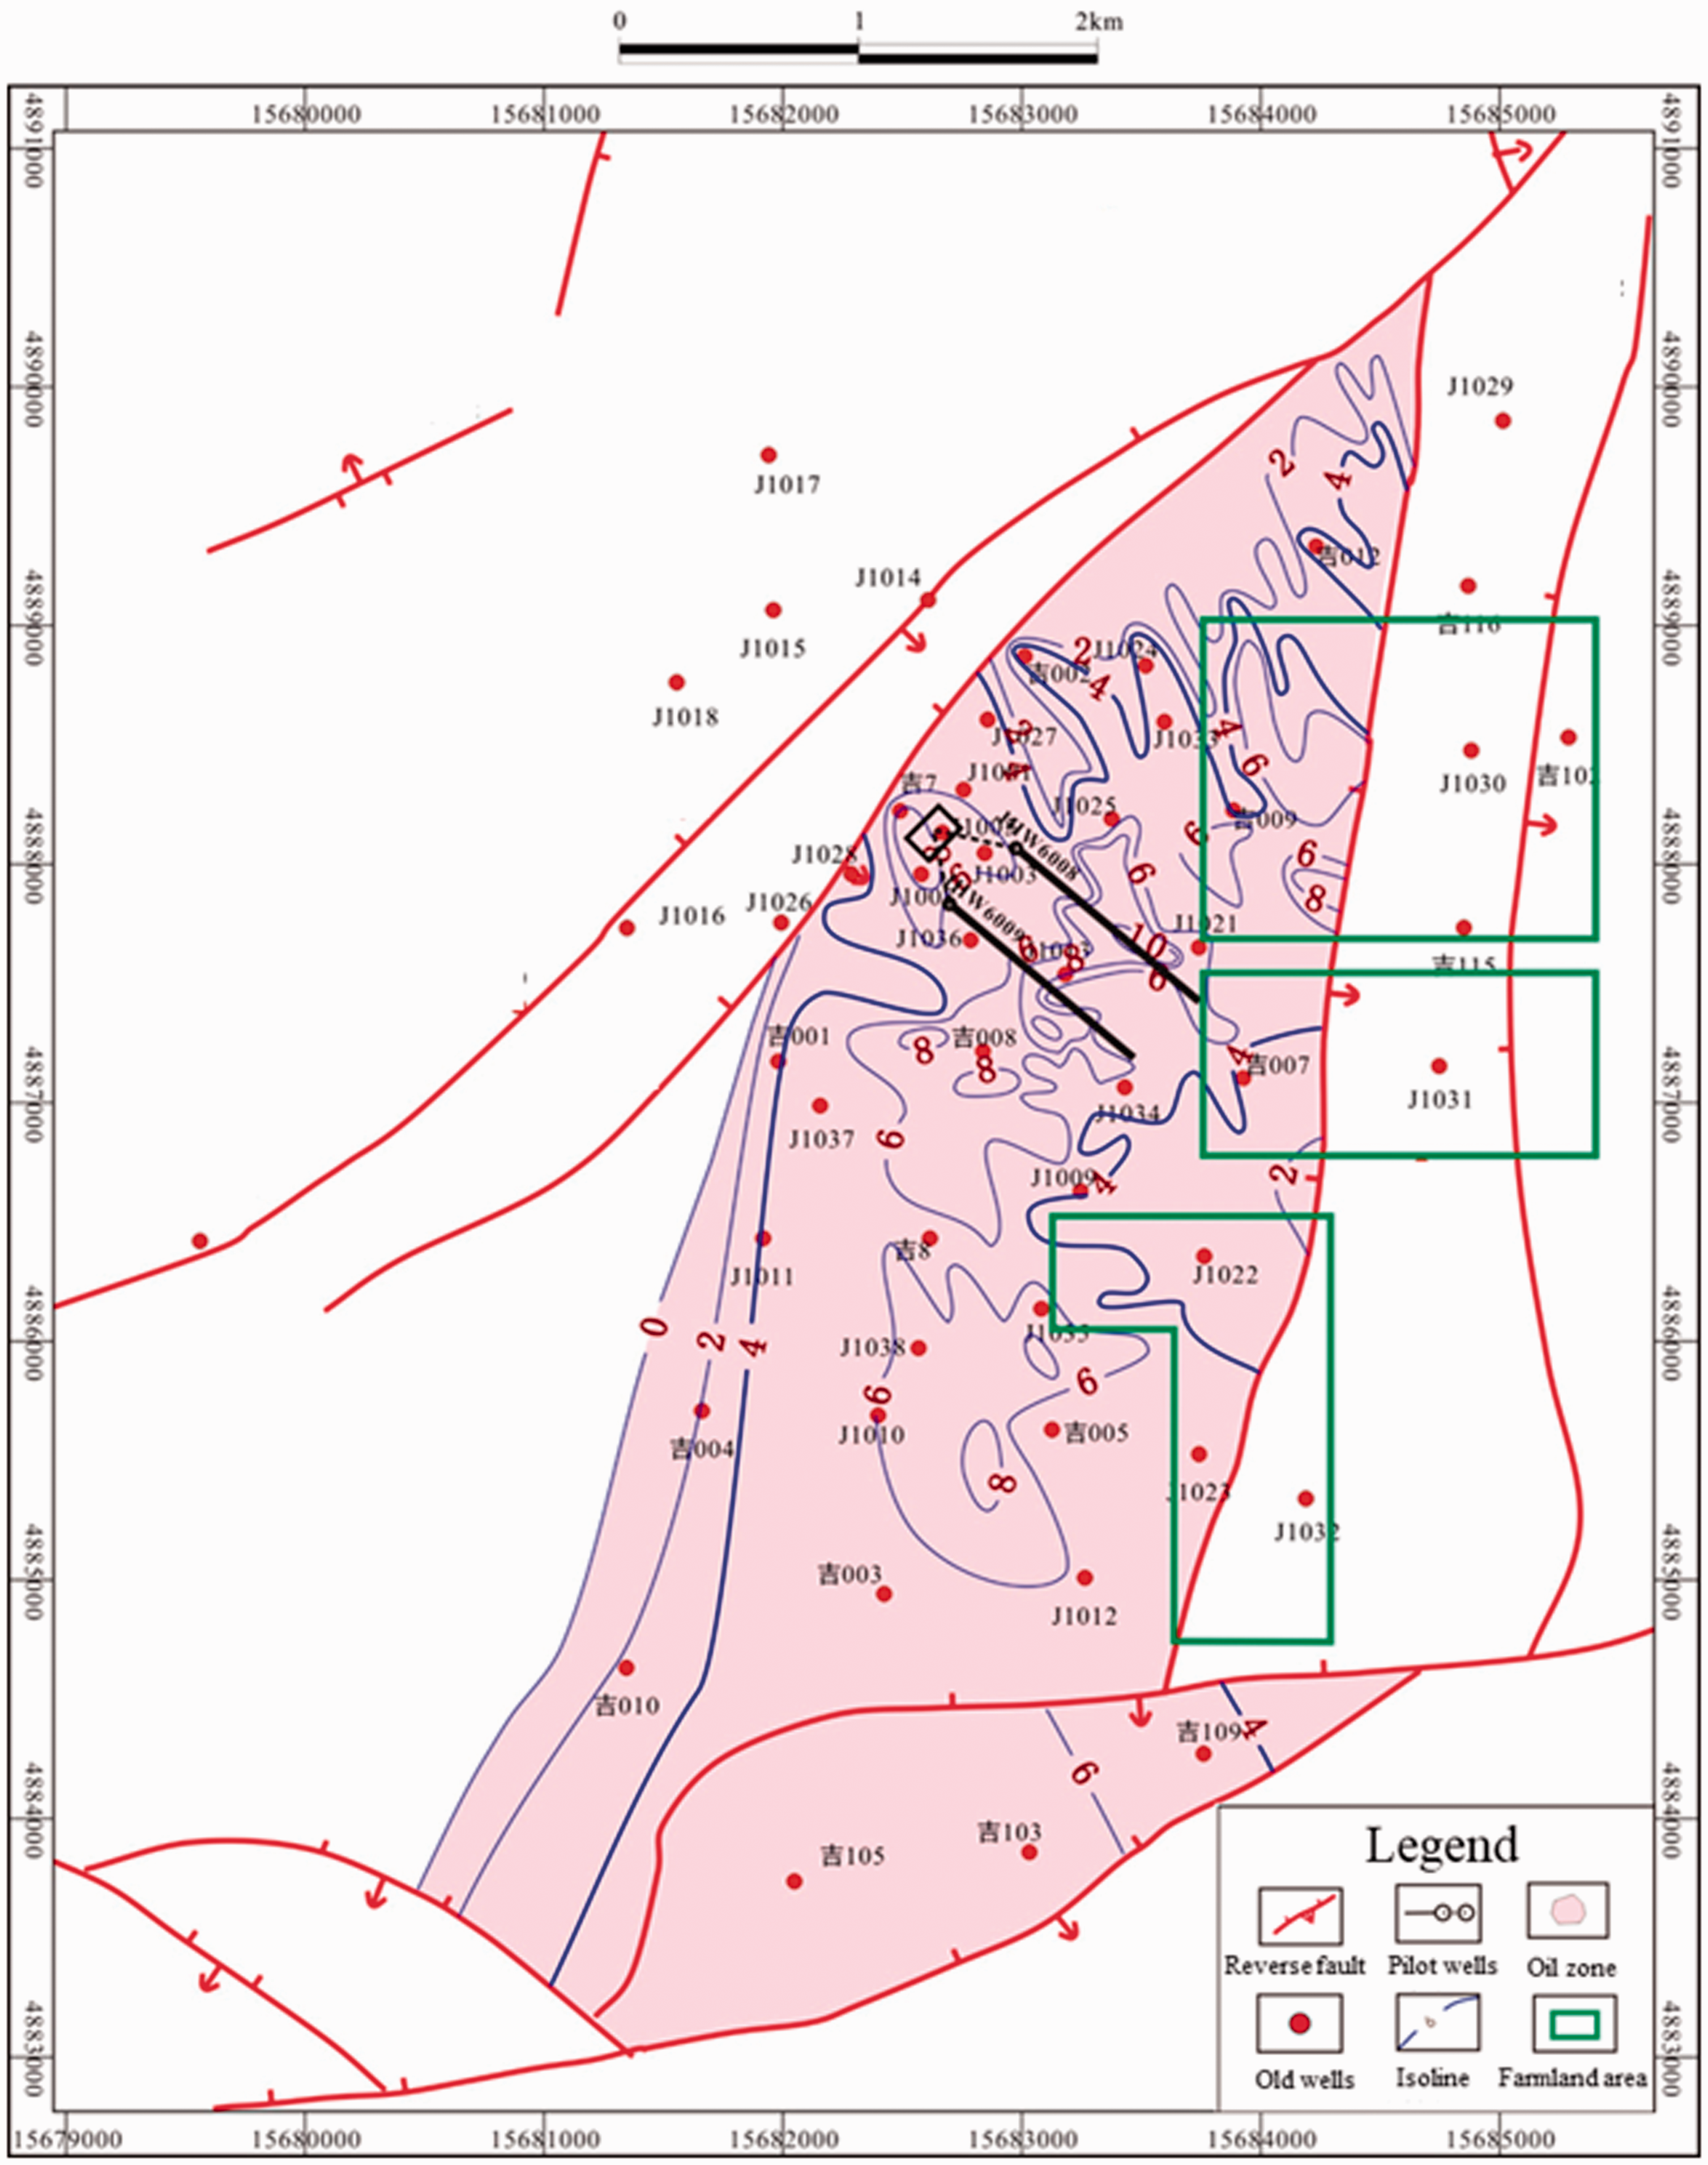
Geological map of the study area.
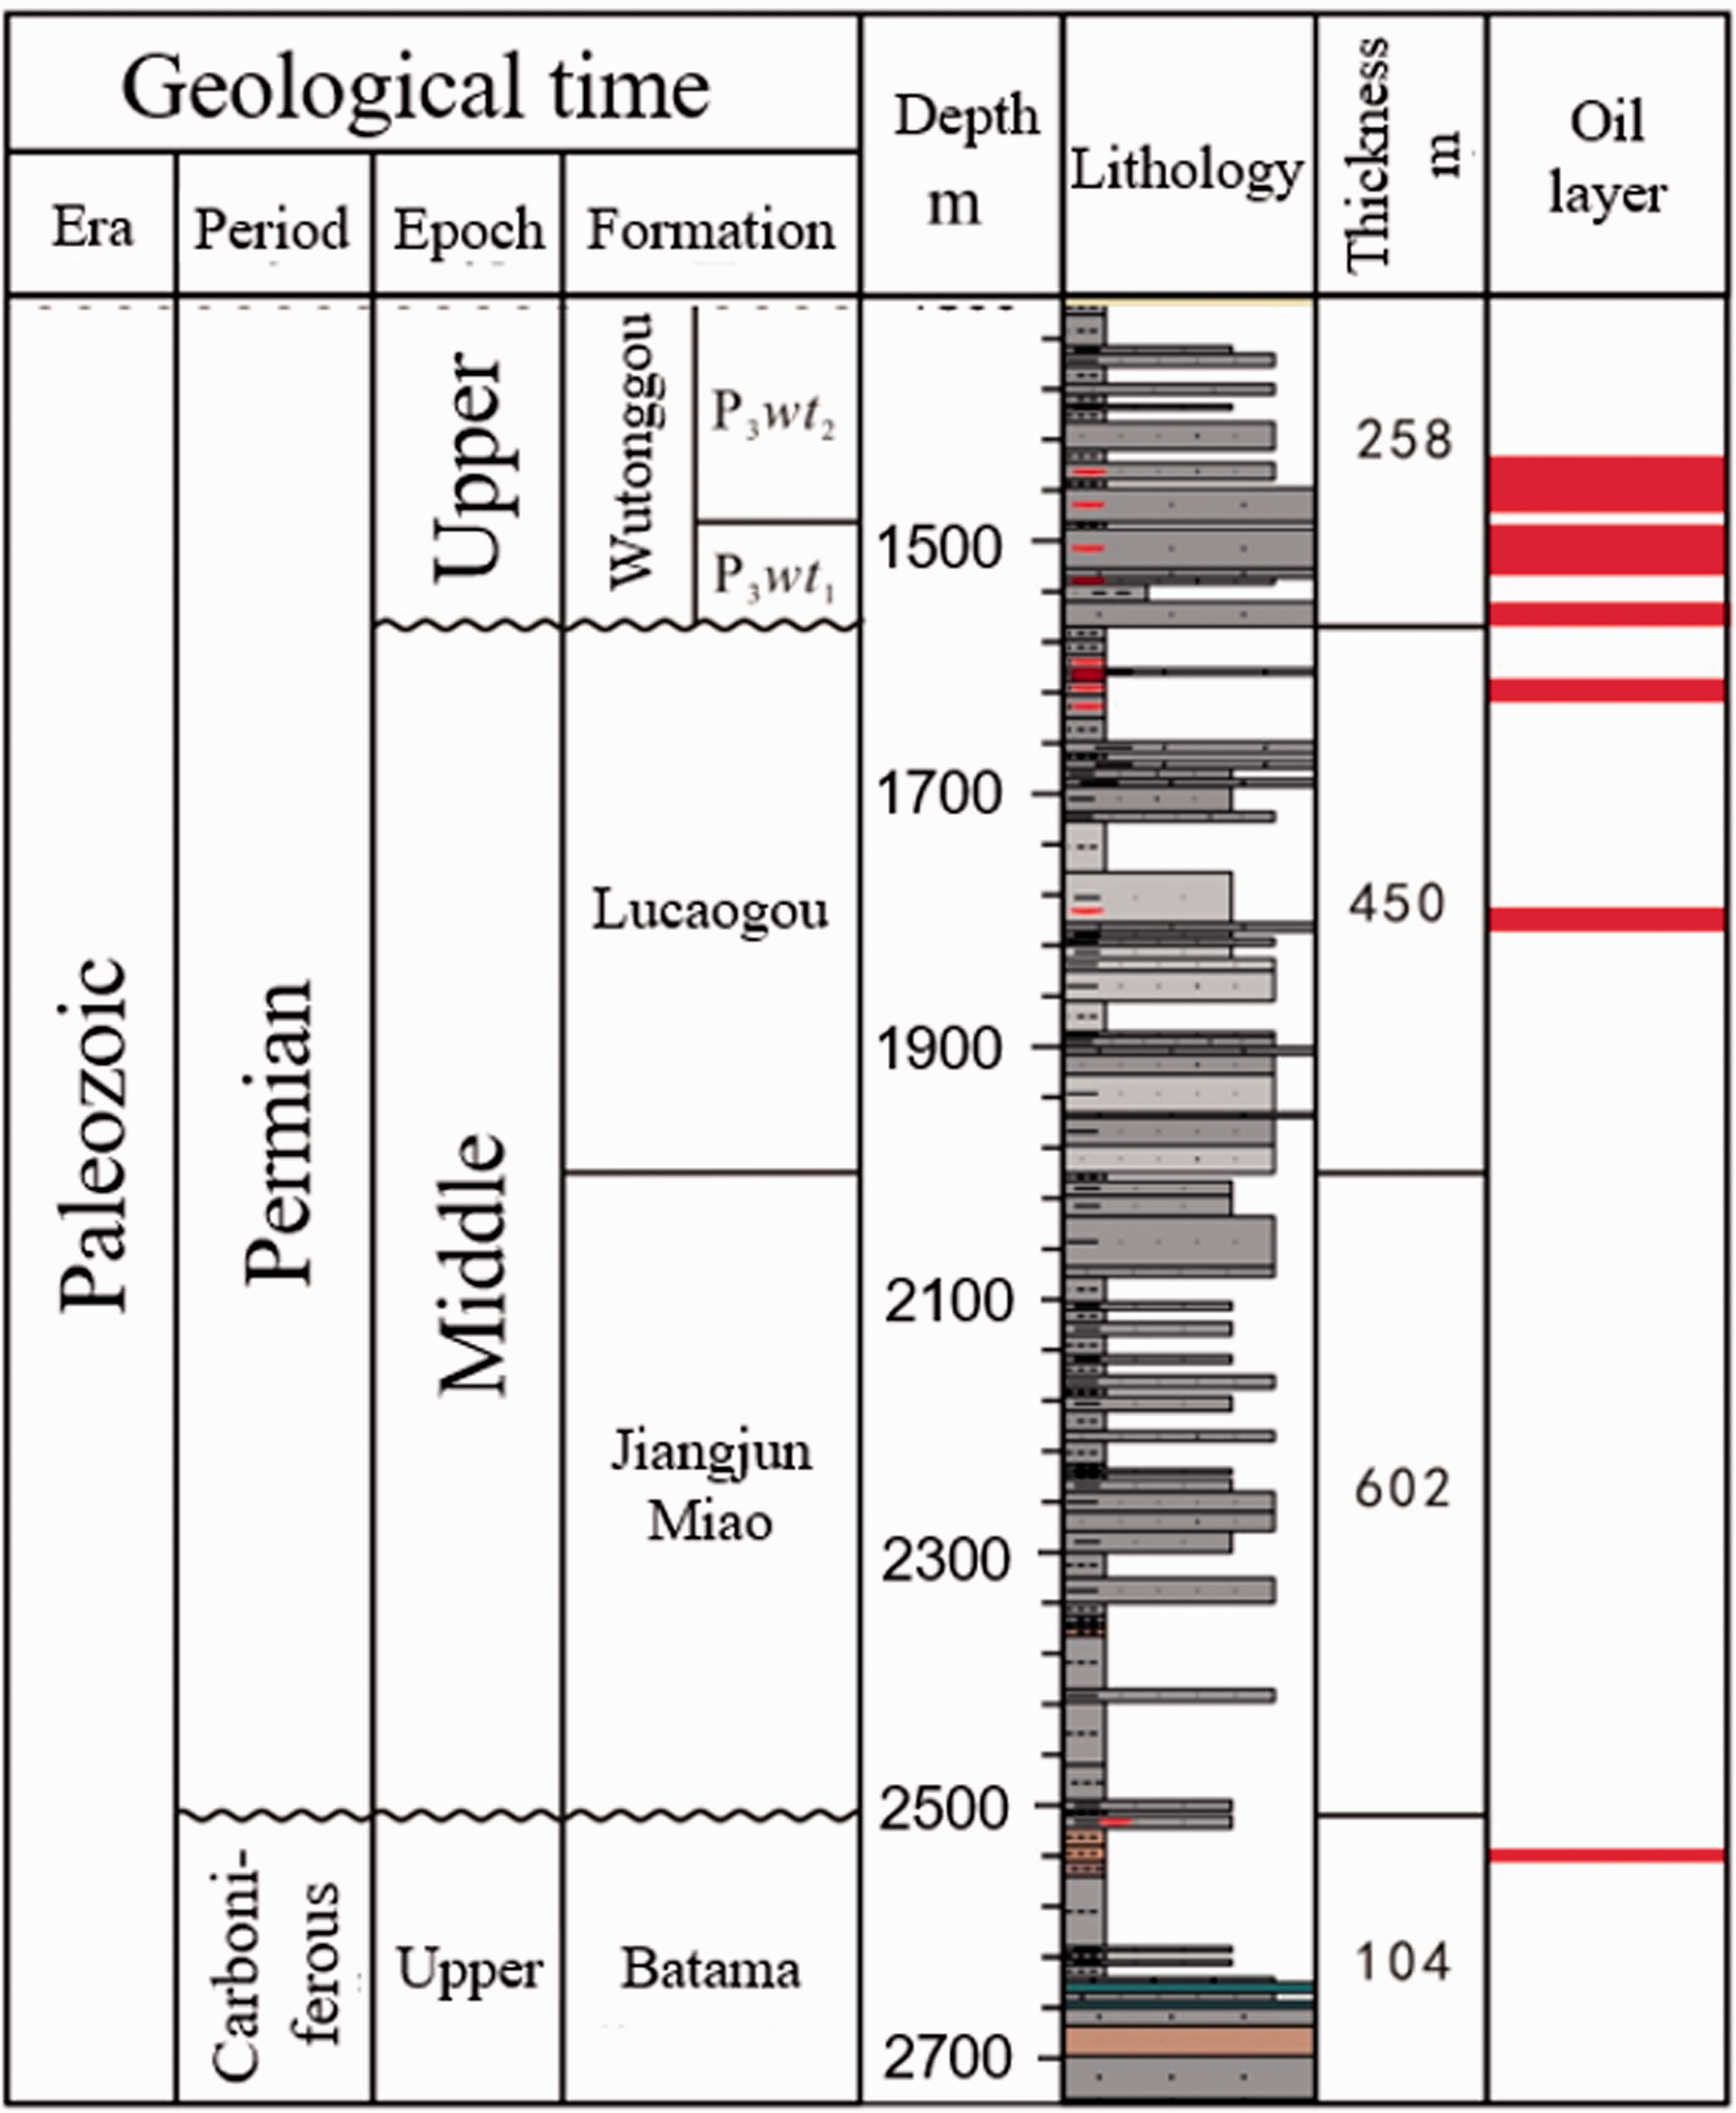
Lithology of the formation in the study area.
The principal stresses recorded in Table 1 are obtained from the comprehensive evaluation of lab measurements and log interpretation. First, lab measurements for in-situ stresses are carried out based on the Kaiser effect (Holcomb, 1993), where the in-situ stress state at depth of 1370 m is measured. Then, rock mechanical interpretation of the acoustic logs, Gamma ray logs, caliper logs, and density logs is conducted to provide the analysis of the vertical profile of in-situ stresses.
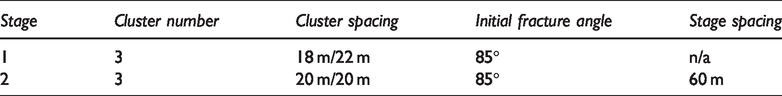
A pilot horizontal well was drilled and completed in the payzone. The logs and the related rock mechanical interpretation are shown in Figure 4, where GR represents gamma ray logs; CALI represents caliper logs; SP represents spontaneous potential logs; RI represents the resistivity index; RXO represents the resistivity of the invaded zone; RT represents the resistivity of the uninvaded zone; DEN is the density log; AC is the acoustic log; CNL is the compensated neutron log. They indicate that there is a certain magnitude of heterogeneity in elastic parameters such as Young’s modulus and Poisson’s ratio. There are totally 11 stages and 31 clusters which are not strictly uniformly distributed along the wellbore. The average stage spacing is 59 m and the average cluster spacing is 20.5 m. The first and second stages of the multi-stage fracturing job are analyzed in this study and their design parameters are in Table 2. Each stage has three clusters with cluster spacings around 20 m and the spacing of these two stages is 60 m. The angle between the initial fractures and the horizontal wellbore is 85° which is often used in fracture simulation (Roussel et al., 2013; Safari et al., 2017). The recorded pumping schedule and pressure for the fracturing of stages one and two are presented in Figure 5.
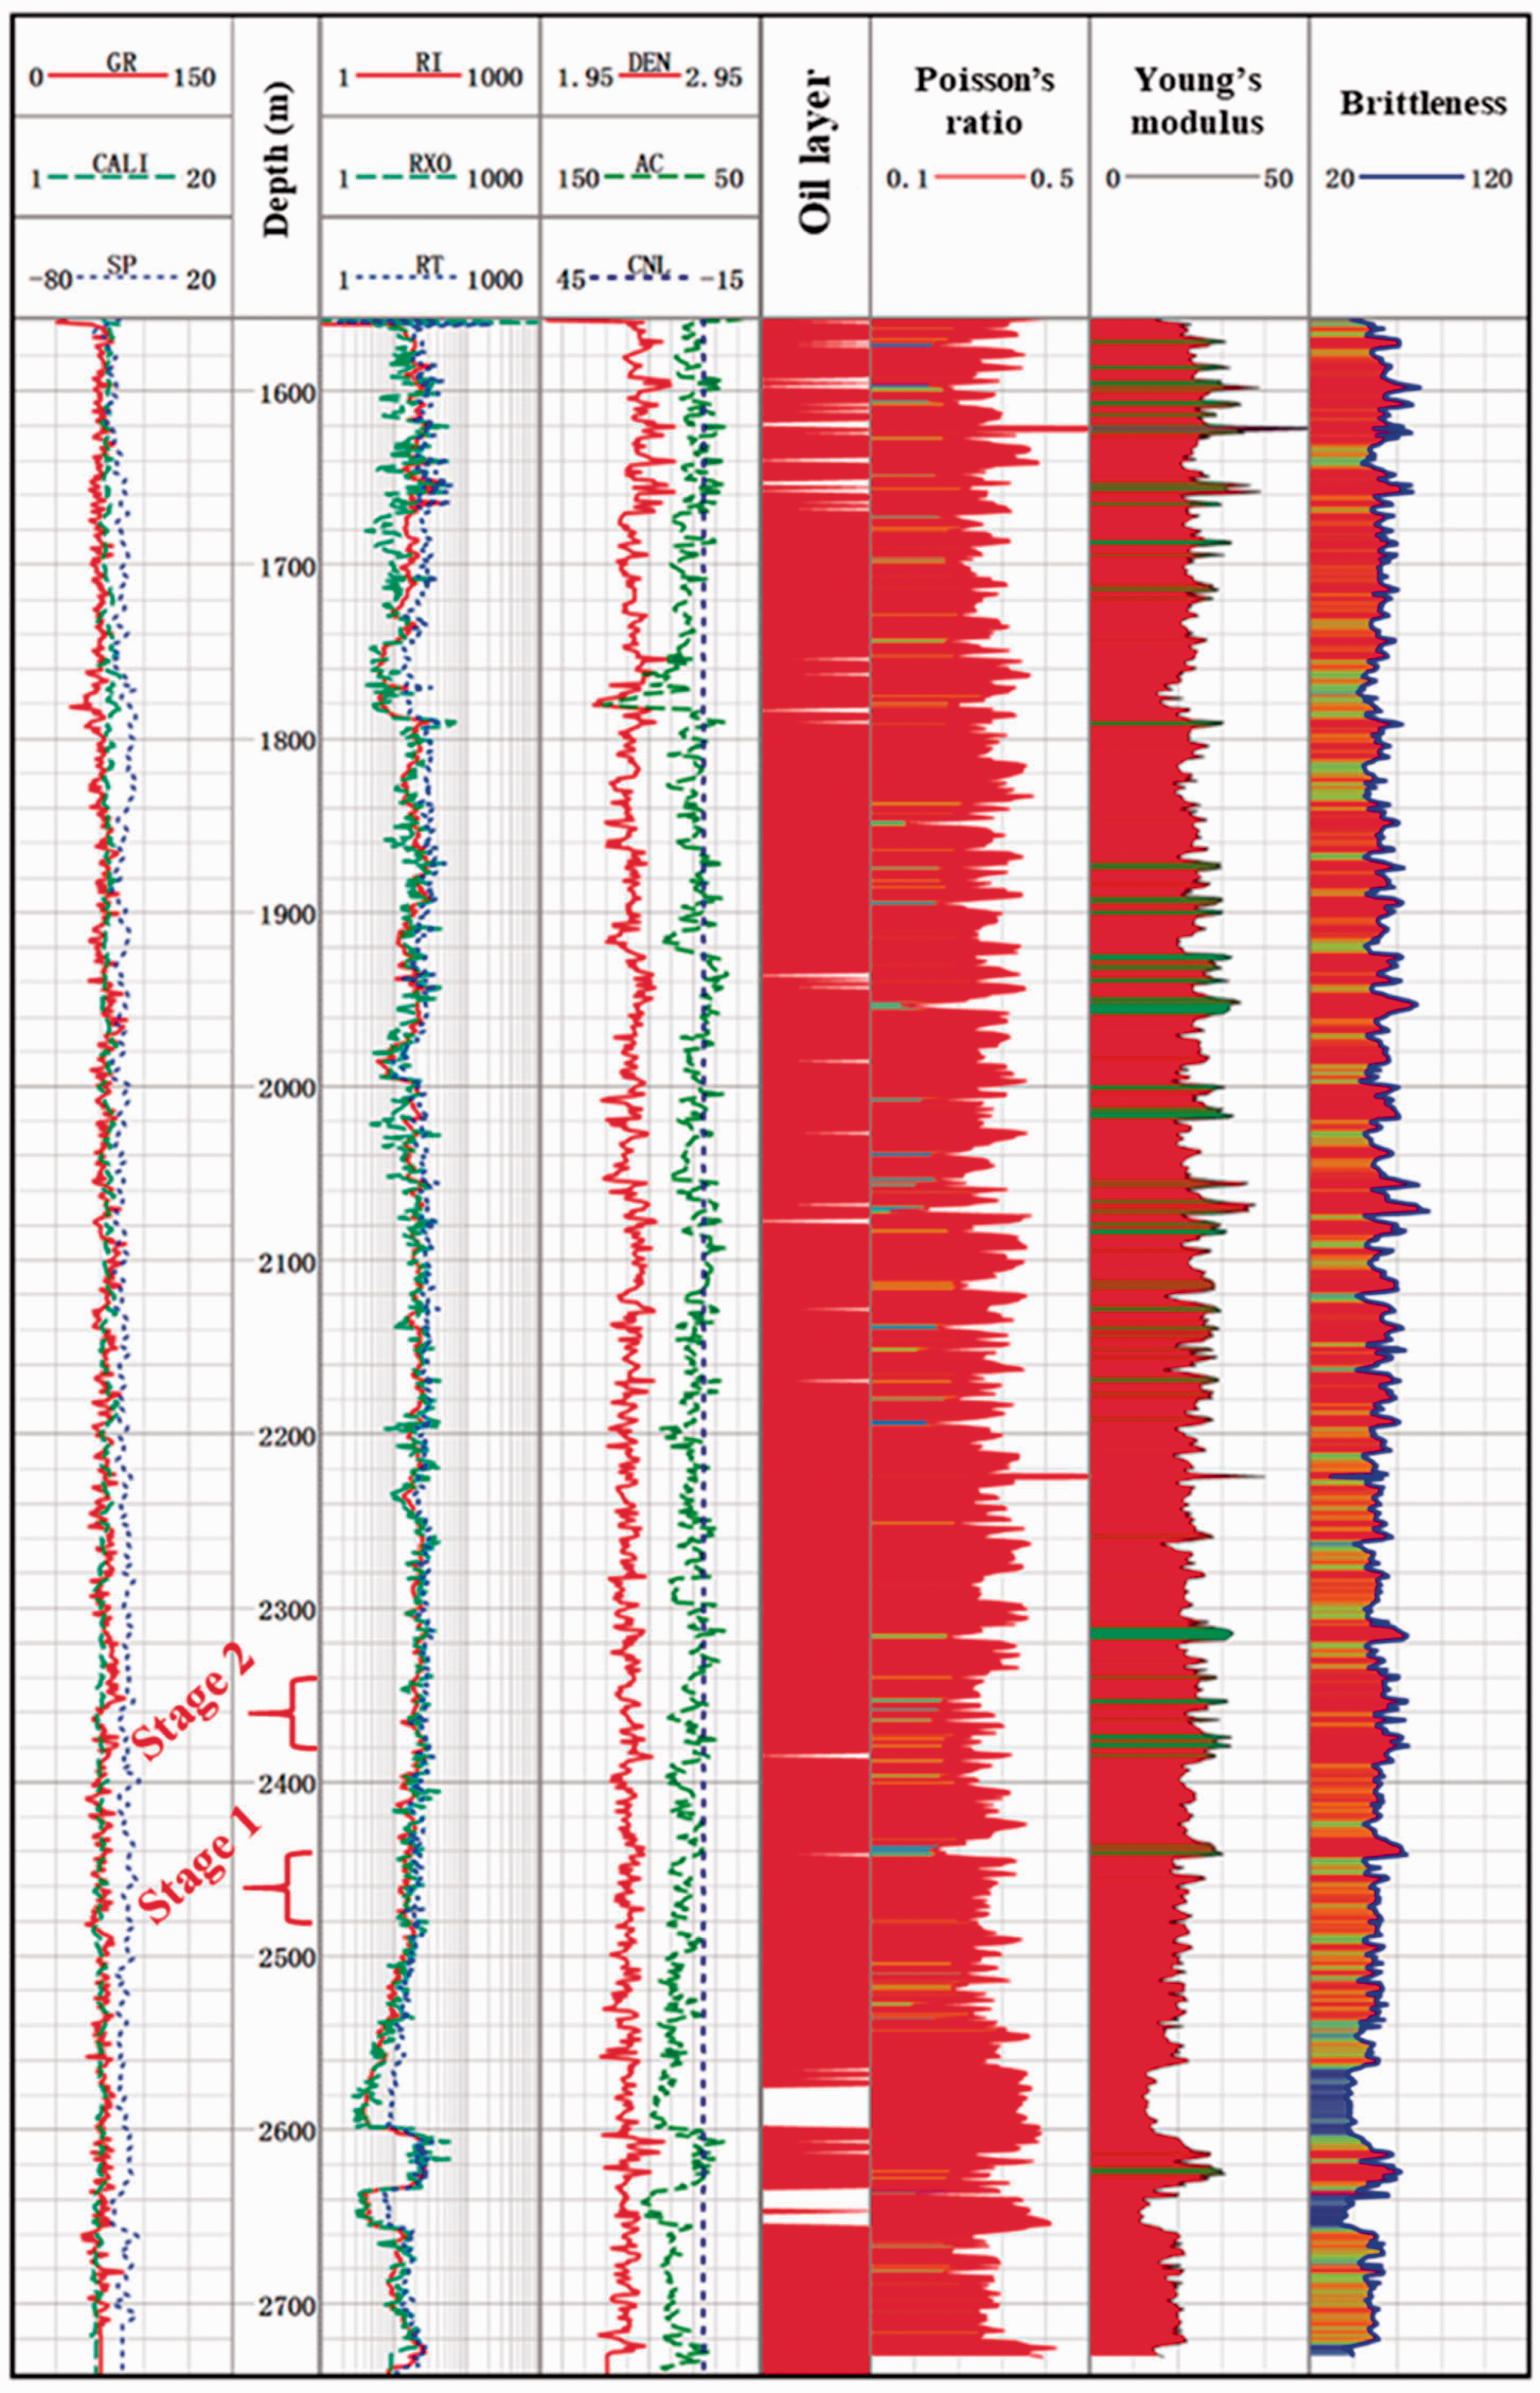
Logs and rock mechanical interpretation for the Jimsar horizontal well.
Design parameters for stage 1 and stage 2 in hydraulic fracturing.
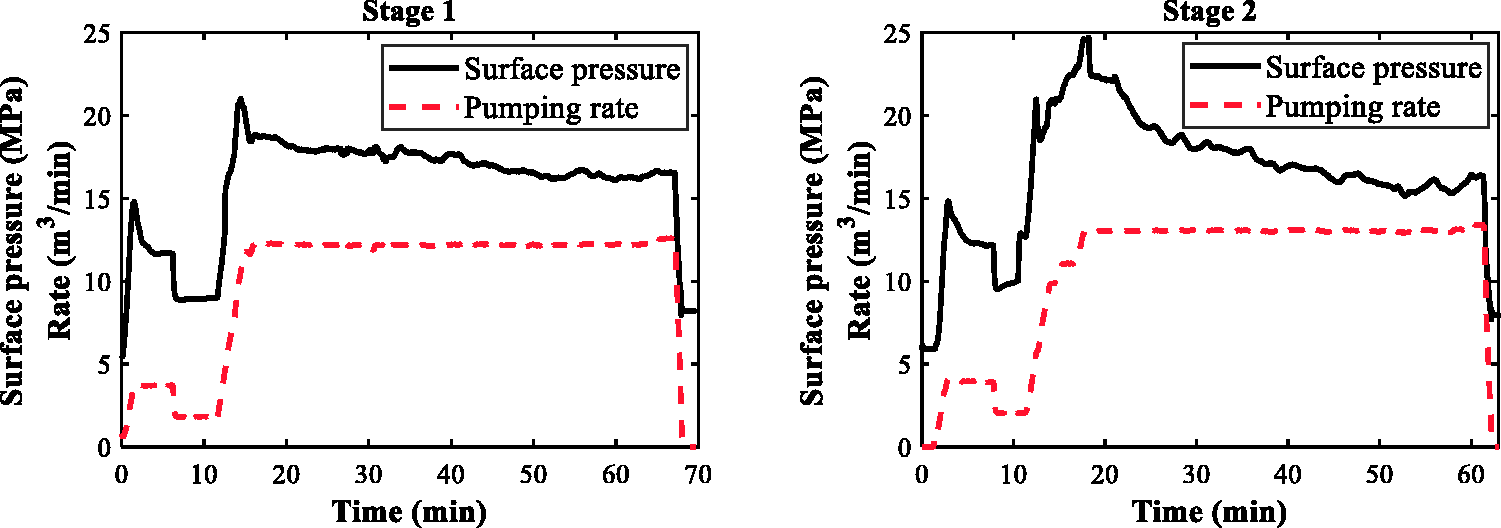
Recorded pumping schedule and surface injection pressure for stages 1 and 2.
Numerical study and discussion
Two sets of numerical analyses are carried out to quantify the effects of relevant parameters on hydraulic fracturing quality in Jimsar shale oil. First, a sensitivity analysis is presented for the effects of fracturing fluid viscosity, stress contrast, and the number of clusters for inter-fracture interference in a single stage. Then, a two-stage study is conducted to quantify the effects of sequential fracturing of multiple stages on fracture quality. Therefore, the mechanical interference between simultaneously grown fractures within a stage and between stages in a multi-stage fracturing scenario can be quantified.
Base case
Based on the aforementioned field parameters, a base case for the hydraulic fracturing study is presented. In the base case, a single stage hydraulic fracture simulation is conducted with three clusters as from field data for stage 1. The pumping schedules and reservoir parameters are also from the field data presented above. Figure 6 shows the final fracture paths propagated from three clusters in the base case. The half lengths of two fractures on the left and on the right are longer than the inner fracture because the stress shadow effects have a negative impact on the growth of the fracture at the center. Non-planar growth is also demonstrated as the simulation considers the effect of mechanical interference in the simultaneous fracture propagation. It is also noted that the geometry of the fractures is not strictly symmetrical as the field design for cluster spacing is not uniform and the reservoir parameters along the horizontal wellbore are not strictly uniform. The left fracture is shorter than the right fracture as the spacing between the left and central fractures is closer, indicating a greater inter-fracture stress interference.
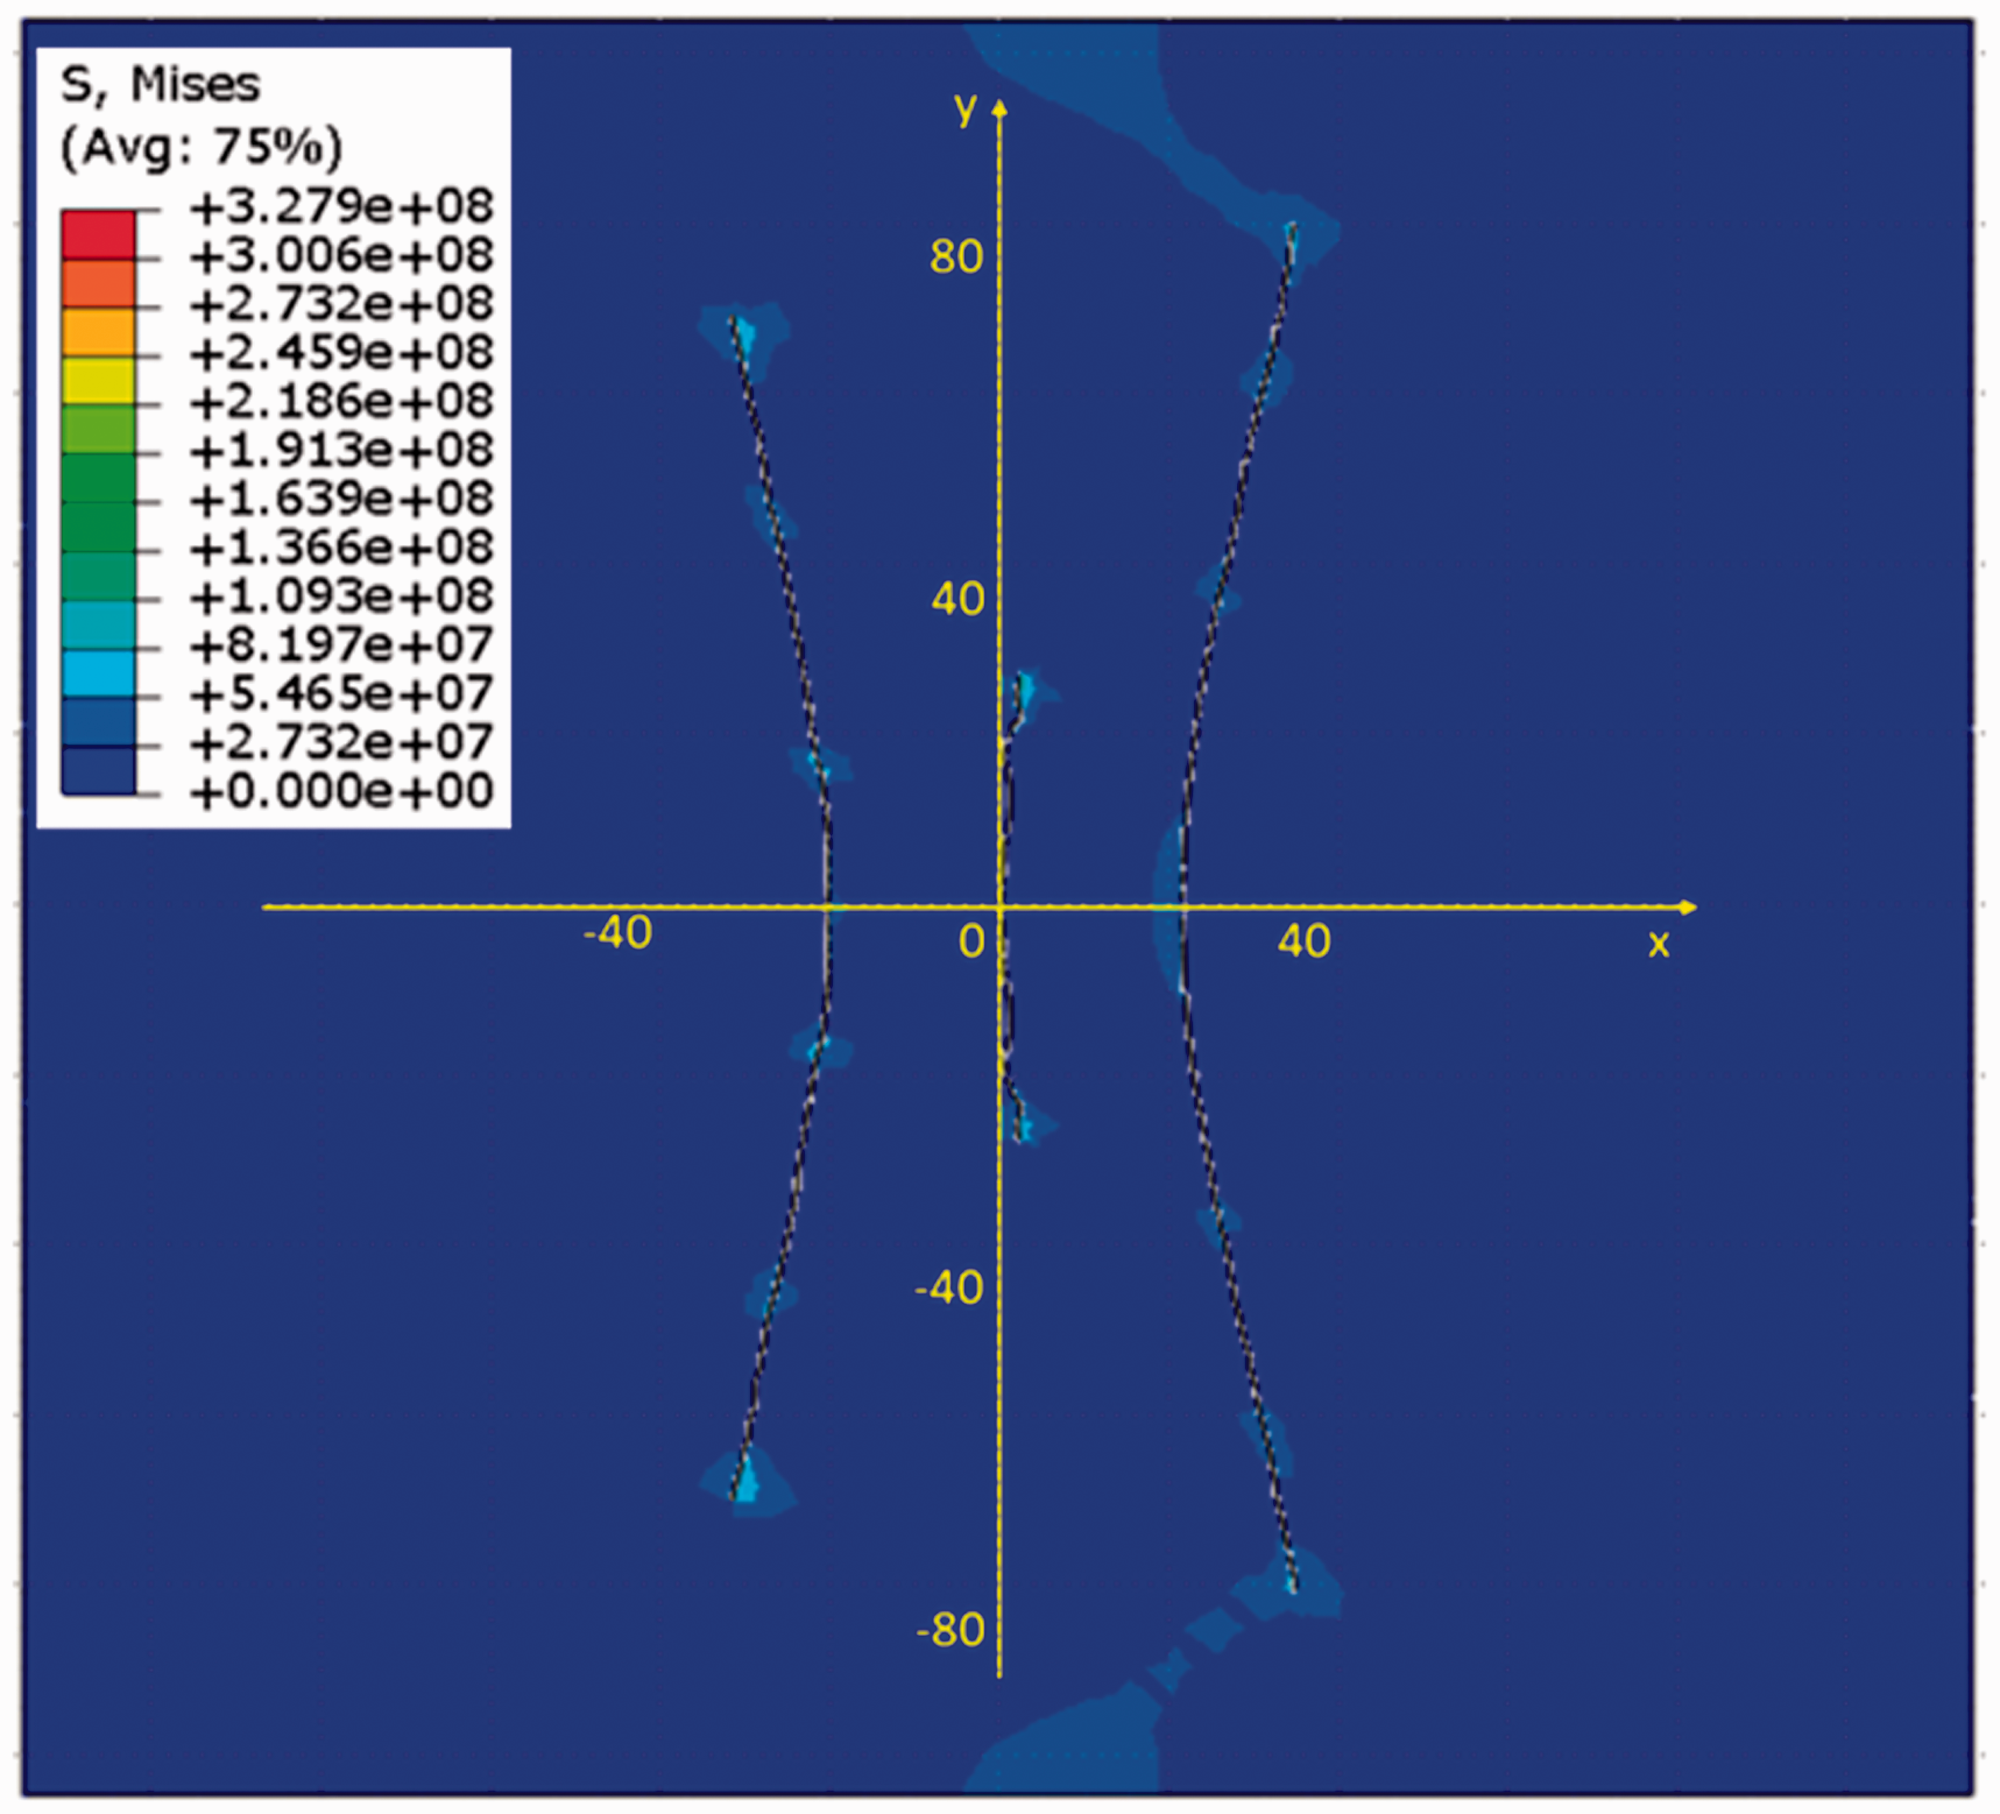
Final fracture geometry of the simulation for the base case.
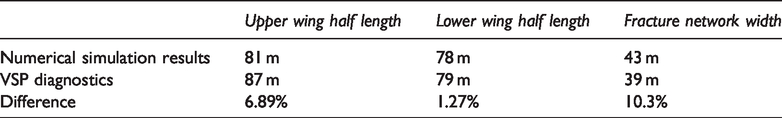
Figure 7 presents the microseismic diagnostics for the stage where the Vertical Seismic Profiling (VSP) technique was especially used in the field to improve the understanding of the stimulated reservoir volume (Tang et al., 2019a, 2019b), and the corresponding fracture geometry data are documented. Table 3 compares the fracture geometry for stage 1 simulated from the numerical model and diagnosed by VSP. Results indicate that the simulation is generally matched with field diagnostics with differences generally less than 10%.
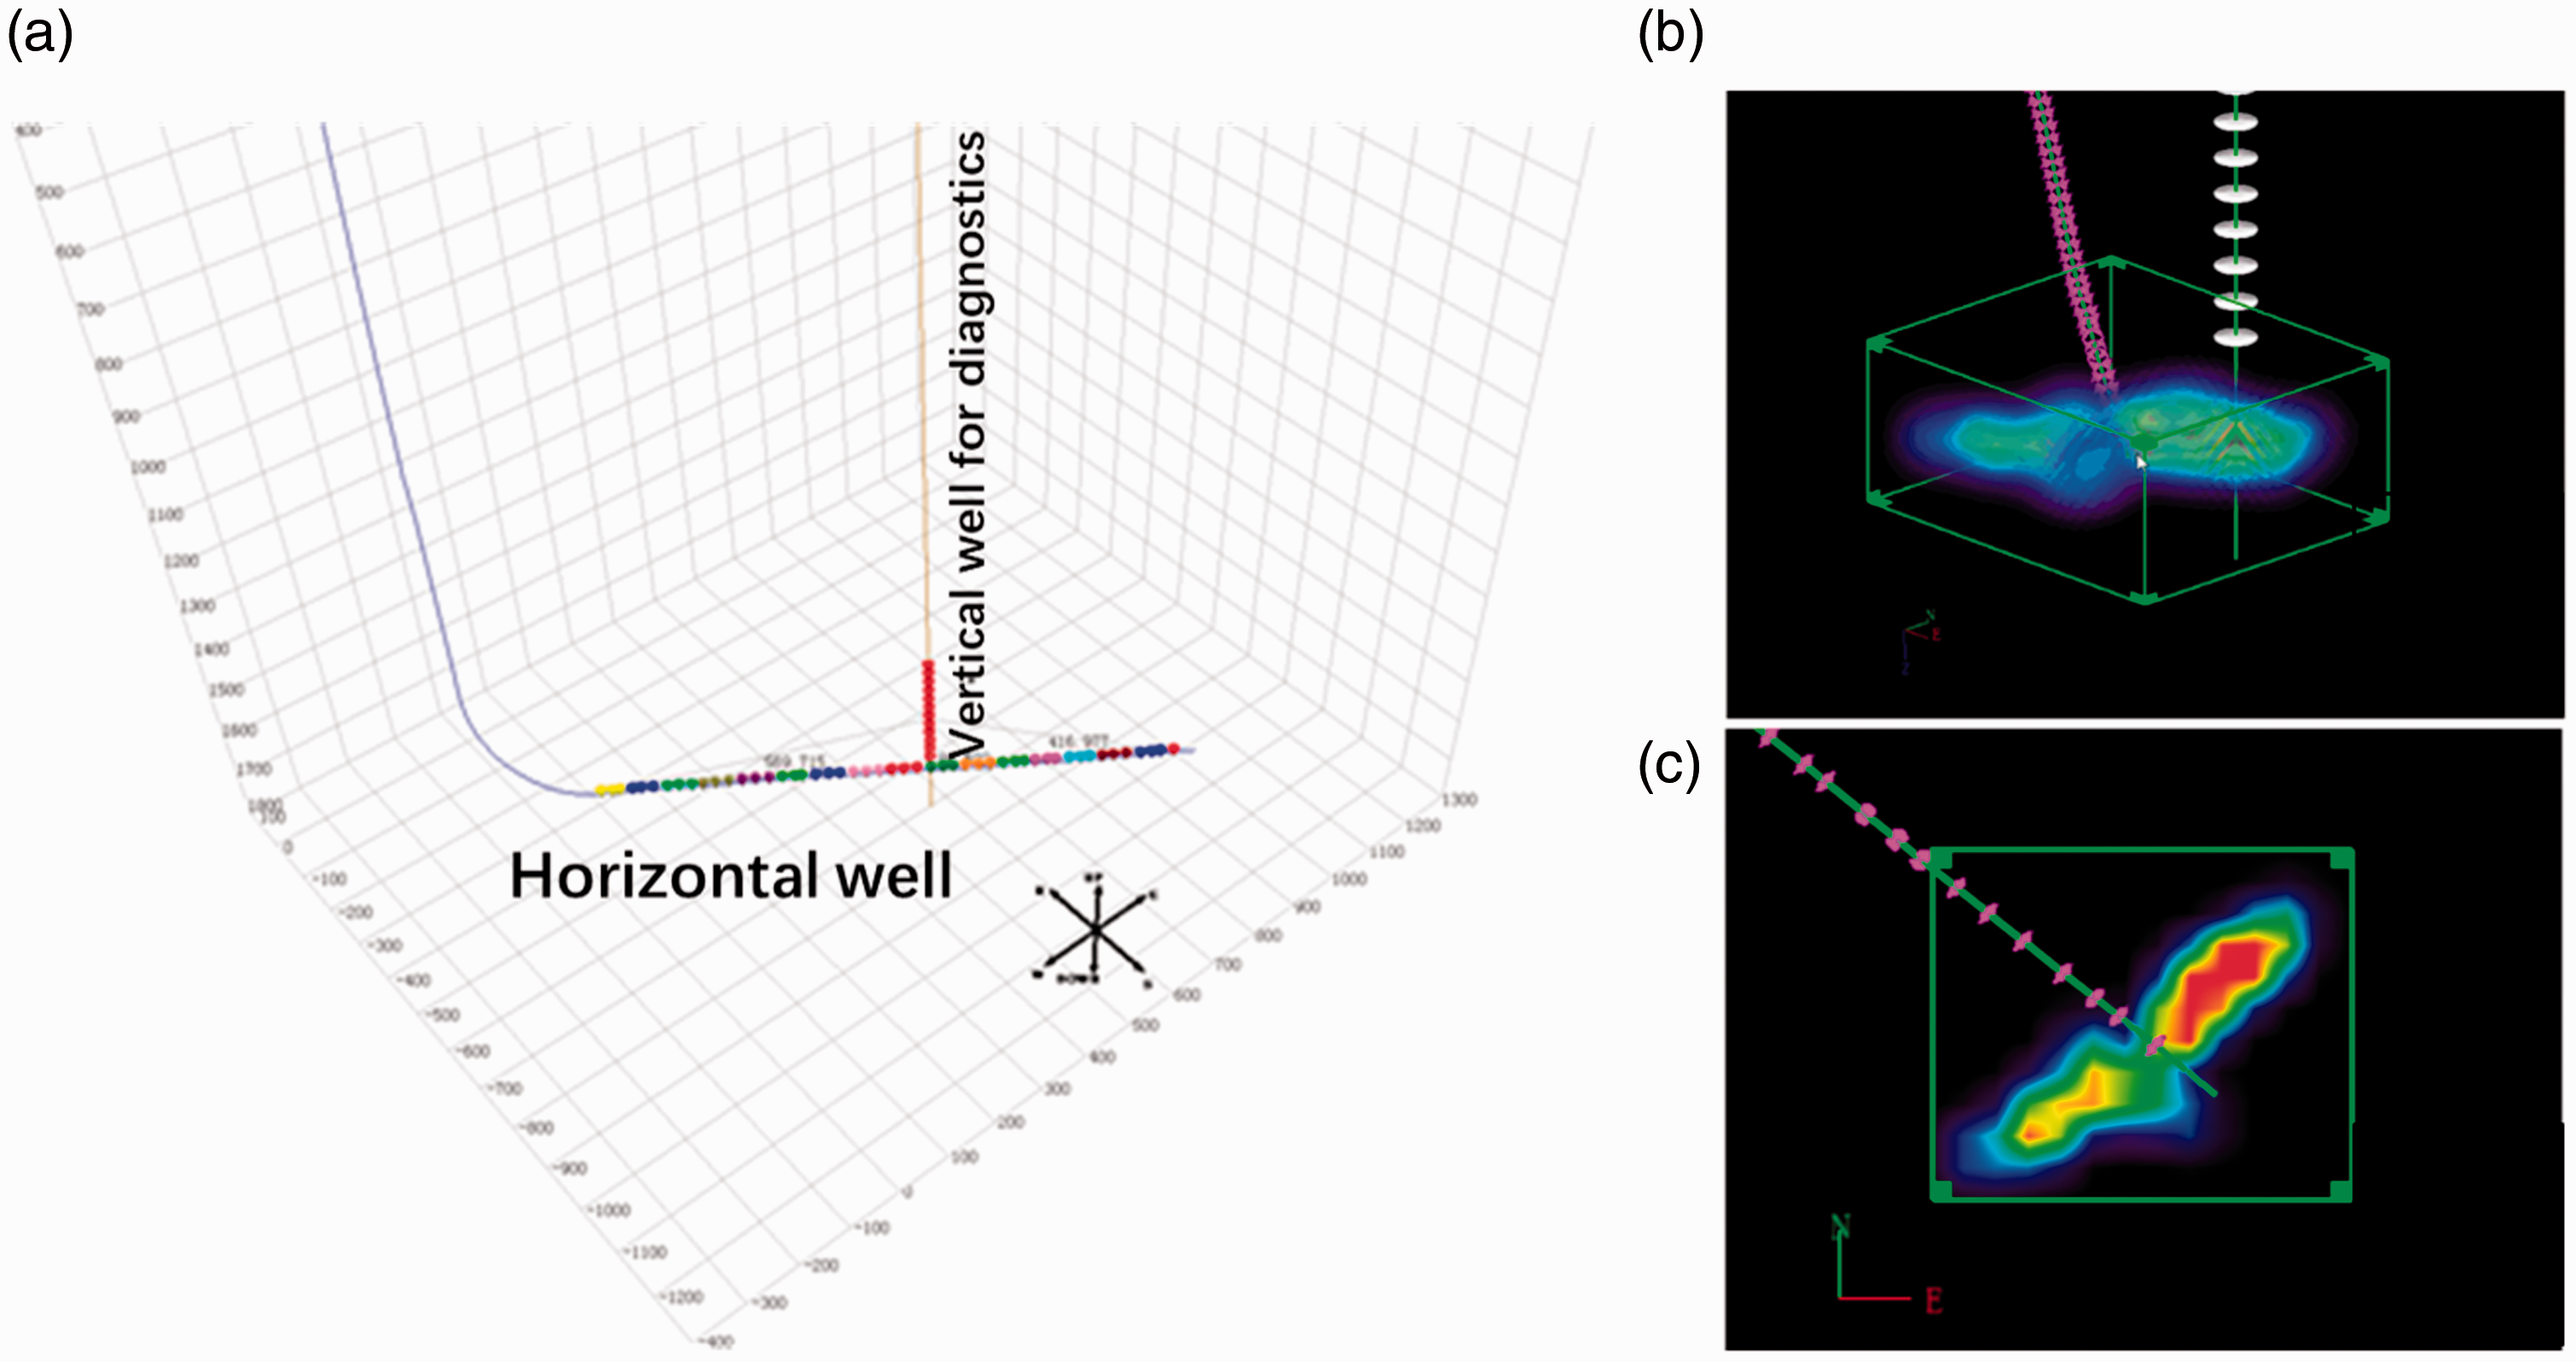
(a) VSP diagnostics for the horizontal well stimulation; (b) microseismic diagnostics for stage 1; (c) stimulated reservoir volume interpretation for stage 1.
Comparison between simulation results and field diagnostics.
After the matching between the base case and VSP diagnostics is presented, parametric studies for in-situ stress contrast between the maximum and minimum principal stress in the horizontal plane, fluid viscosity, cluster number, and multi-stage fracturing are carried out, where both inter-fracture interference within a single stage and inter-stage interference are investigated.
Stress contrast
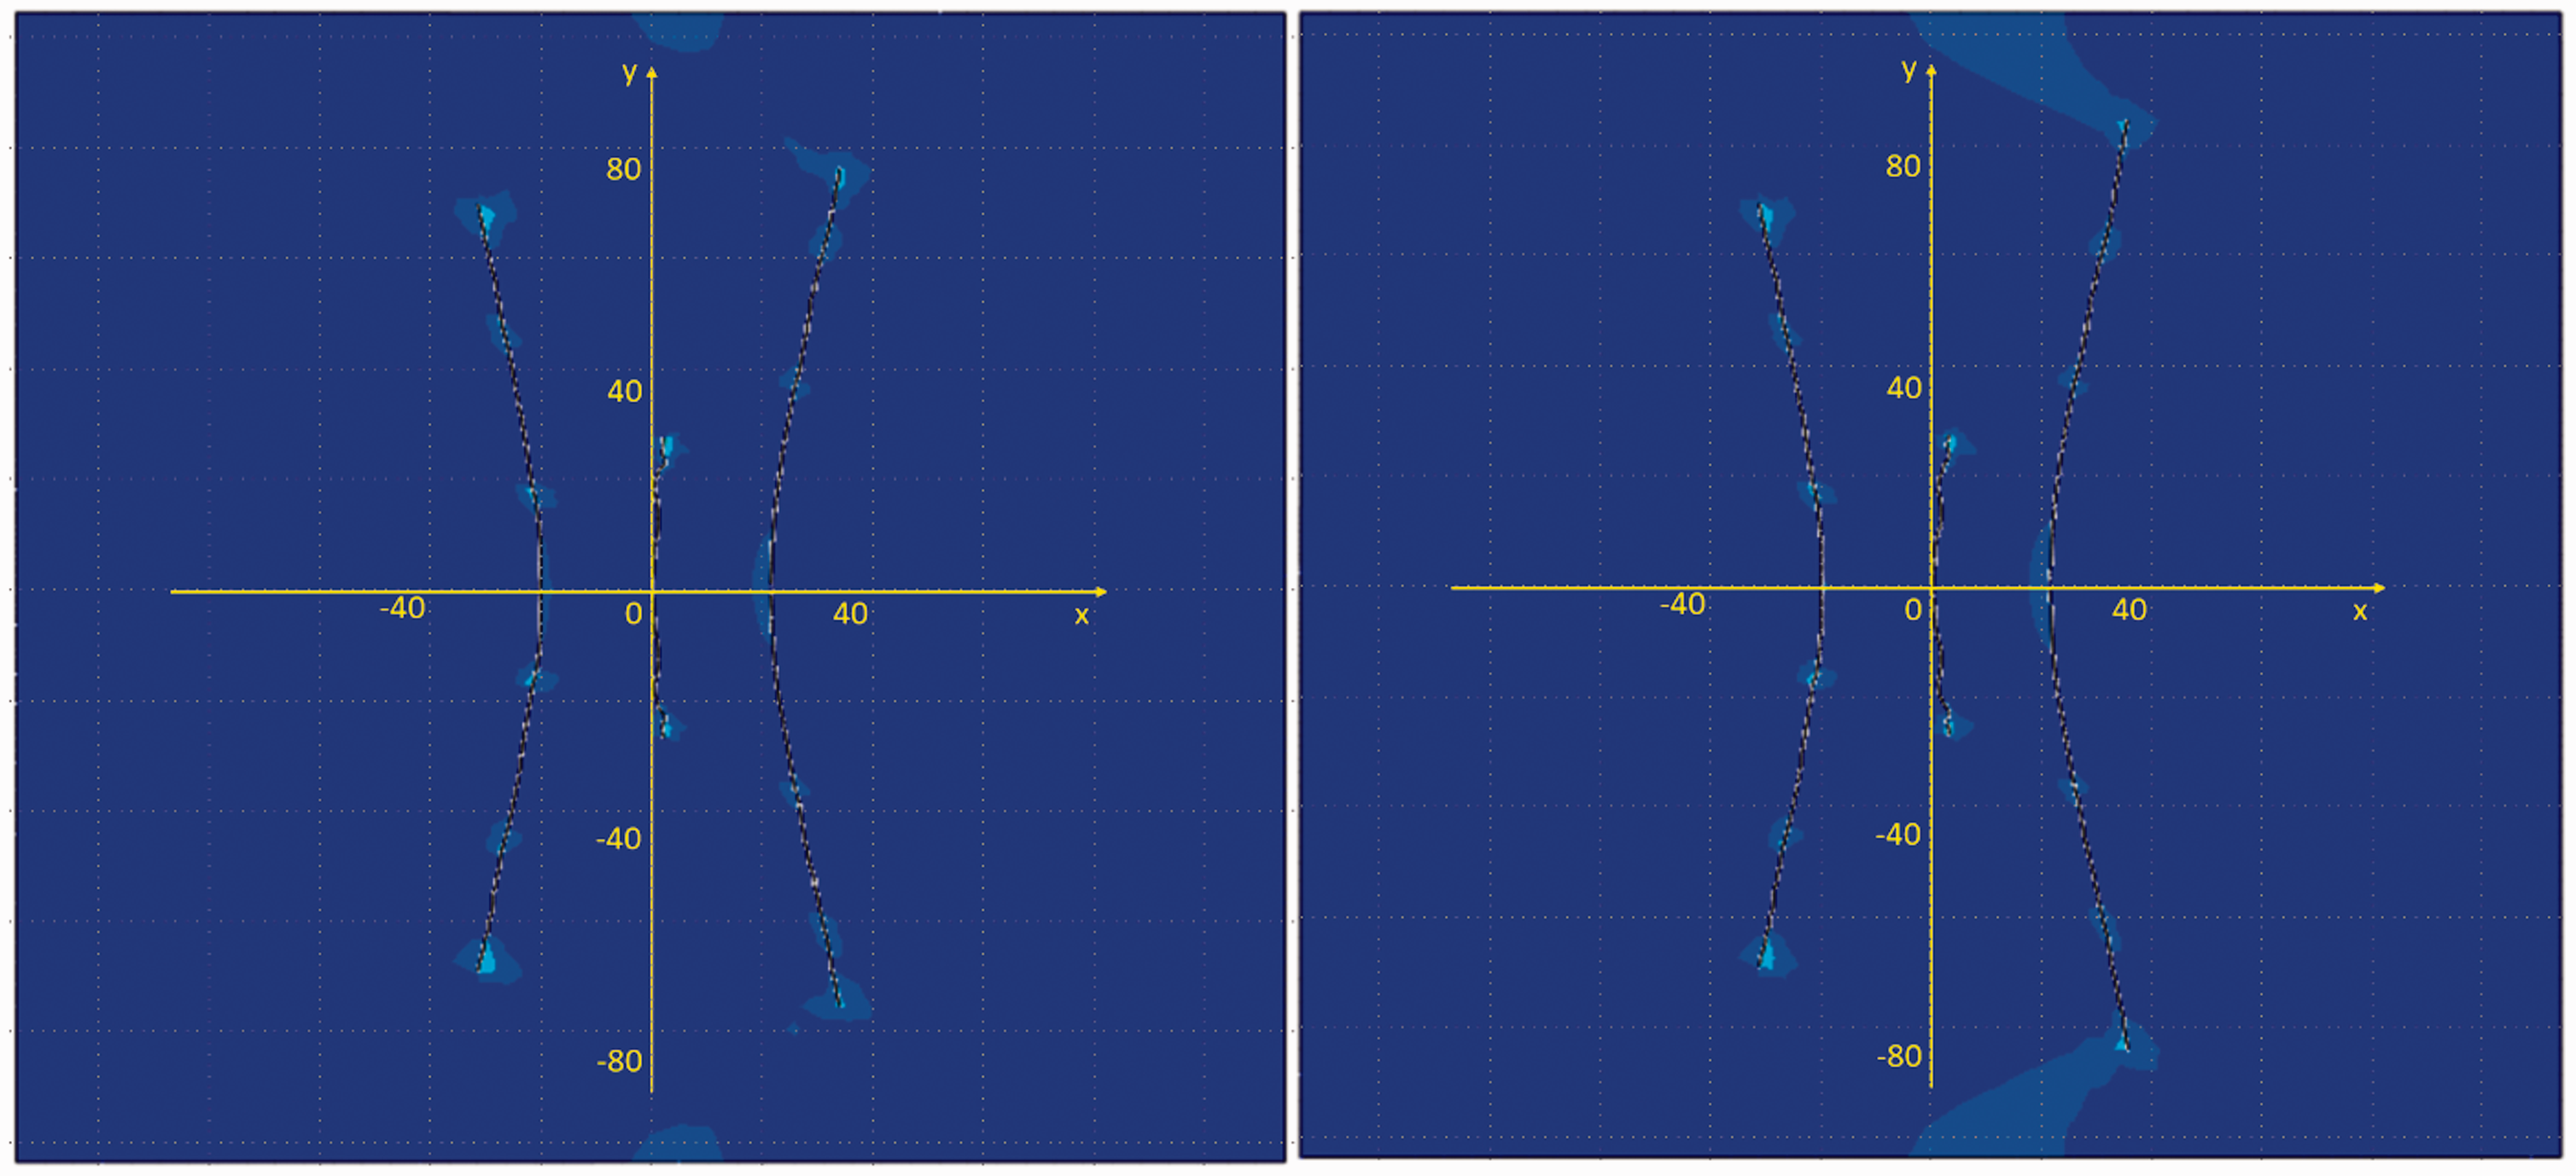
In the base case, a stress contrast of 6 MPa is used. In this section, horizontal stress contrasts of 3 MPa and 9 MPa are also simulated and the respective fracture geometries and fracture width evolution are presented. Figure 8 indicates that stress contrast has an impact on the fracture asymmetry. When the stress contrast increases to 9 MPa, the left fracture becomes longer than the right fractures, which indicates that the non-uniform cluster spacing and stress contrast jointly affect the asymmetrical growth of simultaneously grown fractures within a stage. It is also noted that increasing the stress contrast leads to an increase in the width of the fracture network, and the transverse growth of fractures is the most significant with 3 MPa stress contrast while the transverse growth is the most insignificant with 9 MPa stress contrast. It is concluded that a higher stress contrast is correlated with a narrower single-stage fracture network.
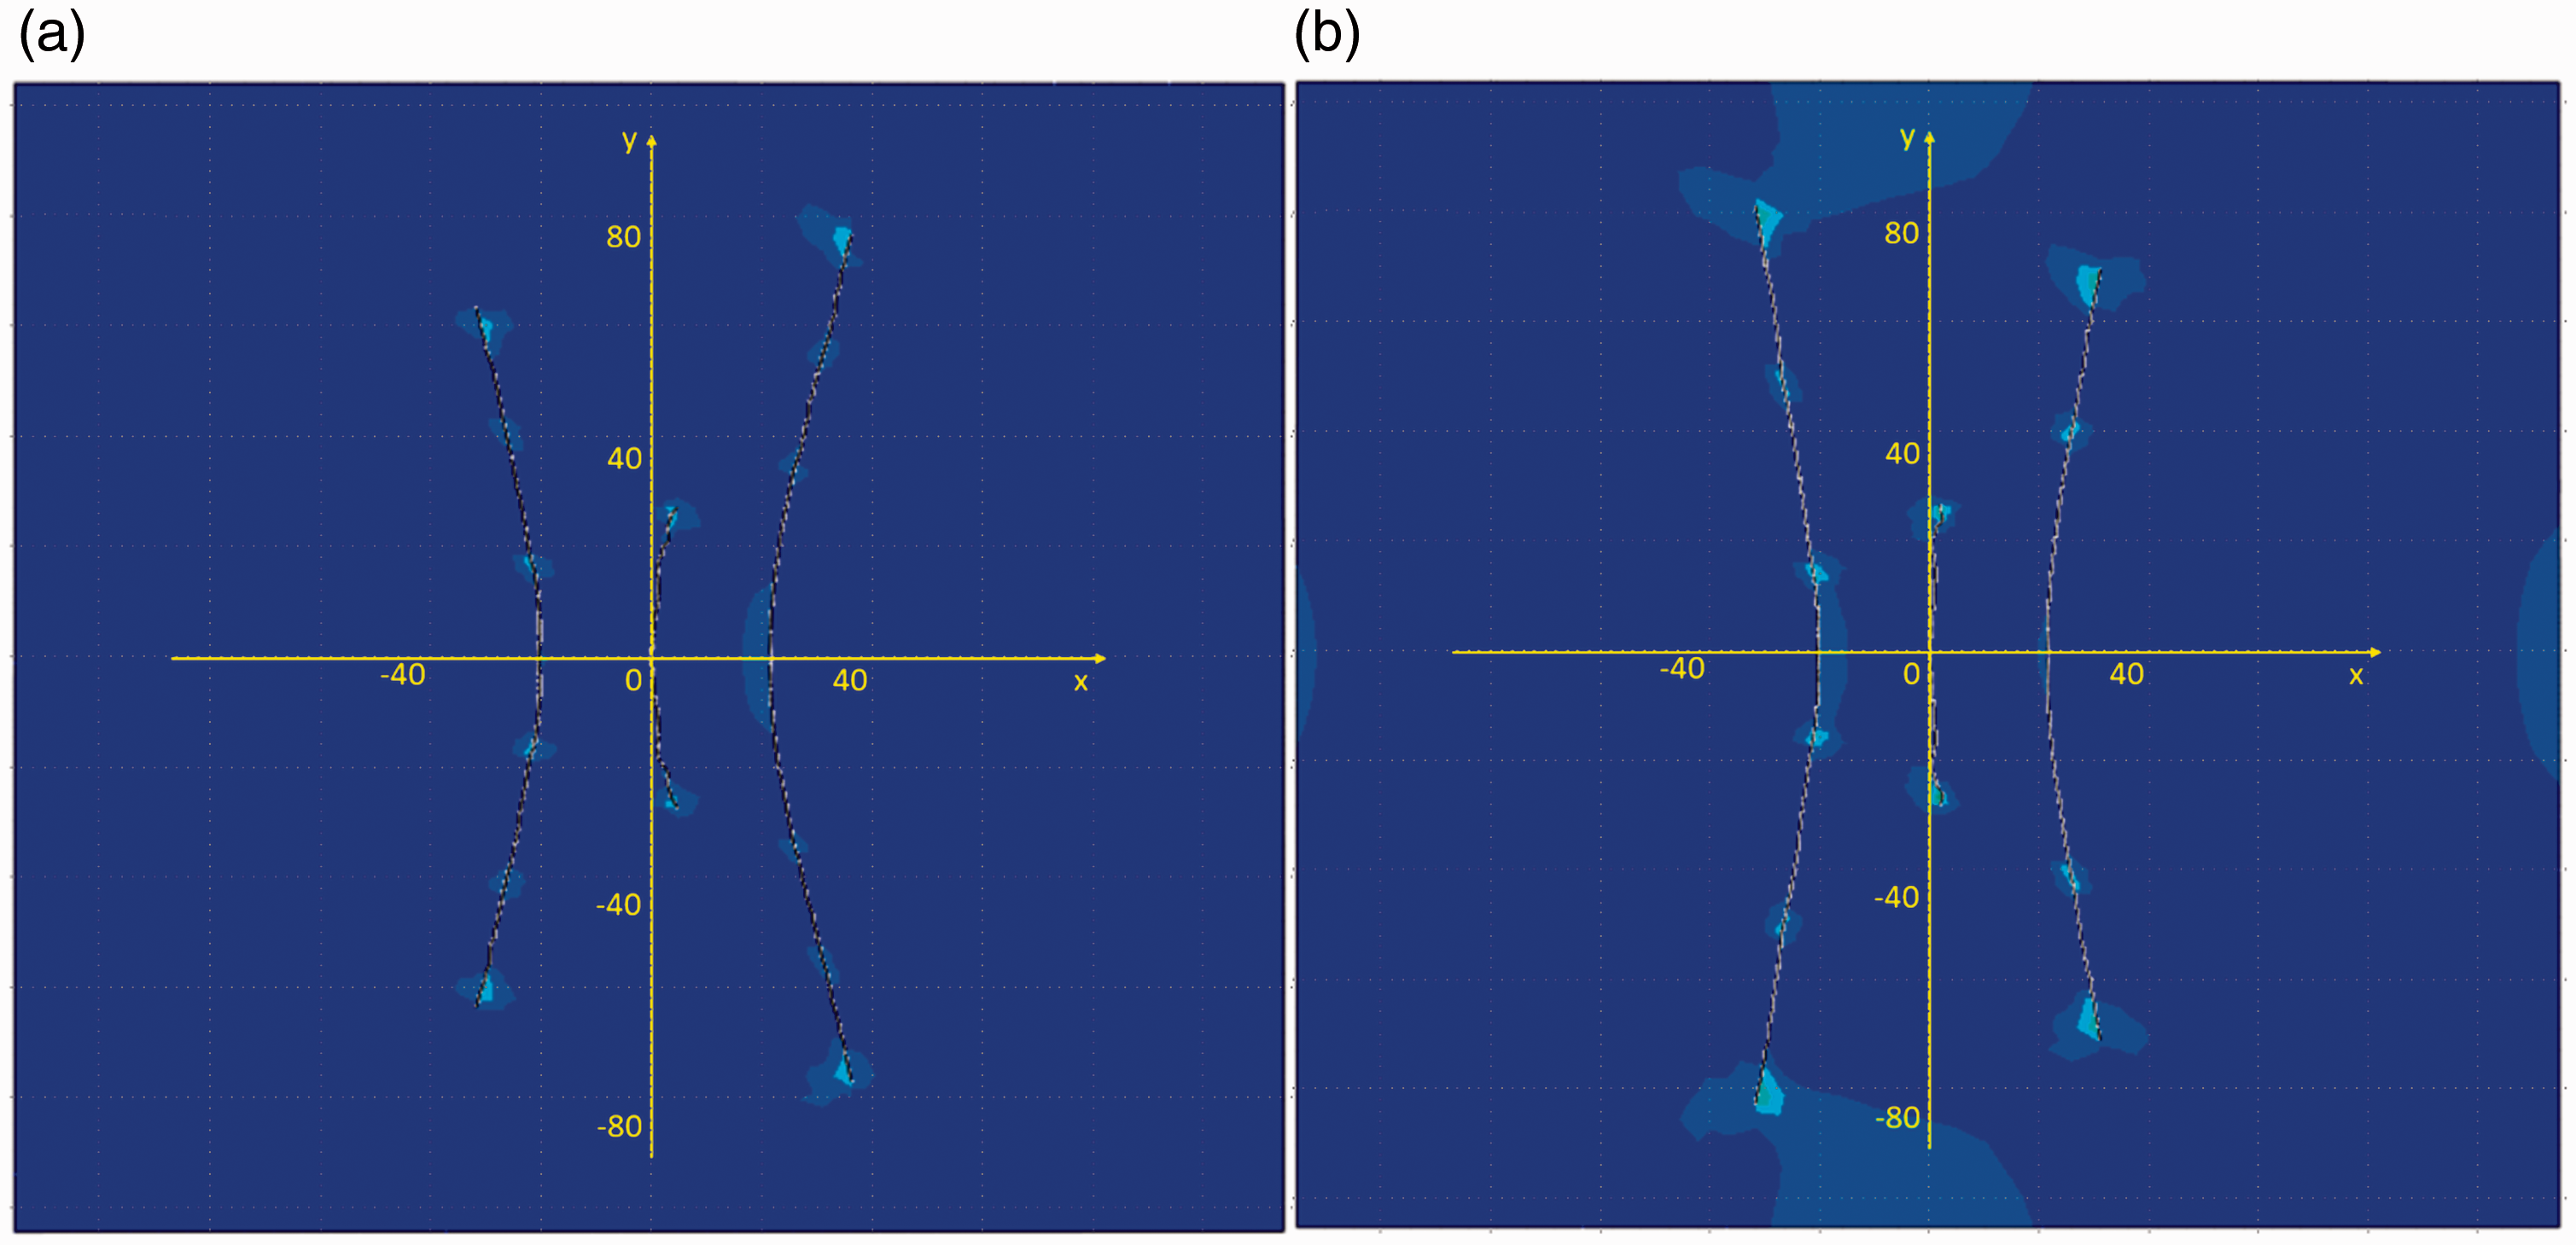
Fracture geometries with stress contrasts of (a) 3 MPa and (b) 9 MPa.
Figure 9 presents the temporal evolution of fracture width at the perforations in stage 1 with different stress contrasts. Fractures 1–3 correspond to the left, central, and right fractures in stage 1. The fracture widths at the perforations on the left (fracture 1) and right (fracture 3) sides endure more oscillated evolutions, while the width evolution at the inner perforation (fracture 2) is less oscillated. This indicates that although the growth of the inner fracture is inhibited, the width changing profile is not largely affected. Besides, the width evolution profiles with three different stress contrasts for inner fracture have the least oscillation, indicating that the effects of stress contrast on fracture width are location-sensitive: the effects of stress contrast on fracture width are stronger for the outer fractures and are weaker for the inner fracture.
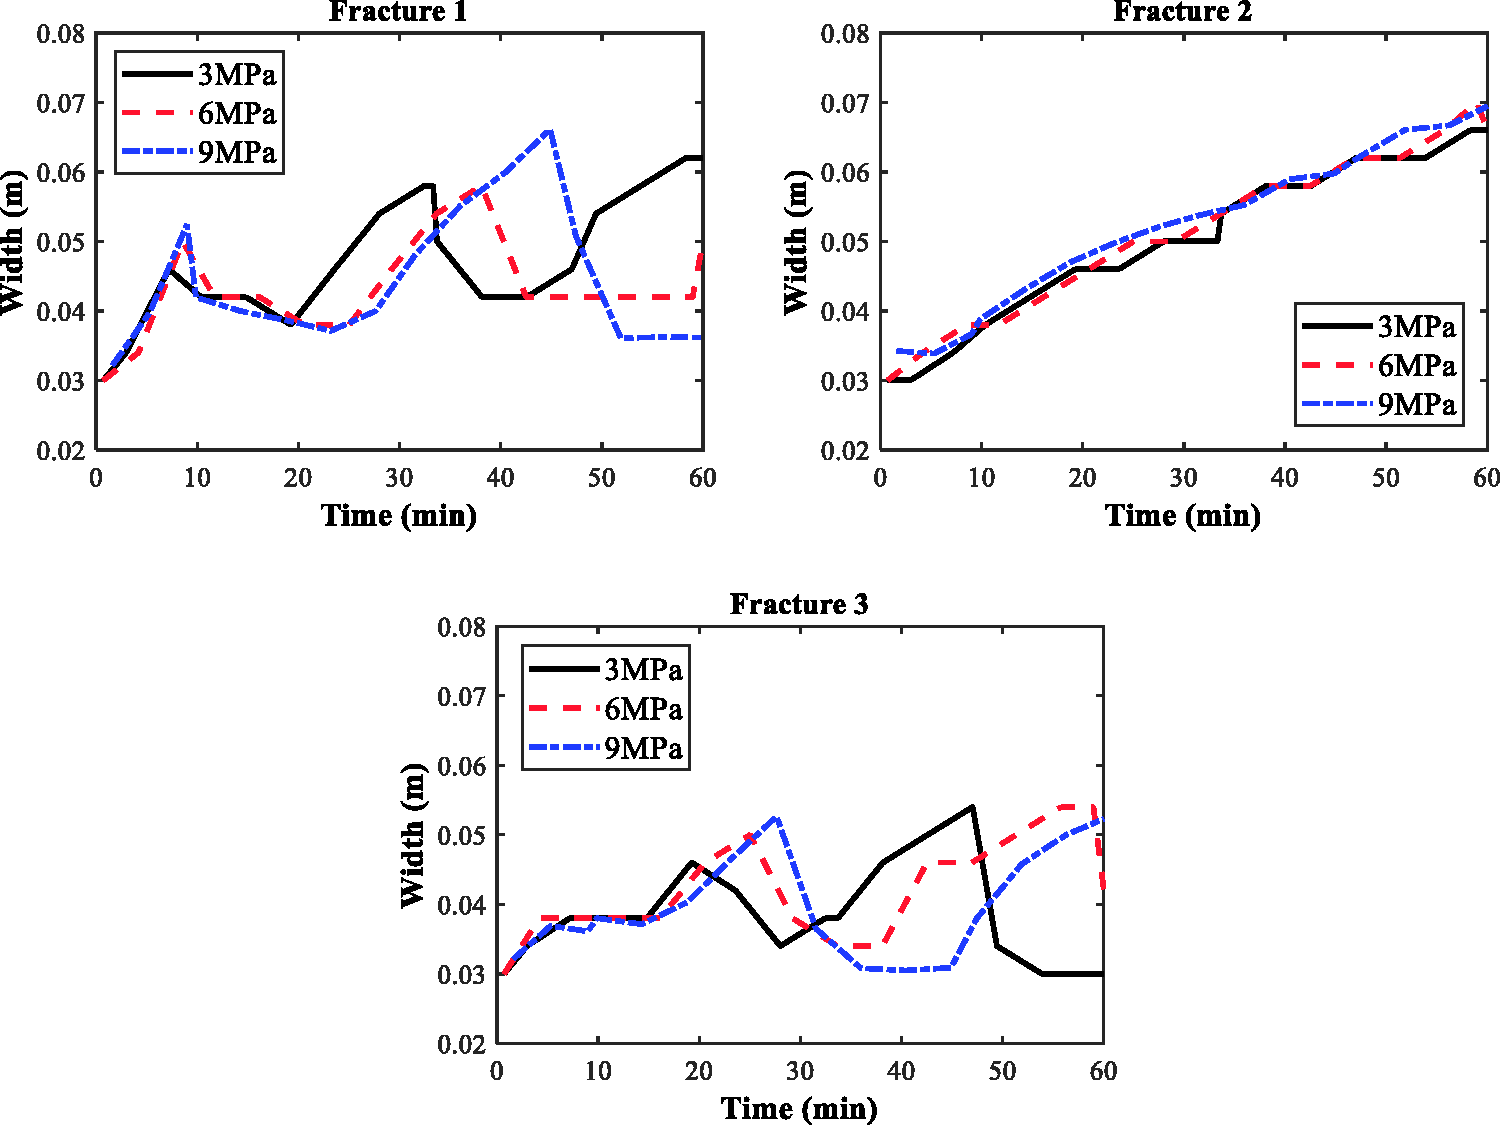
Time evolution of fracture width at the perforations of stage 1 with different stress contrasts.
It is noted that the evolution of fracture widths is oscillated. This is caused by the heterogeneous stress distribution during the simultaneous growth multiple fractures and by the fracture mechanism. First, the rock mechanical properties along the fracture wellbore are inherently heterogeneous which lead to instability in the converge numerical solutions. Second, stress shadow effects and mechanical interference between growing fractures contribute to the heterogeneity of the stress field, which in return causes the oscillated patterns in the curves.
The parametric study on stress contrast indicates that an accurate estimation or measurement of in-situ stress contrast is important for the fracture quality, since it affects the fracture width and the dimension of the stimulated reservoir volume.
Fluid viscosity
A viscosity of 40 mPa·s for the fracturing fluid is used in the base case. In this parametric study, another two viscosities of 30 mPa·s and 50 mPa·s are simulated to quantify the effects of this fracture fluid property on the final fracture quality. Figure 10 shows the final fracture geometries stimulated with these two fracturing fluid viscosities. Results show that a lower fracturing fluid viscosity leads to shorter fracture half lengths, which is explained by the fact that a more viscous fracturing fluid can better facilitate the deformation and failure of the rock and consequently enhance the fracture propagation process. In addition, except for the fracture half lengths of the outer fractures, the curvatures of non-planar fractures and the general stimulated reservoir volume are not greatly affected by the viscosity of fracturing fluids.
Fracture geometries with fracturing fluid viscosities of (a) 30 mPa·s and (b) 50 mPa·s.
Figure 11 shows the width evolution against time at three perforations within the stage under the effect of different fracturing fluid viscosities. Results show that the general trends of the temporal evolution of fracture width are not greatly affected by varying the fracture fluid viscosity.
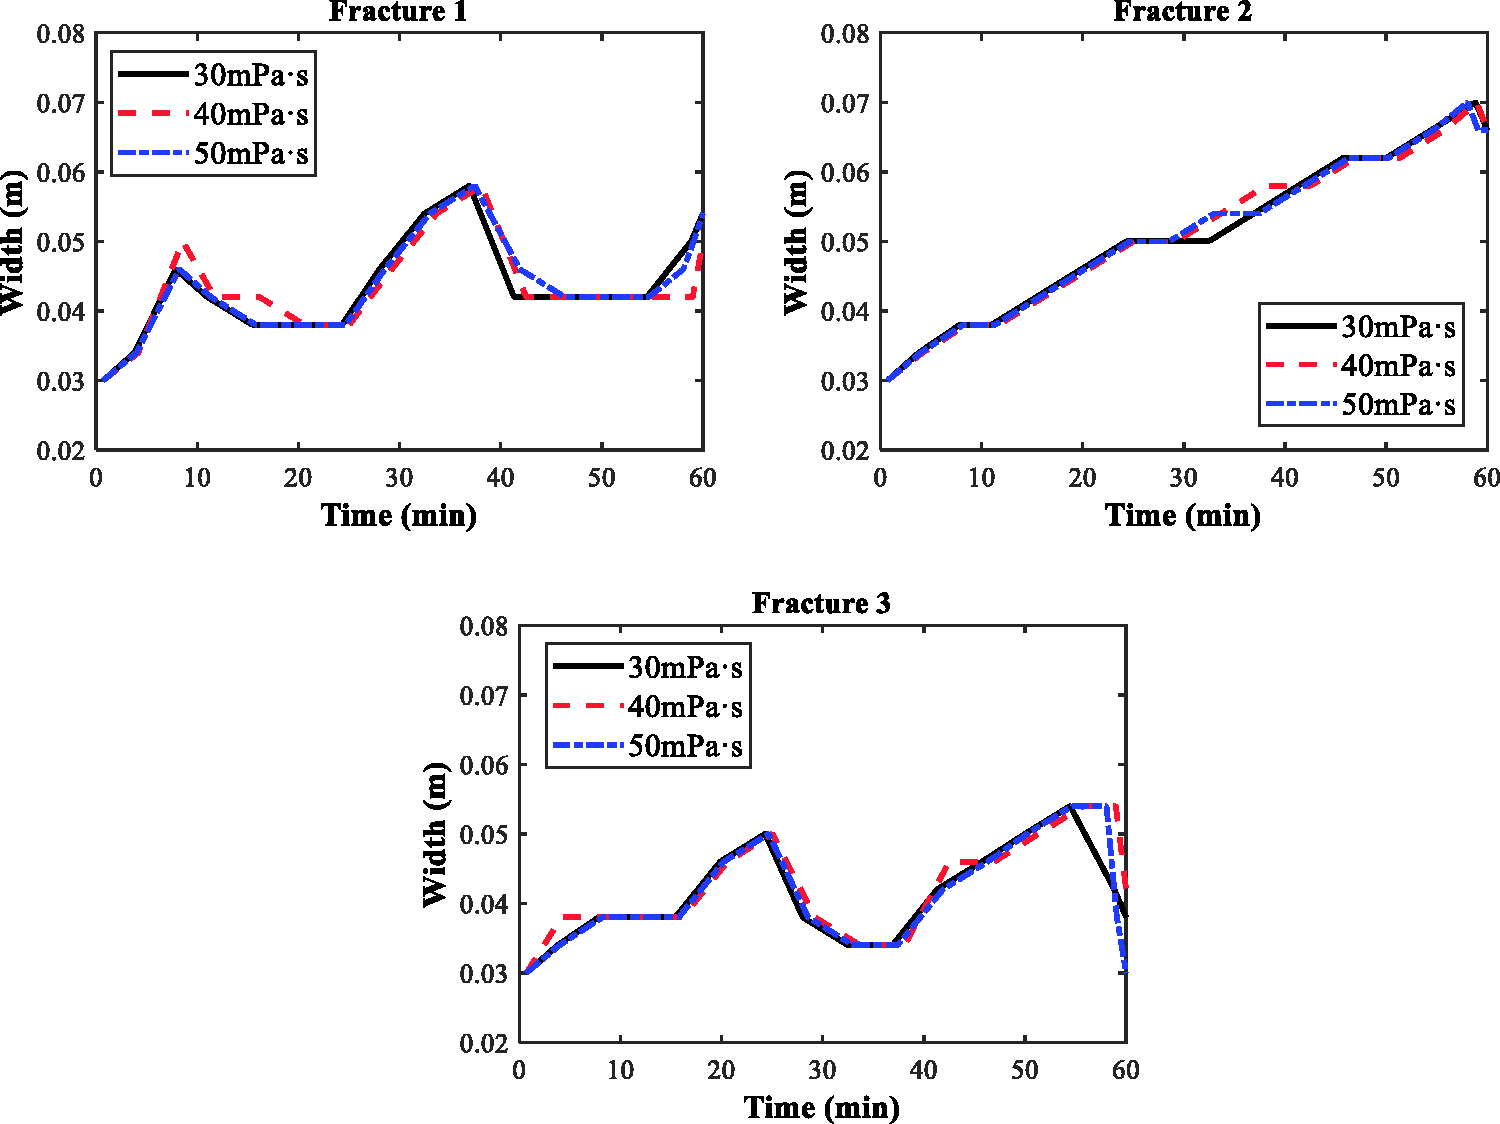
Time evolution of fracture width at the perforations of stage 1 with different fracturing fluid viscosities.
Cluster number
In the field, the cluster number for stage 1 is currently 3. In this subsection, a numerical simulation with four clusters within a stage is carried out to quantify the effect of cluster number on fracture network geometry and on fracture width. Compared to the base case, the cluster density is increased with the increase in cluster number, and the average cluster spacing in this case is 13.3 m. The four perforations are located at x = –18, –9, 11, and 22 on the x axis. Figure 12 presents the fracture geometry of the 4-cluster fracturing simulation. Compared to the 3-cluster fracturing, a significant difference in this case is that the two inner fractures endure stronger inter-fracture interference and fracture reversal at and near the fracture tips. In this case, the closer cluster spacing magnifies the effects of stress shadow on the limitation of the inner fracture growth which also diverts the inner fractures transversely. This observation means that the stress shadow effect is mainly exerted on inner fractures while the propagation of the two outer fractures is not significantly affected by the denser cluster spacing.
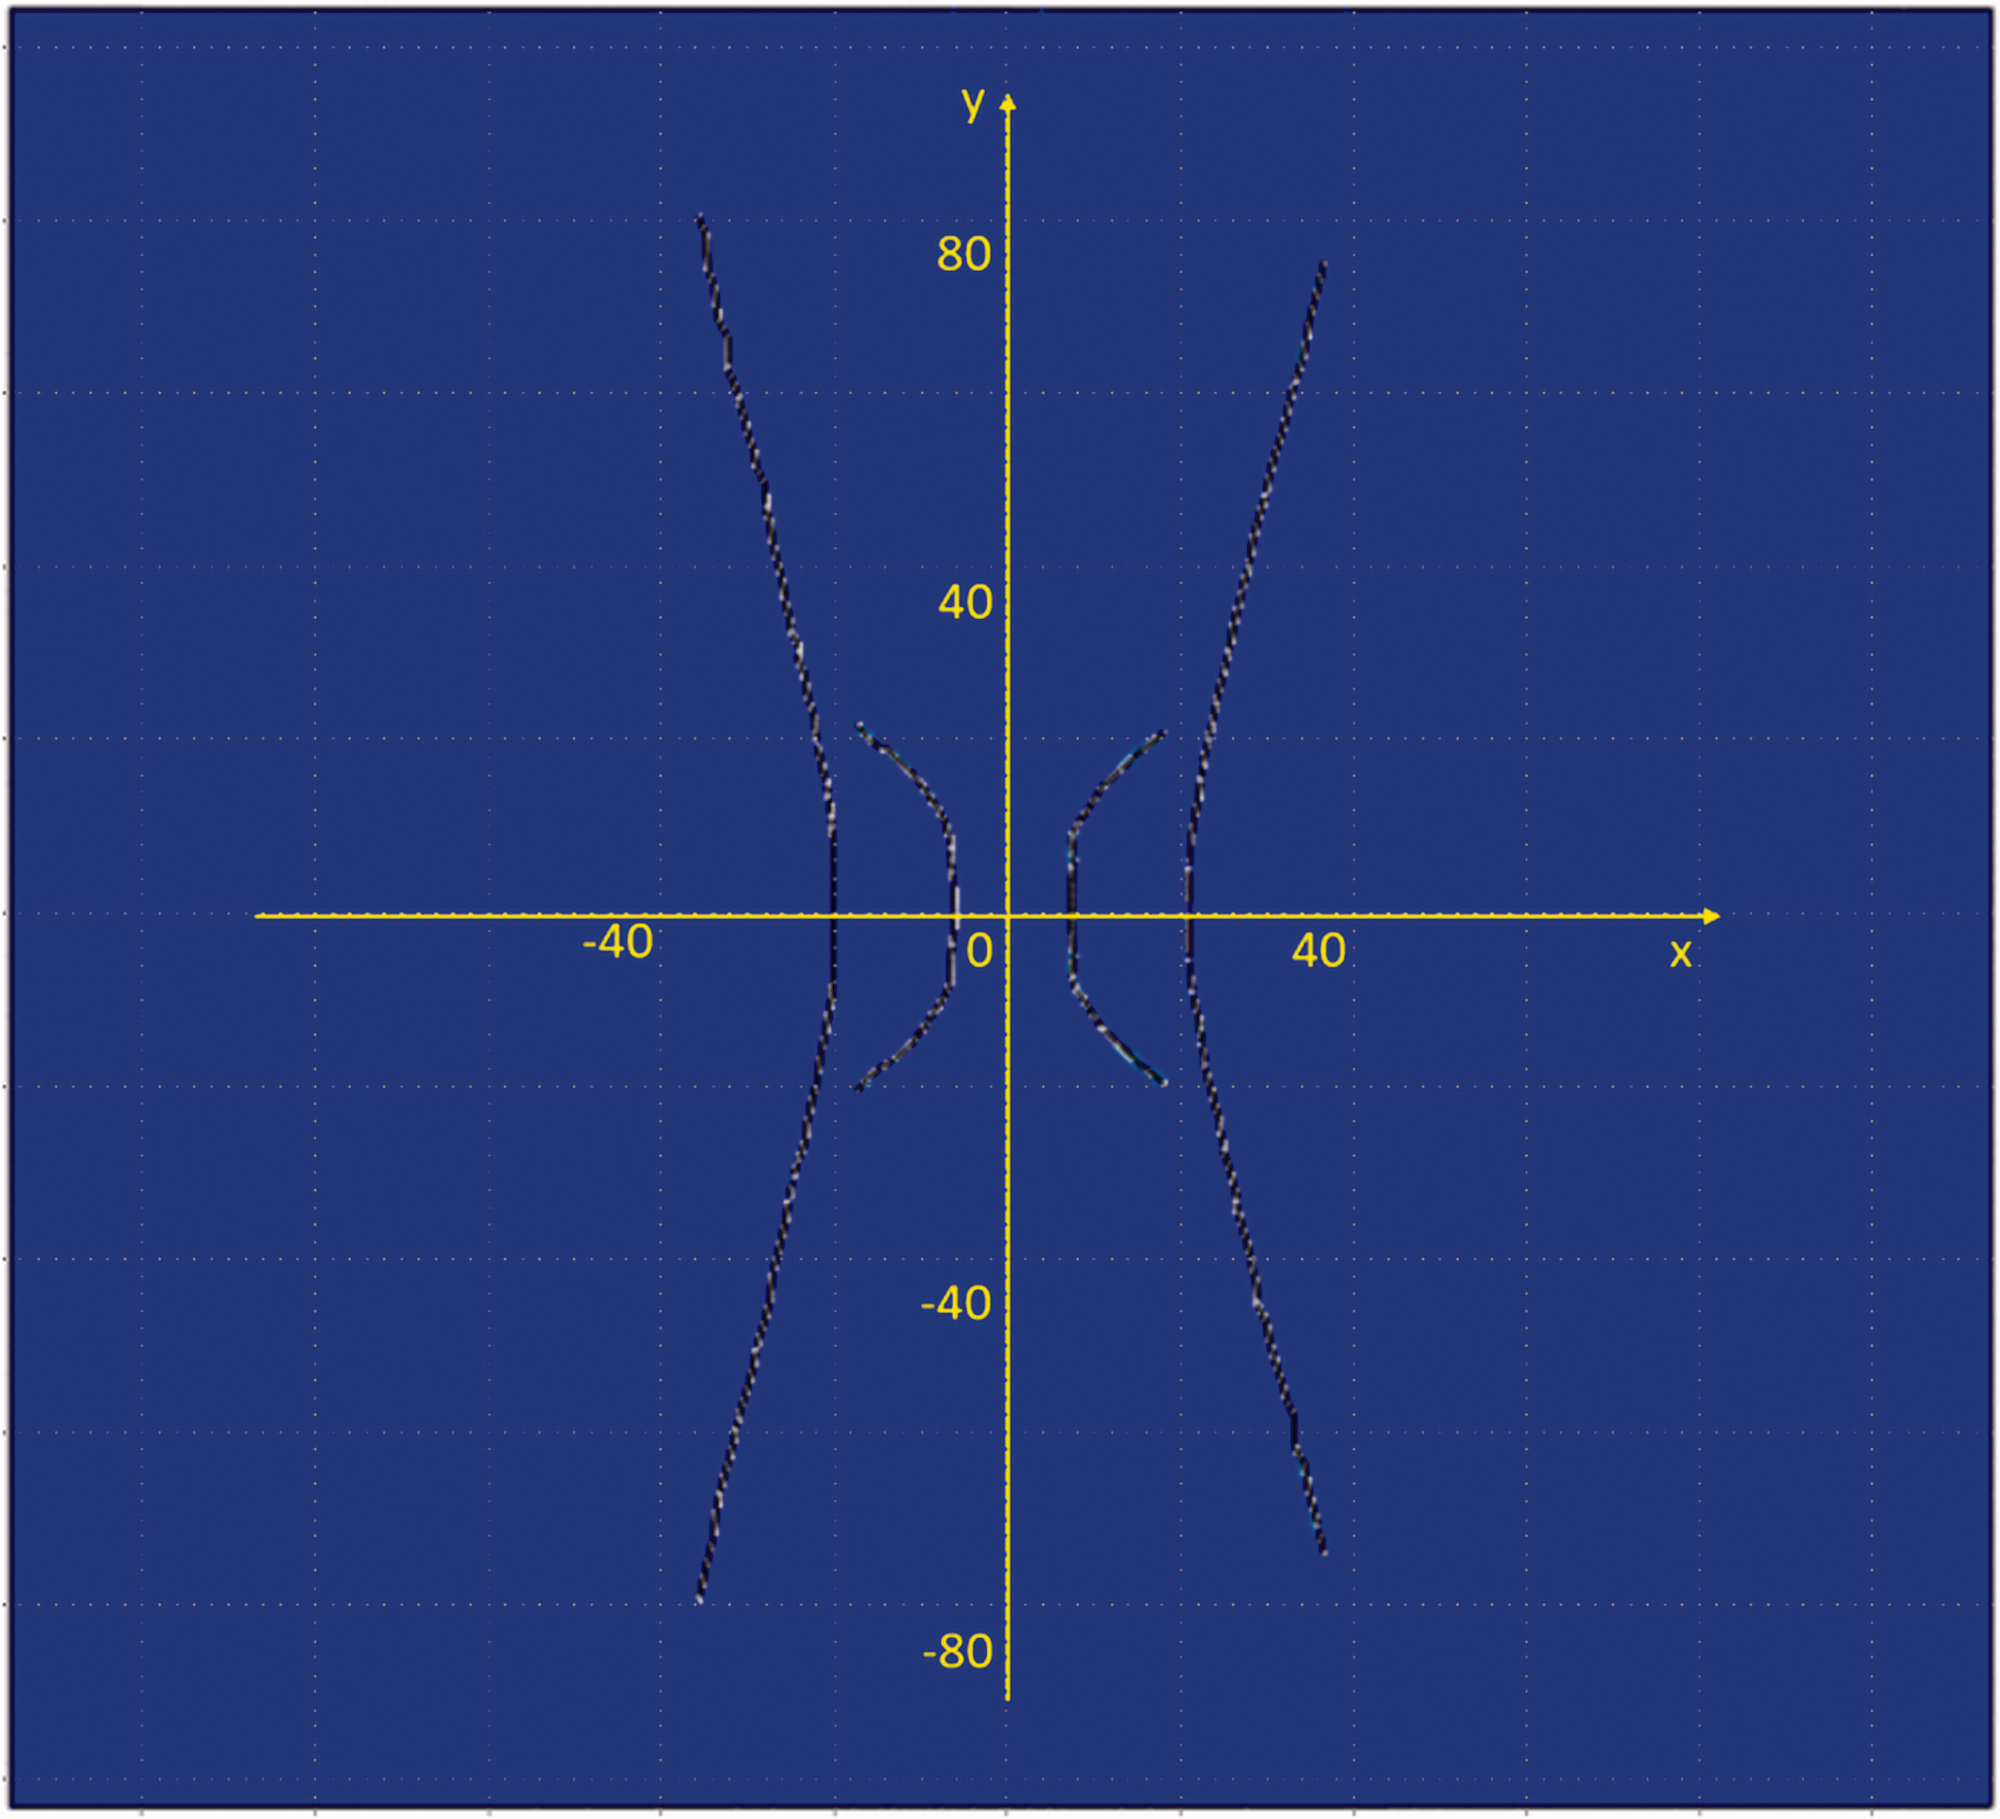
Fracture geometries with the cluster number increased to four in a single stage.
Figure 13 shows the temporal evolution of the fracture width at four perforations within the investigated stage, and fractures 1 and 4 are the two outer fractures while fractures 2 and 3 are the two inner fractures. It is observed that due to the enhanced inter-fracture interference and the stress shadow effect, the widths for the inner fractures are generally decreasing with time while the widths for the outer fractures are increasing with time. When the pumping time is approaching 60 minutes, the widths at the perforations for the inner fractures are close to 0, implying that although the closer cluster spacing allows for an extra hydraulic fracture to be propagated, it essentially damages the fracture quality and the corresponding fracture conductivity. Thus, the two outer fractures can effectively drain the matrix while the drainage efficiency of two inner fractures is inhibited.
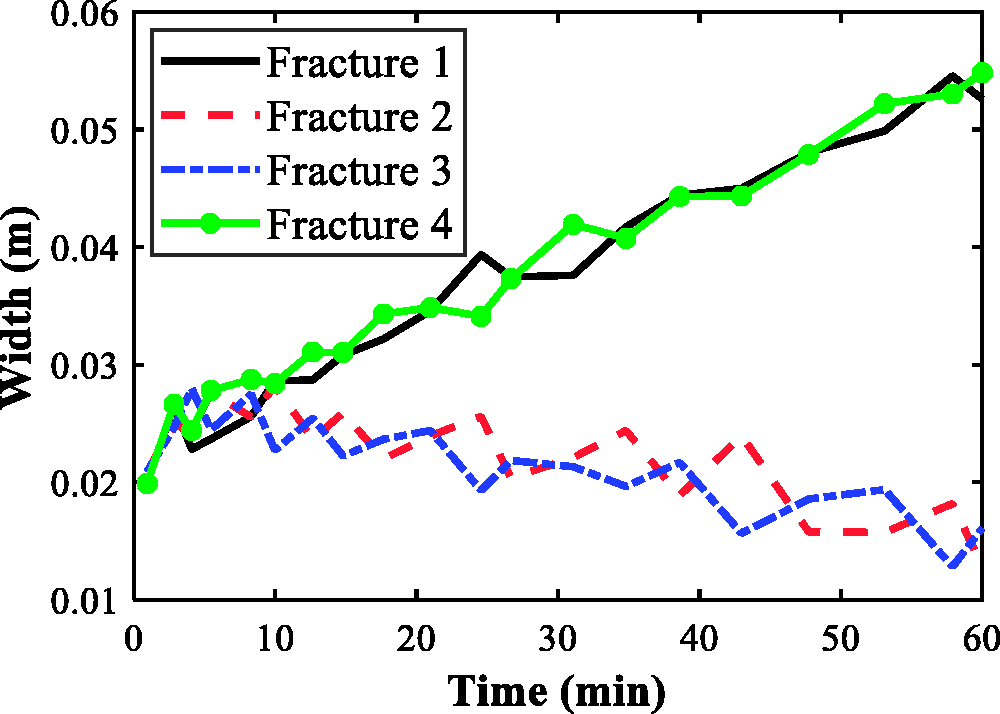
Time evolution of fracture width at the perforations with cluster number of 4 in a single stage.
Inter-stage interference effect
In this subsection, a two-stage fracturing scenario is simulated to quantify the inter-stage fracturing interference in the field where consecutive stages are usually sequentially stimulated. The simulation parameters for the two stages are from the aforementioned data presented for the study area and the stage spacing is 60 m. Through this simulation, how the fracture propagation in a certain stage affects the fracture network in the subsequent stage can be quantitatively investigated.
Figure 14 presents the fracture paths of the two consecutive stages. Stage 1 is identical to the previously presented base case and fractures in stage 2 are simulated in the in-situ stress field altered by the fracturing of stage 1. It is observed that the fracture network of stage 2 is generally the same as that of stage 1, while the most significant difference is in the right fracture of stage 2 where the curved propagation path is pushed back in y direction near the fracture tips. This indicates that the fracturing in the subsequent stage can be affected by the previous stage. In contrast, the central fracture and the left fracture are not significantly affected by the fracturing of the first stage, as their fracture geometries are generally symmetric with the x axis.
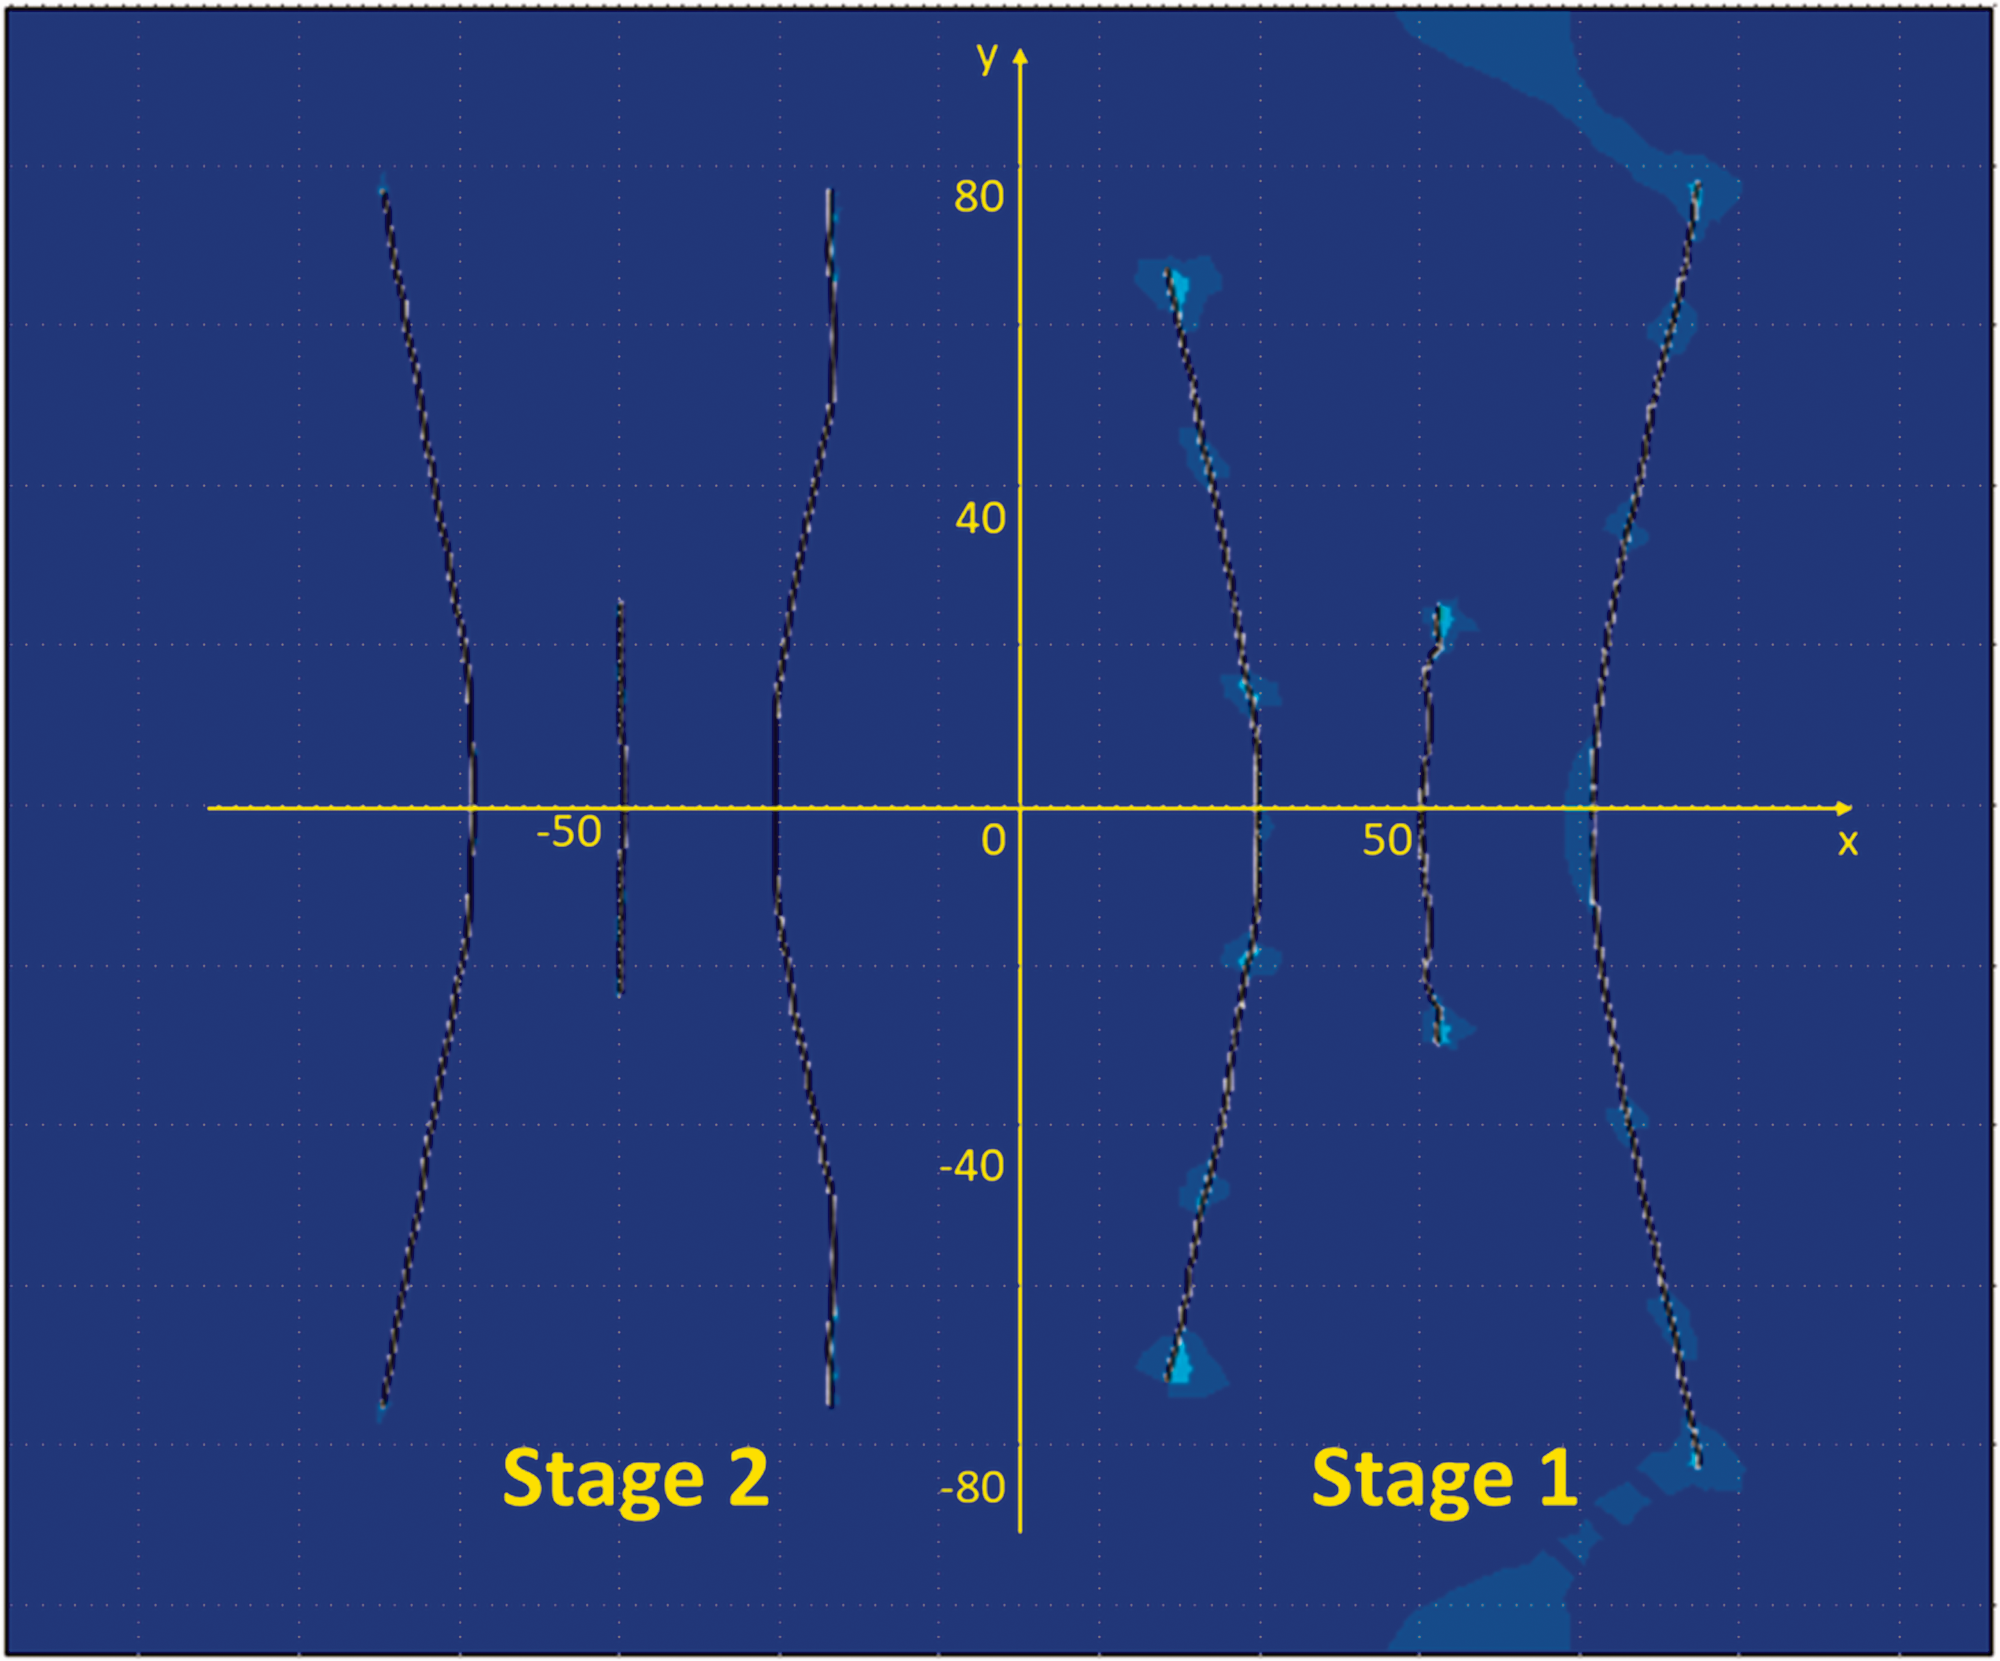
Fracture geometries from the multi-stage fracturing simulation.
Figure 15 presents the comparison between the fracture widths ai perforations for the first stage and for the second stage. It is noticed that the widths in the first stage are generally greater than those in the second stage, indicating the fact that the hydraulic fracturing of the first stage alters the in-situ stress and leads to inter-stage fracturing interference which eventually restricts the opening of the fractures in the second stage. In the first stage, fracture widths are around 0.04 m, while they are reduced to around 0.02 m in the subsequent stage, indicating a strong inhibition introduced by the sequential fracturing in consecutive stages.
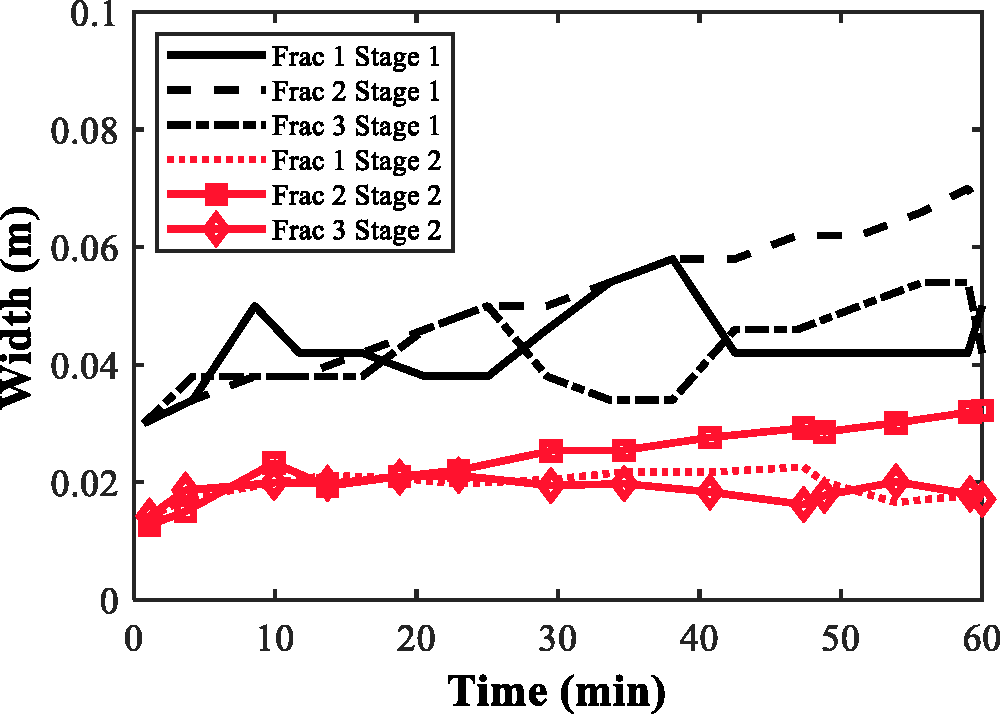
Time evolution of fracture width at the perforations in stage 1 and stage 2.
Discussion
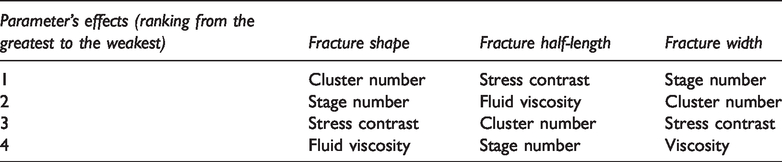
In the numerical analysis, four parameters including stress contrast, fluid viscosity, cluster number, and stage number and their effects on fracture propagation and fracture width are presented. It is noted that the cluster number has the greatest effects on fracture shapes as the inner fractures eventually propagate longitudinally when the cluster number is increased to four. The effects of stress contrast and fluid viscosity are mainly on the fracture half-length instead of fracture shapes. The effect of stage number is mainly on fracture shapes, and this effect is the most pronounced in the fracture cluster closest to the earlier stage.
The stage number has the greatest effects on fracture width, as widths in the second stage significantly decrease. Cluster number has the second greatest effects on fracture width, while fluid viscosity has the weakest effects on fracture width. These observations are recorded in Table 4.
Ranking the effects of certain parameters on simulated fracture results.
Conclusions
This study introduces a non-planar hydraulic fracture model based on the extended finite element method and presents its use in a realistic shale oil fracturing scenario. Parametric studies are conducted to quantify the effects of relevant parameters on the fracture quality. In conclusion:
The simulated fracture geometries generally match with the field diagnostics of stimulated reservoir volume, with differences lower than 10%. Fracture asymmetry is caused by non-uniform cluster spacing and slightly heterogeneous reservoir properties. Compared to the inner fracture, effects of stress contrast and fracturing fluid viscosity on fracture width are greater in outer fractures. Besides, effects of stress contrast are greater than effects of fracturing fluid viscosity. Denser clusters in a stage increase the inter-fracture interference, which not only inhibits the growth of inner fractures but also cause inner fracture growth to divert transversely. Consecutive stimulations in a multi-stage fracturing job contribute to inter-stage fracturing interference. In the subsequent stage, fracture geometries are affected and fracture widths are inhibited.
Footnotes
Declaration of conflicting interests
The author(s) declared no potential conflicts of interest with respect to the research, authorship, and/or publication of this article.
Funding
The author(s) disclose receipt of the following financial support for this work: the National Natural Science Foundation of China (No. 51904314), the Fundamental Research Funds for the Central Universities and the Science Foundation of China University of Petroleum, Beijing (No. 2462018YJRC031), the Research Foundation of China University of Petroleum-Beijing at Karamay (No. XQZX20200009), and the Independent Research Project of the State Key Laboratory of Petroleum Resources and Prospecting, China University of Petroleum, Beijing (No. PRP/indep-4-1813).