
Abstract
The aim of this work is to compare the wind data extrapolated by 1/7th wind power law and site-specific wind power law for wind power potential estimation at Shahbandar. Both the Wind shear exponents (WSE) and local air density values were calculated using measured wind data at 10 and 30 m heights and they were found minimum in summer and maximum in winter. Weibull distribution was applied with a newly developed method to estimate the Weibull parameters whose accuracy was tested using coefficient of determination which was more than 95%. Technical analysis of energy generation was conducted which showed that GE1 and GE2 turbines have highest yield and capacity factors respectively while B3 and V5 has corresponding minimum values. Comparison showed that 1/7th wind power estimates lower values of wind potential than site-specific wind power law. Moreover, comparison of predicted data with measured data shows that site-specific wind power law estimates data more accurately.
Keywords
Introduction
Throughout the world, energy generation is mainly dependent on fossil fuels (Sumair et al., 2020g) which are deteriorating the environment rapidly. Therefore, keeping in view the increasing global energy demand and negative impacts of fossil fuels usage, renewable energy sources (RES) must be utilized to maximum capacity. RES are characterized as being environmental friendly sources of energy having zero or minimal carbon emissions (Khahro et al., 2014c); wind energy is one of those RES which is seeking attention due to its environmentally friendly nature and abundance (unlike fossil fuels which are limited in amount and are continuously dwindling with their usage). Global wind installed capacity, which was 196 GW(Khahro et al., 2014b) and 282 GW (Khahro et al., 2014a) at the end of 2010 and 2012 respectively, increased to 563 GW (IRENA, 2019) at the end of 2018 and is currently more than 622 GW(IRENA, 2020).
Like global energy scenario, there is an arising tendency of utilizing wind energy in Pakistan. Since 2008 when installed wind capacity in country was about 6MW, there has been observed significant increase as currently installed capacity has grown to 1236 MW (Sumair et al., 2020f). Although, this is manifolds enhancement, it is much less than its theoretically existing potential which is estimated as 346 GW (Sumair et al., 2020f). Pakistan Meteorological Department (PMD) conducted a survey to locate the most lucrative sites of wind potential and it is reported that a wind corridor along the coastline of Sindh and Balochistan provinces is rich with theoretically estimated potential of 43 GW) (Baloch et al., 2017; Shoaib et al., 2017). However, site-specific wind potential estimation remains untouched in many of these areas; one such site is Shahbandar whose wind potential needs to be estimated as this maybe an attractive site to develop future wind projects by Government of Pakistan (GOP).
Throughout the literature, Weibull distribution has been most widely used (Sumair et al., 2020c). Wind potential at six stations in Turkey was estimated using seven years data measured at 10 m height, given in (Ucar and Balo, 2009). Similarly, wind potential at Belen-Hatay (Turkey) (Sahin and Bilgili, 2009) was estimated using hourly recorded wind data collected over two years period (2004-2005). (Ucar and Balo, 2011) estimated wind power potential at Ankara and Polatli (Turkey) using Weibull distribution. Wind energy at 15 locations in Iraq was estimated using 10 years wind data (Darwish and Sayigh, 1988) and Weibull distribution. Off-shore wind resource at mainland costs of Saudi Arabia was estimated using Weibull function (Rehman, 2005). Many other researchers presented in (Celik, 2003; Fazelpour et al., 2017; Sumair et al., 2020a, 2020b) also applied Weibull distribution to estimate wind power potential.
Along with accurate probability distribution, wind potential estimation depends upon the reliability in wind speed data. Generally, the wind speed is measured at convenient lower heights because measurement at higher heights itself is costly, therefore, extrapolation of measured wind data is needed (Shami et al., 2016). Many researchers have performed extrapolation of wind data, for instance, as presented in (Werapun et al., 2017). 10-minutes wind data spanning over one-year period (December 2011-November 2012) was measured at hub height of 65 and 120 m respectively and shear exponent (WSE) was found to be 0.355. Wind data measured at 65 m height was extrapolated using 1/7th power law and energy generation from measured wind data and extrapolated wind data was estimated and compared and it was found that a difference of about 35% in estimated energy generation can occur.
Wind shear exponents (WSEs) were estimated at three representative sites in south of Italy (Gualtieri and Secci, 2011). Six years (1997-2002) hourly recorded wind data was used to calculate WSE. Mean values of WSE at three sites were found to be 0.271, 0.232 and 0.150 respectively. Diurnal, monthly and seasonal variation in WSE was analyzed along with the estimation of wind predominant direction. Using local temperature and pressure data, mean air density was also estimated. Wind potential was assessed at 50 m height using Weibull probability density function and wind probability distributions were evaluated. The most suitable turbine at each site was also determined based on its energy generation. Furthermore, comparison of energy generation using extrapolated wind data from 10 m to 50 m using 1/7th power law and using actual WSE was also carried out.
Wind potential estimation at Rawdat Ben Habbas (Saudi Arabia) was made using wind data collected for one-year period (S. Rehman, 2007). Temperature, pressure and relative humidity etc. were also recorded at 2 m height. WSE was estimated and it was found to be varying between 0.280 and 0.360 while air density varied from 1.076 to 1.187 kg/m3. Energy production estimation showed that a 30 MW wind project is able to produce 88,096 MWh with capacity factor of 33.5%. Similarly, Wind energy production using three wind turbines of 0.60, 1.00 and 1.50 MW was estimated at Rafha (Saudi Arabia)(Rehman et al., 2007). Wind speed data collected over a period of 1985-2004, measured at 12 m height, was used which was extrapolated to 60 m height using 1/7th power law. Similarly, (Rehman, 2009) extrapolated wind data using calculated real WSE. Energy generation using 2.75 MW turbine was estimated and it was found that 6,681; 6,875 and 7,049 MWh/year energy could be produced at three higher heights respectively.
Wind speed characteristics at Gassim (Saudi Arabia) were investigated (Al-Abbadi and Rehman, 2009) using Weibull distribution and WSE was estimated and it was found that mean WSE is 0.337. Annual energy generation was estimated using 2.75 MW turbine and it was found that 6,554.70; 7,634.80; and 8,563.50 MWh/year could be produced at 60, 80 and 100 m heights respectively. A similar work for a representative site in Saudi Arabia is presented in (Rehman et al., 2009). In which two years (2006–2007) hourly recorded wind data was used to calculate WSE which was found to be 0.346. WSE was used to extrapolate the wind data. Monthly mean energy values were found to be varying from 698.00, 810.00 and 907.00 MWh in November to 978.00, 1081.00 and 1164.00 MWh in June.
As it is evident that accurate extrapolation of wind data is very important. Therefore, it must be done considering site-specific wind characteristics rather than simply relying on generalized wind shear exponents. Therefore, this work estimates the wind potential at Shahbandar (a site along the coastal belt of Pakistan) by extrapolating wind data using 1/7th and site-specific wind power law. Comparison of predicted data from both models is carried out along with technical evaluation of annual energy production using different turbines.
Material & methods
Mathematical modelling
Wind power law
Wind power law as given in (Khahro et al., 2014c; Sumair et al., 2020e) has widely been used to extrapolate the wind data. It is given as follows
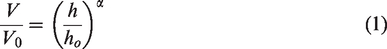
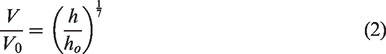
V is required wind speed (extrapolated wind speed), V0 is measured wind speed at lower height, h is higher height, ho is lower height and α is wind shear exponent (WSE). A generalized case of equation (1) is given in equation (2) in which WSE equals 1/7. Therefore, equation (2) is termed as 1/7th power law.
However, to determine WSE for a particular site, measured data at two heights is required. When this data is available, WSE is evaluated using equation (1) and taking its natural logarithm, as given in equation (3)
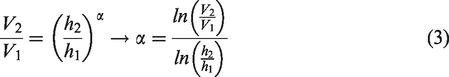
Where V2 and V1 are wind speeds at two different heights of h2 and h1 respectively.
Variation in air density (ρ)
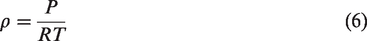
Air is a highly compressible fluid whose density depends upon local temperature (T) and pressure (P). As one moves above from ground, both vary and this variation in temperature and pressure in troposphere in reference to the known temperature To, pressure Po and a constant β (5.87 K/km) is given as equation (4) and equation (5) (Elger et al., 2016) respectively.


Air density is calculated using ideal gas equation as follows:
Weibull distribution
Among various available statistical distributions, this is mostly applied for wind data. It is given below (Sumair et al., 2020d, 2020g):
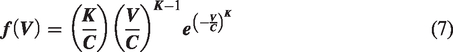
Where V is any wind speed, K and C are shape and scale parameter (ms−1) respectively which were calculated using equation (8) and equation (9) as given in (Sumair et al., 2020a)


Wind power density (WPD)
WPD is calculated using equation (10)
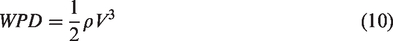
As mean of wind speed data, V in equation (10), is not a true represenative of wind potential, therefore, there is a need to estimate WPD by summing the instantaneous WPDs Hence, a more relaistic and accurate approcah to estimate wind potentail is given as follows:
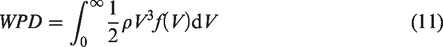
equation (12) was used to measure the correctness od weibull model.
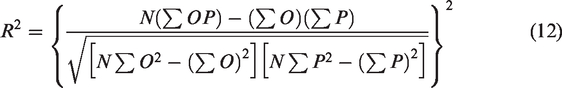
N is total number of obervations, O is observed frequency and P is predicted or estimated frequecny value.
Annual energy production (AEP)
How much energy a certain energy producing plant will produce? This is a decisive number for investing in a typical power project. In wind power production, energy produced by a typical turbine per year (AEP) can be estimated using equation (13)

Where
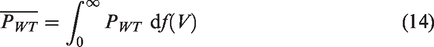
Performance evaluation of a typical wind trurbine is often described by its actual power production (AP) to its power production capacity i.e. rated power (RP). This important parameter is known as capacity factor, given as below:
Results & discussions
Variation in WSE and air density
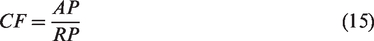
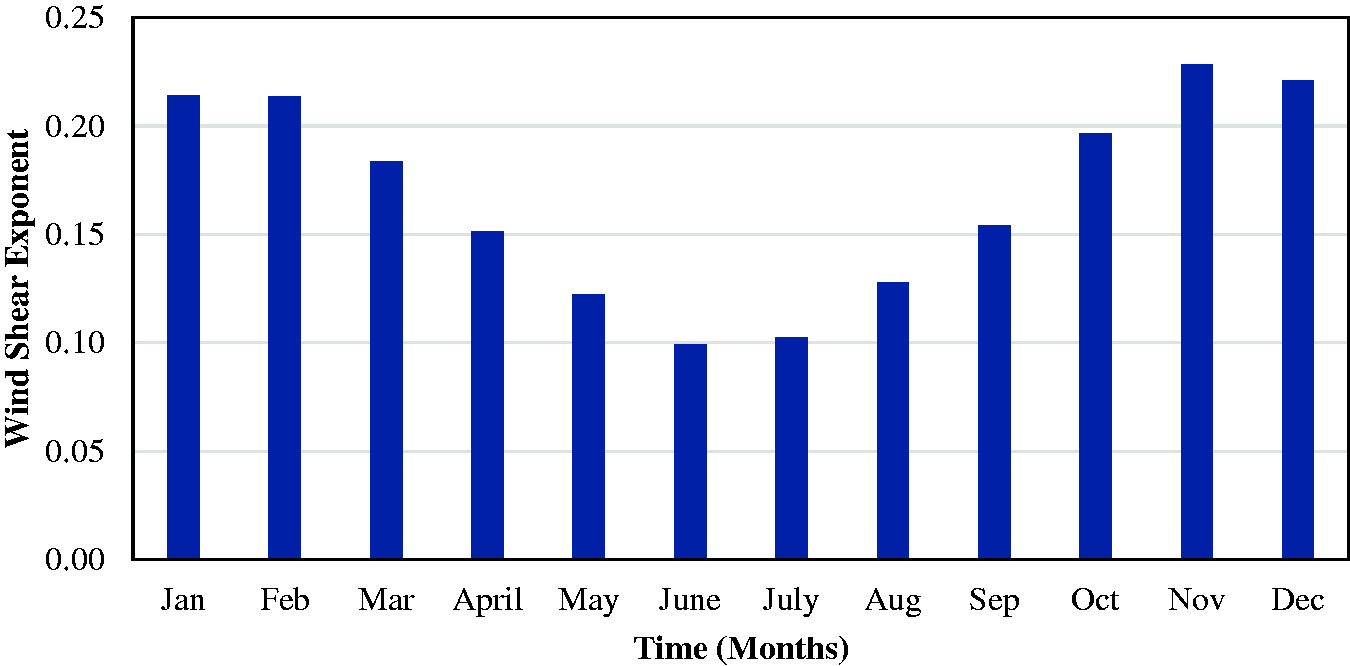
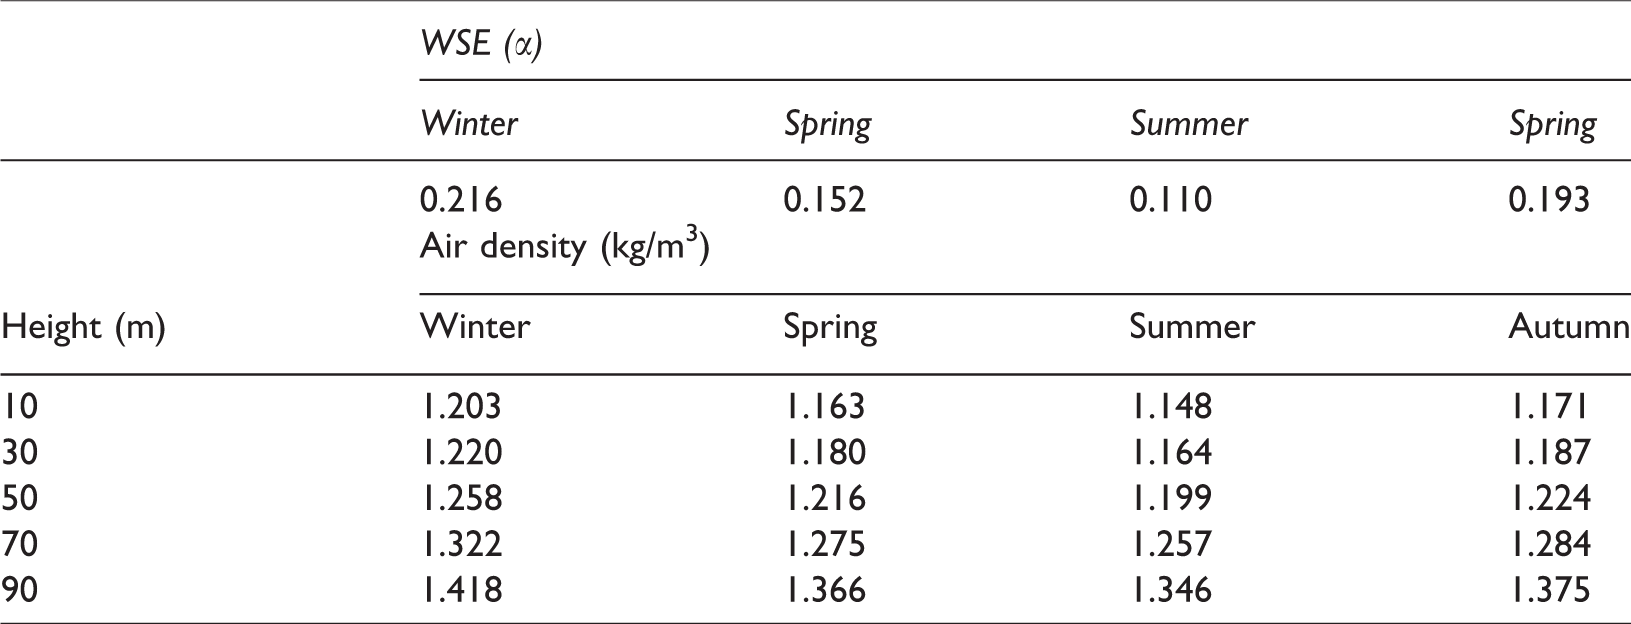
Seasonal values of WSE are given in Table 2. Moreover, variation in WSE has also been given in Figures 1 and 2 respectively. Analysis showed that WSEs are maximum in December and minimum in June. The reason is the physical phenomenon behind wind formation. As the temperature increases, better mixing of wind gusts takes place and hence lower are the values of WSE and vice versa.
Monthly based variation in WSE at Shahbandar.
Seasonal based variation in WSE at Shahbandar.
Air density at five different heights and their mean seasonal values at each height are given in Table 1 along with graphical representation shown in Figures 3 and 4. Analysis showed that at any height, air density is minimum in June (summer) and maximum in December (winter). As pressure remains almost constant throughout the year at a height, but temperature varies greatly from summer to winter, hence, density is found maximum in winter and vice versa. Moreover, density has been found to increase with height. As one goes above sea level, both the temperature and pressure decrease within troposphere with temperature decrement more significant than pressure decrement. Therefore, temperature factor predominately affects the density and it increases with decreasing temperature at higher height. An increase in density of about 17.52% has been observed from 10 m to 90 m height.
Seasonal average values of WSE and air density.
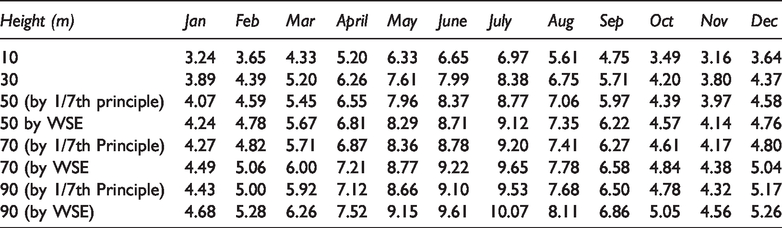
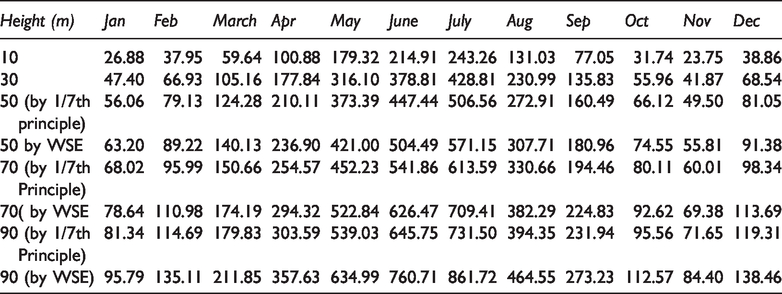
Monthly values of wind speeds at five heights at Shahbandar.
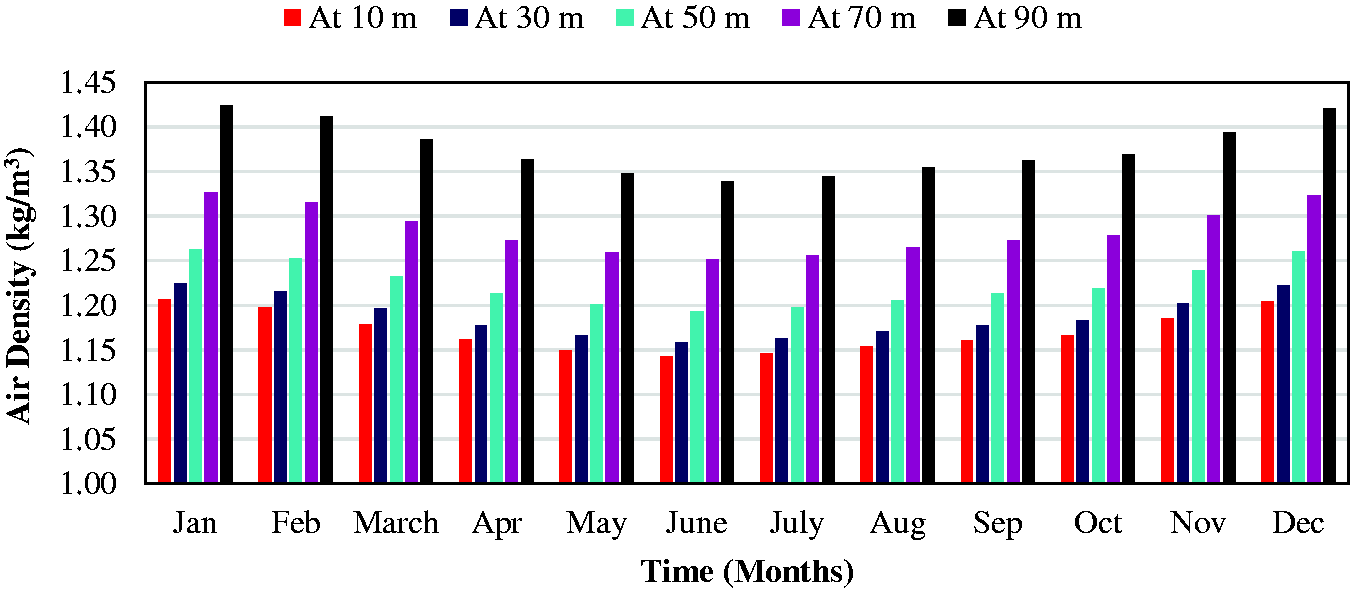
Monthly based increment in air density with height at Shahbandar.
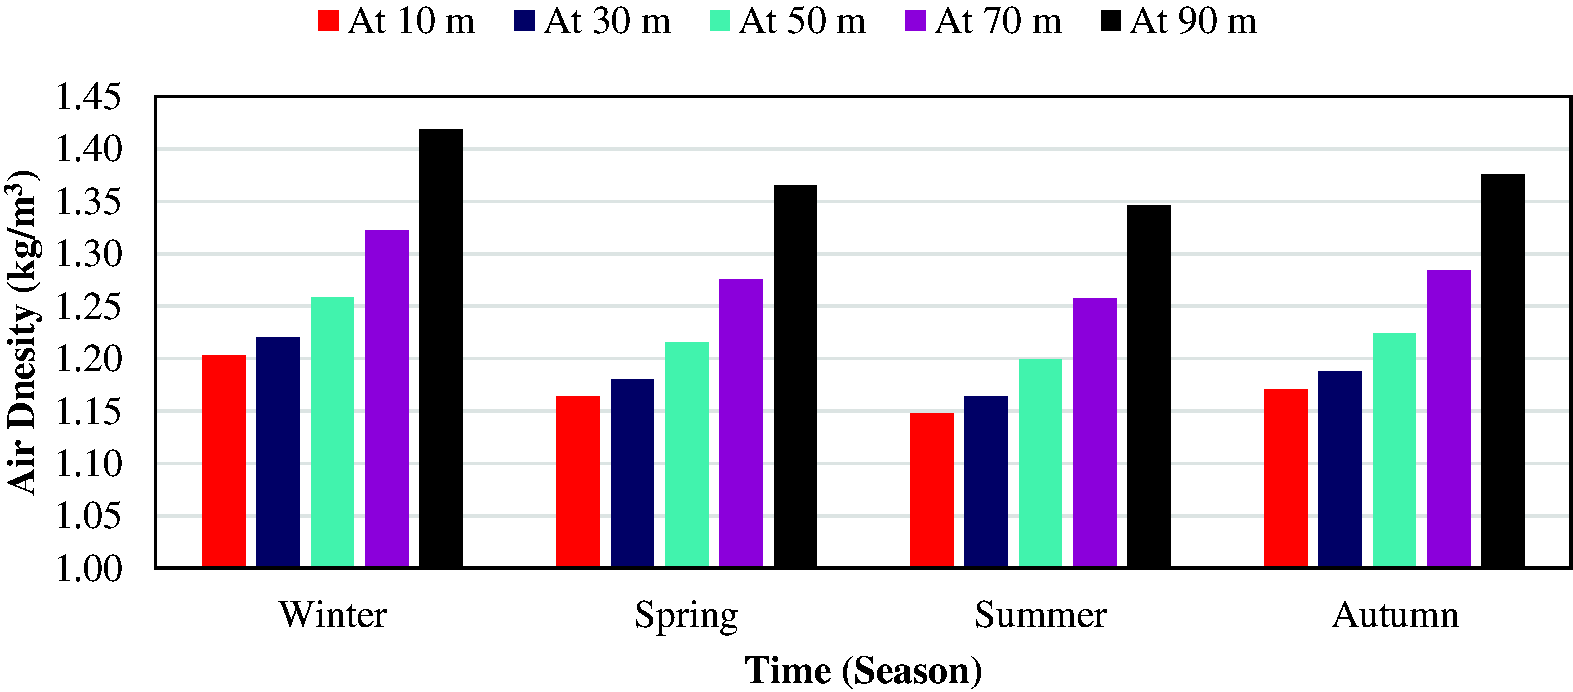
Seaosnal based increment in air density with height at Shahbandar.
Variation in wind speed
Measured and extrapolated data is written in Table 2. Also, graphical analysis has been presented in in Figures 5 and 6 which shows that maximum wind speed occurs in summer (July) while minimum in winter. With increase in height, speed increases significantly. An increase of about 44.60% in wind speed has been observed from 10 m to 90 m height. As wind speeds at three higher heights were extrapolated using two models, comparison of these two models shown in Figure 7 represents that there is a difference of about 4.10%, 5.00% and 5.30% in predicted values by two models at 50, 70 and 90 m heights respectively with 1/7th model predicting lower values than the other.
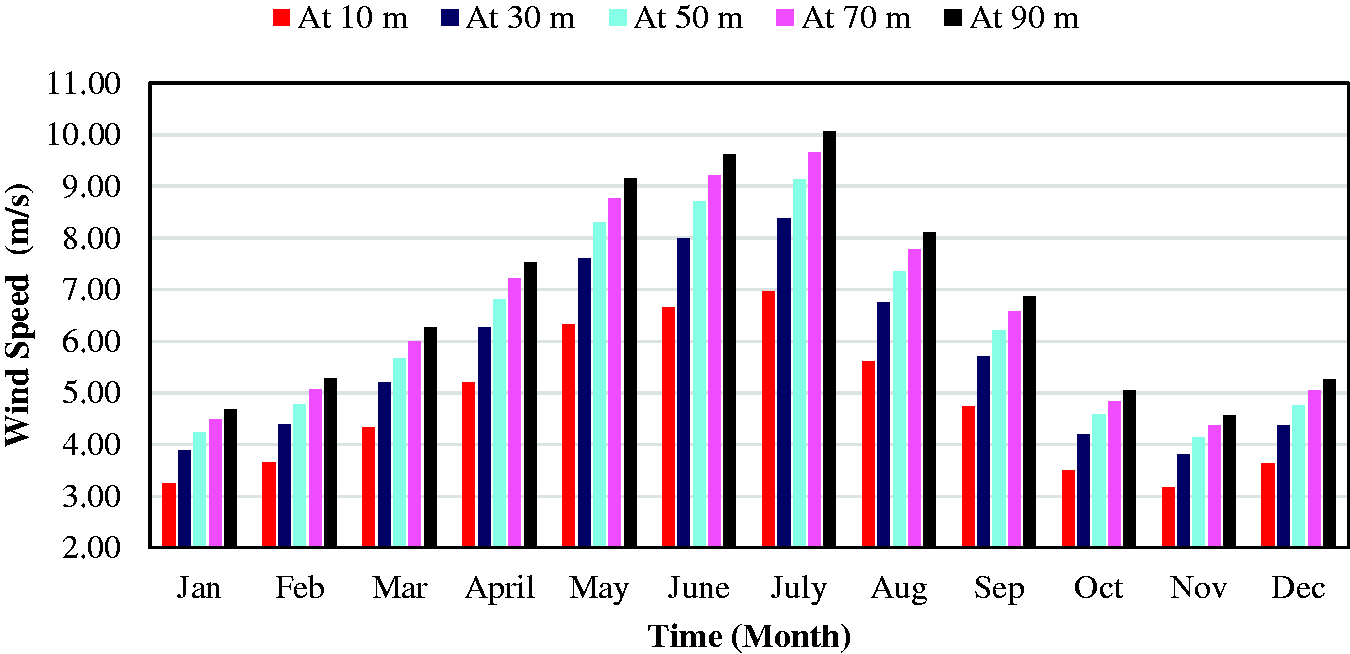
Monthly based increment in wind speed with height at Shahbandar.
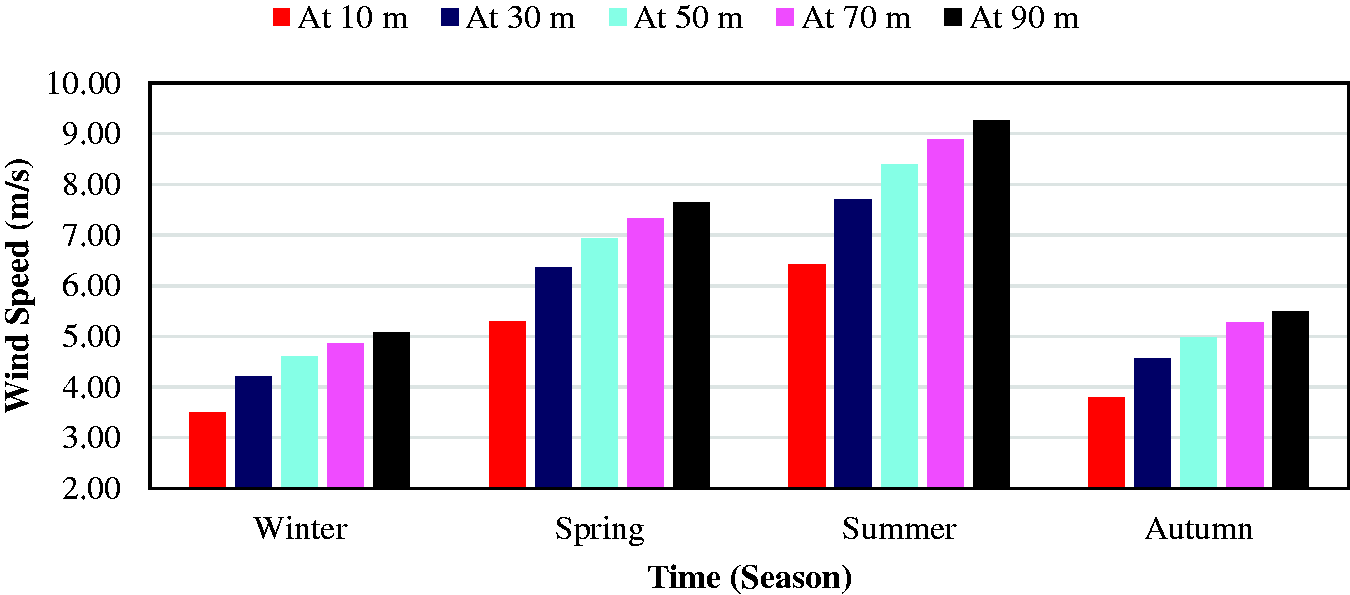
Seasonal based increment in wind speed with height at Shahbandar.
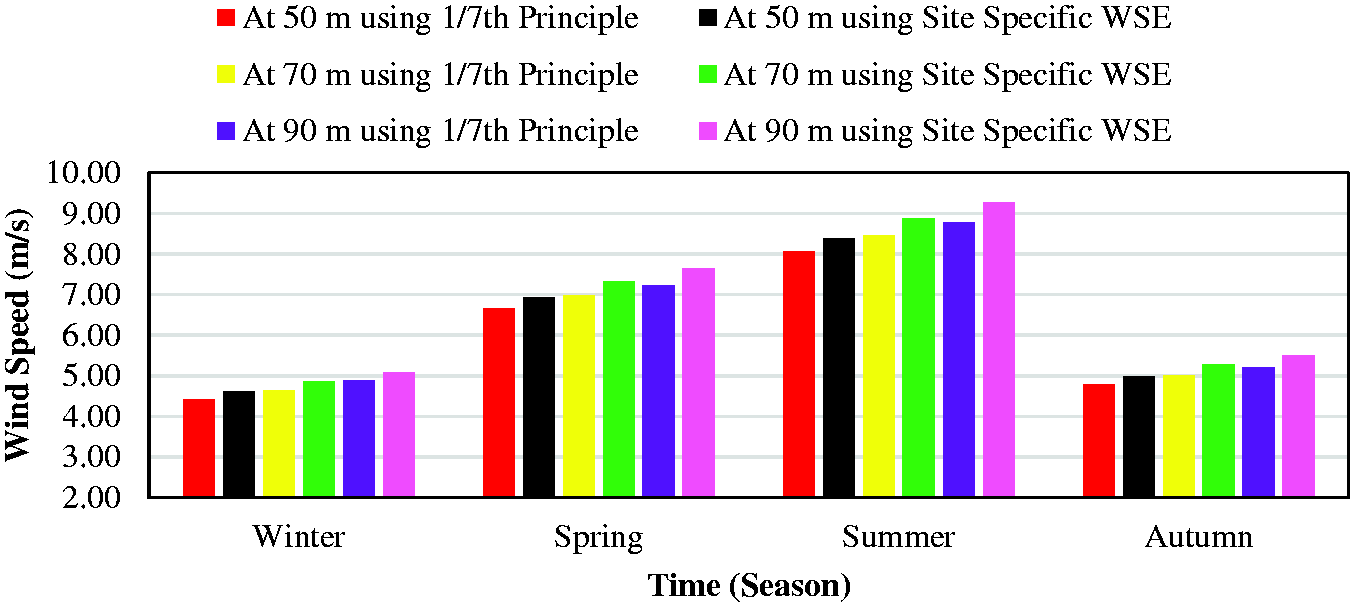
Comparison of predicted wind speed values by 1/7th and site-specific wind power law.
WPD
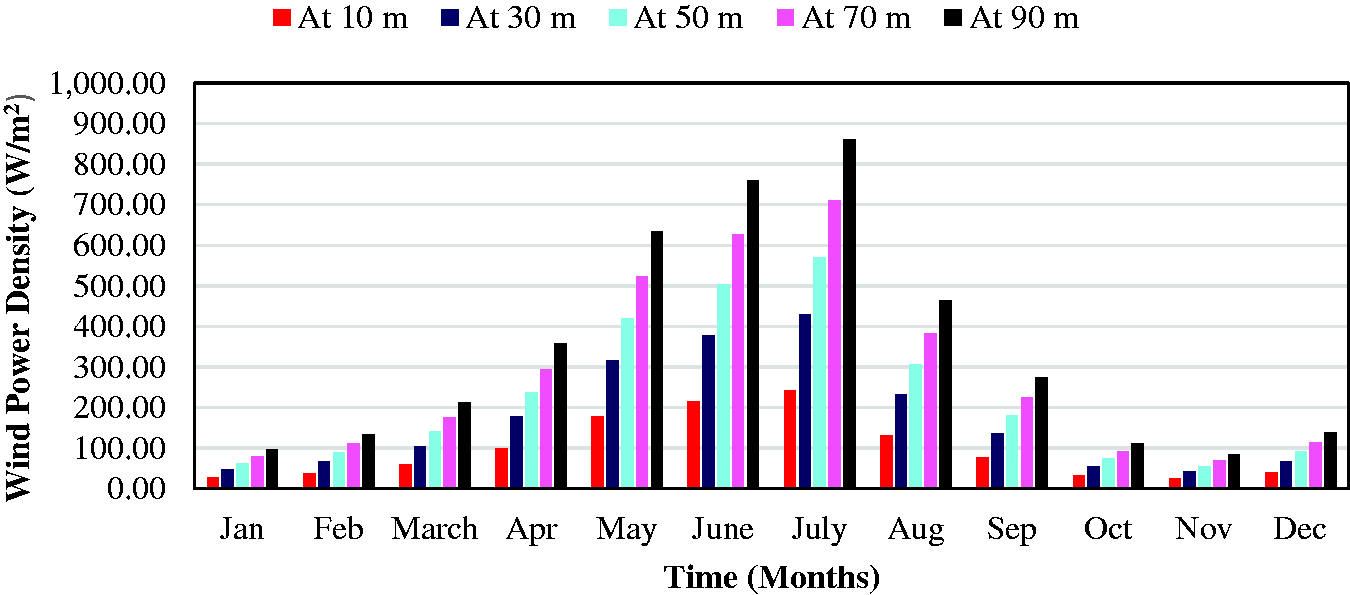
WPD values are given in Table 3 and their variation with height have been graphically shown in Figures 8 and 9 respectively. Analysis showed that maximum WPD occurs in summer and minimum in winter which is coincident with the corresponding variation in wind speed. An increase of about 254.51% in WPD has been observed from 10 m height to 90 m height. Moreover, increase in WPD with height is slightly higher in winter (256.20%) than in summer (254.20%). The reason is that winter is characterized by higher WSE and higher air density; both contribute towards increasing wind power density at faster rate than in summer. Comparison of wind power density values, depicted in Figure 10, predicted by both models shows that there is a difference of about 13.00%, 16.00% and 18.00% between predicted values by both models at 50, 70 and 90 m height respectively.
Monthly mean wind power density (W/m2) values at five heights at Shahbandar.
Monthly based increment in WPD with height at Shahbandar.
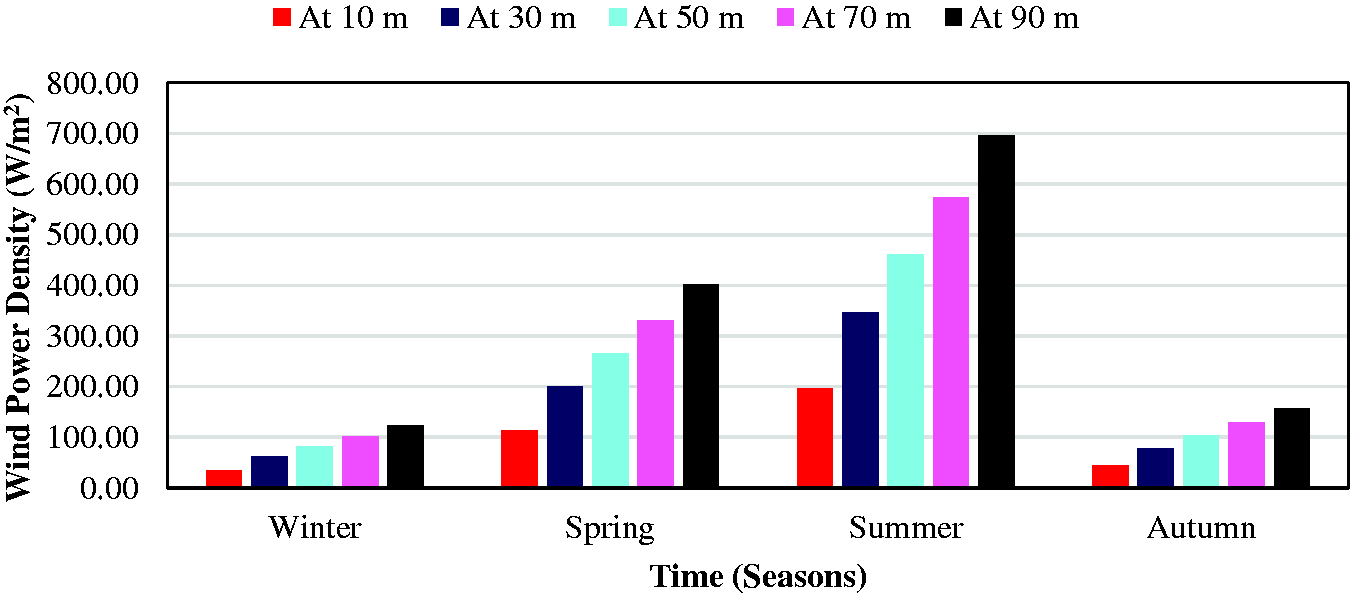
Seasonal based increment in WPD with height at Shahbandar.
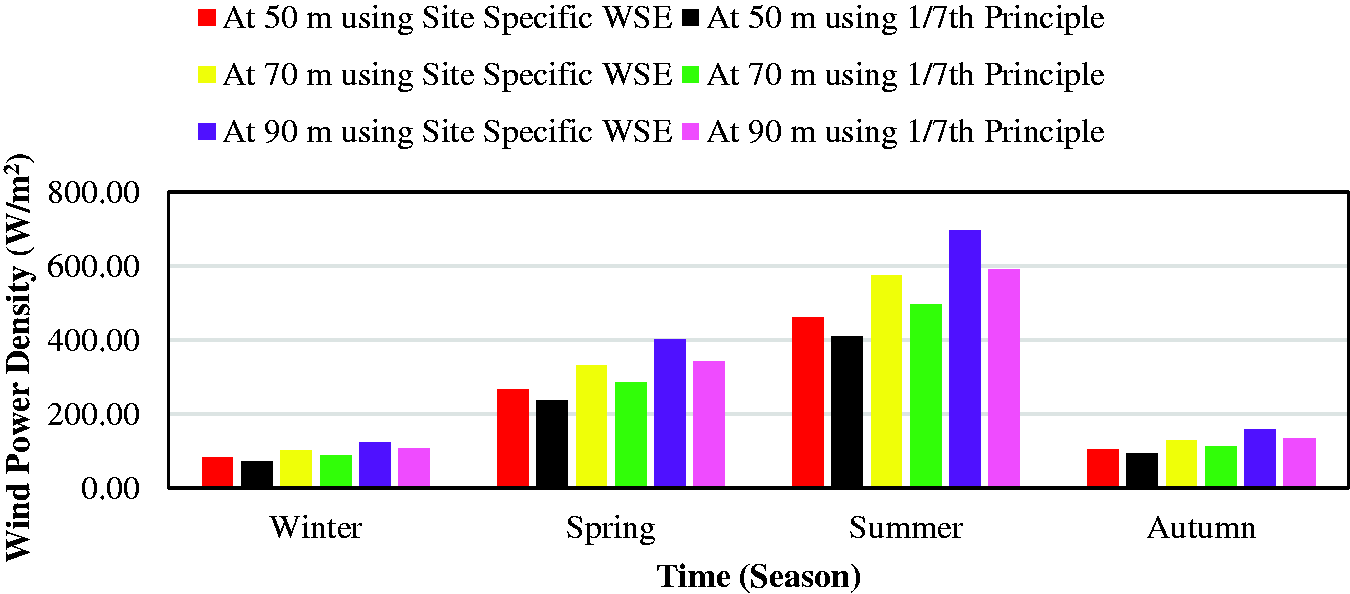
Comparison of predicted wind power density values by 1/7th and site-specific wind power law.
Weibull distribution
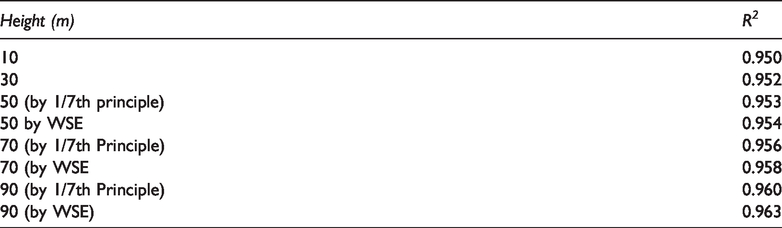
R2 values have been listed in Table 4 and comparison of distribution curves for all five heights is shown in Figure 11. Analysis shows that the curve’s spread on X-axis increases with height and its peak along Y-axis decreases. This is so because, spread on X-axis represents the wind speed which increases with height and peak describes the reverse. The higher the peak, lower will be the wind potential. Therefore, as with increase in height, wind power potential increases, so the curve spreads more and flattens (with decreasing peak). Comparison of distribution curves for three extrapolated heights predicted by two models has been shown in Figure 12 which also shows that curves drawn from site-specific wind power law are relatively more spread and flatter than those predicted by 1/7th power law. The reason is again the same; 1/7th wind power law predicts lower wind speeds (and hence lower potential) than the other model.
Coefficient of determination at five heights at Shahbandar.
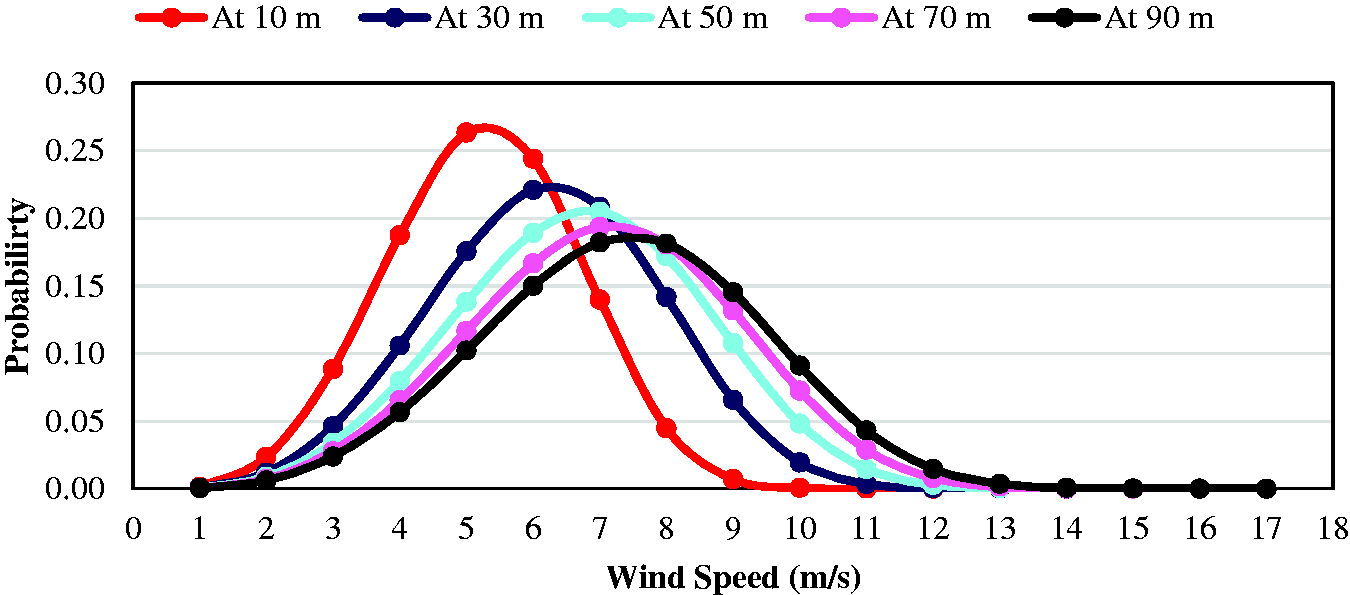
Weibull distribution curves for five heights at Shahbandar.
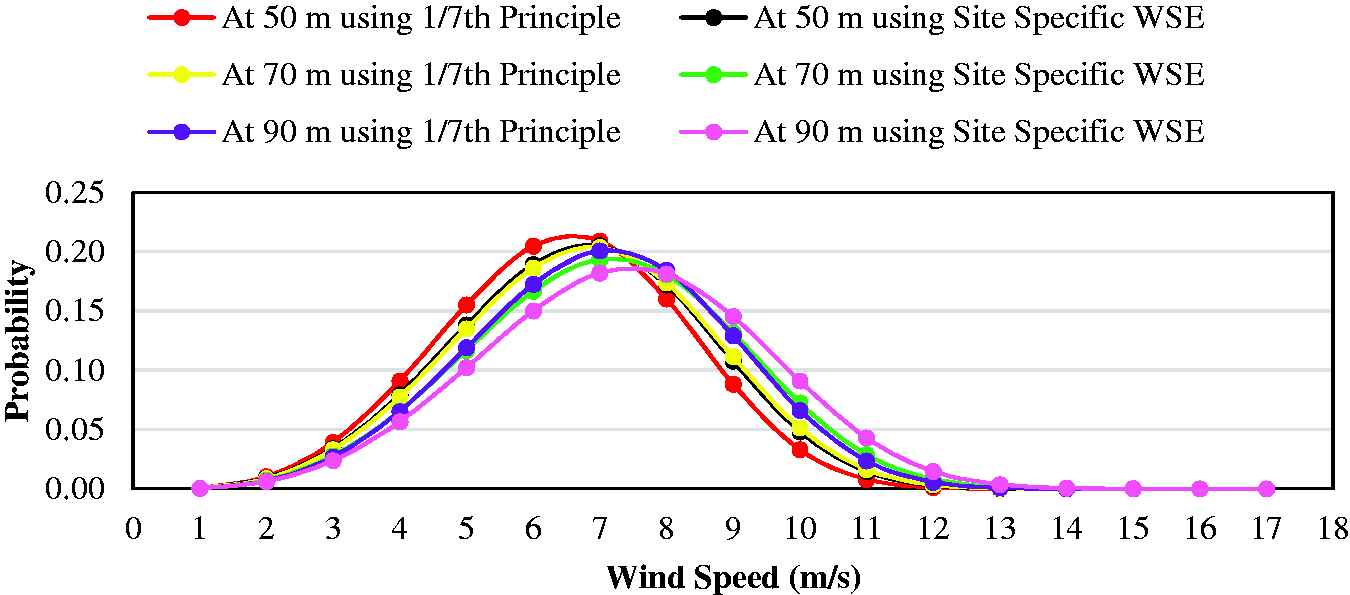
Comparison of Weibull distribution curves predicted by 1/7th power law and site-specific power law at three heights at Shahbandar.
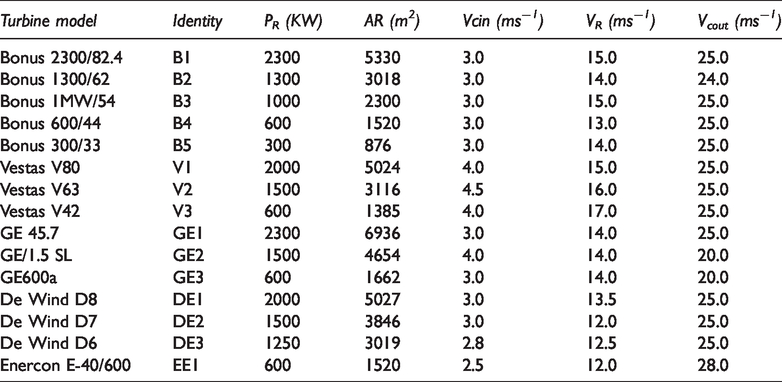
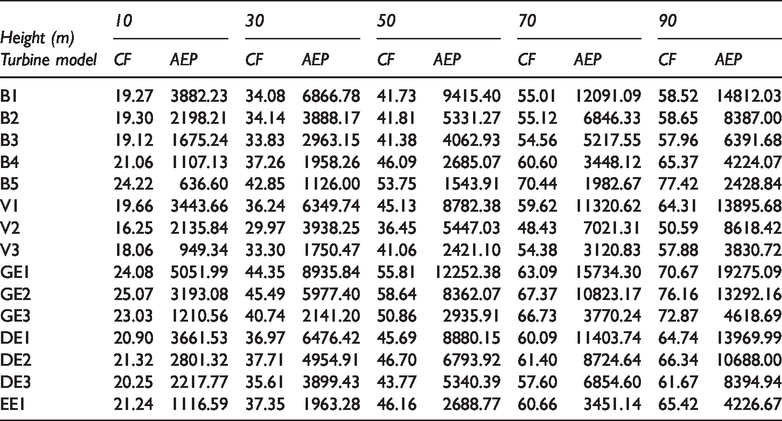
Technical analysis of annual energy production
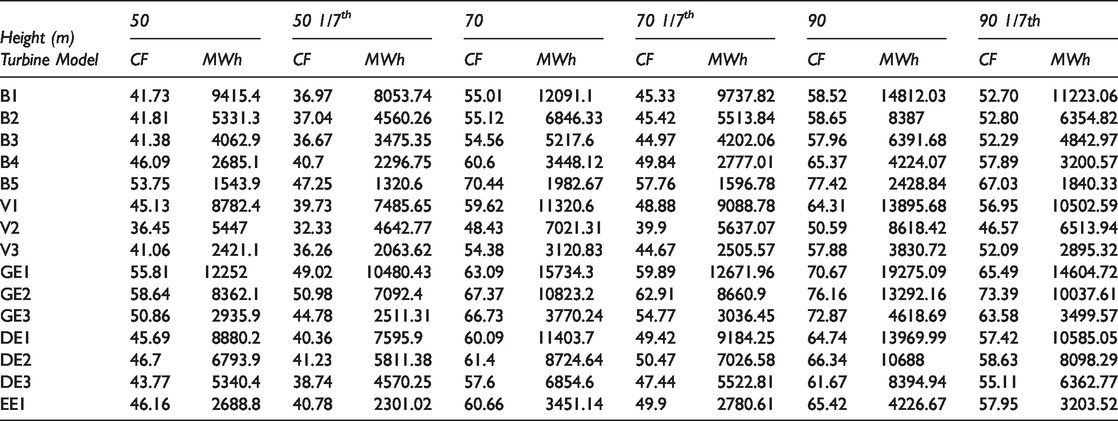
Table 5 carries the specifications of various turbines and energy production along with capacity factors are given in Table 6 for all five investigated heights. It has been observed that GE1 turbine produces the maximum energy while B5 produces the least. On the other side, GE2 has the maximum capacity factors while V3 has the minimum. Moreover, an increase in energy yields of about 303.52% has been observed from 10 m to 90 m height. Comparison of annual energy yields at three extrapolated heights by two models has been done and values listed in Table 7. Analysis shows that there is a difference of about 17.32%, 24.56% and 32.31% in energy yields estimated by two models at 50, 70 and 90 m height respectively with 1/7th model estimating lower values.
Technical specifications of wind turbine models.
Annual energy production, AEP (MWh) and capacity factors, CF (%) at five heights at Shahbandar.
Comparison of AEP and CF values estimated based on 1/7th wind power law and site-specific wind power law.
Measured Data versus Extrapolated Data
Accurate wind potential estimation requires accurate wind data determination. Four years wind data was available at 10 and 30 m heights which was extrapolated to three higher heights by using two models. A substantial difference between predicted values by two models has been observed. Therefore, there is a need to determine which of the two models estimates the wind data closer to measured wind data. Measured wind data at 50 m height was obtained for 2.5 years (Jan 2016-June 2018). Therefore, this measured data was compared with extrapolated data for same duration, as shown in Figure 13 which shows that site-specific wind power law predicts values closer to measured data than 1/7th power law. Hence, site specific wind power law can be considered the accurate one and hence 1/7th power law is said to underestimate the wind potential.
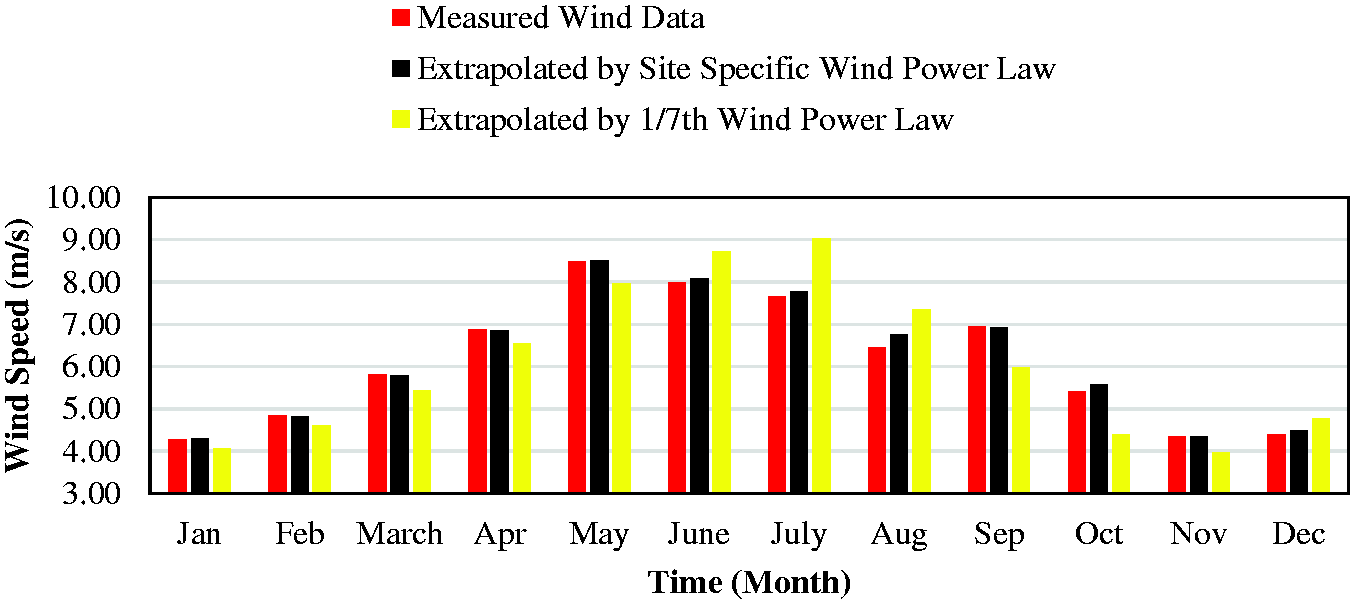
Comparison of measured data with extrapolated wind data.
Conclusion
Wind shear exponents (WSE) greatly vary throughout the year with highest values observed in December (winter) and lowest in June (summer). The reason is the temperature variation. The higher the temperature, the better mixing of wind gusts takes place and hence lower values of WSE are observed. Air density values are found to be minimum in summer and maximum in winter. As pressure remains almost constant throughout the year, however, temperature increases substantially in summer, so air density is lower in summer and vice versa. 1/7th wind power law underestimates the wind speed values by 4.10%, 5.00% and 5.30% at 50, 70 and 90 m height respectively and this difference is about 13.00%, 16.00% and 18.00% in wind power density values and 17.32%, 24.56% and 32.31% in annual energy yield values. Performance comparison of turbines shows that GE1 and B5 are maximum and minimum energy producing turbines respectively. On the other hand, GE2 has maximum CFs while V3 has the minimum. Comparison of measured data with predicted data shows that site specific wind power law predicts wind data more accurately than 1/7th wind power law.
Footnotes
Declaration of conflicting interests
The author(s) declared no potential conflicts of interest with respect to the research, authorship, and/or publication of this article.
Funding
The author(s) received no financial support for the research, authorship, and/or publication of this article.