
Abstract
Small wind turbines of 1–3, 5–10, and 15–20 kW rated powers are used to find out suitable and efficient turbines for power generation in the eastern region of Saudi Arabia. Additionally, the effect of hub height on energy output and the plant capacity factor is investigated to recommend an optimal hub height to be used in the present case. To achieve the set objectives, hourly mean wind speed data measured at 20, 30, and 40 m and wind direction at 30 and 40 m during 13 September 2005 to 9 May 2010 have been utilized. The annual mean wind speed values were 5.73, 5.34, and 4.75 m/s at 40, 30, and 20 m with north-north west (NNW) prevailing wind direction. An increase of about 20.7% was estimated in wind speed measured at 40 m compared to that at 20 m. Wind turbines Fortis Passat—1.4 kW, Fortis Montana—5.8 kW, Fortis Alize—10 kW, and CF20—20 kW with annual energy and plant capacity factor of 7.015 MW h and 57.2%, 25.955 MW h and 51.08%, 42.603 MW h and 48.63%, and 54.674 MW h and 31.21% were the most efficient turbines for the chosen location, respectively. Highest percentage increase in annual energy yield was obtained for a mere change of 5 m from 15 to 20 m in hub height in the present case study. The next best annual energy yield was obtained while increasing hub height from 20 to 30 m.
Keywords
Introduction
Globally increasing population, fast technological development, luxurious, and materialistic life styles have resulted in disproportionate increase in power requirements. Hence new and renewable sources of energy in addition to regular means of power generation are being explored to meet the increasing demands. Exploitation and utilization of clean energy sources reduces the dependence on fossil fuels which means reduction in greenhouse gases emissions and facilitates energy supply at places where there is no national or regional electrical grid. The fast developing and widely used sources of clean energy include the wind, solar thermal, solar photovoltaic (PV), hydro, geothermal, and biomass. Of these clean sources, wind energy has been accepted commercially due to its availability, ease of maintenance, and low cost of operation. The global cumulative wind power installed capacity reached 369.597 GW by the end of 2014 compared to 318.644 GW in 2013, an increase of 16% (GWEC, 2015). The global annual cumulative wind power growth is shown in Figure 1. With cumulative installed capacity of 91.413 GW, China remained the leader in wind power industry as of December 2014. The USA, Germany, Spain, and India remained at second, third, fourth, and fifth place with total cumulated wind power installed capacities of 65.879, 39.165, 22.987, and 22.465 GW, respectively. With respect to new additions in 2014, China was number one with 23.196 GW (45.1%) and Germany at number two with 5.279 GW (10.2%) new installations. However, USA, Brazil, and India remained third, fourth, and fifth with new capacity additions of 4.854 GW (9.4%), 2.472 GW (4.8%), and 2.315 GW (4.5%), respectively.
Global cumulative annual wind power installed growth (GWEC, 2015).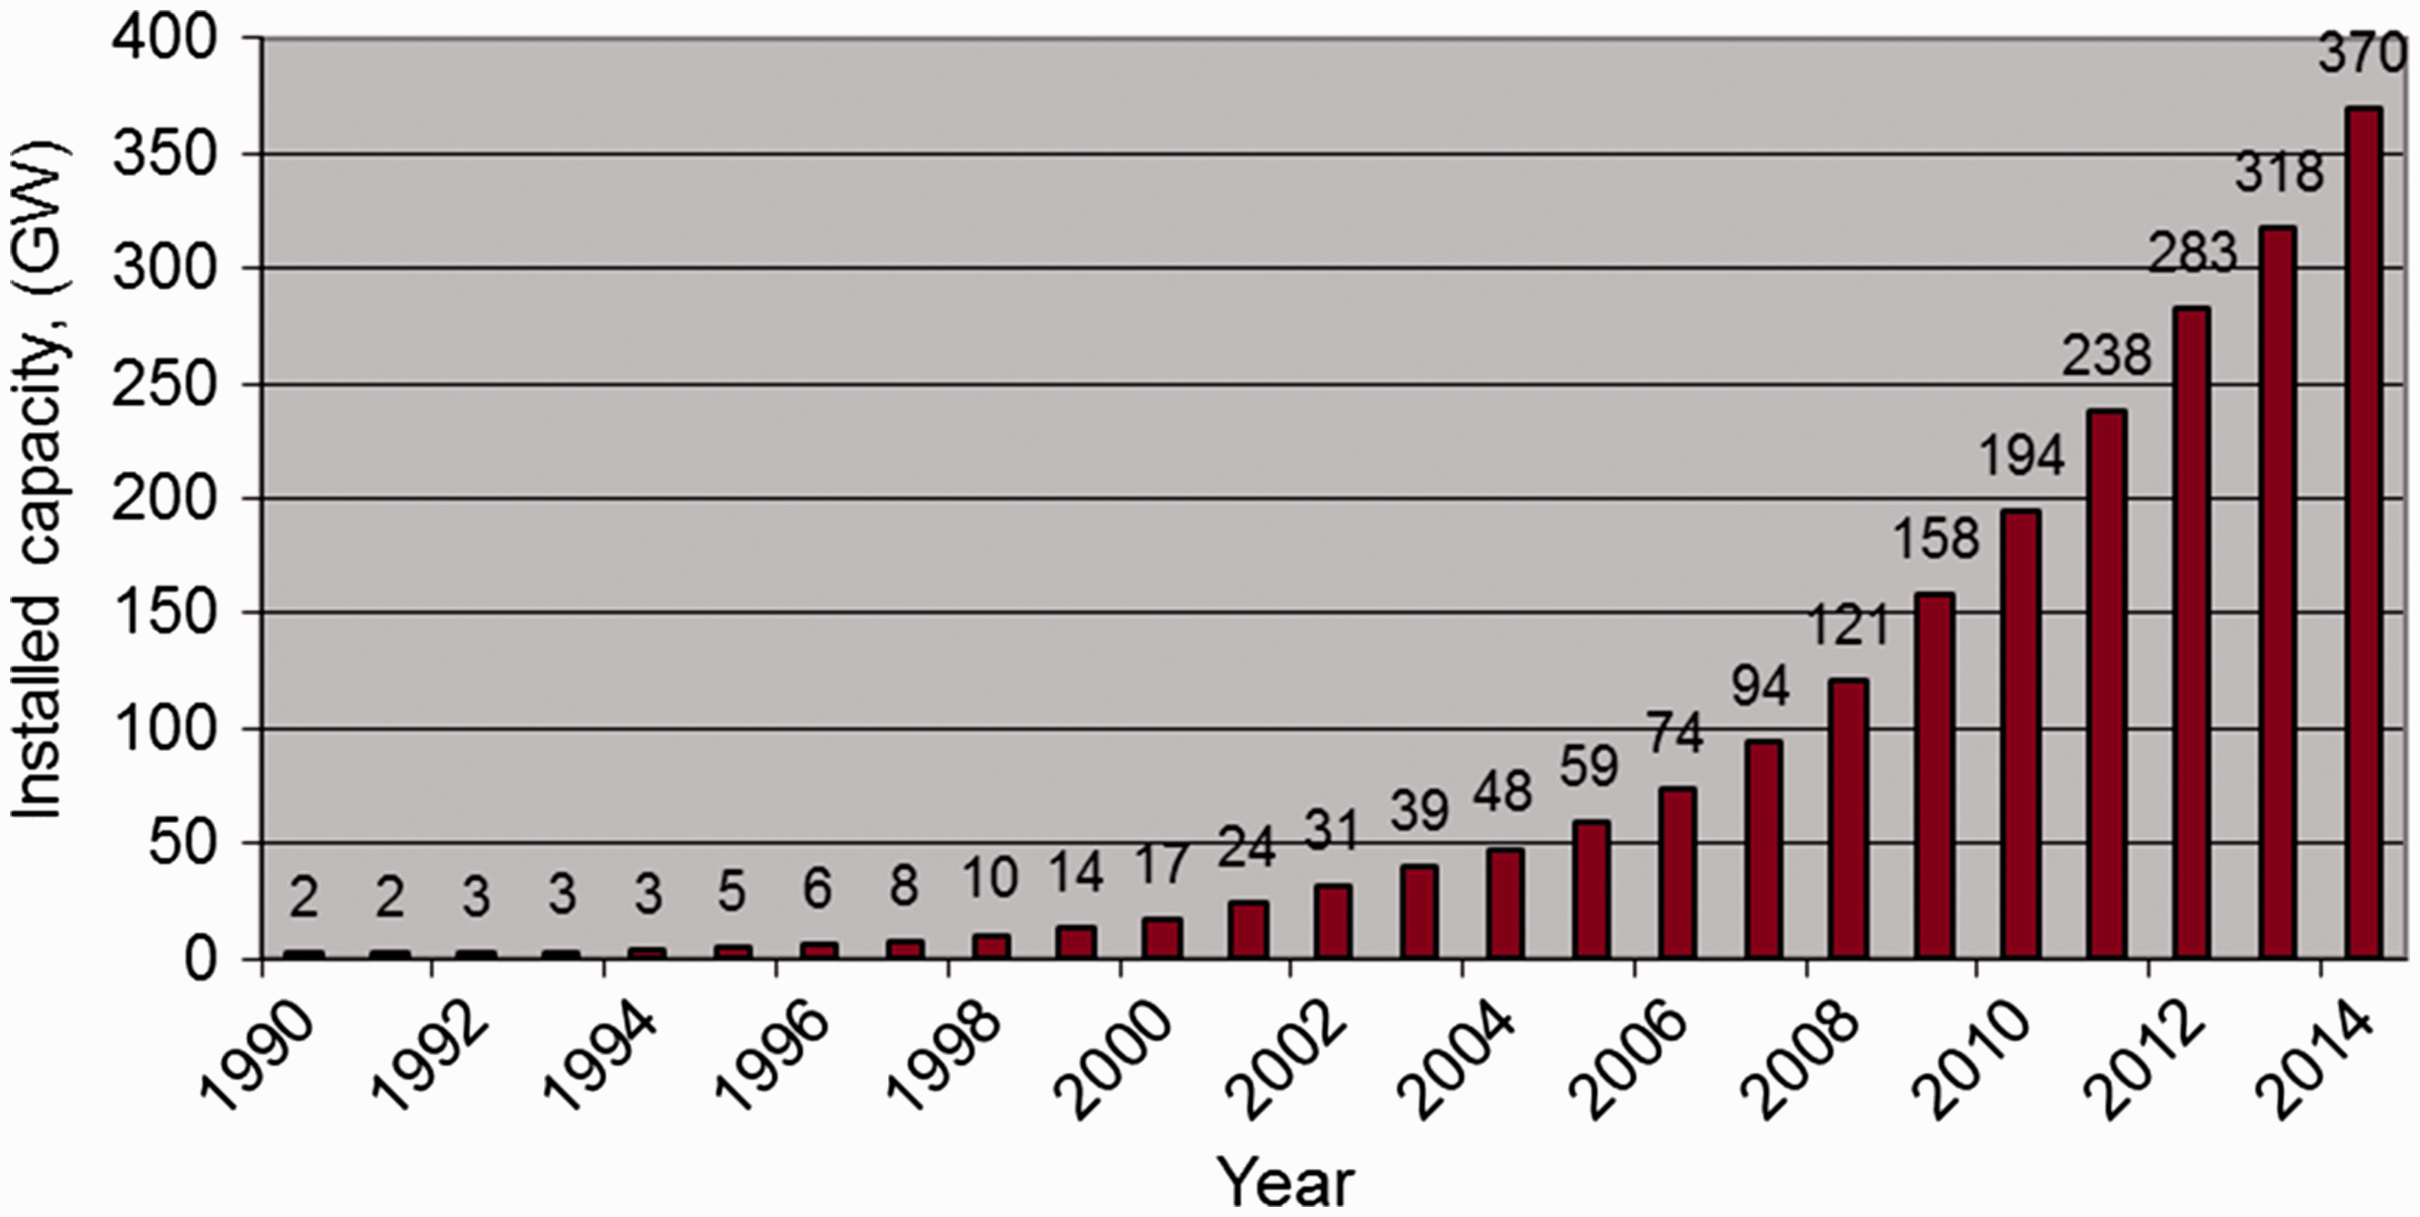
Saudi Arabia is a vast country and is well connected with asphalted roads network and with electrical grid. Beside all efforts by the government, there are still some isolated areas and small communities and villages which are not on the national grid due to being uneconomical. These villages and communities are being supplied power using diesel generation power plants developed and maintained by the national power utility. This option is very costly and skilled manpower intensive and hence the government is taking initiative to use new and renewable sources of energy like wind, solar thermal, and solar PV to meet partial load requirements of these communities and villages. To investigate the possibility of using small wind turbines for various applications in Rawdat Ben Habbas (RBH), the present study has been initiated.
Small wind turbine applications include heating of greenhouses and residential buildings (Ozgener, 2010), hydrogen production for upgrading bitumen from oil fields (Olateju and Kumar, 2011), and water lifting (Abed, 1997), to name a few. According to Albani et al. (2014), all energy forms or sources have an adverse environmental impact but the wind energy does not, compared to conventional energy sources. Wind energy is one of the cleanest, benign, and environment friendly source of energy and is not going to diminish like fossil fuels having fixed and limited reserves (Al-Qabandi et al., 2014; Bassyouni and Gutub, 2013; Ozgur and Kose, 2006).
Lara et al. (2011) evaluated a 3 kW wind turbine for charging a battery bank of 48 V/880 A h by means of a six-pulse rectifier. Nagai et al. (2009) reported the performance of a 2 kW rated power wind turbine in terms of the functions of wind turbine rotational speed, generated outputs, and its stability for wind speed changes. The expected performance of the turbine was confirmed under actual wind conditions and it showed a power coefficient of 0.257 at an average speed of 7.3 m/s. Bekele and Tadesse (2012) conducted feasibility of small-scale hydro/pv/wind-based hybrid system for six sites. Ozgener (2006) presented energy analysis of a 1.5 kW turbine with a hub height of 12 m and rotor diameter of 3 m in Turkey. The test results showed that at an average wind speed of 7.5 m/s the turbine produced 616 W of energy.
Arifujjaman et al. (2008) modeled a small wind turbine with furling mechanism and its resulting dynamics using MATLAB/Simulink platform. The results indicated that the energy capture of a wind turbine depends on the control strategy, wind speed, and the Rayleigh distribution. Jowder (2009) investigated the site matching of wind turbines at 30 and 60 m heights by estimating the capacity factors of some commercially available wind turbines for its optimal selection. The study conducted by Bishop and Amaratunga (2008) proposed a distributed energy system using micro wind turbines of horizontal and vertical axis configurations of less than 500 W rated power. The study illustrated great potential of small wind turbines to be competitive with conventional wind farms. Mostafaeipour (2013) statistically analyzed the three hourly measured long-term wind speed data (1991–2004) of Kerman, Iran. Mean wind power based on measured data and Weibull distribution function as well as the relative percentage error between estimated values of wind power based on two methods have been studied and reported results for three small wind turbine having rated powers of 300 W, 600 W, and 1 kW, respectively. Sedaghat et al. (2012) have investigated the effect of turbulence on small wind turbines characteristics using open jet wind generating facilities.
Etamaly (2013) proposed an accurate procedure to choose the best site and suitable wind turbines. Authors analyzed 100 turbines to select suitable turbines for chosen best sites at Yanbo, Dhahran, Dhulom, Riyadh, and Qaisumah in Saudi Arabia. Bassyouni et al. (2015) used the wind data for a period of 11 years (2002--2012) to study the wind characteristics of Jeddah in Saudi Arabia. The results showed that maximum and minimum wind power potential was observed in the month of March and February. The study concluded that the wind potential of the region can be used for small-scale off-grid applications. Islam et al. (2013) proposed a comprehensive study to highlight the recent and future trends of wind energy technology, and estimated that within next 2–3 decades the vertical axis wind turbines (VAWT) can dominate the wind energy technology. Chen et al. (2013) used a statistical method in combination with linear wake model and wind turbine power curve to model the wind speed distribution for wind power assessment for optimal micro-siting. Kishore et al. (2013) proposed the design of a small-scale wind energy portable turbine targeted to operate below 5 m/s wind speed. Simic et al. (2013) performed a detailed study and analysis of small wind turbines with less than 10 kW of installed power.
The present study utilizes wind speed measurements made at different heights over a period of around five years at RBH meteorological station to evaluate the performance of 14 horizontal and eight VAWTs of 3–20 kW rated power.
Data, site, and material description
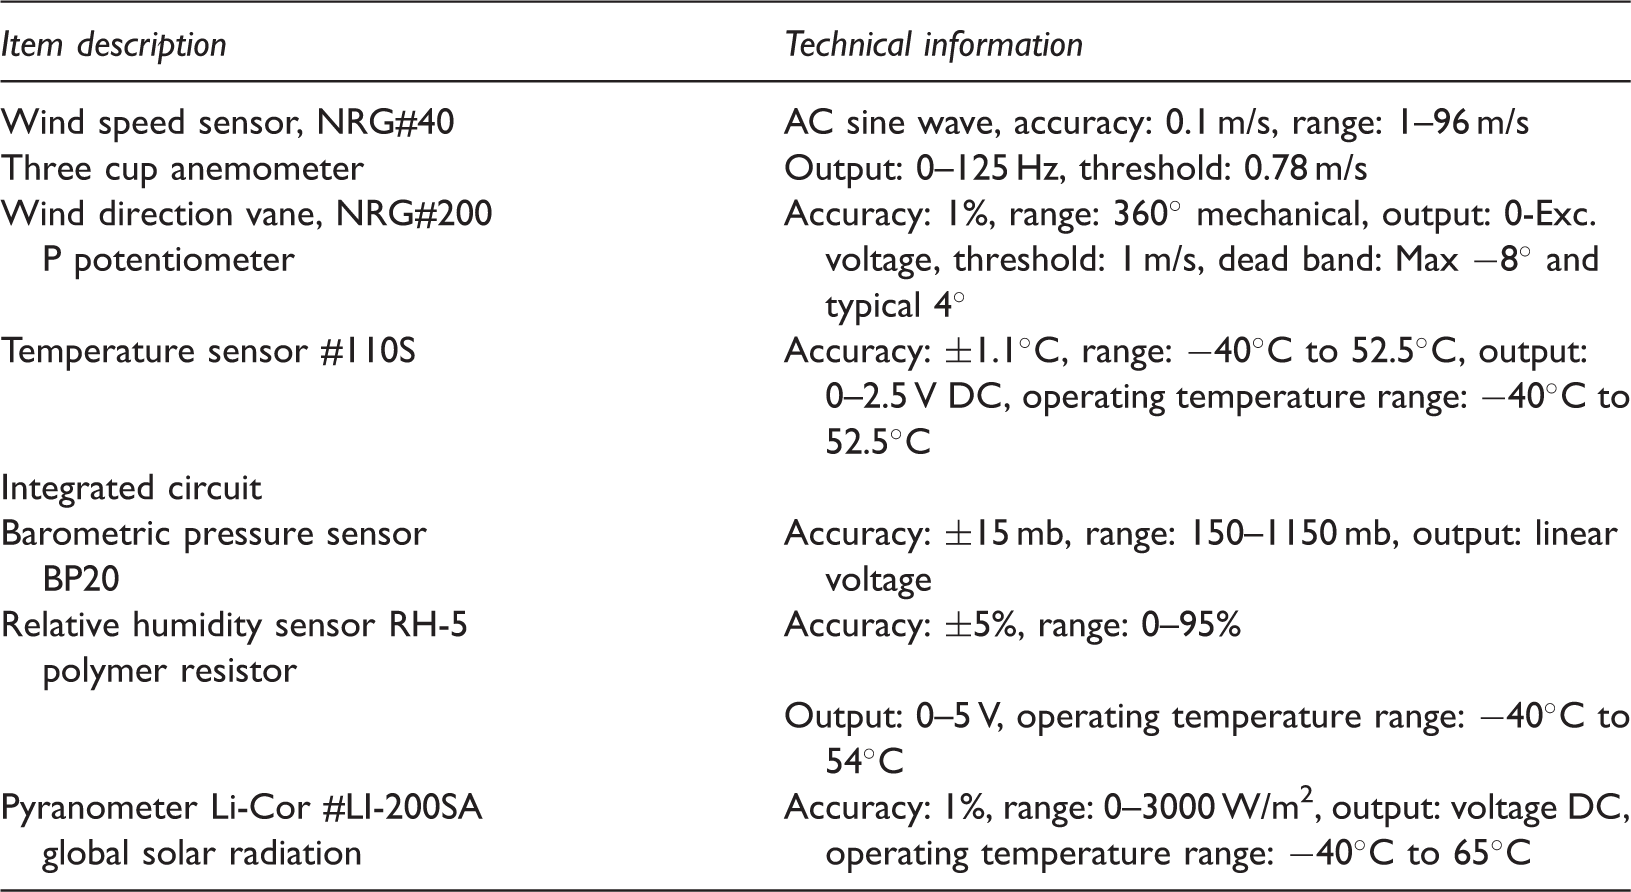
Operating ranges and accuracies of various sensors used for data collection.
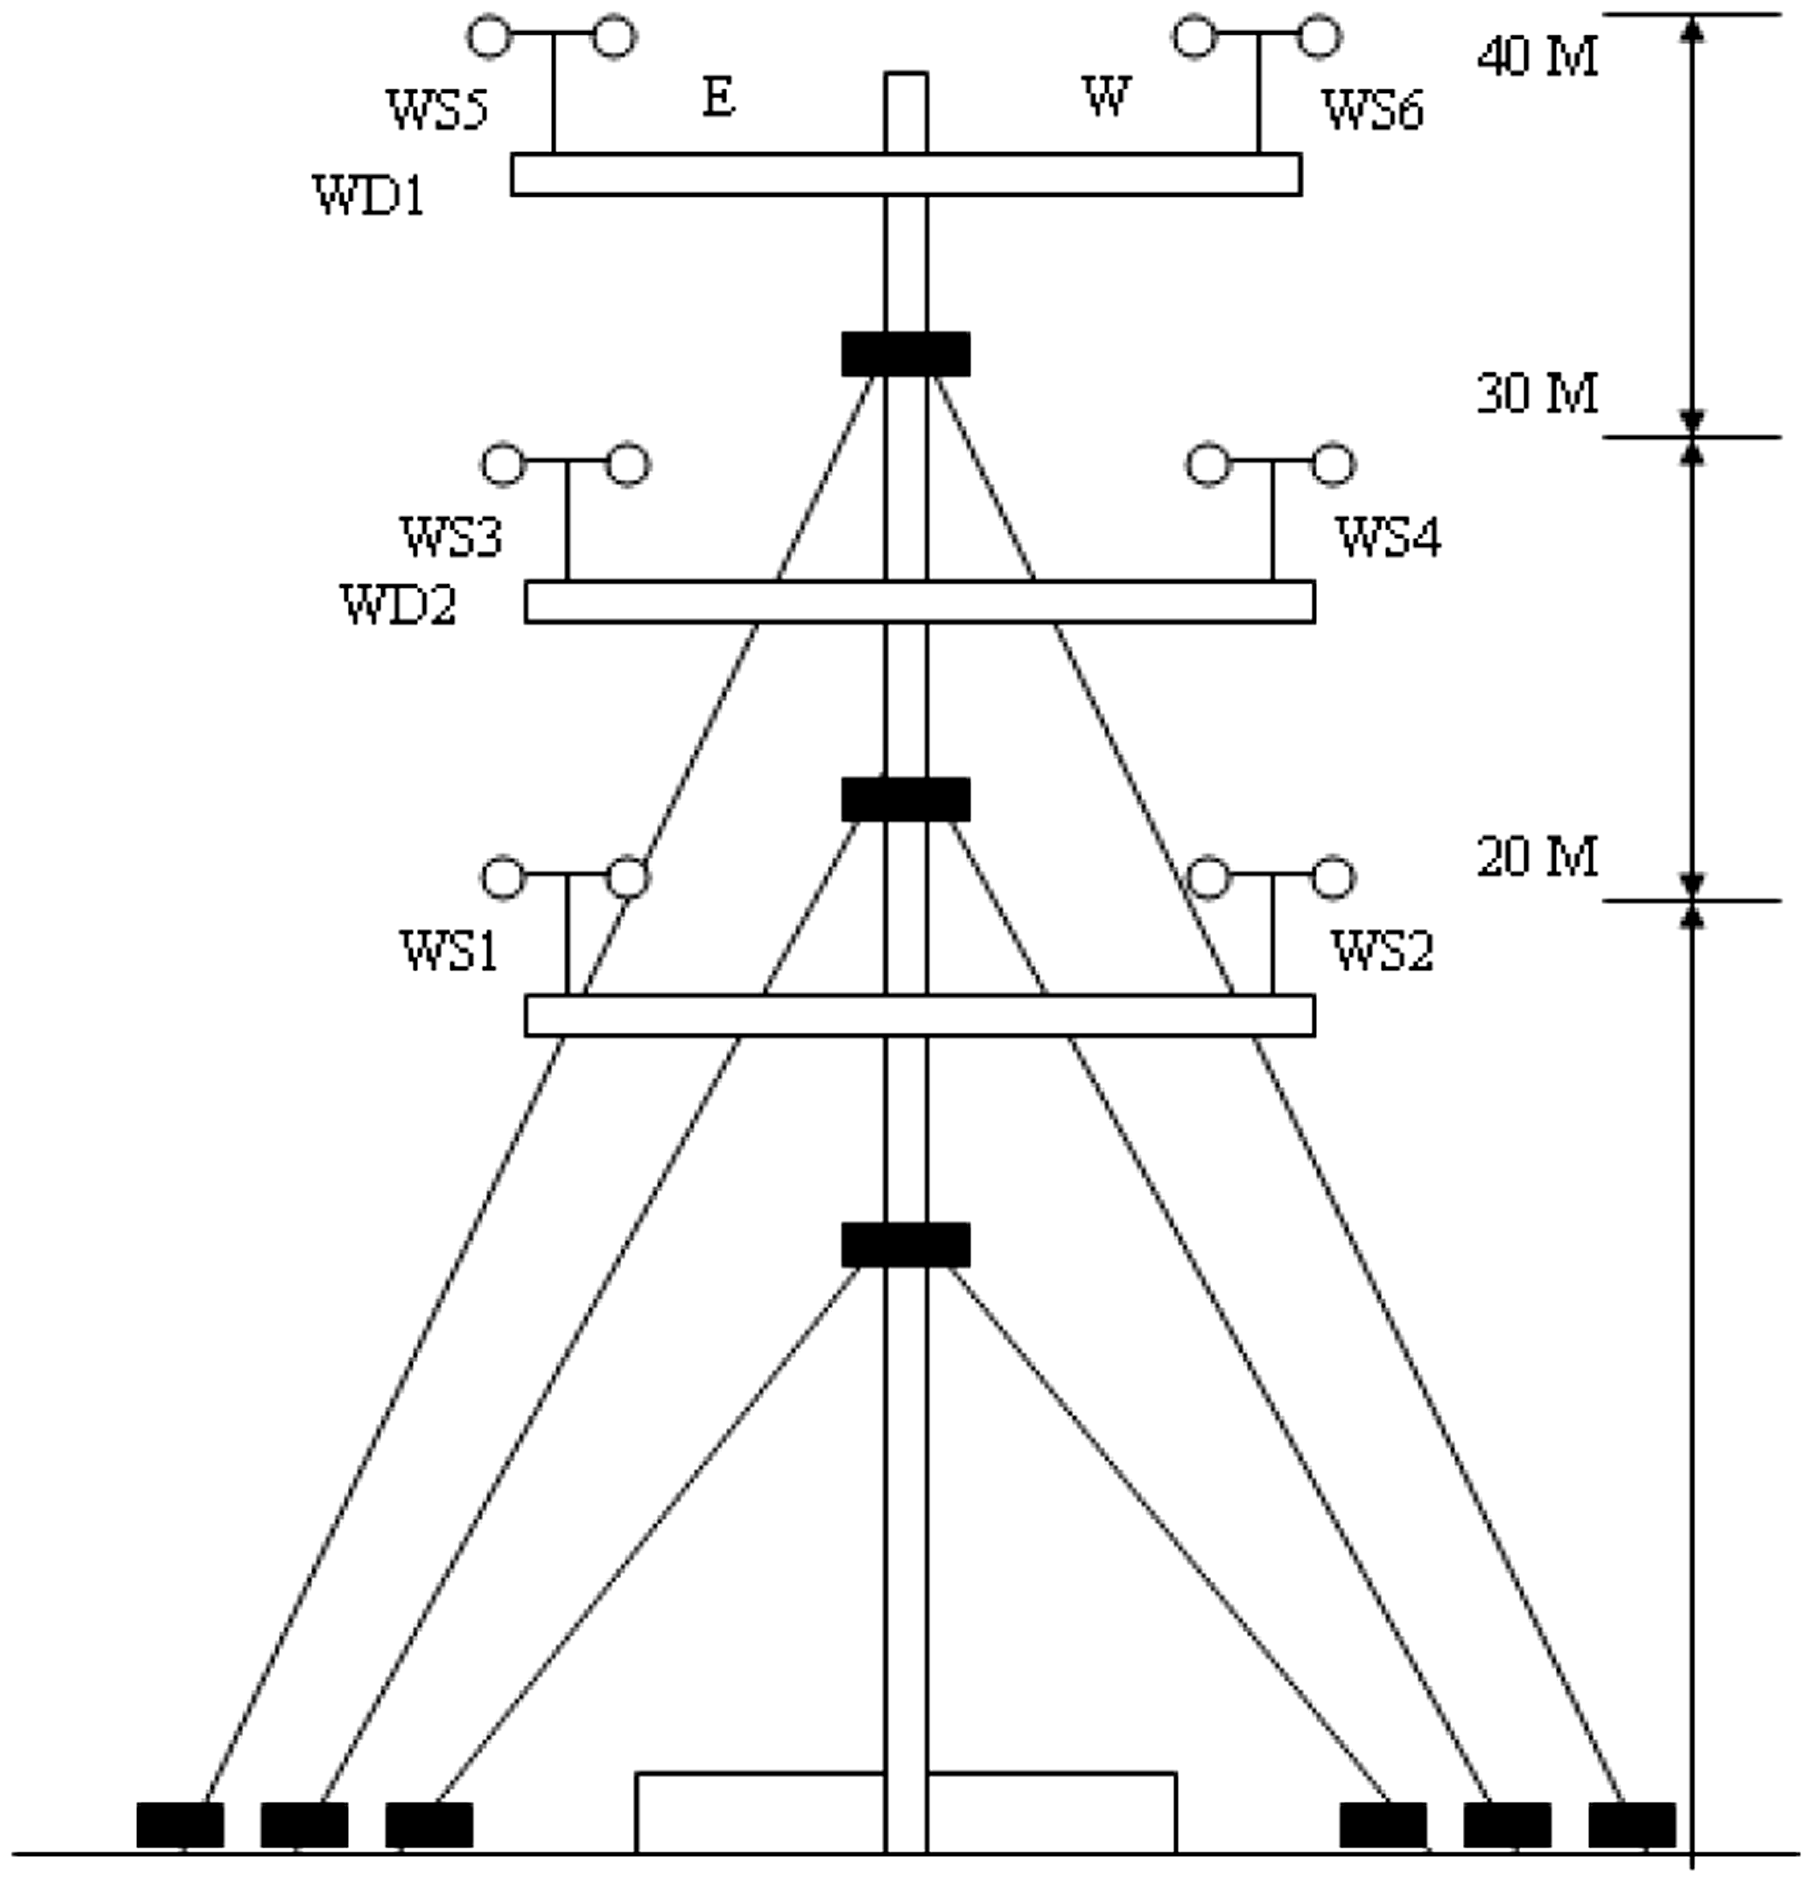
Schematic diagram of meteorological measurement tower at RBH.
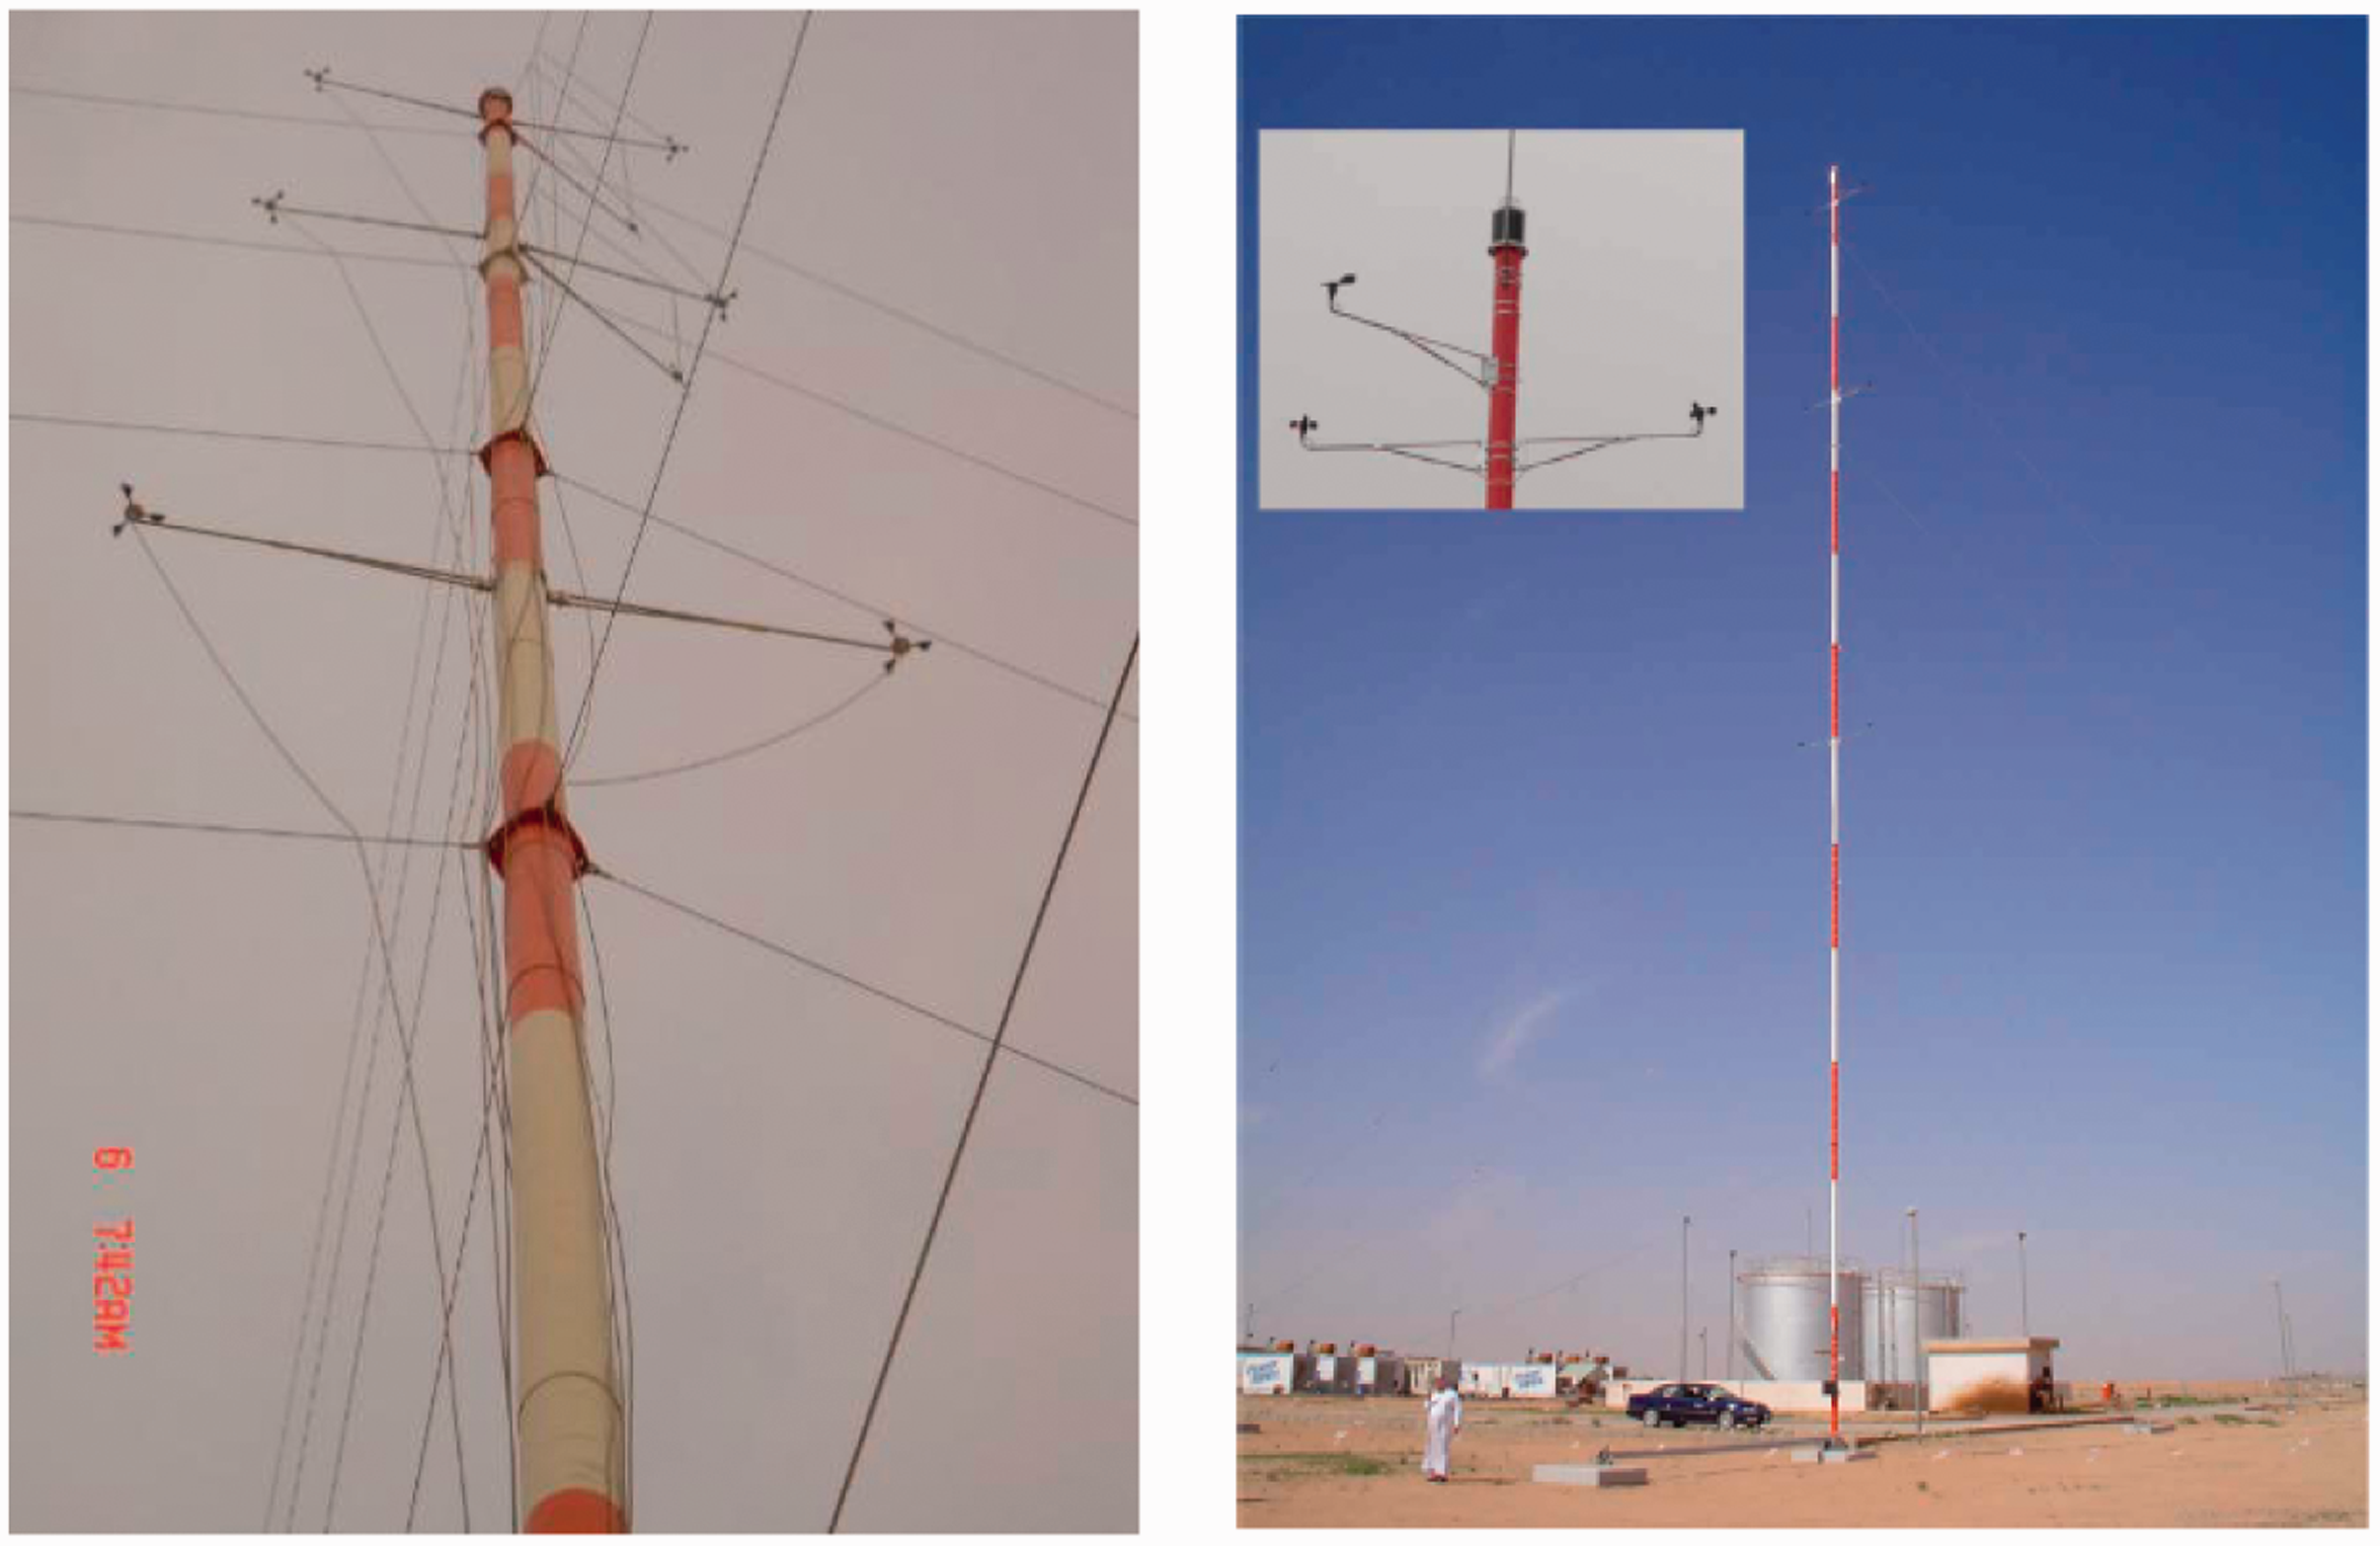
Meteorological measurement mast at RBH.
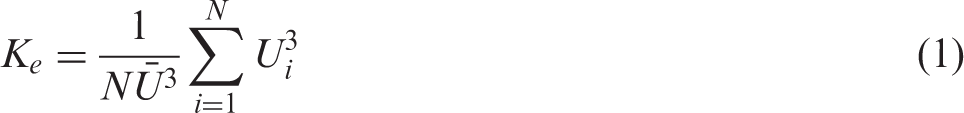
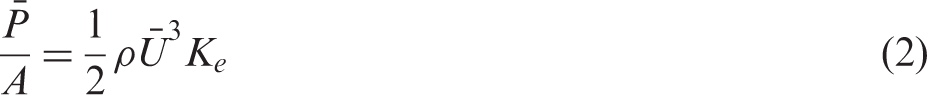
The energy pattern factor (Ke) also known as the cube factor is calculated for each wind speed using the following equation

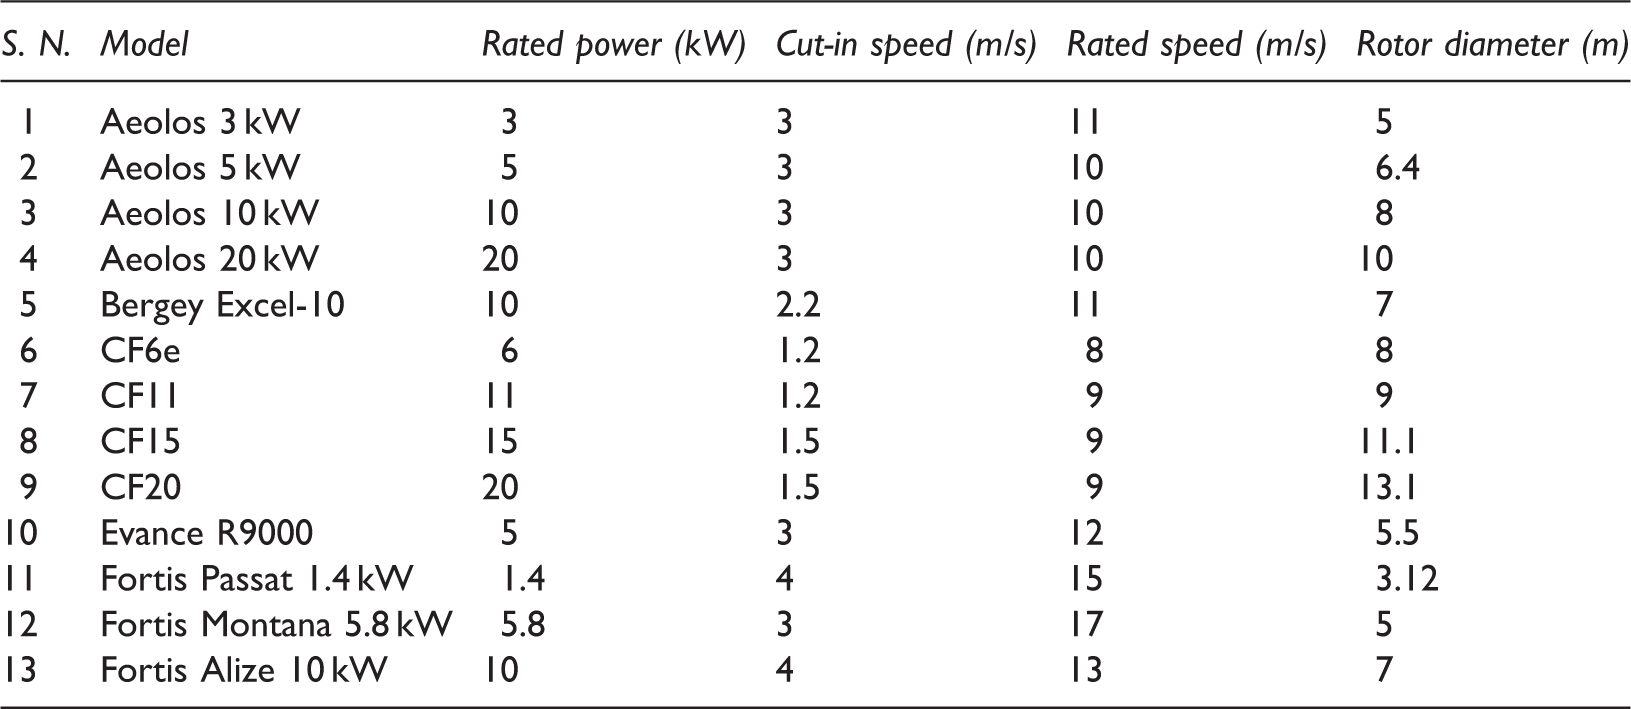
Horizontal axis small wind turbine specifications.
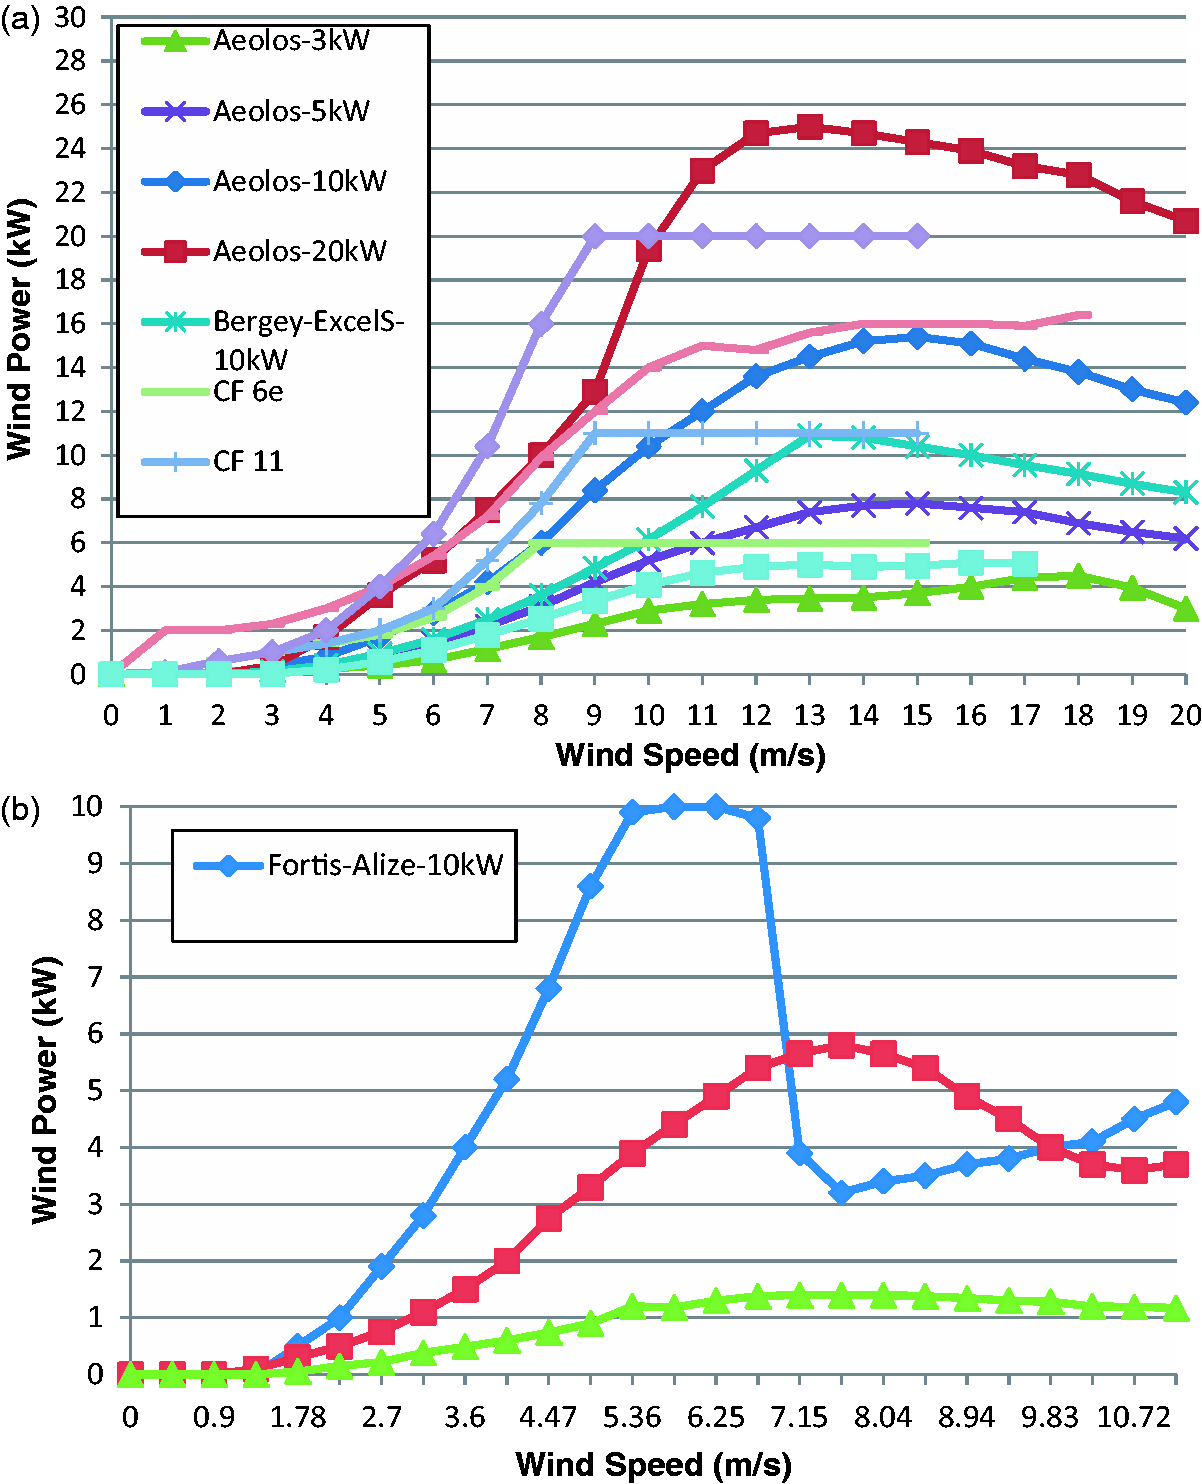
(a) Wind power curves of selected HAWTs, (b) wind power curves of selected HAWTs.
Results and discussion
The theoretical computation results are presented as overall meteorological summaries, energy yield and plant capacity factor (PCF), annual and monthly energy yield, and PCF variation. To estimate the net power or energy yield, the availability, wake effect, turbine performance, and electrical losses are assumed as 3, 4, 3, and 2%, respectively, with an overall loss of 11.48%. The PCF values were obtained by dividing the actual energy yield by the maximum possible yield in a given period of time.
Meteorological summaries at RBH (13 September 2005 to 9 May 2010)
Meteorological data summary (13 September 2005 to 9 May 2010).
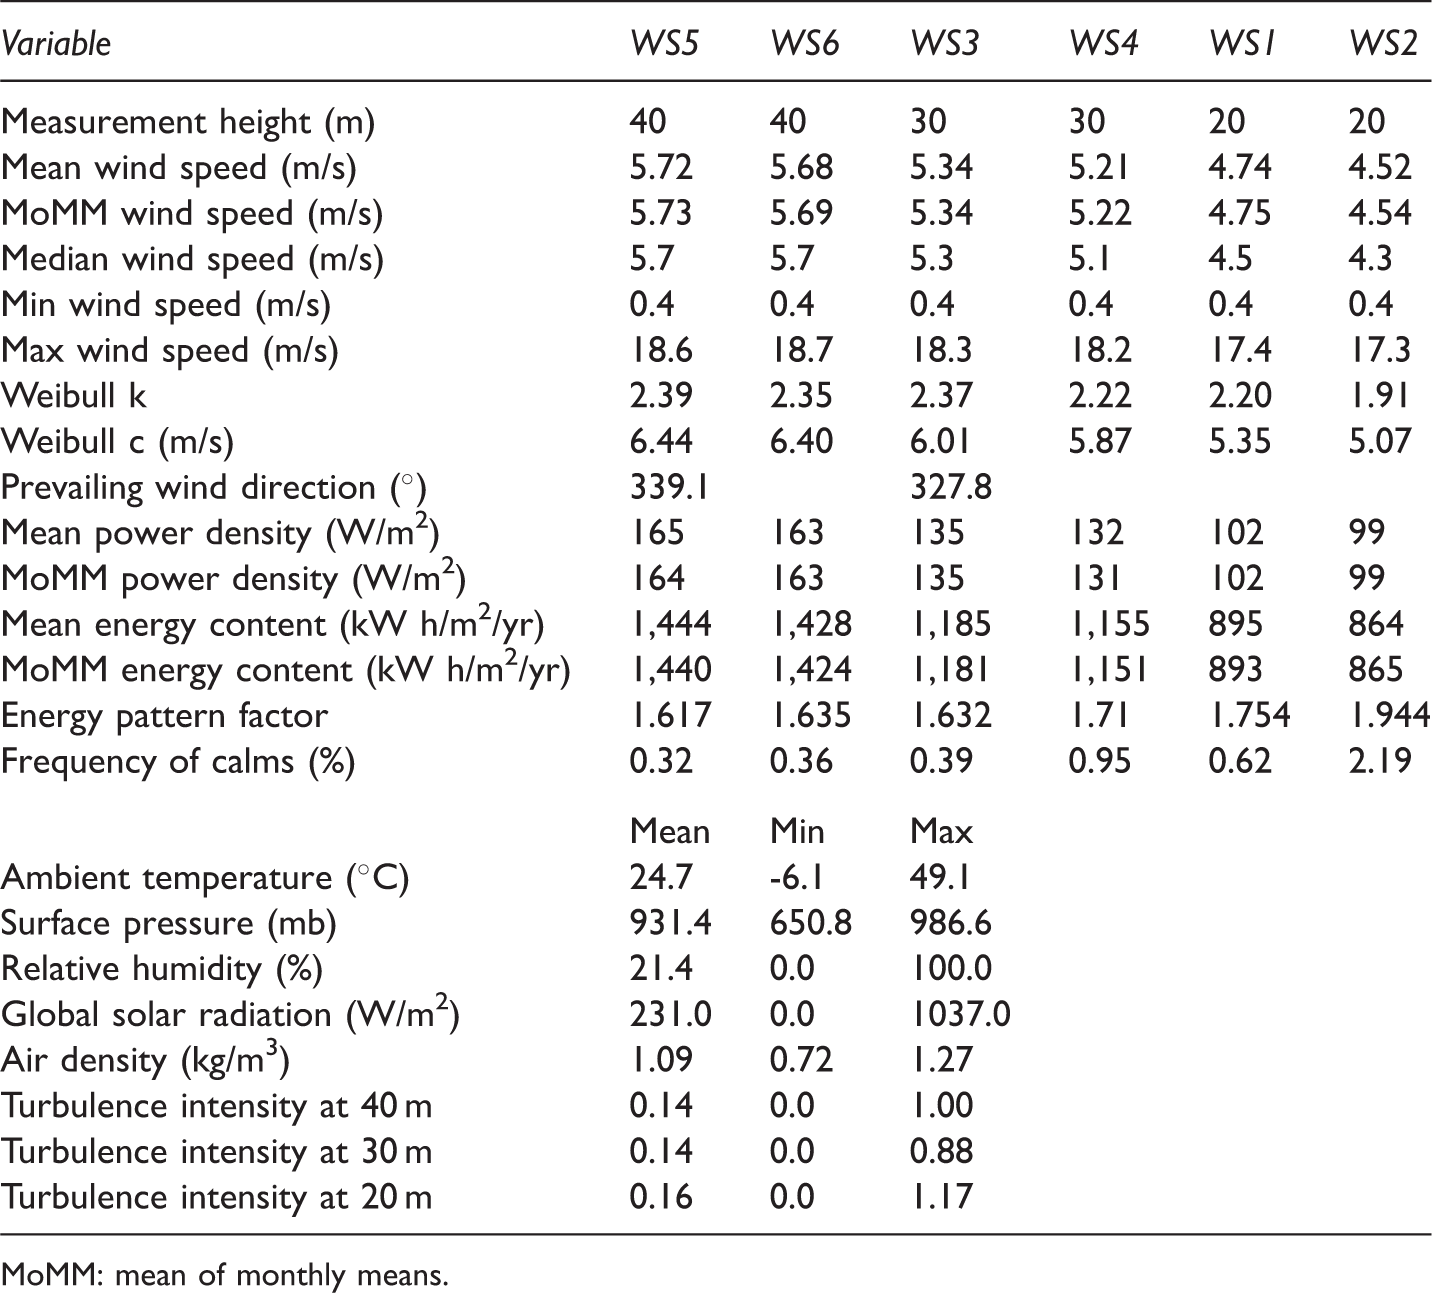
MoMM: mean of monthly means.
The mean air turbulence intensities were calculated using the mean wind speed and standard deviation values and were found to be 0.14, 0.14, and 0.16 at 40, 30, and 20 m AGL which were always less than the critical TI value of 0.18 as the permissible value recommended in IEC 61400-1 standard (2005). Furthermore, the mean TI values were found to be decreasing with height which indicates that wind turbines will be safe to operate even at further higher hub heights if needed. Finally, the mean WPD was found to vary from 102 to 165 W/m2 corresponding to 20 and 40 m heights. The mean WPD at 30 m height was 135 W/m2 as can be seen from Table 3. In case of WPD, the MoMM of WPD and simple WPD values were almost the same in magnitude. The WPD density was also found to increase with increasing heights. The mean energy content or the wind speed cube factor was observed to be decreasing with increasing wind measurement height. For an increase of height of 10 m from 20 to 30 m, the energy content changed by around 25% while for the same height change from 30 to 40 m it changed only by 18%. This simply implies that the energy content or the wind cube factor effect decreases with height. The energy pattern factors were found to be decreasing with increasing height with highest values at 20 m height and lowest at 40 m.
Energy yield and PCF analysis (1 July 2006 to 10 July 2008)
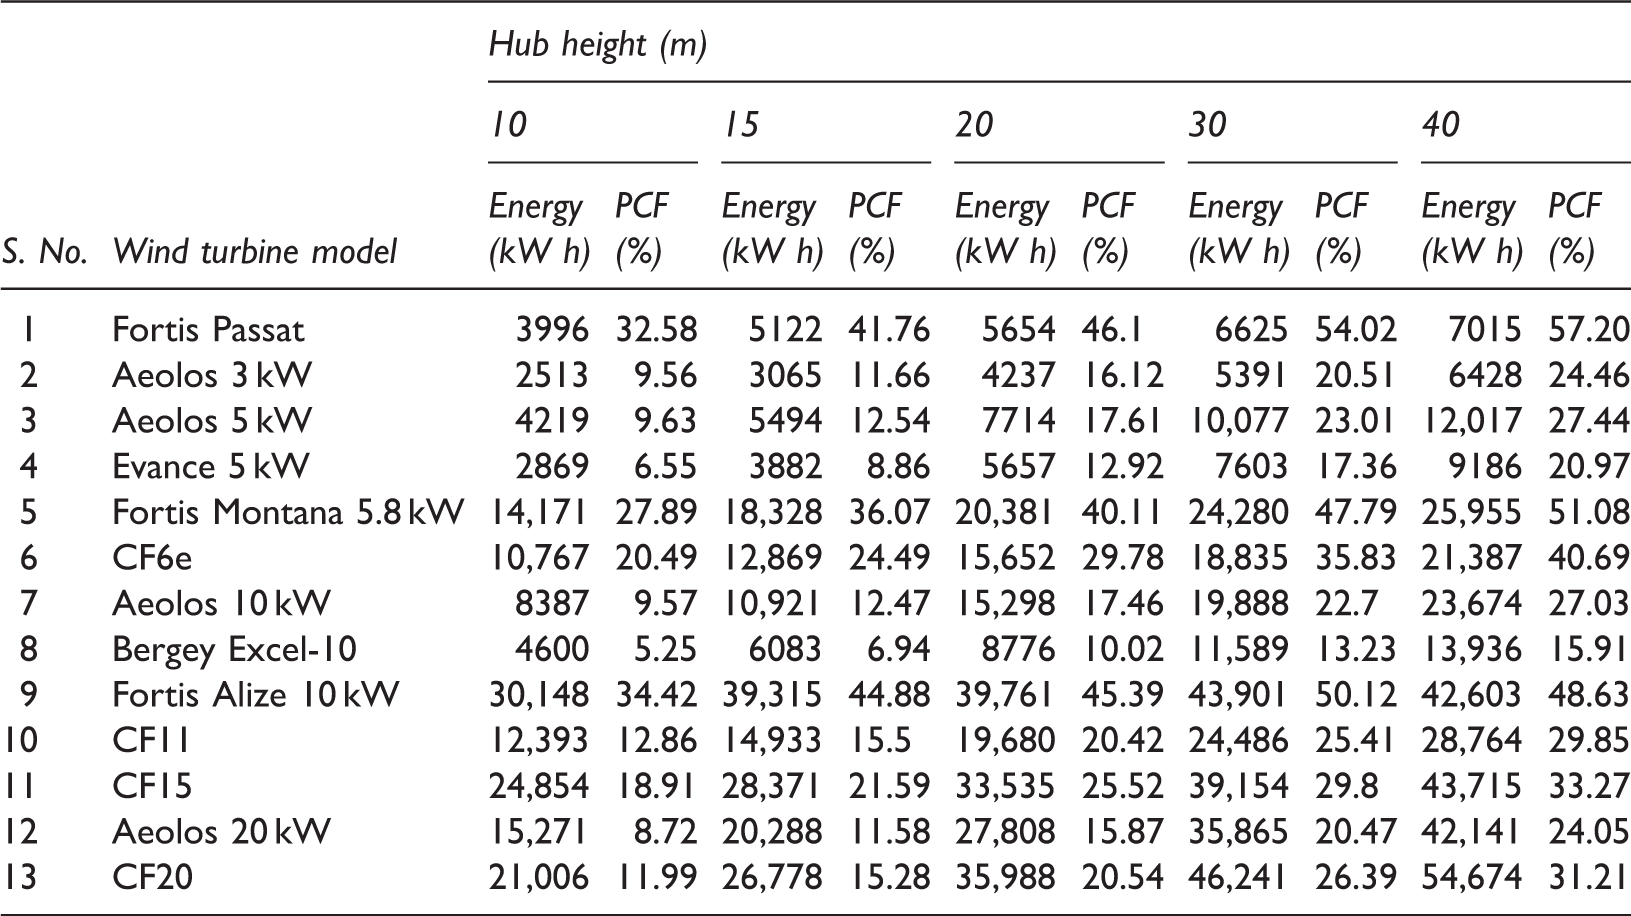
Annual energy yield and plant capacity factor obtained from HAWTs.
The effect of hub height on the percent change in energy yield from chosen WTs is shown in Figure 5. As seen from this figure, maximum percentage increase in AEY was observed for all the chosen WTs while changing the hub height from 15 to 20 m, i.e. an increase of only 5 m. Next best percentage increase in AEY was obtained for hub height change of 5 m, i.e. from 10 to 15 m. An interesting observation is made from this figure that almost all the WTs showed same percentage change in AEY for an increase of hub height of 5 m (from 10 to 15 m) and an increase of hub height of 10 m (from 20 to 30 m). Furthermore, highest percentage increase in AEY of about 45% was observed for Bergey Excel-10 and Evance R9000 wind turbines. For example in case of Evance R9000, the AEY changed from 2.869 MW h to 3.882 MW h to 5.657 MW h to 7.603 MW h to 9.186 MW h corresponding to change in hub height from 10 to 15, 15 to 20, 20 to 30, and 30 to 40 m, respectively.
Percentage increase in AEY of wind turbine with change in hub height.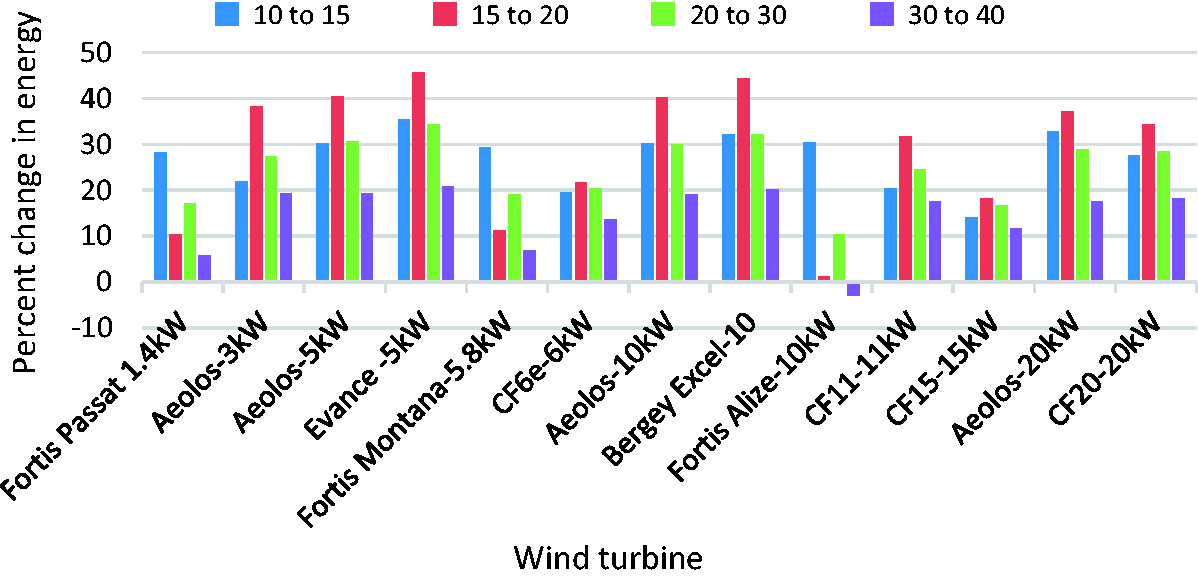
For practical applications at RBH and its surroundings and areas with similar or better wind resources, following wind turbines are recommended:
For small loads of < 0.7 kW, Fortis Passat with PCF of 41.76% at 15 m hub height; For medium loads of up to 1.5 kW, Aeolos 5 kW with PCF of 17.61% at 20 m hub height; For larger loads of up to 2.5 kW, CF6e with PCF of 29.78% at 20 m hub height; For further higher loads, suitable wind turbines could be chosen from the performance data given in Table 4.
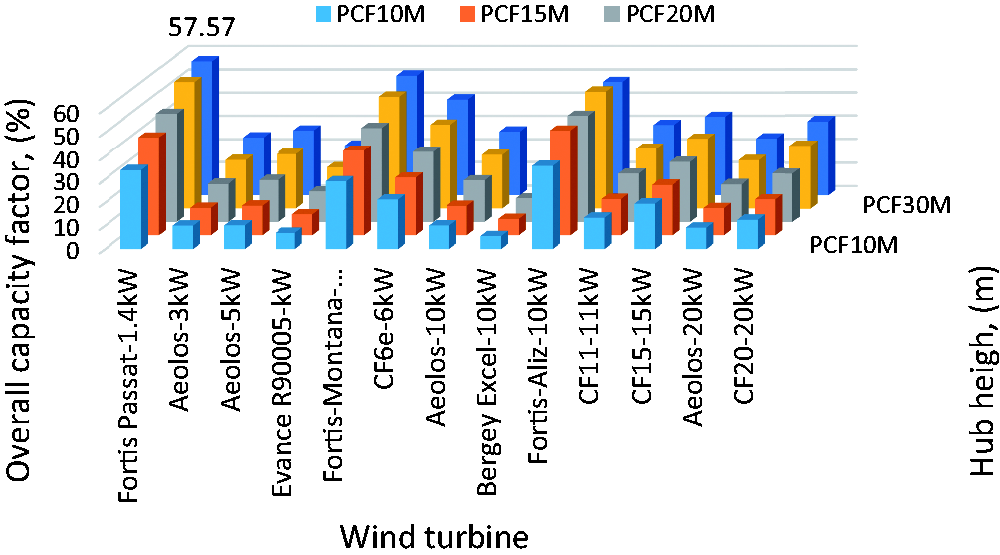
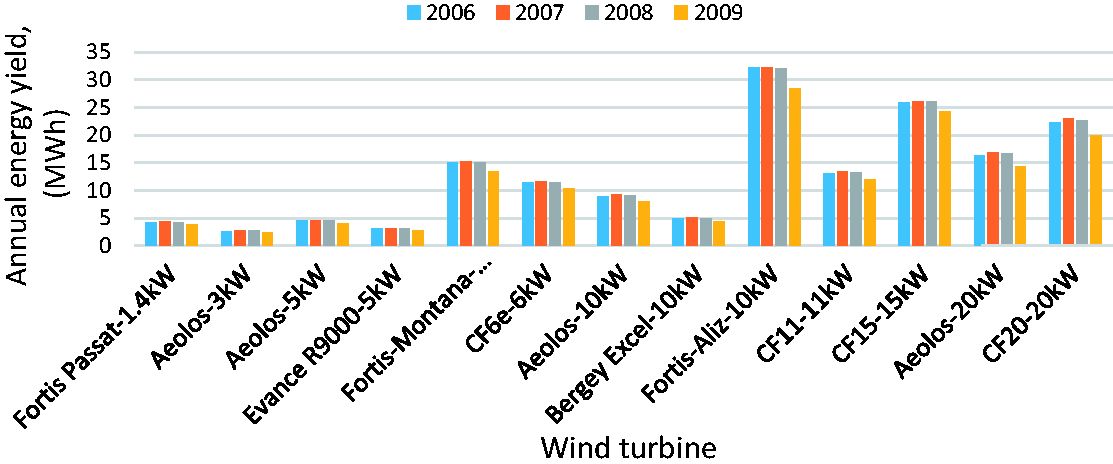
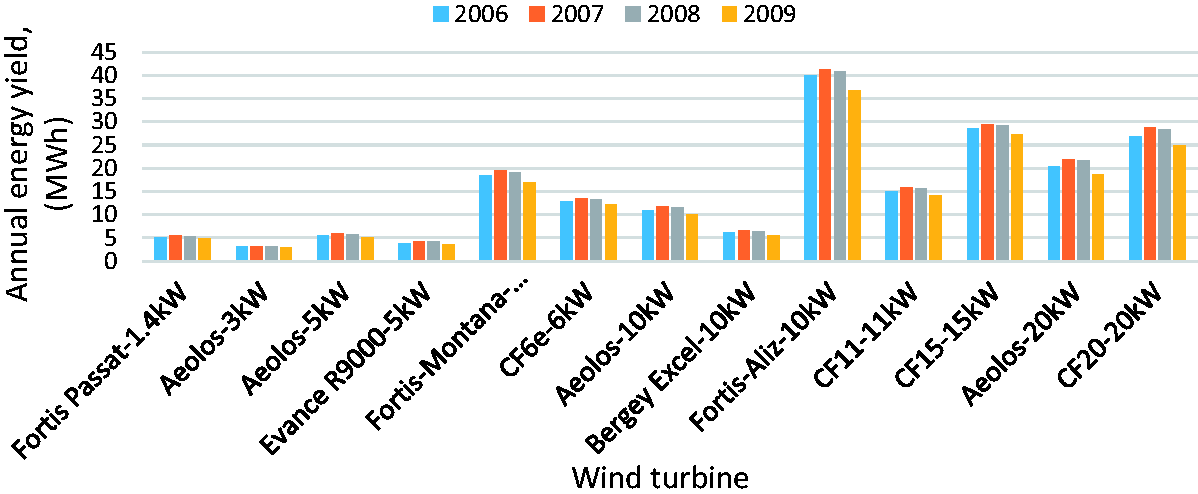
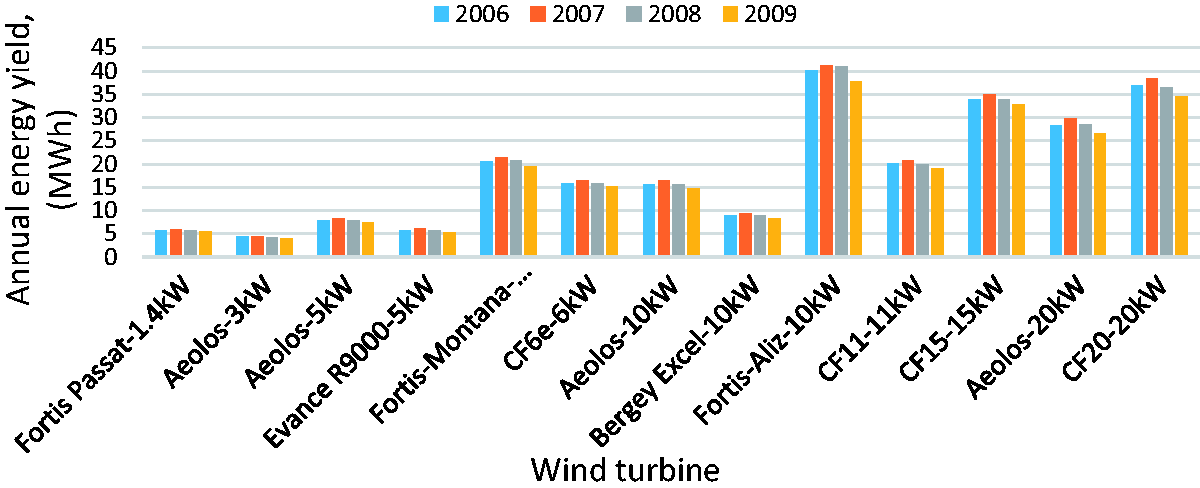
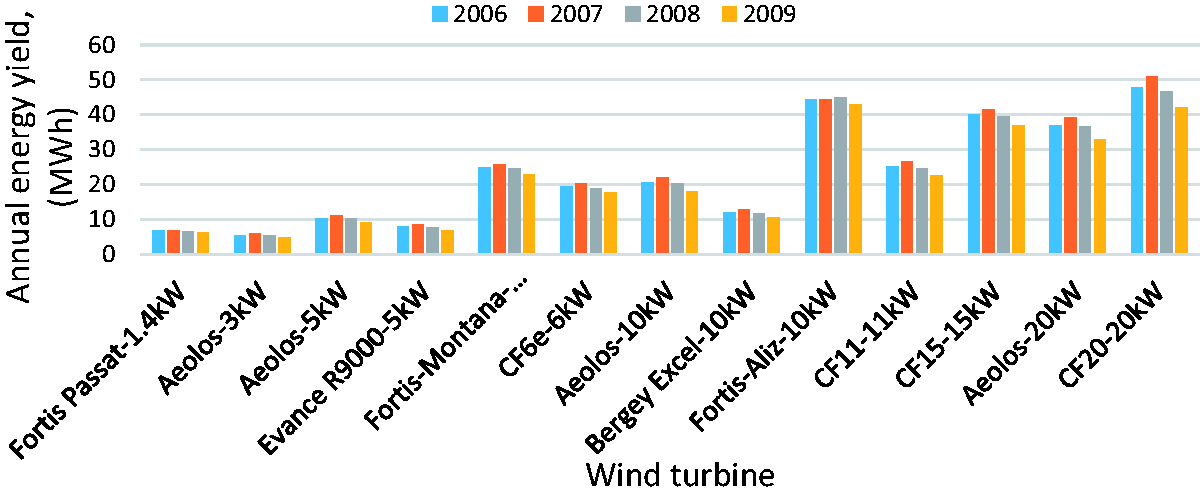
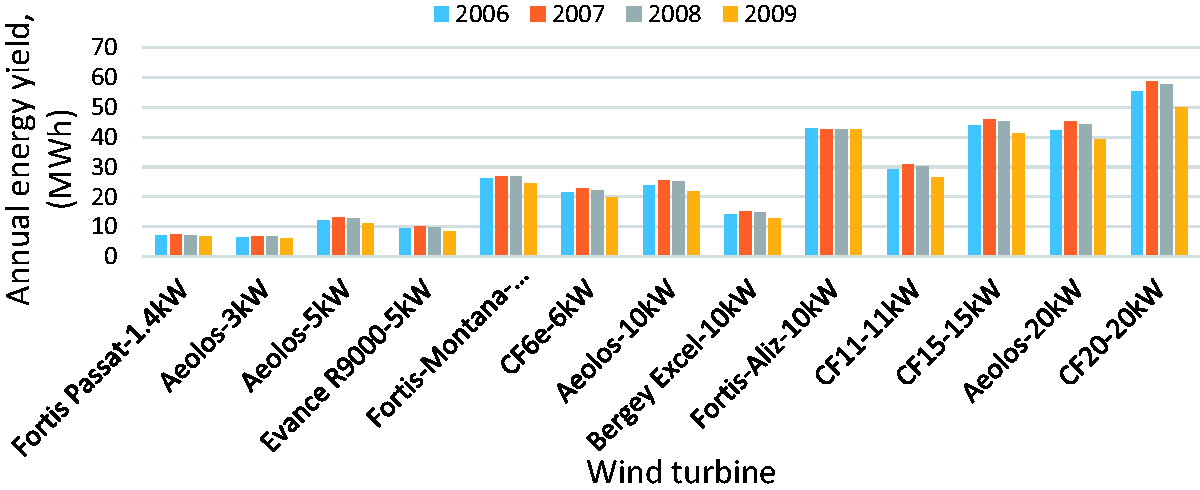
Figures 6 and 7 provide the performance of all the WTs at a glance based on AEY and PCF and could be used for the selection of an efficient wind turbine for a particular load requirement and application. Furthermore, these figures could also be helpful in choosing the hub height of the chosen wind turbine based on AEY or PCF or combination. The long-term performance in terms of actual energy produced in different years (from 2006 to 2009) of all the WTs corresponding to hub heights of 10, 15, 20, 30, and 40 m is displayed in Figures 8 to 12, respectively.
Variation of overall energy yield from chosen wind turbines with hub height. Variation of overall plant capacity factors of chosen wind turbines with hub height. Annual variation of energy yield of wind turbines with 10 m hub height. Annual variation of energy yield of wind turbines with 15 m hub height. Annual variation of energy yield of wind turbines with 20 m hub height. Annual variation of energy yield of wind turbines with 30 m hub height. Annual variation of energy yield of wind turbines with 40 m hub height.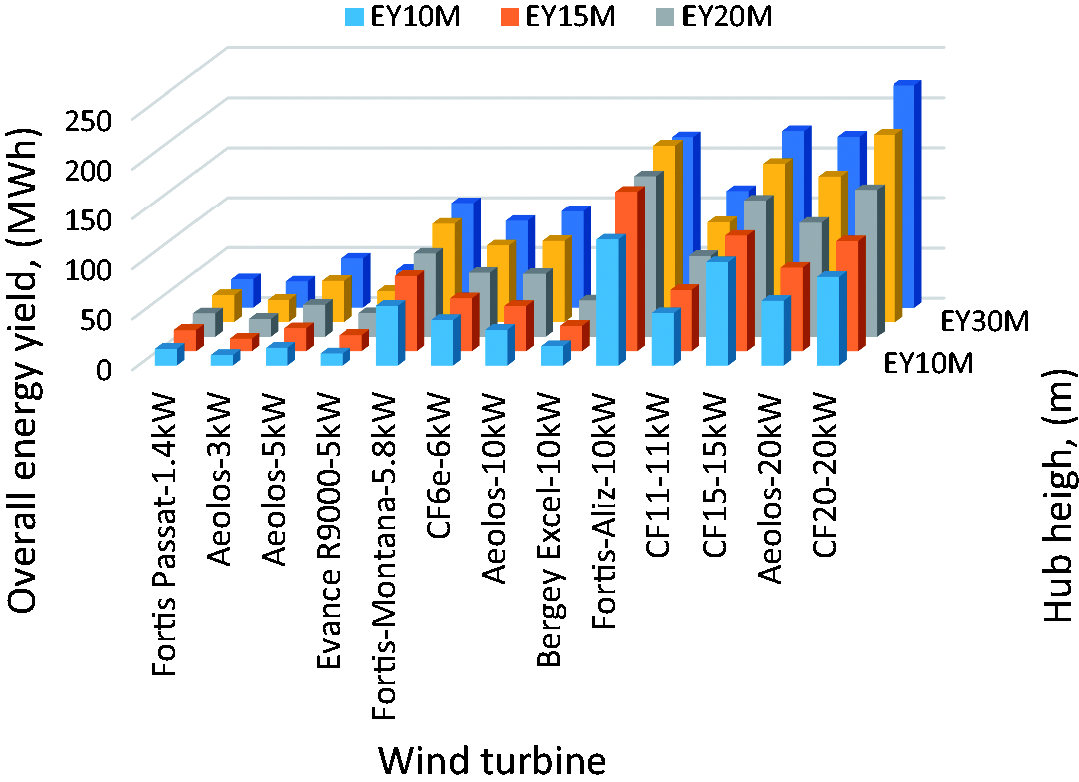
The durations during which the chosen wind turbines did not produce any energy are compared in Figure 13. It is very clear from this representation that all the wind turbines had highest percentages of zero out for hub height of 10 m. This simply meant that the wind has more fluctuations near the ground level due to high roughness value. As the hub height of the turbine increased, the percentages of the zero output energy were noticed to decrease, as depicted in Figure 13. In case of wind turbines Fortis Passat, Aeolos-H 3 kW, Fortis Montana-H 5.8 kW, and Fortis Alize-H 10 kW, the decrease in zero output percentages was insignificant while in case of rest of the turbines it was noticeable. It is however established that maximum decrease in zero output power was achieved for a mere increase in hub height of 5 m from 10 to 15 m. On the other hand, almost no change or decrease was seen in percent time duration of zero power output.
Zero output power duration during entire data collection period.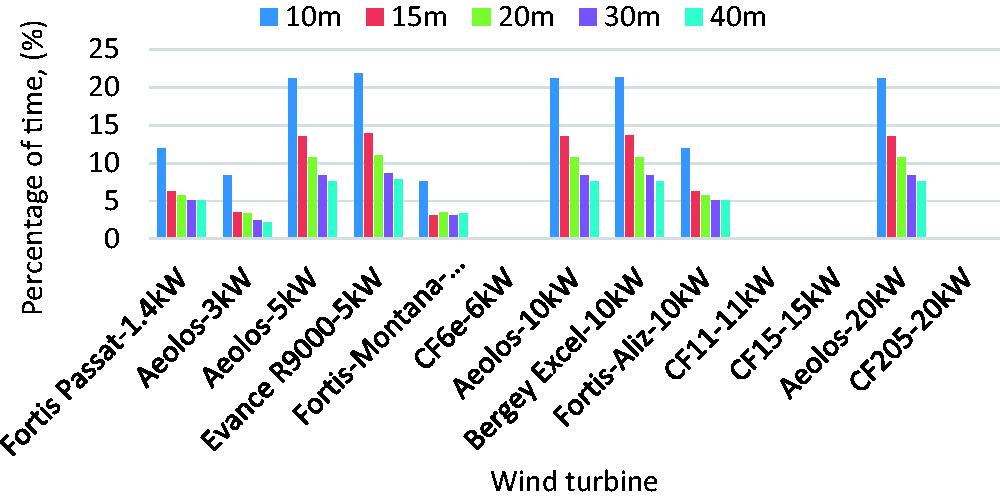
The percent duration of time during which the wind turbines produced the rated power at different hub heights is shown in Figure 14. In general, the rated power generation duration was found to be increasing with increasing hub height due to the fact that wind speed intensity increases with height above the ground level due to minimal effect of ground activities and additional contribution of regional wind speed. At 10 and 15 m hub heights none of the wind turbine except Fortis Passat, CF6e, and Fortis Alize produced the rated power. The data provided in Figures 13 and 14 can also provide a guideline for the selection of an efficient wind turbine for a particular site for wind power development.
Rated output power duration during entire data collection period.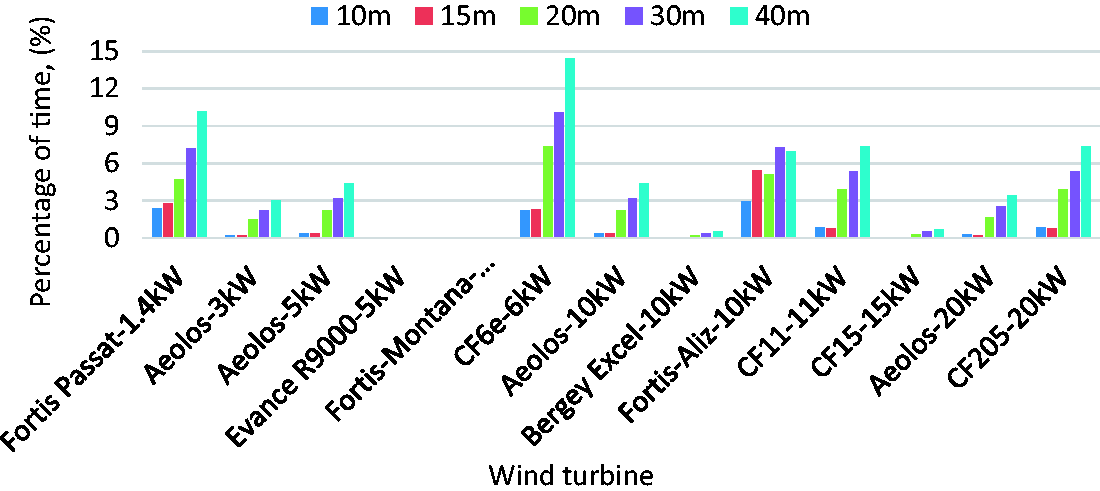
Monthly variation of energy yield and PCF
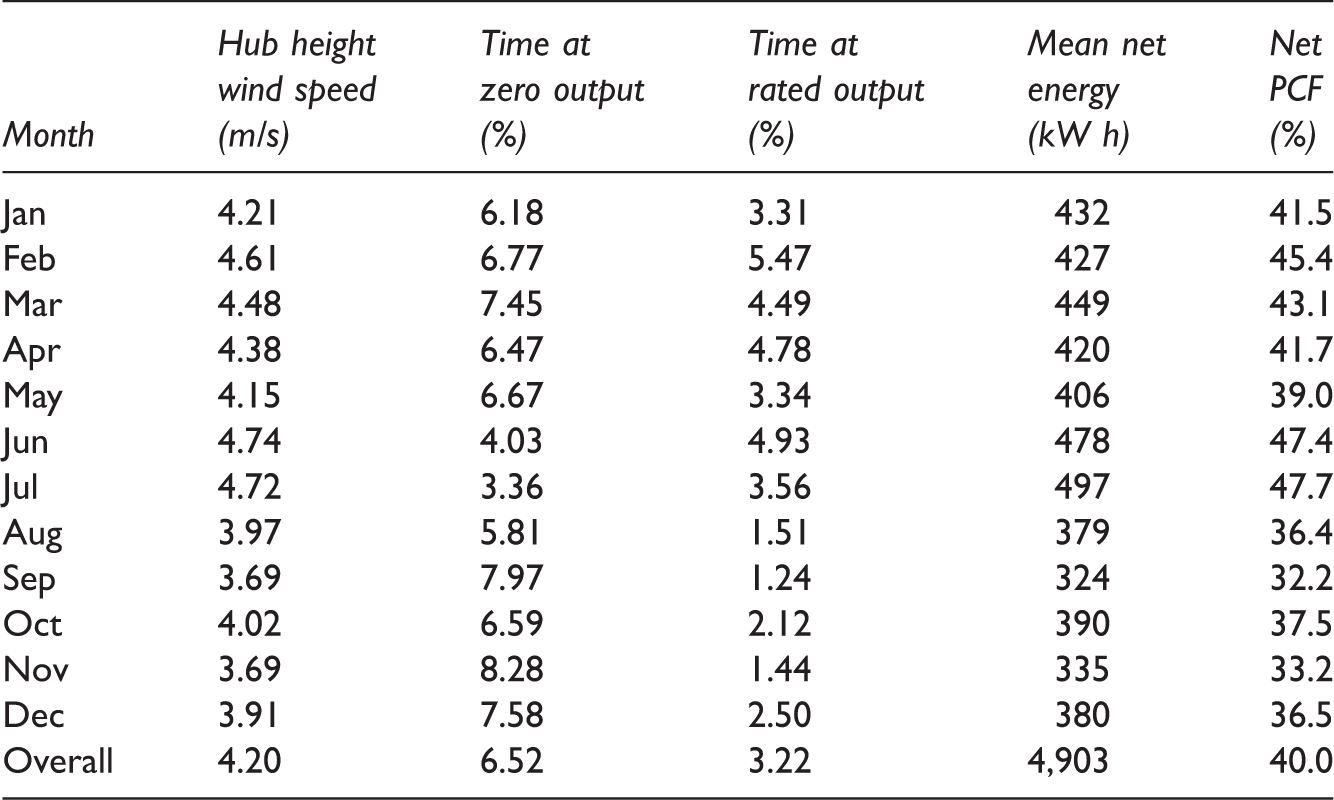
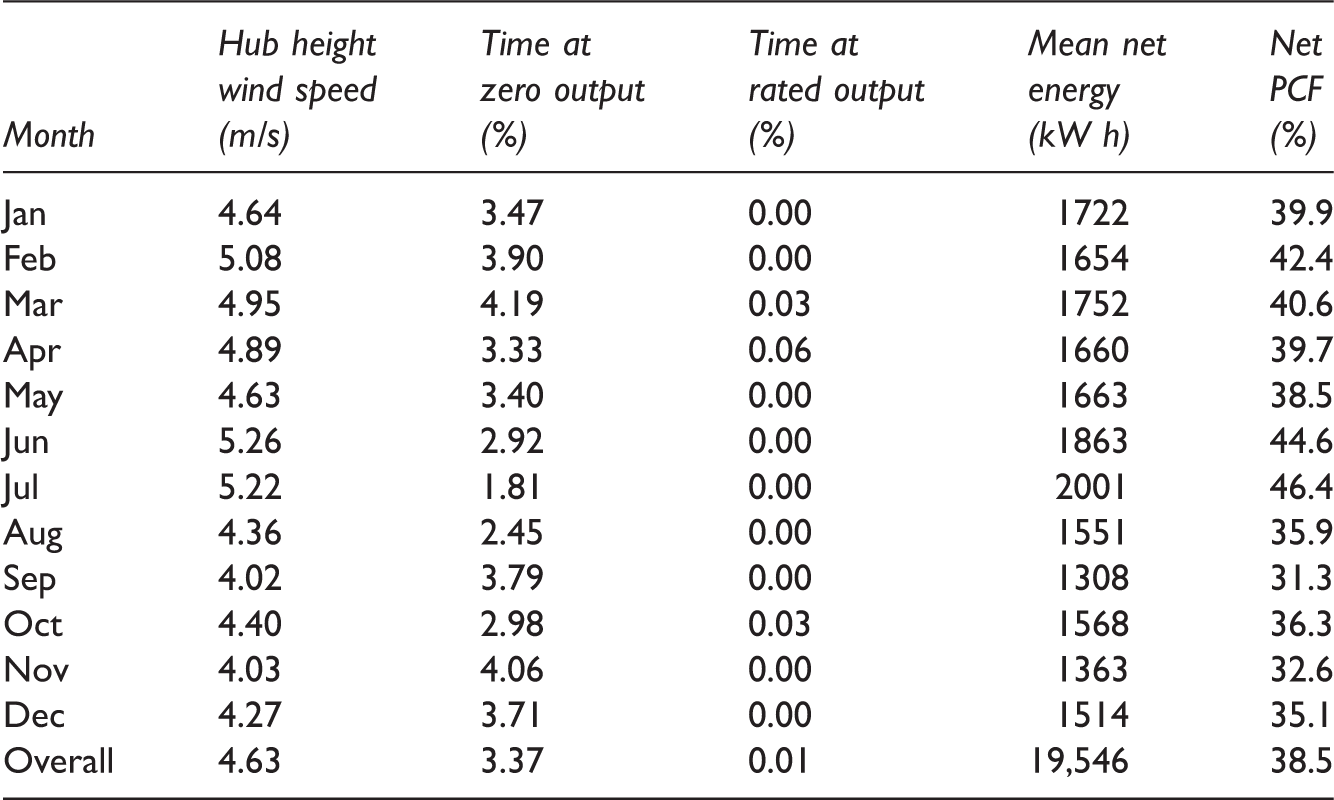
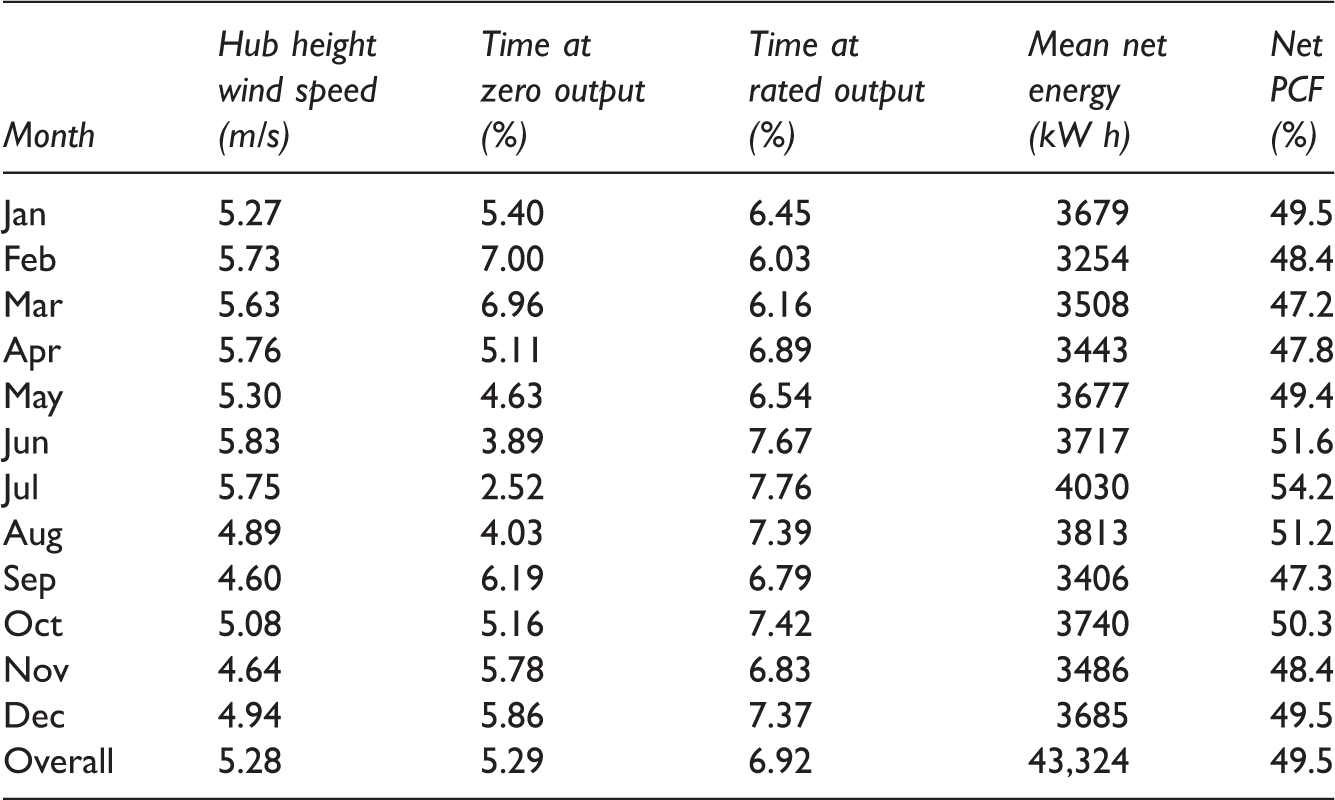
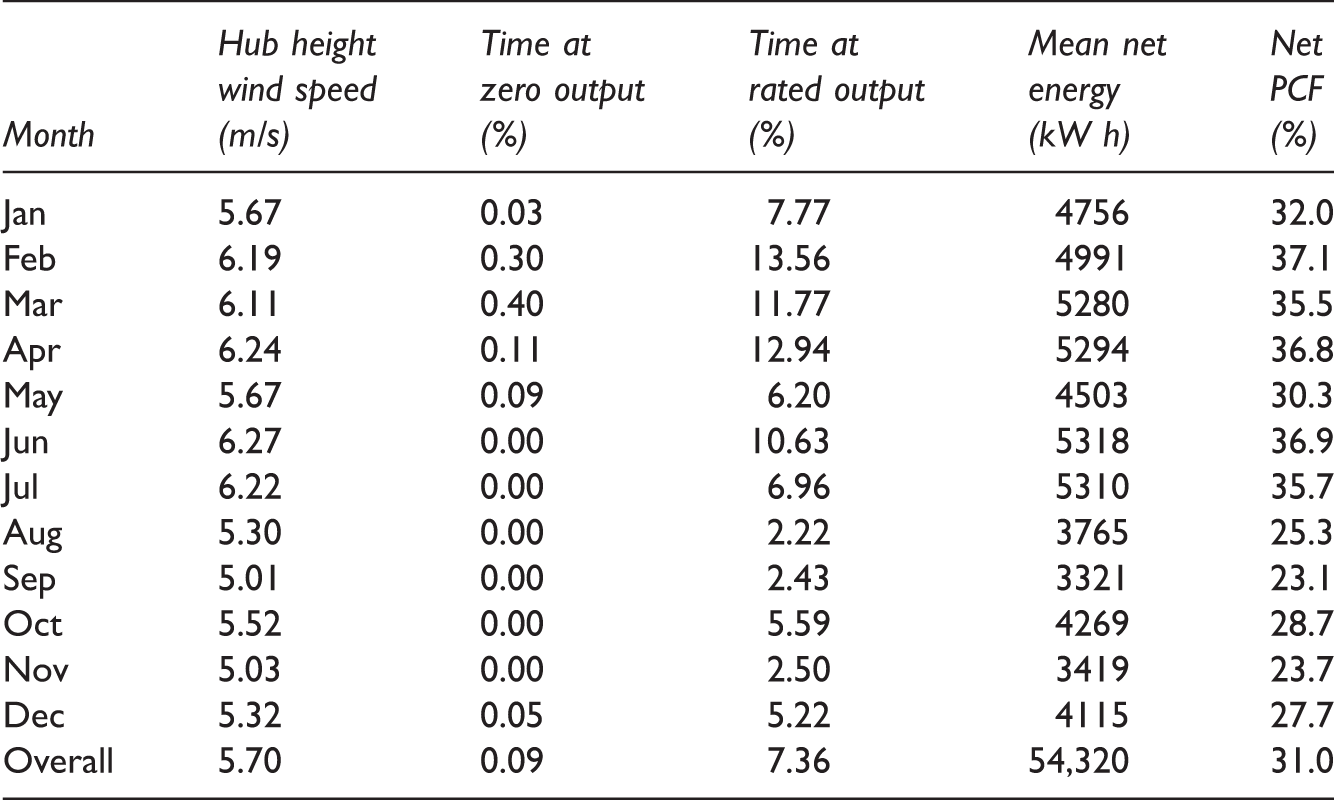
Based on optimal annual energy yield, the PCF, and hub height, wind turbines with higher values have been chosen here for further analysis on monthly basis. The selected wind turbines are Fortis Passat of 1.4 kW, Fortis Montana of 5.8 kW, Fortis Alize of 10 kW, and CF20 of 20 kW rated powers. The respective PCFs of these turbines are of 41.76, 40.11, 50.12, and 31.21% corresponding to hub heights of 15, 20, 30, and 40 m, respectively.
Monthly variation of energy yield and plant capacity factor for a 1.4 kW (Fortis Passat) wind turbine at 15 m hub height.
Monthly variation of energy yield and plant capacity factor for a 5.8 kW (Fortis Montana) wind turbine at 20 m hub height.
Monthly variation of energy yield and plant capacity factor for a 10 kW (Fortis Alize) wind turbine at 30 m hub height.
Monthly variation of energy yield and plant capacity factor for a 20 kW (CF20) wind turbine at 40 m hub height.
Conclusions
A total of 13 wind turbines have been analyzed in terms of annual energy yield and PCF by using wind speed data measured at 20, 30, and 40 m AGL at RBH meteorological station in Saudi Arabia for a period of 55 months and 25 days. To estimate the net power or energy yield, the down time, array, icing, and other losses were assumed as 5, 4, 1, and 2%, respectively. Following are the findings of the present study:
The long-term mean WS varied from 4.74 to 5.34 to 5.72 m/s corresponding to measurement heights of 20, 30, and 40 m. An increase of about 20.7% was found in wind speed measured at 40 m compared to that at 20 m. In the present case, the MoMM wind speed were almost the same as the normal mean values. The mean WD was predominantly from NNW with an average value of 339° at 40 m and 327° at 30 m. The ambient temperature varied from a minimum of -6.1 ℃ to a maximum of 49.1 ℃ with an overall average of 24.7 ℃. The mean values of global solar radiation, pressure, and relative humidity were 231 W/m2, 931.4 mbar, and 21.4%, respectively. The mean air turbulence intensities were 0.14, 0.14, and 0.16 at 40, 30, and 20 m AGL which were always less than the critical TI value of 0.18 as the permissible value recommended in IEC 61400-1 standard. The mean WPD values were 102, 135, and 165 W/m2 at 20, 30, and 40 m heights. The mean energy content or the wind speed cube factor was observed to be decreasing with increasing wind measurement height. For an increase of measurement height of 10 m from 20 to 30 m, the energy content changed by around 25% while for the same height change from 30 to 40 m it changed only by 18%. This simply implies that the energy content or the wind cube factor effect decreases with height. The energy pattern factors were found to be decreasing with increasing height with highest values at 20 m height and lowest at 40 m. Maximum percentage increase in AEY was observed for all the chosen WTs while changing the hub height from 15 to 20 m, i.e. an increase of only 5 m. Next best percentage increase in AEY was obtained for hub height change of 5 m, i.e. from 10 to 15 m. An interesting observation is made that almost all the WTs showed same percentage change in AEY for an increase of hub height of 5 m (from 10 to 15 m) and an increase of hub height of 10 m (from 20 to 30 m). In general, the rated power generation duration was found to be increasing with increasing hub height due to the fact that wind speed intensity increases with height above the ground level due to minimal effect of ground activities and additional contribution of regional wind speed. For small loads of <0.7 kW, Fortis Passat with PCF of 41.76% at 15 m hub height can be used while for medium loads of up to 1.5 kW, Aeolos 5 kW with PCF of 17.61% at 20 m hub height is recommended. For larger loads of up to 2.5 kW, CF6e with PCF of 29.78% at 20 m hub height is suggested.
Footnotes
Declaration of conflicting interests
The author(s) declared no potential conflicts of interest with respect to the research, authorship, and/or publication of this article.
Funding
The author(s) disclosed receipt of the following financial support for the research, authorship, and/or publication of this article: The authors wish to acknowledge the support of the Research Institute of King Fahd University of Petroleum and Minerals, Dhahran, Saudi Arabia. Alam wishes to acknowledge support given to him from the Research Grant Council of Shenzhen Government through grants JCYJ20120613145300404. The authors (A Lashin and N Al Arifi) extend their appreciation to the Deanship of Scientific Research at King Saud University (Saudi Arabia) for funding the work through the international research group project no. IRG14-36.