
Abstract
Central air conditioning is the main energy-consuming equipment in modern large-scale commercial buildings. Its energy consumption generally accounts for more than 60% of the electricity load of an entire building, and there is a rising trend. Focusing on reducing central air conditioning energy consumption is a first priority to achieve energy savings in modern large-scale commercial buildings. To study the main influencing factors of central air conditioning energy consumption in large shopping malls, in-depth collection and analysis of energy consumption data of Shenzhen Tian-hong shopping mall were considered, and the impact of factors such as the basic composition of central air conditioning, time, and Shenzhen weather on the energy consumption of shopping malls was considered. The most representative Buji Rainbow store of the Rainbow Group is used as the research object. The influencing factors of central air conditioning on its energy consumption are divided into air conditioning pumps, host 1–1, host 1–2, host 2–1, and host 2–2. The power consumption of the freezer and the eight impact indicators of time and weather in Shenzhen were constructed using Pearson correlation coefficients and a long short-term memory neural network method to construct a regression model of the energy consumption prediction of the mall building. The average relative deviation between the predicted energy consumption values and the measured energy consumption values is less than 10%, which indicates that the main influencing factors selected in this paper can better explain the energy consumption of the mall, and the obtained energy consumption prediction model has high accuracy.
Keywords
Introduction
With the increasing speed of urbanization in China, the urban construction industry is booming. As of 2018, the area of public buildings accounted for approximately 40% of the total building area, and public buildings with central air conditioning systems accounted for approximately 80% of this total. Central air conditioning constitutes the main energy-consuming equipment in modern public buildings. Its energy consumption generally accounts for 40%–60% of the electricity load of an entire building, and there is a rising trend, which has brought heavy pressure on building energy conservation (Ballarini and Corrado, 2012; Chen et al., 2001; Tan et al., 2020). Reducing the energy consumption of central air conditioning is the primary task for achieving energy efficiency in modern public buildings (Dong et al., 2018; Jarzabska and Krzaczek, 2016; Lambert, 2009).
Many researchers at home and abroad have continue to focus in the field of building energy saving. The results show the design stage of the emporium should focus on the effect of skylight on energy saving, which can reduce the area of excessive lighting by more than 50% (El‐Abd et al., 2018). Analysis and evaluation of the operation of the typical shopping center in Qatar, It is shown that reasonable regulation of cooling areas can bring the total energy savings of buildings to 12.819% (Liu et al., 2019). The energy consumption of a department store in Nanjing is analyzed. The results show that the heat transfer coefficient k is the best at the equilibrium point (Yu and Gong, 2014). The load characteristics and influencing factors of a shopping mall building in Chongqing is analyzed, The results show that the internal heat source strength, indoor air conditioning temperature and air exchange number is the key factor affecting the cold load index of shopping malls, designated directions for energy conservation in shopping malls (Liu et al., 2019; Sun et al., 2011). Study on indoor thermal comfort, this paper puts forward the control strategy of energy saving optimization of air conditioning terminal system in shopping malls (Liu and Deng, 2010). Based on the forecast and analysis of the energy consumption of the shopping malls in Shenzhen, large differences in energy use at various stores, the energy consumption of lighting and air‐conditioning system is the largest, the main problems of air conditioning system are manual control, low temperature difference of backwater supply and high power density of lighting equipment. It shows that there is a great space for saving energy in the buildings of shopping malls in Shenzhen (Liu et al., 2017).
To summarize, the research on energy-saving management of shopping malls is abundant, However, each has its own focus and shortcomings. For example, the influence of air conditioning specific factors, overall energy consumption in buildings, personnel changes and other factors were not studied. Under the background of the country’s vigorous promotion of energy conservation and emission reduction and previous projects of Shenzhen Tuoyuan energy technology Co., Ltd., data collection has been performed on the air conditioning systems of some public buildings. Based on Pearson and long short-term memory neural network, the energy consumption of the shopping malls is predicted. To help the shopping malls manage their energy consumption more efficiently, improving profitability (Lim and Kim, 2018).
Key technologies for system design
Pearson correlation coefficient
In statistics, the Pearson correlation coefficient is also called the Pearson product-moment correlation coefficient and is used to measure the degree of linear correlation between two variables X and Y, obtaining a value between −1 and 1. The formula for the Pearson correlation coefficient is as follows (Bibby et al., 2018)

It can be known from the formula that the Pearson correlation coefficient is obtained by dividing the covariance by the standard deviations of the two variables. When two random variables are negatively correlated, the size of the covariance value is not a good measure of the degree of correlation between them. For example, some data are distributed in two-dimensional space, and we want to know the degree of correlation between the X-axis and the Y-axis. If the correlation between X and Y is small but the data distribution is relatively discrete, this will lead to a larger covariance value (Mustafaraj et al., 2014; Nadal et al., 2017). It is not reasonable to use this value to measure the correlation. To better measure the correlation between two random variables, the Pearson correlation coefficient is introduced, and it is divided by the standard of the two random variables on the basis of the covariance as follows
It is easy to conclude that the Pearson correlation coefficient has a value between −1 and 1. When the linear relationship between the two variables increases, the correlation coefficient tends to 1 or −1. When one variable increases and the other variable also increases, this indicates that there is a positive correlation between them, and the correlation coefficient is greater than 0, when one variable increases and the other variable decreases, this indicates that they are negatively correlated, and the correlation coefficient is less than 0, if the correlation coefficient is equal to 0, it indicates that there is no linear correlation between the variables.
Long short-term memory neural networks
A recurrent neural network (RNN) is a type of neural network that takes sequence data as input, recurses in the direction of sequence evolution, and has all nodes (recurrent units) connected in a chain. RNNs have memory, share parameters, and are Turing-complete, so they can learn sequence features with high efficiency. RNNs have applications in natural language processing, such as language recognition, language modeling, and machine translation. They are also used for various types of time series prediction and combined with convolutional neural networks (CNNs) to process computer vision problems (El-Abd et al., 2018; Xu et al., 2016).
Although RNNs are frequently used to analyze and predict sequence data, research has shown that RNNs will forget previous state information over time, so long short-term memory (LSTM) neural networks have been introduced (Friess and Rakhshan, 2017; Kim and Srebric, 2016). LSTM time RNNs have the characteristics of being suitable for processing and predicting important events with long intervals and delays in time series and have been applied in many fields in recent years. In addition to the applications of LSTM networks in the fields of image analysis, document summary, speech recognition, handwriting recognition, etc., these networks also exhibit good performance in the prediction of time series data. They are mainly used to describe the relationship between the current data and the previous input data, use their memory capabilities, save the state information of the input network, and use the previous state information to affect the exact value and development trend of subsequent data. This approach includes the vanishing gradient problem.
The LSTM network structure uses a control gate mechanism, which is composed of memory cells, input gates, output gates, and forget gates. The specific structure is as follows. Xt represents the input at time t, and ht represents the state value of the cell at time t.
The three large boxes in the figure indicate the states of the cells at different timings, and the small boxes in the cells indicate the feedforward network layer with a sigmoid activation function. Similarly, for the cells in the tanh feedforward network layer, the number of hidden neurons in the feedforward network layer is continuously trained and debugged, and an optimal value is determined after comparing and measuring the prediction accuracy of each model. The calculation principle of each controller is introduced below.
First, calculate the value of the input gate and the candidate state value


Second, calculate the activation value ft of the forget gate at time t. The formula is as follows

From the above two calculation steps, we can calculate the updated state Ct at time t. The formula is as follows

After calculating the updated value of the cell state, the value of the output gate can be calculated. The calculation formula is as follows


Through the above calculations, the LSTM network can effectively use the input to produce a long-term memory function. The LSTM network structure, as shown in Figure 1.
LSTM network structure.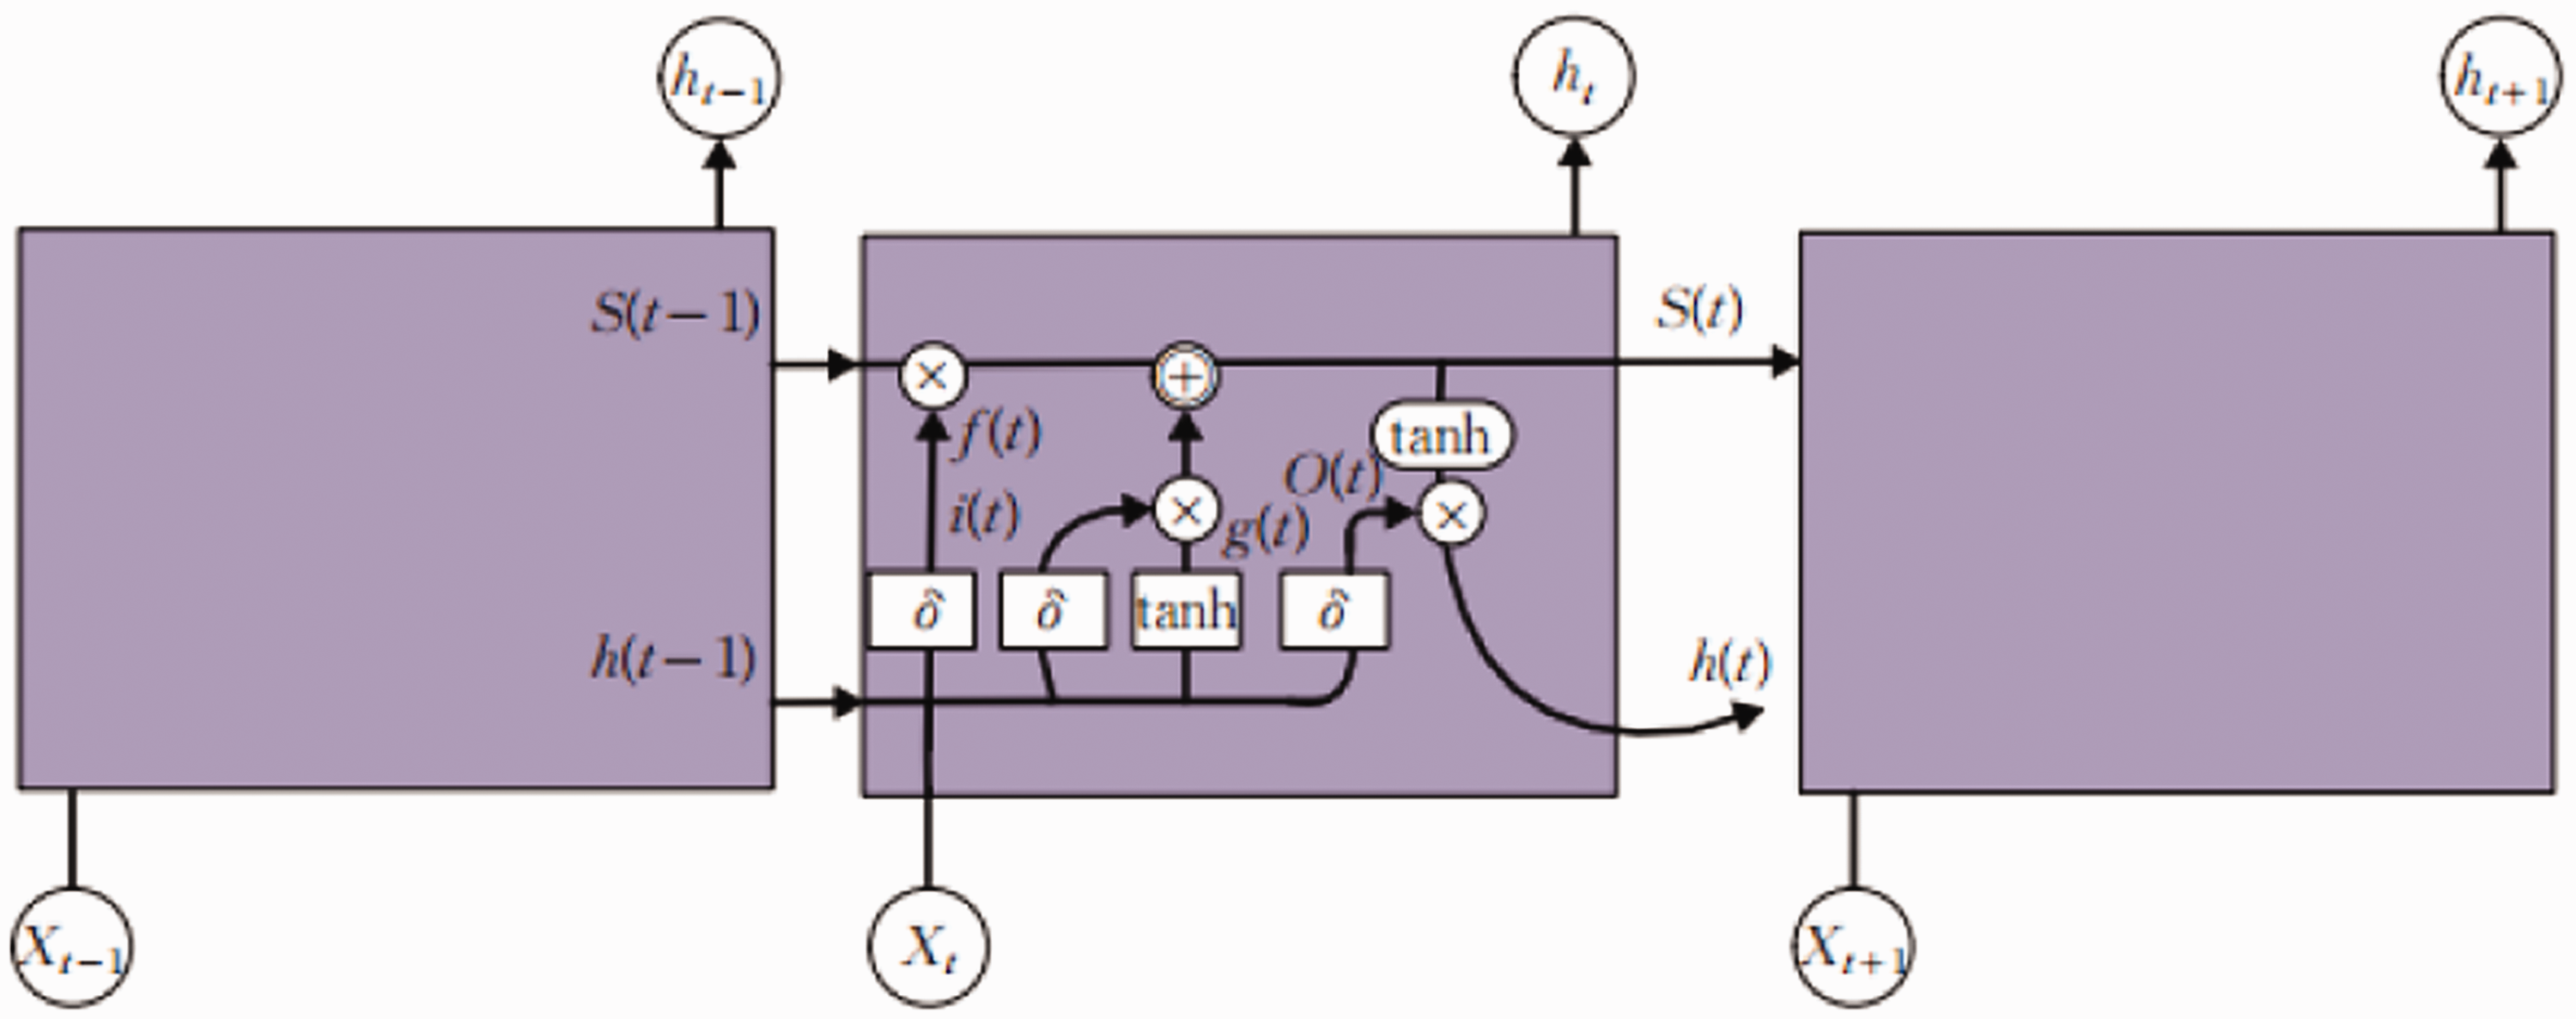
Methods and experiments analysis
Evaluation criteria
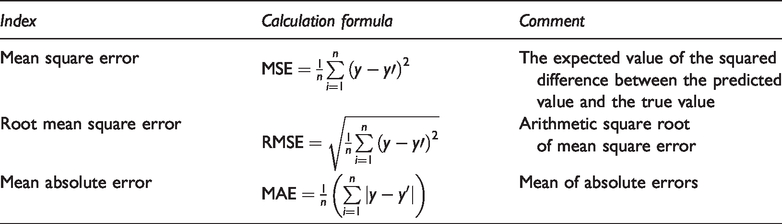
To test the model’s prediction effect on air conditioning power consumption, the mean square error, root mean square error, average absolute error, and average absolute percentage error are used to evaluate the prediction results. The calculation formulas of the prediction error indexes and their meanings are shown in Table 1.
Prediction error indexes.
Working principle of central air conditioning
A central air conditioning system mainly operates in summer, and its main function is to transfer excess heat from a room to the outside to play a cooling role. For the convenience of calculation, the heat transfer process is expressed as the reverse transfer process of the cooling capacity. During the cooling process of a central air conditioning system, the cooling capacity is transmitted three times, as shown in Figure 2.
Process of cold energy transfer.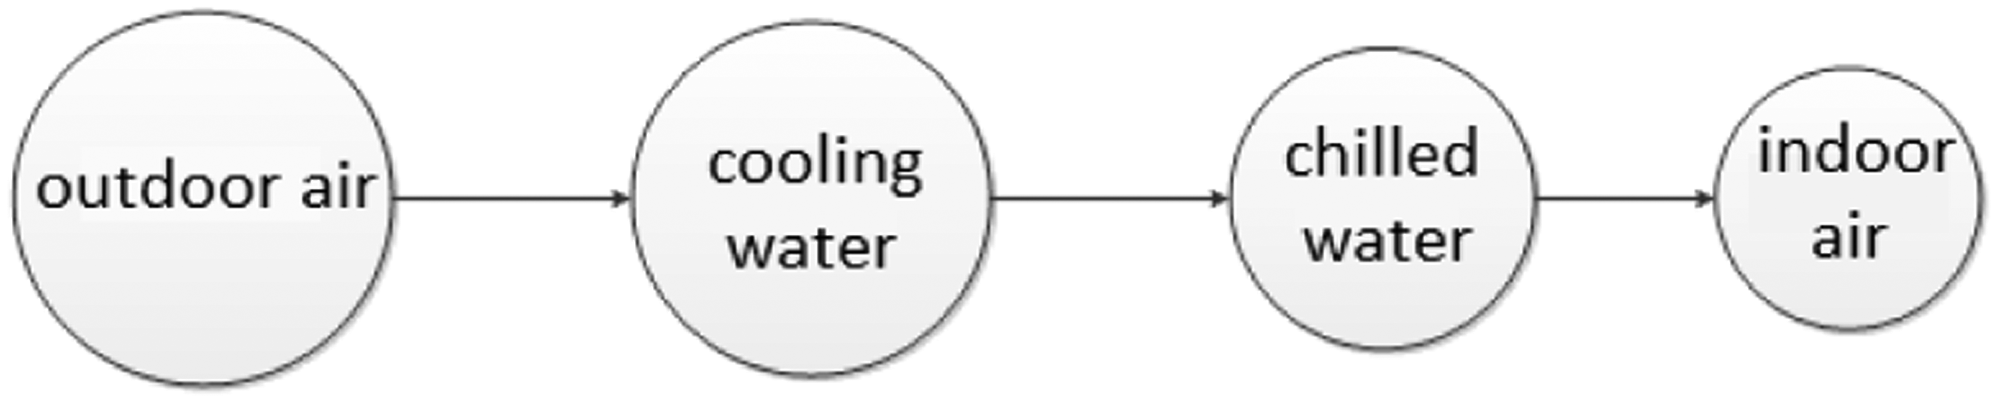
A central air conditioning system is mainly composed of five parts, namely, a refrigeration unit, a refrigeration pump, a cooling pump, a cooling tower and a fan coil. Among them, the cooling tower, refrigeration unit, and fan coil realize the processes of transferring cold air from outdoor air to cooling water, cooling water to chilled water, and chilled water to indoor air, respectively. The cooling pump and the freezing pump mainly complete the cooling water cycle and the freezing water cycle, respectively. As shown in Figure 3, the refrigeration unit cools the chilled water in a compressor and then sends the chilled water to a fan coil system through a refrigeration pump. At the same time, the refrigeration unit generates heat, and the cooling pump drives the cooling water circulation, transferring the heat generated by the cold machine to the cooling tower and then radiating it to the outdoor air.
Structure of a central air conditioning system.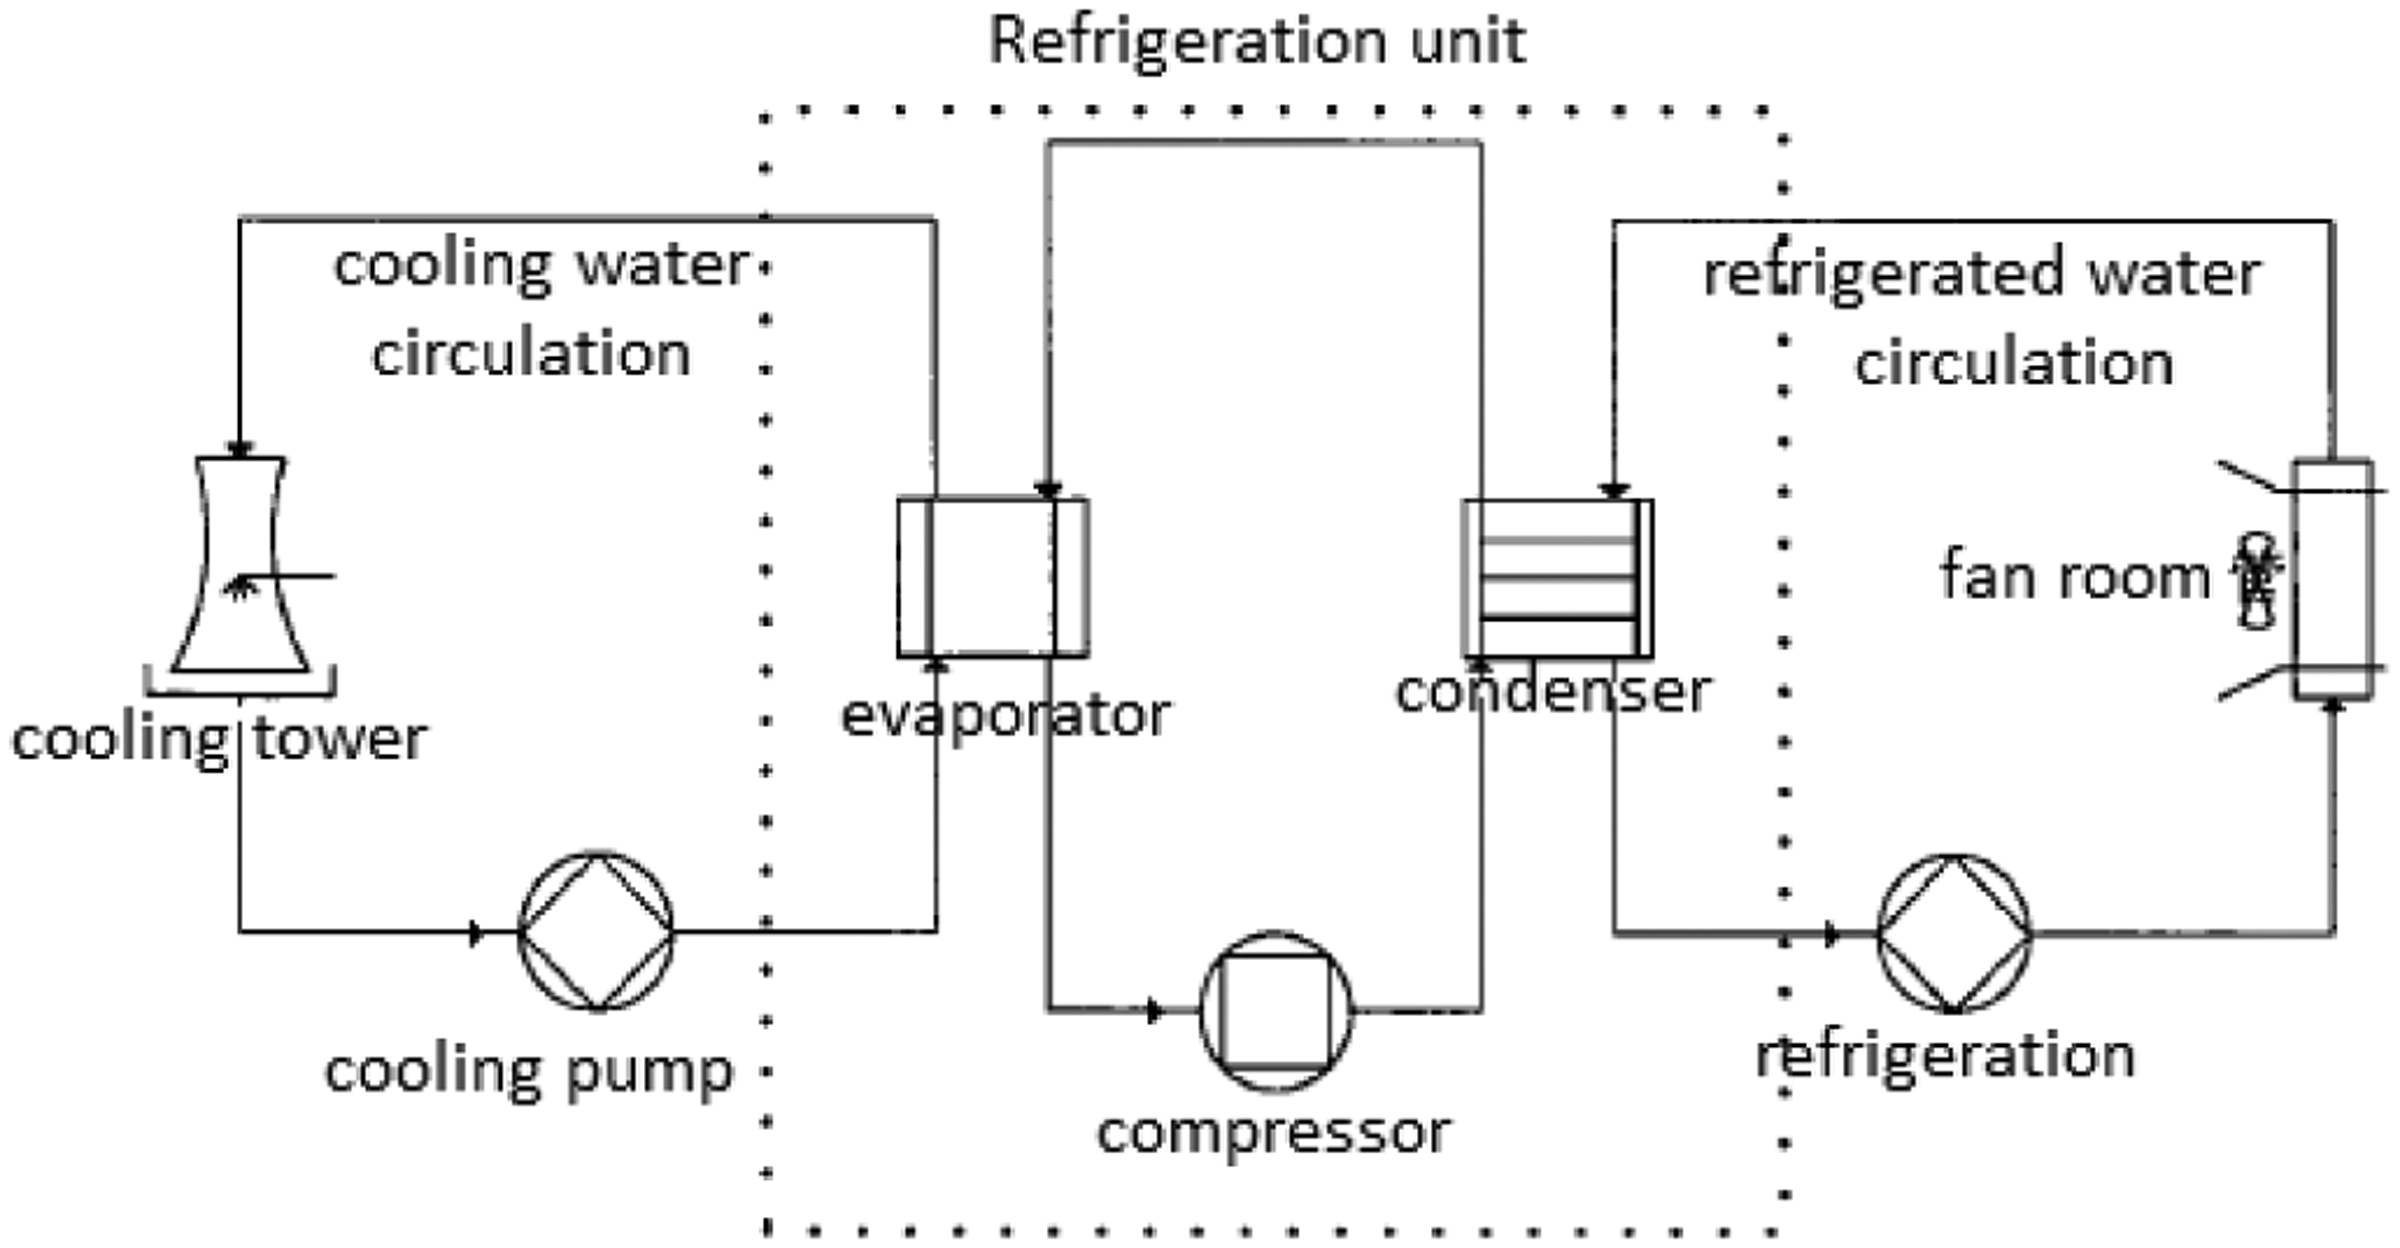
Experimental data
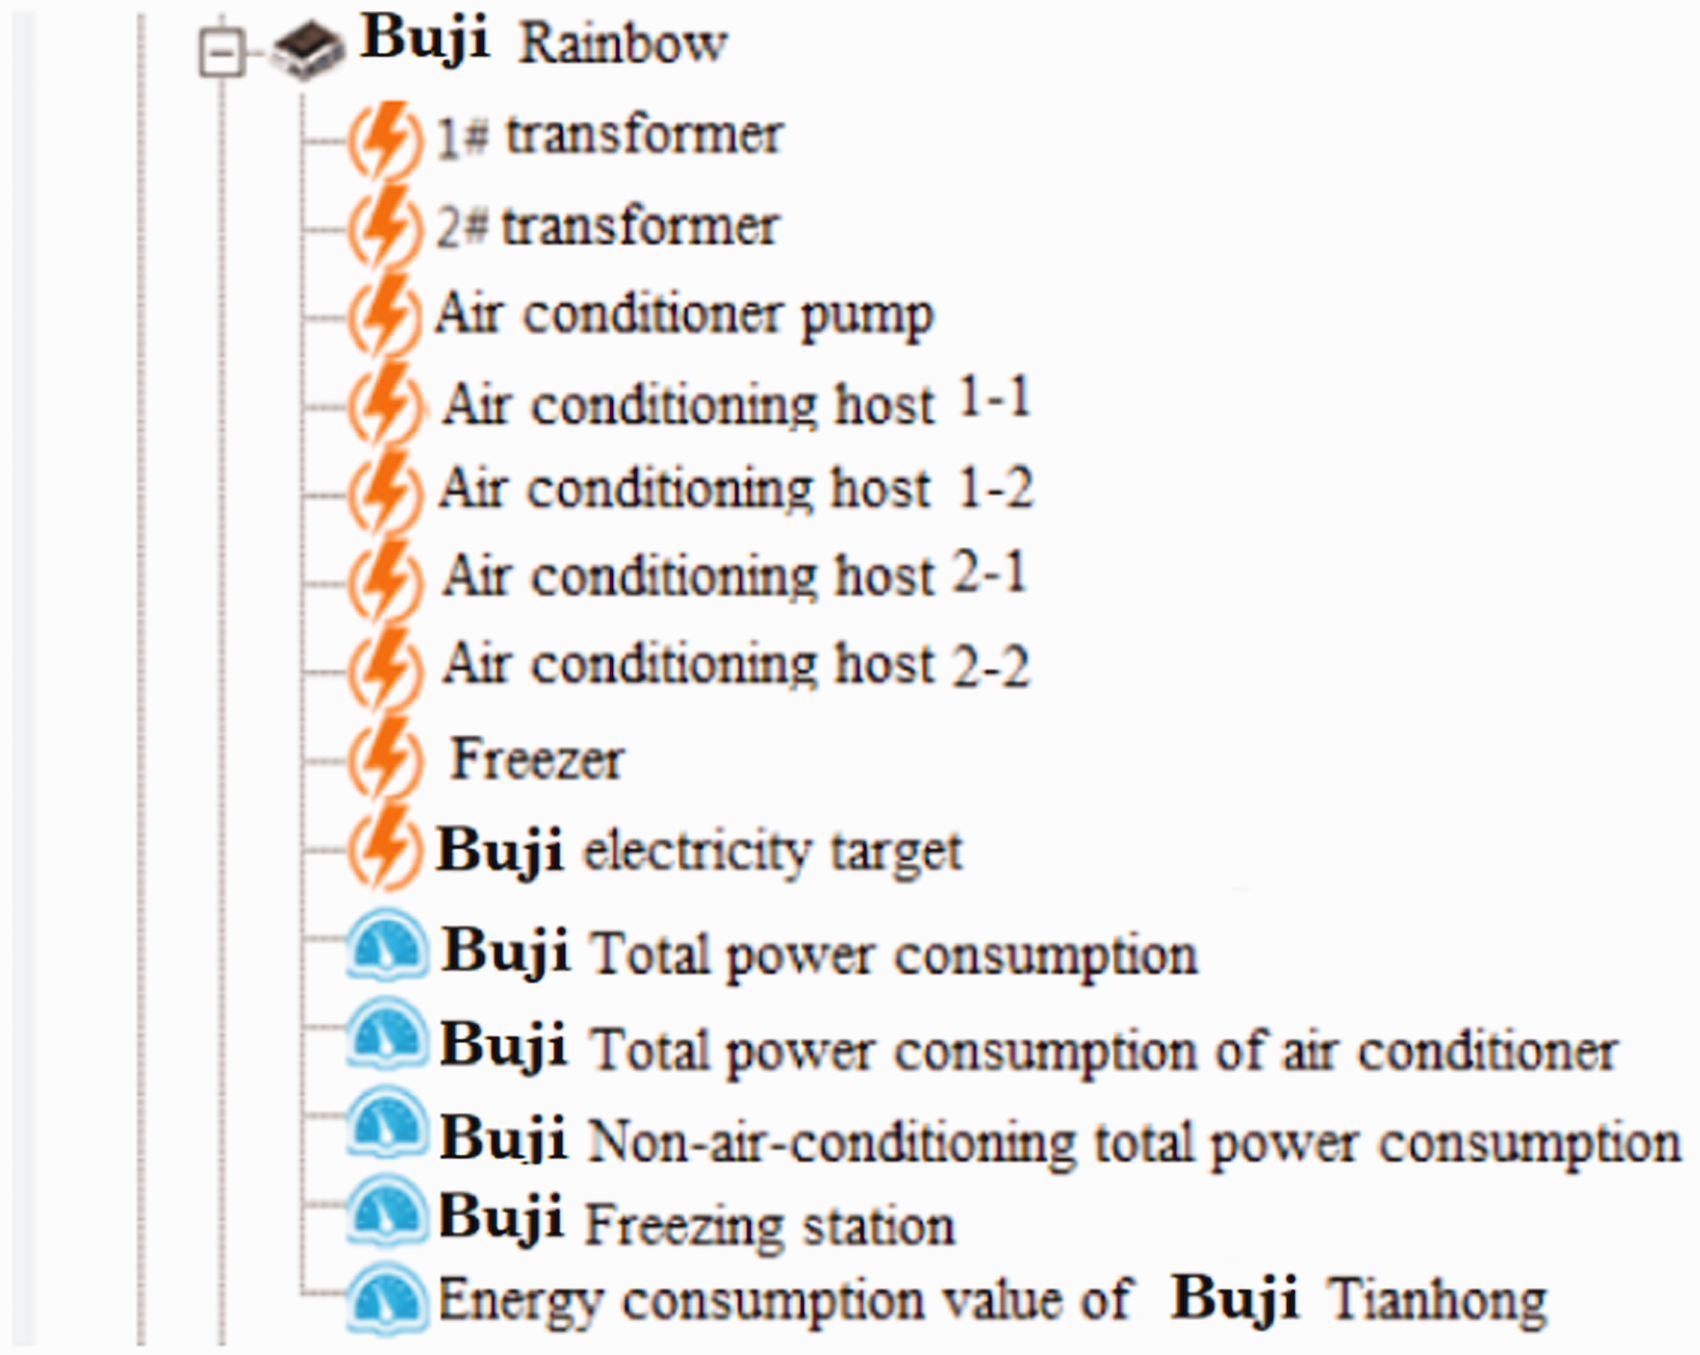
The statistical analysis page of the Rainbow Group’s energy management platform project undertaken by the company in Shenzhen is shown in Figure 4. The Rainbow Group has 15 branches, including the Buji, Ping-shan, and Ssang-yong stores. Among them, the Buji Rainbow department store’s data is the clearest and most in line with the working principle of central air conditioning. The data of the Buji air conditioner is shown in Figure 4 and 5. In this experiment, the air conditioning pump, host 1–1, host 1–2, host 2–1, host 2–2, the refrigerator power collected by the platform, and the eight impact indicators of time and weather in Shenzhen are selected to predict air conditioning in the Buji Rainbow department store, which always uses electricity.
Rainbow department store energy management platform. Buji Rainbow department store energy collection.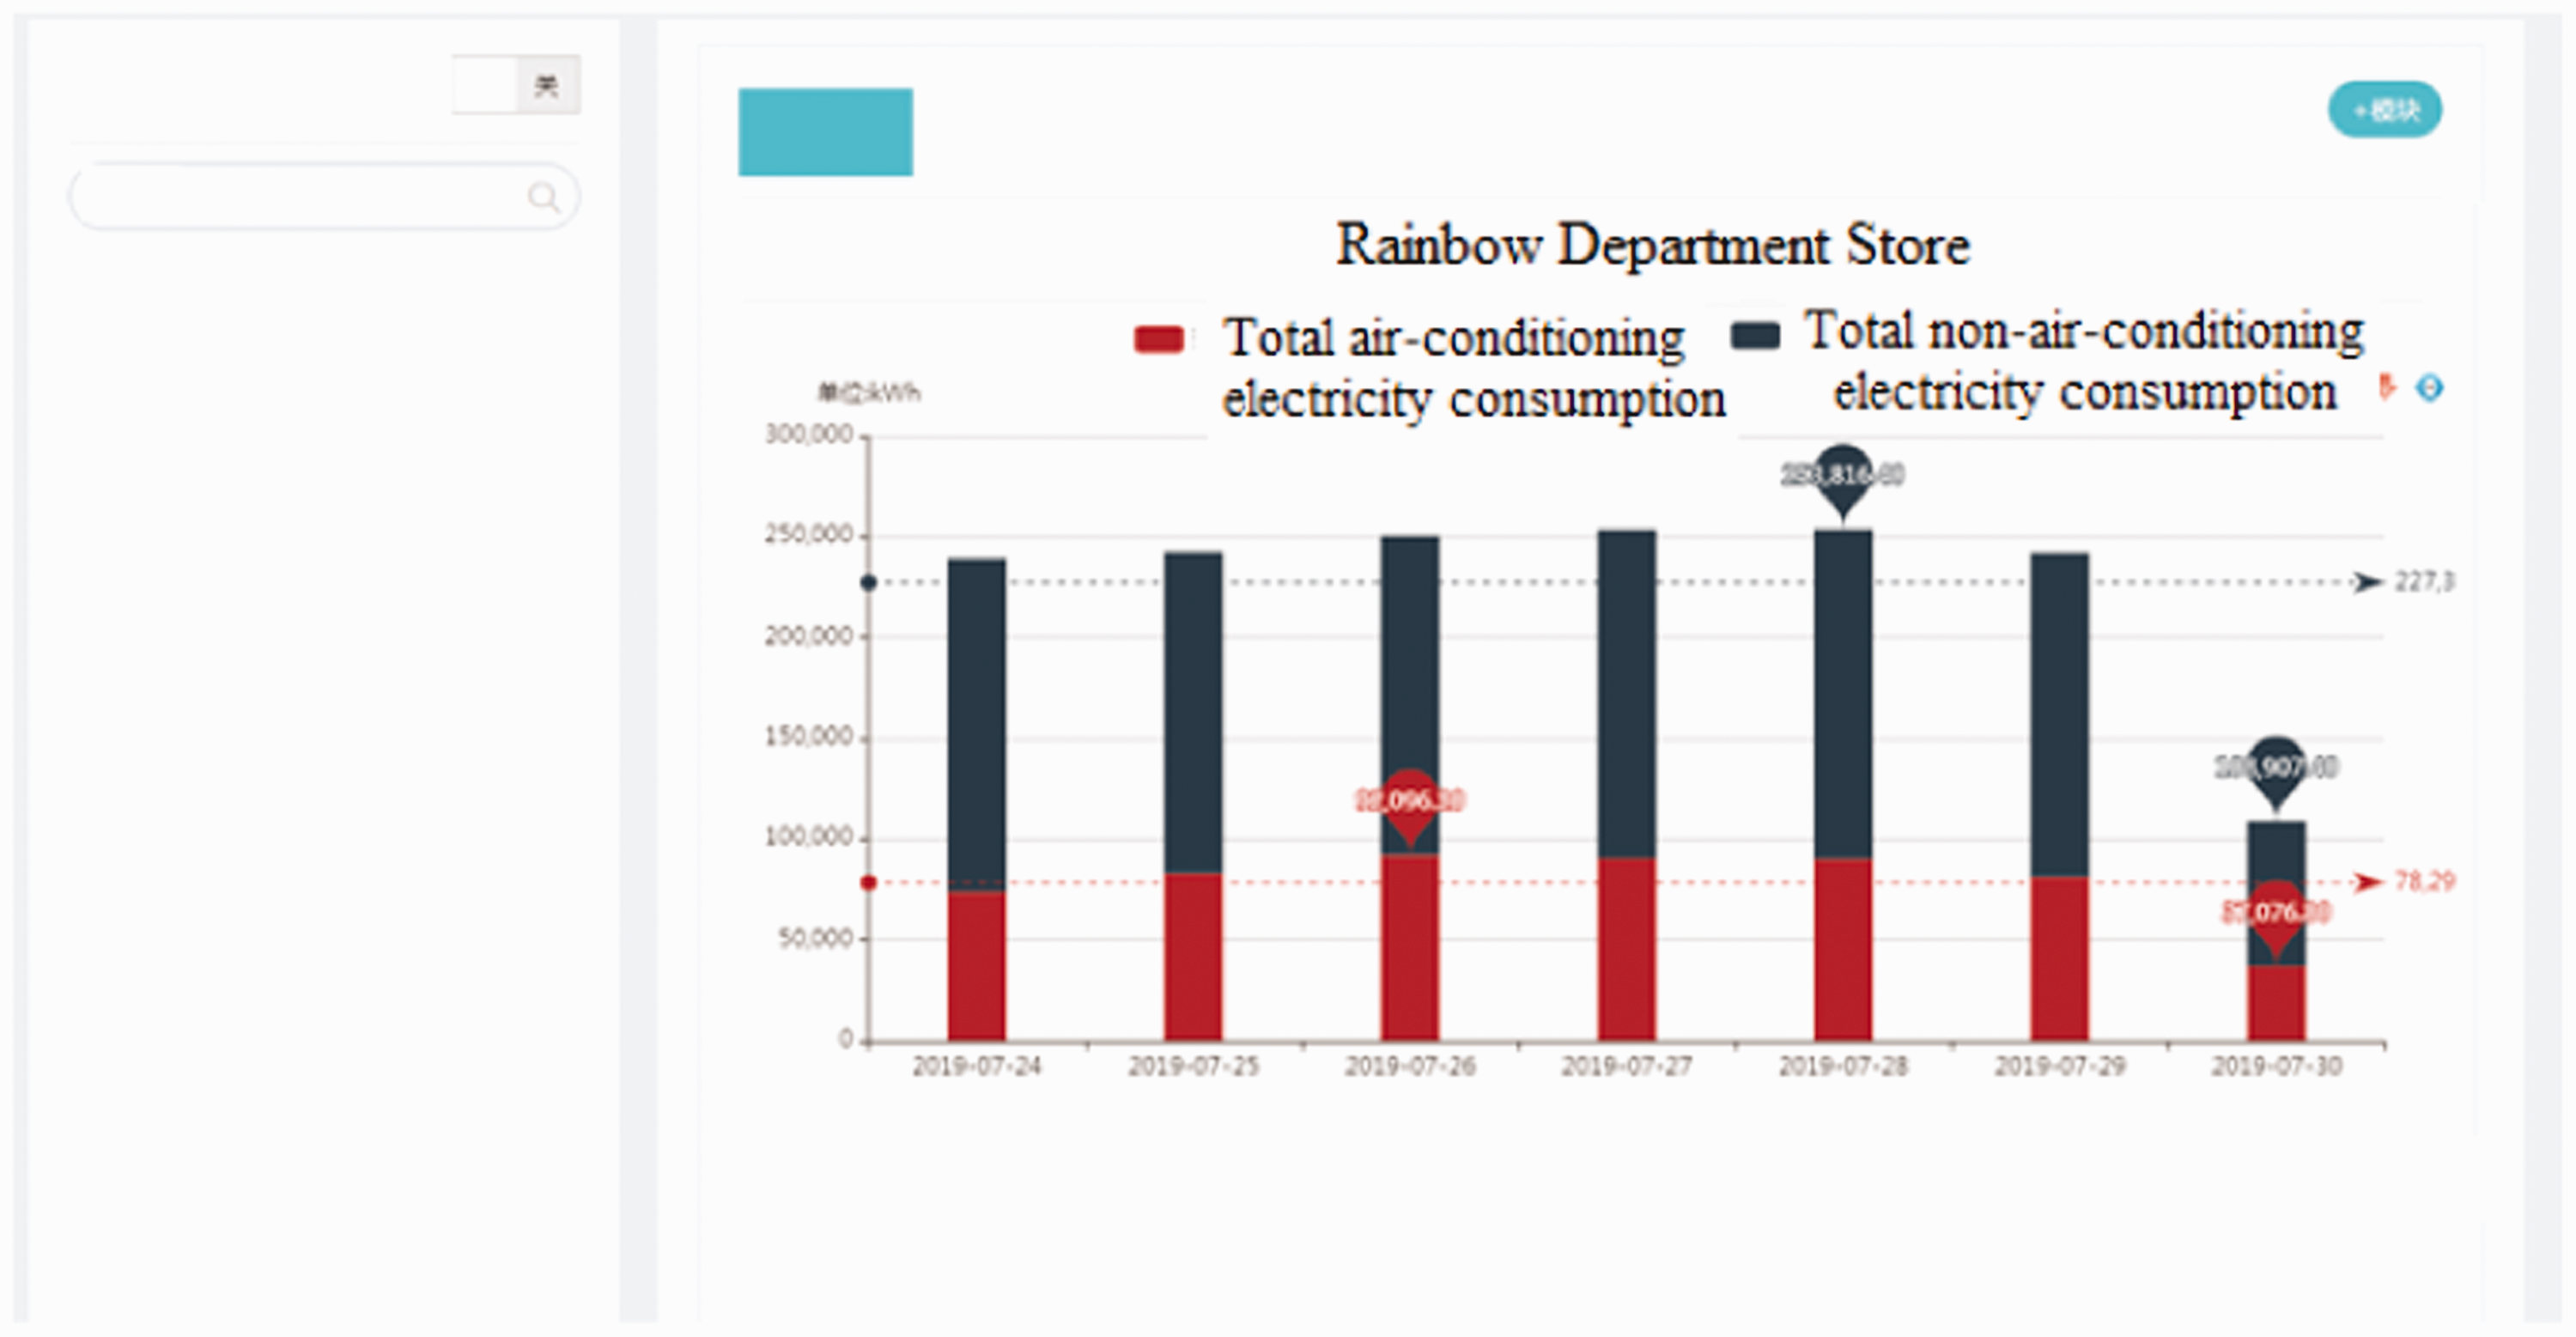
Since the initial stage of the platform is in the construction and testing phase, data collection is unstable, so different data sets are selected for experimental modeling. The first two-thirds of the data set is taken as the training set, and the last one-third is taken as the test set.
Experiment 1
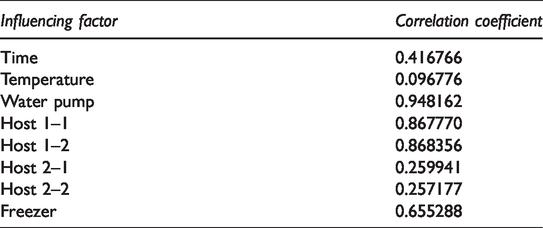
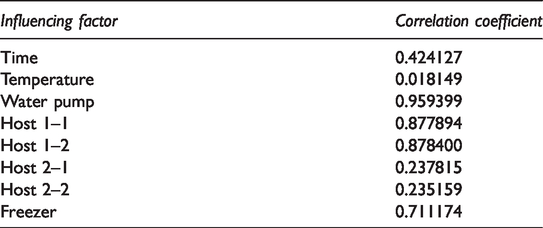
Select the energy consumption data collected during 1 March 2019 to 7 July 2019 as experimental analysis data, forecast error of the data during this period is shown in Table 3. The first two-thirds of the data is the training set, and the last one-third is the test set. The correlation coefficients of the total air conditioning power consumption and the other eight influencing indicators were obtained from the Pearson correlation algorithm, as shown in Table 2.
Pearson correlation coefficients for the data set from 1 March 2019 to 7 July 2019.
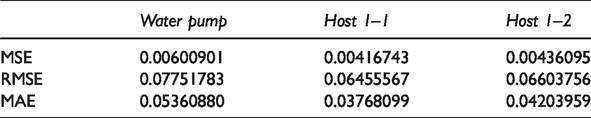
Forecast error of the data set from 1 March 2019 to 7 July 2019.
The water pump, host 1–1 and host 1–2 exhibit the largest correlation coefficients and are included in the LSTM model for training.
According to the prediction error, although the correlation coefficient of the water pump is larger than that of host 1–1 and host 1–2, the values of the three evaluation indexes are slightly larger than those of the other two. The reason is that the Pearson correlation coefficients of the three impact indicators all exceed 0.85 and are relatively similar, so the results obtained are basically the same.
A comparison between the predicted values and the actual values obtained by using the water pump as the indicator is shown in Figure 6.
Forecast comparison of pump for training.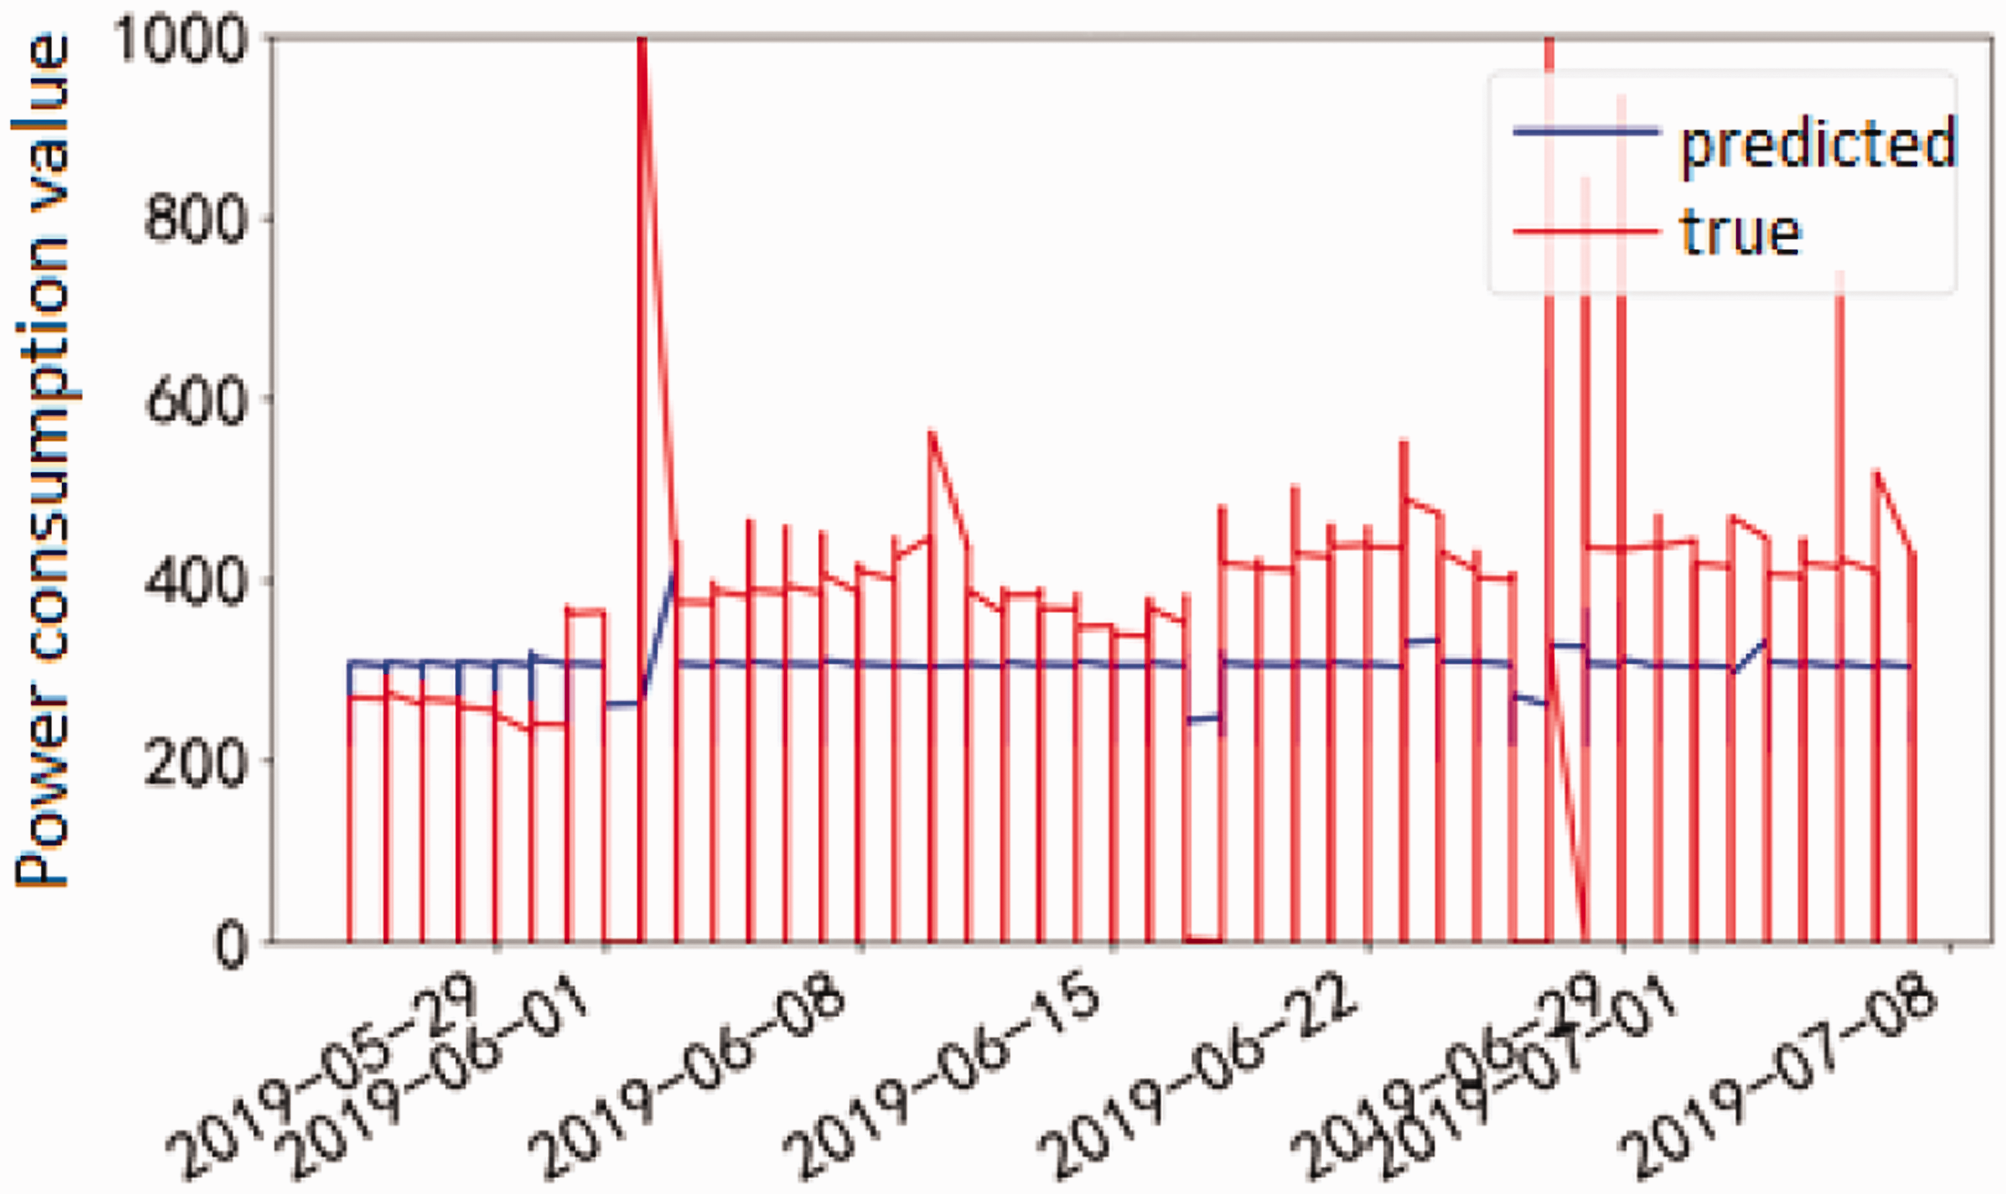
A comparison between the predicted values and the actual values obtained by using host 1–1 as the impact indicator is shown in Figure 7.
Prediction comparison of host 1–1 for training.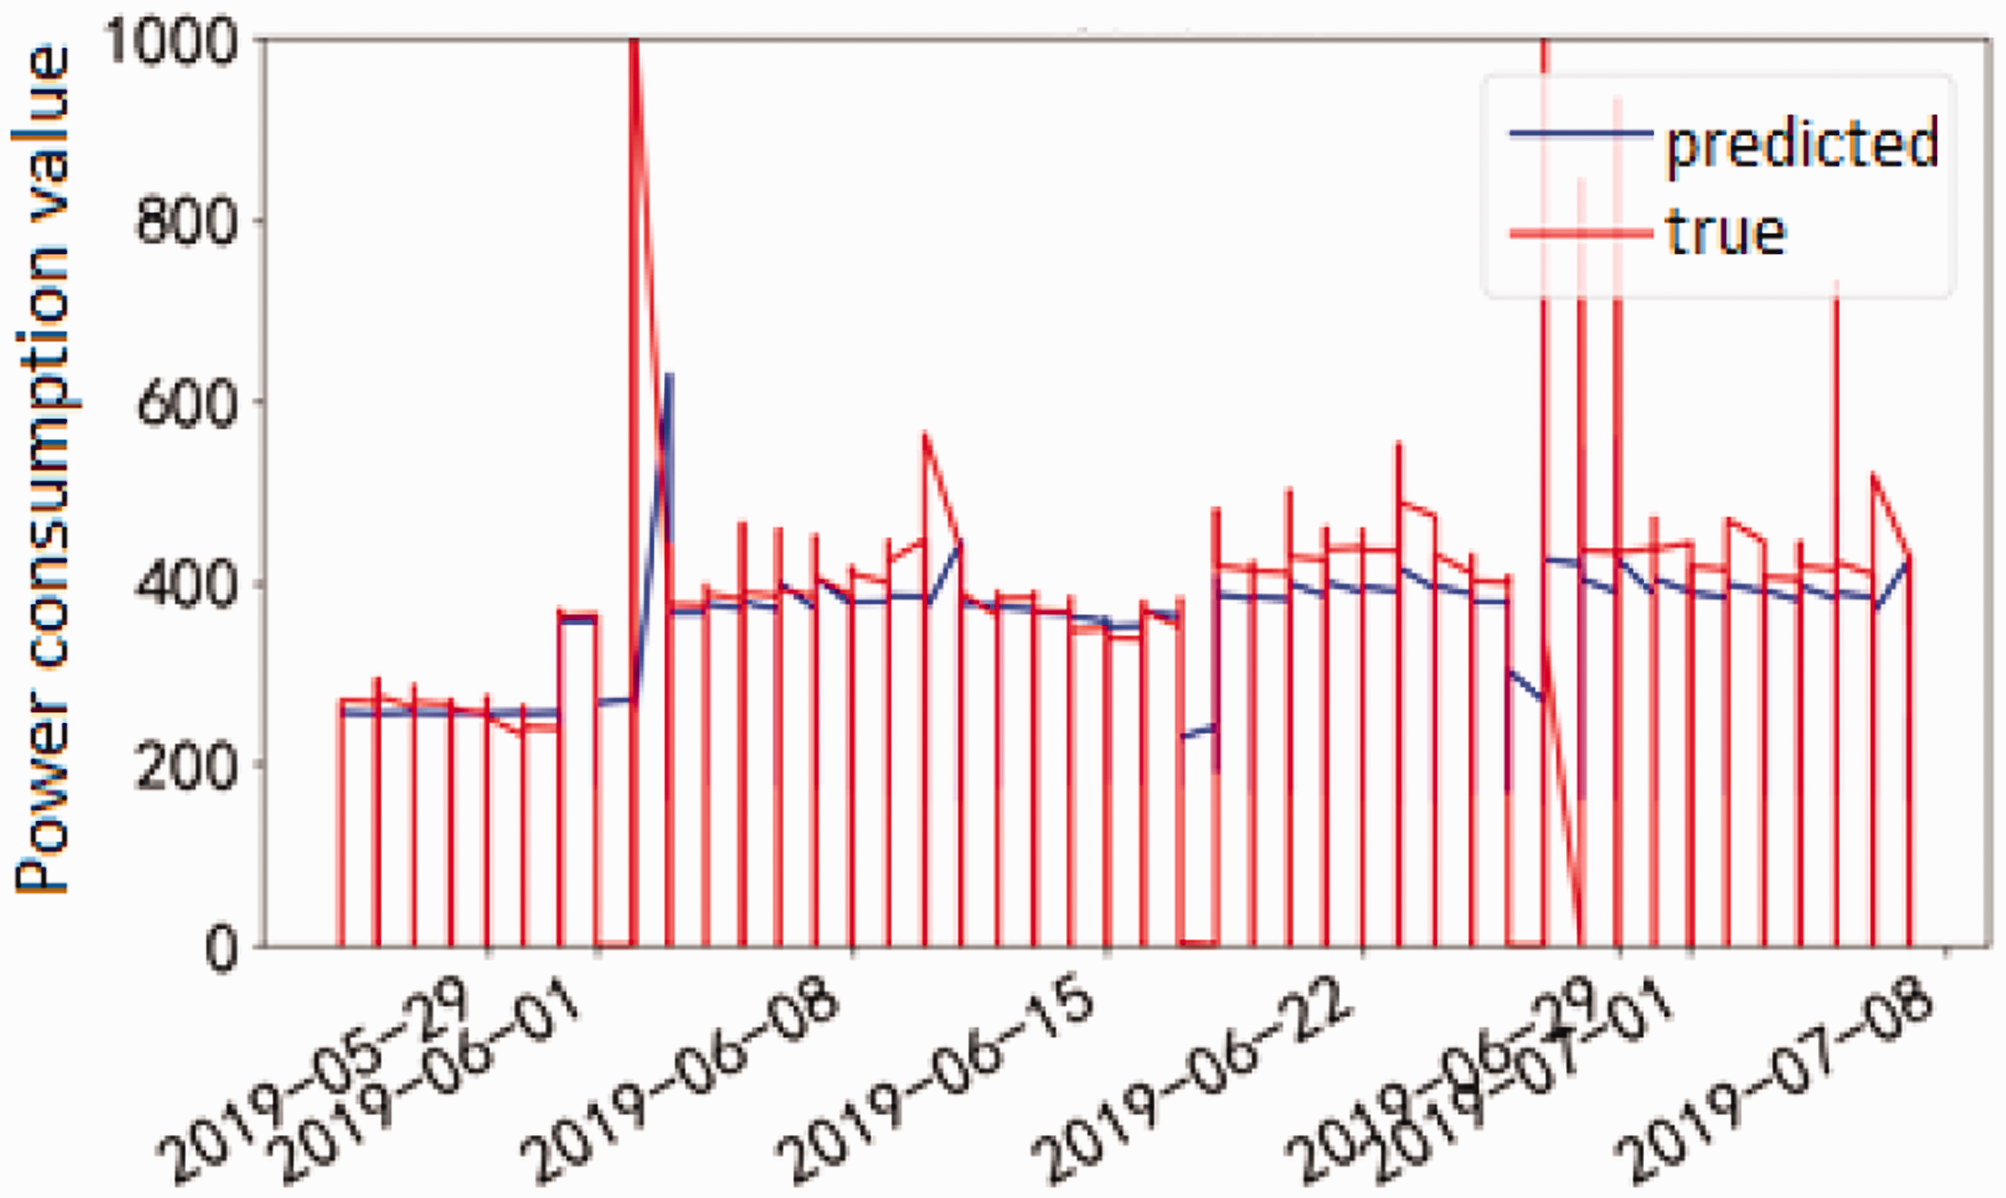
A comparison between the predicted values and the actual values obtained by using host 1–2 as the impact indicator is shown in Figure 8.
Prediction comparison of host 1–2 for training.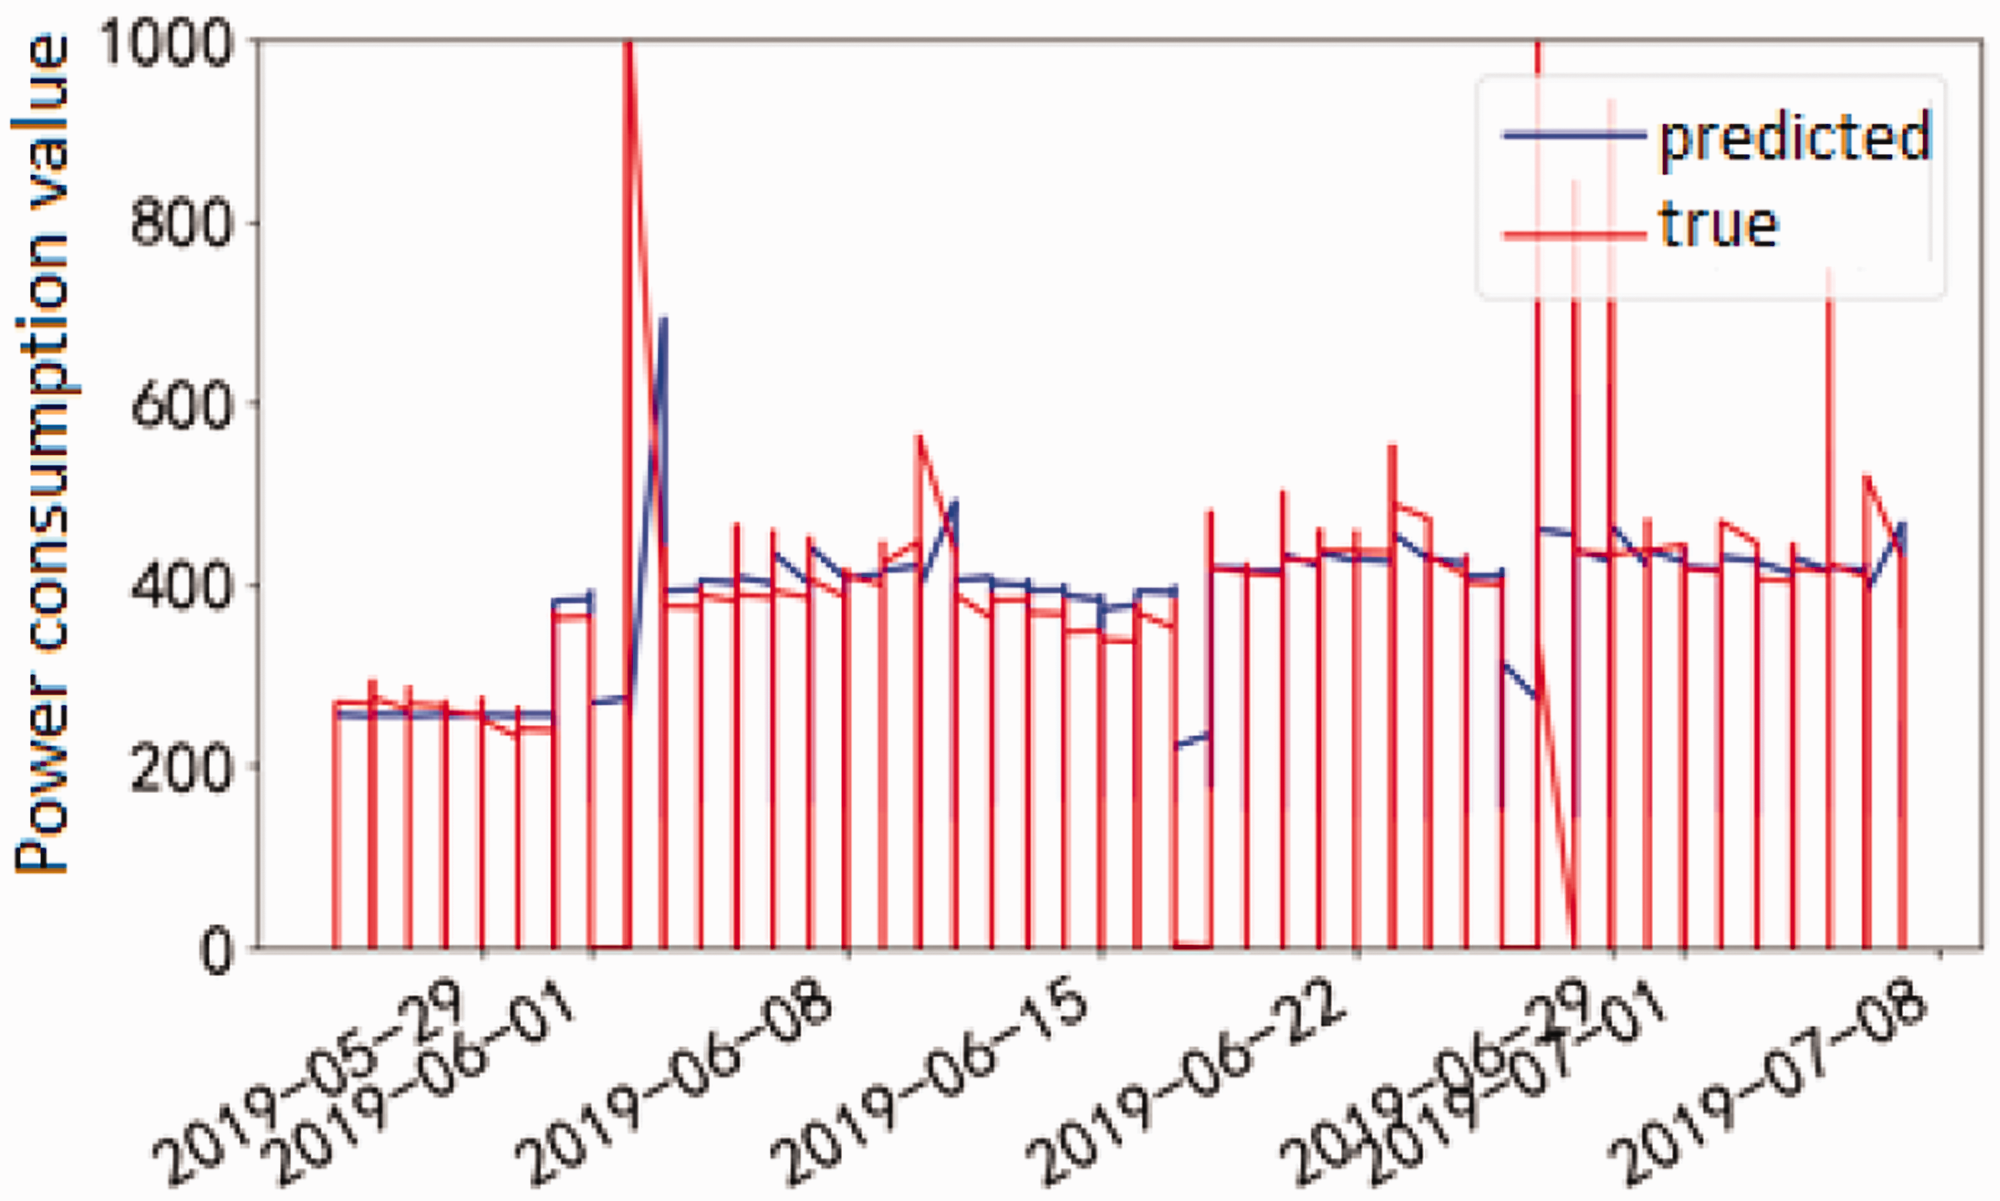
From the above three comparison charts, the fitting curves of host 1–1 and host 1–2 are better than that of the water pump. In view of the prediction error, the values of the three evaluation indexes of the water pump are greater than those of the other two.
Experiment 2
Experimental data were selected from 1 May 2019 to 7 July 2019. The correlation coefficients between the total air conditioning electricity consumption and the other eight influencing indicators were obtained from the Pearson correlation algorithm, as shown in Table 4.
Pearson correlation coefficients for the data set from 1 May 2019 to 7 July 2019.
The water pump, host 1–1 and host 1–2 exhibit the largest correlation coefficients and are included in the LSTM model for training. The prediction errors are shown in Table 5.
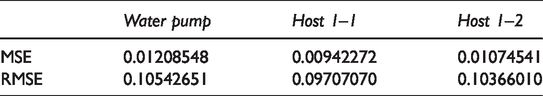
Prediction errors for the data set from 1 May 2019 to 7 July 2019.
A comparison between the predicted values and the actual values obtained by using the water pump as the indicator is shown in Figure 9.
Comparison of predictions for pump training.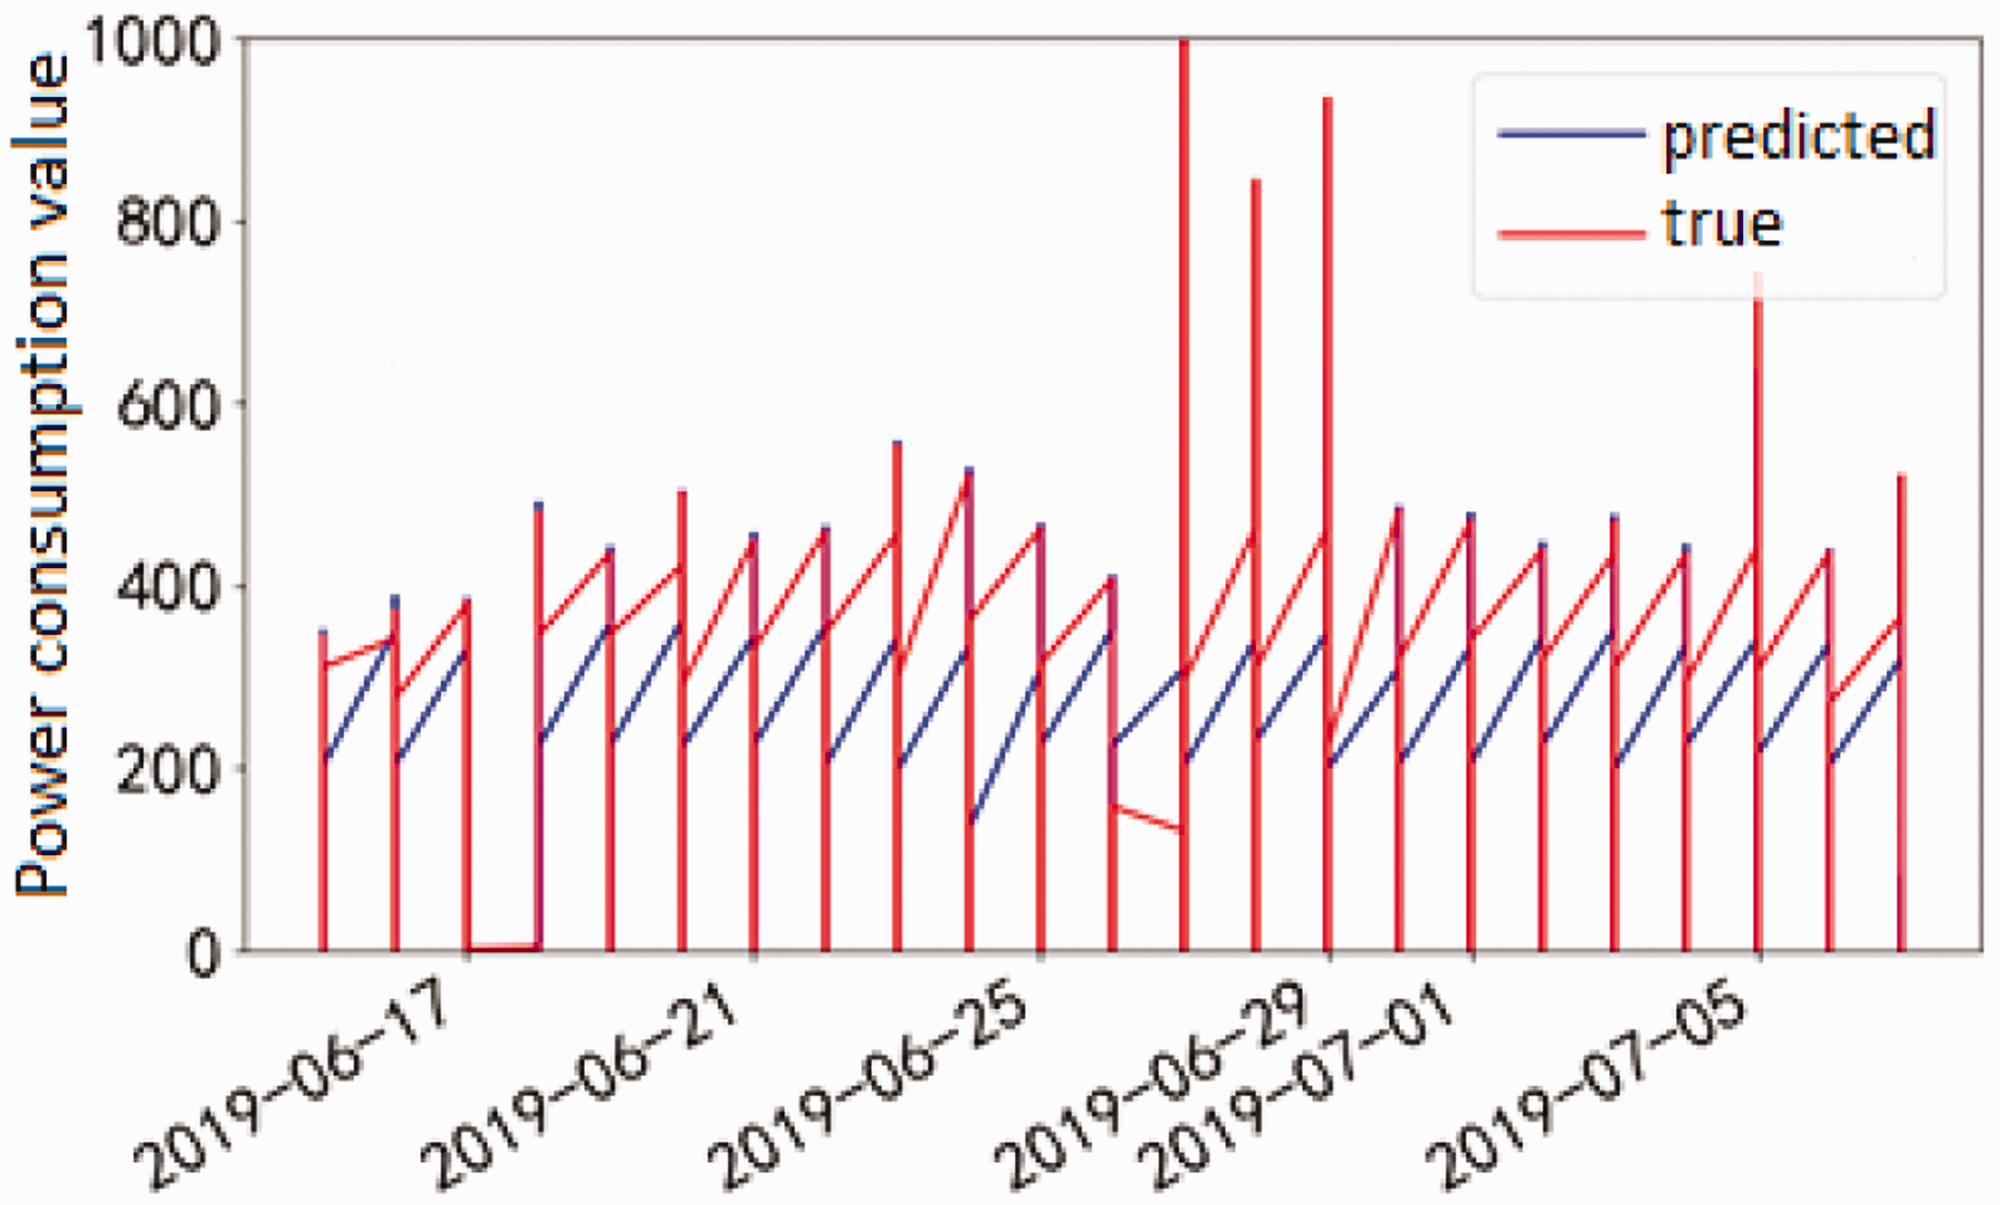
A comparison between the predicted values and actual values obtained by using host 1–1 as the impact indicator is shown in Figure 10.
Comparison of predictions for host 1–1 training.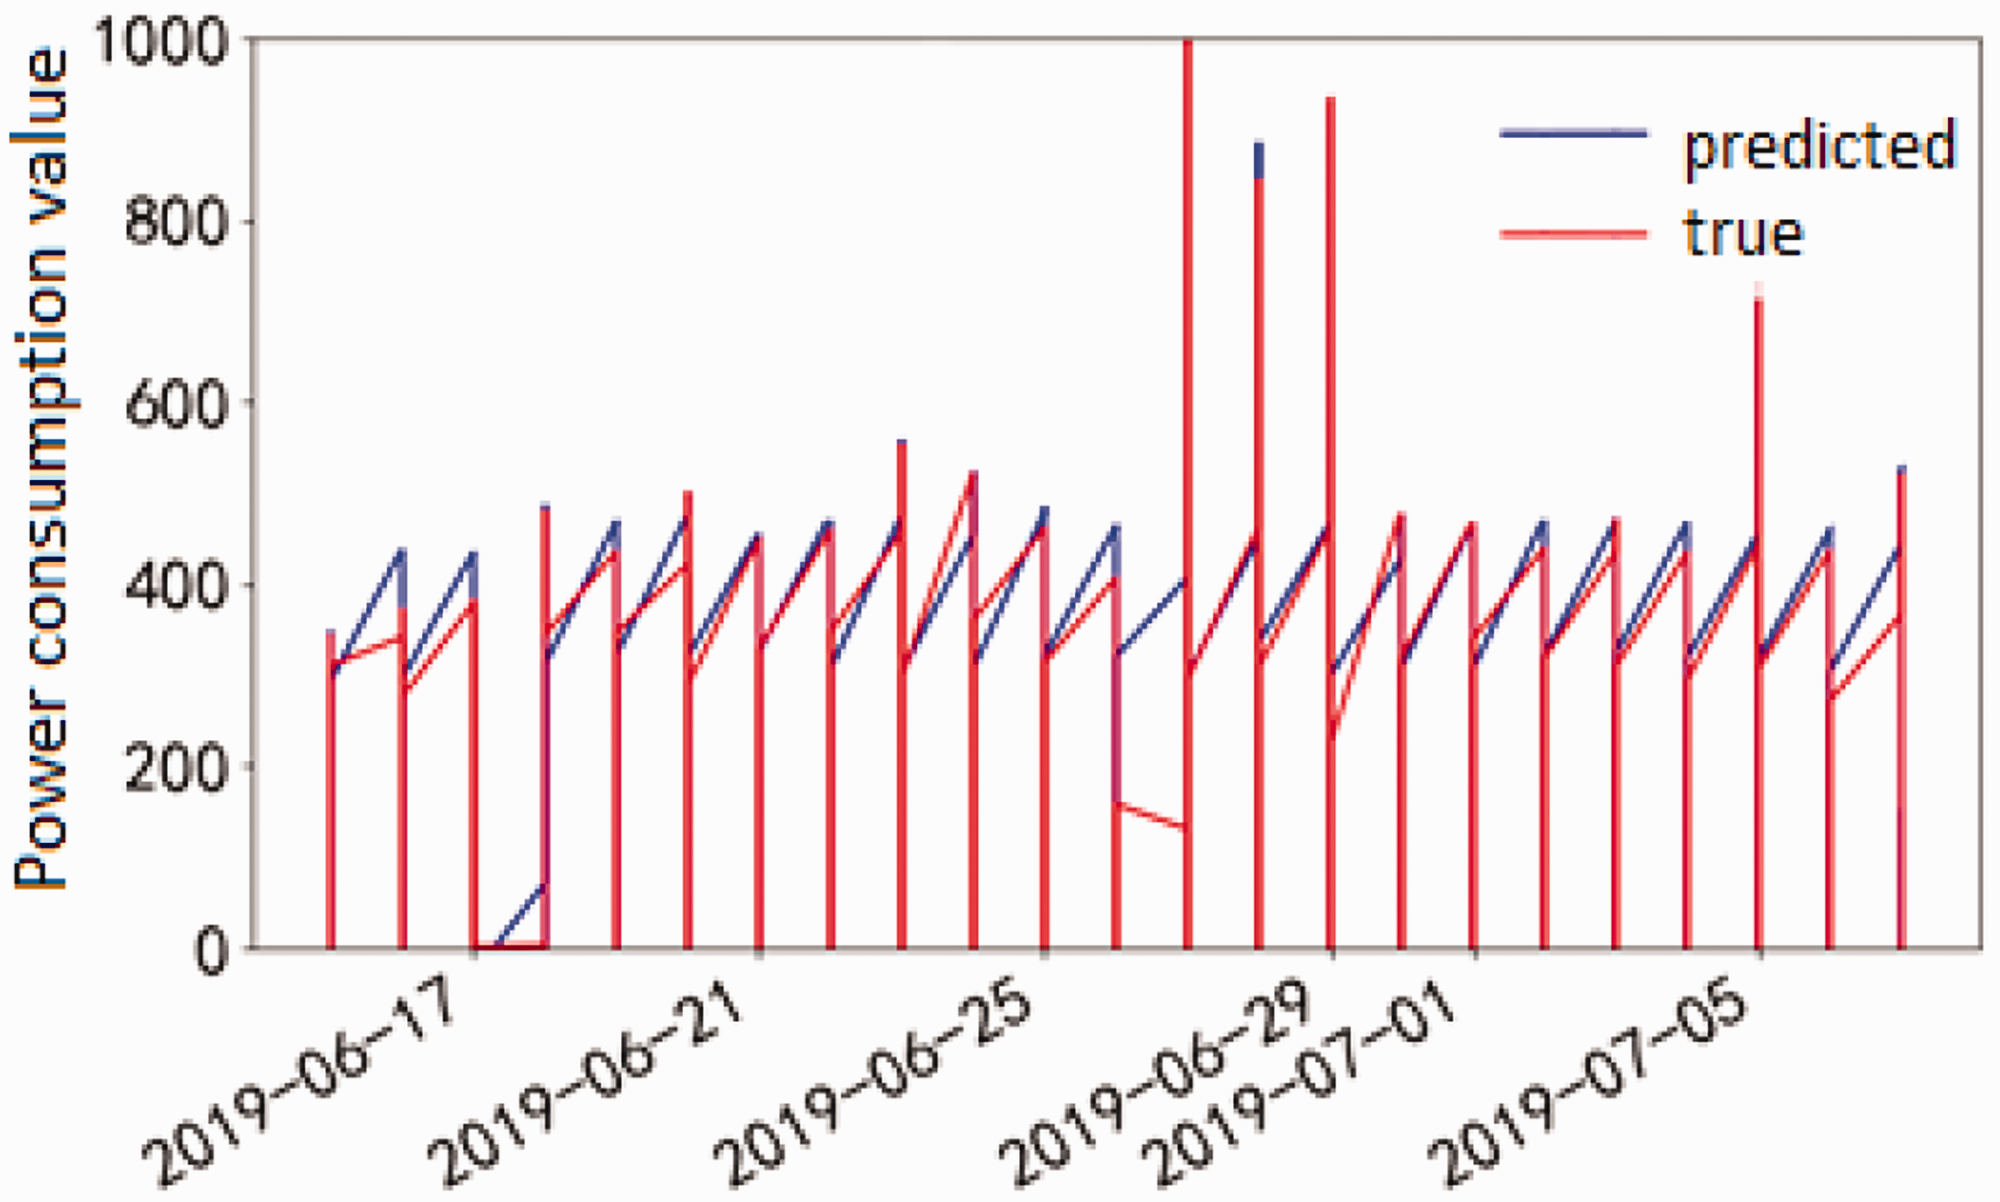
A comparison between the predicted values and the actual values obtained by using host 1–2 as the impact indicator is shown in Figure 11.
Comparison of predictions for host 1–2 training.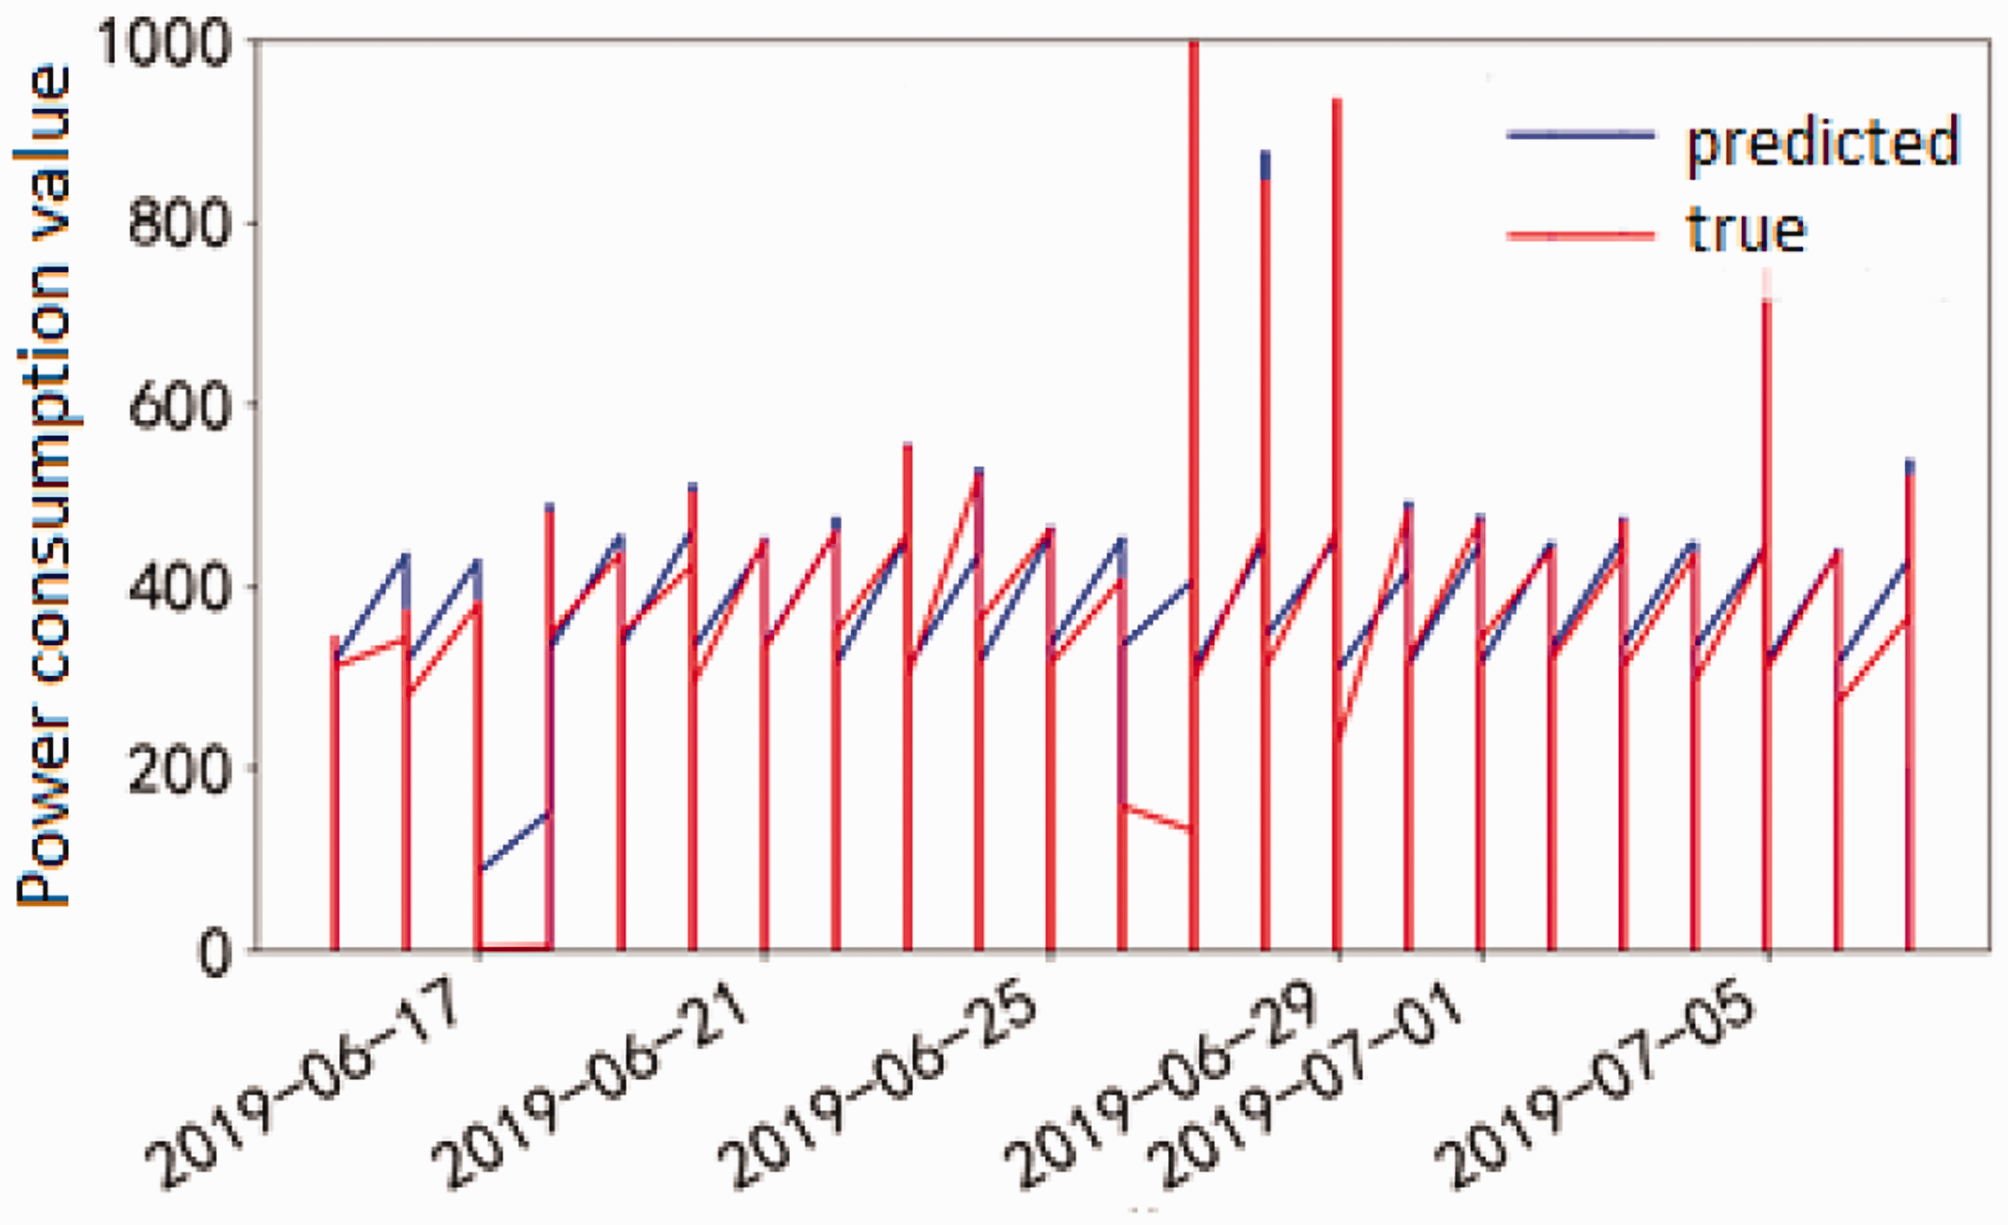
From the above three comparison charts, the fitting curves of host 1–1 and host 1–2 are better than that of the water pump. In view of the prediction error, the values of the three evaluation indexes of the water pump are greater than those of the other two. Combining the previous three experiments, overall, the prediction results of host 1–1 and host 1–2 are relatively good.
Conclusions
According to the results of the two experiments, the following can be concluded: (a) the prediction results of the impact indexes with a large Pearson correlation coefficient are better, and an increase in a Pearson correlation coefficient that exceeds 0.85 has little effect on the prediction results; (b) the closer the time of prediction is, the better the experimental results; and (c) although the data sets are different, the top three correlation coefficients were obtained for the pump, host 1–1 and host 1–2. Due to the short period of these experiments, many deficiencies remain, and there are still some problems to be studied and explored in the follow-up: (a) data source problems. The data source used in this experiment is only related to the air conditioning system itself. It is necessary to further analyze the relationships among other factors, such as pedestrian flow, shopping mall sales, and air conditioning electricity consumption; (b) correlation analysis. Further plans include using the CATBOOST decision tree algorithm for correlation analysis; and (c) model improvement. It is further planned to introduce an attention mechanism into the LSTM model and input the influencing factors into the model by weight.
Footnotes
Declaration of conflicting interests
The author(s) declare no potential conflicts of interest with respect to the research, authorship, and/or publication of this article.
Funding
The author(s) disclosed receipt of the following financial support for the research, authorship and/or publication of this article: Financial support for this work was provided by the Guangdong Province Higher Vocational Colleges & Schools Pearl River Scholar Funded Scheme (2016) and Project of Shenzhen Science and Technology Innovation Committee (JCYJ20170817114522834).