
Abstract
The Juhugeng mining area in the Qilian Mountains is the only district of China where terrestrial gas hydrate has been found. This paper aimed at studying the gas migration for gas hydrates based on fluid inclusion and apatite fission track experiments with samples being collected in both the hanging wall (Triassic strata, non-hydrocarbon source rocks) and footwall (Jurassic strata, hydrocarbon source rocks) of drilling cores. Fluid inclusions are found in both the hanging wall and footwall, and are characterized by two generations: the first generation includes gaseous and liquid hydrocarbon fluid inclusions with the homogenization temperature of concomitant saline water inclusions being 83–115°C, and the second generation includes gaseous fluid inclusions with the concomitant homogenization temperature of saline water inclusions being 115–149 °C, suggesting two periods of gas migration. Combining with the reconstruction of the burial and thermal histories, the gas migration history can be elaborated as follows: (1) In the Late Paleogene period (>30 Ma), the gas in the footwall migrated to the hanging wall because of the thrusting of Triassic strata, with the temperature being more than 110 ± 10°C (derived from apatite fission track results), corresponding well with the homogenization temperature of the saline water inclusions of the first generation being 115–149 °C; (2) In the Late Neogene to Quaternary (<8 Ma), the study area were impacted by the intensive faults, leading to the second gas migration with a good match between temperature lower than 110 ± 10°C (derived from apatite fission track results) and the homogenization temperature of saline water inclusions in the second generation (83–115 °C), and the geological age of the second gas migration can be restricted from 8 to 1.8 Ma. The permafrost was formed in Quaternary, so the controversial gas hydrate formation pattern can be determined that the gas should be accumulated before the permafrost was formed.
Introduction
Gas hydrate is a kind of clean energy with enormous potential (Kimura et al., 2014; Tomaru et al., 2007), and the Juhugeng mining area of Muli basin in the Qilian Mountain permafrost is the only district of China where terrestrial gas hydrate has been found, which has aroused widespread attention (Fang et al., 2017; Lu et al., 2011; Liu et al., 2015; Wang, 2010). The gas hydrate is preserved in the temperature–pressure stability zone at a depth of 116–490 m with temperature being less than 10 °C (Chen, 2015). Many researchers have studied the gas hydrate of the Juhugeng mining area from different aspects, including sedimentary and structure characteristics (Chen, 2015; Jiang et al., 2015; Shao et al., 2015), gas hydrate stability zone (Cao et al., 2013), gas hydrate distribution (Lu et al., 2011; Wang et al., 2011; Zhu et al., 2010), gas source (Cao et al., 2012; Lu et al., 2010; Sun et al., 2014; Wang et al., 2009), and reservoir characteristics (Peng et al., 2018). However, there is only limited literature that refers to gas migration process for the gas hydrate, which was mainly involved in the discussion of the gas hydrate accumulation type: some researchers thought that the gas was accumulated before the formation of permafrost (Lu et al., 2015a; Zhai et al., 2014); they found that the gas hydrate was preserved in the footwall of thrust faults and disconnected micro-fissures or pores of sandstone and shales, which could mean the gas accumulated before the formation of permafrost, and the mudstone, shales, and siltstones of the coal measures near the surface were considered as good sealing strata. Other researchers believed that the permafrost was formed before the gas accumulation (Zhang et al., 2014; Li et al., 2013), and they declared that all the gas hydrate was found only near the faults and below the permafrost, indicating that the faults acted as the migration pathway and the permafrost can prevent the gas from escaping because of the nondeveloped pore-microfracture system of the permafrost.
So, the gas source, gas migration pathways, gas reservoirs, and the sealing conditions for the gas hydrate had been discussed widely in literature; however, the gas migration history for gas hydrates is still unclear. Therefore, the gas migration history for gas hydrates, including the geological ages and periods of gas migration, was considered as the main purpose of this study.
To explore the gas migration geological ages and periods of gas hydrate, a clear understanding of the source rocks is needed. The carbon isotope (δ13C1, δ13C2, δ13C3), an important indicator for the gas source (different values indicate different gas source), is often used to determine the origin of the gas hydrate. There are two viewpoints of the gas source in the study area: One is that the gas comes from deep crude oil cracking, mainly because the carbon isotope value of the gas hydrate conforms to the characteristics of oil-type cracking gas (Lu et al., 2010, 2011). The other viewpoint is that the gas originated from source rocks in coal measures of the Middle Jurassic, and its main bases are as follows:
The carbon isotope of coal seam gas in the middle Jurassic is lighter than general values and indicates the mixing characteristics of coal- and oil-type gases (Cao et al., 2012). While most carbon isotope values of gas hydrates show oil-type gas features, there are still some samples with coal-type gas characteristics (Dai et al., 2017). The carbon isotope values of pyrolysis gas of mudstones in the Middle Jurassic have strong similarities with those of gas hydrates (Chen, 2015). Source rocks characterized by Type I-II kerogen produce oil-type gases with δ13C1 being in the range of −30‰ to −55‰ and δ13C2 being less than −28‰, while source rocks characterized by Type III kerogen produce coal-type gases with δ13C1 being in the range of −10‰ to −43‰ and δ13C2 being greater than −27.5‰ (Cao et al., 2012; Tan et al., 2017). The organic matter of mudstones and oil shales in the upper section of the Middle Jurassic is characterized by Type I-II kerogen (Wang, 2018), of which the carbon isotope is in accordance with that of gas hydrate (Tan et al., 2017).
In addition to the carbon isotope contrast, the distribution and geochemistry characteristics of hydrocarbon source rock also can help to distinguish the source rocks of the gas hydrate from the other side. The regional stratigraphy in Muli basin from old to young includes Palaeozoic strata (Cambrian, Ordovician, Silurian, Devonian, Carboniferous, and Permian), Mesozoic strata (Triassic, Jurassic, and Cretaceous), and Cenozoic strata (Palaeogene, Neogene, and Quaternary), and there are theoretically four sets of hydrocarbon source rocks in the Muli coal basin (Fu and Zhou, 1998): the dark gray limestone in the Upper Carboniferous and the Lower Permian; the dark mudstone/shale in the Upper Triassic; and the coal, dark mudstone/shale, and oil shale in the Middle Jurassic. The characteristics of these hydrocarbon source rocks are as follows.
Regardless of regional stratigraphic data or previous research achievements (Fu and Zhou, 1998), it is found that the Carboniferous Formation in Juhugeng mining area is less developed. The Carboniferous strata are only found in the district that lies 3 km to the north of the study area. Therefore, it is considered that source rocks of Carboniferous Formation have little or no contribution to the gas hydrate. According to the research of Liu (2015) on evaluation of source rocks in Permian strata, the source rocks of Permian strata have poor hydrocarbon generation capacity with the organic matter content being less than 0.2% and pyrolysed hydrocarbon values being generally less than 0.1%. The organic matter content of dark mudstones/shales in the Upper Triassic strata is mainly between 1% and 3%, with mean values of the hydrocarbon generation potential index (“S1 + S2,” obtained from rock pyrolysis experiments) being less than 0.5 mg/g, belonging to non- or poor hydrocarbon source rocks (Zhang et al., 2014). Based on the statistics of strata data, the thickness of source rocks in the Upper Triassic is between 1.33 and 35.3 m, so the hydrocarbon generation capacity of source rocks in the Upper Triassic is very limited. In addition, Tan et al. (2017) substantiated that no gas migrated from the Upper Triassic using the carbon isotope contrast of coal measure gases in the Middle Jurassic, which further negated the source rock role of the Upper Triassic. The vitrinite reflectance of source rocks (coal, dark mudstone/shale, and oil shale) in the Middle Jurassic is mainly from 0.95% to 1.46% (Wang, 2018), which is in the mature stage of the abundant hydrocarbon generating period. The thickness of source rocks is between 27.25 and 388.66 m, with an average of 158.74 m, showing good hydrocarbon generation capacity. So far, no oil or gas reservoirs have been found in the Upper Carboniferous or the Lower Permian or the Upper Triassic; only in the Middle Jurassic are there coal measure gases and gas hydrate reservoirs that are generated by source rocks of the Middle Jurassic (Cao et al., 2012; Tan et al., 2017).
Therefore, we believe that the source rocks of gas hydrates in this area are the coal, mudstone, and oil shales in coal measures of the Middle Jurassic. Those source rocks are always considered as the good gas source rocks for the gas generation (Pandey et al., 2018; Singh et al., 2016a, 2016b, 2017). So, the geological ages of gas migration for the gas hydrate studied in this paper are based on the understanding that the source rocks of gas hydrate are located in coal measures of the Middle Jurassic. The impact of thrust faults on gas migration is discussed because (1) the faults damaged coal measures and caused a large number of fractures and crushed zones, which constituted gas migration channels (Lu et al., 2015a, 2015b; Zhai et al., 2014); and (2) coals and shales are self-sourcing reservoirs, while faults can break the adsorption equilibrium (Clausen et al., 2015; Ju et al., 2009, 2016) so that coalbed methane and shale gas can migrate to the temperature–pressure stability zone.
To characterize the gas migration process in this area, a fluid inclusion (FI) study was applied to detect the conditions and periods of the gas migration for the gas hydrate. The apatite fission track (AFT) experiment, which can record the rock’s age, and Thermodel for Windows, a computer geological simulation of burial and thermal histories, were used to restore the structural evolution of Middle Jurassic in the study area. Finally, the gas migration characteristics controlled by thrust faults were discussed.
Geological background
The Juhugeng mining area is located in the western part of Muli basin, Qinhai Province of Northwest China, and the geotectonic position is in the middle Qilian Mountains of the Qilian orogenic belt (Pan et al., 2009) (Figure 1, the structure outline map of the study area is cited from Jiang et al., 2015, and the map of China and the two of drill column are added in this study). The geological structures of the Juhugeng mining area are dominated by thrust faults, which are densely developed and act as NW-NE trending lines (Cao et al., 2010). The research area was a stability region during the Middle Jurassic period, when the coal measures, including Jiangcang Formation (Upper) and Muli Formation (Lower), were deposited in this area (Guo et al., 2011), and the sedimentary facies of Middle Jurassic coal-bearing strata consist of a suite of fluvial, lacustrine, and swamp (Wen et al., 2006). There are abundant coal and organic shale layers as the hydrocarbon source rocks in Jiangcang and Muli Formations, and the lithology of coal measures is characterized by sandstones being interbedded with multiple coal and shale layers (Shao et al., 2015).
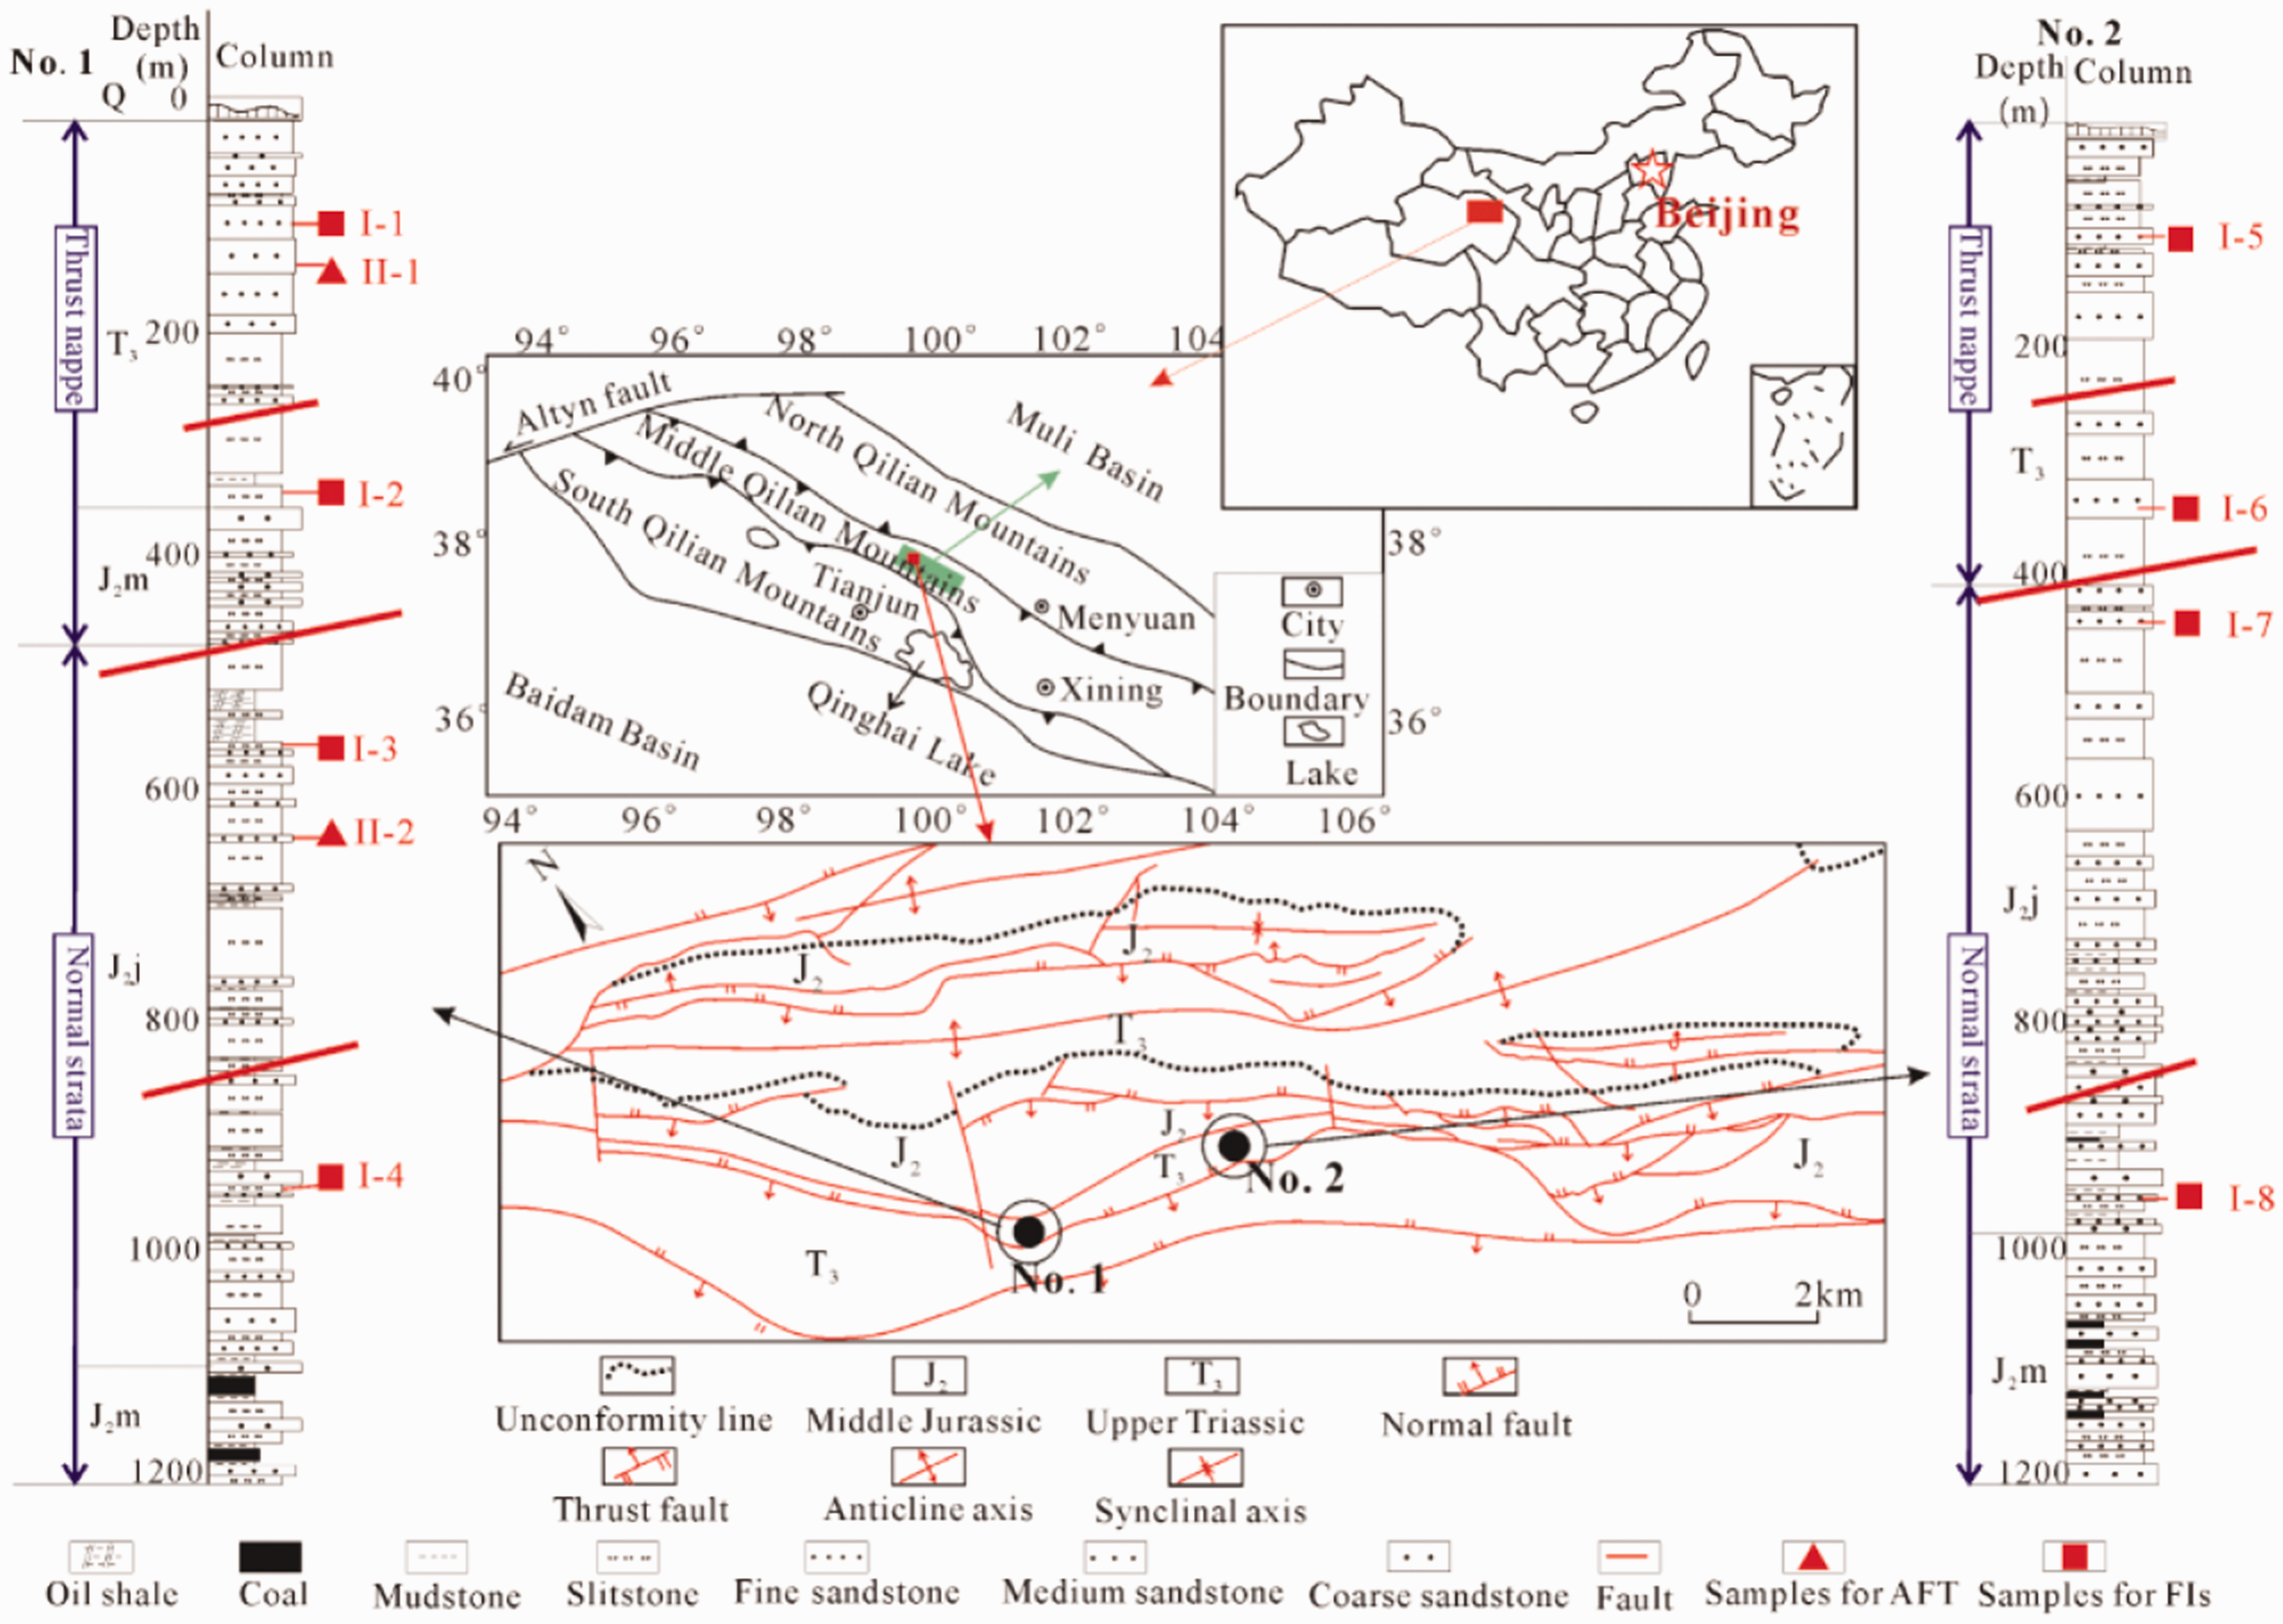
Geological position of the Juhugeng mining area with sampling locations (Source: modified from Jiang et al., 2015). 1: gas hydrocarbon; 2 gas–liquid hydrocarbon; 3: liquid hydrocarbon; 4: gas hydrocarbon–saline water; and 5: saline water. Number a, b, and c are quartz, and number d is calcite.
From the Late Jurassic to Early Cretaceous, the stress state of the research area changed from being stretched to being pressed, and some faults and folds began to form (Jiang et al., 2015). The Juhugeng mining area uplifted from the Late Cretaceous to Paleogene and experienced a rapid subsidence and uplift since the Miocene epoch due to the India-Eurasia collision (Jiang et al., 2015; Jovivet et al., 2001; Qi et al., 2016). Therefore, the strata of the study region were denuded heavily, and structures here mainly consisted of thrust faults because of the compression and uplift. The strata in the southern part of the Juhugeng mining area had been cut off by the thrust faults, the Triassic strata were thrust onto the Middle Jurassic strata, and the strata in hanging wall were overturned (Figure 1). The exposed strata are Quaternary, Middle Jurassic, and overturned Triassic, which thrust onto the Middle Jurassic (Figure 1).
Samples and methods
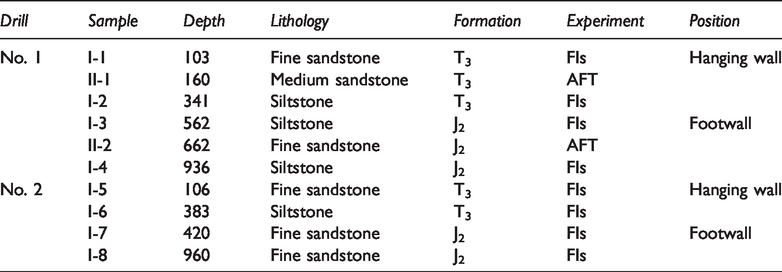
As Figure 1 shows, samples were collected from two drill cores located in the southern part of the study area. The hanging wall of No. 1 drill contains overturned Upper Triassic and partial Middle Jurassic strata, and footwall includes Middle Jurassic strata in normal succession, while the hanging wall of No. 2 drill only contains overturned Upper Triassic strata, and the footwall consists of Middle Jurassic strata in normal succession. In fact, there is considerable tectonic evolution and structure information in the literature, but in order to constrain the thrust fault ages, two sandstone samples were collected for the AFT experiments, of which Sample II-1 was from the hanging wall, and Sample II-2 was from the footwall. Eight sandstone samples in both the hanging wall and footwall were prepared for the FI experiments to explore the conditions and periods of gas migration. The sample information is listed in Table 1.
Sample information.
FI experiments
The FI experiments, including transmitted light and fluorescence microscopy observations, homogenization temperature measurements, salinity measurements, and micro-Raman spectroscopy, were carried out at the Beijing Research Institute of Uranium Geology with the Chinese National Standard EJ/T 1105–1999. Measurement of the homogenization temperature and salinity of FIs was carried out by a LINKAM THMS600 at a 26 °C temperature and 40% relative humidity. The micro-Raman spectroscopy of FIs was conducted using a LABHR–VIS LabRAM HR800 with frequency doubling solid-state laser of YAG crystal at a 25 °C temperature and 50% relative humidity. The existing states of FIs, including color, shape, size, and host minerals, were observed by the transmitted light and fluorescence microscopy under fluorescence and plane-polarized light, which can ascertain the phase states and distribution features of FIs.
AFT experiments
The two selected sandstone samples for AFT experiments were crushed to screen apatite out, and every single apatite was polished into a thin section. Then, the apatite was etched in nitric acid solution at a 25 °C temperature to reveal natural fission tracks (Yuan et al., 2003, 2006). In addition, the apatite was induced to generate fission tracks under a neutron irradiation using fission track glass standard, with a conjoined low uranium muscovite as the external detector. Therefore, the induced fission tracks can be obtained from muscovite after the etching of HF solution at a 25 °C temperature. All the fission tracks were measured using an optical microscope, including the length and density of induced and natural fission tracks, and then the fission track age can be calculated.
Results
FI experiments
FIs are generally trapped and preserved in crystal lattice defect and healed cracks of minerals (O’Hara and Becker, 2004; Pan et al., 2006). The generation relationship of FIs can be determined by FI position and morphology observed by an optical microscope, and the gas migration periods and paleo-temperature history can be derived from the homogenization temperature and micro-Raman spectroscopy of FIs (Tilley et al., 1989; Xu et al., 2016).
Petrography, types, and distribution of FIs
Petrography
The petrography analysis is important for the determination of the paragenesis of FIs (Klein and Fuzikawa, 2010; Pal and Mishra, 2002; Sahoo et al., 2015, 2018; Wang et al., 2015). All samples contain FIs except Sample I-5, and host minerals of FIs mainly are quartz grains (Figure 2). Only in Sample I-7, there can be found a calcite vein being the other FIs – hosted mineral (Figure 2(d-1)). The quartz grains are fine-grained crystals with rough margins, and lots of quart grains show poor psephicity and serrated contacts with each other (Figures 2(b-1) and (c-1)). In addition, in most quartz grains, there are large amount of N, NE, and WE healed-orientated microfractures, where FIs mainly preserved (Fig. 2). The calcite is always characterized by rough surface (Figure 2(d-1)), and there also can be found NE-orientated microfractures in calcite. These phenomena suggest that the strata have experienced intense tectonically destructions.
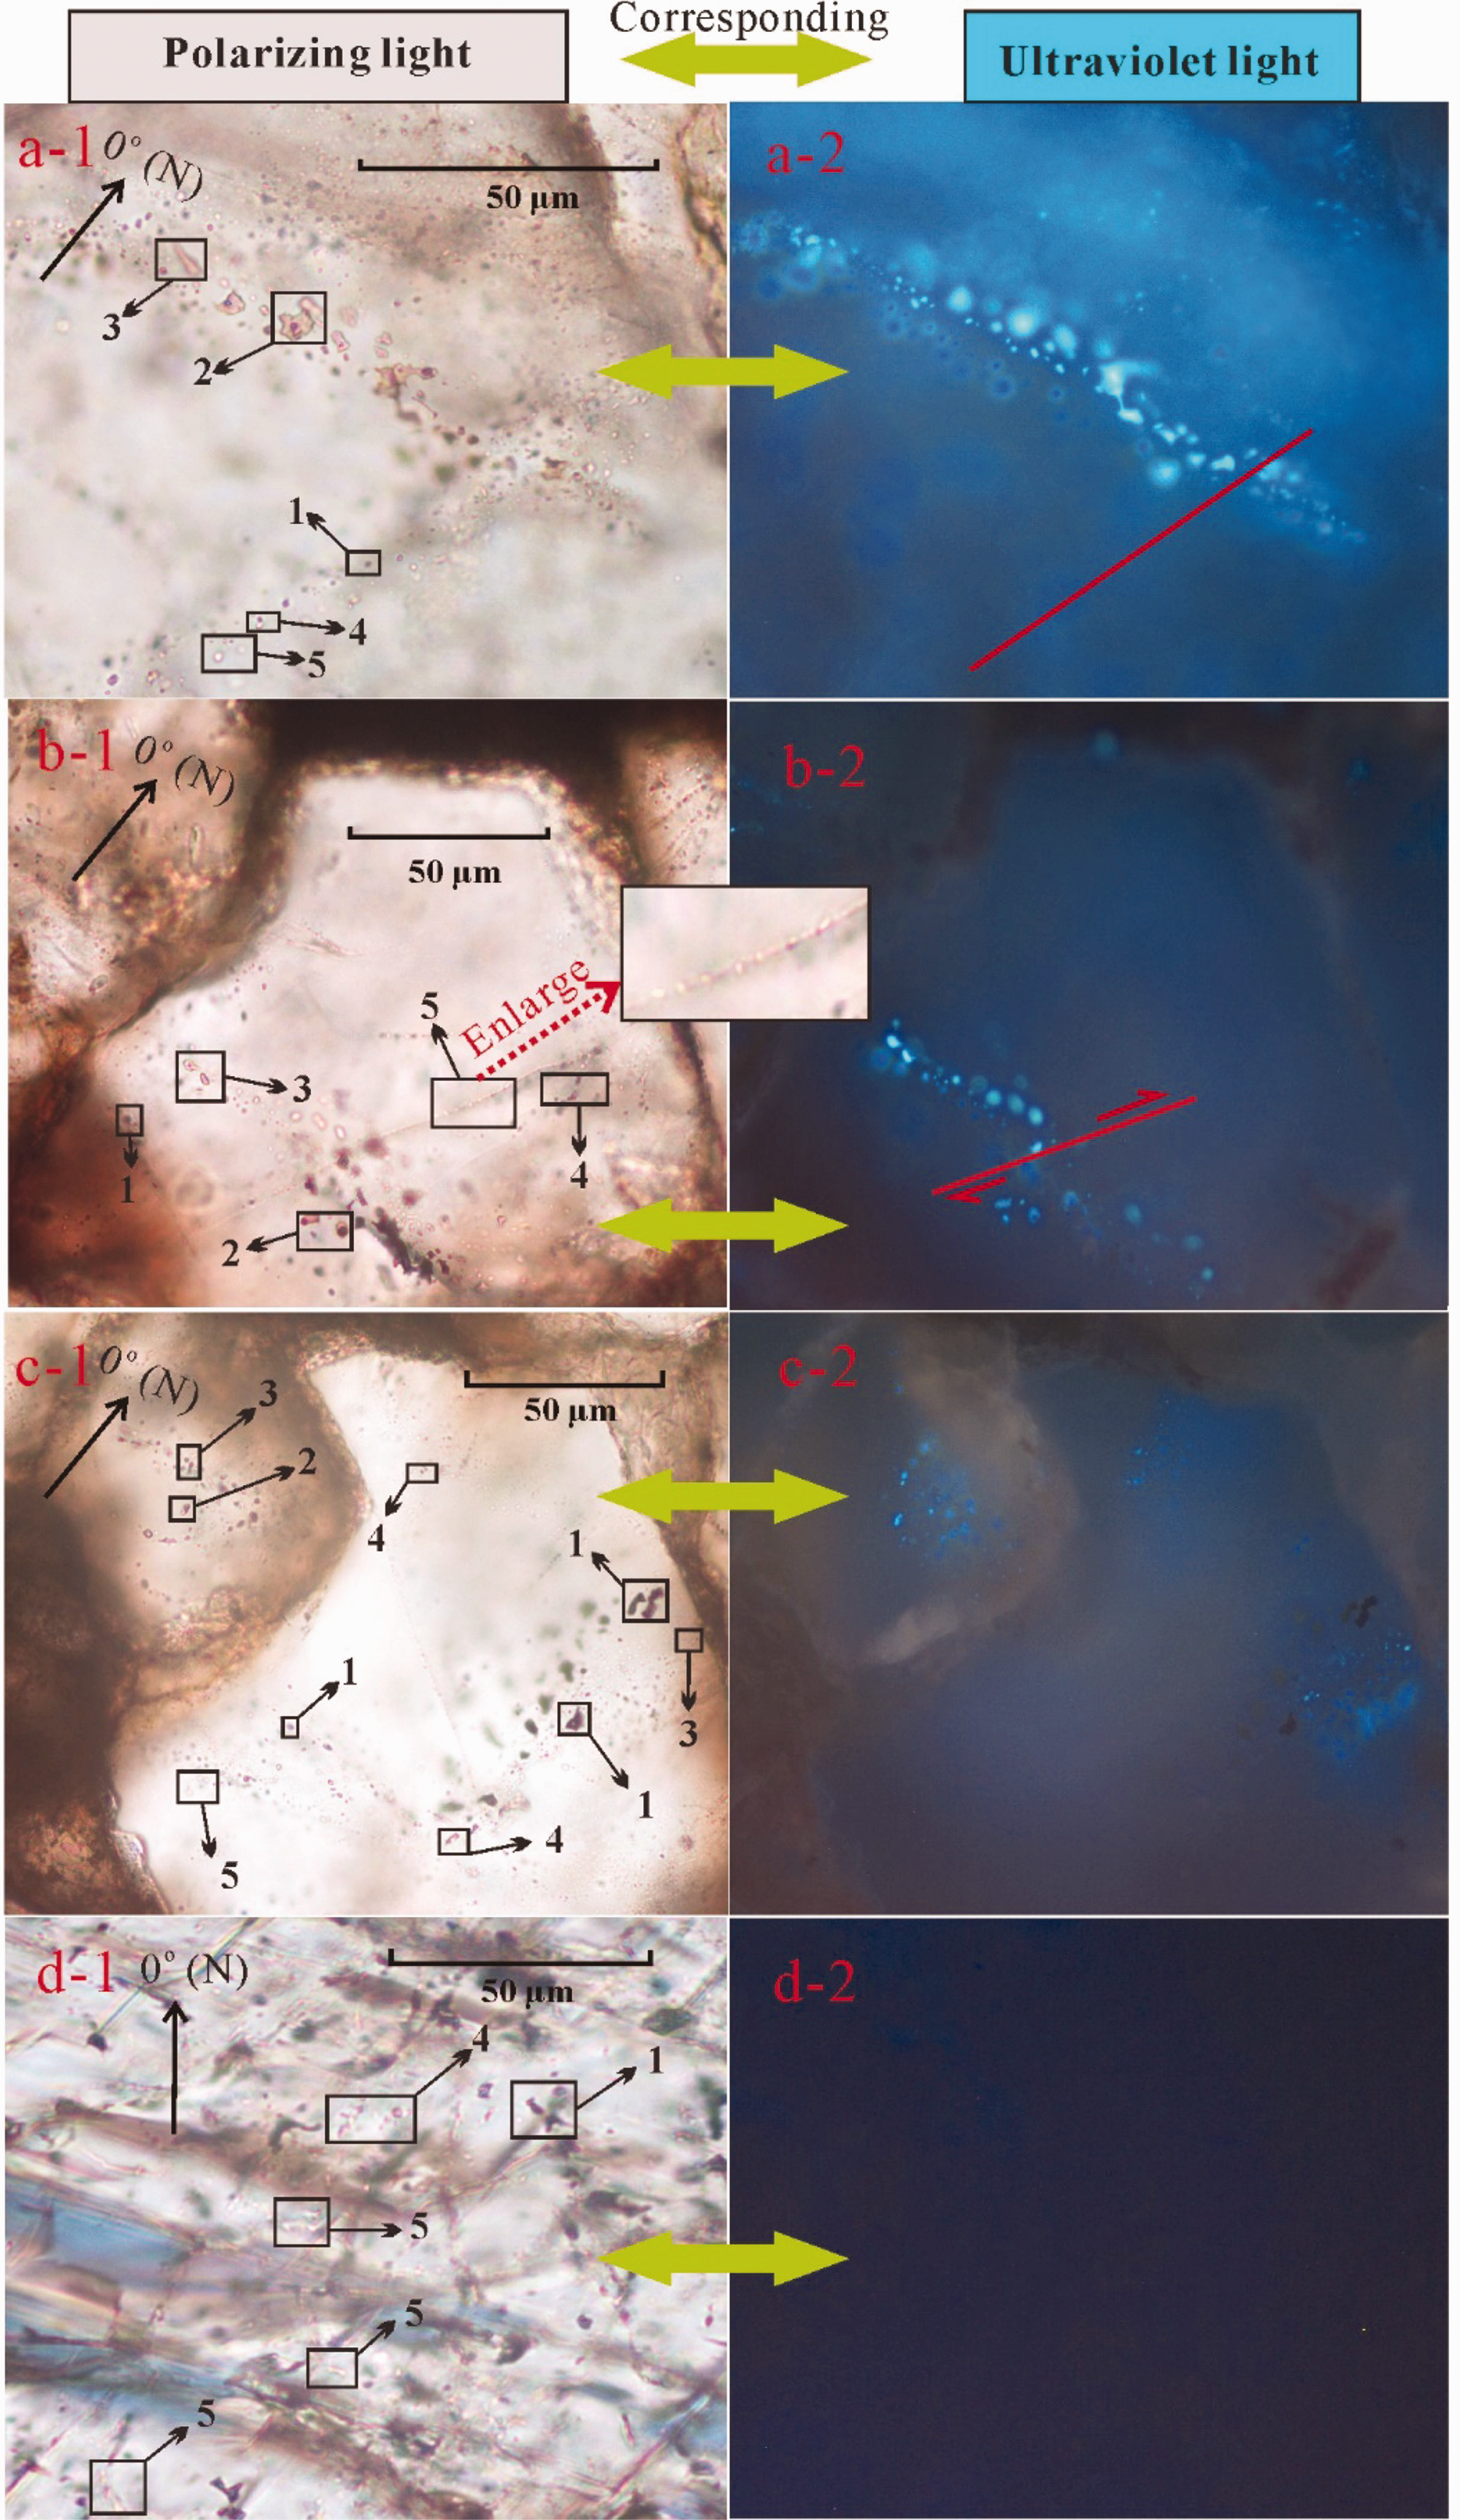
Occurrence characteristics of FIs under polarizing and ultraviolet light.
Types
The types of FIs can be divided into two categories: organic inclusions and concomitant saline water inclusions, where organic inclusions contain both gaseous and liquid hydrocarbons. The results of FI experiments show that the FI types in the study area consist of gas hydrocarbon, gas–liquid hydrocarbon, liquid hydrocarbon, gas hydrocarbon–saline water, and saline water (Table 2), which were identified by an optical microscope with polarizing and ultraviolet light (Figure 2): (1) liquid hydrocarbon emits fluorescence under ultraviolet light, while gas hydrocarbon and saline water do not; 2) when using polarizing light, gas hydrocarbon inclusions are black, and liquid hydrocarbons are yellow or yellowish-brown (different colors reflect different thermal evolution levels (Pan et al., 2006); liquid hydrocarbon in this experiment only emits yellow or yellowish-brown light), and saline water inclusions are colorless (transparent) with borders.
Proportion of each FI type.
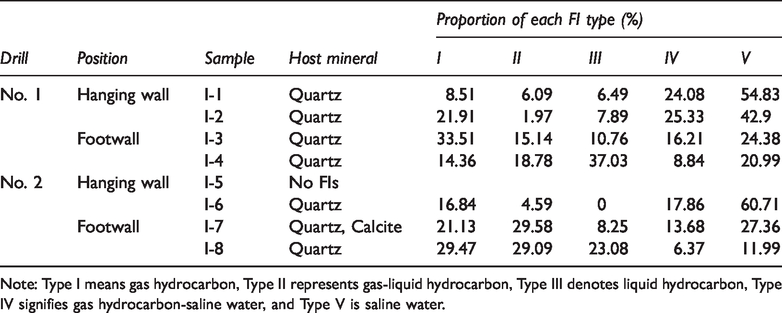
Note: Type I means gas hydrocarbon, Type II represents gas-liquid hydrocarbon, Type III denotes liquid hydrocarbon, Type IV signifies gas hydrocarbon-saline water, and Type V is saline water.
According to the observation results, all five kinds of FIs can be found in quartz in each sample, but only gas hydrocarbon–saline water and saline water inclusions are preserved in a calcite vein of Sample I-7 (Figure 2(d-1)), suggesting a secondary generation of FIs in the calcite because the calcite vein is not the diagenetic mineral of the sandstone but a vein formed at postdiagenetic ages. Therefore, it suggests that the first generation of FIs includes gas hydrocarbon, gas–liquid hydrocarbon, liquid hydrocarbon, gas hydrocarbon–saline water, and saline water, but the second generation of FIs only includes gas hydrocarbon, gas hydrocarbon–saline water, and saline water inclusions.
Distributions
FIs in each sample are linearly preserved in N, NE, and WE healed-orientated microfractures (Figure 2), and no FIs exist in the process of mineral formation (e.g., in quartz secondary outgrowth rims). The existing state of FIs that largely appears as linear distribution features indicates that stress damage had created orientated microfractures on the minerals so that the orientated FIs can be formed in these fractures.
It is worth noting that there exists a string of hydrocarbon inclusions being cut and staggered by a NE-orientated microfracture where gas hydrocarbon–saline water and saline water inclusions preserved, which is shown in Figure 2(a-1) and (b-1) (Figure 2(a-2) and (b-2) and Figure 2(a-1) and (b-1) are the same pictures, respectively, but obtained under ultraviolet light, just demonstrating that the string of inclusions are hydrocarbon inclusions). This is a clear evidence that there are two generations of FIs.
Based on statistics of each FI type (Table 2), hydrocarbon-bearing inclusions in No. 1 Drill account for between 45.17% and 79.01%, while those in No. 2 Drill range from 39.29% to 88.01%. The proportion of concomitant saline water inclusions increases as the depth decreases, while that of hydrocarbon-bearing inclusions decreases as the depth decreases, even Sample I-5, collected from the top of No. 2 Drill, was not detected with FIs, indicating that the generated hydrocarbon migrated from the bottom to the top of the strata with the power of migration being gradually decreasing. In addition, fine grained detrital rock (shales, mudstone, siltstone, fine sandstone) has good sealing ability to prevent hydrocarbon from escaping, and hydrocarbon did not have enough power to migrate through hundreds of fine grained detrital rock (Jurassic and Triassic strata) into shallow strata. Even the inclusion abundance (the ratio of FIs-bearing grains to all grains) of Sample I-1 (103 m in depth), nearly the same depth with Sample I-5 (106 m in depth), is at about 1%. So, the absence of FI in Sample I-5 just proved the good sealing ability of fine grained detrital rock and the hydrocarbon did not have enough power to migrate into relative shallow strata.
Microthermometry results
Microthermometric measurement was designed to obtain the homogenization temperature of saline water inclusions, because the homogenization temperature of saline water inclusions was considered more reliable to represent the trapping temperature than that of the hydrocarbon or gas inclusions (Hanor, 1980; Pan et al., 2006; Roedder, 1984), so that the generations of inclusions can be divided and the matching relation of each generation of homogenization temperature and real geo-temperature can be achieved, and paragenesis of the FIs often determined by contrasting homogenization temperature values of saline water inclusions (Bakker, 2004; Burke, 2001; Tao et al., 2010).
The homogenization temperature distributions of saline water inclusions in all samples are shown in Figure 3. Each red or black lump in Figure 3 represents a saline water inclusion’s homogenization temperature. Apparently, two temperature ranges should be divided by a line that can satisfy the distribution characteristics of lumps in all samples, especially in Samples I-1, I-2, I-3, and I-7 because there are obvious different ranges of lumps in these four samples. Therefore, from a holistic perspective, temperature of 115 °C was chosen as the line to divide the temperature ranges. So, all the homogenization temperature data can be divided into two categories: low- and high-temperature parts, the homogenization temperature of which is in the range of 83–115 °C and 115–149 °C, respectively. Therefore, it can be inferred that the gas migrated two times. FIs in the hanging wall and footwall are characterized by the homogenization temperature of 83–115 °C and 115–149 °C, respectively, which means the gas had migrated into the hanging wall and footwall twice.
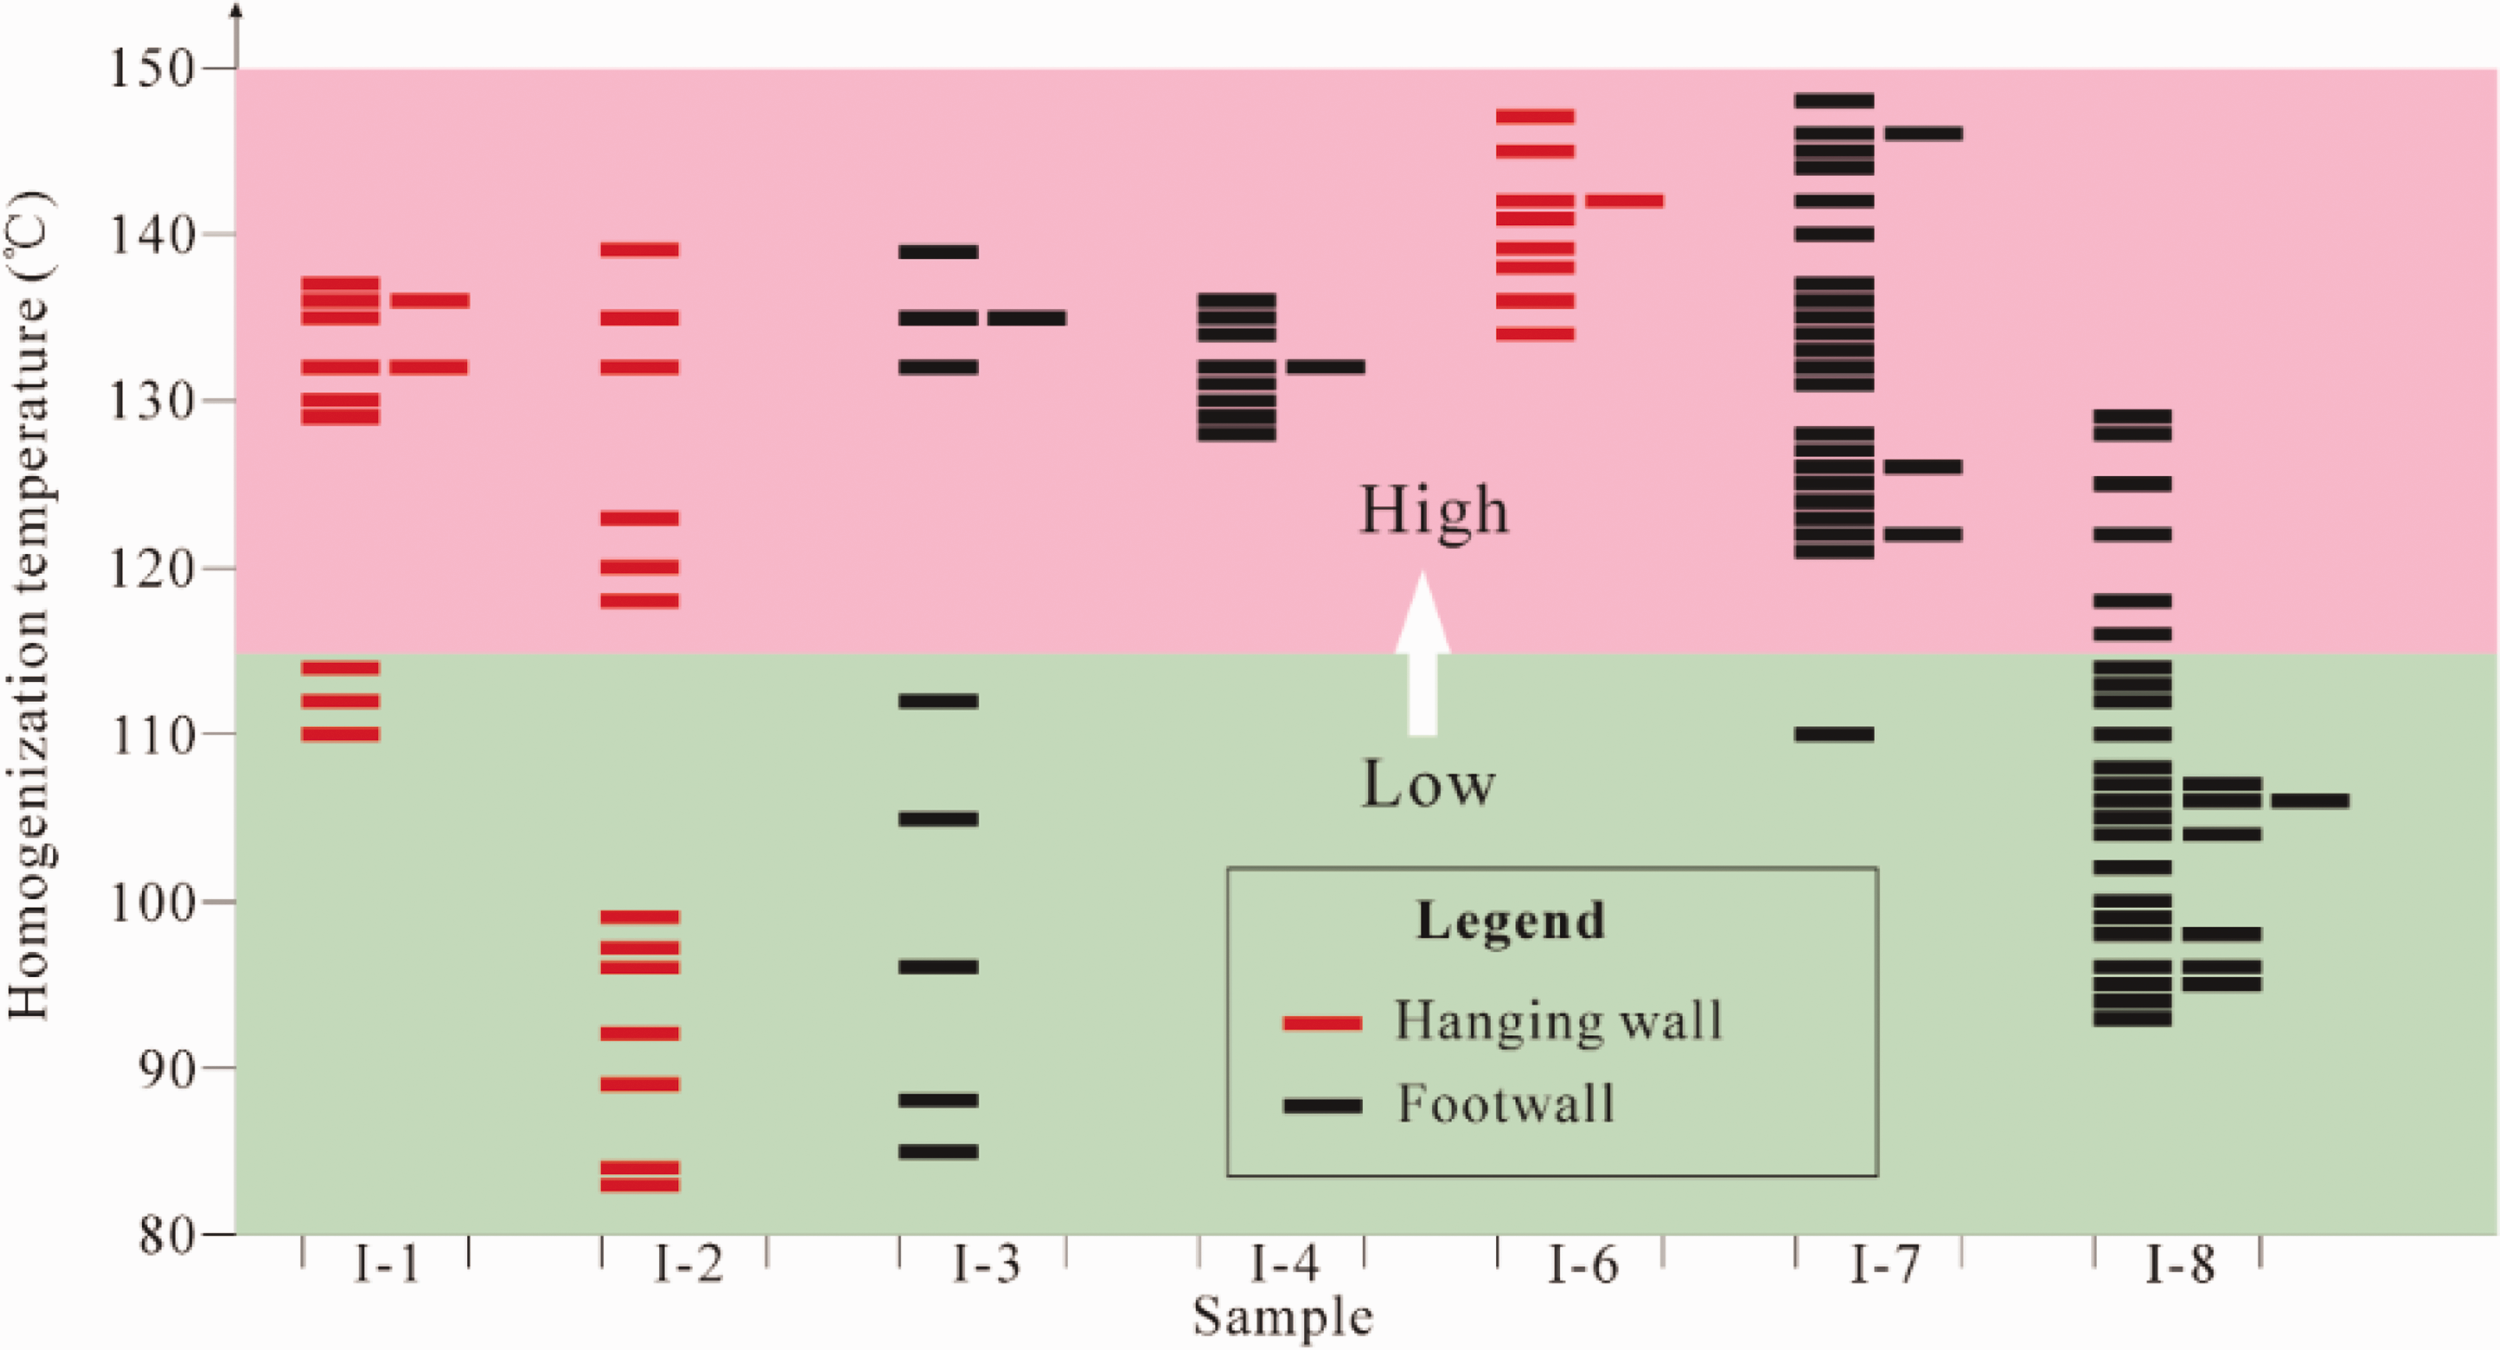
Homogenization temperature of each sample.
In addition, the salinity of saline water inclusions is also an aiding indicator to determine the generations of FIs (Xu, et al., 2016). Figure 4 shows the scatter diagram between the salinity and homogenization temperature of saline water FIs, and two styles can be divided: one is low-temperature (83–115 °C) and high-salinity (>6%) style, and the other one is high-temperature (115–149 °C) and composite-salinity style, also indicating two generations of FIs.
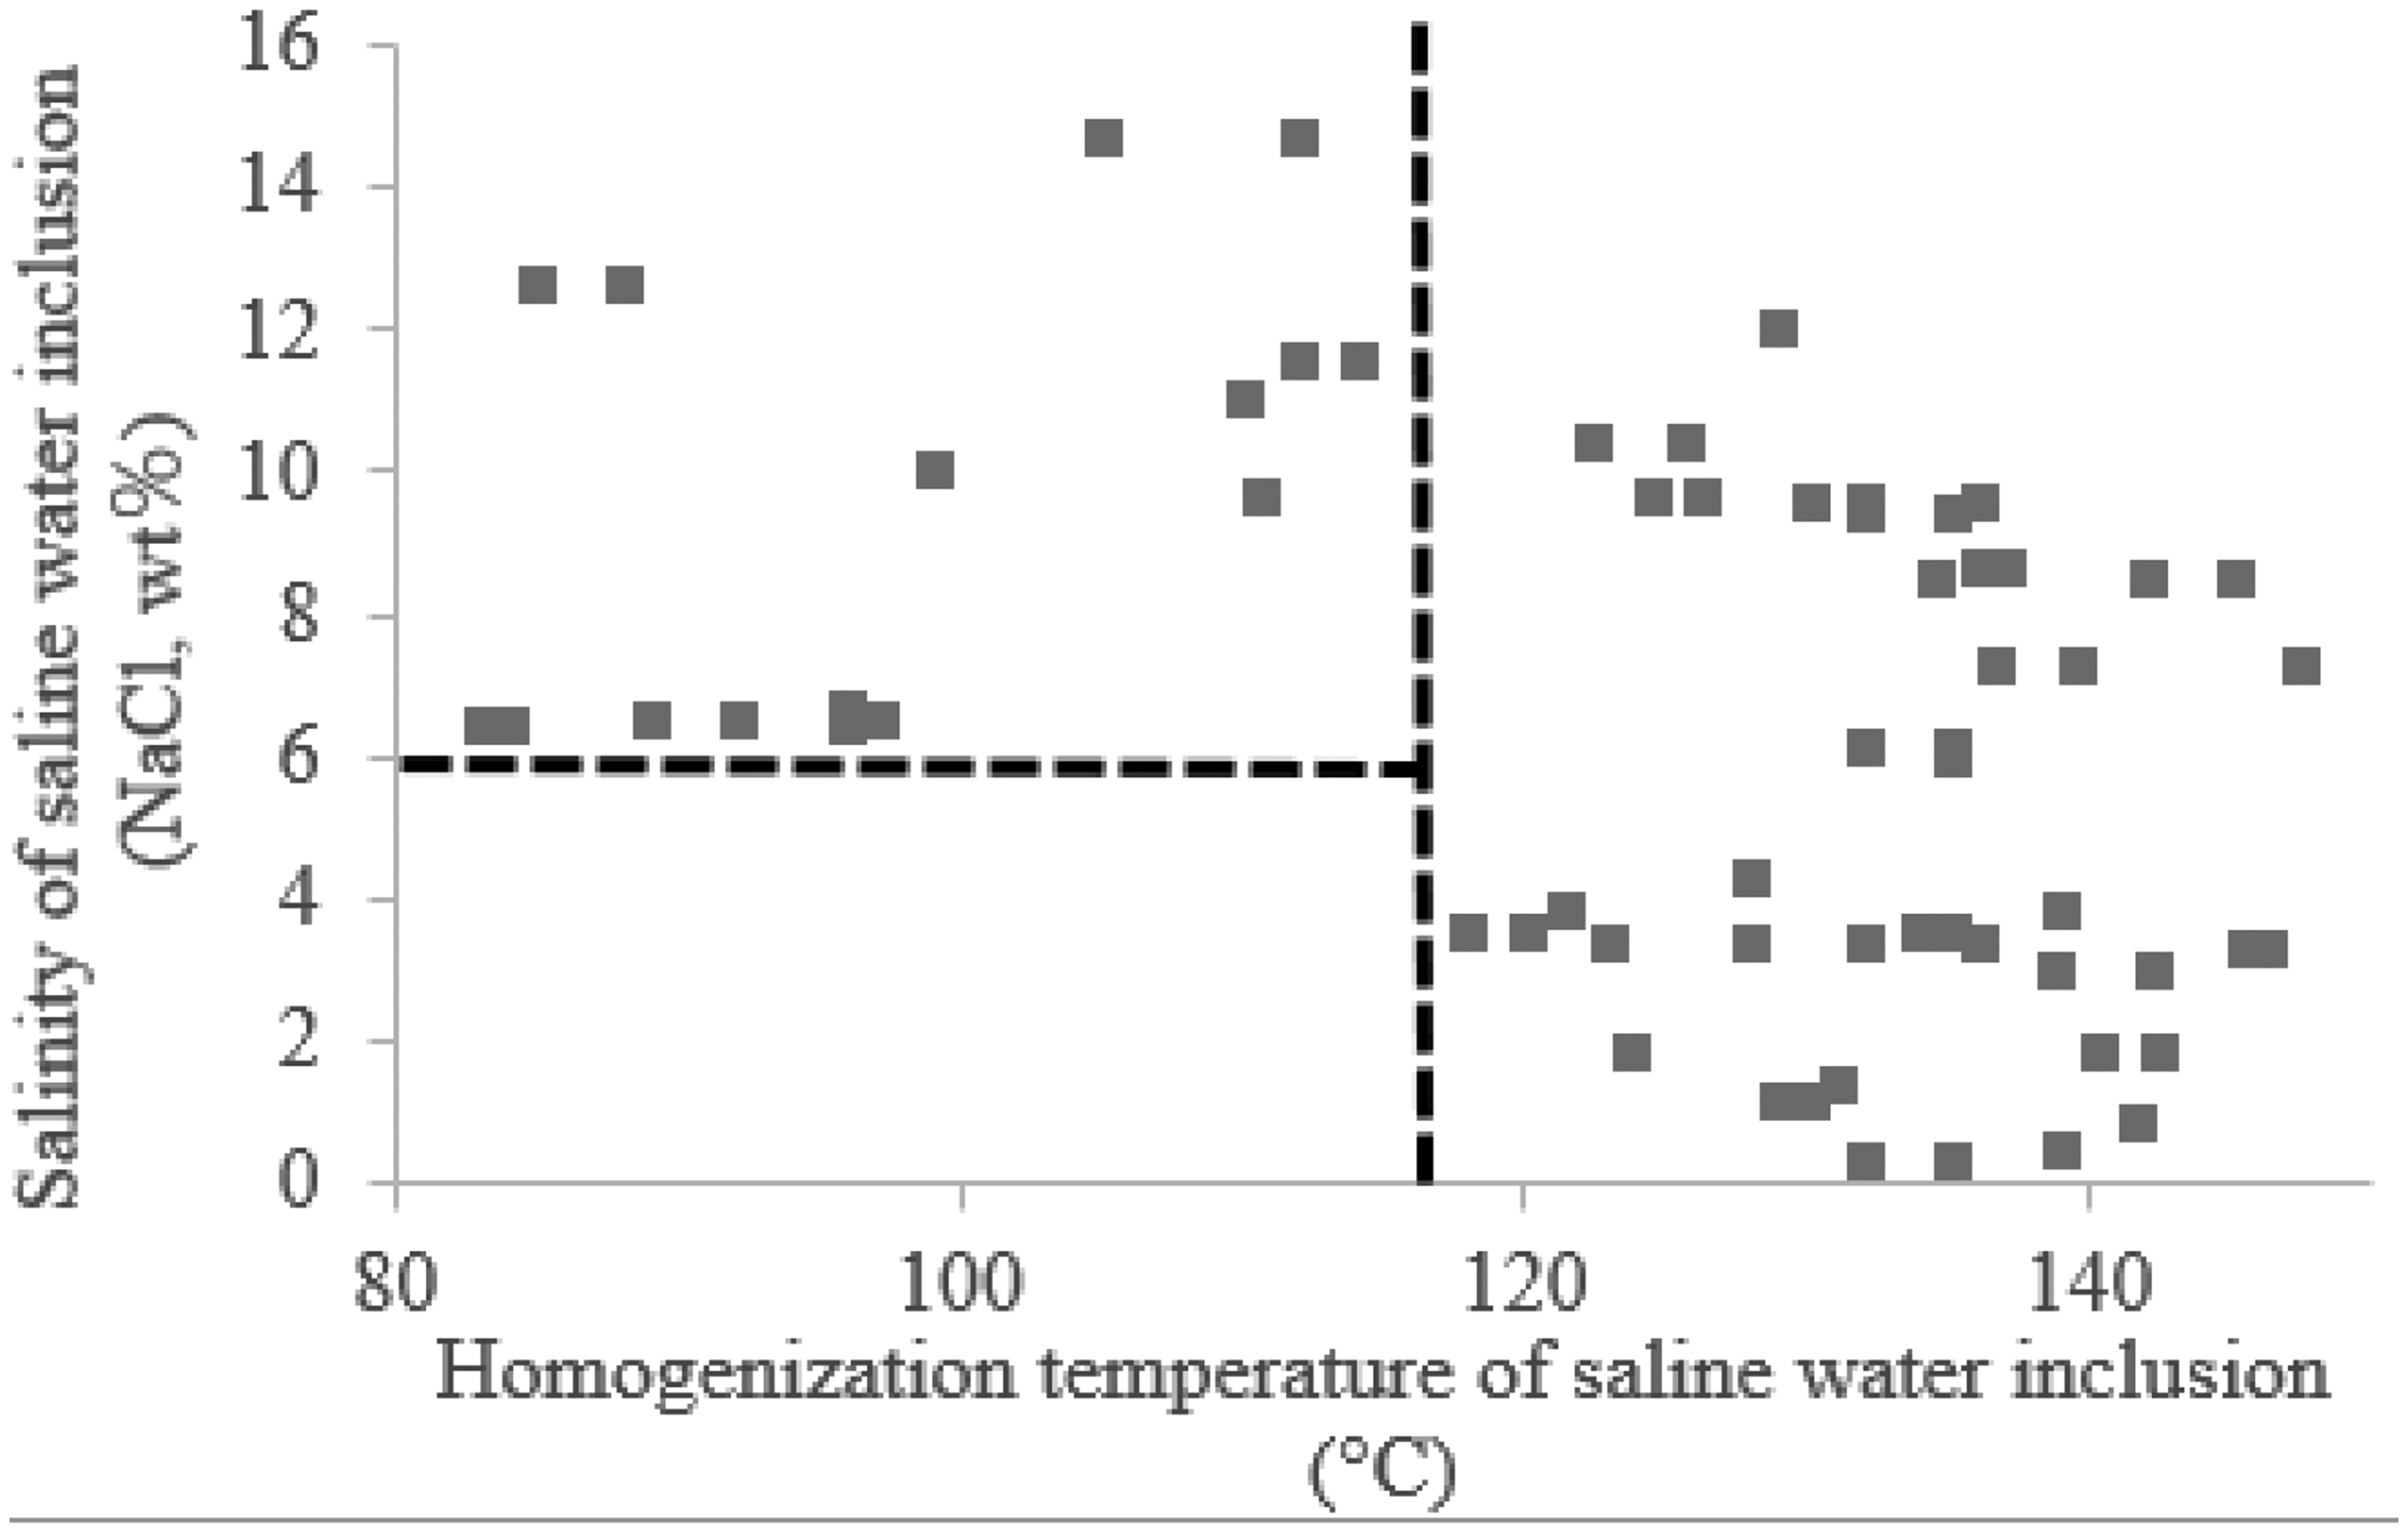
Classification of saline water FIs by homogenization temperature and salinity.
Micro-Raman spectroscopy and fluorescence microscopy results
The micro-Raman spectroscopy is performed to determine the components of gas part of the inclusions. The results show that gaseous parts of inclusions in all samples are methane (Figure 5), and literature has proved that the methane gas in this study area was thermogenic because the geochemical characteristics of methane conformed to the pyrolytic methane of the source rocks (Cao et al., 2012). Moreover, the gas-bearing inclusion occupies the largest proportion in all kinds of inclusions, and hydrocarbon source rocks in the study area are in the stage of middle-high maturity with the main vitrinite reflectances ranging from 0.95% to 1.46% (Wang, 2018), indicating that hydrocarbon source rocks mainly generate gas. Therefore, the proportions of gas-bearing inclusions coincide well with the characteristics of hydrocarbon source rocks, which also corroborate that the inclusions originated in hydrocarbon source rocks of Middle Jurassic coal measures from the other side.
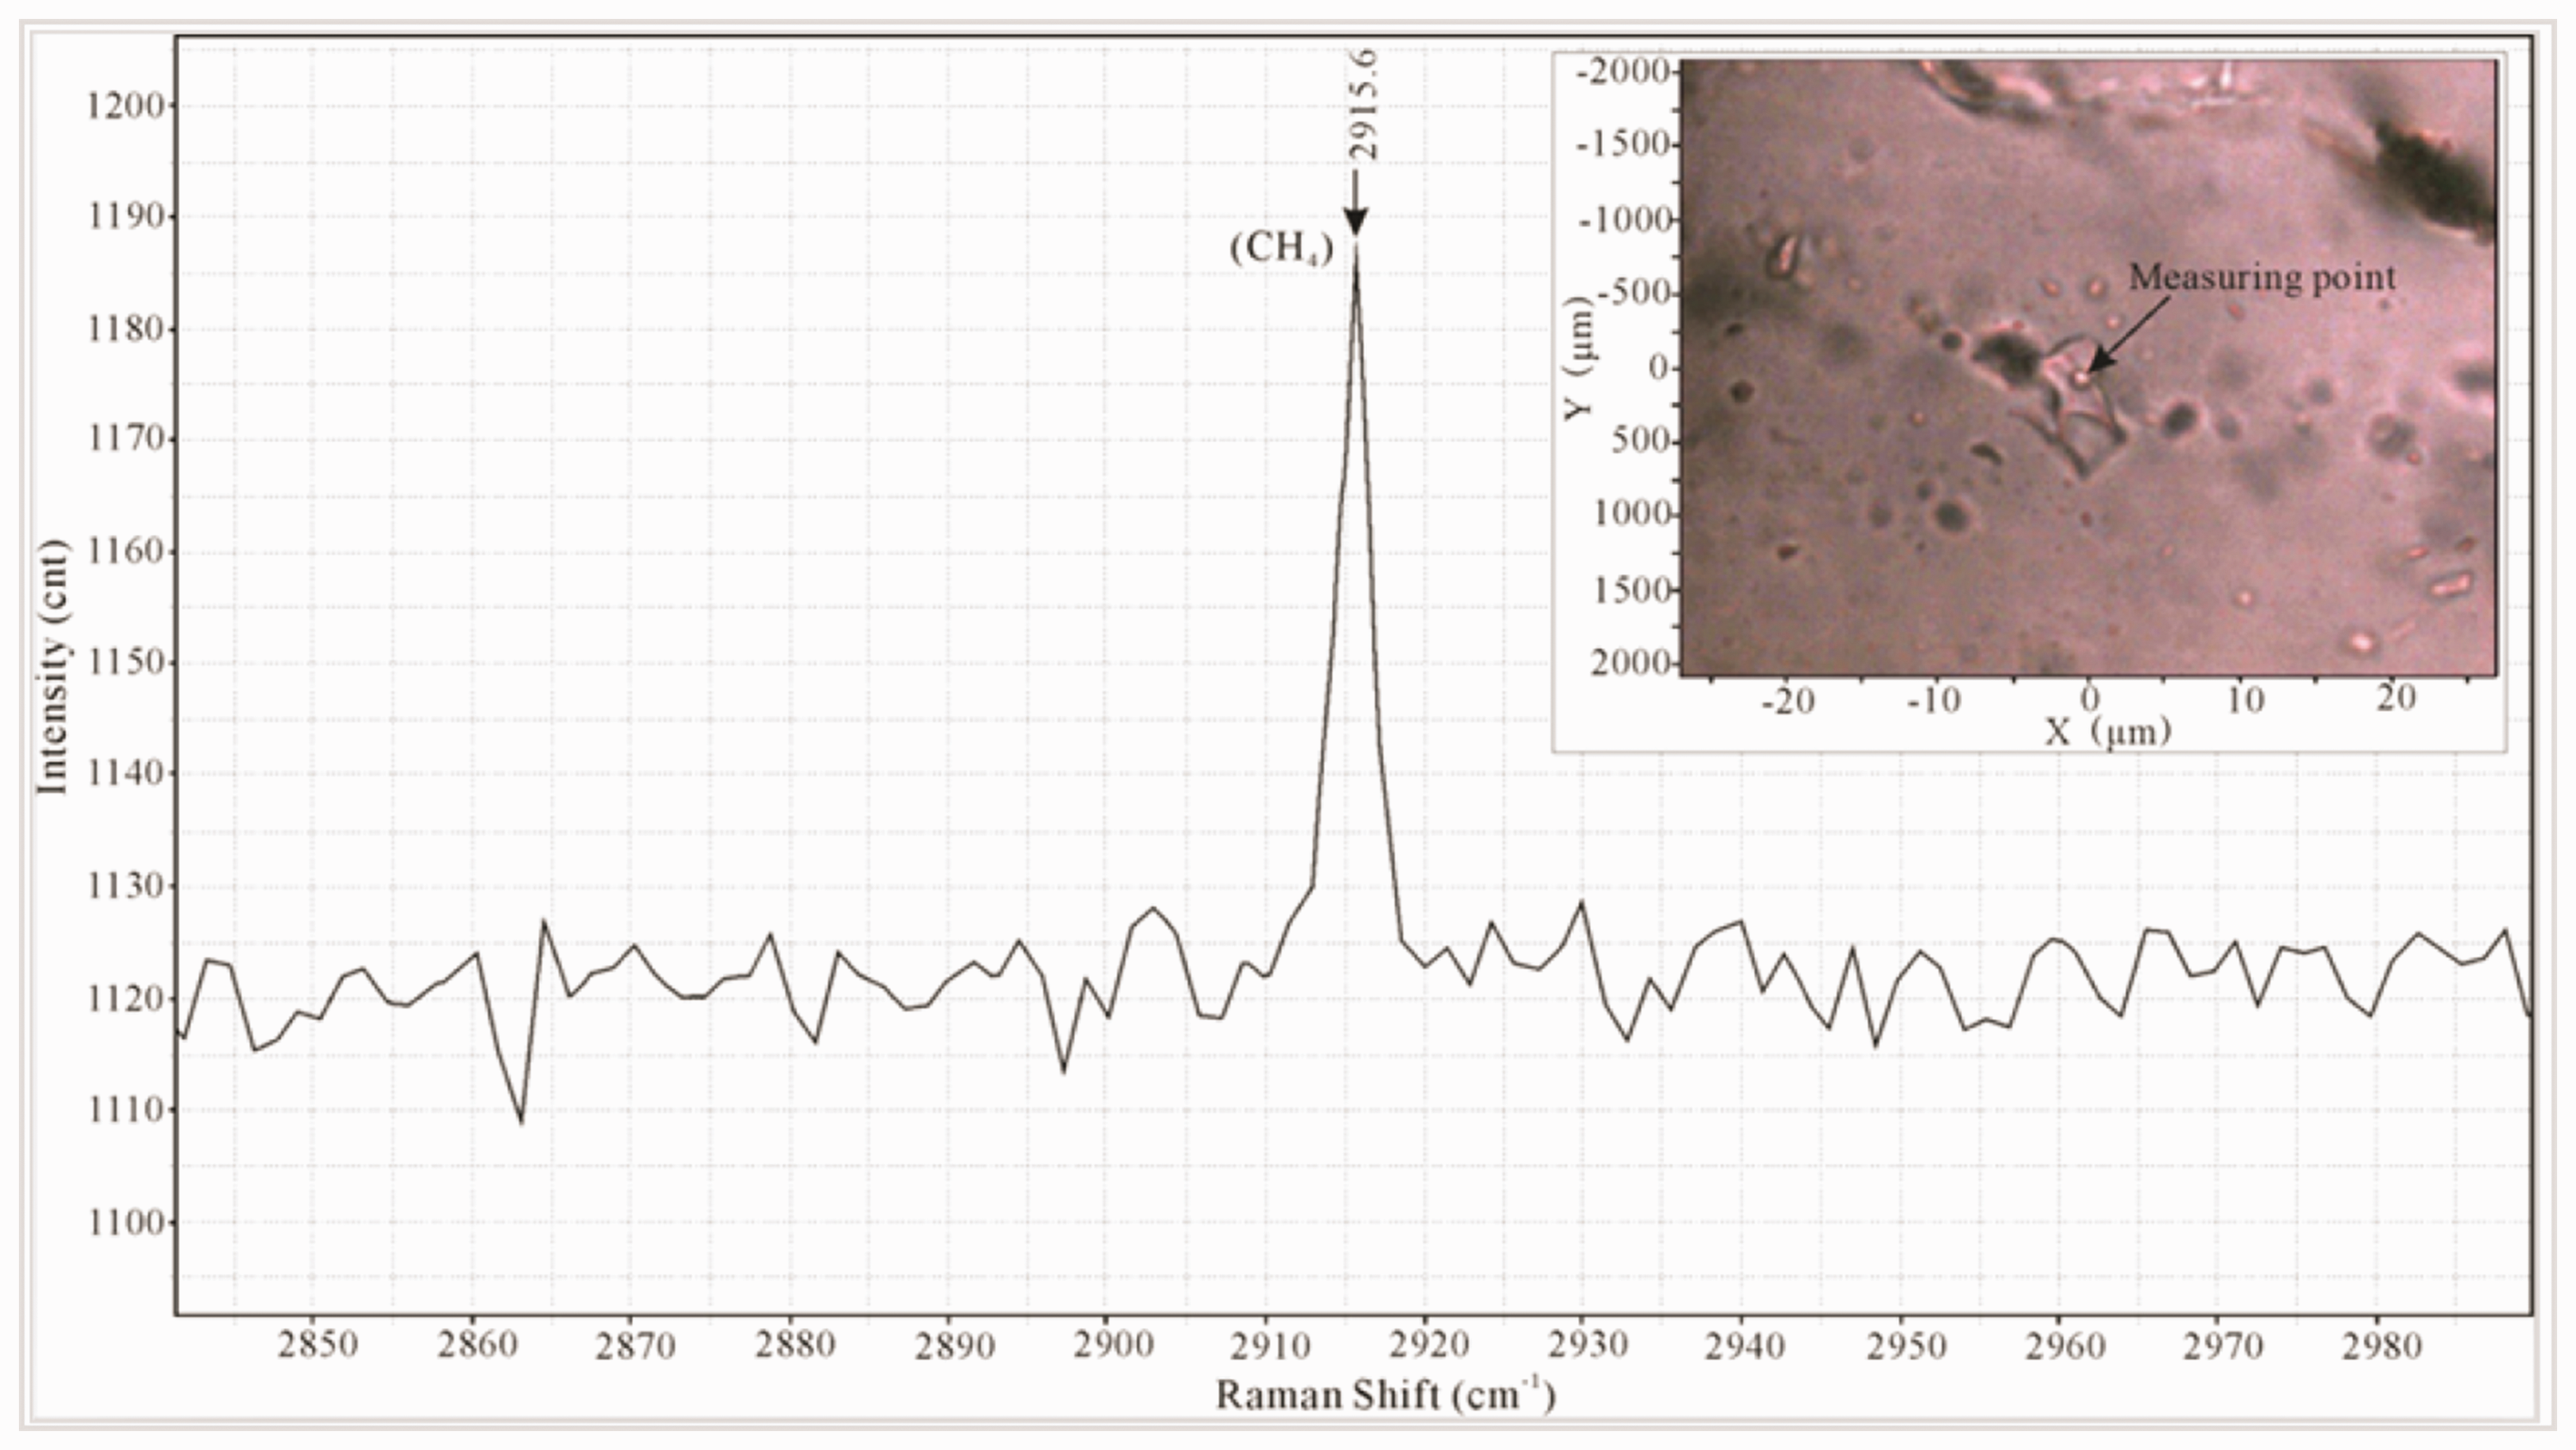
Raman spectrum of sample I-1 (taking Sample I-1 as an example).
Hydrocarbons in FIs can emit different fluorescent colors under ultraviolet radiation, which can reflect the maturity and components of the hydrocarbons and can help to determine the stages of migration (Li et al., 1998; Liu and Gu, 1997; Pan et al., 2006). The inclusion fluorescence of all samples exhibits the colors of blue green and blue (Figure 6), indicating that the maturity of FIs in the study area is very similar.
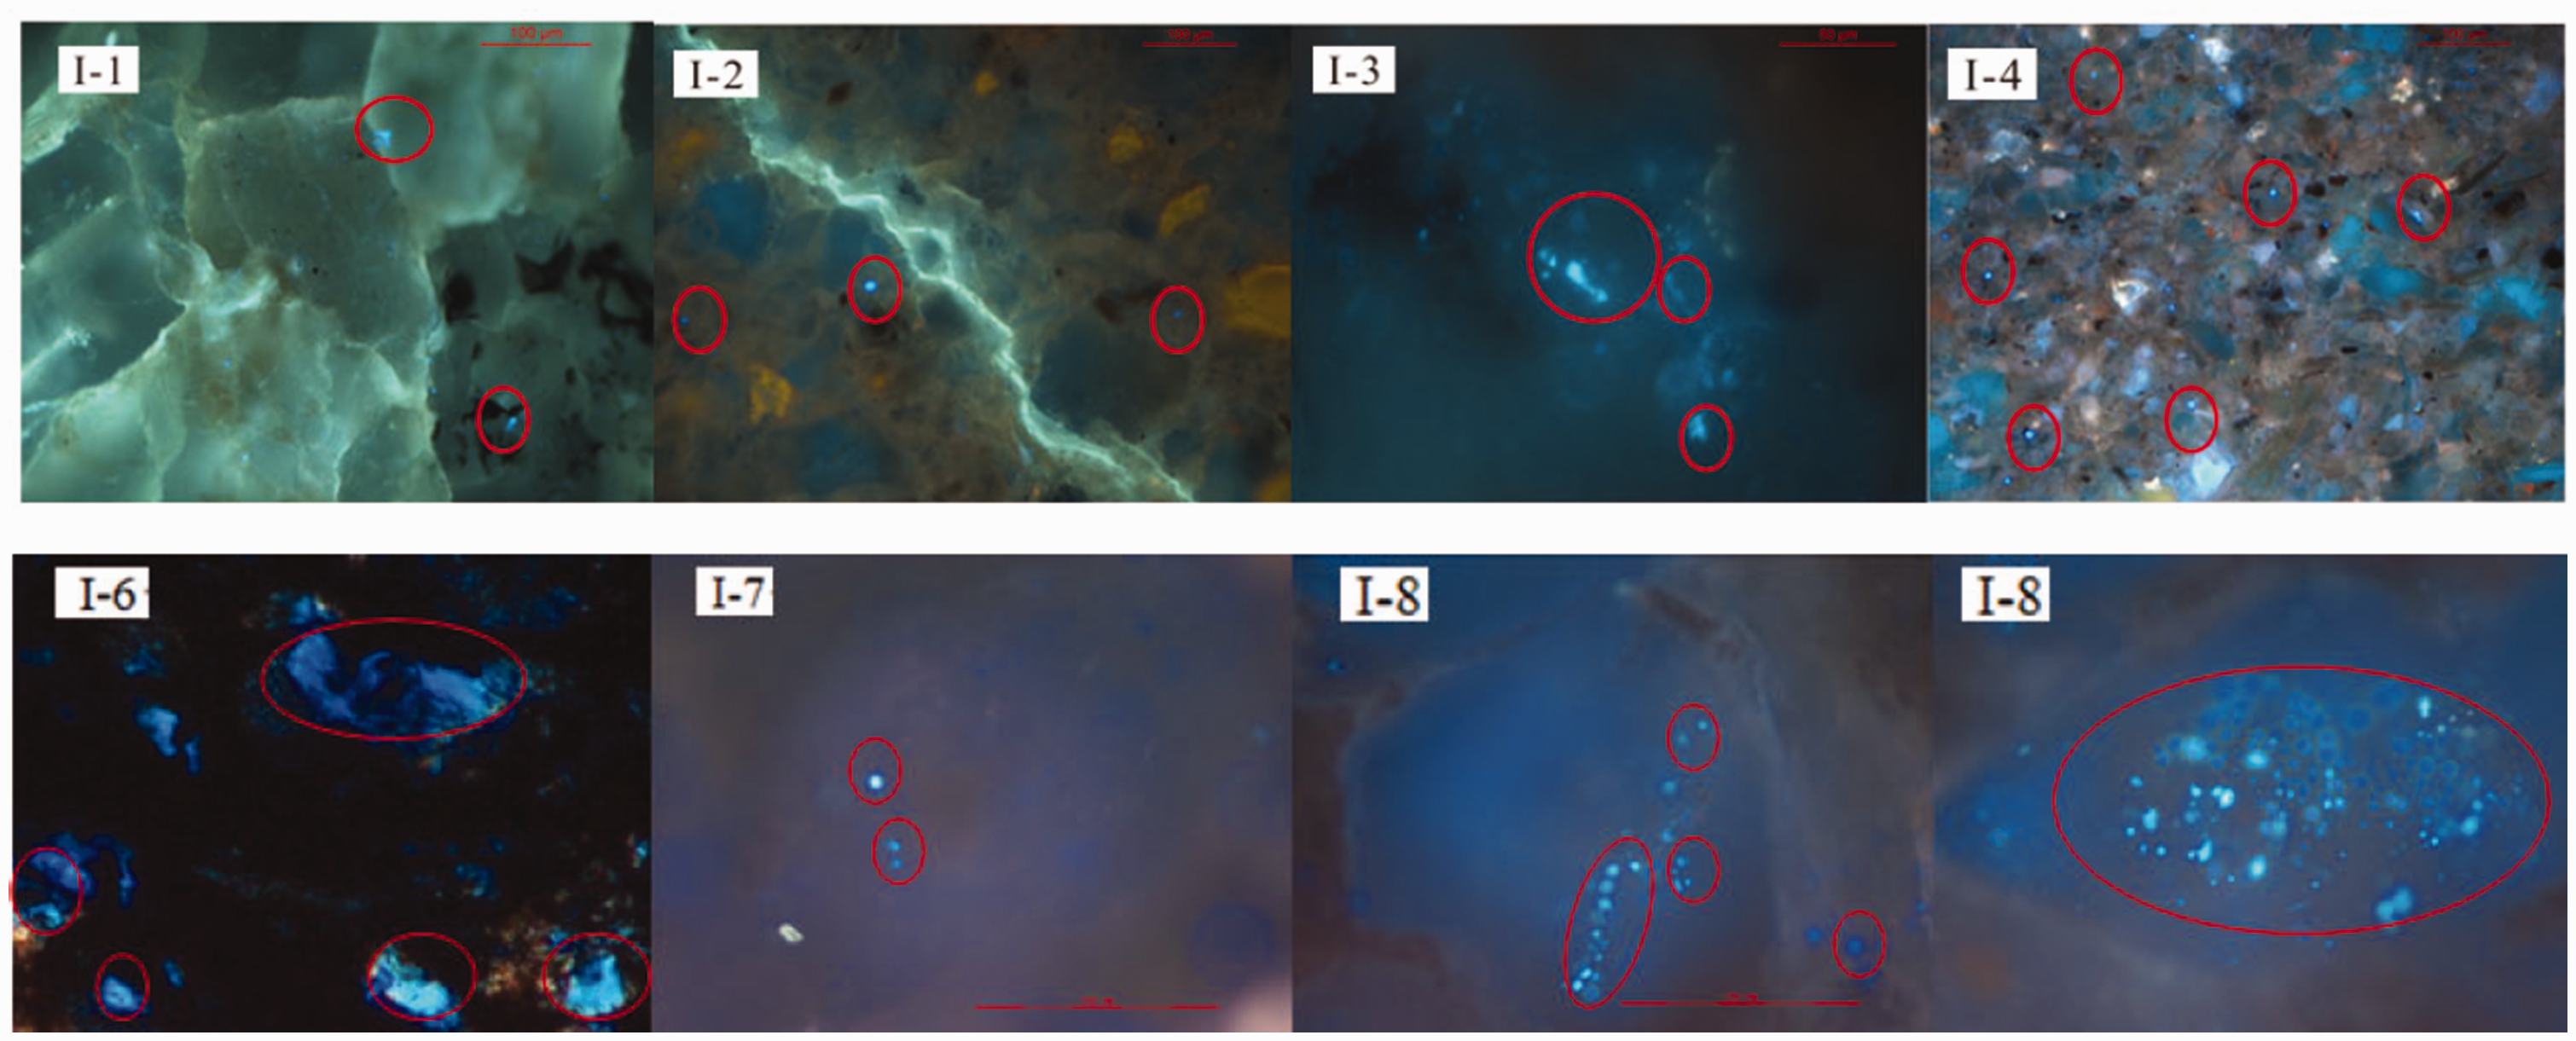
Fluorescence characteristics of Samples I-1, I-2, I-3, I-4, I-6, I-7, and I-8.
AFT results
An AFT experiment is a kind of dating technique using the amount and length of tracks in apatite crystals generated by 238U fission to calculate a rock’s age (Flcischcr et al., 1965; Green, 1985; Hurford and Green, 1983), which is usually applied to study orogenic uplift history (Song et al., 2018; Zeitler et al., 1982; Zhu et al., 2005). The fission tracks in apatite crystals were affected by temperature (Duddy et al., 1988), such that the tracks’ length would decrease if the temperature exceeds 60 °C and would vanish when the temperature surpasses 110 ± 10°C (Fitzgerald et al., 1995). As a result, the rock ages tested by AFT experiments indicate the time that the rock’s temperature decreased to 110 ± 10°C, so the calculated ages and length features were widely applied in structural evolution and cooling event studies (Hendrix et al., 1994; Jovivet et al., 2001; Sobel and Dumitru, 1997).
The AFT results are shown in Figure 7. P(χ2) is a measurement to evaluate the congruence degree between every single apatite age and all apatite ages in a sample (Galbrainth and Laslett, 1993). If P(χ2) is less than 5%, it means that the apatites’ age values are relatively scattered with each apatite having different chemical dynamic behaviors (Huan et al., 2013; Zhang and Wang, 2004), i.e., in a sample, some apatites experienced temperatures of 60 – 110 ± 10°C such that fission tracks had decreased in length, and some apatites did not experience a high temperature (above 60 °C) (Sobel et al., 2006). If P(χ2) is more than 5%, it suggests that all the apatites belong to the same age group; in other words, all apatites in one sample experienced the same chemical dynamic behaviors (Sobel et al., 2006). The age distribution histograms and frequency curves shown in Figure 6 can assist in determining the concentration degree of apatite ages. Apatite ages of Sample II-1’ concentrate mainly in the range of 2.5–10 and 15–30 Ma, with the P(χ2) value being 0%, indicating that Sample II-1 had been uplifted to a depth where the corresponding temperature decreased to 110 ±10°C at about 30 Ma and experienced temperatures of 60–110 ± 10°C since 30 Ma; it can be inferred that Triassic strata uplifted in the Late Paleogene because of the tectonic movement, since the oldest apatite gain age of Sample II-1 (hanging wall) was 30 Ma. Apatite ages of Sample II-2 ranged from 0 to 8 Ma, with the P(χ2) value being 75%, indicating that Sample II-2 had been uplifted to a depth where the corresponding temperature decreased to 110 ± 10°C at about 8 Ma and did not experience high temperatures more than 110 ± 10°C, which means Jurassic strata uplifted since 8 Ma. The ages tested correspond very well with results of Qi et al. (2014, 2016) and Li (2010), who found Qilian Mountains had experienced intensive uplift at about 25 ± 7 and 8 Ma, respectively.
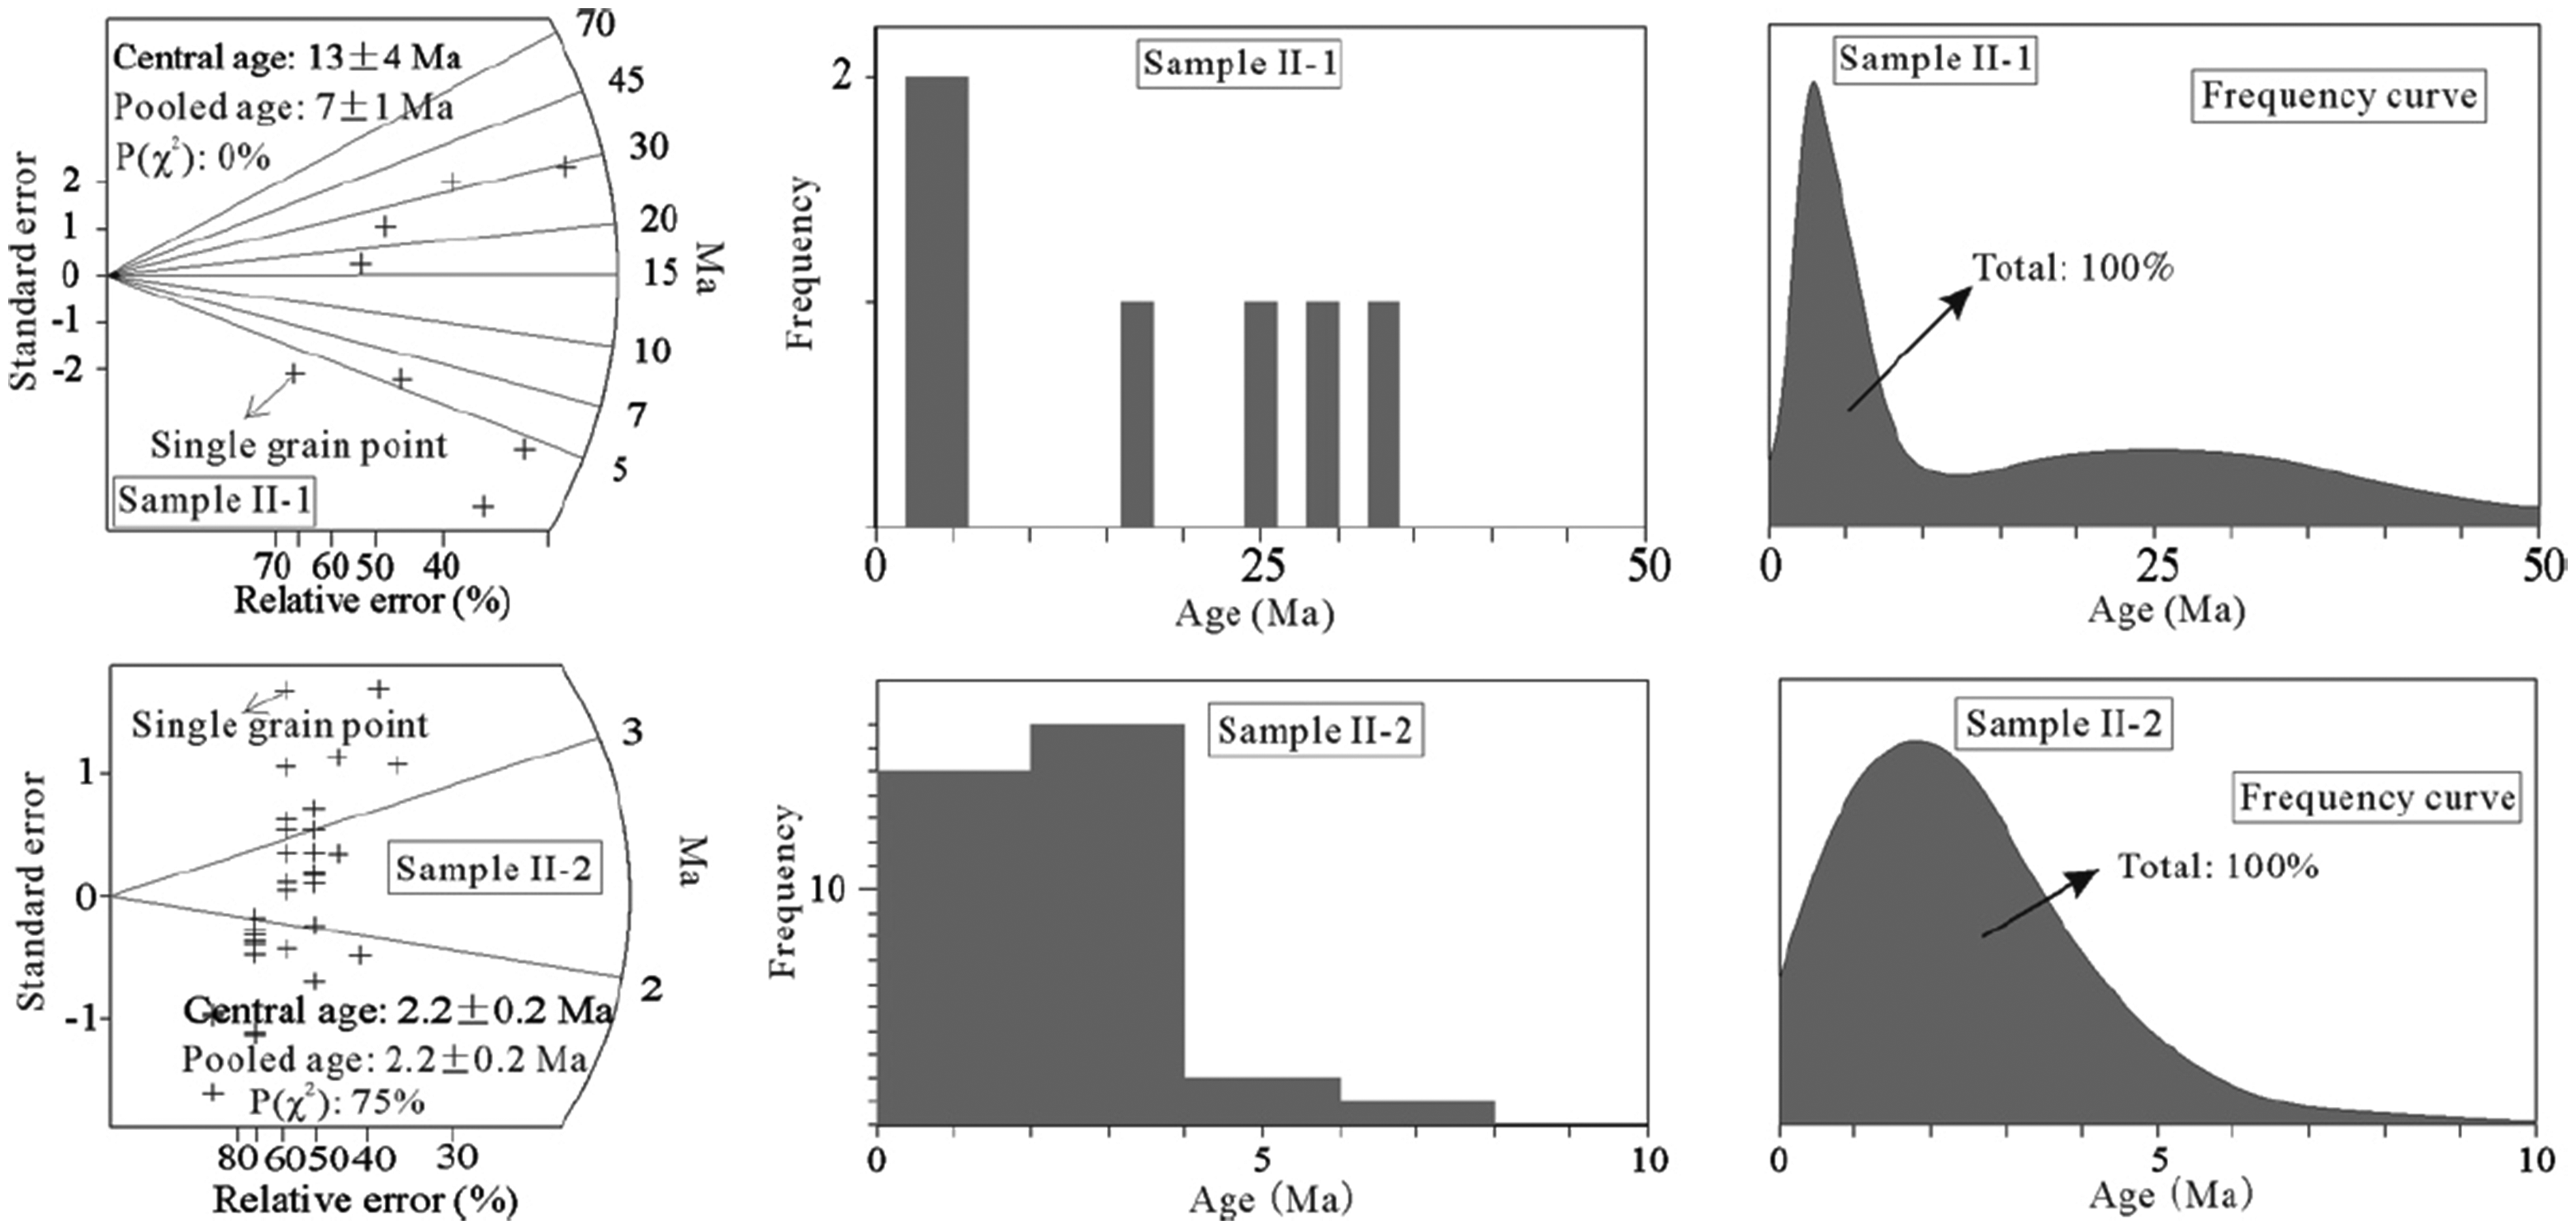
The AFT results.
Discussion
The reconstruction of burial history of coal measures in the study area
In order to study the gas migration, the burial and geo-temperature history needs to be reconstructed, so that the matching relationship between structural movements and gas migration stages derived from FIs experiments can be determined. There are many paper related to the structural evolution history of the Muli coal field and Qilian Mountains, which can aid in the reconstruction of the burial and geo-temperature history in the study area.
The “Thermodel for windows,” geological modeling software, was used to simulate the burial and geo-temperature histories with the back-stripping technique (Zhang et al., 2005). Basic geological data for the simulation were collected from the literature and our previous work (Jiang et al., 2015; Jovivet et al., 2001; Qi et al., 2016; Sun et al., 2009; Wang, 2018) (Table 3), in which, “F” represents depositional strata in existence today, “D” stands for depositional strata but that eroded in geological history, “E” means erosion, and “H” indicates depositional break. The denuded strata thickness (missing thickness) was determined by “vitrinite reflectance continuity” and “strata correlation” methods: the former method was based on the theory that the vitrinite reflectance was related to depth by the geo-temperature, and the denudation breaks the vitrinite reflectance continuity in successive strata so that the denudation thickness can be estimated automatically in this modeling software; and the latter method uses the correlation between the research area strata and the neighboring area strata to determine the missing thickness (Jiang et al., 2015; Wang et al., 2006). Moreover, the vitrinite reflectance can be used for geo-temperature history inversion with a widely used chemical kinetic model proposed by Burnham and Sweeney in this modeling software (Burnham and Sweeney, 1989). The related parameter settings are as follows: The paleo-water-depth can be negligible and was set as 0 m since the sedimentary facies were terrestrial facies; the current ground temperature and water depth were set as 0 °C and 0 m, respectively; the current geothermal gradient was set as 2.4 °C/100 m according to Jiang et al. (2015); the simulated basin width was set as 20 km according to the actual coal field data; the simulated layer thickness was set as 50 m; and the strata compaction model was set as an exponential-linear model; the Ro values used in this simulation are “0.90% in 107 m (depth), 0.99% in 217 m (depth), 1.05% in 412 m (depth), 1.11% in 620 m (depth), 1.20% in 850 m (depth), 1.37% in 1035 m (depth),” which were tested in our previous work (Wang, 2018), and the initial Ro value was set as 0.2% according to Jiang et al. (2015).
Basic geological data for the simulation.
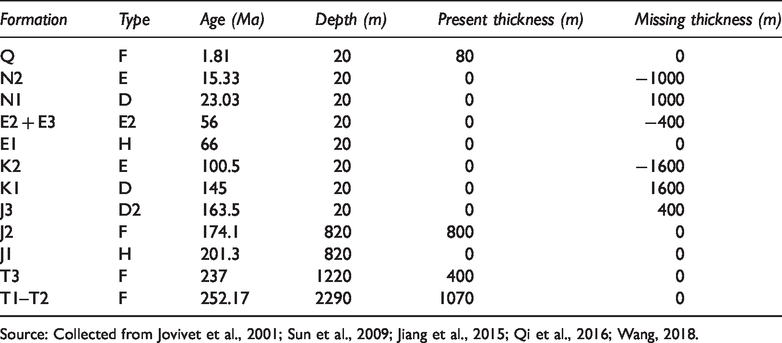
Source: Collected from Jovivet et al., 2001; Sun et al., 2009; Jiang et al., 2015; Qi et al., 2016; Wang, 2018.
The simulation results are shown in Figure 8; combined with previous research achievements, the structural evolution history is narrated as follows.
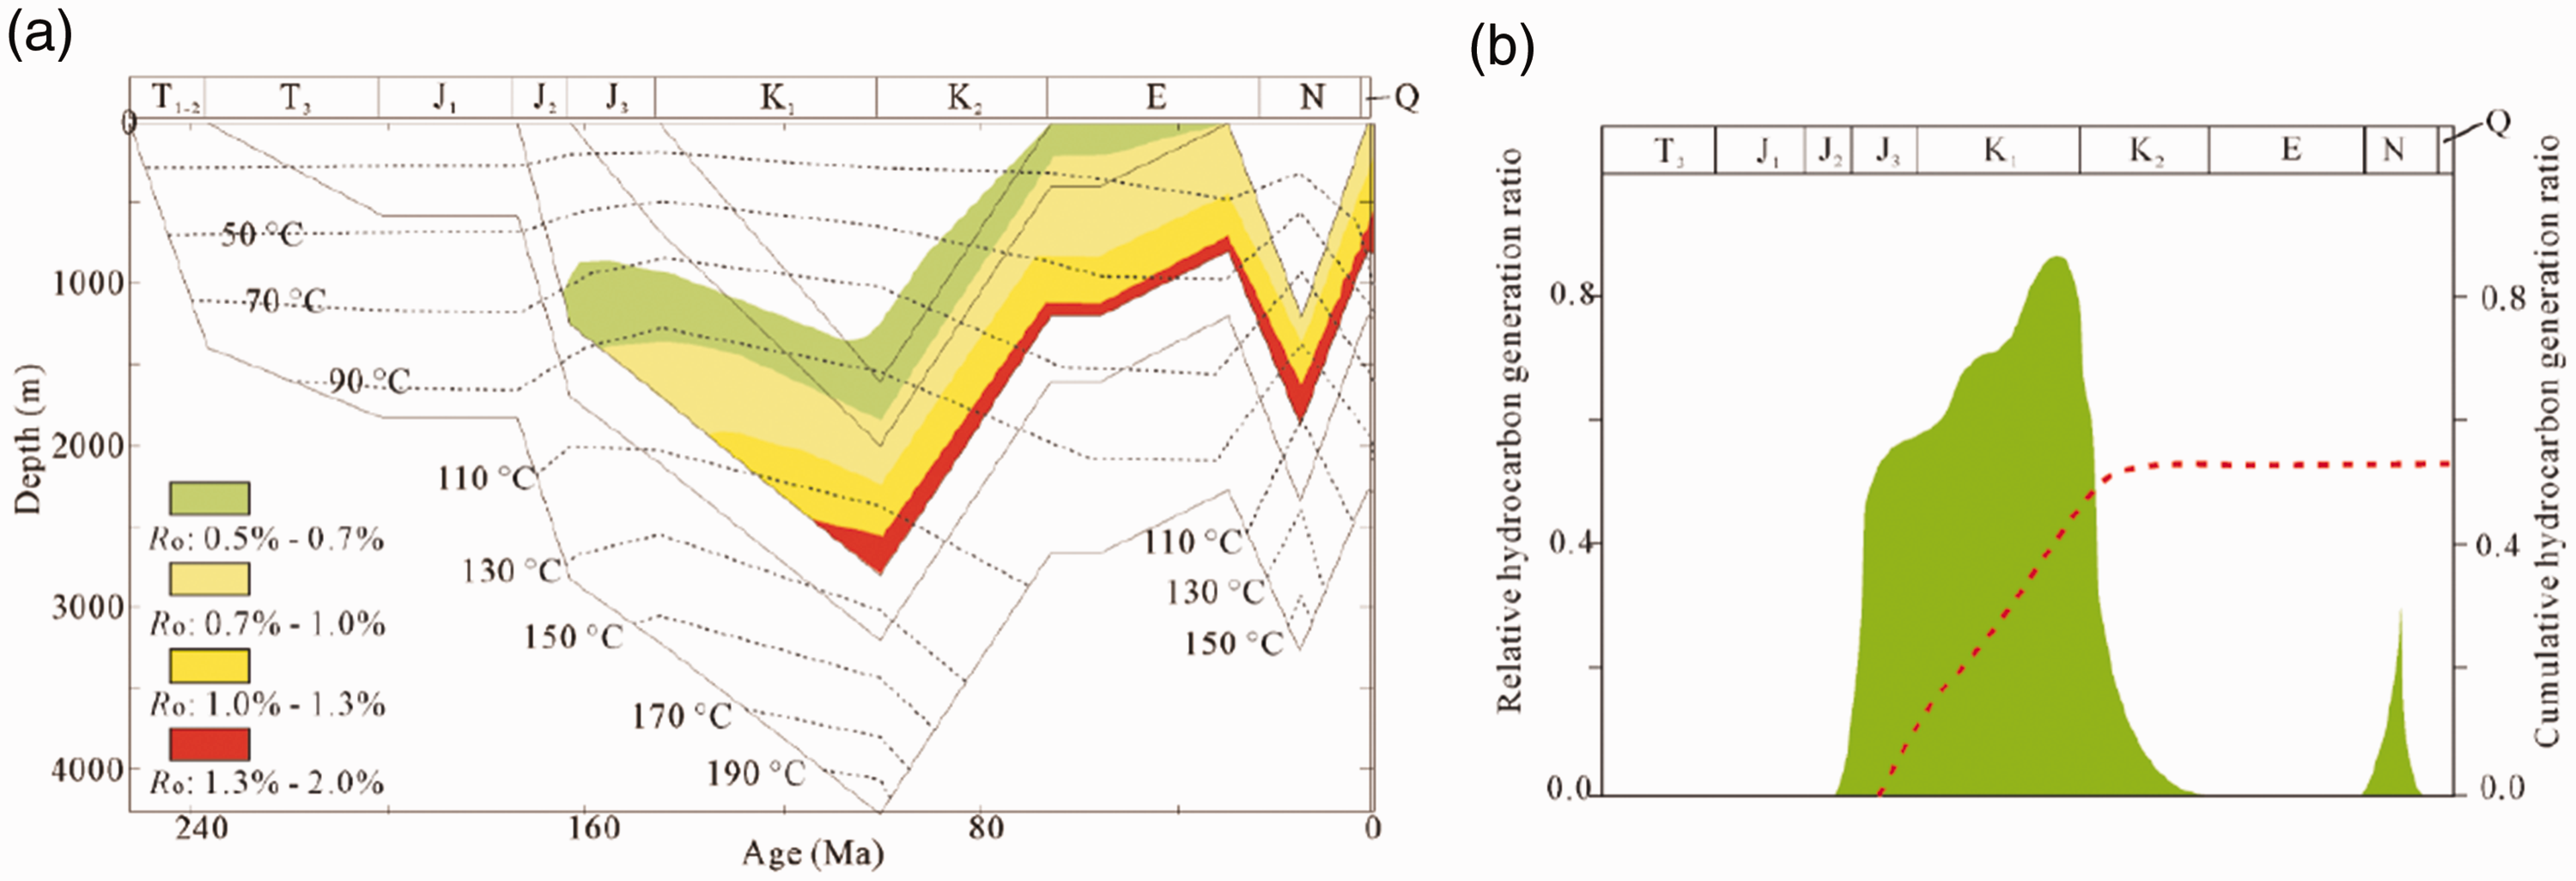
The simulation results of burial, thermal, and hydrocarbon generation histories of the Middle Jurassic.
J2–K2
The research area was a subsiding basin that continuously received sediments from the Middle Jurassic to Early Cretaceous; according to the simulation results, coal measures of Middle Jurassic subsided to a depth that exceeded 2000 m with the paleo-temperature being in the range of 100–130 °C (Figure 8(a)), resulting the first mass hydrocarbon generation (Figure 8(b)). In the Late Cretaceous, the Middle Qilian Mountains kept uplifting due to the collision between the Lhasa block and Qiangtang block (Li et al., 2015). George et al. (2001) proved the tectonic uplift of Qilian Mountains from 115 to 90 Ma B.P., and Guo et al. (2009) also revealed the cooling event of Qilian Mountains in the Late Cretaceous by AFT experiments. The study area uplifted in the Late Cretaceous due to the extrusion stress, but there was no obvious damage in coal measures of the Middle Jurassic (Chen, 2015; Qi et al., 2016; Sun et al., 2009).
2. E1–E3
The tectonic activity of Qilian Mountains was relatively weak during the Early Paleogene (Qi et al., 2016), and the Muli basin, where the Juhugeng mining area was located in the southwest, formed a series of sags for deposition because of the extrusion stress generated by the collision between the India Plate and Eurasian Plate (Qi et al., 2016; Sun et al., 2009). Eocene–Oligocene strata were deposited in these sags of the Muli basin called Huoshaogou and Baiyanghe Formations, and Qi et al. (2013) tested the ages of Huoshaogou and Baiyanghe Formations by electron spin resonance experimentation, a kind of dating technique; the results were 40.2–24.3 Ma B.P. However, no Paleogene strata are found in the Juhugeng mining area, which means that the study area was a non-sag district and was in a steady stage of uplift and denudation.
3. N–Q
There were a series of red-brown mudstone and sandstone deposited in the Early Miocene that exposed on the north of the research area because the Juhugeng mining area experienced a rapid subsidence and formed as a sag to accept deposition during the Early Miocene due to the crushing stress, and the simulation results show that the depth of coal measures was about 1500 m, with the paleo-temperature being about 110 °C (Figure 8(a)), resulting a relatively small number of hydrocarbon generation (Figure 8(b)). Many papers have revealed that Qilian Mountains started to uplift rapidly in the late Miocene (Qi et al., 2013; Wang, 1997), due to the south–north extrusion stress, and the Triassic and Jurassic strata were cut by intensive thrust faults (Jiang et al., 2015; Sun et al., 2009). The apatite particle age of Sample II-2 shows the oldest age being 8 Ma, which proves the occurrence of intensive thrust faults and uplift. Qilian Mountains kept uplifting in the Late Neogene and stayed calm without intense tectonic movements in the Quaternary period (Li et al., 2014; Qi, 2014), so the research area also shows the same structural movements that formed the structural framework that mainly consisted of thrust faults.
The geological ages of gas migration for the gas hydrate based on FIs and AFT experiments
The gas hydrate was preserved in the temperature–pressure stability zone under the permafrost, with a thickness of 75–115 m, and an average value of 90 m. The lithology of the permafrost is mainly composed of Quaternary deposit, sandstones, mudstones/shales, and coals. Theoretically, the gas hydrate can be well preserved in the temperature–pressure stability zone of the permafrost (Grassmann et al., 2010; Milkov and Sassen, 2000). In the study area, the gas hydrate is located at the top of the temperature–pressure stability zone, with a depth ranging from 116 to 490 m (Chen, 2015), and is often enriched in the fault zone (He et al., 2017). As mentioned in “FI experiments” section, the two generations of FIs suggest that coal measure gas had migrated twice through cracks caused by strata destruction and finally filled the strata of the temperature–pressure stability zone near the surface, so the gas migration was completely restricted by structural movements.
According to the age range of the AFT experiments, three geological evolution stages of Late Paleogene (>30 Ma), Late Paleogene to Early Neogene (30–8 Ma), and Late Neogene to Quaternary (<8 Ma) are selected to discuss the relationship between structural evolution and gas migration for the gas hydrate.
Late Paleogene (>30 Ma)
The presence of FIs in the hanging wall proves that the gas has migrated into the hanging wall through the fault, indicating that the gas migration occurred after the thrust of Upper Triassic strata (Figure 9). The AFT results show that the ages of oldest apatite particles are about 30 Ma, indicating that the Triassic formation’ temperature was above 110 ± 10 °C before 30 Ma. The homogenization temperature of saline water FIs also shows a range of 115–149 °C, reflecting relatively high values of temperature, which have a good match with the representation of AFT results. Moreover, the simulative geo-temperature values of Jurassic strata never exceed over 110 °C after 30 Ma (“The reconstruction of burial history of coal measures in the study area” section). Therefore, it can be inferred that the first gas migration occurred before 30 Ma, and the Upper Triassic strata should already been thrust over the Jurassic strata before 30 Ma so that the hydrocarbons (gas and liquid hydrocarbon) can migrate through the fault zone and reach the Upper Triassic strata in the hanging wall (Figure 9), and all five kinds of FIs, including gas hydrocarbon, gas–liquid hydrocarbon, liquid hydrocarbon, gas hydrocarbon–saline water, and saline water, were formed before 30 Ma. Then, the whole strata, including the Triassic and Jurassic strata, uplifted, and the temperature dropped below 110 ± 10 °C at about 30 Ma. In this stage, the study area formed asymmetrical intermountain sunken and upwarped zones (Qi et al., 2015).
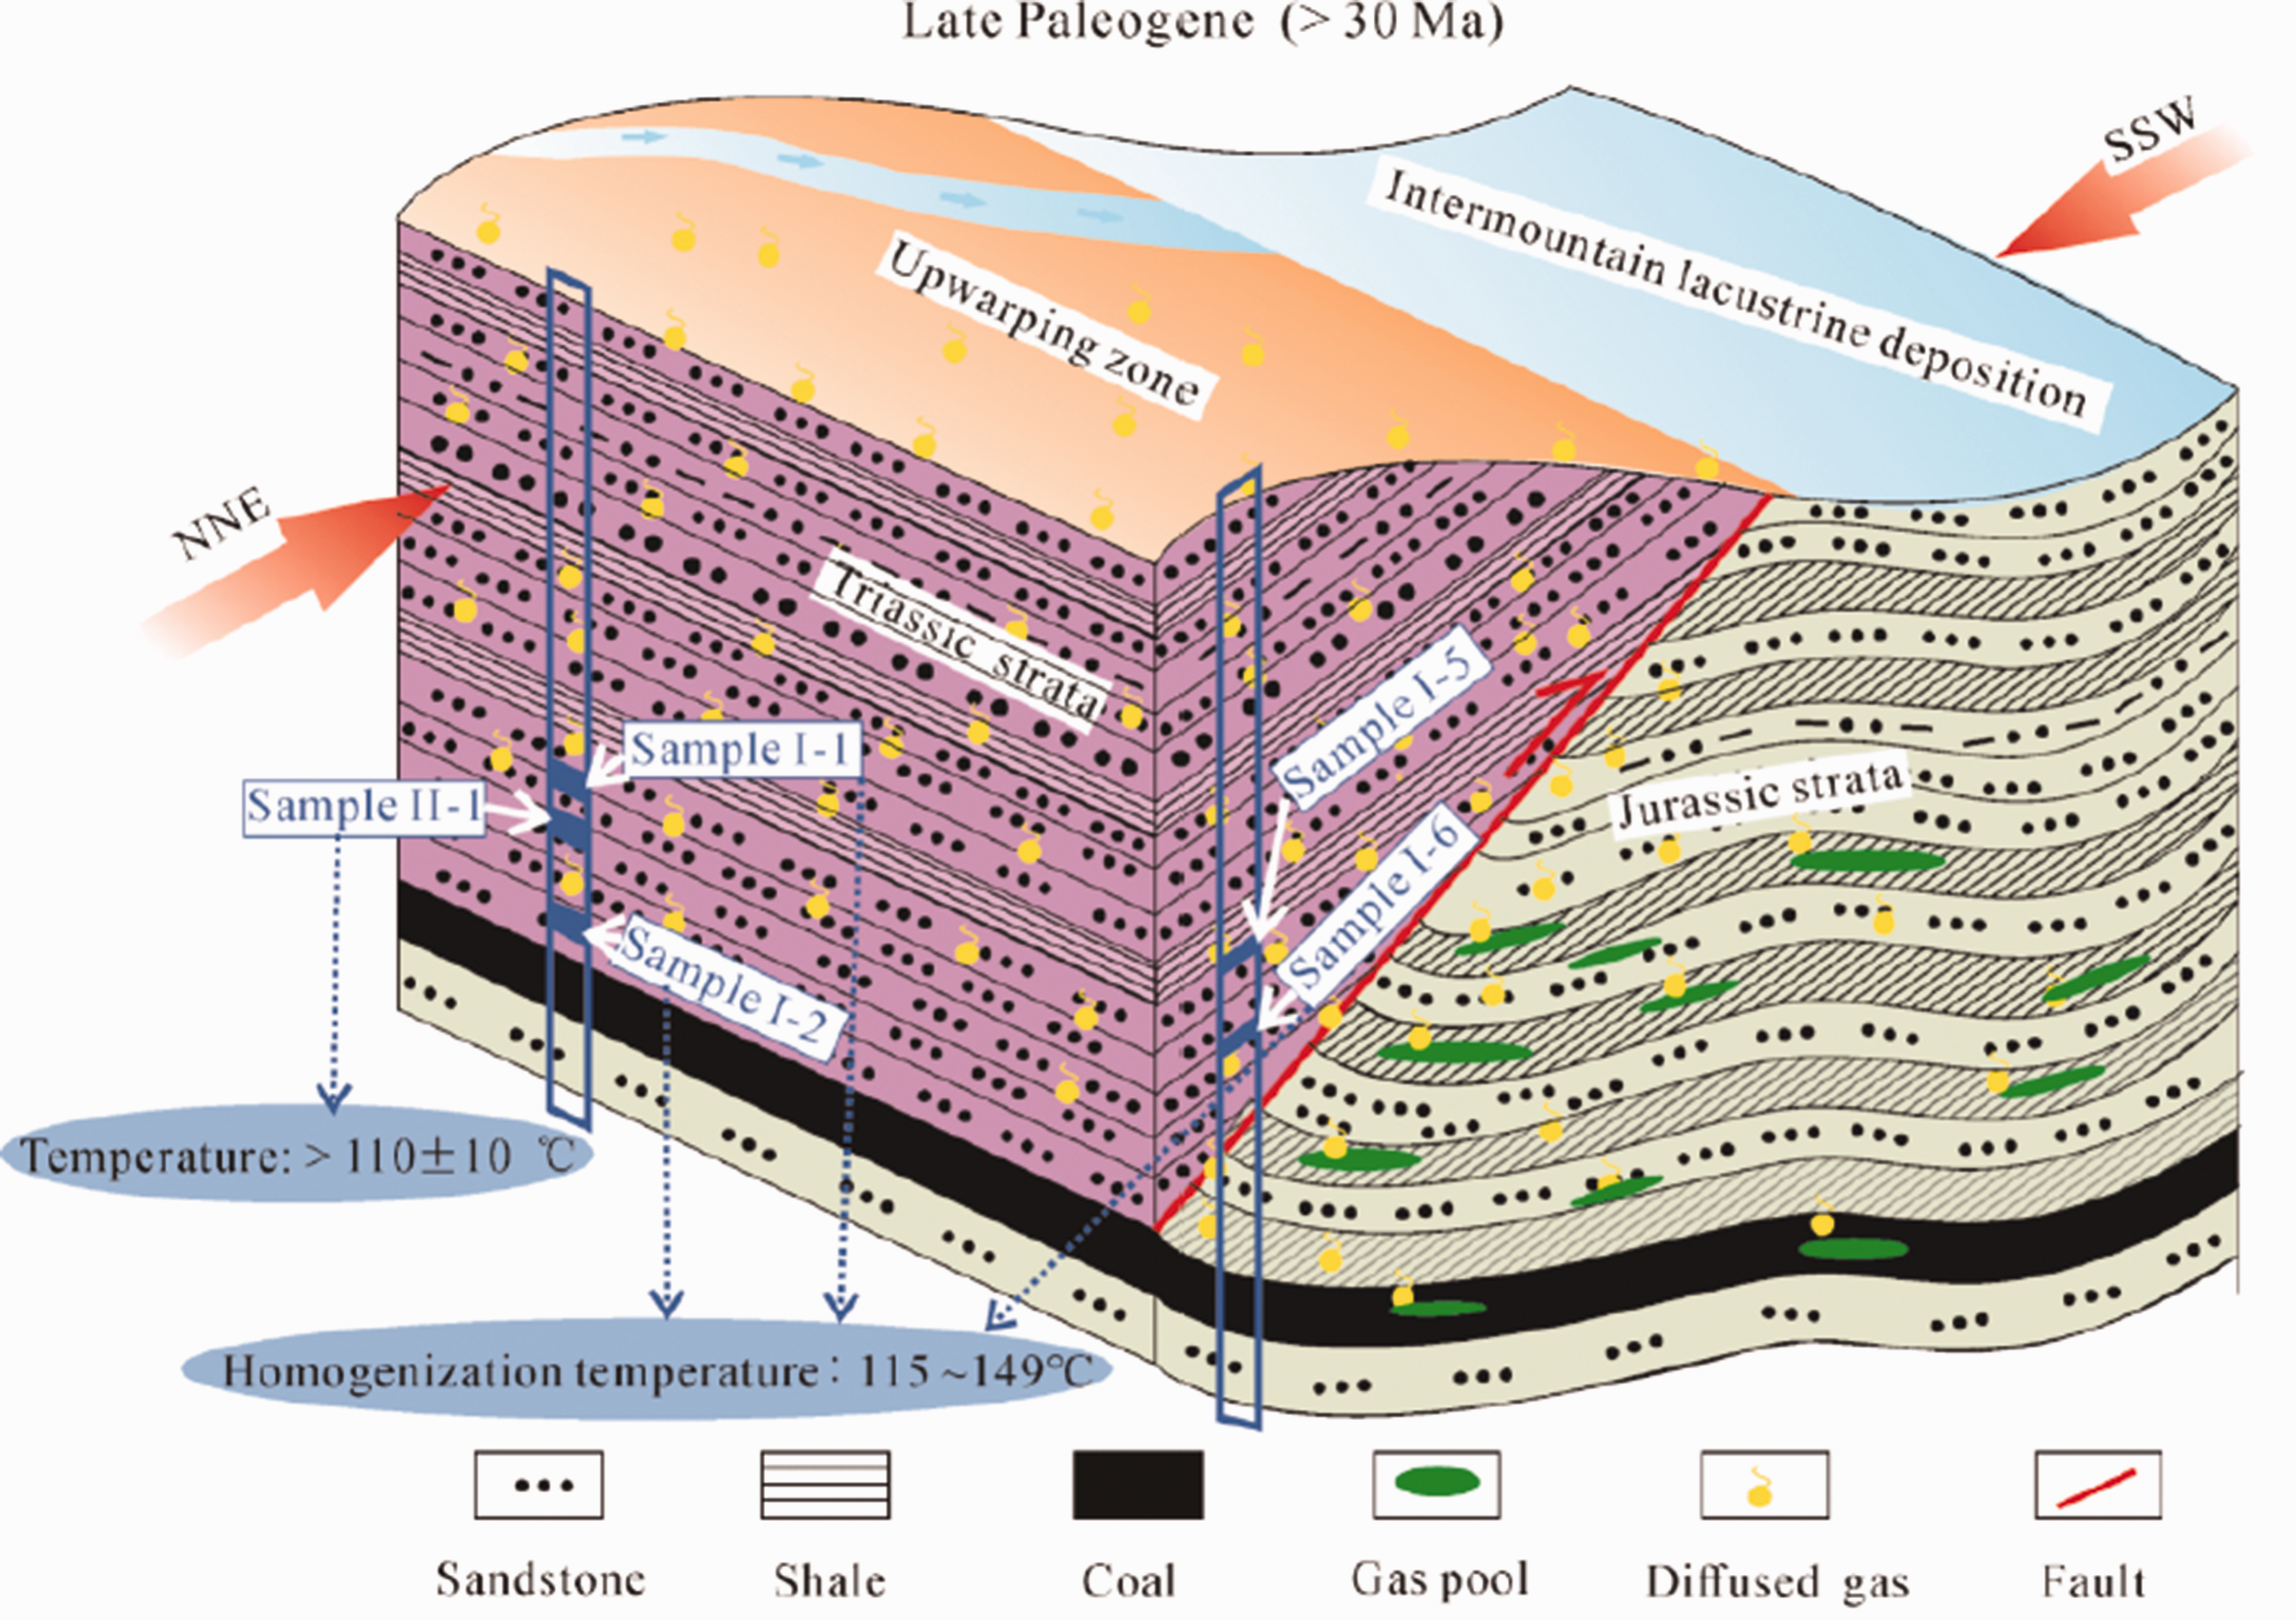
The thrust of Triassic strata and gas migration in the Late Paleogene.
Early Neogene–Late Neogene (30–8 Ma)
The age distribution of apatite particles of Sample II-1 in the hanging wall is strongly heterogeneous and ranges from 2.5 to 30 Ma with P(χ2) being 0%, that is, the apatite particles experienced a temperature between 60 °C and 110 ± 10°C after the geological age of 30 Ma. The apatite particles’ age of Sample II-2 in the footwall is 0–8 Ma, with P(χ2) being 75%, indicating that the temperature of Jurassic strata in footwall was higher than 110 ± 10°C before the geological age of 8 Ma, and Jurassic strata had been raised to a depth where the temperature was lower than 110 ± 10 °C at about the geological age of 8 Ma. Combined with burial history simulation, it can inferred that in the geological ages of 30–8 Ma, there was a rapid subsidence in the study area (Figures 8 and 10), which can also be confirmed by the existence of Early Neogene (N1) strata to the north of the study area. This rapid subsidence resulted in the hanging wall (Triassic strata) and footwall (Jurassic strata) being in the temperature range of 60–110 ± 10°C and higher than 110 ± 10°C, respectively, resulting in a secondary hydrocarbon generation of source rocks in coal measures of Jurassic strata (Figures 8 and 10). However, the rapid subsidence did not last long, so the maturity of the coal measure source rocks was only slightly increased, causing the fluorescent color of some FIs being only mildly increased from blue-green to blue.
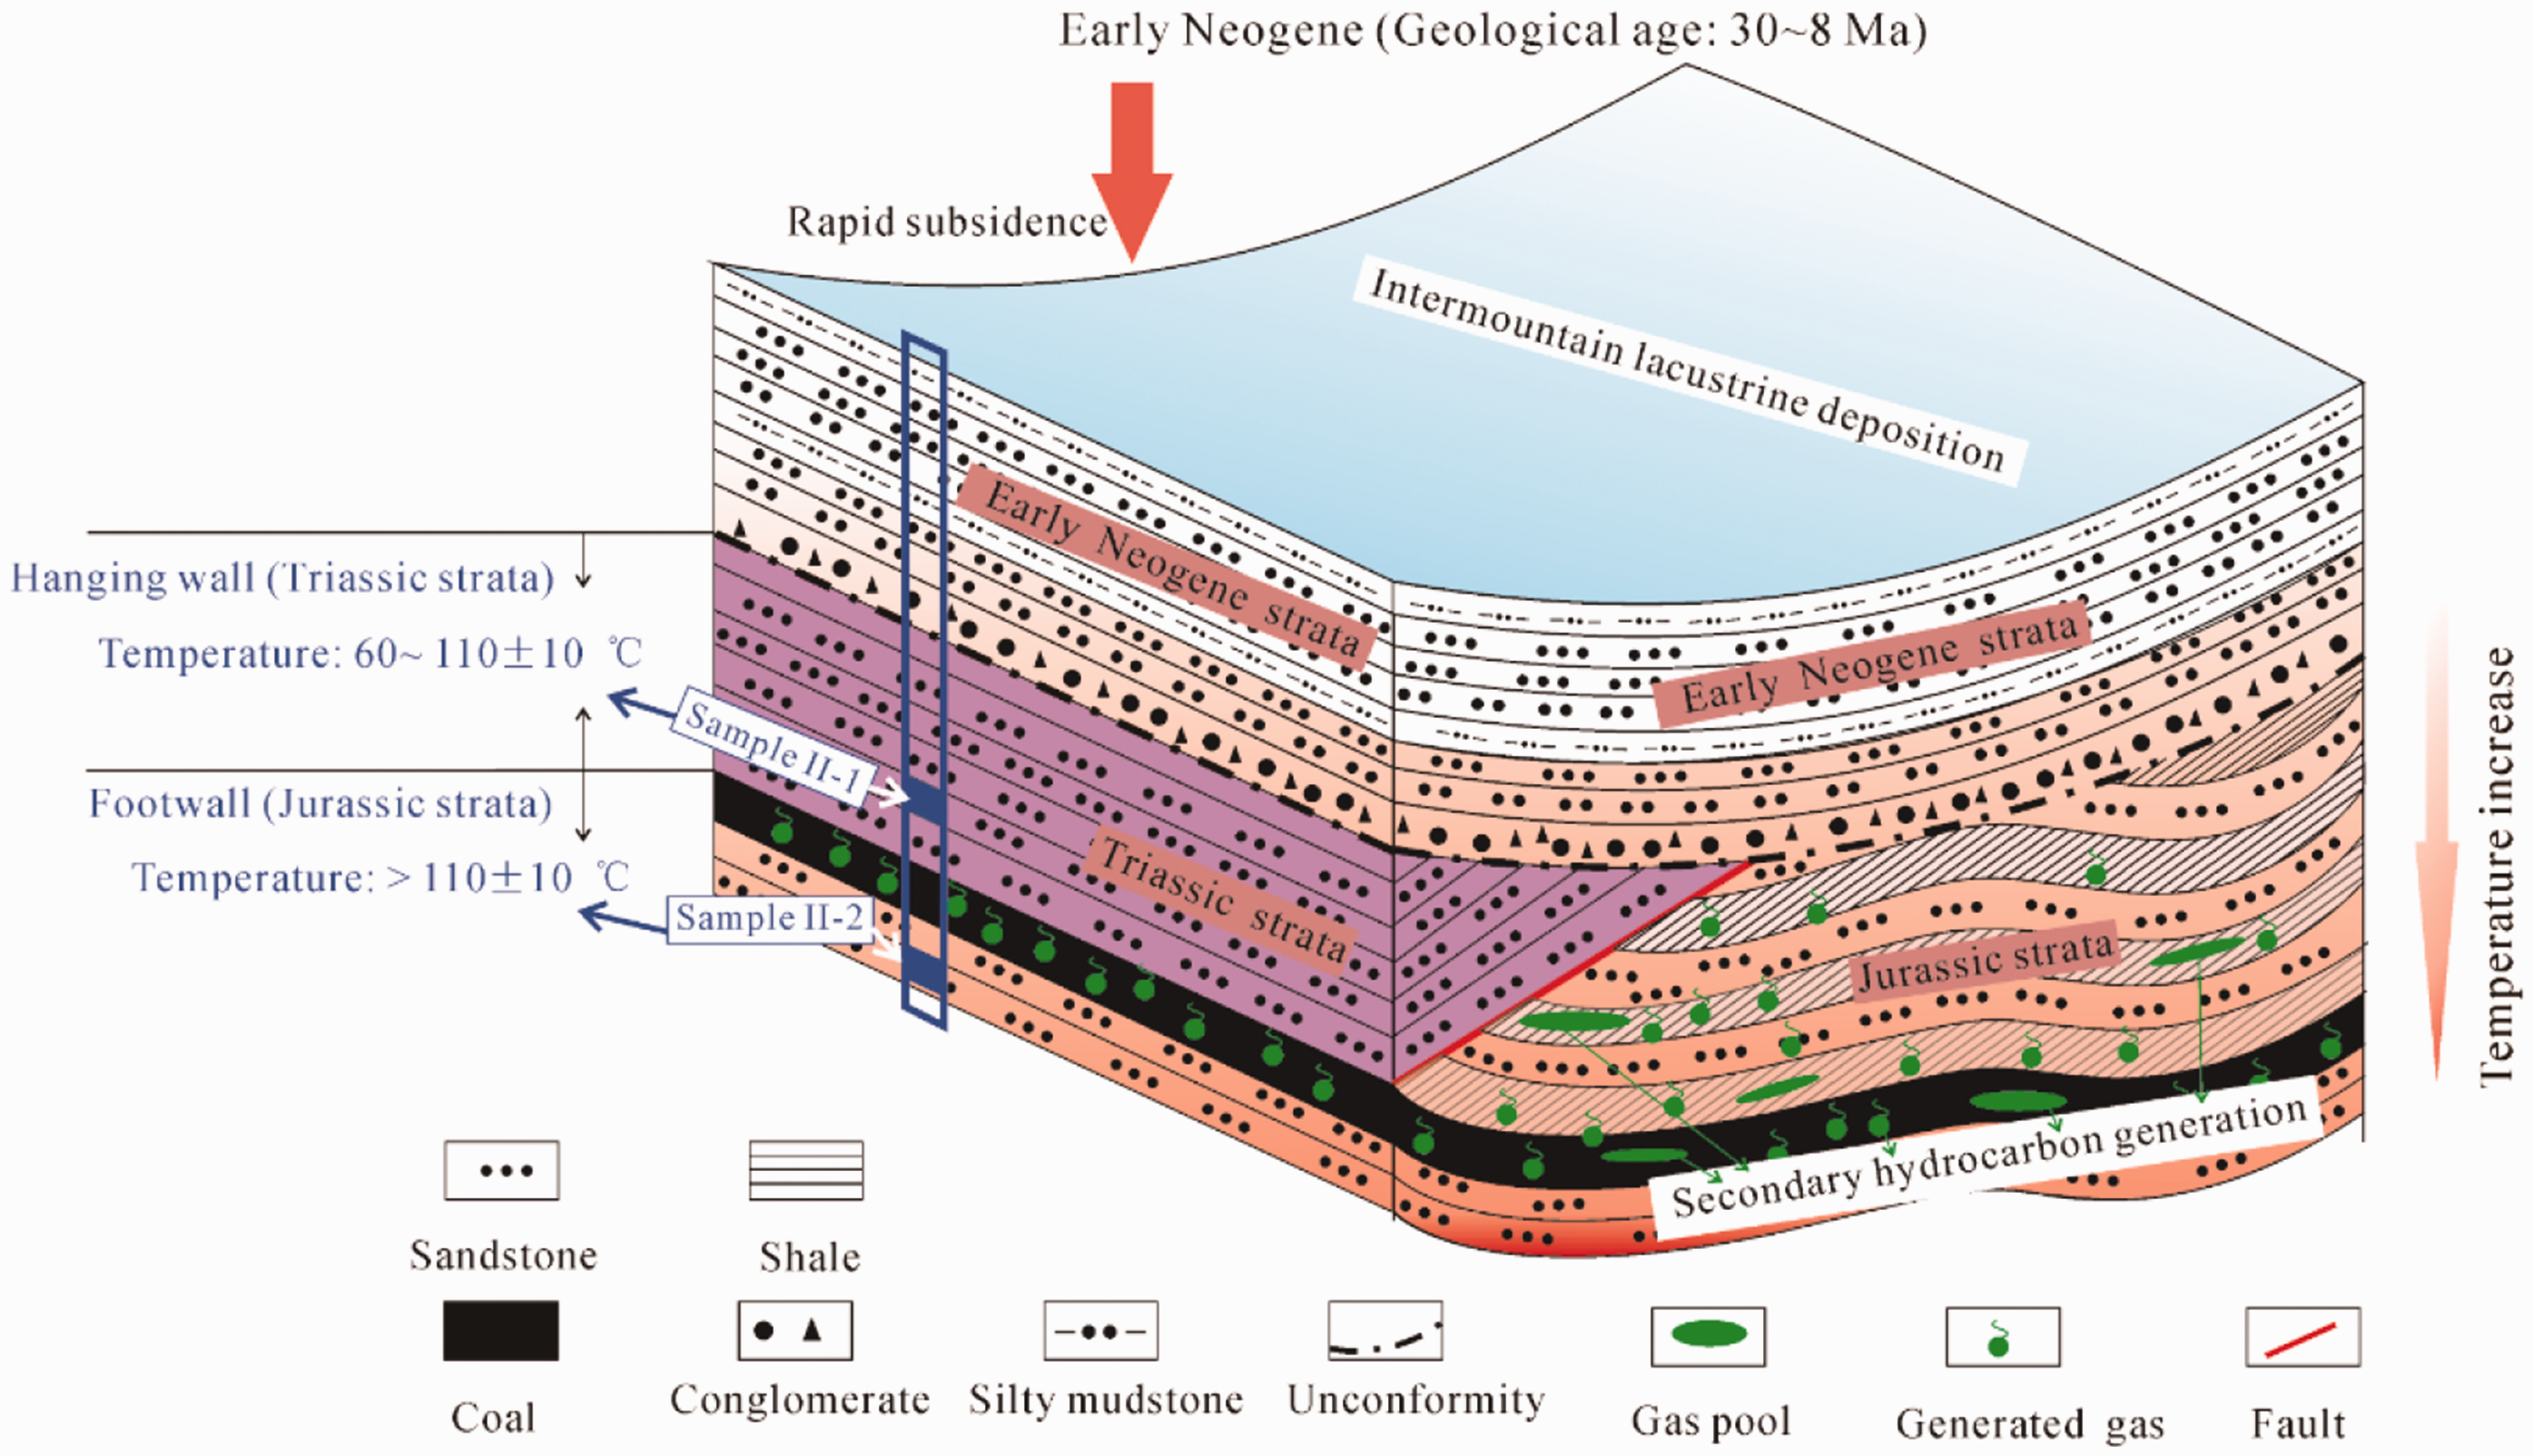
The rapid subsidence of the study area in the Early Neogene and the secondary hydrocarbon generation of coal measure source rocks in Jurassic strata.
Late Neogene to Quaternary (<8 Ma)
Figure 11 shows the structural movements of thrusts in the Late Neogene ∼ Quaternary period and the secondary gas migration in the study area. Influenced by the Northwest trending extrusion stress, the study area keep uplifting in the Late Neogene so that the deposited Early Neogene strata were completely denuded, and only some of the early N1 strata remained to the north of the study area. According to the apatite particles’ age in Sample II-2, the continuous uplift of Jurassic strata in the footwall occurred before 8 Ma, i.e., the study area uplifted in the Late Neogene. After the geological age of 8 Ma, the temperature of the footwall dropped below 110 ± 10°C with the occurrence of intensive thrust faults and uplift discussed in “The reconstruction of burial history of coal measures in the study area” section, and the homogenization temperature of the water saline FIs also showed low values of 83–115 °C, corresponding very well to the temperature representation of Sample II-2’ AFT results and the thermal history simulation. So, it can be inferred that the second gas migration occurred after the geological age of 8 Ma. However, in this migration process, only gaseous hydrocarbon (CH4) migrated without liquid hydrocarbon, which has been confirmed by the types of FIs in the calcite vein in Sample I-7 discussed in “FI experiments” section.
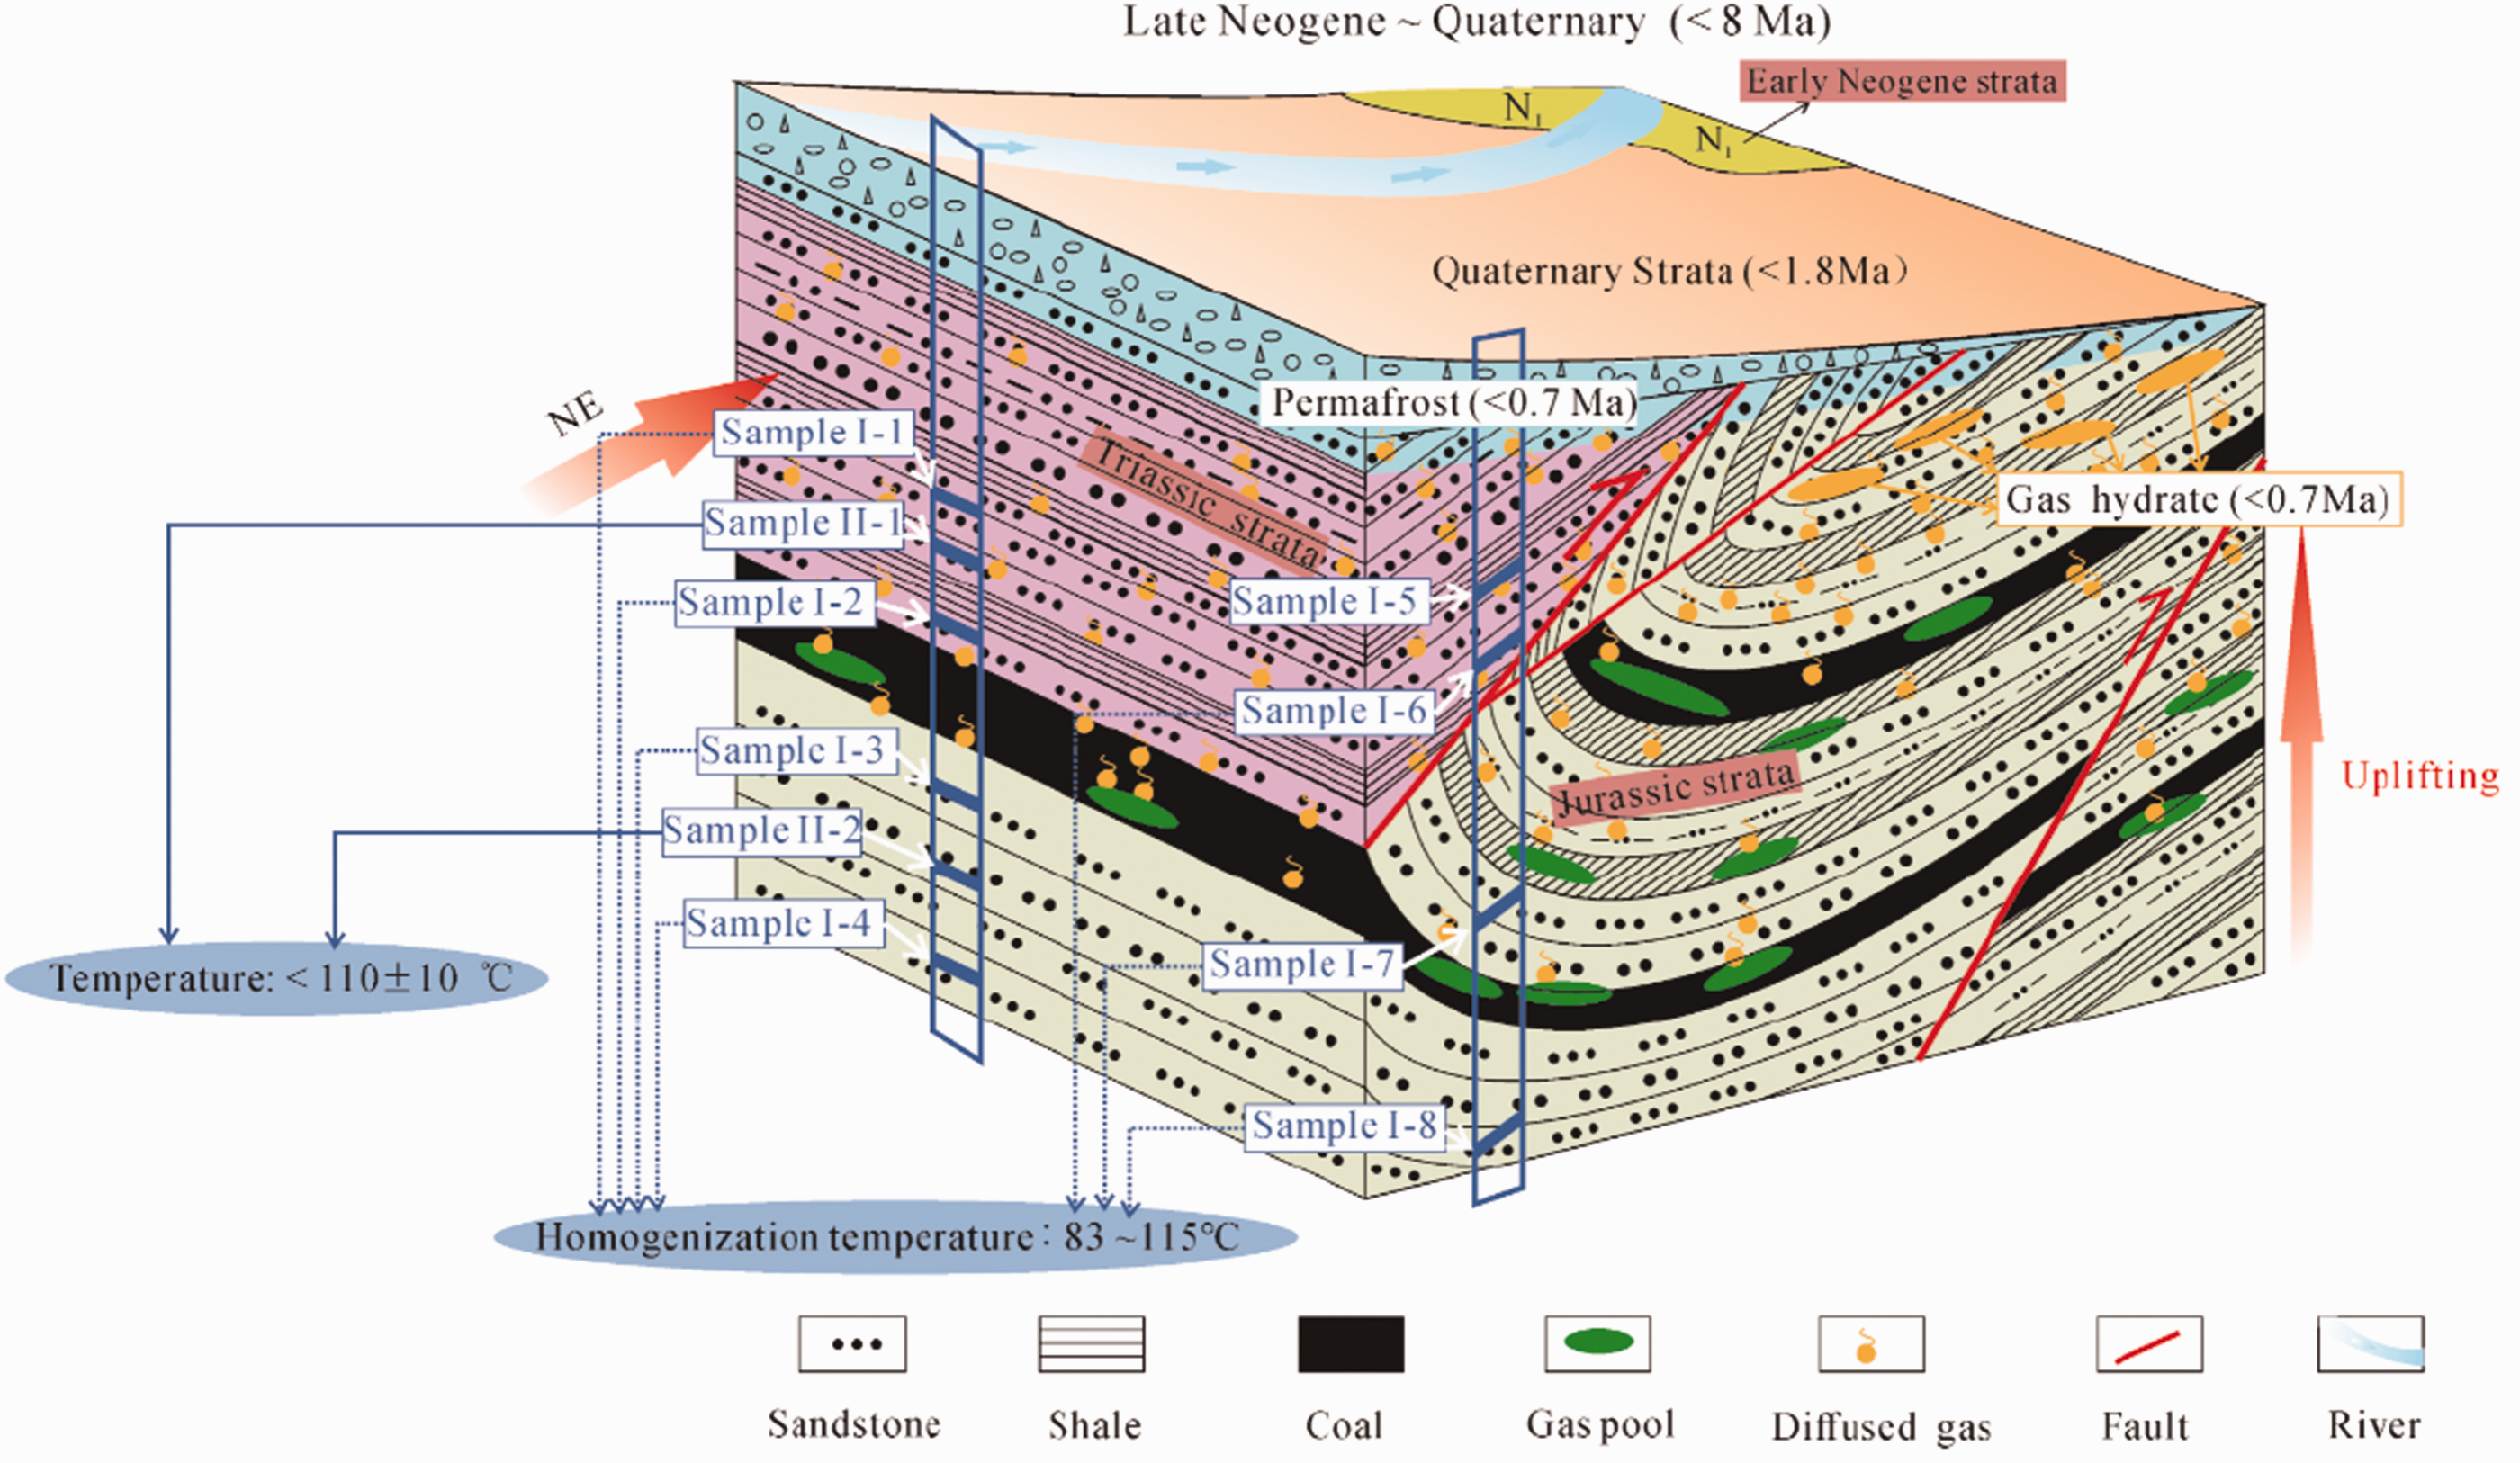
The structural movements of thrusts in the Late Neogene–Quaternary period and the secondary gas migration in the study area.
From the perspective of the occurrence state, the FIs are mainly linearly distributed in healed microfractures (Figure 2), denoting that the gas migration was caused by considerable strata destruction. In general, thrust fault is considered as the barrier to the gas migration, but in the study area, the thrust faults often created fracture zone. So, the fracture zone and the microfracture in the rocks caused by the structural pressure can be the pathways for the gas migration, which is confirmed by many researchers (Chen, 2015; Lu et al., 2019; Zhai et al., 2014), then the gas can migrated from the bottom of the Middle Jurassic to the siltstone and shale reservoirs near the permafrost because of the intensive structural movements after the geological age of 8 Ma. According to Qi’s research in 2014, the tectonic activity in the Qilian Mountains began to weaken at the geological age of 1.8 Ma. Therefore, the second gas migration age can be restricted to 8–1.8 Ma. Moreover, the permafrost was formed after the geological age of 0.7 Ma (Lu et al., 2015a; Qi, 2014), which requires that methane gas be accumulated and then lithologically trapped as effective gas reservoirs before 0.7 Ma so that the gas hydrates can be formed in the temperature–pressure stability zone under the permafrost after the geological age of 0.7 Ma.
The formation pattern of the gas hydrate
For a long time, the gas migration pattern of the gas hydrate was a controversial issue: (1) some researchers thought that the gas accumulated under mudstone/shale sealing conditions in the Upper Jurassic before the formation of permafrost and was then formed into gas hydrate with the water (Figure 12, Type I) (Lu et al., 2015a; Zhai et al., 2014); and (2) some researchers believed that the permafrost was formed before the gas accumulation and was considered as the caprock and reservoirs when the gas migrated through faults and cracks, which led to the formation of the gas hydrate (Figure 12, Type II) (Li et al., 2013; Zhang et al., 2014).
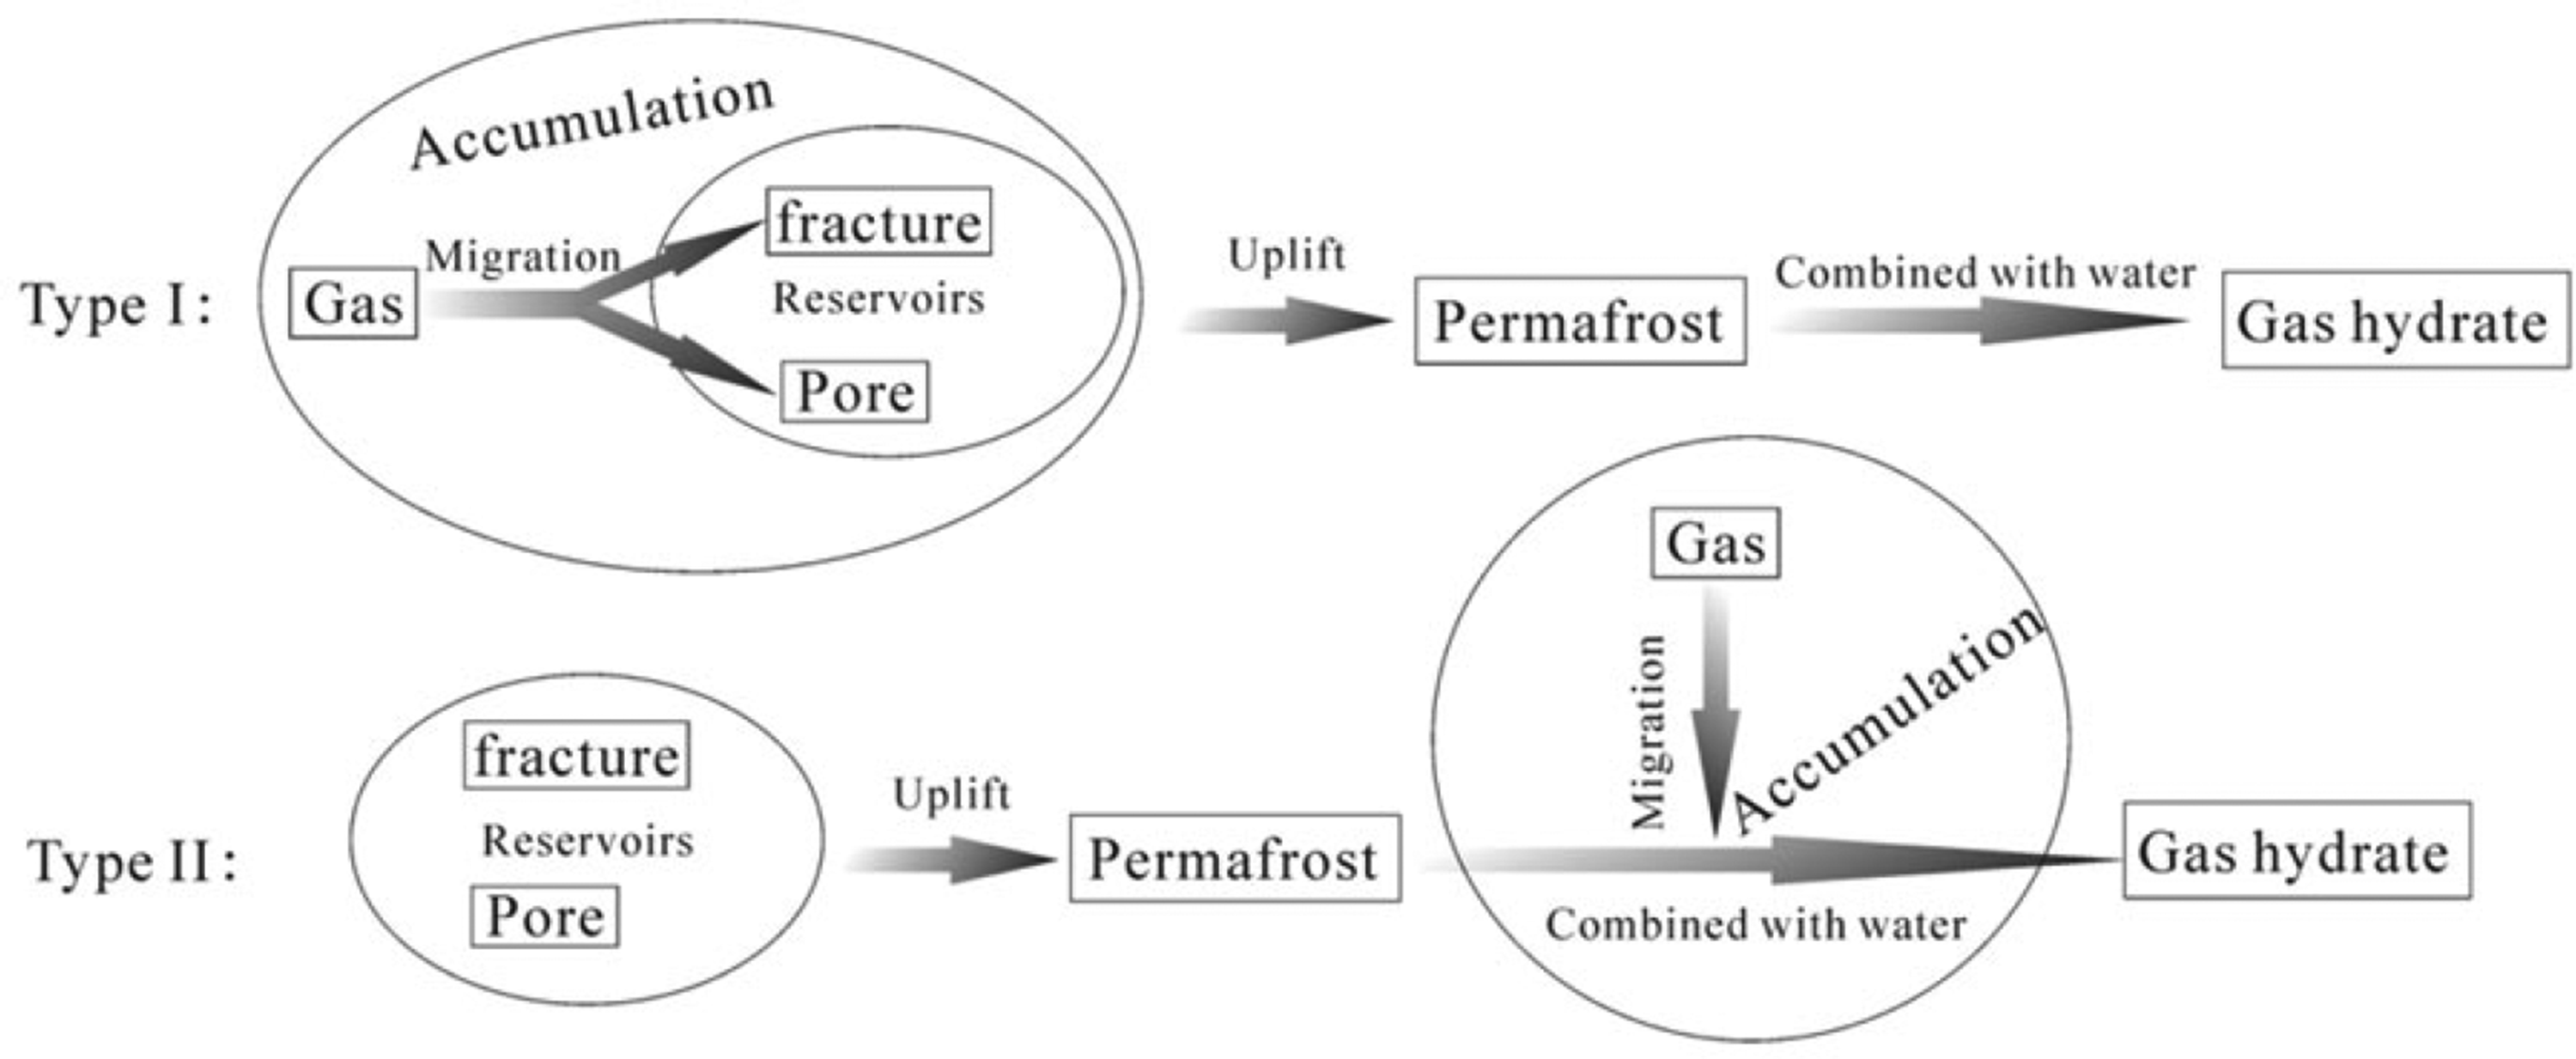
Gas hydrate accumulation types.
According to “Late Neogene to Quaternary (<8 Ma)” section, the twice periods of gas migration occurred before 1.8 Ma, and the permafrost was formed after 0.7 Ma, which requires the methane gas accumulated before 0.7 Ma so that the gas hydrates can be formed in the temperature–pressure stability after the geological age of 0.7 Ma. In addition, the mudstone, shales, and siltstones of the coal measures near the surface were considered as good “cap rocks” for the gas accumulation (Lu et al., 2015a; Zhai et al., 2014), so the migrated gas can be lithologically trapped in the mudstones and siltstones under the “cap rocks” as effective reservoirs, which has been confirmed by the fact that lots of phenomena of gas bubbling were found in cores of sandstone during the drilling process (Zhu et al., 2011). On the contrary, if the permafrost formed before the gas migration process, then it should be recorded by FIs with low homogenization temperature, but no FIs were characterized by these features. Therefore, experimental results in this study support Type I gas hydrate accumulation (Figure 12).
Conclusions
The inclusions of both the hanging wall (Triassic strata) and footwall (Jurassic strata) are characterized by two gas filling stages, and are linearly preserved in healed microfractures with the fluorescent colors being blue green and blue. It is considered that the gas migration happened twice at post-diagenetic ages due to the destruction of coal measures. The first gas migration occurred due to the thrust of Triassic strata before 30 Ma. The temperature of the whole strata was higher than 110 ± 10°C before 30 Ma, suggesting that the FIs of high homogenization temperature values were trapped in this geological evolution stage. The second gas migration occurred during the geological age of 8–1.8 Ma, and the gas hydrate was formed in the temperature–pressure stability zone near surface after the geological age of 0.7 Ma. The temperature of the whole strata was less than 110 ±10°C after 8 Ma, indicating that the FIs of low homogenization temperature values were trapped in this geological evolution stage.
Footnotes
Acknowledgements
Declaration of conflicting interests
The author(s) declared no potential conflicts of interest with respect to the research, authorship, and/or publication of this article.
Funding
The author(s) disclosed receipt of the following financial support for the research, authorship, and/or publication of this article: This study was financially supported by the National Natural Science Foundation of China (Grant Nos. 41902170, 41972174, 41572141).