
Abstract
This paper presents a new approach, called optimized fuzzy Preference Ranking Organization METHod for Enrichment Evaluation (PROMETHEE), based on combining fuzzy logic, an outranking method and the cuckoo search optimization algorithm to assess petroleum potential in a spatial framework. The approach brings together flexibility and simplicity to solve petroleum exploration problem under uncertainty using experts’ knowledge and the information associated with the discovered oil pools simultaneously. The characteristics of the essential elements of the petroleum system are used as key criteria in the model. To exemplify the approach, a case study was undertaken in the Red River petroleum system of the Canadian portion of the Williston Basin. Eight datasets related to the selected criteria were integrated by the optimized fuzzy PROMETHEE to create a map that makes it possible to identify the areas of highest petroleum potential. All discovered oil pools in the Red River petroleum system were used in the verification process. The results indicated that the proposed approach can deal effectively with incomplete data and imprecise information, and can be efficiently used in petroleum exploration, thereby reducing the cost and risk of exploration.
Keywords
Introduction
The primary objective of exploration in the petroleum industry is to find economically recoverable reserves. Petroleum exploration is a costly process which involves a great deal of complexity and uncertainty. A decision to drill in an area without careful consideration of the petroleum potential assessment would most likely result in a dry hole. So, potential modeling is a crucial step in petroleum exploration. The evaluation of the potential of undiscovered petroleum accumulations involves integrating surface and subsurface datasets, including geological, geochemical, geophysical, petrophysical and geographical data.
Existing literature provides a number of methods for modeling petroleum potential in a spatial framework, which fall in three general categories: data-driven, knowledge-driven and hybrid approaches. On the one hand, spatial associations between discovered reservoirs and indirect evidence of the petroleum potential are quantitatively analyzed by data-driven methods (Carranza et al., 2008a; Coolbaugh et al., 2002; Magalhães and Filho, 2012). The extracted spatial relationships are then used to estimate the parameters of model by which input datasets are integrated to produce a petroleum potential map (Abedi et al., 2012a, 2012b; Blewitt et al., 2002; Carranza and Hale, 2002). There are several data-driven methods that can be used for modeling the petroleum potential of a region of interest, such as adaptive neuro-fuzzy inference system (ANFIS), neural networks (ANNs), Bayesian classifiers, evidential belief functions (EBFs), gene expression programming (GEP), logistic regression, support vector machines (SWMs) and weights of evidence. On the other hand, knowledge-driven methods do not require spatial analysis of discovered petroleum pools within a region of interest. They involve application of expert knowledge to assign the parameters of model (Carranza et al., 2008b; Kraipeerapun et al., 2005). Fuzzy logic, Boolean logic, outranking techniques, the Dempster-Shafer belief theory and index overlay are some examples of these methods.
In the past few years, a number of studies have been performed on the spatial or non-spatial assessment of petroleum potential using data-driven, knowledge-driven and hybrid approaches. Zargani et al. (2003) used weights of evidence method to integrate the main geological factors controlling petroleum occurrence in a geographic information system (GIS) environment in order to identify the areas with the highest petroleum potential for future exploration. The results were somewhat encouraging and 64% of the discovered petroleum accumulations of the Murzuq Basin of Libya were located in the favorable regions of the resulting posterior probability map. Chen and Osadetz (2005) simulated the spatial distribution of undiscovered oil and gas accumulations by a fractal model. The results of the simulation indicate that the spatial characteristics of the accumulations in the Rainbow play of the Western Canada Sedimentary Basin (WCSB) are fractal and there are areas with high potential for more investigation in the southwest and northeast of the play. An expert system entitled approximate fuzzy assessment (AFA) on the strength of fuzzy set and possibility theories for the evaluation of oil potential in the Hassi Messaoud fields of Algeria was developed by Tounsi (2005). Source rock, reservoir, trap and seal as the essential elements of a petroleum system were considered in the AFA expert system. Although the system could handle data with uncertainty, the petroleum potential was investigated in a non-spatial framework. Chen and Osadetz (2006b) proposed a model-based simulation approach using the Fourier transform algorithm to produce a petroleum accumulation map for the Rainbow play of the WCSB. The pre-1994 exploratory datasets were used for estimating the model parameters and conditioning the simulation. The final accumulation map successfully predicted the location of 68% of the post-1993 discovery wells. A GIS-based fuzzy multi-criteria evaluation approach for petroleum exploration in northern South America was developed by Bingham et al. (2012). They validated the results by comparing the favorability maps to the discovered fields and concluded that the approach is satisfactory for assessing the petroleum potential in frontier areas because it does not rely on prior probabilities. Two data-driven methods, the frequency ratio and EBFs, were used by Arab Amiri et al. (2015a) to evaluate the spatial distribution of oil pools in the Red River petroleum system of the Williston Basin. Seven sub-criteria of the elements of the petroleum system were selected as input datasets. The frequency ratio method showed slightly better performance in the petroleum potential modeling than EBFs. In another study, Arab Amiri et al. (2015b) applied a GIS-based EBFs model to create a petroleum resources potential map for Khuzestan Province of Iran. Ziyong et al. (2017) employed a GIS-based fuzzy logic model to investigate the gas potential of the Lower Carboniferous of the Chu-Sarysu Basin in Kazakhstan. The geological, geophysical and simulation datasets were integrated using the gamma operator to delineate the areas with the highest gas potential. The predictions of the proposed model were validated by the well-logging interpretation.
Some studies have also been conducted on the spatial characteristics of undiscovered petroleum accumulations. In a study by Gao et al. (2000), for example, each of the gas pools was first parameterized by the geological properties, location, shape and exploration history data. An object model on the basis of the characteristics of each pool and relationships between pairs of pools was then used for predicting the spatial distribution of undiscovered natural gas resources in the Middle Devonian Rainbow reef play of the WCSB. A similar study was carried out by Chen et al. (2000) in the Keg River Reef play of the WCSB. They developed a stochastic model to determine the possible locations and sizes of undiscovered pools.
Furthermore, several spatial approaches such as the index overlay (Grant et al., 1996), multivariate and Bayesian statistical methods (Chen and Osadetz, 2006a), Monte-Carlo simulation and geostatistical techniques (Ruffo et al., 2006), object-based stochastic model (Chen et al., 2008), hybrid fuzzy-probabilistic method (Roisenberg et al., 2009), fuzzy-belief and Bayesian-belief networks (Martinelli, 2012; Xie et al., 2011) have been proposed for risk assessment in petroleum exploration.
Petroleum potential modeling is considered as a multiple criteria decision-making (MCDM) problem, since there are a finite number of spatial elements (pixels or voxels) as alternatives which have to be ranked considering several, sometimes conflicting, criteria. Among various methods of MCDM, the Preference Ranking Organization METHod for Enrichment Evaluation (PROMETHEE), as an outranking approach, is particularly suitable for ranking applications (Albadvi, 2004; Al-Shemmeri et al., 1997; Goumas and Lygerou, 2000; Ufuk Bilsel et al., 2006). The methods of PROMETHEE family are regarded as partially compensatory models (Geldermann et al., 2000) that are easily understood and implemented (Zhao et al., 2019). They are suitable when units are incomparable or incommensurate, criteria metrics are difficult to aggregate, and variety of measurement scales are used (Linkov et al., 2004). Furthermore, fuzzy logic (Zadeh, 1965) has been found to be a very efficient mathematical tool to deal with imprecise and incomplete data (Roisenberg et al., 2009) and is adequate to handle uncertainty in petroleum geology (Chen and Fang, 1993). Consequently, combining fuzzy logic and PROMETHEE, called fuzzy PROMETHEE (FP), provides an effective and flexible knowledge-driven mechanism to solve the petroleum exploration problem under uncertainty.
It should also be noted that most knowledge-driven approaches for petroleum potential assessment such as FP are characterized by complex functional relationships and a large number of parameters that must be specified by experts. In most cases, the parameters cannot be determined with precision and models may suffer from expert-elicited values, hence the need for parameter optimization. Parameter optimization is the process in which model parameters are tuned for a particular problem. Several computational intelligence methods, such as cuckoo search (CS), pattern search, particle swarm optimization (PSO), artificial bee colony (ABC), genetic algorithms (GA) and firefly, were proposed in the literature. These algorithms estimate relevant parameters by minimizing, or maximizing, the objective function in the optimization process. The findings of several preliminary studies (Gandomi et al., 2013; Kumar and Chakarverty, 2011; Tuba et al., 2011; Yang and Deb, 2010; Civicioglu and BesdokEmail, 2013) show that CS is very promising and efficient in solving optimization problems and could outperform other metaheuristic algorithms such as GA, ABC and PSO, because it has relatively few parameters that must be tuned by the user. In fact, besides the population size, there is basically one parameter
Considering the above, optimized fuzzy PROMETHEE (OFP) is presented for petroleum potential assessment, in which FP provides a robust decision-making framework that has the capability to handle data with uncertainty and the CS algorithm is used to optimize weights of the criteria. In order to exemplify FP and OFP, a case study was undertaken in one of the petroleum systems of the Williston Basin.
To the best of our knowledge, the OFP approach has not been previously applied to the petroleum exploration problem. The PROMETHEE methods are able to model real-world problems with crisp input values (Brans and Mareschal, 1994; Brans et al., 1984; Brans and Vincke, 1985), this is not the case in most petroleum exploration activities, especially in frontier areas, where information is uncertain, incomplete and imprecise. Hence, one of the novelties of the presented research work is to utilize the trapezoidal fuzzy (TF) numbers to determine the shape of the membership functions for petroleum potential assessment under uncertainty. Bias is a serious problem in oil and gas exploration. Biased expert-elicited values for parameters included in a petroleum potential model are significantly associated with unsuccessful outcomes such as an uneconomic reservoir or a dry hole. So, another important novelty of the study includes optimizing the experts-assigned weights of the criteria by the CS algorithm.
Materials and methods
The goal of the proposed methodology is to perform petroleum potential assessment in a spatial framework. An overview of the methodology is presented in Figure 1. Having identified the evaluation criteria based on the characteristics of the petroleum system elements, eight datasets related to the criteria were prepared and converted to the raster data model. Cell values of the raster datasets were then stored in a spatial database. The generalized preference functions and a vector containing the triangular fuzzy weights were defined by the exploration experts to apply FP. For OFP, in addition to these, it is necessary to specify the parameters of the CS algorithm by which the triangular fuzzy weights of the criteria are optimized. The values of the net outranking flow were computed for alternatives or pixels both by FP and OFP. The net outranking flow values resulting from each method were subsequently converted to a petroleum potential map. Each map was reclassified into the potential classes ranging from no- to high-potential. Finally, the prediction performance of both methods was evaluated by overlaying a vector layer of the discovered oil pools upon the reclassified maps.
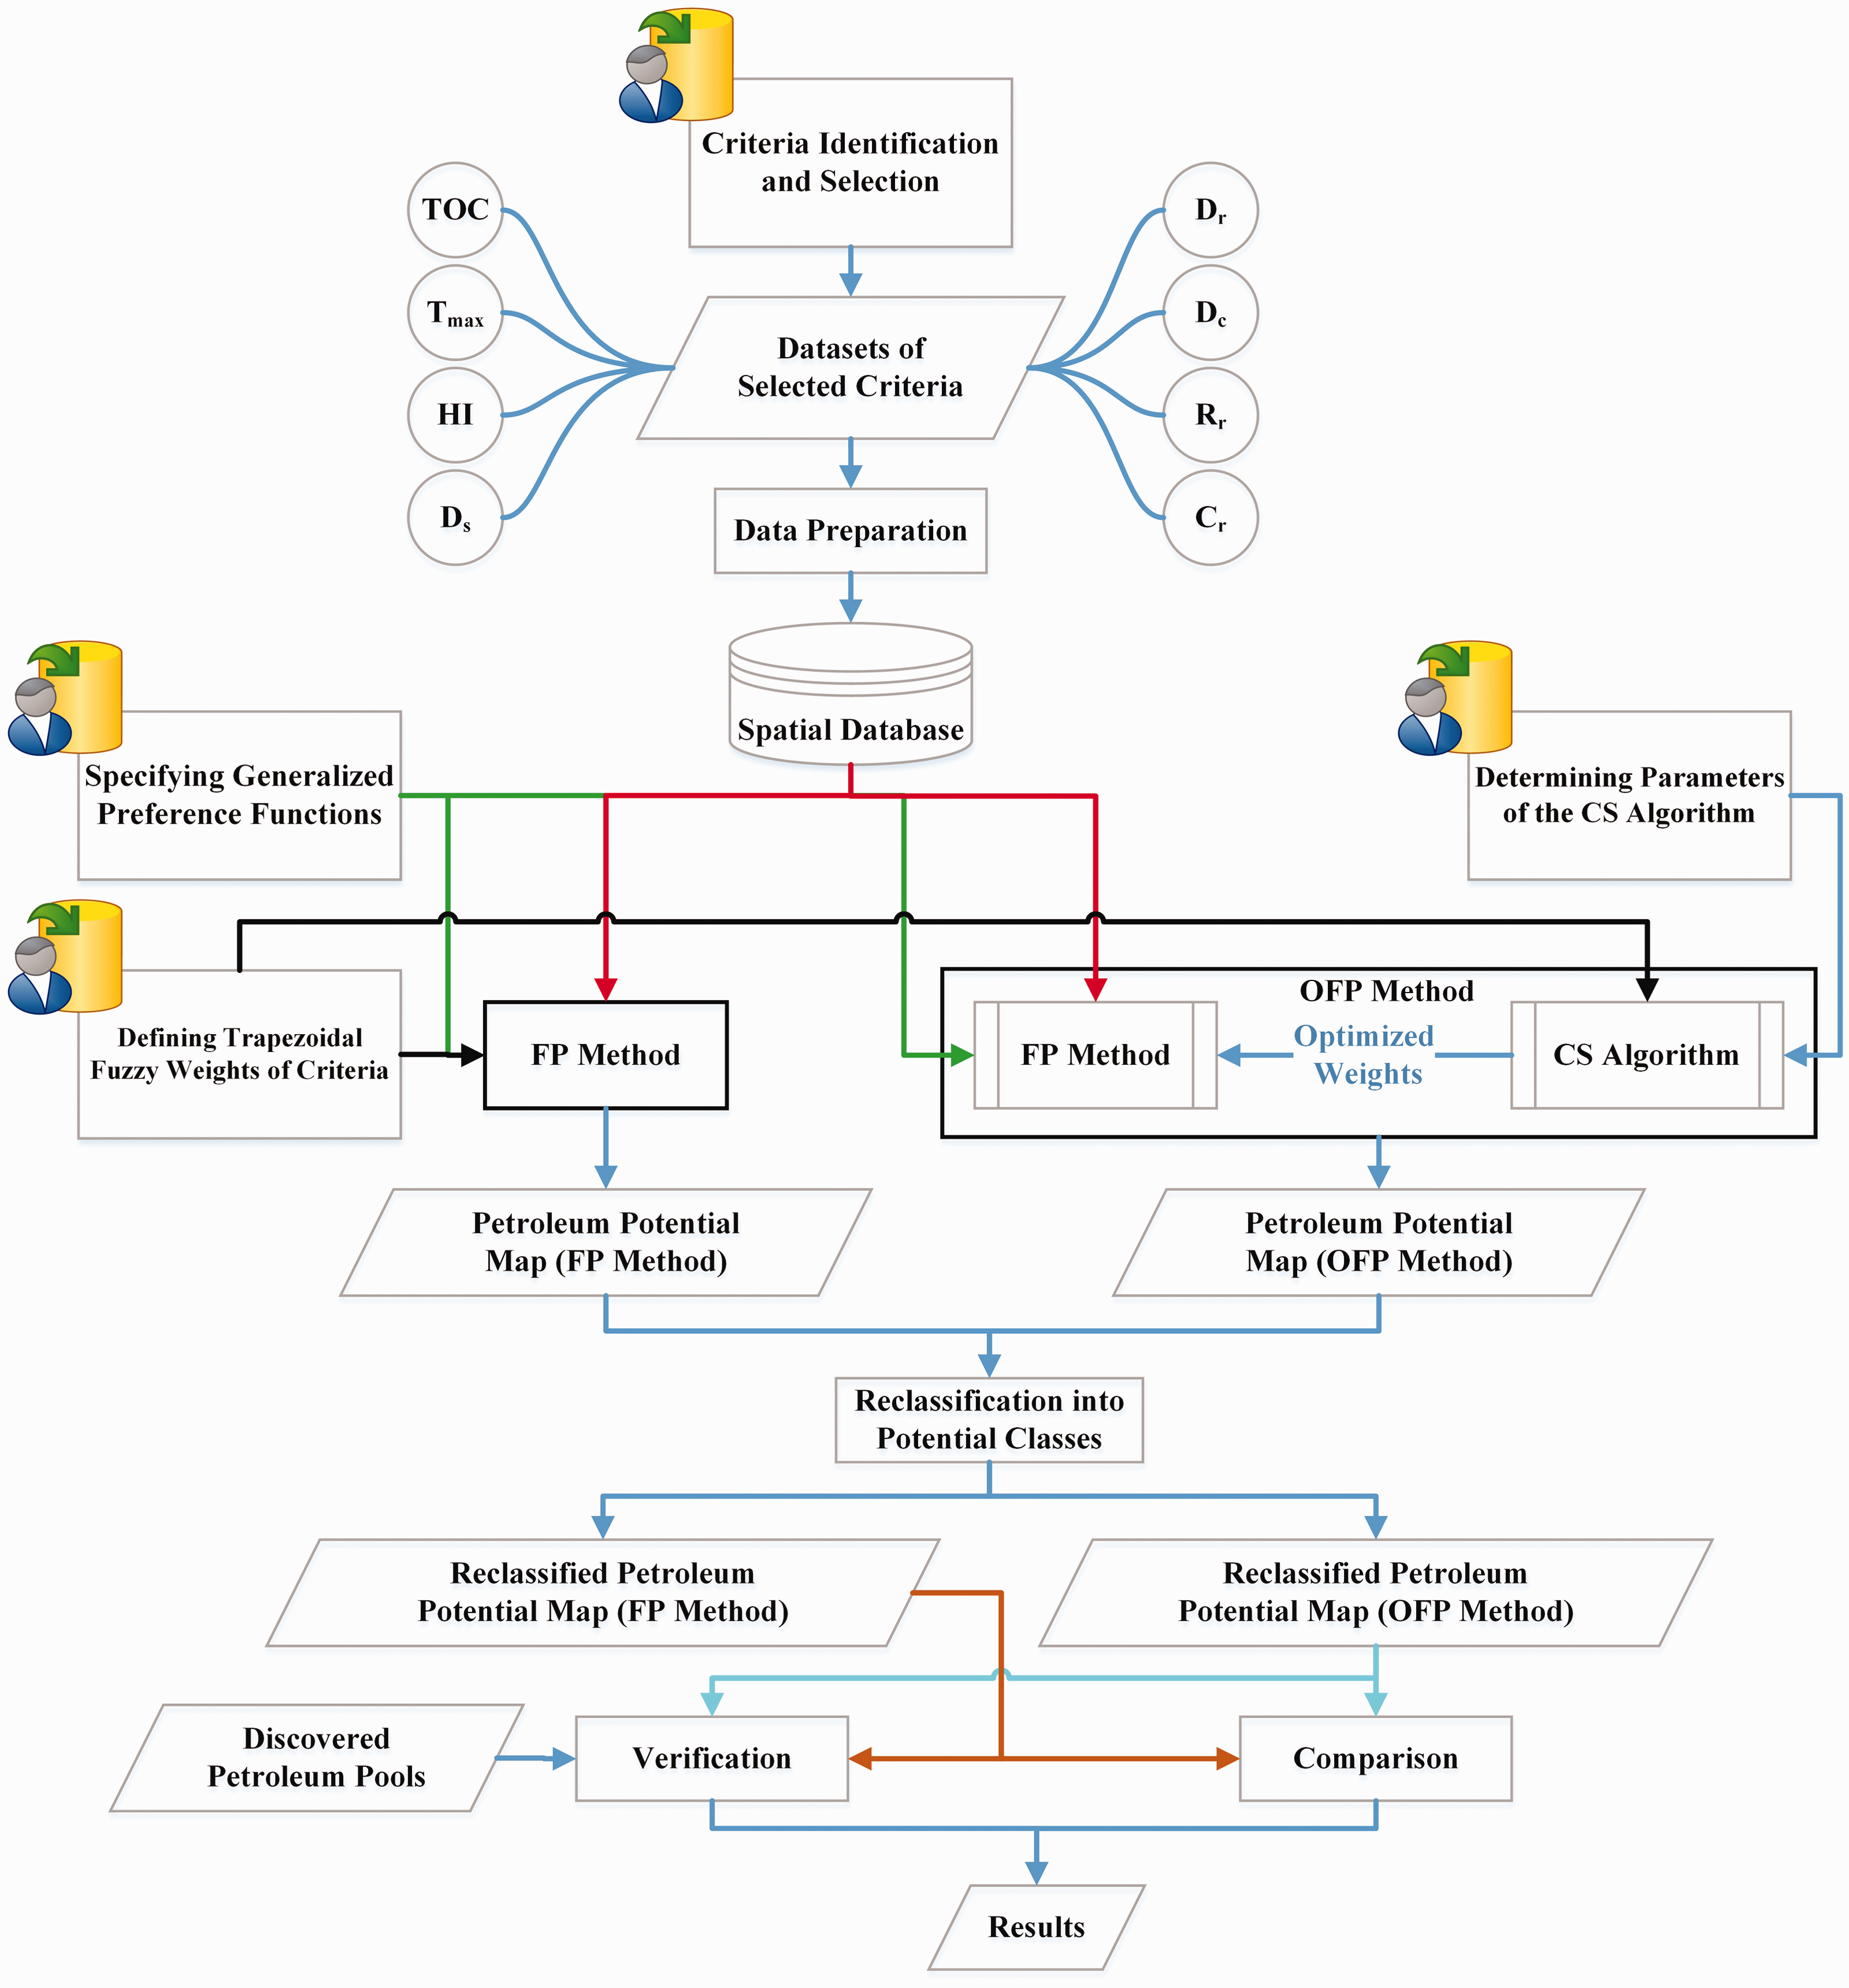
Overall flow of the proposed methodology.
PROMETHEE and FP
PROMETHEE is a subgroup of MCDM methods which was developed by Brans et al. (1984) in the 1980s. The method uses the outranking methodology to rank a finite number of alternatives in accordance with several criteria. The success of various ranking formats of PROMETHEE in different applications is attributed to its simplicity, clearness, stability and flexibility (Brans et al., 1986).
The methods of PROMETHEE family are based on a set of alternatives
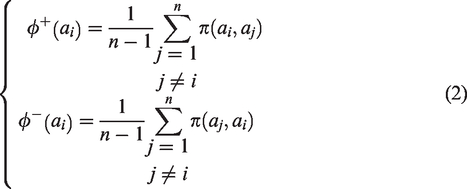
If a complete pre-order is necessary, a total ranking method will be used based on the net outranking flow evaluation. To obtain the net outranking flow, the positive outranking flow is subtracted from the negative outranking flow

The higher the net outranking flow
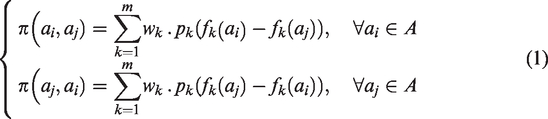
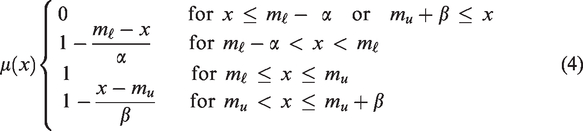
The PROMETHEE methods were extended by Goumas and Lygerou (2000) to deal with fuzzy input data along with crisp weights. Further enhancements were made by Geldermann et al. (2000) using fuzzy preferences and weights. They proposed the use of TF numbers to represent the uncertainties. This approximation seems to be sufficient and comprehensible for decision makers (Rommelfanger, 1988). Using TF numbers offers a particular advantage: it allows to represent an interval, a triangular fuzzy number and a specific value by a specific TF number (Zhang et al., 2009). The membership function for the TF intervals (Dubois and Prade, 1980; Rommelfanger, 1988, 1996) can be formulated as
Step 1: A generalized preference function Step 2: A vector which contains the TF weights is defined.
Step 3: The fuzzy outranking-relation

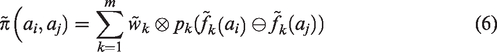
with

The preference degrees are then multiplied by the weight of each criterion. Accordingly, the fuzzy outranking-relation Step 4: The fuzzy positive and negative outranking flows are calculated for each alternative Step 5: Finally, the fuzzy scores are combined and the results are defuzzified and compared/ranked (Geldermann et al., 2000).

The CS algorithm
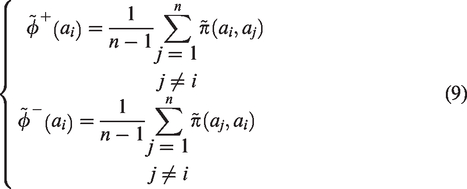
The CS is a metaheuristic optimization method which was developed by Yang and Deb (2009). The idea of the method is based on the brooding parasitism of some cuckoo species (Fister et al., 2014; Yang and Deb, 2014). The explorative random walk (global search) and exploitative random walk (local search) are the search capabilities of the CS algorithm, which are both controlled by a switching/discovery probability ( One egg (a set of solution co-ordinates) is laid randomly in other bird species’ nests by each cuckoo at a time; The nests with high-quality eggs, or solutions, are carried forward to the next generation; The number of host nests available for laying is fixed. A host bird can discover the alien egg with a probability
According to the above rules, the CS algorithm can be summarized in the following steps (Figure 2).
Pseudocode of the CS algorithm.
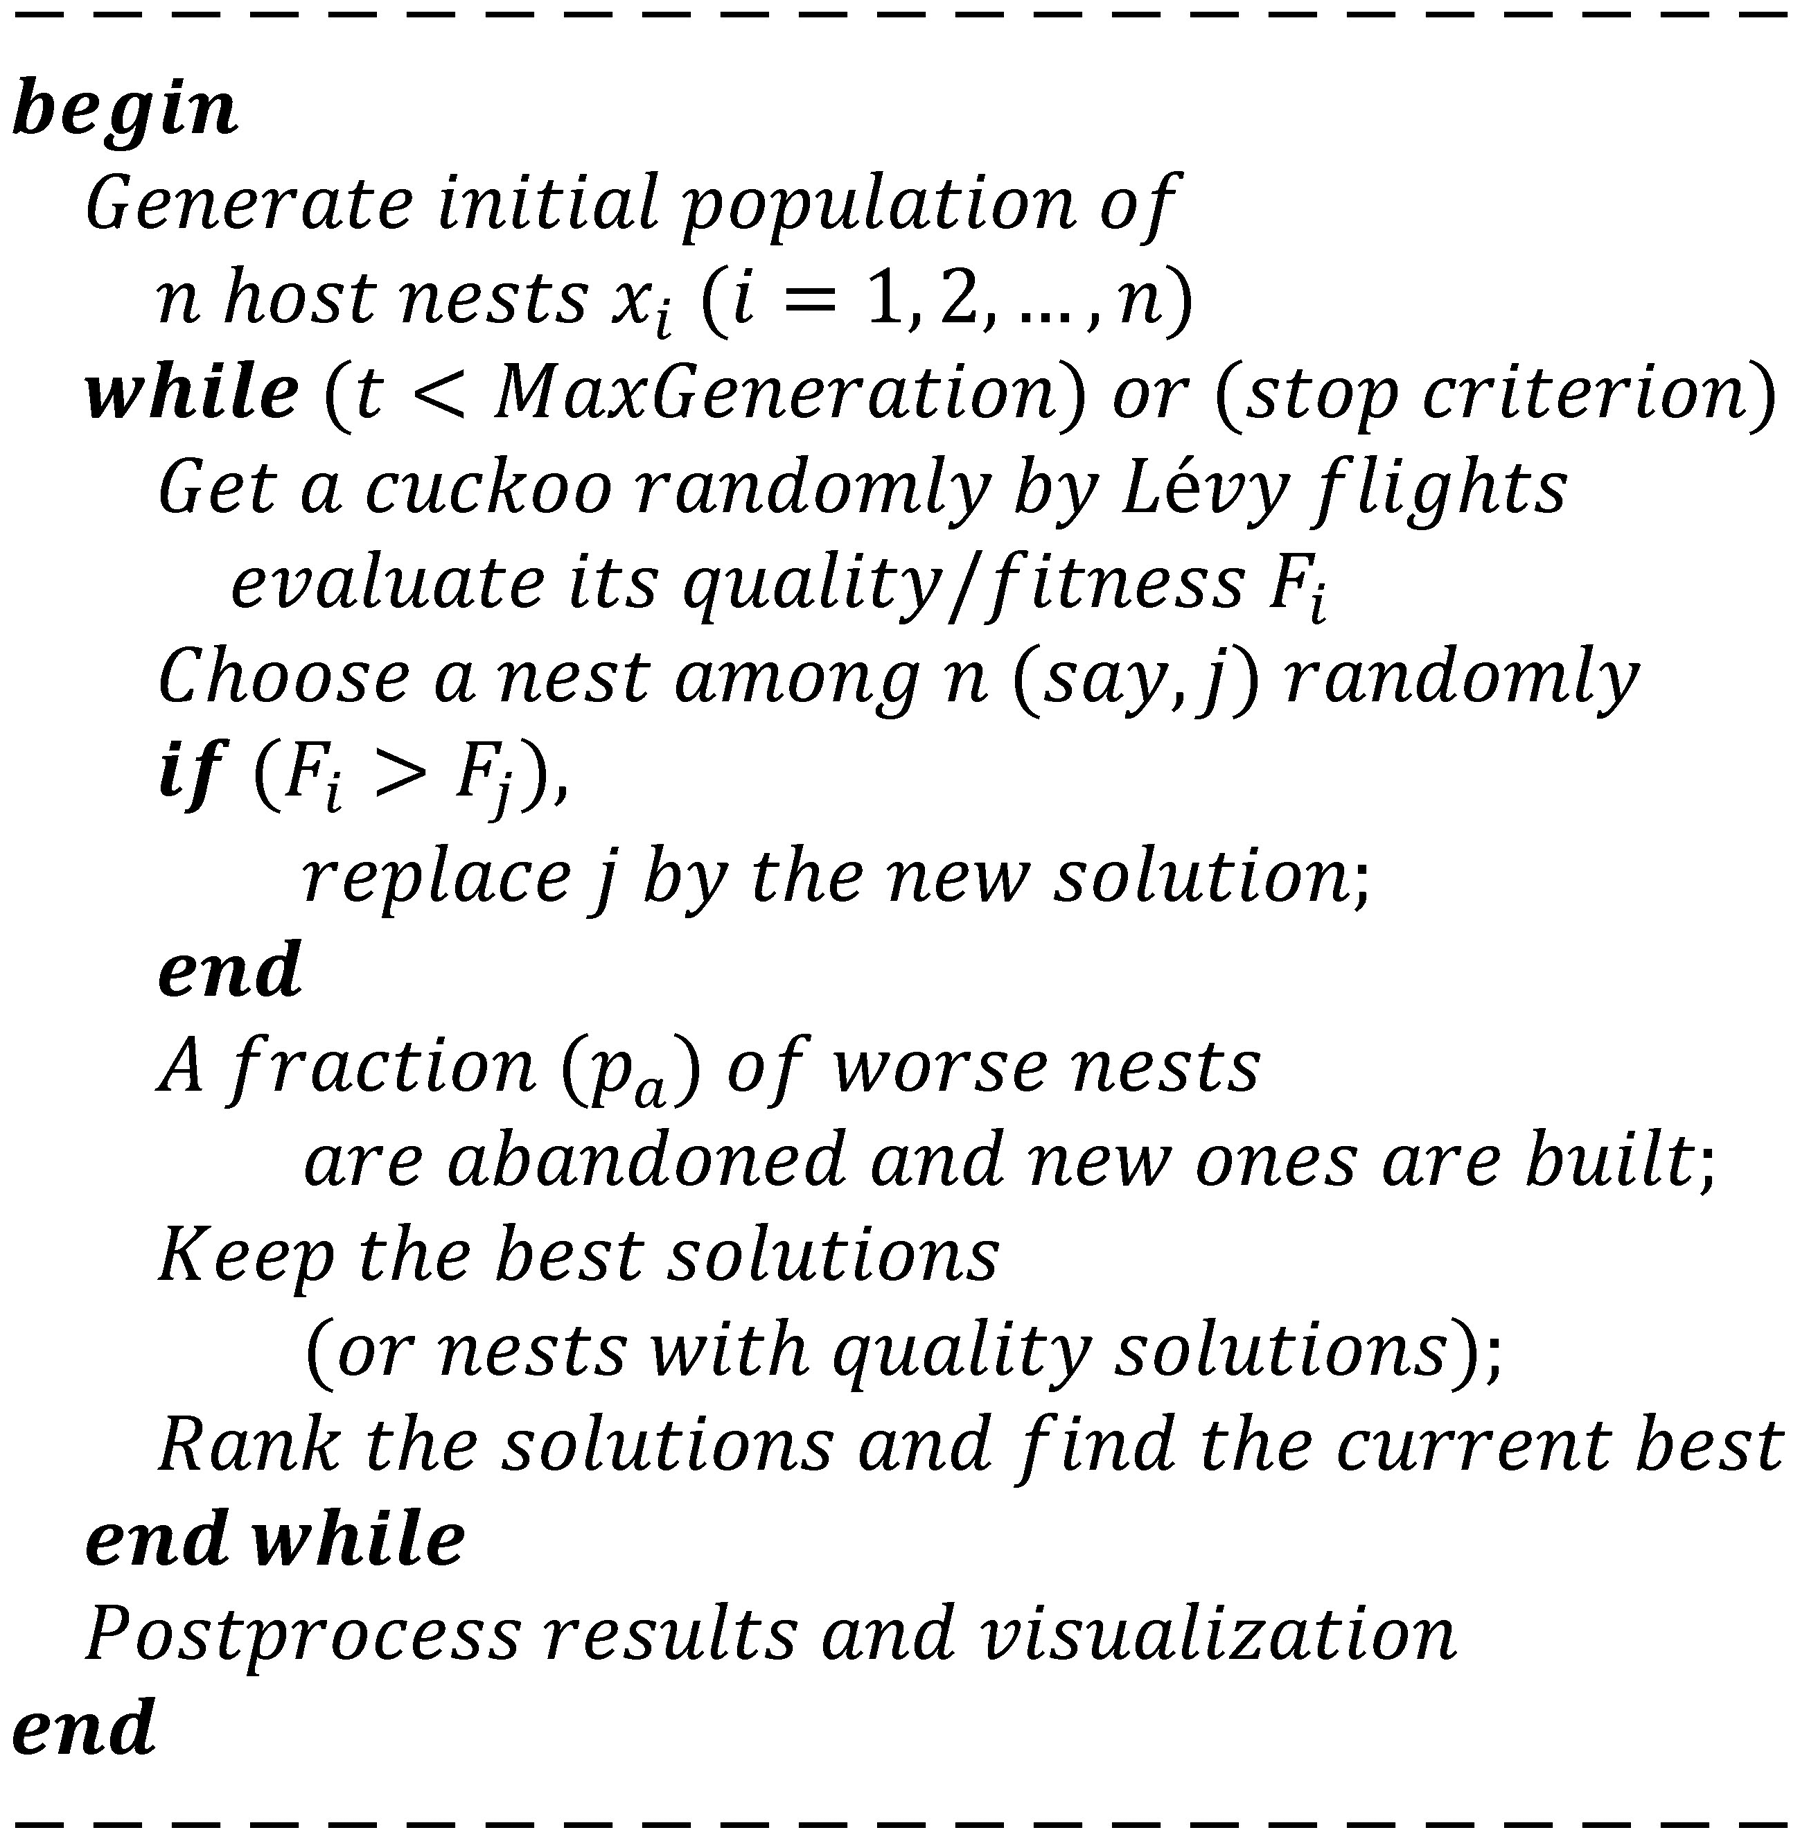
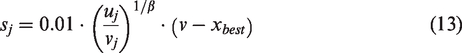
In CS, a pattern (i.e. solution) is associated with a host nest. Every pattern has individual attributes, each of which corresponds to a cuckoo egg (Hanoun et al., 2012). Lévy flights are used to carry out the global random walk as follows


Before starting iterative search process, the most successful pattern is detected as
After defining the donor vector

The fitness of the random pattern is evaluated by the CS algorithm. The

Location and geology
The Williston Basin is a roughly circular, indistinctly bounded, shallow depression on the North American Craton that contains numerous oil-rich formations (Gerhard et al., 1990; Heck et al., 2002; Ruzyla and Friedman, 1985). It covers approximately 300,000 square miles (Pollastro et al., 2013) across two provinces (Manitoba and Saskatchewan) in Canada and three states (Montana, North and South Dakota) in the United States. To the northwest, the basin is separated from the Alberta Basin by the Sweetgrass Arch and the Bow Island Arch; to the south, by the Transcontinental Arch and Black Hills Uplift; and, to the north and east, by the Canadian Shield (Flannery, 2006; Hitchon, 1996). Figure 3 shows the extent of the Williston Basin with the major geologic elements that bound it.
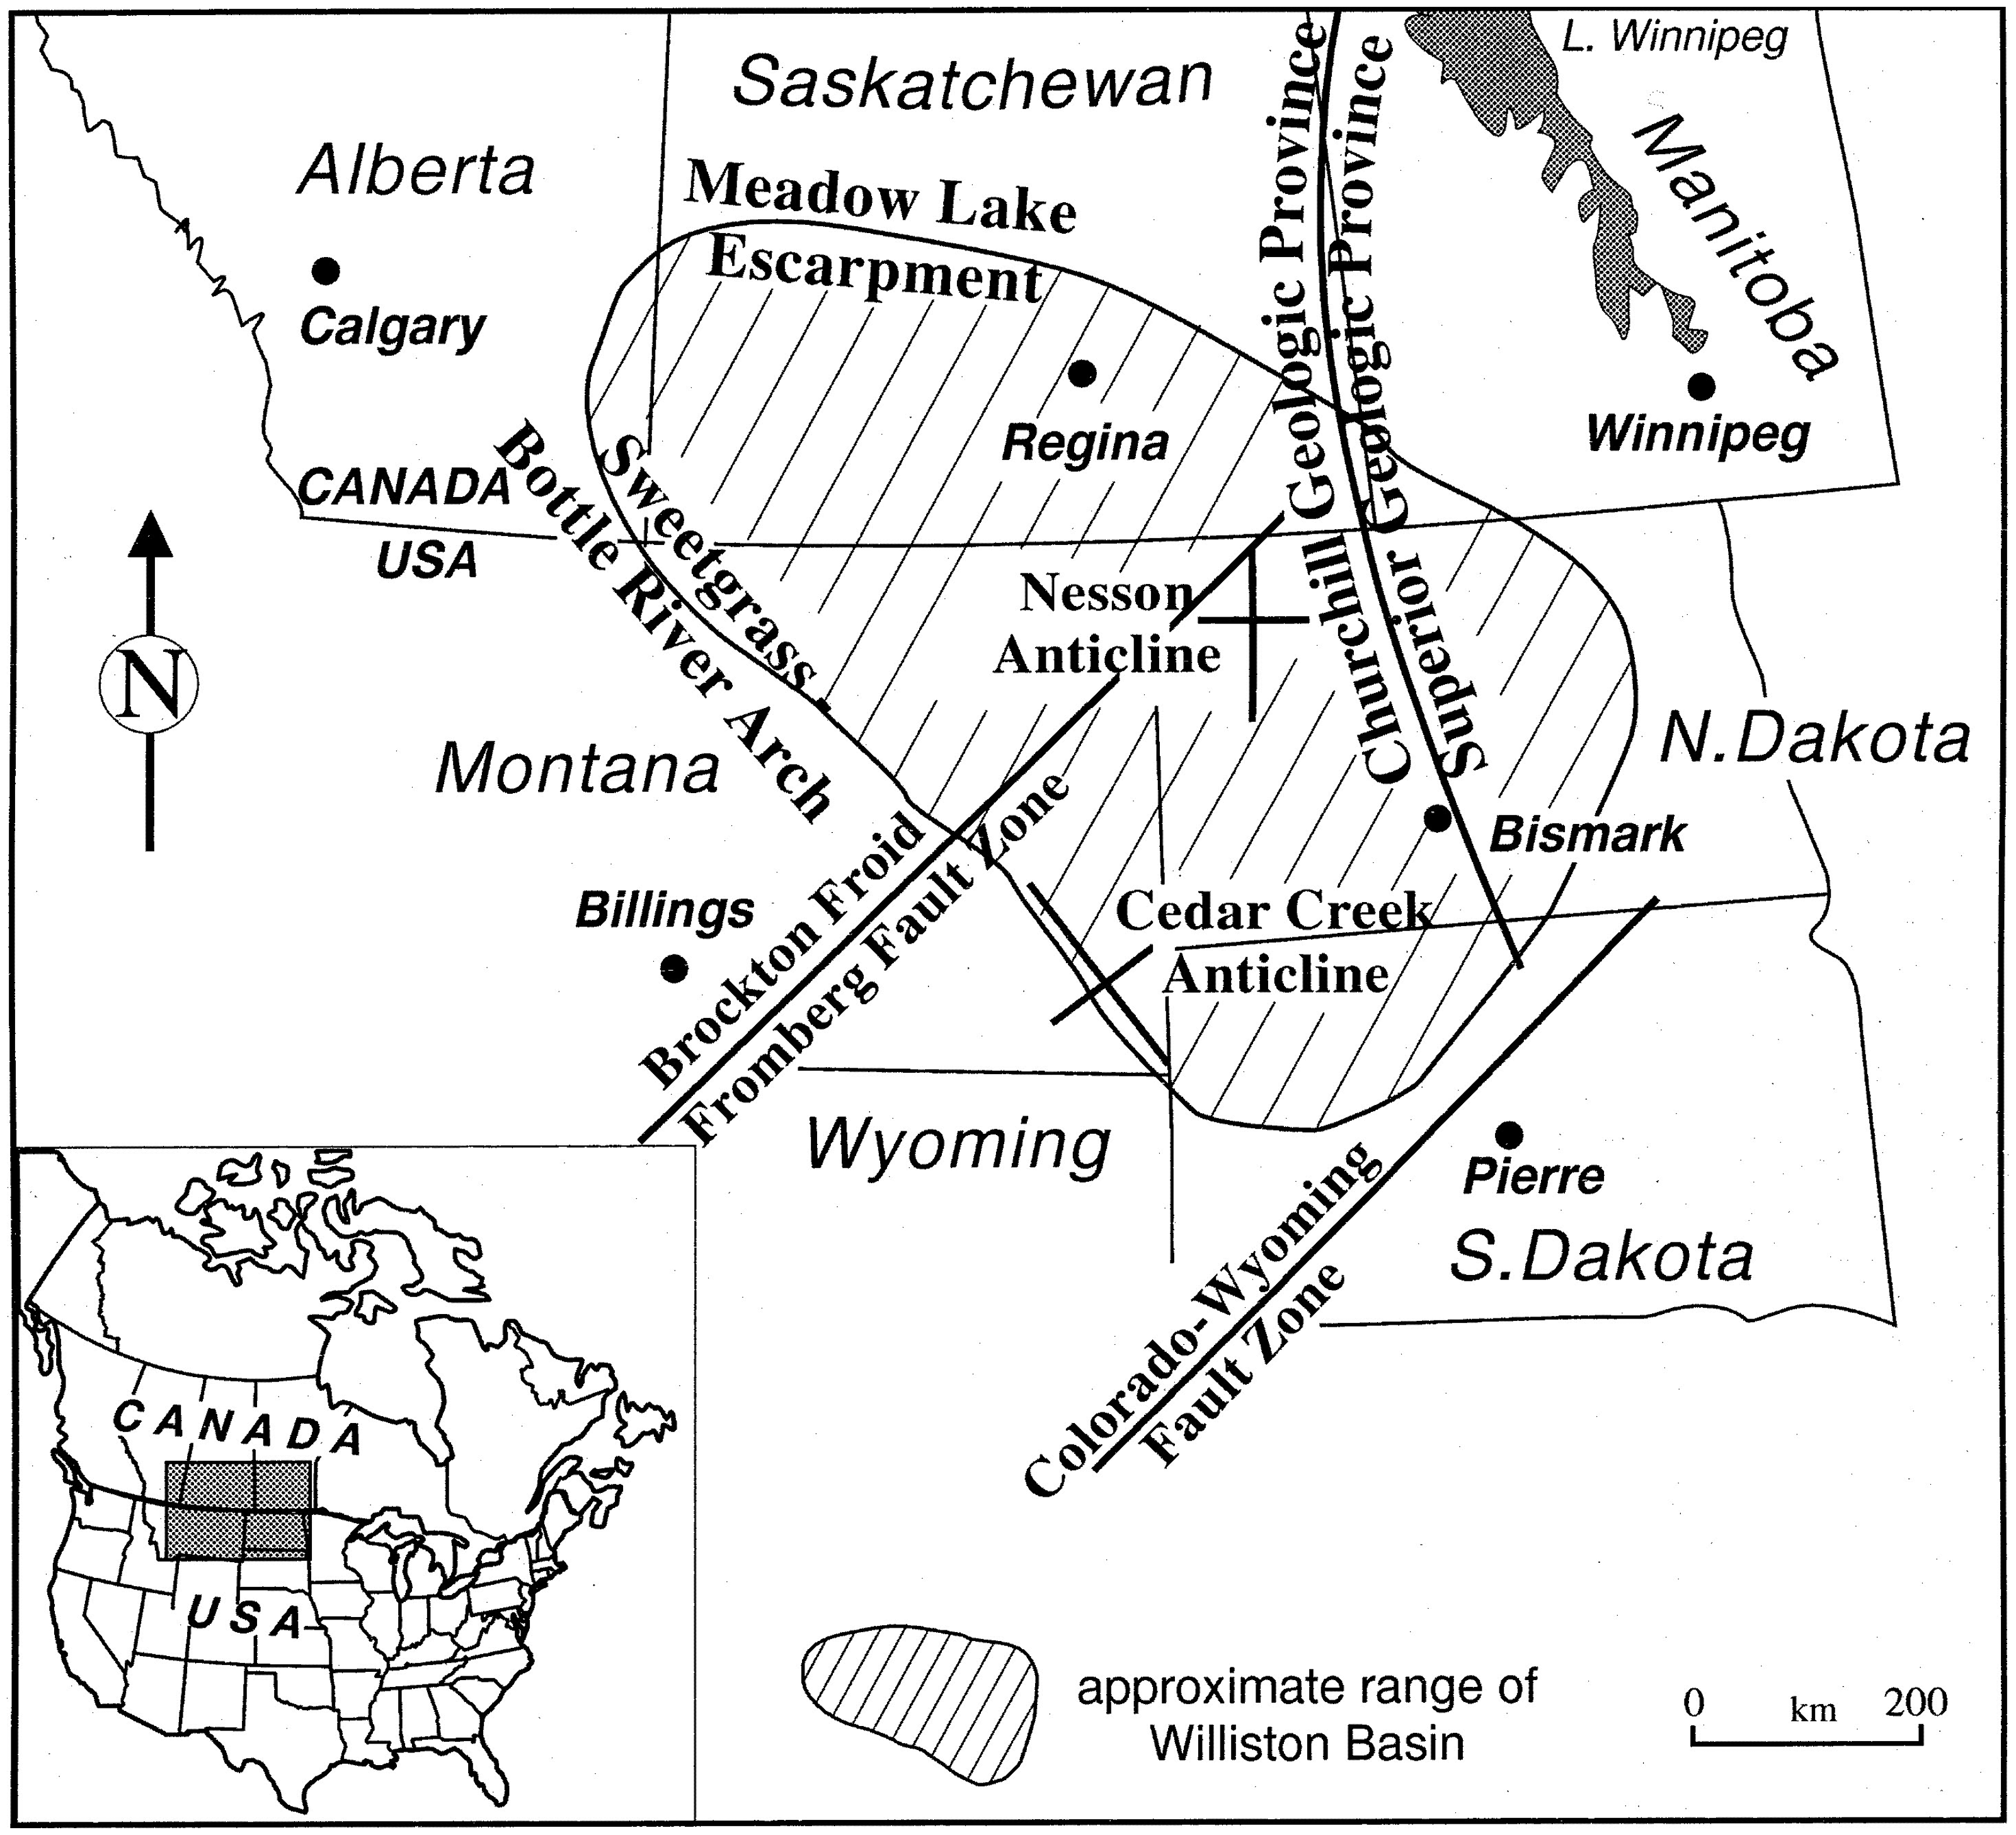
Location map showing the main structural elements of the Williston Basin (Obermajer et al., 2000).
The petroleum system concept in the Williston Basin was first applied by Williams (1974) and Dow (1974) who detailed three petroleum systems, and recent studies have expanded the number to nine including the Red River, Winnipegosis, Bakken, Madison, Tyler, Winnipeg, Duperow, Birdbear and Deadwood (Lillis, 2013). In this study, we focused on the Red River petroleum system because it is a self-sourced and highly prolific system with significant remaining exploration potential (Nesheim, 2017).
The Red River strata are Ordovician in age and consist of three brining-upward cycles. The lowest cycle is the interval of interest in this study. The Yeoman Formation rests disconformably or unconformably on the Winnipeg or Deadwood Formations within the cycle. The Yeoman Formation is made up of dolomitized to undolomitized, burrow-mottled to unmottled lime mudstones and wackestones (Kreis and Kent, 2000). The lower two-thirds of the Yeoman Formation lack sufficient porosity and permeability to be considered a good reservoir unit. The uppermost third, which is known as the Upper Yeoman, is strongly mottled, sufficiently porous and permeable to form good quality reservoirs (Kendall, 1976; Kreis and Kent, 2000; Pu et al., 2003). Furthermore, the thin, commonly laminated, organic-rich interbeds (kerogenite or kukersite) within the Upper Yeoman are identified as the main source of petroleum in Red River reservoirs throughout the Williston Basin (Derby and Kilpatrick, 1985).
In the Red River petroleum system, hydrocarbons have mostly accumulated in structural traps with stratigraphic enhancement (Husinec, 2016). Drilling and seismic investigations indicate that most of the Red River pools are associated with small, low-relief, anticlinal structures formed by compactional drapes of the Red River strata over Precambrian paleohighs (Pu et al., 2003).
The lowest cycle of the Red River strata is sealed by the upper evaporitic unit of Lake Alma Member which is informally called Lake Alma anhydrite (Khan et al., 2006). Lake Alma anhydrite is composed of laminated dolomites, overlain by nodular and laminated anhydrite (El Taki and Pratt, 2009).
Criteria identification and selection
The petroleum system concept can be efficiently used in exploration and resource assessment, and provides a basis for proposing undiscovered commercial accumulations (Magoon, 1997). The petroleum system is a unifying concept that describes the dynamic, mobile formation of petroleum pools and encompasses all the essential elements and processes needed for oil and gas accumulations to exist (Magoon, 1999; Perrodon, 1992). The essential elements of a petroleum system include the source rock, reservoir rock, seal rock and overburden rock. Trap formation and the generation-migration-accumulation of petroleum are the processes. These interdependent elements and processes must be correctly placed in space and time so that organic matter contained in the source rock can be converted into oil and gas accumulations (Magoon and Dow, 1991). In this paper, some characteristics of the Red River self-sourced petroleum system elements are employed as criteria for modeling the petroleum potential. These criteria are briefly described below.
Sedimentary rocks rich in organic matter that form oil or gas are source rocks (Hyne, 2001). Effective source rocks are generating or have generated and expelled petroleum. They satisfy three geochemical requirements, including quantity, quality and thermal maturity (Peters and Cassa, 1994).
As shown in Table 1, there are several common ways to assess each of these factors. The thickness of source rock (Ds), total organic carbon (TOC) contents and thermal maturity (Tmax) control the amount of petroleum generated and expelled from the source rock (Pitman et al., 2001). Tmax is a pyrolysis parameter which measures the degree of maturation of organic matter in rocks. It is defined as the pyrolysis temperature at which the maximum amount of hydrocarbons is released from the decomposition of kerogen (Espitalié, 1986).
(a) Generative potential (quantity) of immature source rock, (b) kerogen type and expelled products (quality) and (c) thermal maturity (Peters and Cassa, 1994).
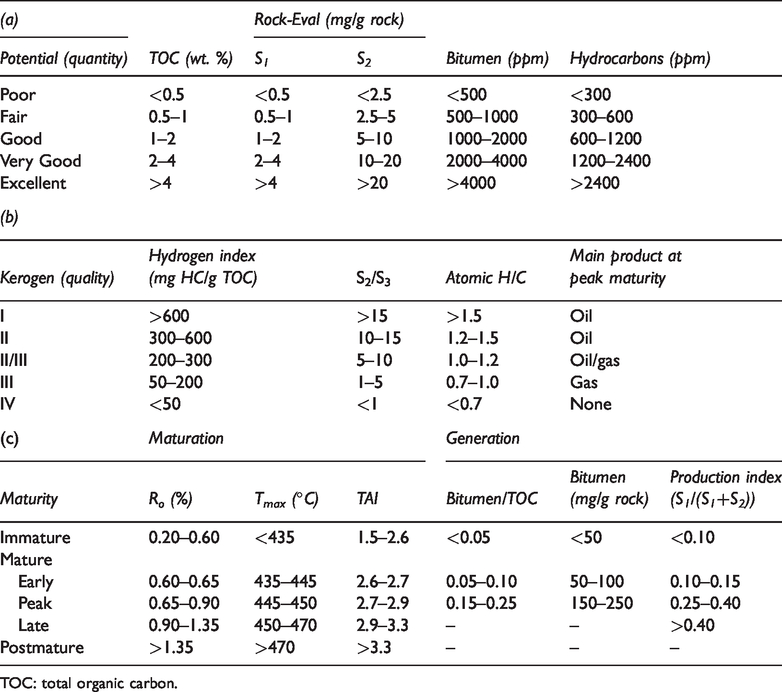
TOC: total organic carbon.
Among the quality parameters, the hydrogen index (HI) is often used in the analysis of petroleum source rocks (Pedersen et al., 1992). HI is a pyrolysis parameter which measures the quality of organic matter in a source rock (Sonnenberg, 2011). This parameter can be used for making a quick estimate of convertibility of organic matter to mobile hydrocarbons and determining the type of expelled products. For example, type I kerogen (HI of over 600 mg HC/g TOC) has up to 80% convertibility to mobile hydrocarbons, and yields a light, high-quality oil, while type III kerogen (HI of less than 150 mg HC/g TOC) with a convertibility of less than 40% generates mostly gas, plus varying amounts of waxy oil (Hallett, 2002). In this study, TOC, Tmax, Ds and HI were selected as criteria for assessing the potential of the source rock.
A reservoir is a body of underground rock having sufficient porosity and permeability to store and transmit oil, water and gas (Speight, 2013). The most common reservoir rocks are sedimentary rocks, because on the one hand, they have generally higher porosity and permeability than igneous and metamorphic rocks, and on the other hand, they form under temperature conditions at which hydrocarbons may be preserved (Max et al., 2013). The thickness of reservoir rock (Dr) and depth to reservoir are two of the hydrocarbon-volume attributes that determine the volume of the hydrocarbon accumulation within the prospect (Crovell and Balay, 1994). Unlike thickness of reservoir rock, there is no clear relationship between reservoir depth and potential of reservoir rock. Therefore, in the absence of porosity and permeability data, only Dr was considered as criterion for the evaluation of the reservoir rock potential.
A trap is a geometrical configuration of rocks in which hydrocarbons can accumulate (Bradley and Powley, 1994). It must be sealed by a relatively impermeable geologic formation to stop upward migration of the hydrocarbons. There are two basic types of traps: structural traps which are the result of strata deformation by tectonic movements and stratigraphic traps where impervious strata seal the reservoir (Gudmestad et al., 2010; Jahn et al., 2008). The trapping potential of structures is indirectly related to roughness (Rr) and curvature (Cr) of reservoir top surface (Arab Amiri et al., 2015a; Dolson, 2016; Ericsson et al., 1998). Since traps are predominantly structural in the Red River petroleum system (Husinec, 2016), Rr and Cr were adopted as the criteria to assess the potential of traps formed by faults and anticlinal folds, respectively.
The cap rock is a low-permeable or impermeable lithologic unit that prevents the escape of hydrocarbons from the underground reservoir. Good cap rocks should be impervious, forming a barrier around and above the reservoir rock. Extension and thickness of cap rock (Dc) are other aspects to be taken into account in seal evaluation (Gudmestad et al., 2010). The low-permeable Lake Alma anhydrite extends across the entire Red River petroleum system and its sealing ability mainly depends on the thickness parameter (Khan et al., 2006). Therefore, Dc was taken into consideration in analyzing the cap rock potential.
Data preparation
The Williston Basin Targeted Geoscience Initiative database (TGI II Williston Basin Project Working Group, 2008) and the Geoscience Data Repository of Earth Sciences Sector of Natural Resources Canada are the sources of all data used in this study. The latest date of the data for Manitoba and Saskatchewan provinces of Canada at the time of compilation is 2008. Datasets required for the purpose of modeling petroleum potential were selected from the databases on the basis of the criteria outlined in the previous section. All datasets were reprojected to the Universal Transverse Mercator projection (zone 13 N and datum NAD83). Spatial operations such as clip, merge, join, etc. were subsequently used to prepare vector datasets. In the spatial domain, FP and OFP can be applied at a pixel or voxel level. Petroleum potential of the Red River petroleum system was modeled in two-dimensional space in this study, so all datasets were converted to raster data model with spatial resolution of 1000 meters which is considered to be appropriate for the scale of the source data (Hengl, 2006).
TOC, Tmax and HI values were determined by Rock-Eval pyrolysis on 183 core samples of the source rock across the study area and interpolated by the tension spline method (Figure 4(a) to (c)).
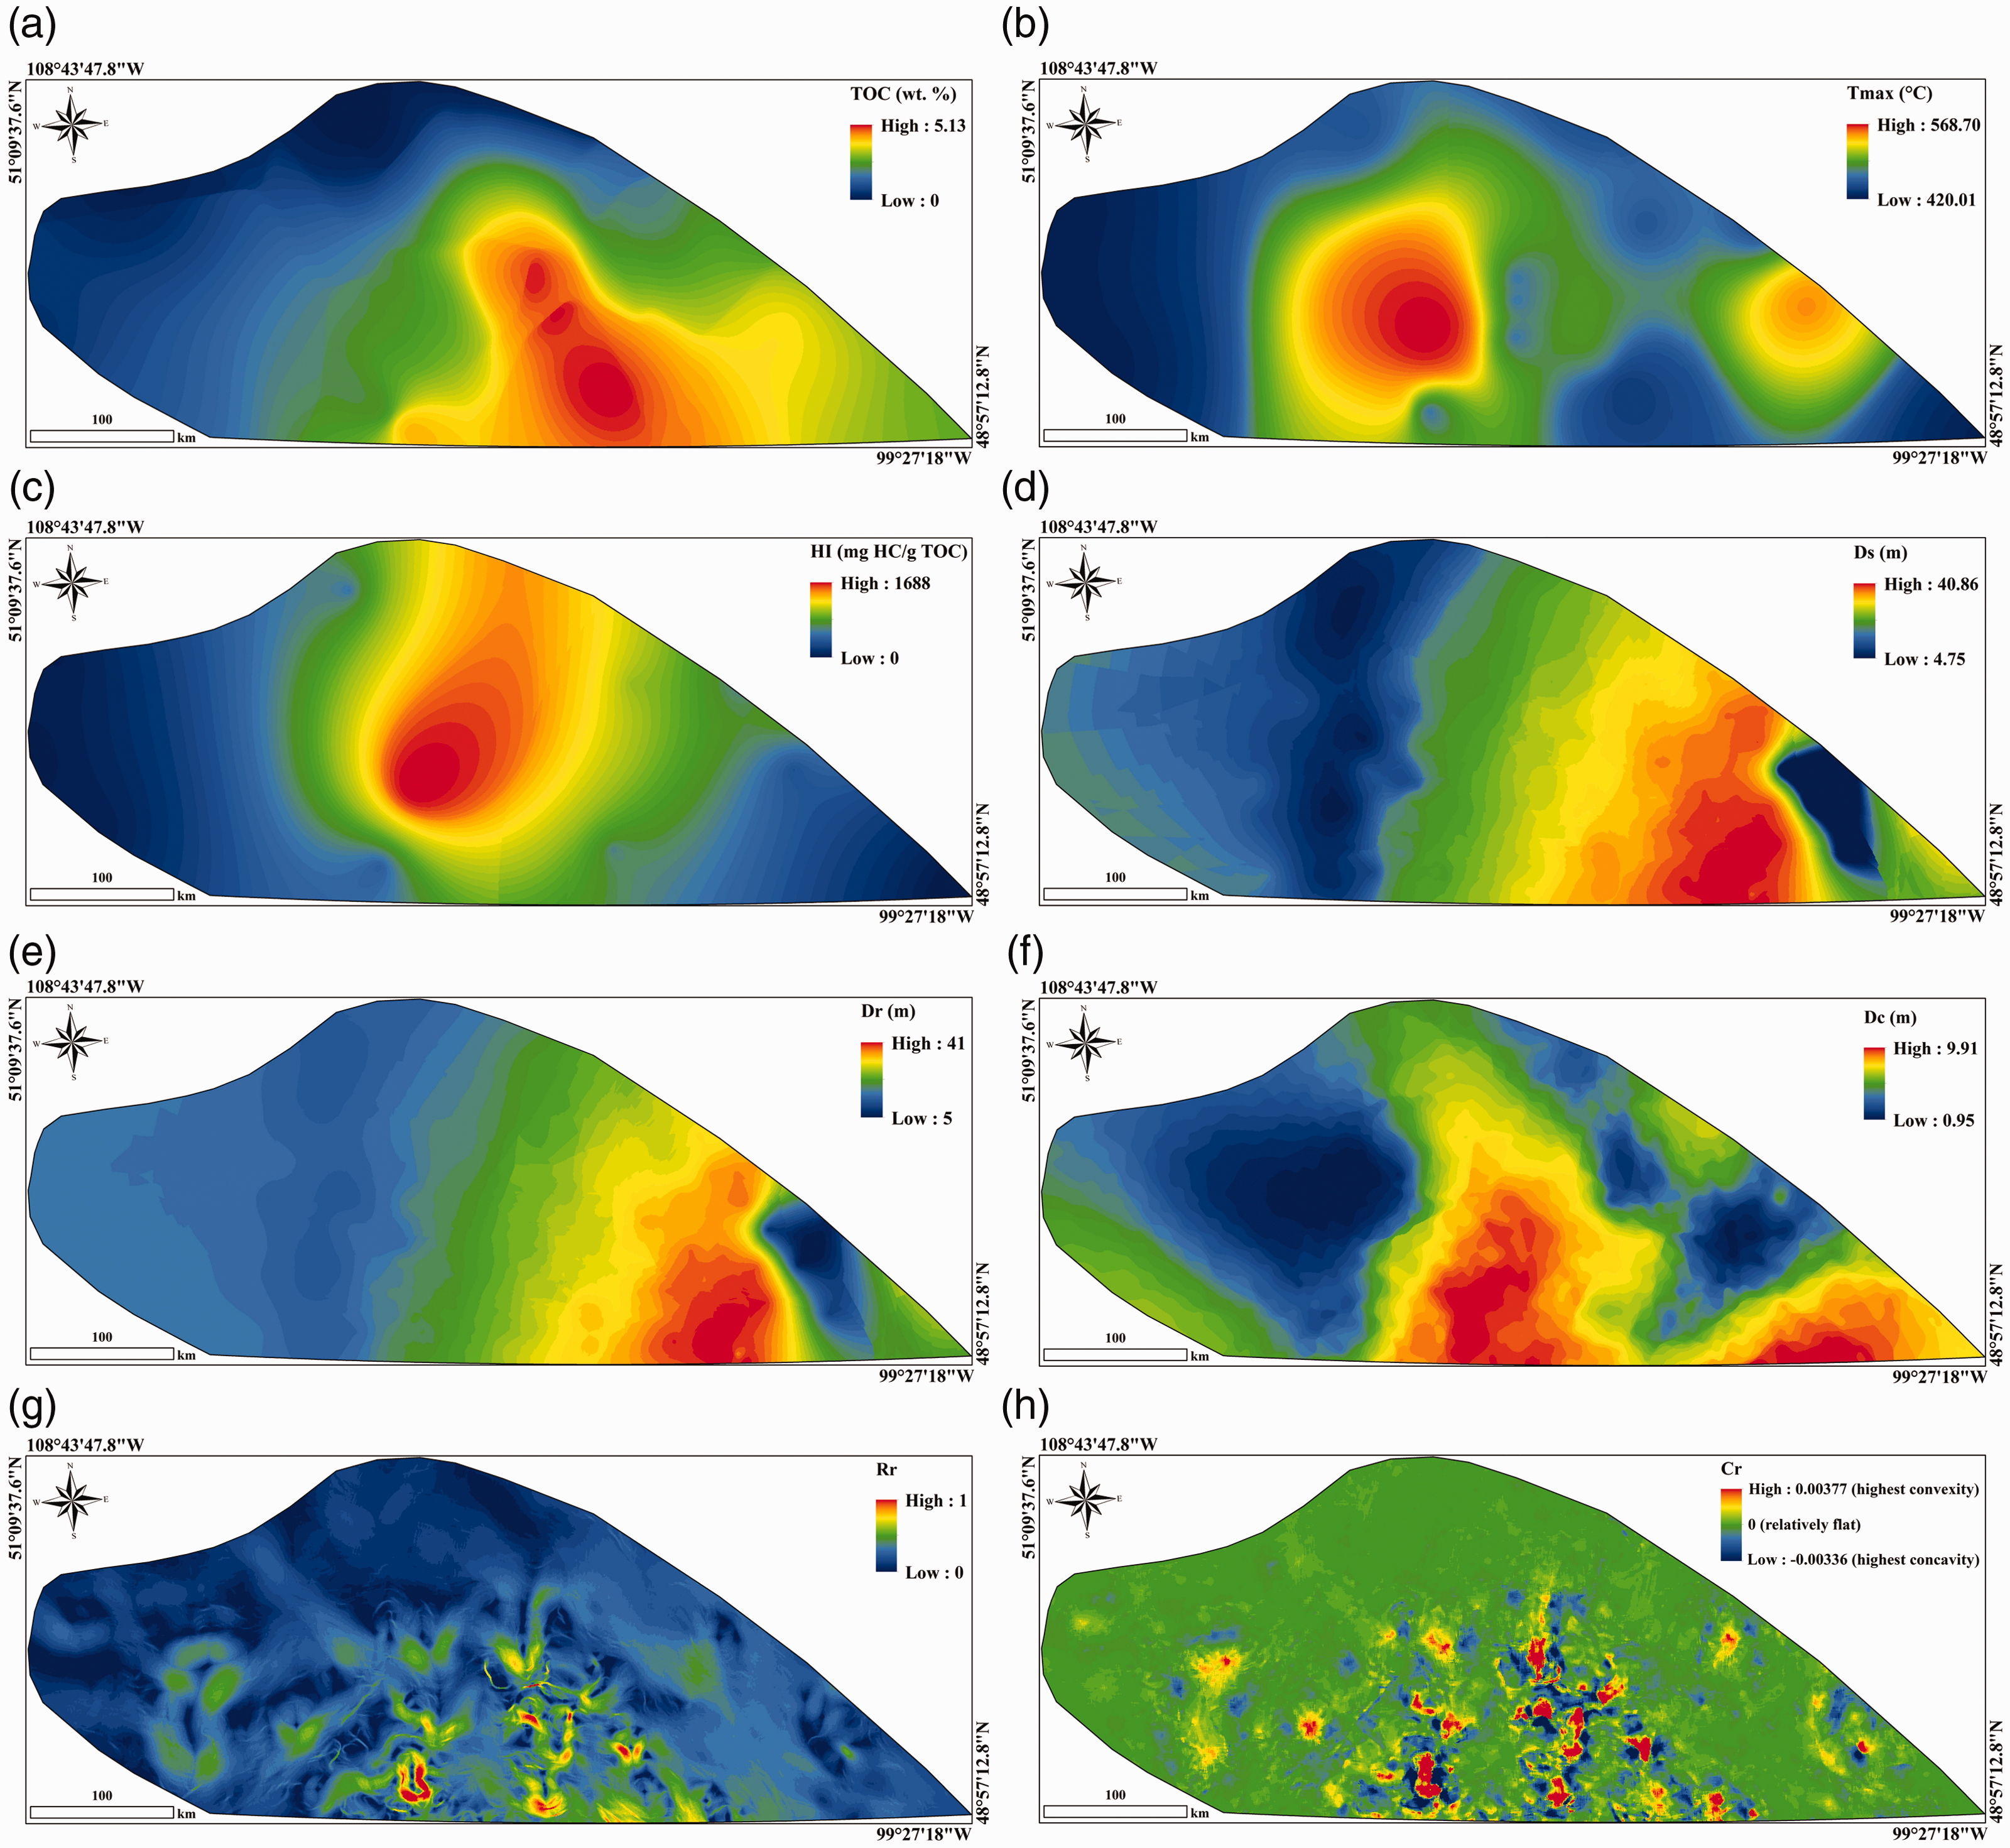
The spatial data layers used in this study: TOC (a), Tmax (b), HI (c), thickness of the source rock (d), thickness of the reservoir rock (e), thickness of the cap rock (f), roughness index (g) and curvature (h) maps.
Isopach data of the source, reservoir and cap rocks, and structure data of the reservoir rock were collected from exploratory and production wells in the northern part of the Williston Basin. The ordinary kriging method was used to rasterize the isopach and structure data. The resulting isopach grids of the Upper Yeoman, the reservoir zone of the lowest cycle of the Red River strata and the Lake Alma anhydrite were used in as Ds, Dr and Dc datasets, respectively (Figure 4(d) to (f)).
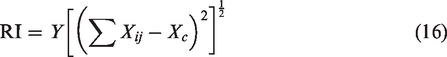
Surface roughness is the amount of elevation variability of a particular area. It can be estimated using techniques such as roughness index (RI), variograms of elevation, standard deviation of elevation, chain set measurements and fractal geometry (Stambaugh and Guyette, 2008). RI was applied to structure grid of the reservoir rock to create Rr dataset (Figure 4(g)). It simply quantifies surface heterogeneity by the following equation (Riley et al., 1999)
Furthermore, curvature of the structure grid of the reservoir rock was calculated in order to obtain Cr dataset (Figure 4(h)). Curvature is the second derivative of a surface fitted to elevation and measures the concavity or convexity of the surface at a particular pixel (Winstral et al., 2002). Thus, the curvature of structure grids can be utilized in evaluating the trapping potential.
Application and results
In order to apply FP, cell values of the eight raster datasets described in the previous section were extracted into a database table with eight fields as criteria and about 110,000 records as alternatives. In the first step, for each criterion, a generalized preference function
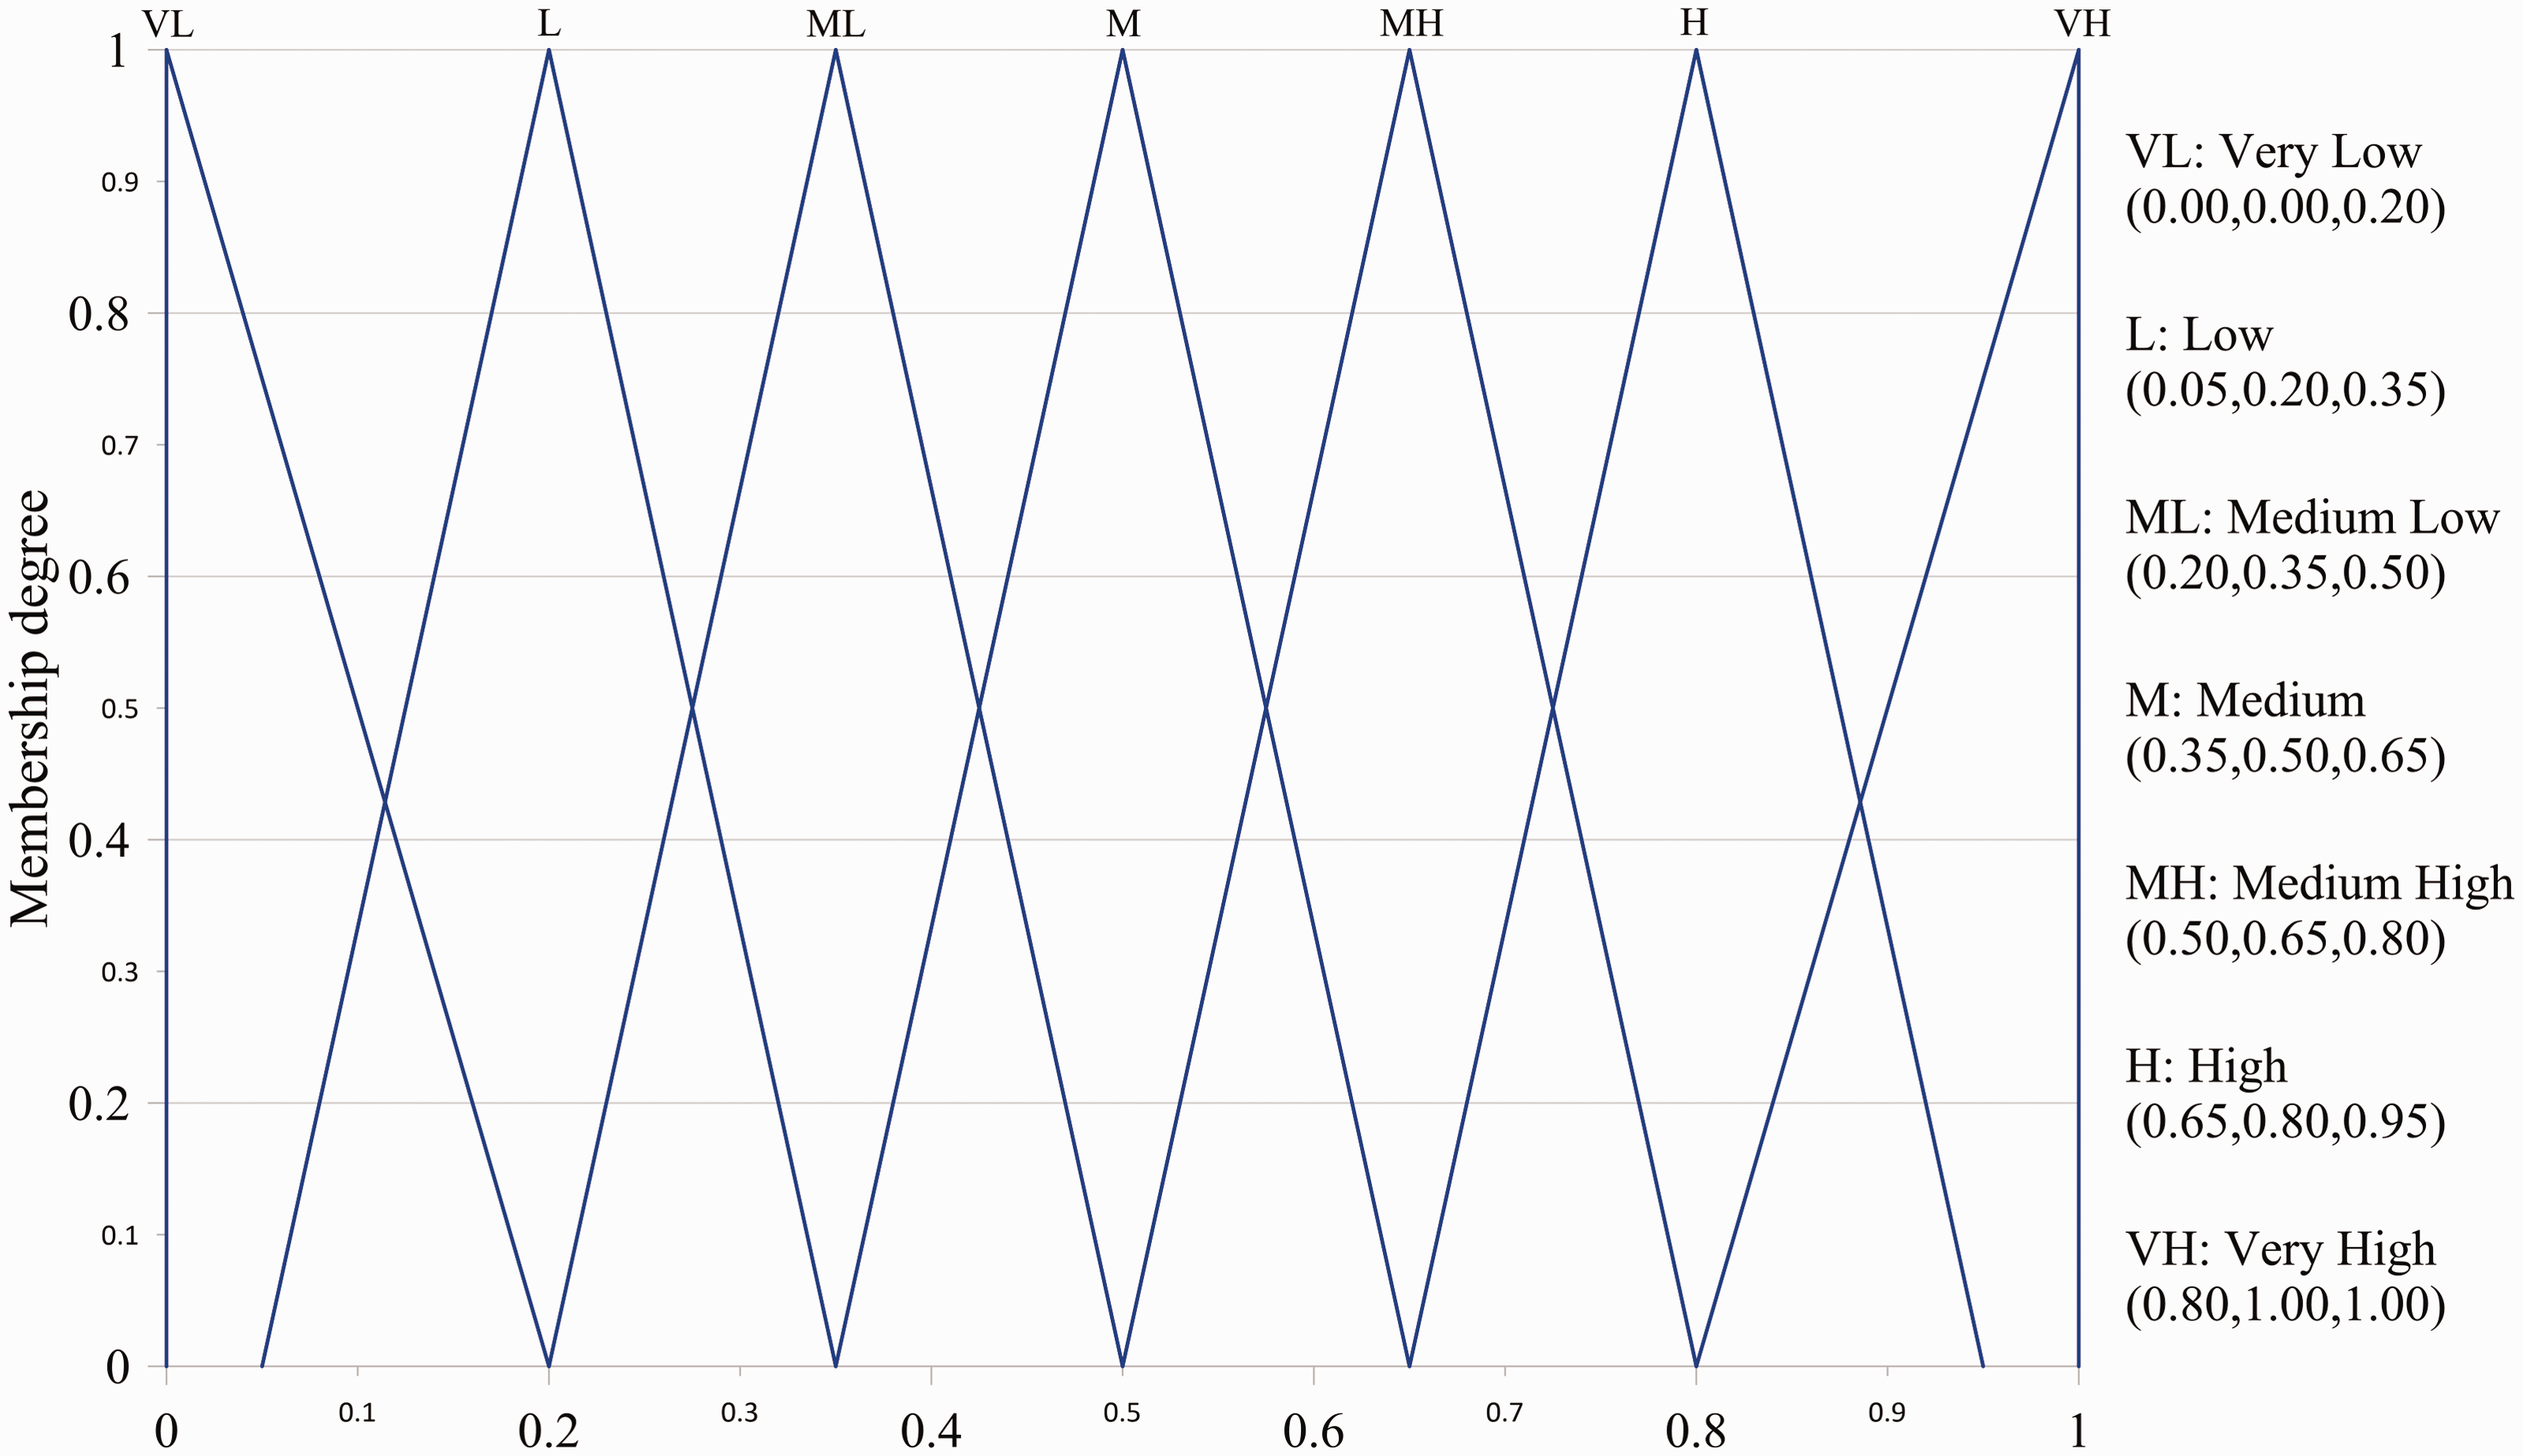
Representation of the linguistic variables as triangular fuzzy numbers.
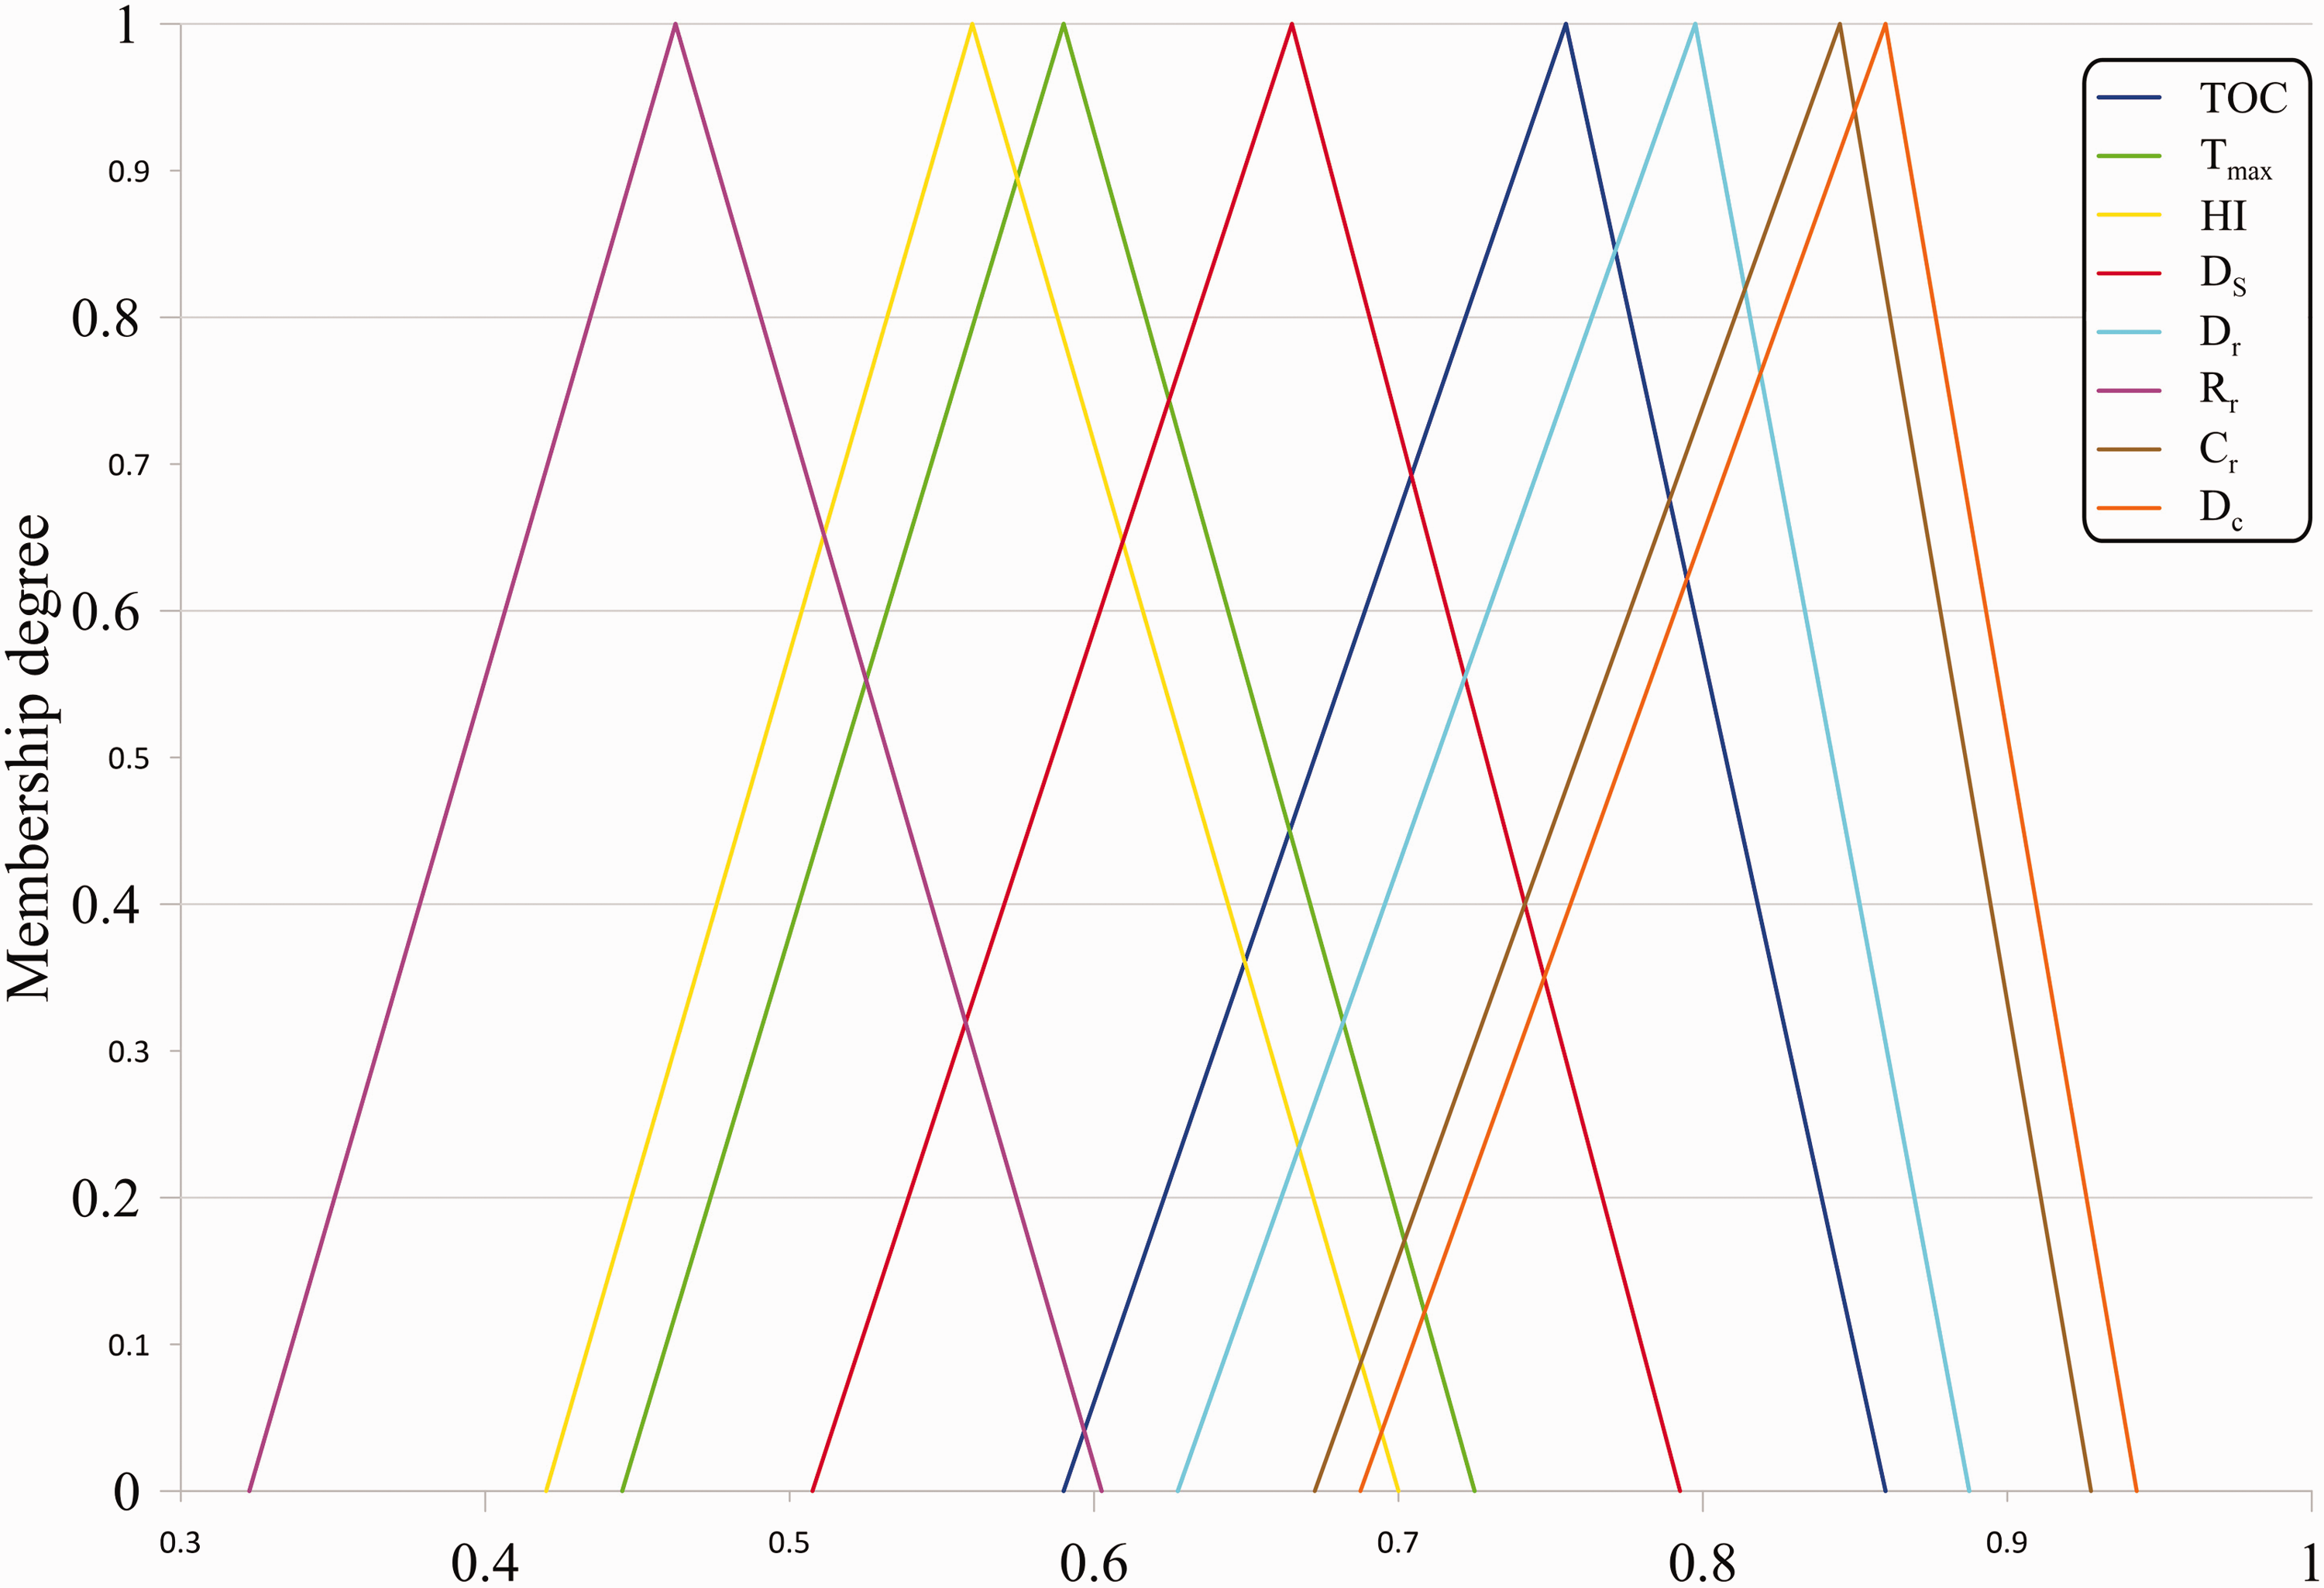
The graphical representation of aggregate weights of the criteria.
Numerous approaches have been proposed in the literature for ranking fuzzy numbers (Detyniecki and Yager, 2000; Facchinetti and Ricci, 2004; Gu and Xuan, 2017; Lee et al., 1994; Wang et al., 2006), most of which transform the fuzzy number into a real number. Among the available methods for defuzzification, the center of area (COA) method yields more reasonable and reliable results. It also makes possible a consistent evaluation of triangular/trapezoidal fuzzy data and of crisp data (Geldermann et al., 2000; Zhang et al., 2009). Therefore, the method was used to defuzzify the resulting fuzzy positive and negative outranking flows. The COA defuzzification method can be expressed mathematically as follows (Geldermann et al., 2000)

After defuzzification through the use of the COA method, net outranking flow was calculated as
The potential map of the petroleum system under study obtained from FP with experts-assigned weights.
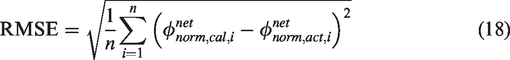
The accuracy in determining the parameters of knowledge-driven models such as FP by the experts is dependent on many factors including complexity of the research object, expert qualification, the scale of evaluation, the number of criteria to be evaluated, etc. For example, complicated models with a large number of criteria may suffer from expert-elicited values of parameters. For experts who contributed to this study, there was noticeably higher ambiguity in determining weights of the criteria than others. Therefore, the experts-assigned weights were optimized using the CS algorithm to obtain more accurate results. In order to determine the optimal values of parameters, the optimization objective function needs to be first defined. The objective function, in fact, is an indicator of agreement between actual and calculated values of the variable of interest. In this paper, RMSE was selected as the objective function to be minimized in the optimization process. The formula to calculate RMSE is
Considering that the weights of the eight criteria were defined as triangular fuzzy numbers, 24 parameters should be optimized. The algorithm parameters, including the number of host nests and the maximum number of iterations, were set to 50 and 3000, respectively, to ensure a fair evaluation. Following Yang and Deb (2009), the mutation probability value
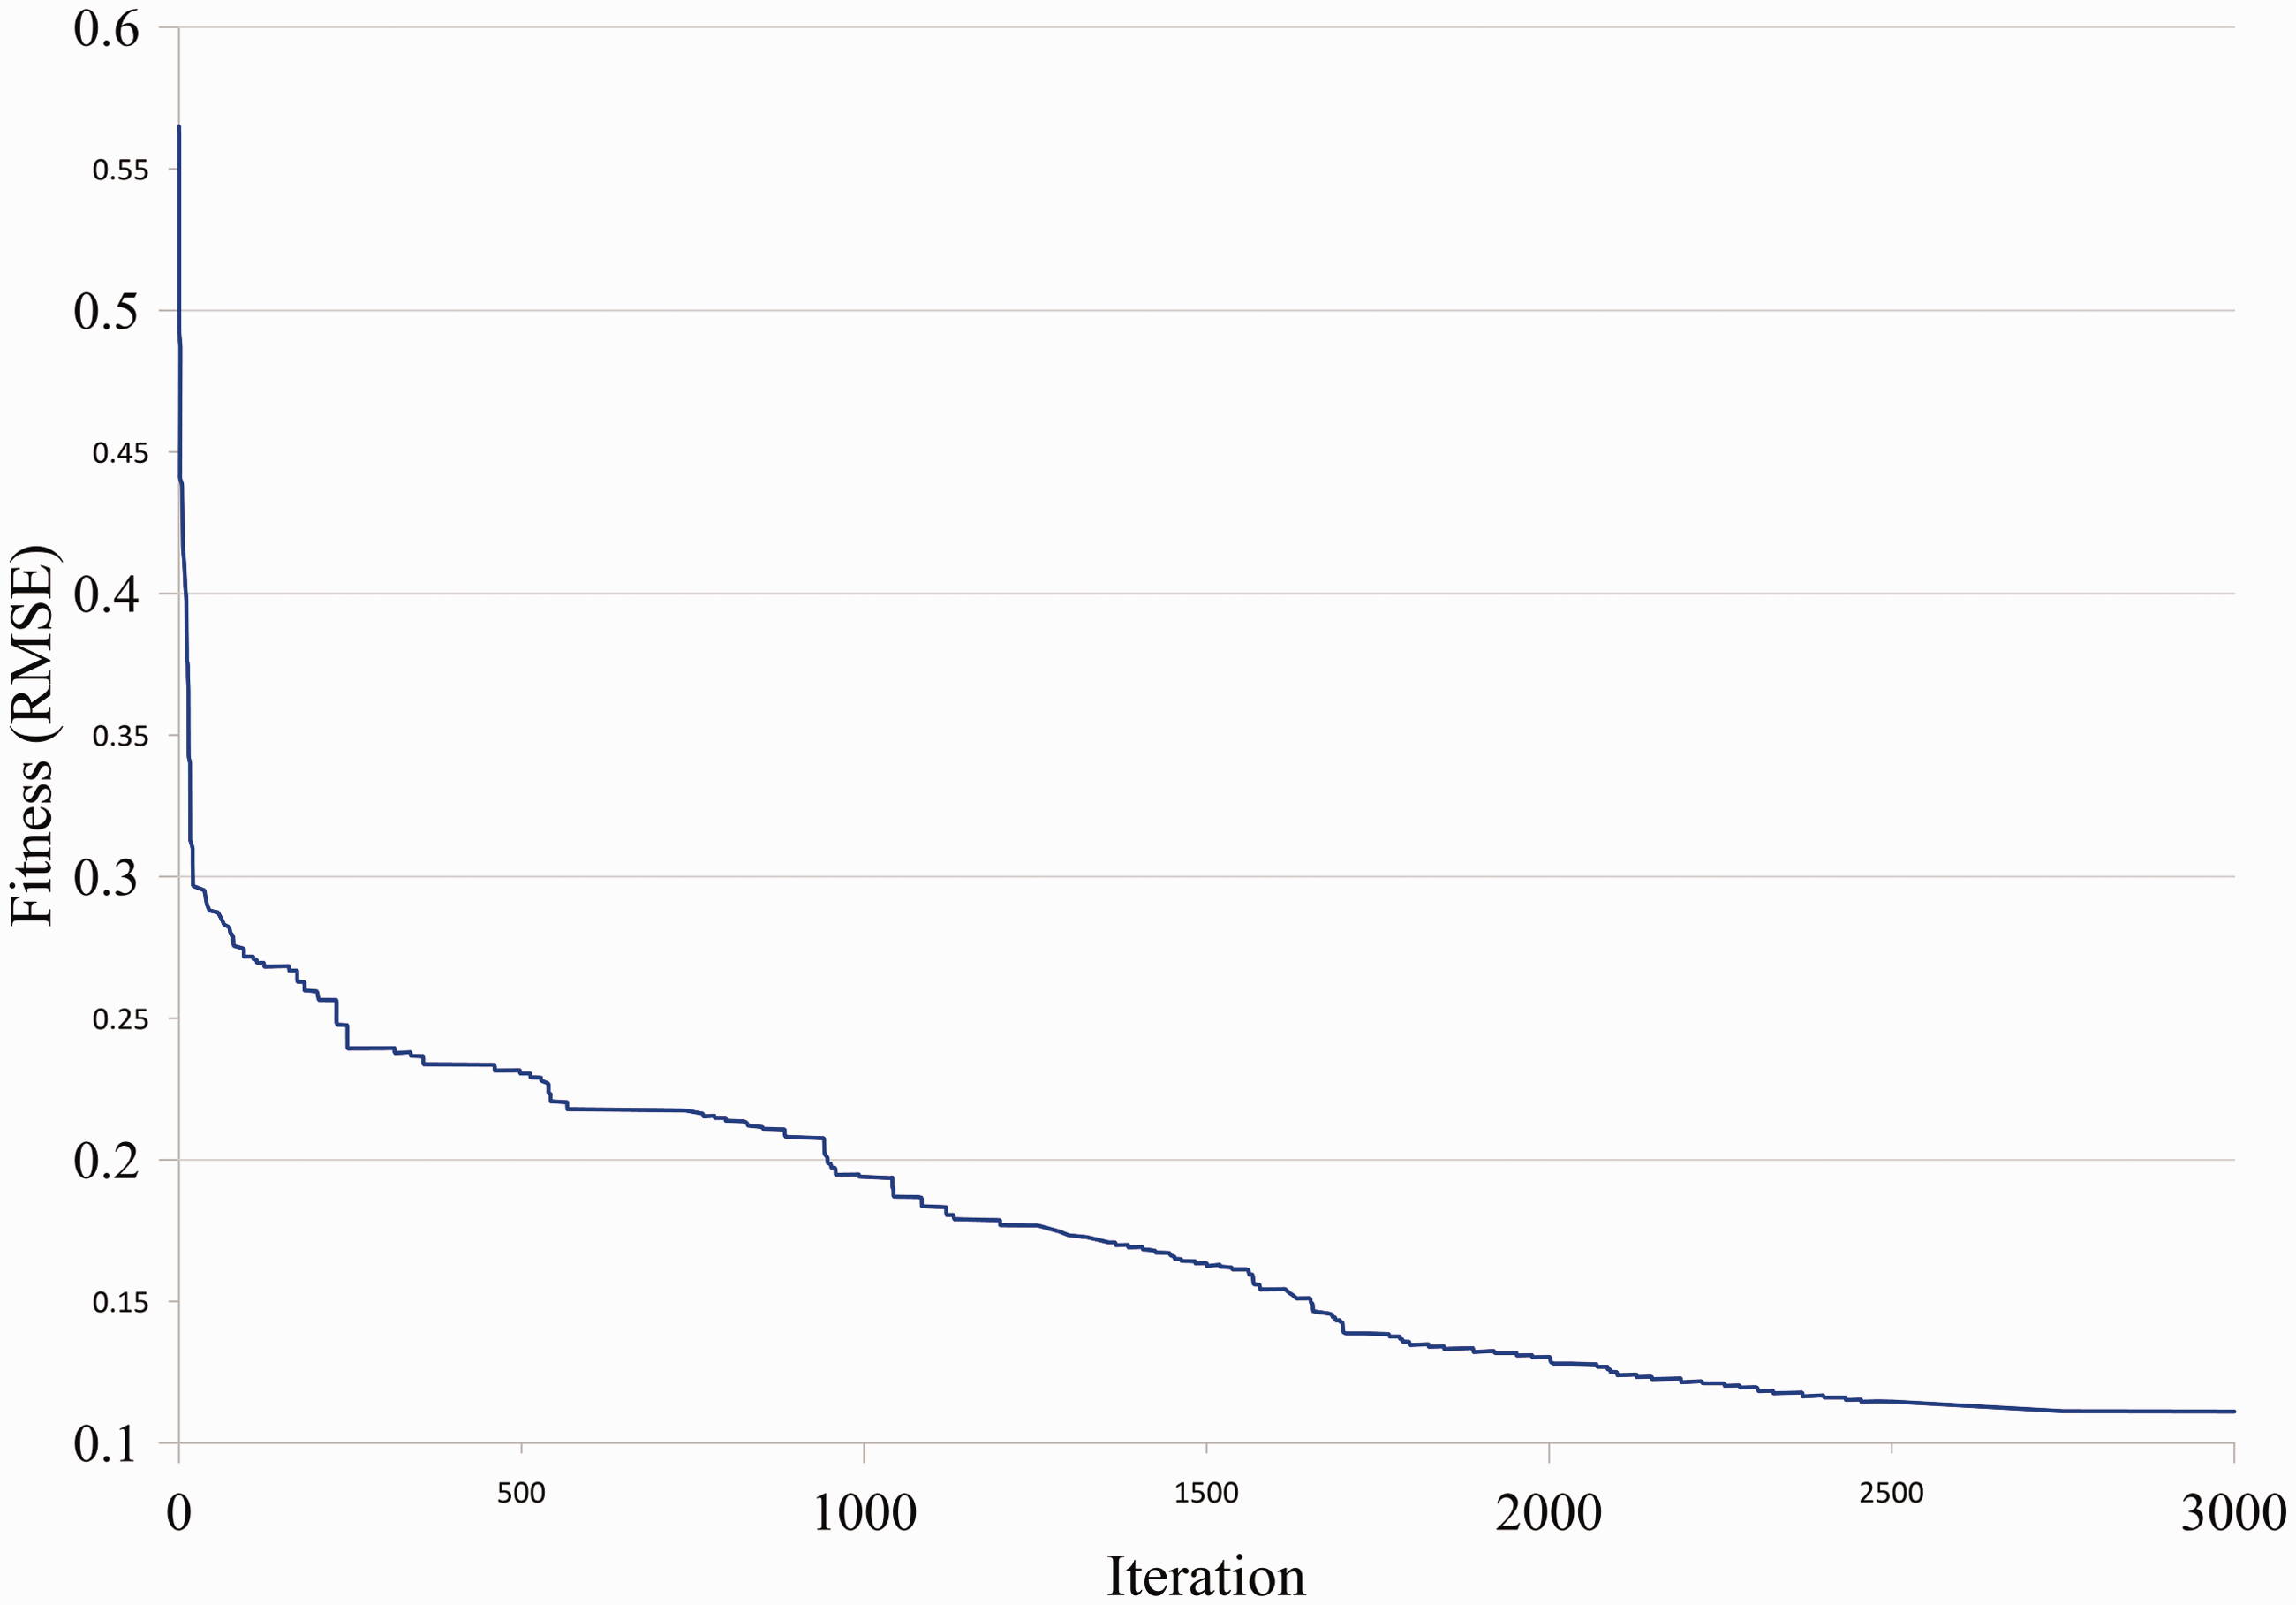
The fitness convergence of the CS algorithm.
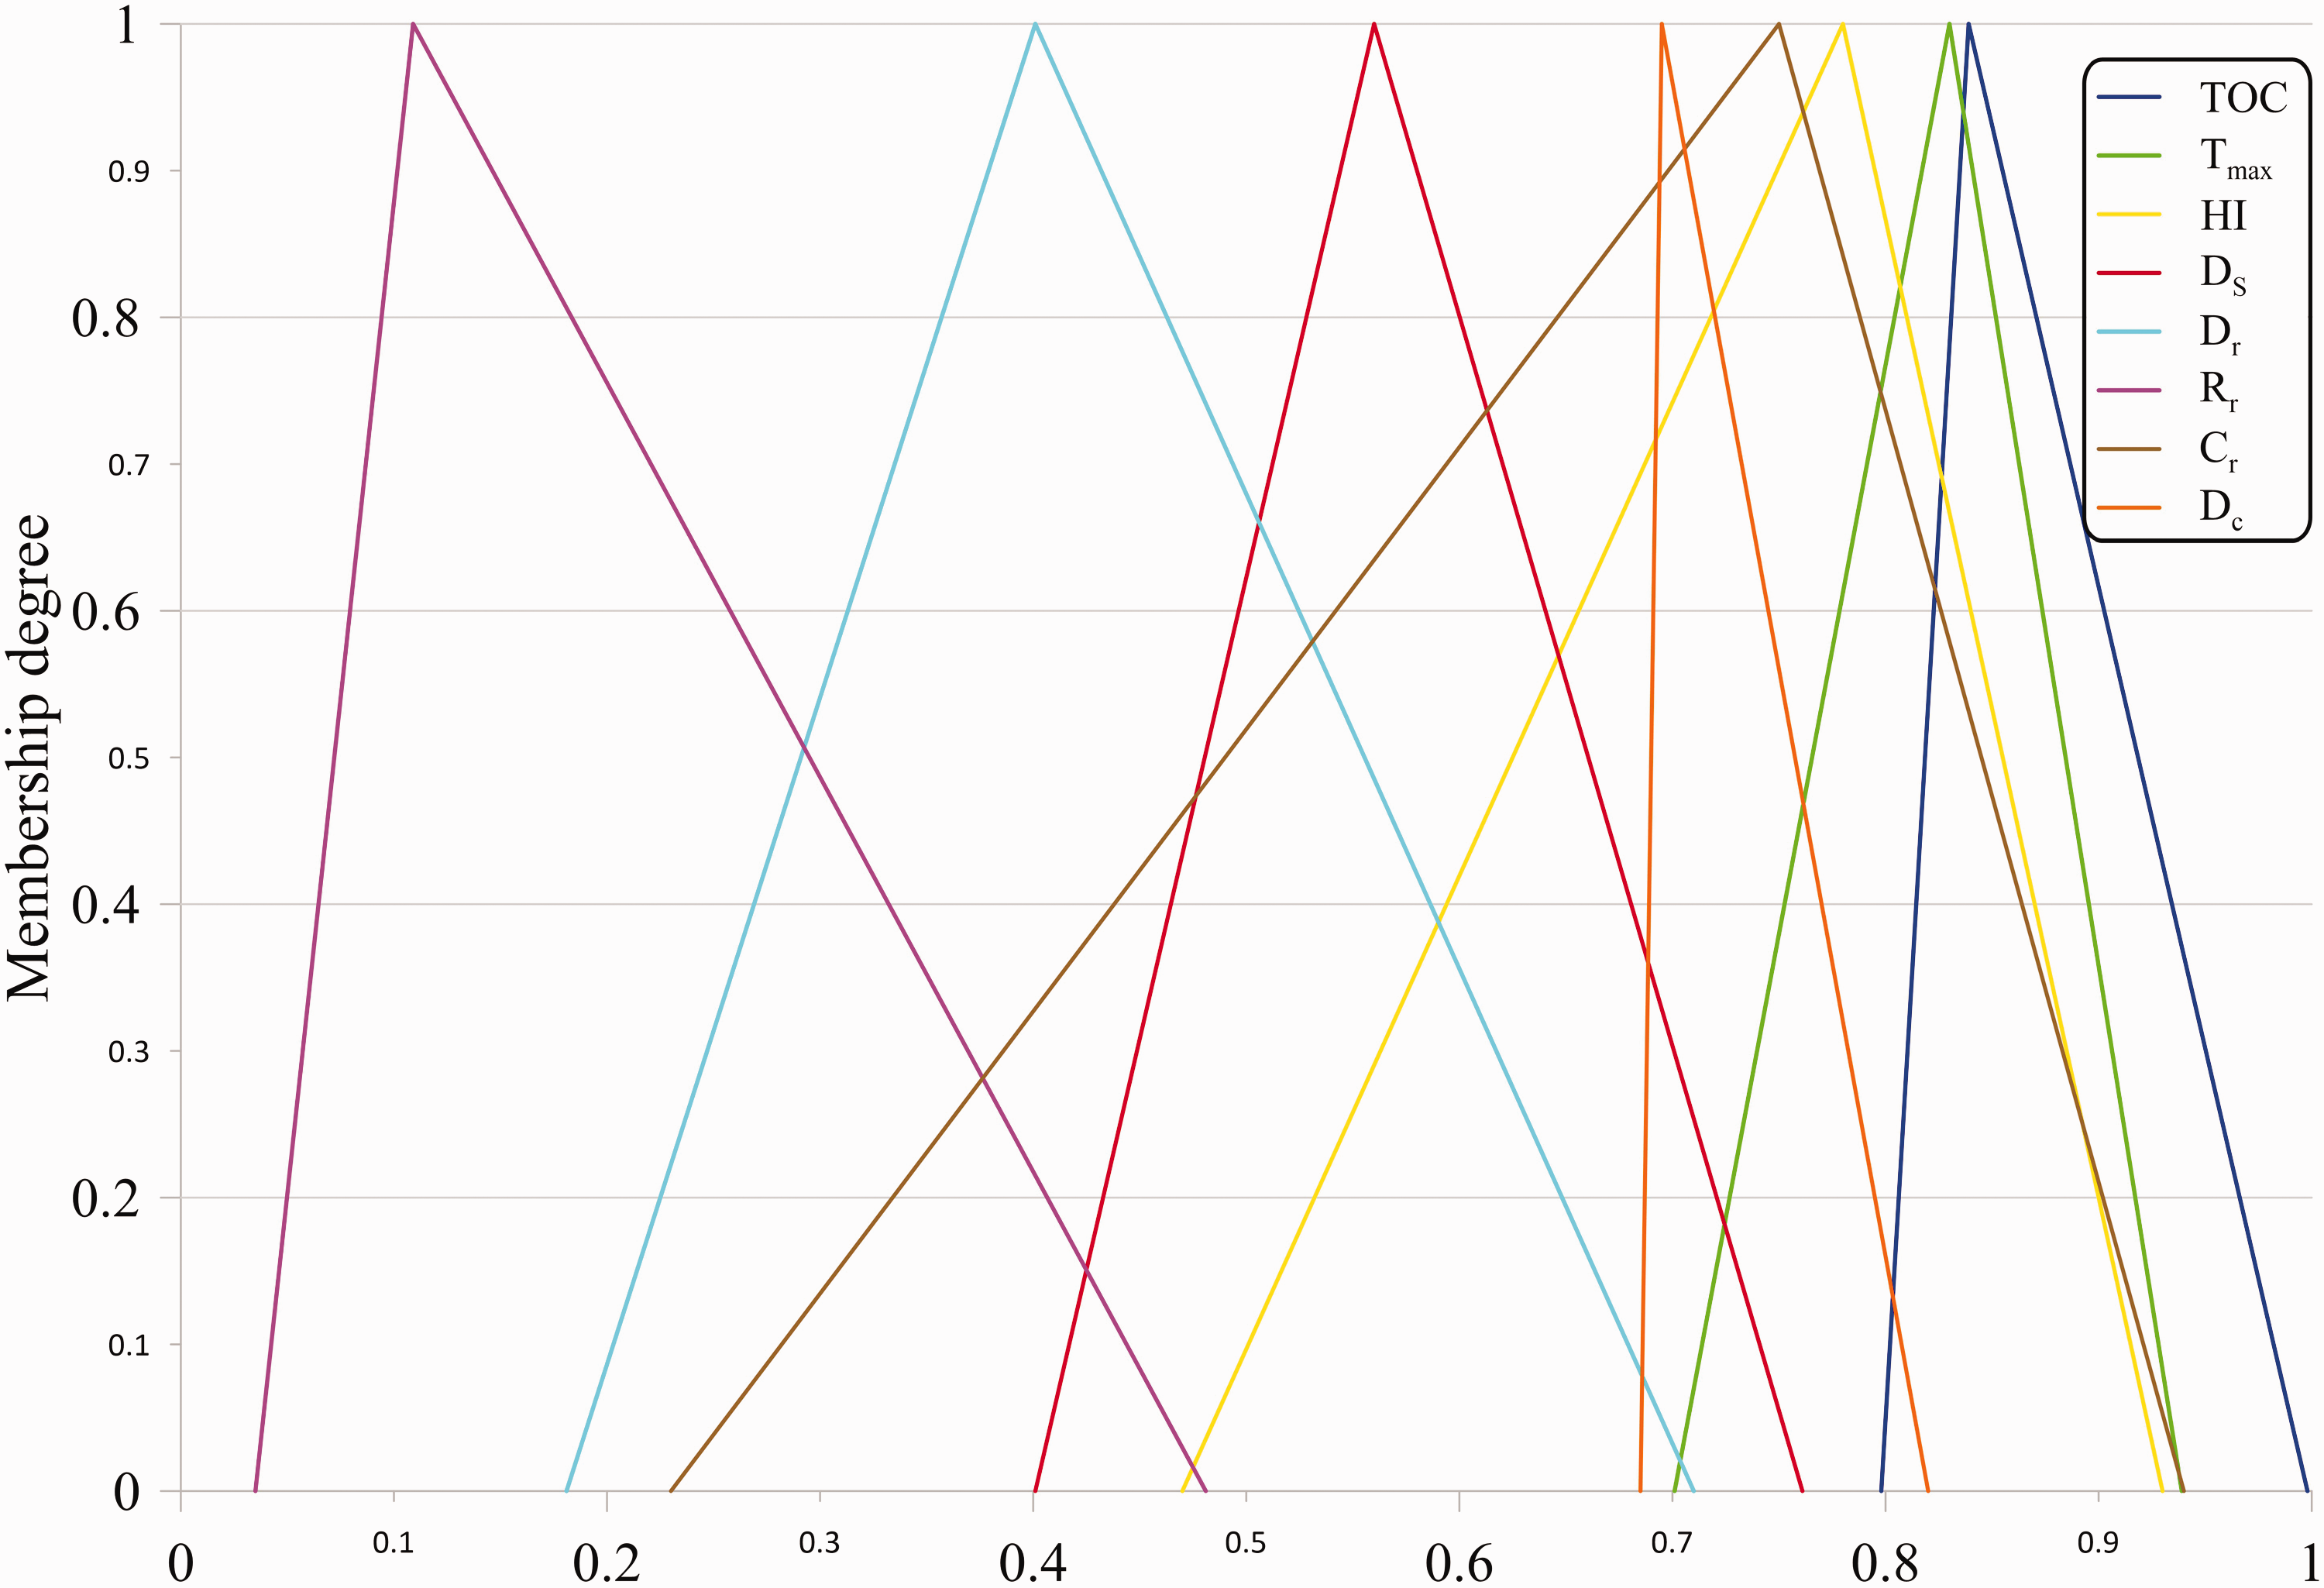
Optimized triangular fuzzy weights of the criteria.
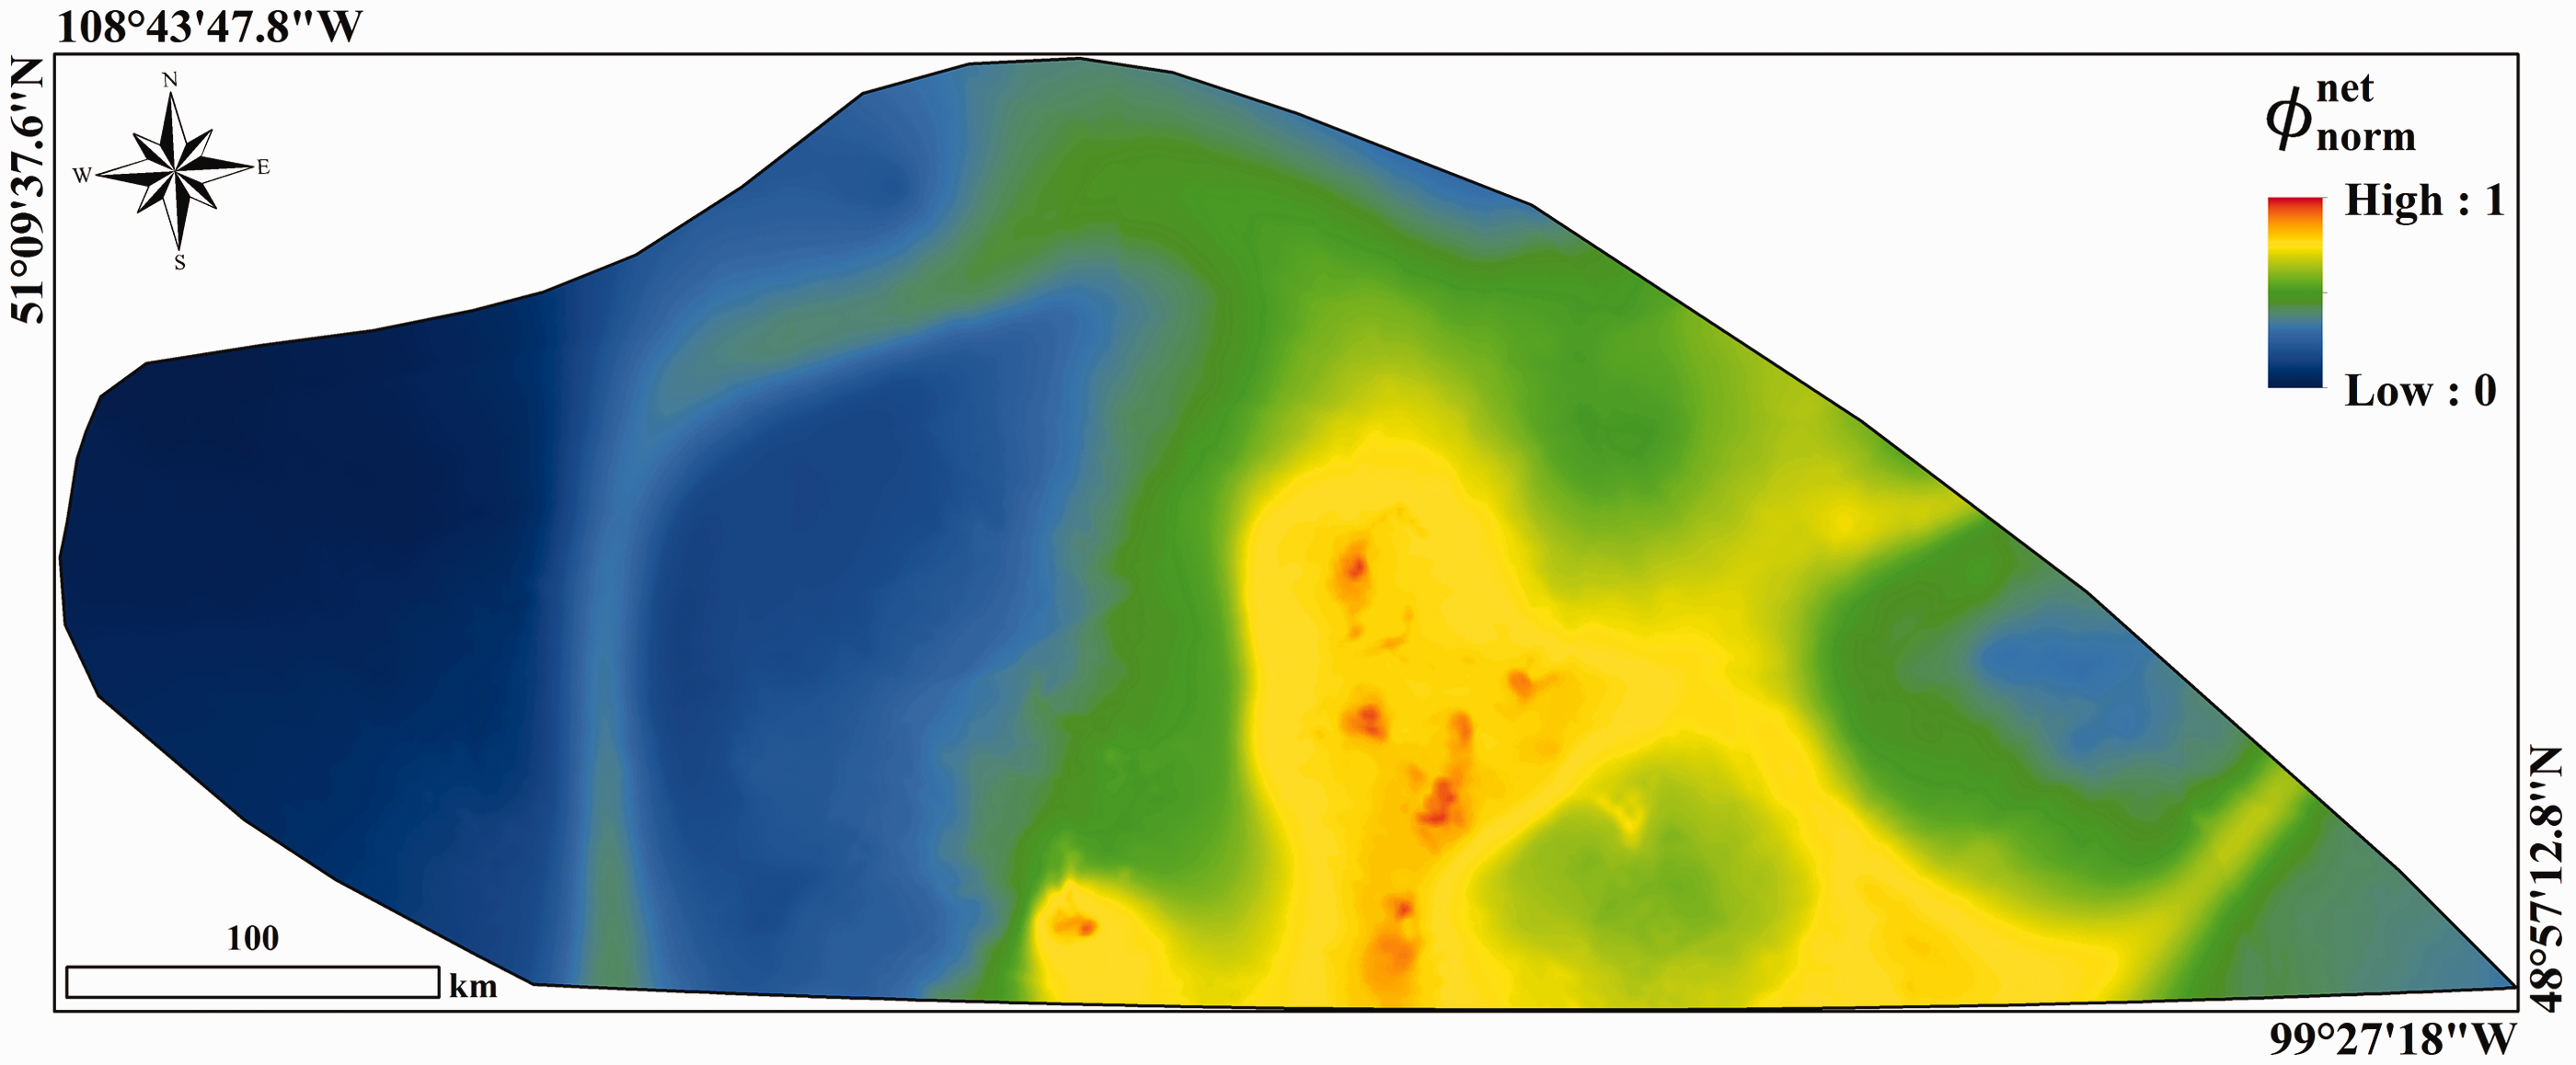
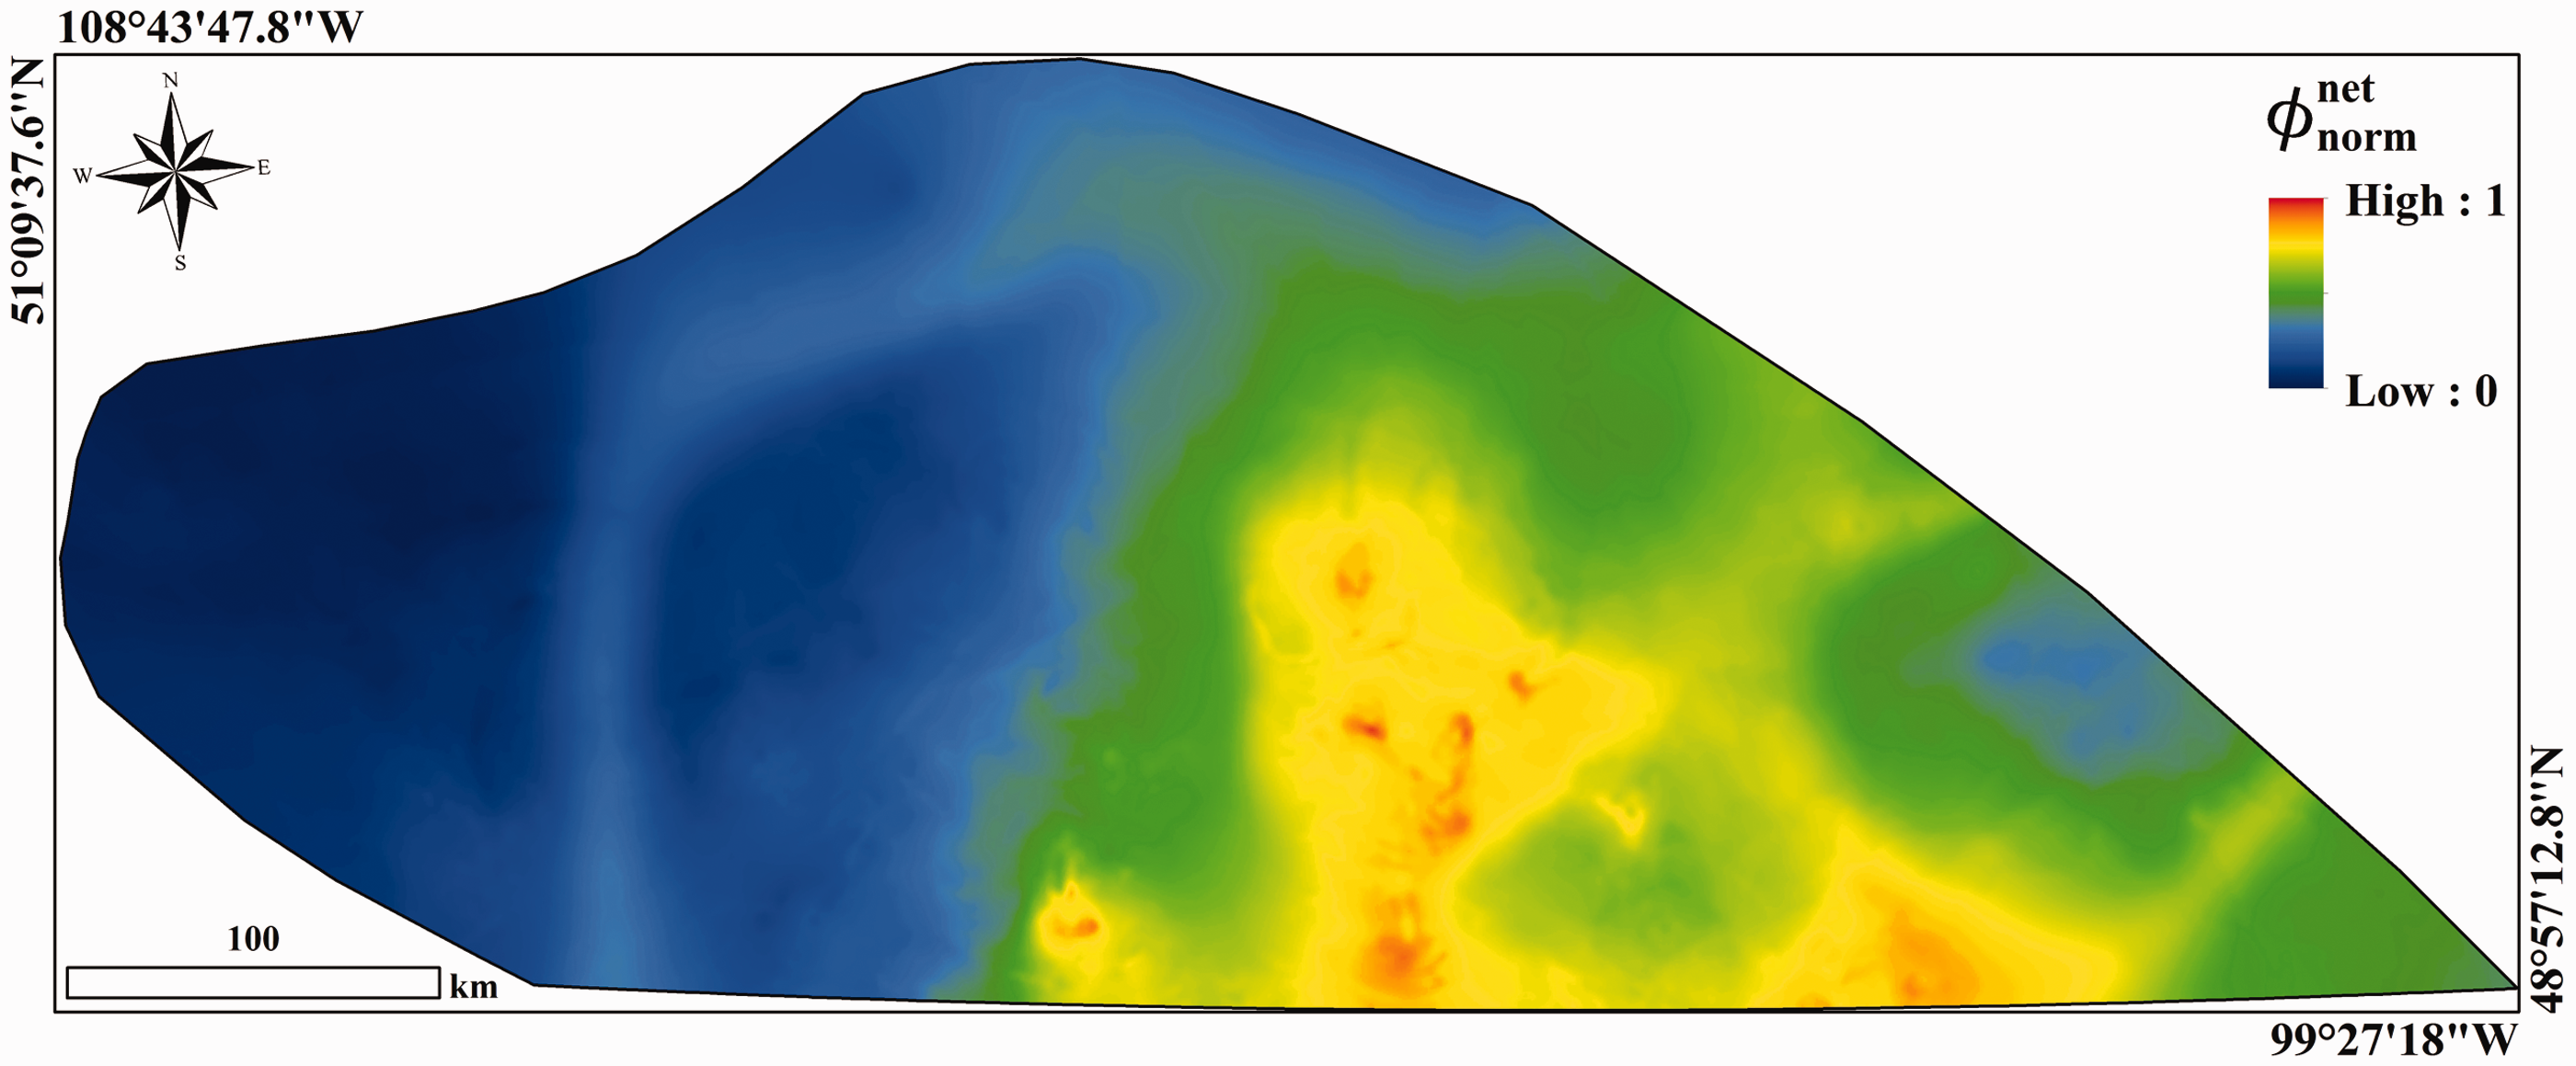
The petroleum potential map of the Red River petroleum system produced by OFP.
In order to make comparison of the results easier,
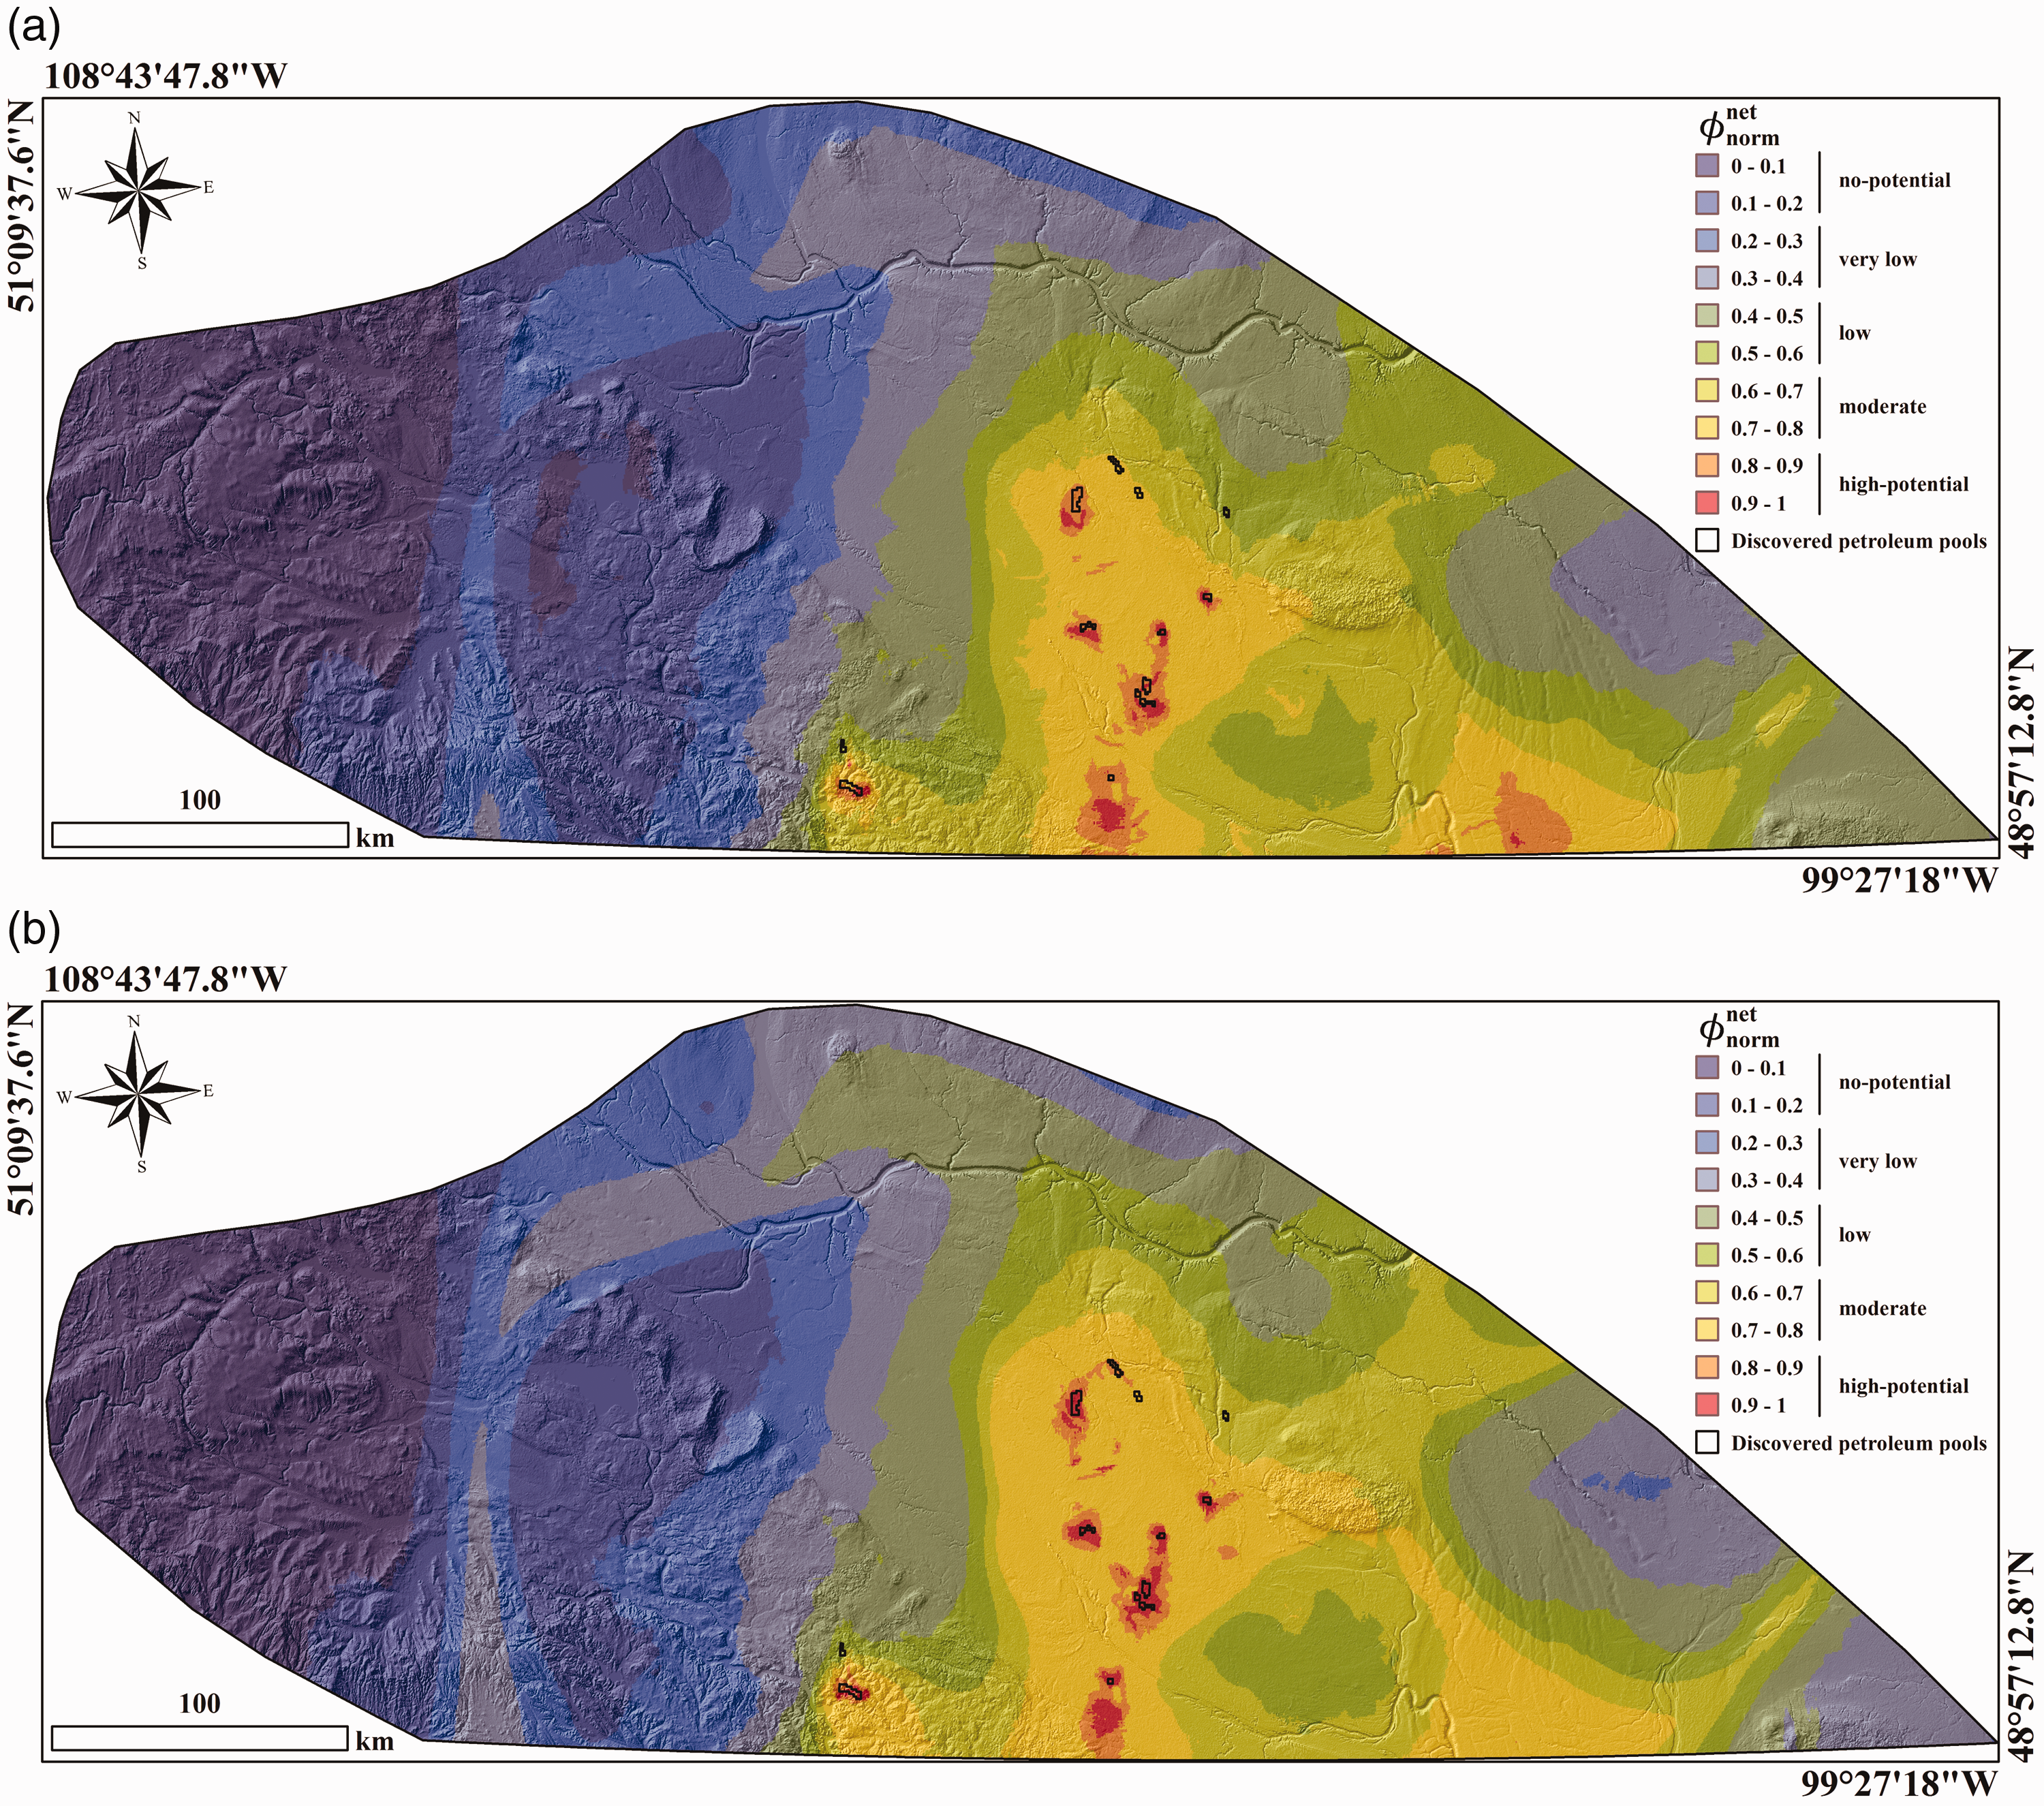
Vector layer of the discovered oil pools overlaid on the petroleum potential map obtained from FP (a) and OFP (b).
Discussion
Petroleum exploration is an expensive, difficult and risky, but necessary, operation. A robust and efficient approach is thus required to achieve a high degree of accuracy in modeling petroleum potential, which will ultimately lead to lower costs and risks in exploration. In this regard, one of the important contributions of this study is to use the optimized triangular fuzzy weights instead of the experts-assigned ones. A visual comparison of the two sets of weights is displayed in Figure 12. It can be noticed that the experts have undervalued the relative importance of the geochemical criteria including TOC, Tmax and HI. They have assigned higher values for weights of the other five criteria than that computed by the CS algorithm. Another remarkable point is that there is a significant difference between the optimized and experts-assigned weights for Tmax, HI, Rr and Dr in contrast to the other criteria.
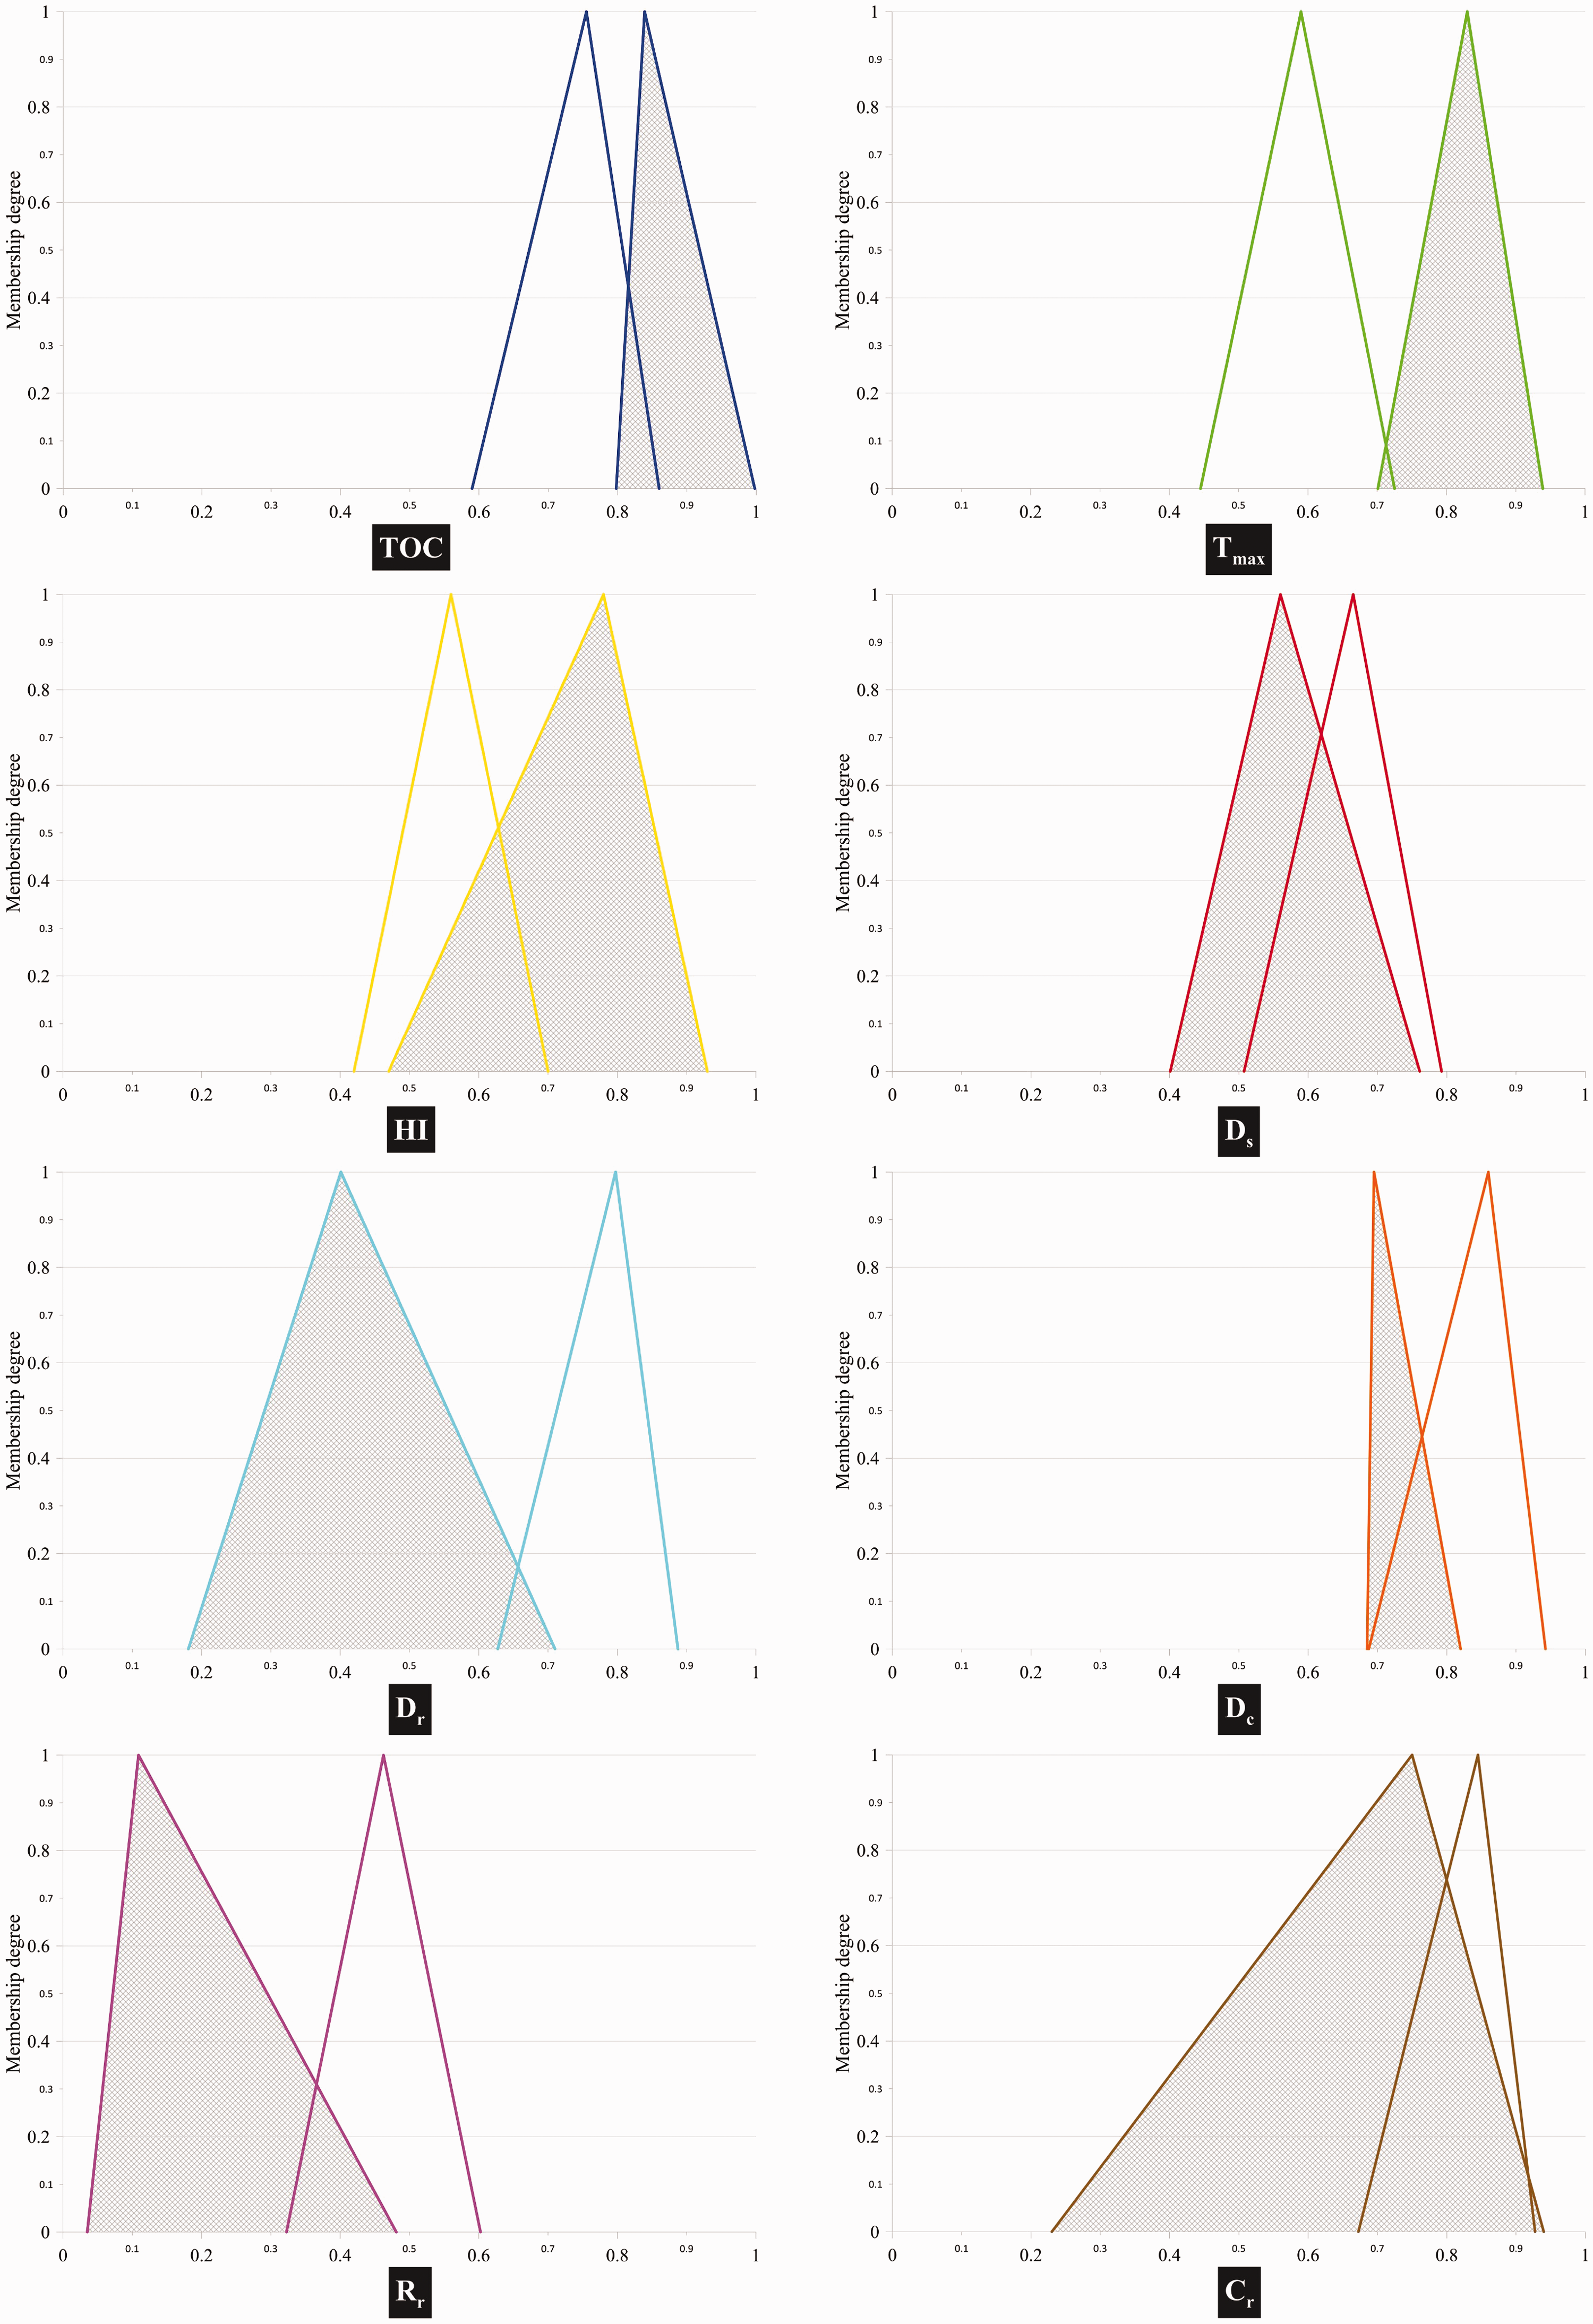
Experts-assigned triangular fuzzy weights of the evaluation criteria (non-hatched triangles) compared to optimized weights (hatched triangles).
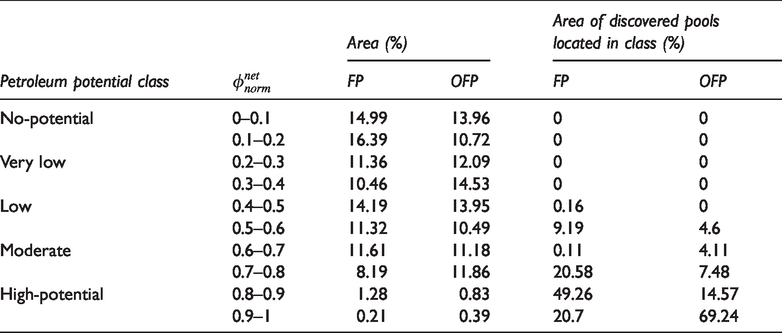
In this study, the predictive accuracy of the models was evaluated by comparing the high-potential class of the reclassified maps to the discovered oil pools of the Red River petroleum system. As indicated in Table 2, FP and OFP have successfully predicted 69.96% and 83.81% of the discovered pools area, respectively. In further detail, 49.26% and 14.57% of the area of the pools have been located in the interval
Attributes of petroleum potential classes.
The next important point to be considered is the screening capability of the model, which has an inverse relationship with area ratio of the high-potential class. The lower the area ratio of the high-potential class, the smaller the area for more detailed investigation, and accordingly, the lower the cost of exploration. Therefore, the screening capability of a model is an important issue in petroleum potential assessment. FP and OFP resulted in the ratio values of 0.015 and 0.012, respectively (Figure 13), both of which are considerably lower than the values obtained in the studies discussed earlier.
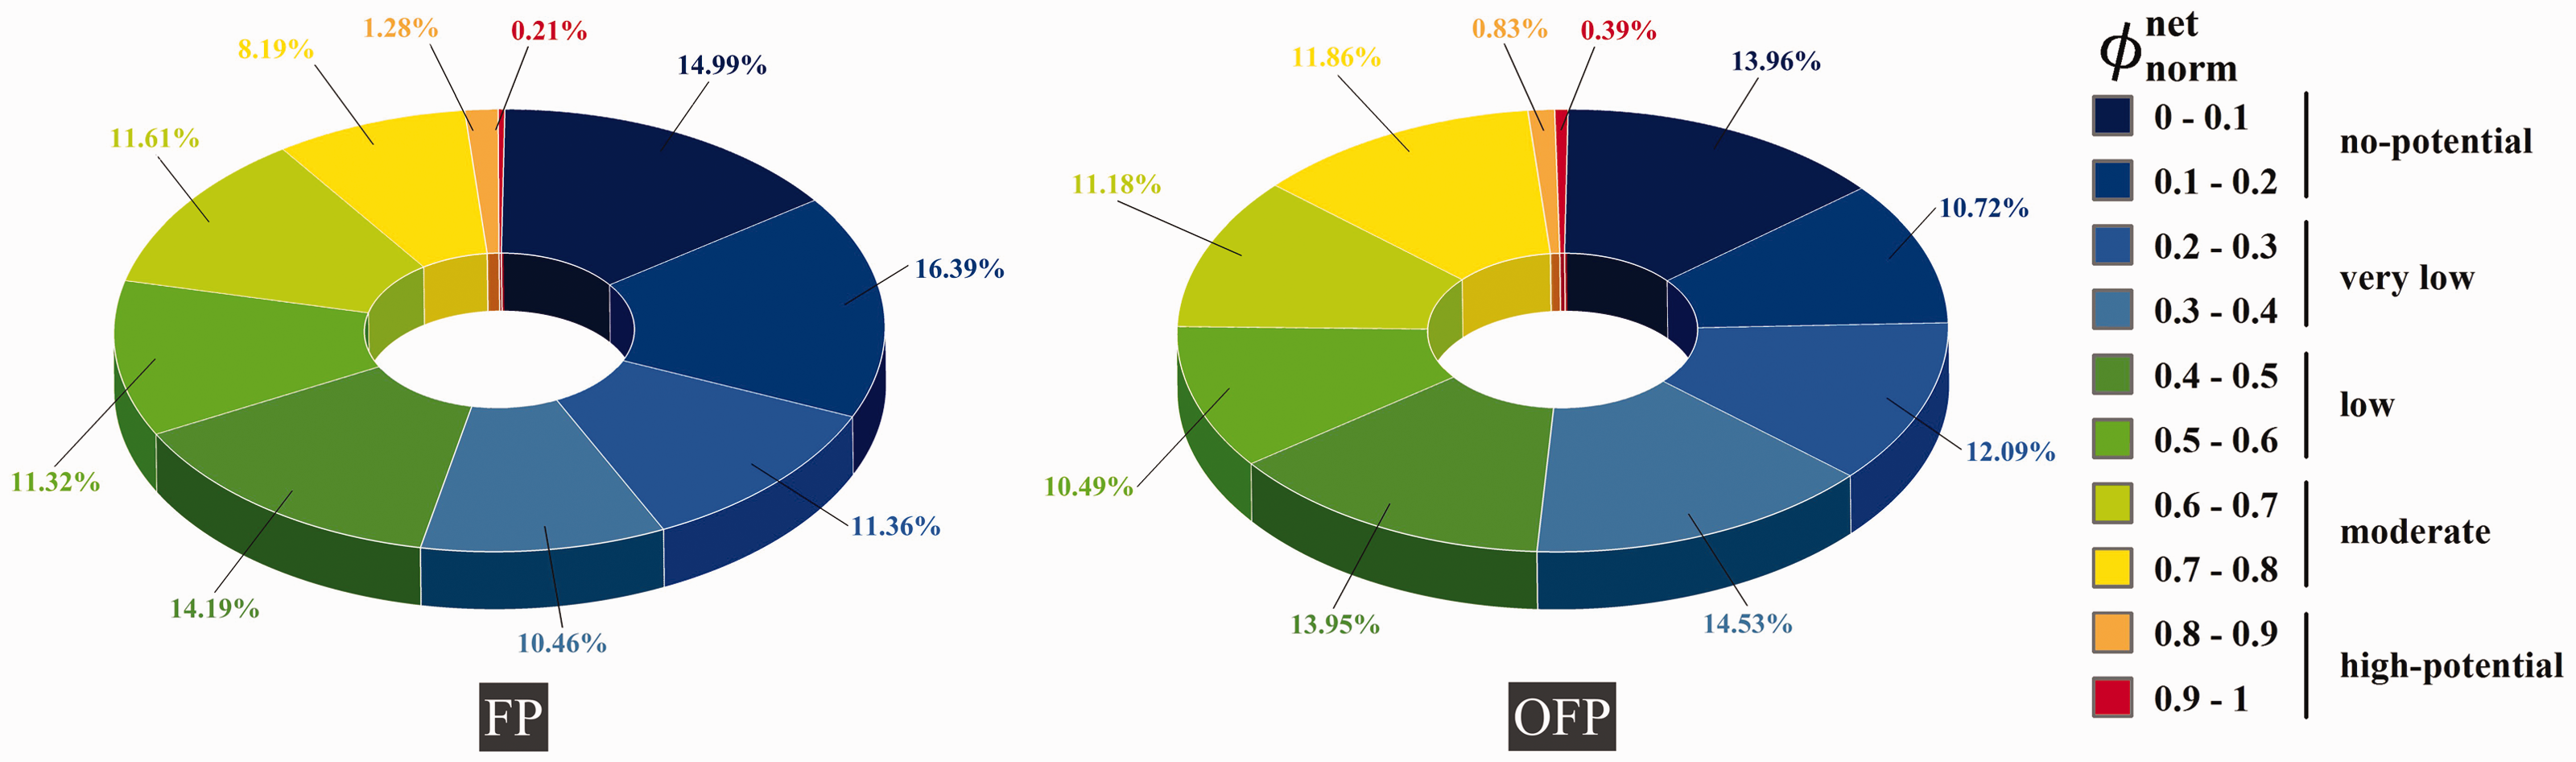
Pie charts showing the ratio of the high-potential class area to the total area under study for FP and OFP.
Conclusions
This study resulted in the following conclusions:
The proposed OFP approach has the ability to model petroleum potential under uncertainty and has identified the location of most of the oil accumulations discovered to date in the Canadian side of the Red River petroleum system. There is a significant increase in predictive accuracy of the model with the optimized weights compared to the use of the experts-assigned or non-optimized weights, which means that the CS algorithm has successfully estimated the triangular fuzzy weights of the criteria. Areas with the highest potential and the lowest risk have been located in the central part of the Canadian Williston Basin which can be considered as future exploration targets in the Red River petroleum system.
We plan to continue this research by improving the OFP approach as well as by including additional input datasets into the model. The former will be accomplished by optimizing all parameters of the model and by using other types of preference functions. For the latter, a petroleum system with relatively complete datasets will be selected to be evaluated by the proposed approach in the future study. Datasets pertaining to the permeability and porosity of reservoir rock were inaccessible in the present study. It is expected that using such datasets can provide more accurate results.
Optimal well placement is a challenging problem in oil field development since it depends on reservoir, petrophysical and fluid properties on the one hand, and on economic parameters on the other, all of which are highly uncertain. It requires an efficient and robust ranking algorithm that its input parameters are properly tuned and has the capability to appropriately deal with uncertain data and subjective preferences of decision makers. We suggest that studies be performed to determine optimal well locations in the petroleum industry using OFP.
Footnotes
Declaration of conflicting interests
The author(s) declared no potential conflicts of interest with respect to the research, authorship, and/or publication of this article.
Funding
The author(s) received no financial support for the research, authorship, and/or publication of this article.