
Abstract
Due to environmental concern, Taiwan aims to remove nuclear power from its energy structure. Since an increase in fossil fuel-based generation is foreboded by law, the lost nuclear power can only be replaced by renewable energy sources. The maritime climate and constant monsoons make wind power a feasible alternative energy source to Taiwan. With more than 300 potential wind farm sites under consideration, the government does not have enough information to determine the best sites in terms of power generation and capital investments. To explore such information, this study employs a lifecycle analysis to identify the economic components of these sites under the estimates of wind speed data and potential wind power generation obtained in our previous study. We also use a sensitivity analysis to examine the impact of construction cost, maintenance cost, energy sale, and emission trade on the site selection decision. We show that variations in construction costs and energy prices have larger impacts than greenhouse gases prices. In addition, the results point out that most sites pass the cost-benefit examination, but site rankings may alter in the face of capital rationing and climate change. Some policy implications derived from the results are discussed in detail.
Introduction
Taiwan is a small island with little natural resource and most of its energy relies on imports. In 2017, Taiwan relies on 98% imported energy (Bureau of Energy, 2017). Up to date, more than 95% of its energy comes from fossil fuels and 4.3% from nuclear power, with less than 1% from renewable energy sources (Bureau of Energy, 2017). Considering energy security and environmental sustainability, Taiwan government tends to reduce coal consumption and nuclear electricity generation. Renewable energy is considered to be an effective approach to enhance energy security and mitigate climate change (Owusu and Asumadu-Sarkodie, 2016; Rafique et al., 2018; Rainer, 2013; Wang et al., 2018). In 2017, Taiwanese government announces that due to environmental consideration, all nuclear power will be phased out by 2025, implying more than 18 billion kWh must be replaced by other sources. Since the law forebodes the increase in fossil fuel use, the lost electricity can only be recovered by renewable energy sources.
The maritime climate of Taiwan provides a satisfactory premise for wind power development. So far 16 wind farms have been operated in Taiwan, with annual electricity of approximately 14.69 million kWh, and to reduce the effects from lost electricity, it is clear that more wind farms must be developed. The government has proposed additional 370 wind farm sites, but information regarding capital investment and power generation from these sites is rare for government officers to make final decision. Because capital rationing and budget constraints generally exist for such a large-scale development of renewable energy, a detailed examination that integrates economic and environment consequences to ensure it is beneficial to the society is usually necessary (Kung et al., 2013; McCarl et al., 2009). In this study, we will explore the turbines’ power curves and electricity potential with updated information, and employ a lifecycle analysis to investigate the costs associated with site development, operation and maintenance, energy sale, and funding/subsidy requirement so that decision makers can determine the sites and understand subsequent economic measures.
Wind power has been widely adopted in many countries to produce domestic electricity and reduce carbon dioxide (CO2) emissions (Brouwer et al., 2016; Hennings et al., 2013; Levitt et al., 2011; Schleich et al., 2017; Xia and Song, 2017). To estimate the wind power potential, simply using parameters form other studies is not feasible because turbines’ power curves and electricity potential from wind power are usually different from sites and machines and these parameters should be estimated in accordance with site-specific characteristics. For example, in our previous bioenergy studies (Kung et al., 2013, 2015), we show that as long as the feedstock supply is determined, ethanol production can be calculated since the energy conversion rates among bioenergy technologies are relatively stable. In these studies, we do not need to care about where the feedstocks come from because the conversion rates are pre-determined whenever the technology is specified. This does not apply to wind power generation since there does not exist universally applicable parameters and all site-specific factors such as landscape, wind speed, wind direction, continuity and stability of wind must be individually estimated; otherwise a large deviation could occur and the result can be misleading.
This study is designed to fit the power curves and examine the electricity potential with the updated dataset and employ a lifecycle analysis investigate economic and environmental effects of 370 scheduled wind farm sites. Kung et al. (2019) proposes a wind power assessment approach which can reduce estimating error by 87%. In this study, we apply this approach to estimate the electricity potential of 370 scheduled sites in Taiwan. By doing so we provide a detailed ranking for all proposed sites in terms of their electricity potential, as well as the stability of electricity supply. During this stage, a lifecycle analysis is adopted to examine the potential cost and benefits associated with sites, and a sensitivity analysis is later applied to examine the influences of important factors such as emission price and construction costs. How capital rationing and other constraints may vary or limit the results are also discussed in detail.
Literature review
Wind power development is considered to be an effective approach to enhance energy security and mitigate climate change (Gavard, 2016; Kaygusuz, 2010; Thomson et al., 2017; Wheatley, 2013; Xia and Song, 2009; Zhao et al., 2016), but its effectiveness is highly dependent on wind power expansion, distribution assumption, and system integration (Hvelplund et al., 2017; Rehman et al., 2019). As indicated by Katzenstein and Apt (2012), cost of wind power development is an important factor constraining its expansion. Engineers and researchers have been continuously investigating on the improvement of wind turbines manufacturing and the reduced maintenance and operation requirements over time to push towards the development of large scale and more efficient machines (Kaldellis and Zafirakis, 2011) while Ahmed and Cameron (2014) review wind power technologies and highlight the trends of industry and challenges that these technologies will face.
Williams et al. (2017) show that wind power costs are expected to decrease due to technological progress but Liebe et al. (2017) point out that site-specific characteristics such as landscape, circulation pattern, and seasonality that have great influences on wind stability must be properly estimated to estimate wind power. Therefore, although a considerable amount of wind power studies have been conducted (Gillenwater, 2013; Hu et al., 2013; Partridge, 2018; Shoaib et al., 2019; Thøgersen and Noblet, 2012), no single parameter can be applied universally due to the above reasons, and the estimation of turbines’ power curves for different sites must be implemented and tested prior to any wind power development.
In addition, in the cases of no subsidies, economically feasibility of renewable energy development is keyed to its success. That is, unless investors can receive higher than required returns they will not invest in this project. Under such a consideration, even if wind power development eventually increase net social welfare, private sectors will still take profitability into account. Lifecycle analysis (LCA) is one effective approach to evaluate the site profitability by decomposing the full system into several computable sub-systems, and with this analytical framework researchers can analyze the system in part or in whole, depending on their objectives (Wang, 2007).
LCA has been long employed in the environmental and resource studies such as agricultural input utilization (Bhattacharyya et al., 2012; Pandey et al., 2012), biochar utilization (Glaser et al., 2002; McCarl et al., 2009), pyrolysis utilization (Kung et al., 2015), and climate change mitigation (Lehmann, 2007). This approach has also been widely applied in countries and regions interested in developing renewable energy. For example, Bhattacharyya et al. (2012) and Pandey et al. (2012) first report the management and utilization of fertilizer in India, and numerous studies use this framework to investigate renewable energy production in Thailand, Malaysia, Philippines, United States, and China (Delivand et al., 2012; Liu et al., 2011; McCarl et al., 2009; Shafie et al., 2014; Silalertruksa and Gheewala, 2013; Soam et al., 2016; Suramaythangkoor and Gheewala, 2011).
Methodology
This study explores potential wind farm sites which can generate electricity economically and environmentally efficient. We examine the impact of construction cost, maintenance fee, energy sale, and emission trade on the site selection decision under a lifecycle framework. To achieve a more accurate power assessment, the wind stability and electricity output are estimated by the Weibull distribution and a threshold regression model (Kung et al., 2019). Additionally, this study follows the decomposition procedures illustrated by Kung et al. (2015) to analyze the economic consequences from all stage such as construction, transportation, and operation of wind power development, calculate the emission effects during these stages, and apply a sensitivity analysis to examine how such measures will alter under different market conditions. This section introduces the model on how to evaluate the electricity generation and the lifecycle analysis framework in this study.
Wind power assessment
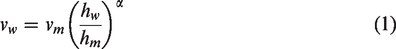
It requires long-period wind speed data to achieve better wind power output estimation. However, it is costly to collect measured data at all potential sites. This study uses hourly wind speed data from all meteorological stations which can be collected from Central Weather Bureau, Taiwan. Data are available from 2012 to 2016. In near ground, wind speed will change with height significantly. For the evaluation of wind speed variation based on height, the following formula is used (Gualtieri and Secci, 2012; Safari and Gasore, 2010).
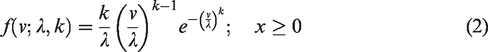
A Weibull distribution has won its reputation in analyzing wind speed data (Bagiorgas et al., 2012, 2016; Baseer et al., 2017; Bassyouni et al., 2015; Rehman et al., 2012). The two-parameter Weibull distribution consists of scale and shape parameters, and the distribution of wind speed can be estimated by Weibull distribution. The probability density function (p.d.f.) of Weibull distribution is as follows
For convenience of calculating the expected electricity generation, we estimate the power curve of wind turbine by the following quadratic equation (Chang and Tu, 2007; Chang et al., 2003)
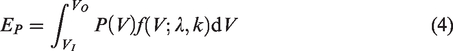
After achieving the parameters of Weibull distribution and the power curve of wind turbine, we calculate the expected electricity generation as follows
Finally, to reduce the estimating error of wind power, we follow the method proposed by Kung et al. (2019), and use the threshold regression to forecast the actual electricity generation.
Lifecycle analysis
To examine how these farm sites can be economically feasible and effective, it is necessary to adopt a lifecycle framework to investigate the overall process. Table 1 presents the components that will be incorporated in the lifecycle analysis.
Components included in the lifecycle analysis.
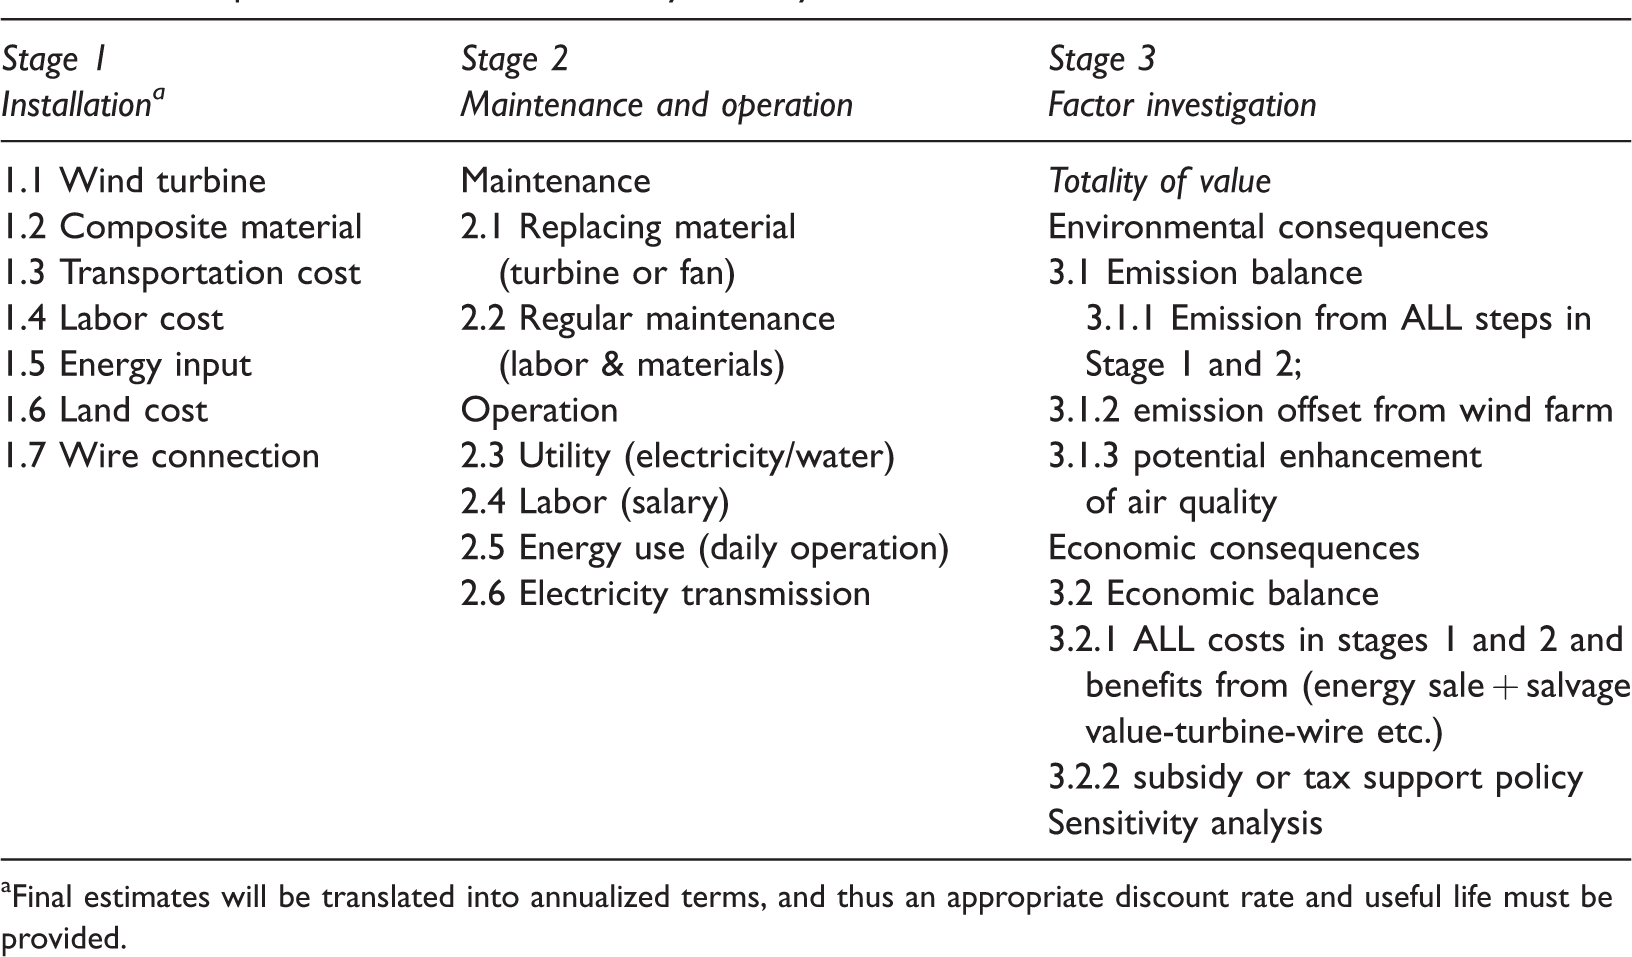
aFinal estimates will be translated into annualized terms, and thus an appropriate discount rate and useful life must be provided.
The stage 1 evaluates the costs associated with wind farm construction. Costs of wind turbine and wire connection are obtained from Taipower Corporation while the costs of composite materials, labor, and land acquisition are based on the publicly trading prices and wage rates. The transportation cost of these materials is then estimated under the formula provided by McCarl et al. (2009), which is expressed as

In stage 2 we use the data released by Taiwan Ministry of Economic Affairs (TMEA) to calculate the average operation and maintenance cost during operation. In stage 3 the economic measures are calculated and summed up to estimate the overall profitability. Specifically, the revenue from energy sale and monetized emission reduction are calculated as below


Results and discussions
Estimated wind power potential
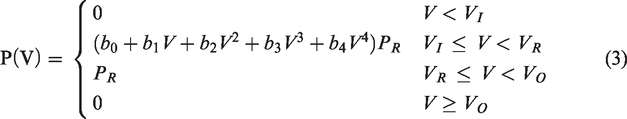
Estimation of power curves is crucial in wind power development because it is the measurement of electricity output under various wind speeds, given a normal climate condition. Currently there are eight turbine models deployed by Taipower Corporation and the power curves are estimated by equation (3). Figure 1 presents the power curves of three capacity level wind turbines employed in this study: small (E40-600), middle (GE Energy 1.5se) and large (E70-2300).
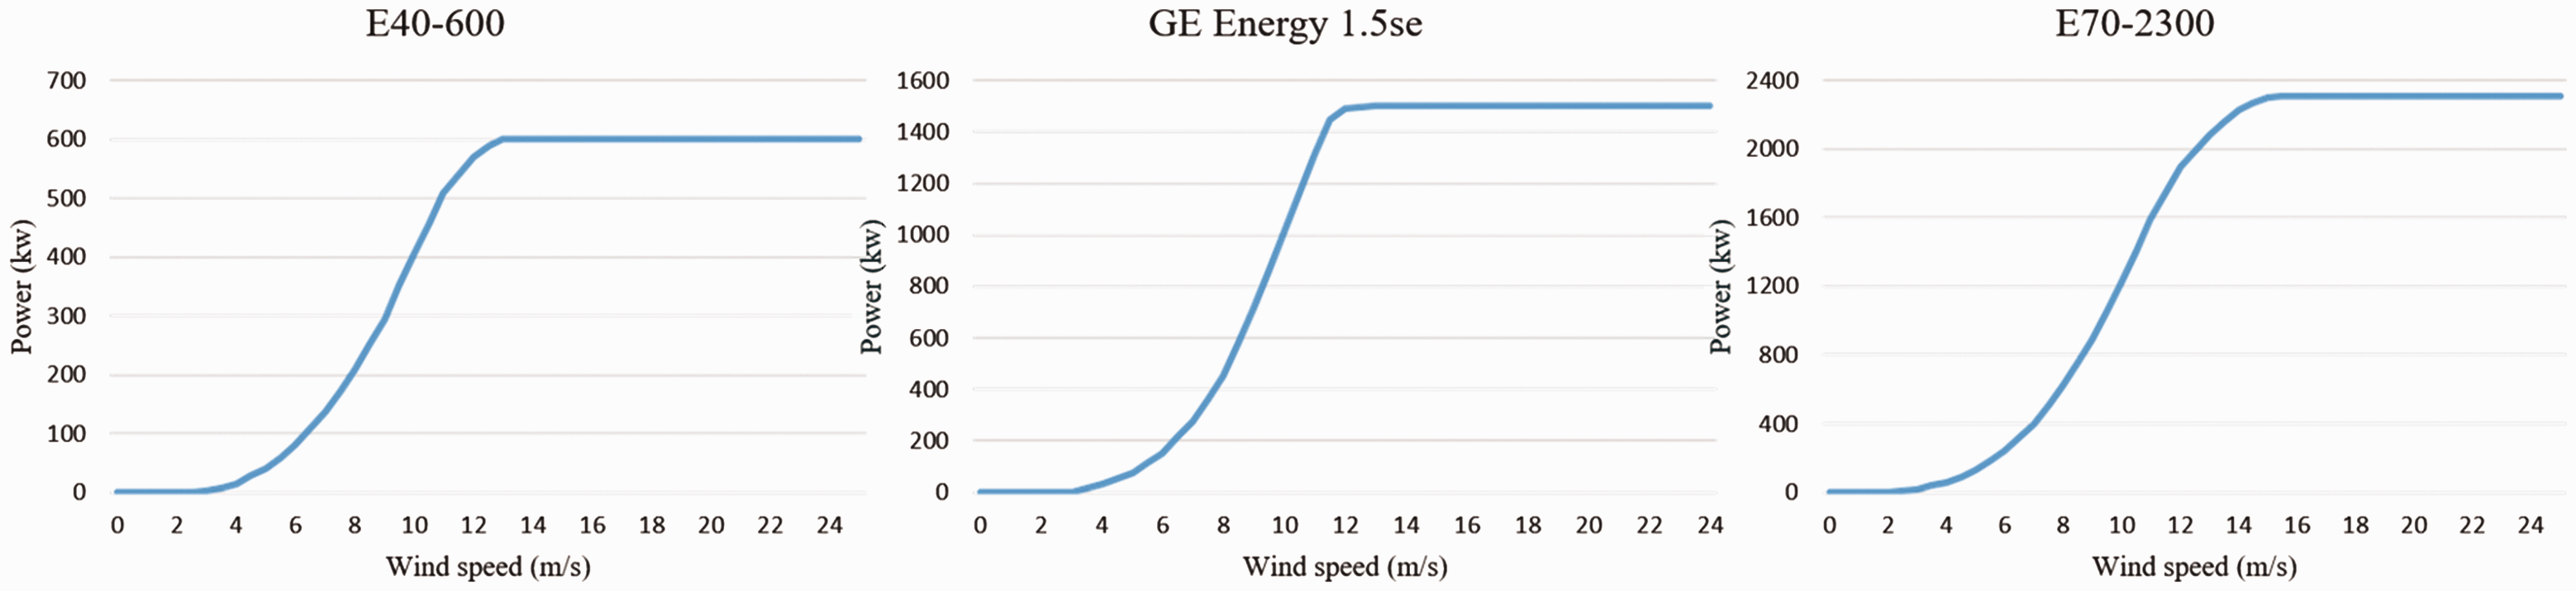
Power curves of three capacity level wind turbines.
Kung et al. (2019) show that, compared to the theoretical estimation model, refining the estimated electricity output by threshold regression model, in average, would reduce estimating error by 87%. It implies that an additional step of accommodating a threshold regression model can eliminate estimation errors considerably and could be a feasible and attractive approach in wind power estimation. Therefore, this study employs the same method to estimate the electricity potential of 370 scheduled farm sites. Taiwan can be divided into five regions, including north district, middle district, south district, east district and island district. To make the result more concise, three farm sites that generate highest electricity of each region are aggregated and displayed. The location is shown in Figure 2 and the average hourly and annually electricity generation of each wind farm is shown in Table 2. Island district has highest electricity potential and south district has lowest electricity potential.
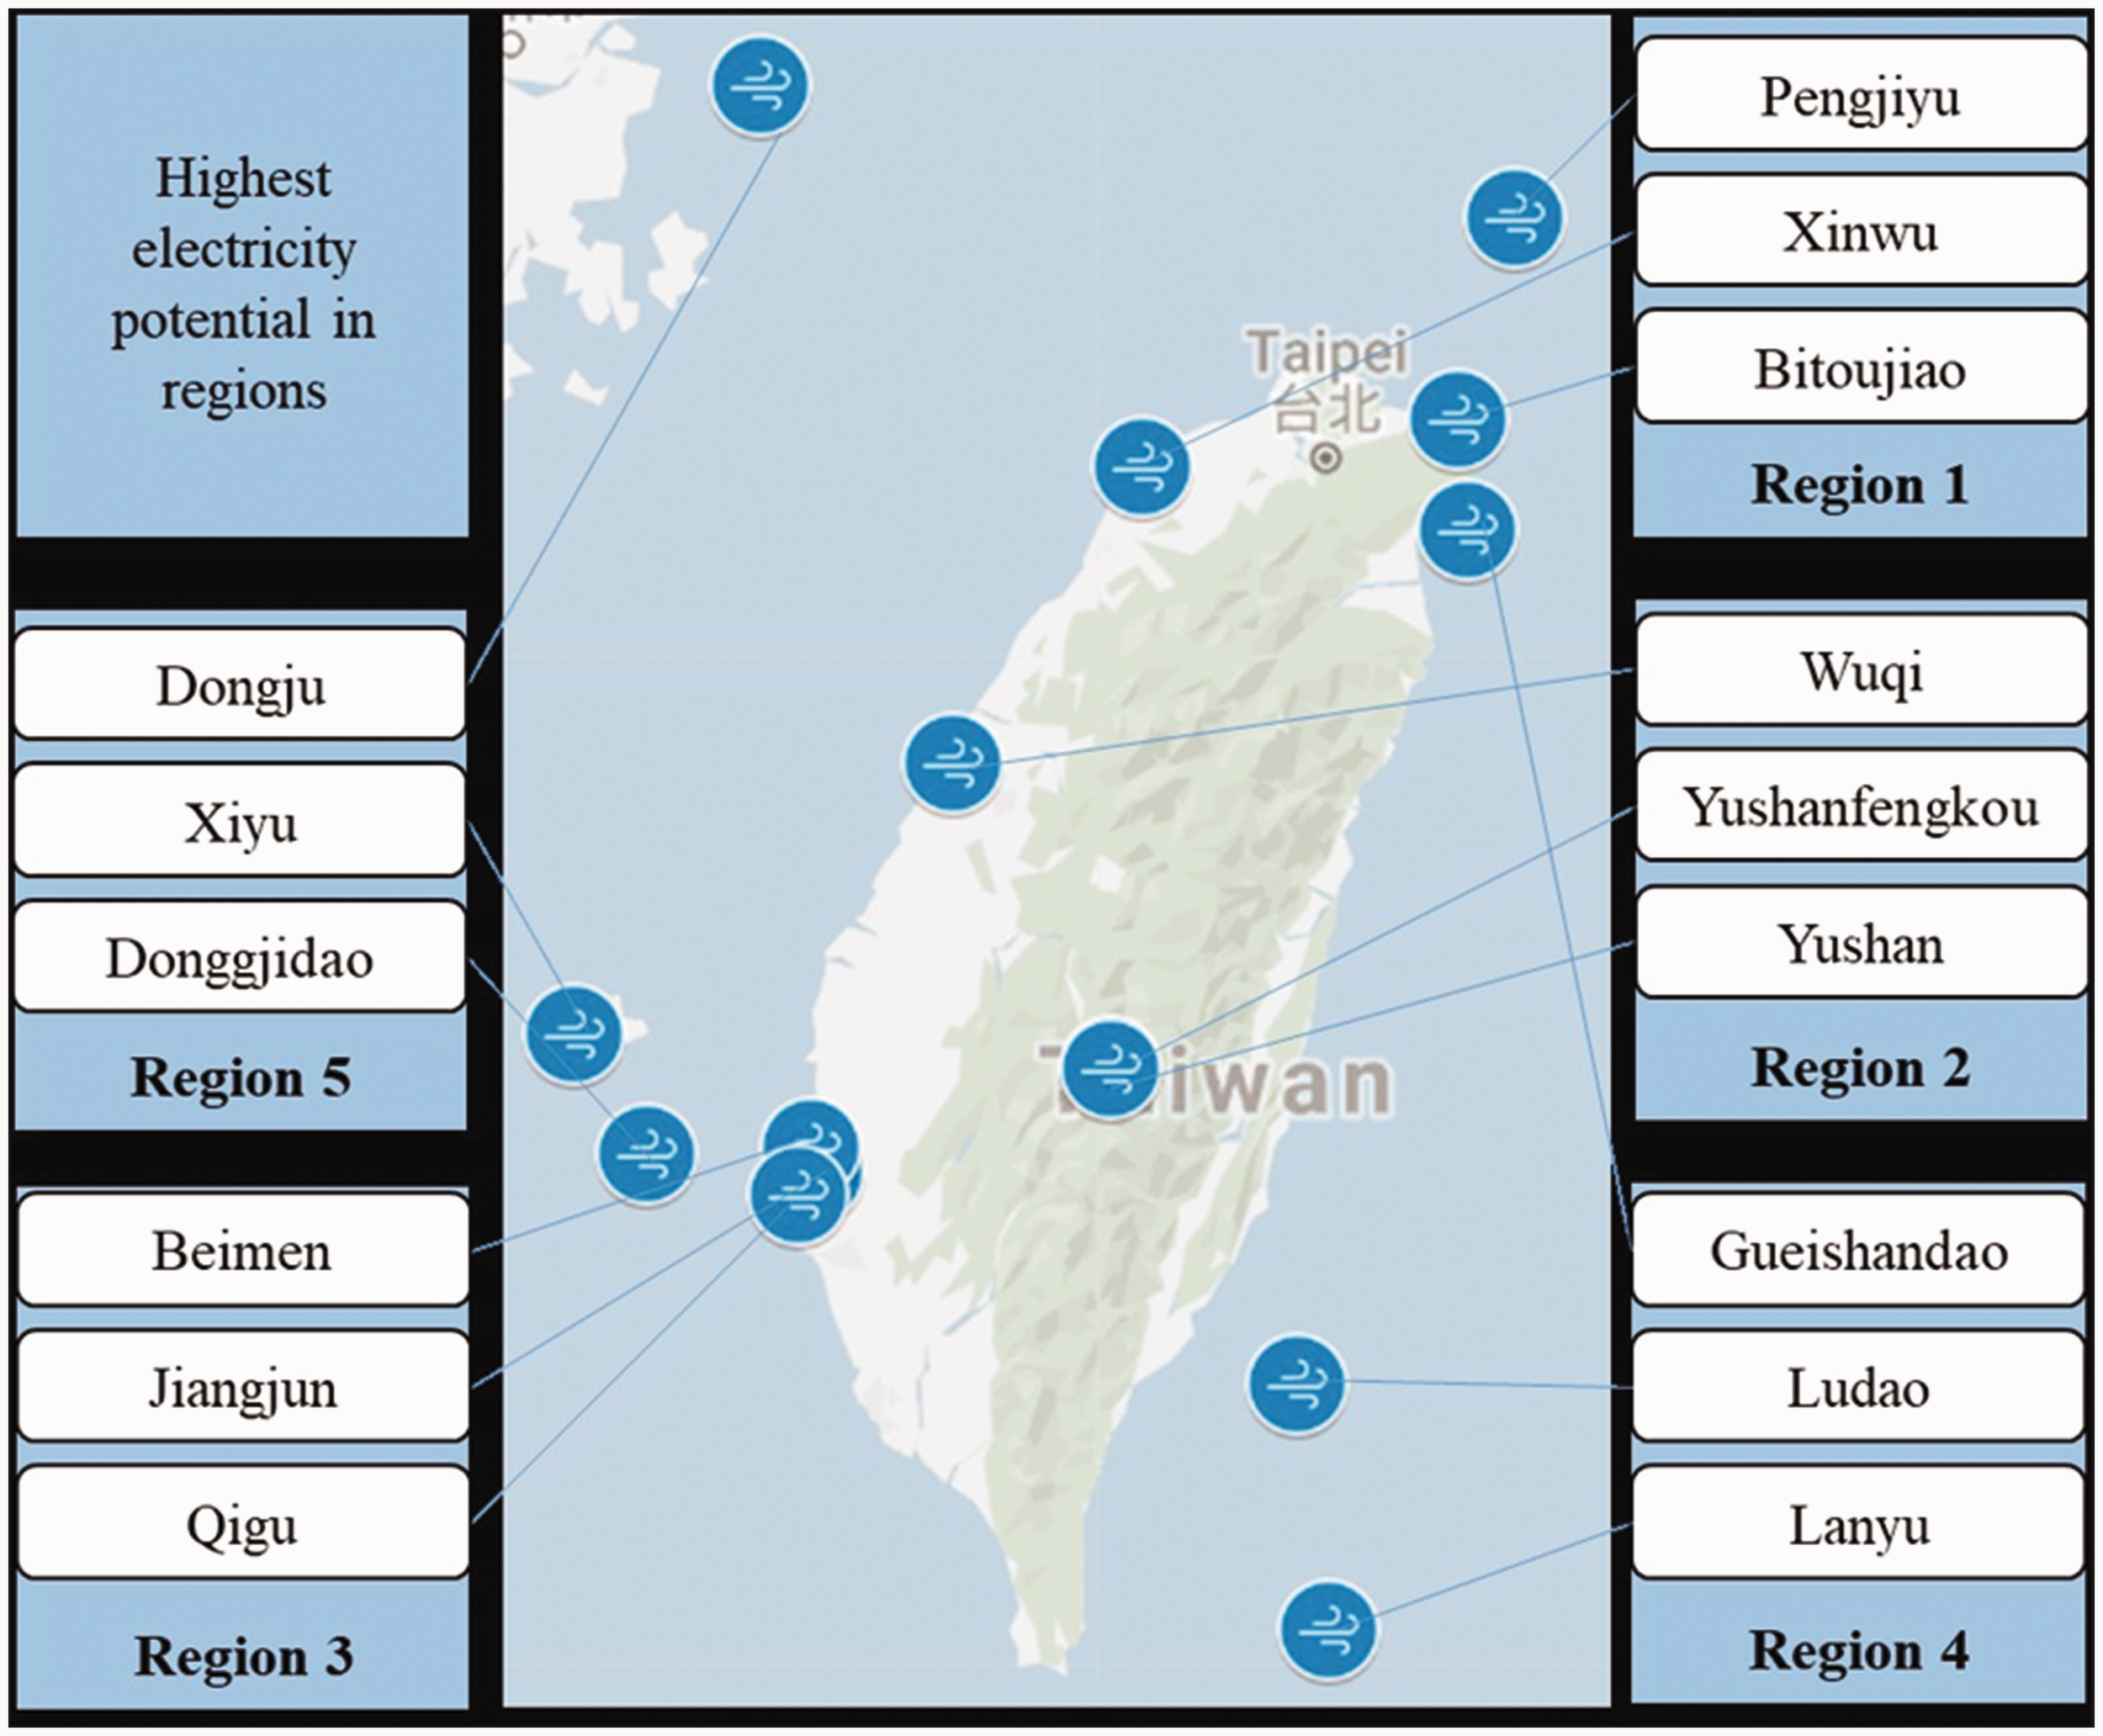
Potential wind farm location.
Highest electricity potential in regions.
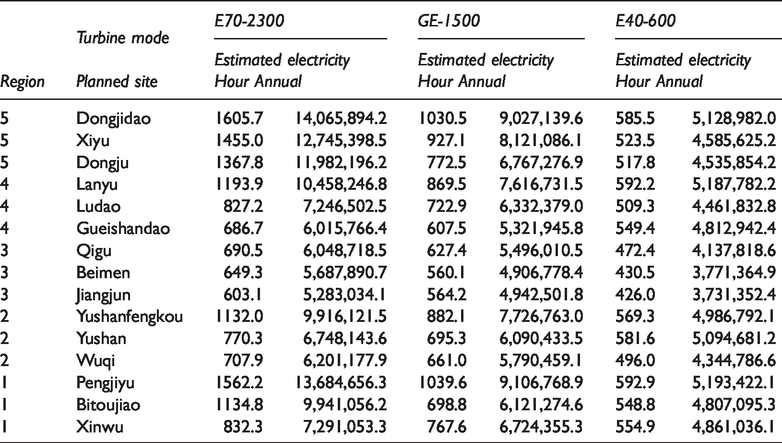
It is clear that the turbine used in farm sites will ultimately influence the electricity output. E70-2300 turbine generally provides more electricity, but the total electricity does not change considerably when all sites employ the same turbine. This can be illustrated by one example. If E70-2300 turbine is applied in Dongjidao, annual electricity generation can be 14 million kWh and only 5.13 million kWh will be obtained if E40-600 turbine is used. However, in sites such as Tamsui and Nantou where wind speed is lower, a large turbine does not guarantee a higher electricity output. Therefore, it is clear that a uniformly employment of certain turbine is not a good approach to generate highest electricity. Put in other words, the optimal design of Taiwan’s farm sites should be based on the characteristics and electricity potential of each site, which is analyzed in this study.
Lifecycle analysis
The study has indicated the electricity potential of scheduled farm sites. However, simply knowing the electricity output of each farm does not guarantee the efficient capital investment to be arrived. For example, it is not desired for wind farm developer to spend NT$1 million in generating merely 100 kWh electricity, even if this additional electricity does increase energy security. Therefore, for private investors, it is necessary to estimate the profitability that may be received from each site before they are engaged in such a large-scale development. To explore this question lifecycle analysis is employed to provide more information to both investors and decision makers.
Economic effects
Following the stages provided in Table 1 and estimated hourly power generation provided in Table 2, we use formulas (5) to (7) to estimate the economic components such as annualized construction and maintenance costs, sales revenue, and expected profits. For simplicity, we only display the sites what have the highest electricity potential in each of the five regions, and the information of the rest 355 sites can be found in Appendix Table 7.
The total construction cost is based on the estimation of the Guidelines on Energy Development (TMEA, 2017), which is then annualized under a 20-year useful life and 4% discount rates. The maintenance cost is NT$1683 per kW, and thus the larger the turbine, the higher the maintenance. With the proposed electricity price of NT$2.878 per kWh (TMEA, 2017), we can calculate the profitability of each proposed sites. The results are displayed in Table 3.
Economic components of wind farm sites with different turbine mode.
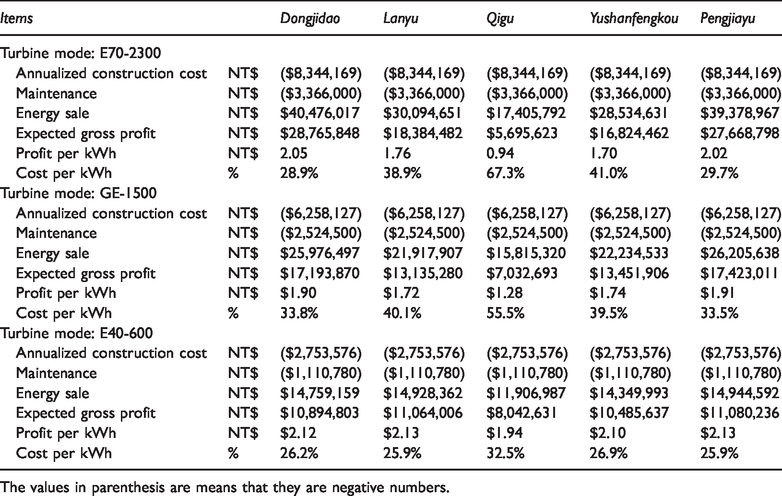
The values in parenthesis are means that they are negative numbers.
Suppose the wind farms are constructed by the government-owned company such as TaiPower Corporation. The results indicate that it is relative economically efficient to develop wind farm sites in which wind resource is highly stable. Although higher power generation implies higher revenues, it does not mean that installation of high-power turbines is efficient. To be cost effective, we should compare the profit per kWh of different engines rather than net revenue. Under such a consideration small turbine (i.e., E40-600 model) seems to perform well because they require a lower investment per unit of power generated.
There is merit to discuss this result further because it is sometimes confusing. In places with strong wind, large turbines are likely to generate more electricity and more energy sales, but how come it is not more cost effective? A possible explanation to this result is due to the low operation efficiency of turbines. This can be found in Appendix Table 8 where the operation efficiency of turbines are generally less than 57%, implying a substantial amount of investment does not generate any revenue when the system is idle. However, if the operation system is more stable or the efficiency can be improved, high-power turbines may still be an attractive alternative. Cost effective plays an important role in the face of capital rationing. Since multiple renewable energy technologies such as bioenergy and solar PV are also proposed by various parties, budgets allocating to wind power may be limited, and thus determination of most cost effective strategy in wind farm construction is necessary.
However, the situation may be totally different if these sites are developed by private sectors. Assume that these sites are conjunctive developed by many companies and each company can choose to develop only one or two wind farms. In this case where capital rationing does not exist, individual company will only consider the net profit rather than the efficiency. For example, a company will prefer a NT$10 million project with 20% return to a NT$1 million project with 10% return if this company can only develop one or two farms. Therefore, the company will choose the turbine that yields the greatest net present value, whether this turbine is considered as the most cost-effective alternative.
Environmental influences
In addition to economic components, environmental consequences can also be monetized. Environmental benefits and damages are generally hard to compute because they often pertain to non-marketable assets such as biodiversity and recreation. In this study, we calculate the potential fossil replacement from wind power to estimate the emission reduction, and then provide a forest-equivalent measure so that the environmental benefits can be reflected. Table 4 shows the results.
Environmental benefit of wind farm sites.
Ceteris paribus, more electricity generated by wind power, more imported coal can be replaced. The results show that, depending on the site characteristics, wind farms can offset considerable amounts of emission. For Dongjidao and Pengjiayu where wind resource is sufficient and relatively stable, more than 5000 tons of coal can be replaced annually, which is sequestering more than 7200 metric tons of emission or equivalent to afforestation of 750 hectares.
It is noteworthy to point out that above calculation only provides a rough estimate that shows the emission reduction benefit from wind farm construction. The afforestation benefit, in general, contains both market and nonmarket values. Because emission reduction only reflects market values of afforestation, the estimated benefit shown in Table 4 may be greatly understated.
Totality of value
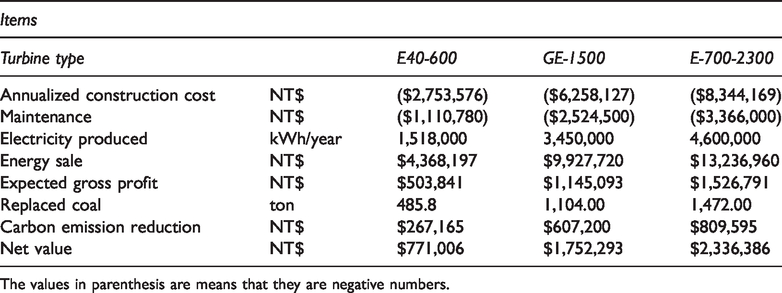
The wind power development can have positive economic and environmental benefits in some sites, but the results may not be representative since a large-scale development of wind power is very likely to involve sites whose electricity potential is lower. Therefore, if we only consider the sites with great power generation, this analysis will simply end up with a bright conclusion: development of wind farm everywhere is profitable. This study thus uses a more conservative measure by averaging the profitability to avoid overoptimistic estimates. Table 5 shows the economic and environmental consequences results for the “average” sites (the sites whose electricity potentials are ranked between 170 and 200, out of 370 scheduled sites).
Economic and environmental effects of wind farm.

The values in parenthesis are means that they are negative numbers.
We show that if “average” sites are developed, profits can still be expected. The results imply that in general a large-scale development of wind power in Taiwan is economically feasible. However, it is noteworthy to indicate that these results are based on the assumption that the development is engaged by private sectors, for which pursue greatest power generation and return rather than efficiency. Therefore, if capital rationing exists or these projects are developed by the government, it is necessary to investigate the efficient use of funds and verifies the development on these “average” sites.
Sensitivity analysis
The results indicate that most of proposed sites could end up with profits. However, the results merit further discussion because the analyzed components such as construction cost, transportation effort, and defined electricity purchase price could vary during construction. Under such a consideration, a sensitivity analysis that examines how variation of a factor would influence the results is useful to explore these uncertainties. In this study, we examine the variation of construction costs and maintenance fee related to site construction, daily operation, and repair. The results are presented in Table 6.
Sensitivity analysis for average sites without environmental benefits.
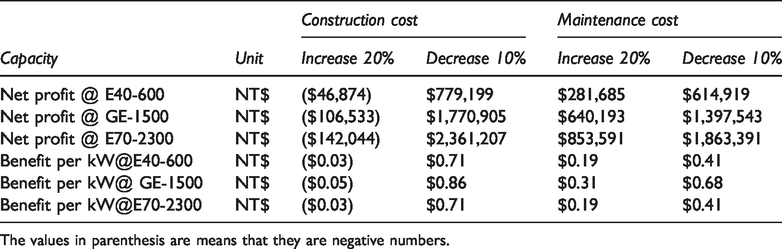
The values in parenthesis are means that they are negative numbers.
When construction costs is 20% higher than expected, electricity sales from wind power cannot cover the development costs, regardless of turbine types. On the contrary, the changes in the maintenance cost have a smaller impact on profitability. For an average site, as long as the maintenance cost inflates less than 45.4%, a profit can be received. If we include the value of the emission reduction using the emission price listed on Chicago Climate Exchange, no loss would occur for an average site if the construction cost increases less than 28%.
Policy implications
This study integrates several important issues in wind power development by exploring a more precise approach to estimate the power curves, estimating the power potential of 370 proposed sites, illustrating potential economic and environmental benefits from average sites, and depicting the influences of uncertain parameters. Some policy implications can be derived from these results.
Monitoring of global circulation patterns must be implemented. Since the stability and strength of wind resource is highly dependent on the global circulation pattern, it is necessary to monitor the global circulation patterns. This issue is important because the global climate shift that potentially alters the circulation patter is unprecedentedly fast, and it will not be feasible to simply use the estimates from previous studies. Adoption of updated global circulation models, as well as climate change projections released by IPCC can be an option. A greater effort may be required, but such an effort may benefit multiple industries such as agriculture and fishery. For example, a better forecasting in climate change and global circulation pattern means that we may be able to predict the precipitation, temperature, and hunter-gathering mode of fish more precisely, and provide more information on crop selection, land-use improvement, resource allocation, and fishing strategy. Profitability and efficiency may not be maximized simultaneously. We show that the most proposed sites can generate a significant amount of electricity and end up with profits. However, profitability cannot be always translated to efficiency. For example, there are two sites (A, B), whose construction and maintenance cost defined as ($1million, $5 million), and suppose their profits are ($3 million, $9 million). It is easily to see that A’s profit is less than that of B, but it is too early to conclude that B is the better choice because efficiency is ignored. This situation is extremely crucial when we are limited in budgets. If the government decides to develop these sites by its own, this situation must be taken into account. But if the sites are to be developed by many companies, profitability may be of priority because individual companies only need to develop a small number of sites. Therefore, whether to focus on profitability or efficiency depends on the characteristics of developers. Social-economic factors such as inflation and consumer price index must be integrated in the decision-making process. Factors involved in wind farm construction can be highly uncertain. For example, the construction cost consists of material, transportation, labor, and miscellaneous items, all of which are subject to change in the face of uncertain market operations. Therefore, it is necessary to investigate how changes in these factors may vary the results. The sensitivity analysis or scenario analysis may be applied, and Monte Carlo analysis may be conducted if the probability of such changes can be predicted. A thorough and comprehensive investigation on these factors can improve the quality and robustness of the results. Promotion policies that integrate multiple renewable energy technologies must be encouraged. We show that wind power can contribute a significant amount of electricity, but it is still very unlikely to recover the lost nuclear power only from wind power. Therefore, other renewable energy technologies may be conjunctive applied to enhance energy security. Joint application of solar energy and bioenergy can also be attractive to Taiwan, but the overall economic and environmental effects require additional investigation. For example, issues regarding energy crop selection, technology (liquid or non-liquid) determination, cropland utilization, and competition among renewable alternatives should be explored and the impacts on social welfare associated with these issues must be estimated.
Conclusions
Wind power is an effective technology to provide renewable energy and sequester carbon dioxide. Taiwan has proposed 370 wind farm sites but information regarding power generation and economic feasibility from these sites is limited. This study unburies these answers.
To better estimate the electricity potential, this study employs the updated global circulation models and Weibull distribution to estimate the turbine’s energy curve, and we find that the deviation of energy output can be largely reduced. The results show that wind speed is highly related to turbine selection. For example, if E70-2300 turbine is applied in Dongjidao, annual electricity generation can be 14 million kWh and only 5.13 million kWh will be obtained if E40-600 turbine is used. However, in sites such as Tamsui and Nantou where wind speed is lower, a large turbine does not guarantee a higher electricity output. Therefore, it is clear that a uniform employment of certain turbine is not a good approach to generate highest electricity.
We also show that the most proposed sites can generate a significant amount of electricity and end up with profits. However, profitability cannot be always translated to efficiency, depending on the characteristics of developers. Additionally, we find that for an average site, as long as the maintenance cost inflates less than 45.4%, a profit can be received. If the value of the emission reduction is included, no loss would occur for an average site unless the construction cost increases more than 28%.
Understanding the potential change in future climate is also important because wind power potential is greatly influenced by climate pattern. If the climate changes significantly, the results presented in this study may become less useful, and more effort on monitoring and simulating future climate patterns may be required. Future studies are encouraged to incorporate such factors to conduct a more comprehensive and robust analysis.
Supplemental Material
EEA903428 Supplemental Material - Supplemental material for An economic analysis on Taiwanese wind power and regional development
Supplemental material, EEA903428 Supplemental Material for An economic analysis on Taiwanese wind power and regional development by Li-Jiun Chen, Liguo Zhang and Chih-Chun Kung in Energy Exploration & Exploitation
Footnotes
Declaration of conflicting interests
The author(s) declared no potential conflicts of interest with respect to the research, authorship, and/or publication of this article.
Funding
The author(s) disclosed receipt of the following financial support for the research, authorship, and/or publication of this article: The authors thank the financial support from the National Science Foundation of China (41861042; 71663025), Distinguished Young Scholar Program of Jiangxi Province (20171BCB23047), and Science Program of Jiangxi Bureau of Education (GJJ190275). The authors also thank for the assistance of Dr. Bruce McCarl at Texas A&M University and Dr. Chi-Chung Chen at National Chung-Hsing University for their modeling opinion.
References
Supplementary Material
Please find the following supplemental material available below.
For Open Access articles published under a Creative Commons License, all supplemental material carries the same license as the article it is associated with.
For non-Open Access articles published, all supplemental material carries a non-exclusive license, and permission requests for re-use of supplemental material or any part of supplemental material shall be sent directly to the copyright owner as specified in the copyright notice associated with the article.