
Abstract
A good heating regulation should be able to maintain relatively stable indoor temperature. Hence, the dynamic control scheme of a heating system should be formulated considering outdoor temperature, solar radiation, wind speed and direction, and other meteorological factors, rather than just the outdoor temperature. A dynamic control strategy of a heating system based on an integrated meteorological parameter is proposed, which converts several parameters into one using the equivalent influence method. An analysis of the thermal dynamic characteristics of both the building envelope and the heating system established a complete feedforward control scheme. A residential community in north China was selected to conduct operation data monitoring using the aforementioned model. Results showed that the new control scheme could effectively stabilize indoor temperature. The variance of the indoor temperature was 0.48 using the traditional method, and that of the test object was 0.31 after adopting the proposed model.
Keywords
Introduction
In addition to outdoor temperature, indoor building temperature is also affected by solar radiation, rain or snow, speed and direction of wind, and other meteorological factors. The influence of these meteorological parameters has been increasingly important, especially with the frequent occurrence of extreme weathers in China in recent years. An investigation on how an integrated meteorological parameter could control the heating system is of great significance. Different meteorological parameters affect indoor temperature through different parts of the building envelope, and the heating system influences the indoor condition through cooling equipment. These two influences result in indoor temperature fluctuation. Due to the thermal inertia of the envelope and the thermal characteristics of the heating system itself, indoor temperature is the coupling result of these changes. In order to establish an accurate regulation scheme of a heating system, it is necessary to clarify the impact of different meteorological parameters on different parts of the envelope, which is an hourly dynamic heat load. In addition, it is necessary to clarify the lagging characteristics of the heating system.
Many scholars have investigated the dynamic response of building thermal load toward meteorological parameters. Gadd and Werner (2013) conducted tests on multiple heating systems in Sweden and concluded that the main meteorological factors affecting the heat load include outdoor temperature, wind speed, and solar radiation. Their study revealed that 60% of the total heat load is affected by outdoor temperature, the change of wind speed can increase the heat load by 1–4%, and the heat of solar radiation can reduce the heat load by 1–5%. The main reason for the change in the heat consumption of domestic hot water is the personal utilization factor. For example, the heat consumption of hot water on weekdays would be significantly different from the consumption on weekends. An average domestic hot water load accounts for 30% of the total load, and pipeline heat loss accounts for about 5–8% of the total load. Wojdyga (2008), a Polish scholar, studied the architecture of the Afeyon region in Poland. The autoregressive (AR) model was used to fit the heat load and daily energy consumption data of three heating seasons by substituting meteorological parameters and the results were compared with the actual recorded data. For input parameters of the AR model, outdoor temperature, wind speed, and solar radiation are considered as being in a linear relationship. The heat storage of the building envelope is considered as being in a linear relationship with the thermal load of the previous day. The change in humidity has little impact on the thermal load of a building; thus, it is defined as a constant. The results showed that the average daily outdoor temperature was negatively correlated with daily energy consumption, with a correlation coefficient of −0.776. Danish scholars, Bacher et al. (2013), have proposed a prediction method of hourly thermal load within 48 h. The coefficient in the prediction model was determined by identifying the real-time-measured data of 16 local buildings. The meteorological parameters considered in the model included outdoor temperature, solar radiation, wind direction, and wind speed. The lagging effect of different meteorological parameters on the building was first analyzed, and then the input values of meteorological parameters at corresponding times were studied. Wind speed was obtained based on the velocity and multiplied by different correction factors based on wind direction. Solar radiation was multiplied by the corresponding coefficients in the morning, afternoon, and evening. A fuzzy black box method was proposed by Australian scholars, Killian et al. (2015), to analyze the thermal characteristics of buildings. They emphasized the importance of input data pre-processing to the accuracy of the model. The input parameters of the fuzzy black box method are water supply temperature, outdoor temperature, solar radiation, and vacancy rate, and the output parameter is the indoor temperature.
Some studies aimed to introduce the influence of meteorological parameters into the heating system control using the model predictive control method, and experimental investigations were carried out to evaluate the results. Some heating systems introduce the impact of the meteorological parameter directly to the heating system through the climate compensator, but the main inputting meteorological parameter is the outdoor temperature. A German scholar, Crijns (2015), analyzed the heat supply operation of three government buildings of Nordrhein-Westfalen in western Germany after installing the weather forecast system. The test results for three consecutive years showed that the new operation strategy improved the indoor comfort level and achieved an average energy-saving effect of 12%. Czech scholars, Prívara et al. (2011), believed that the traditional building heating operation system (the control system based on climate compensation) could not effectively utilize the free heat in the buildings, especially the heat from solar radiation; thus, it could not respond well to the heat required in the buildings. Furthermore, the traditional heating operation will result in insufficient heat supply when there is a sharp drop in the outdoor temperature. According to Prívara, the predictive control system involved both weather forecasts and the dynamic thermal model of the building; therefore, it guaranteed a minimum energy consumption of heat supply while keeping the indoor comfort level within a certain range. To accomplish such a sophisticate dynamic prediction, both the input of the building model and the accuracy of the meteorological parameter prediction would have important influences on the results. Meanwhile, input parameters also need certain processing to optimize the regulation effect. By testing a university building during the heating season in 2009–2010, the authors showed that this predictive control strategy could achieve an energy saving ratio of 17–24%. Swiss scholar, Oldewurtel et al. (2012), put forward a stochastic model predictive control (SMPC) method based on the black box method. The model is based on the analysis of building thermal inertia and climate prediction to control the heating capacity of the building. According to the authors, there are many computer modeling tools, such as TRNSYS and EnergyPlus, which are used to evaluate building energy consumption, but not for building heat regulation. The building input model analysis in the SMPC model construction is based on the principle of capacitor thermal resistance. The author adopted the COSMO-7 weather forecasting model provided by the Swiss national weather service, MeteoSwiss (2019), to improve the weather forecast model (outdoor temperature, humidity, solar radiation) based on the Gaussian uncertainty, in order to control the building climate compensation. The results indicated that the SMPC method can effectively lower the energy consumption of buildings. It is worth noting that the authors also concluded that the effect of the model has a significant correlation with the accuracy of weather prediction. Danish scholars, Petersen and Bundgaard (2014), investigated the influence of uncertainty of the weather forecast on a building operation based on the prediction value. The research object was a double office with one window in Aarhus, Denmark. The study concluded that even though uncertainty exists in the weather forecast, compared with the traditional control mode, predictive control is still able to save energy or improve the indoor comfort level.
In summary, scholars from various countries have conducted a high number of studies about the influence of multiple meteorological factors on the dynamic thermal load of buildings (Liu et al., 2019). In addition, they have attempted many practices of dynamic regulation and control of heating based on multiple meteorological parameters. The majority of these studies were conducted based on experience and actual data, but the research on the coupling mechanism of the building’s envelope structure and the heating system has not been carried out yet; therefore, the value in generalizing those models is limited.
The purpose of this paper is to establish a dynamic regulation model of the heat supply system based on an integrated meteorological parameter. First, a dynamic regulatory model of heating system based on an integrated meteorological parameter is proposed, which converts multiple meteorological parameters into one integrated outdoor meteorological parameter using the equivalent influence method. The harmonic method was adopted to theoretically decouple the coupling effect of a heating system and envelope on indoor temperature, in order to increase the accuracy. Thus, a complete set of the feedforward control strategy was established. An actual heating community in the cold region of north China was chosen to test the effect on stabilizing indoor temperature.
Dynamic control model of a heating system based on integrated meteorological parameters
The ultimate goal of the dynamic control scheme is to provide heat on demand. This means that, after the heat supply of the heating system is transferred to the cooling equipment, the hourly heat transferred to the indoor area (heat dissipating from the cooling equipment) is exactly equal to the hourly heat loss caused by outdoor meteorological parameters (heat required by the building). In order to realize the matching of the same amount by hour through the regulation of heat supply, it is necessary to predict the required heat of the building first. We need to calculate the heat dissipation of the cooling equipment, and then analyze the theoretical heat supply capacity of the heating system. Finally, we need to determine the water supply temperature, flux, and other heat parameters combining the regulation scheme of heat supply. This new scheme is proposed to ensure that the heating system determines the amount of heat per hour accurately when facing a situation where the heat pipe network delay and attenuation exist along with the thermal inertia of the structure. The following discussion takes radiator heating and quality regulation as examples to introduce the idea of establishing a feedforward dynamic regulation model, with the aim to maintain the indoor temperature constant around the set temperature.
Heat demand of the building
After adopting the dynamic control scheme, the heat demand of buildings will no longer be a steady-state algorithm, but a dynamic one. According to the outdoor temperature
Heat loss from radiator
Heat dissipation from the radiator is calculated using the following formula

It is generally acknowledged that the radiator gives off heat through convection, and the heat transfer coefficient is calculated using the following experience formula

Furthermore, heat loss from the radiator is expressed by the following formula

In a hot water heating system, the average heat medium temperature of the radiator is considered as the arithmetic mean of the inlet and outlet water temperature of the radiator, as seen in the following formula

Heat supply of the heating system
Heat supply of the heating system could be calculated using the following formula

When taking the whole community as the research object,
Dynamic control scheme of heat supply based on integrated meteorological parameter
To achieve heat supply on-demand and keep indoor temperature stable, we need to consider the corresponding relationship between three heat amounts under the following different times

From equation (6), the hourly heat demand
According to the recommended formula given in the China National Standard Thermal Design Code for Civil Buildings GB 50176-93 (1993), the lag time is calculated according to the following formula
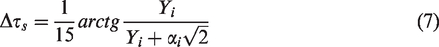
Research has shown that the lag time of a heating system is approximately equal to the fluid flowing in the pipeline (Jie et al., 2012). In this dynamic regulation model, the fluid flowing time is selected as the lag time of the heating system, and the calculation is as follows
DW = diameter of the pipeline (mm)
For a heating system using the qualitative regulation mode, combine formulas (1) to (8) into simultaneous equations, import various physical parameters, and import expected indoor temperature. The result is
The actual operation steps of the regulatory scheme
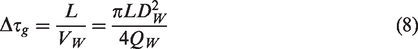
The actual operation steps of the heating system dynamic regulatory scheme based on the integrated meteorological parameter are as follows:
Collect data including the length of the pipeline, the diameter of the pipeline, and the flux. Calculate lag time Collect inner surface heat storage and exchange coefficient of buildings. Calculate the lag time of the radiator Acquire the characteristic parameters of the radiator through a field test; Input real-time and predicted meteorological parameters; Calculate the heat demand of buildings Determine the suggested set water supply temperature
A flowchart of the operation steps is shown in Figure 1.
Flowchart of the operation steps.
Case study of stabilized indoor temperature control in a residential community in the cold region of China
A residential community with heat supply in the cold region of north China was selected to conduct operation data monitoring. The dynamic control scheme was used for the control guidance of the system. The indoor temperature fluctuation of users was compared with the traditional control mode.
Residential building information
The community was built in 2014, with a total land area of 15,500 m2 and a total building area of 36,600 m2. The district is equipped with a gas boiler room and a heat exchange station.
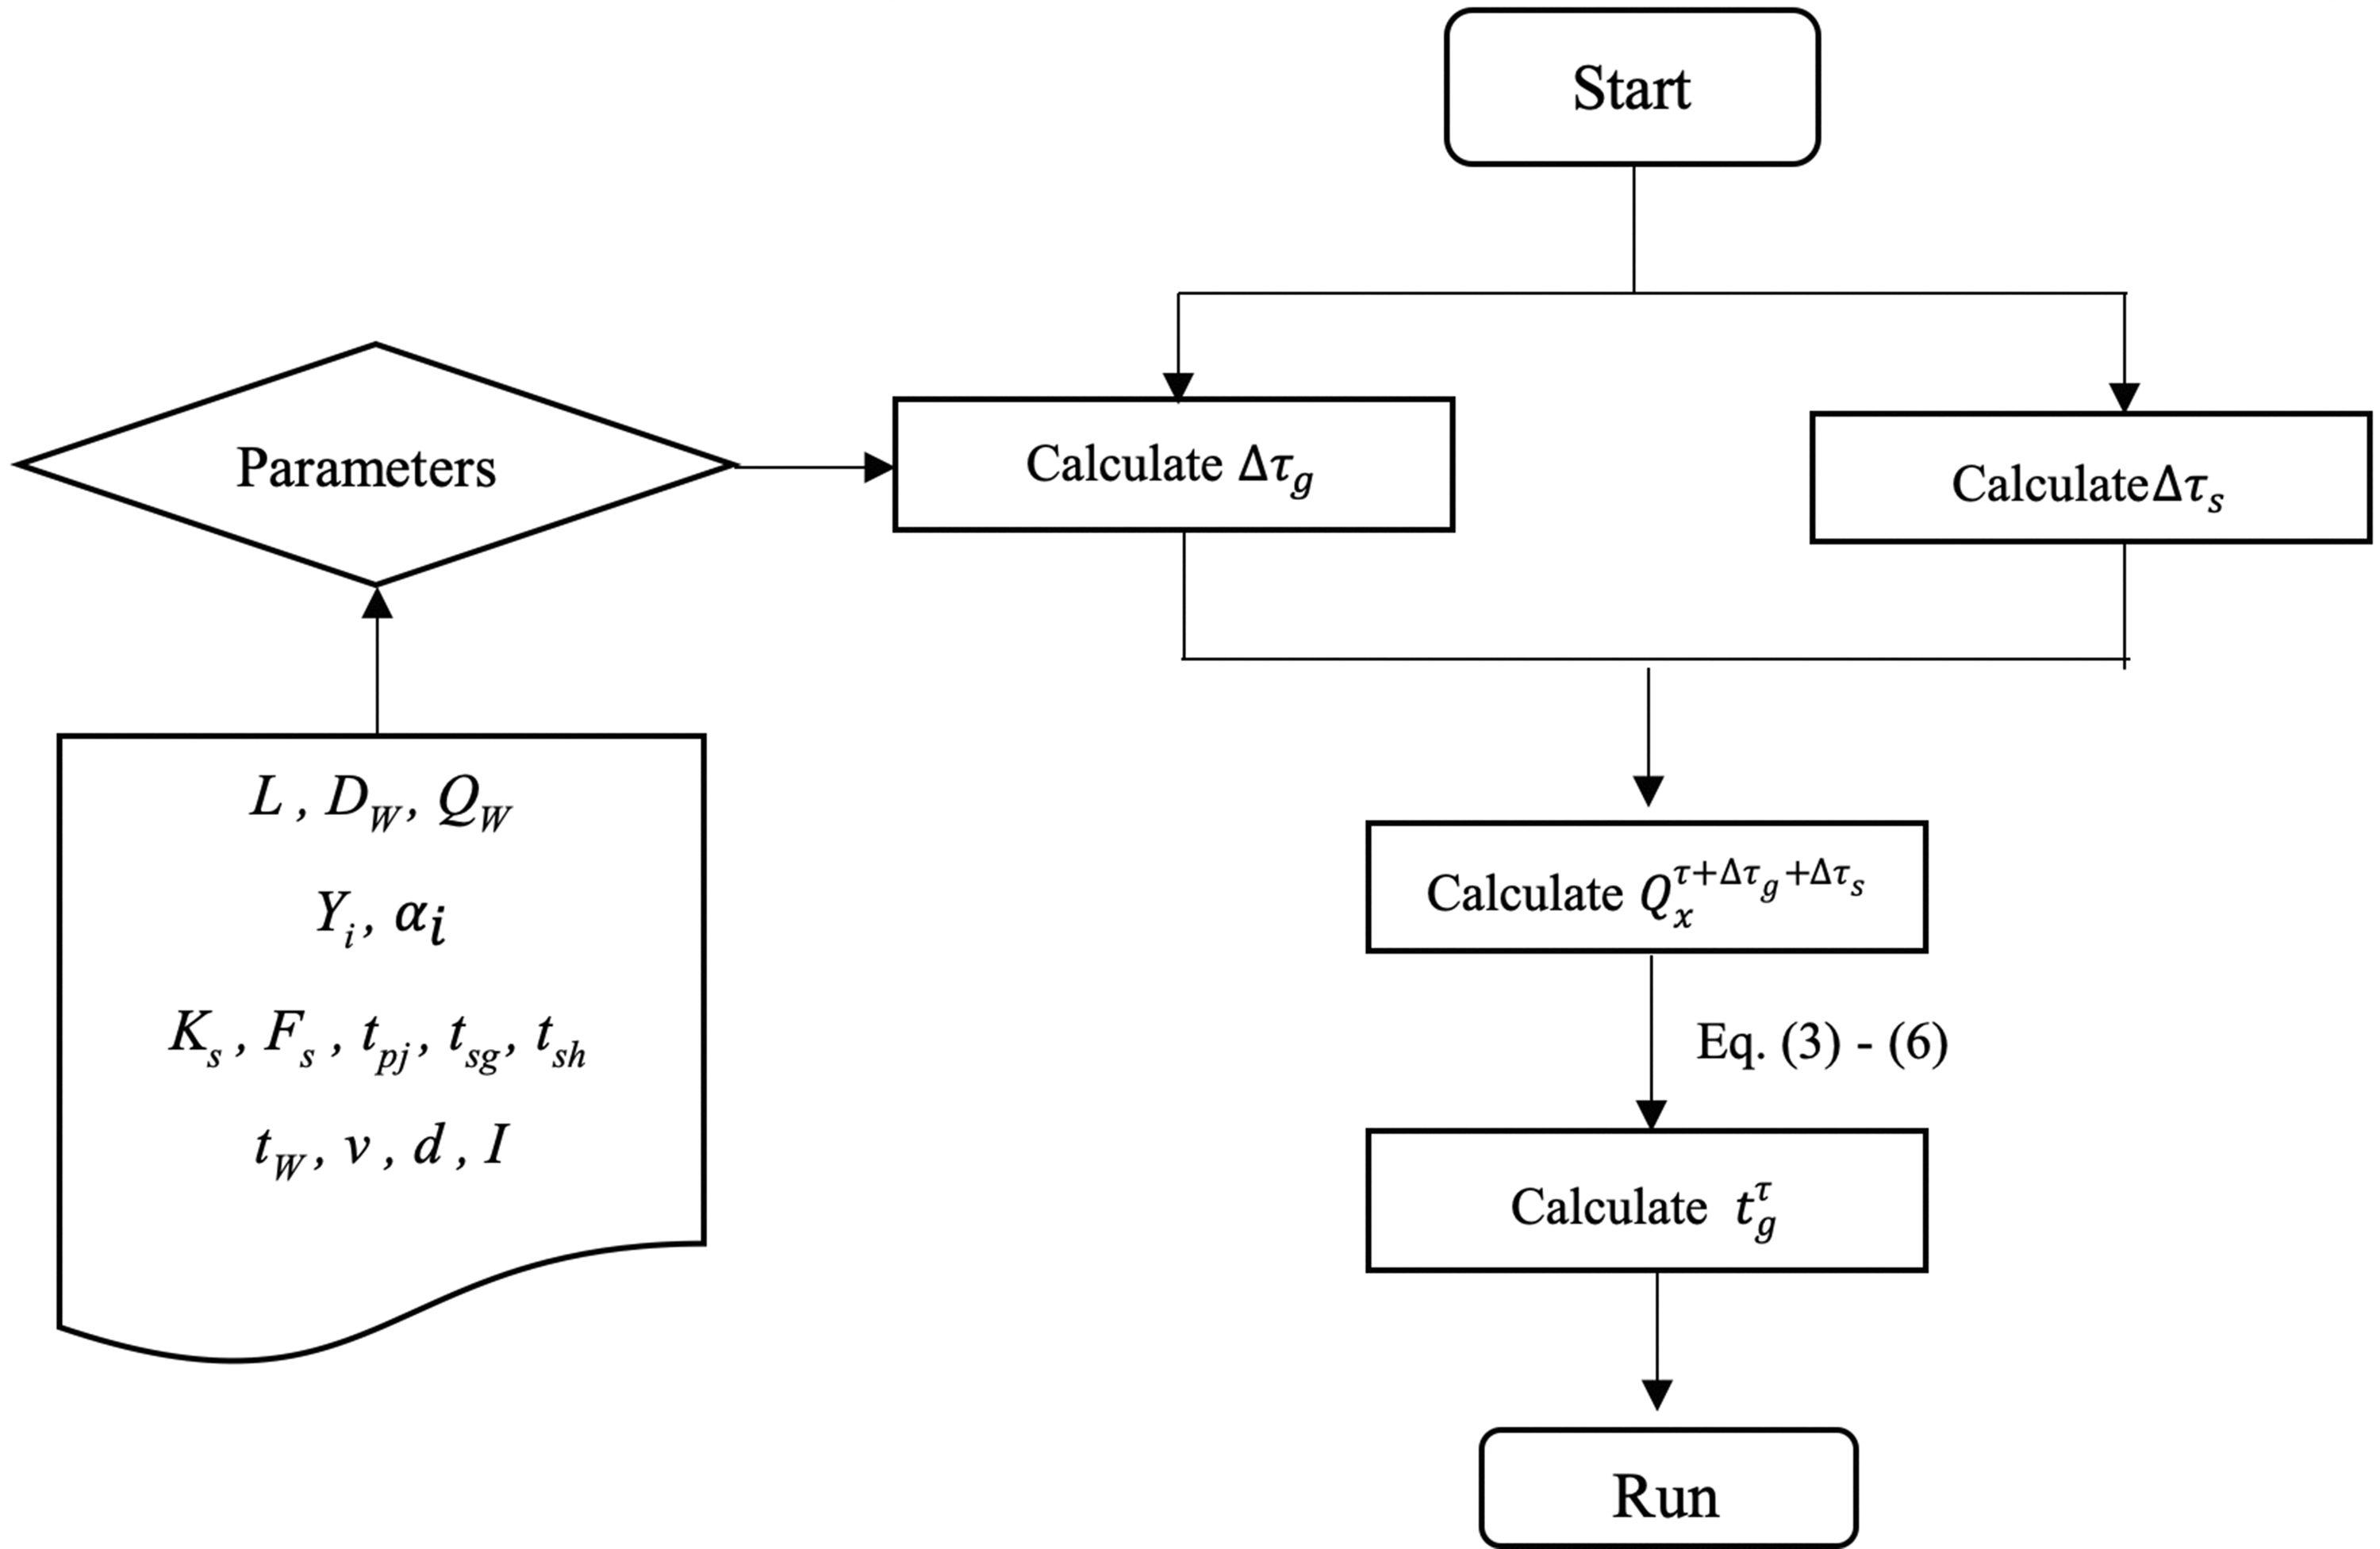
The total building area is 36,600 m2, including 34,500 m2 above ground and 2100 m2 underground, with a plot ratio of 2. The community consists of six residential buildings, one public building, and one underground garage, among which Buildings 1–6 are residential buildings with a construction area of 33,200 m2, Building 7 is a commercial and public facilities building, and Building 8 is an underground garage of two floors. The floor area, floor levels, and heights of each residential building are shown in Table 1. The community’s building layout is shown in Figure 2.
Residential building information.
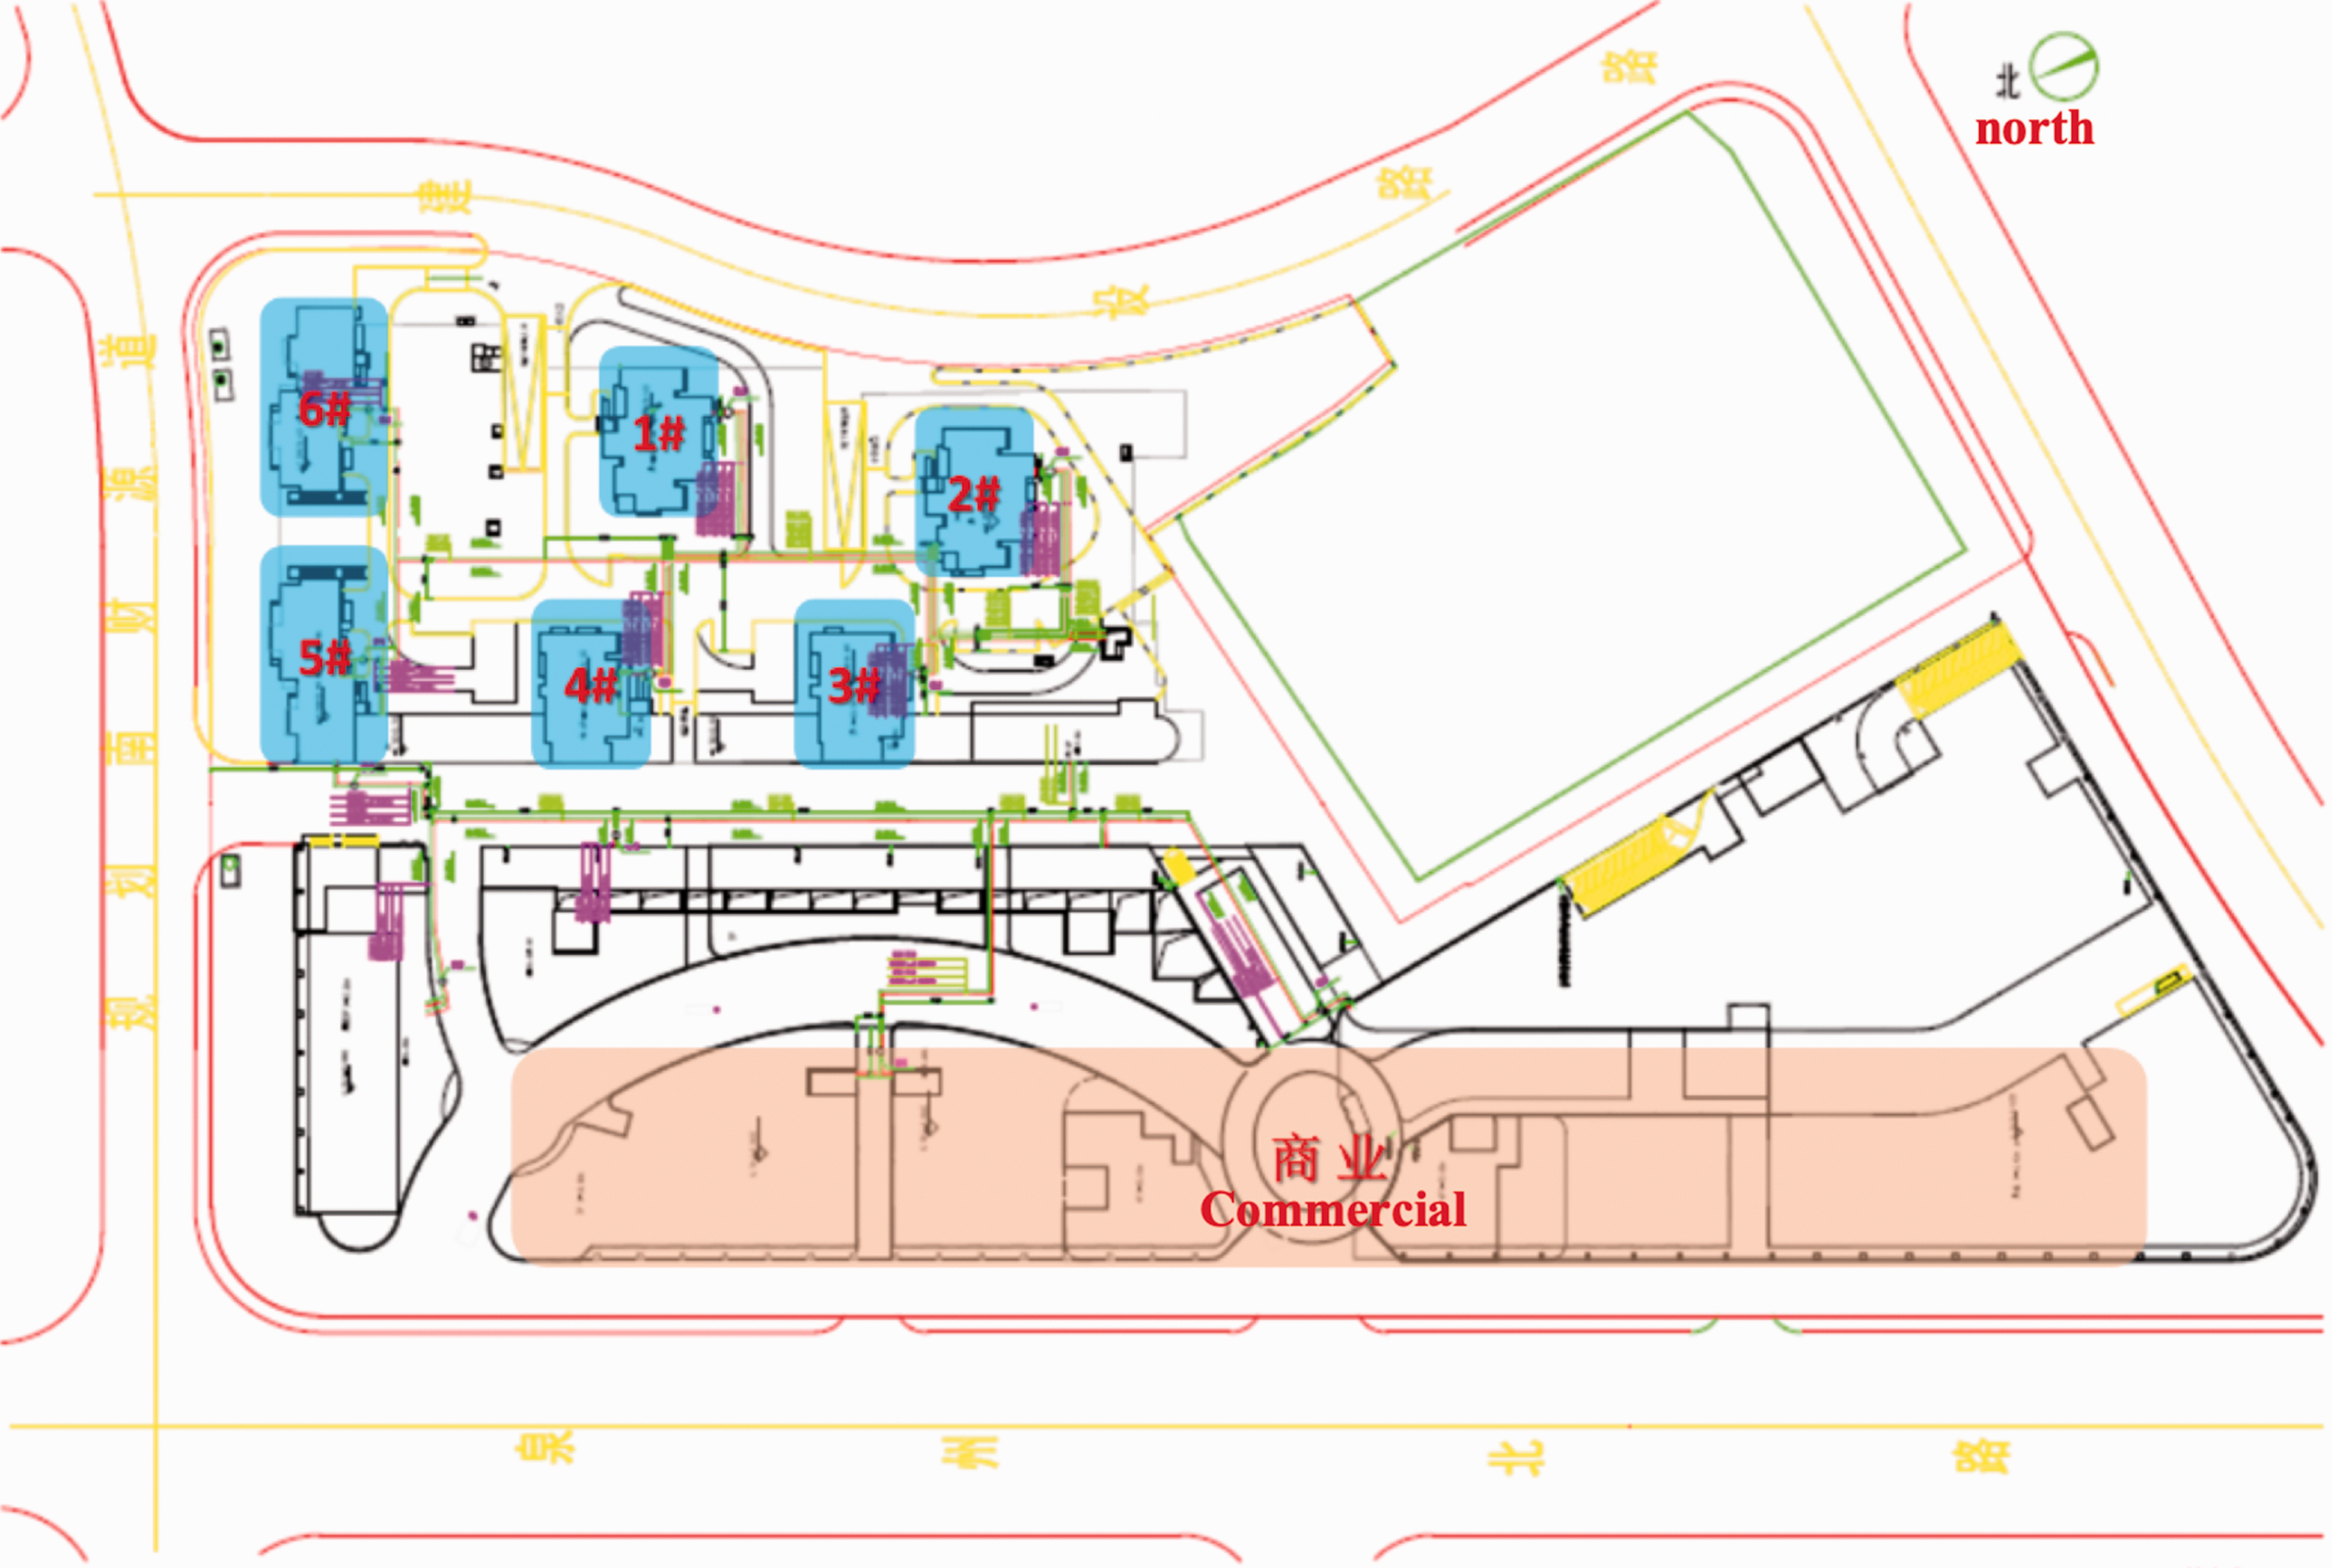
Community plane graph.
Except for the underground garage, which is a frame-shear wall structure, all the other buildings are shear wall structures. For the buildings above the ground, the outer wall used a 200 mm gas concrete block and the inner wall used a 100 mm gas concrete block. For the underground buildings, part of the outer wall used a reinforced concrete block, and the inner wall used a 200 mm gas concrete block.
Community heating information
Heat is generated by two 2.8 MW gas-fired hot water boilers that run simultaneously in the heating season to meet the residential and commercial heat demand. Since the heat loads and the heating properties of different buildings are different, the heating system of the project adopts a combination of direct and indirect heating supply. The residential lower building area and commercial and public buildings have a direct supply system, and the residential upper area has an indirect supply system. The rated water supply and return temperature of the boiler is 95/70°C, and the frequency of circulating the water pump is regulated by the climate compensator in the secondary pipe network, in order to measure the secondary water supply temperature.
Test scheme
The original regulatory scheme of the community was designed mainly to control the water supply temperature according to the outdoor temperature, which was set manually by the workers based on their experience. For example, after 10 March, the water supply temperature was set directly at 35°C from 20:00 to 07:00 the next day. At the end of the heating season, when the weather is moderate, they will switch off the furnace directly during the day (from 08:00 to 19:00).
In January 2019, some residents installed indoor temperature recorders. There are four buildings in the Liya Garden upper building area, among which the building layout of Buildings 1 and 2 is the same, and that of Buildings 3 and 4 is the same. Buildings 2 and 3 were selected for monitoring and installation. There are 128 households in these two buildings, including 88 households in the lower building area and 40 households in the upper area. Forty-six units of temperature recording instruments are installed currently, including 31 units in the lower building area and 15 units in the upper area. In order to transmit the data from the temperature recorder to the control platform, four sets of collectors were installed.
This regulation took monitoring data in February as the object of determining parameters. Take March as the main control time. Through the above-mentioned methods, from 10 March, the actual heating regulation was carried out to stabilize the indoor temperature. Only the lower building areas were regulated, while the upper areas were still subject to the original regulation scheme, in order to compare the effects of regulation.
The information on the main parameters of the control model is shown in Table 2.
Information on the main parameters of the control model.
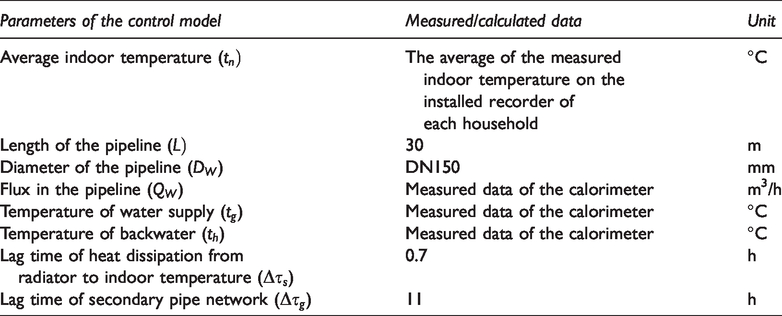
The actual and predicted meteorological parameters used in this test are all from the meteorological bureau of the city where the community is located. The temperature of water supply and backwater had considered the laggings from the radiator and the circuits.
The regulation results analysis
The integrated multi-mode air temperature prediction method was developed for air temperature prediction (Wu et al., 2014). Results show that the average accuracy of integrated prediction for hourly air temperature in 6 h, the minimum air temperature, and the maximum air temperature reached 76.34, 77.88, and 78.00%, respectively. In addition, a prediction technology based on the artificial neural network algorithm was developed for wind speed prediction (Yang et al., 2019). The average absolute error of wind speed within 72 h was 1.72 m/s. In the regulation period of heat supply, the method predicted and forecast the hourly temperature change within the margin of the error. The hourly temperature change during a severe temperature drop is shown in Figure 3. The temperature was under relatively large turbulence and the prediction matched the fluctuation.
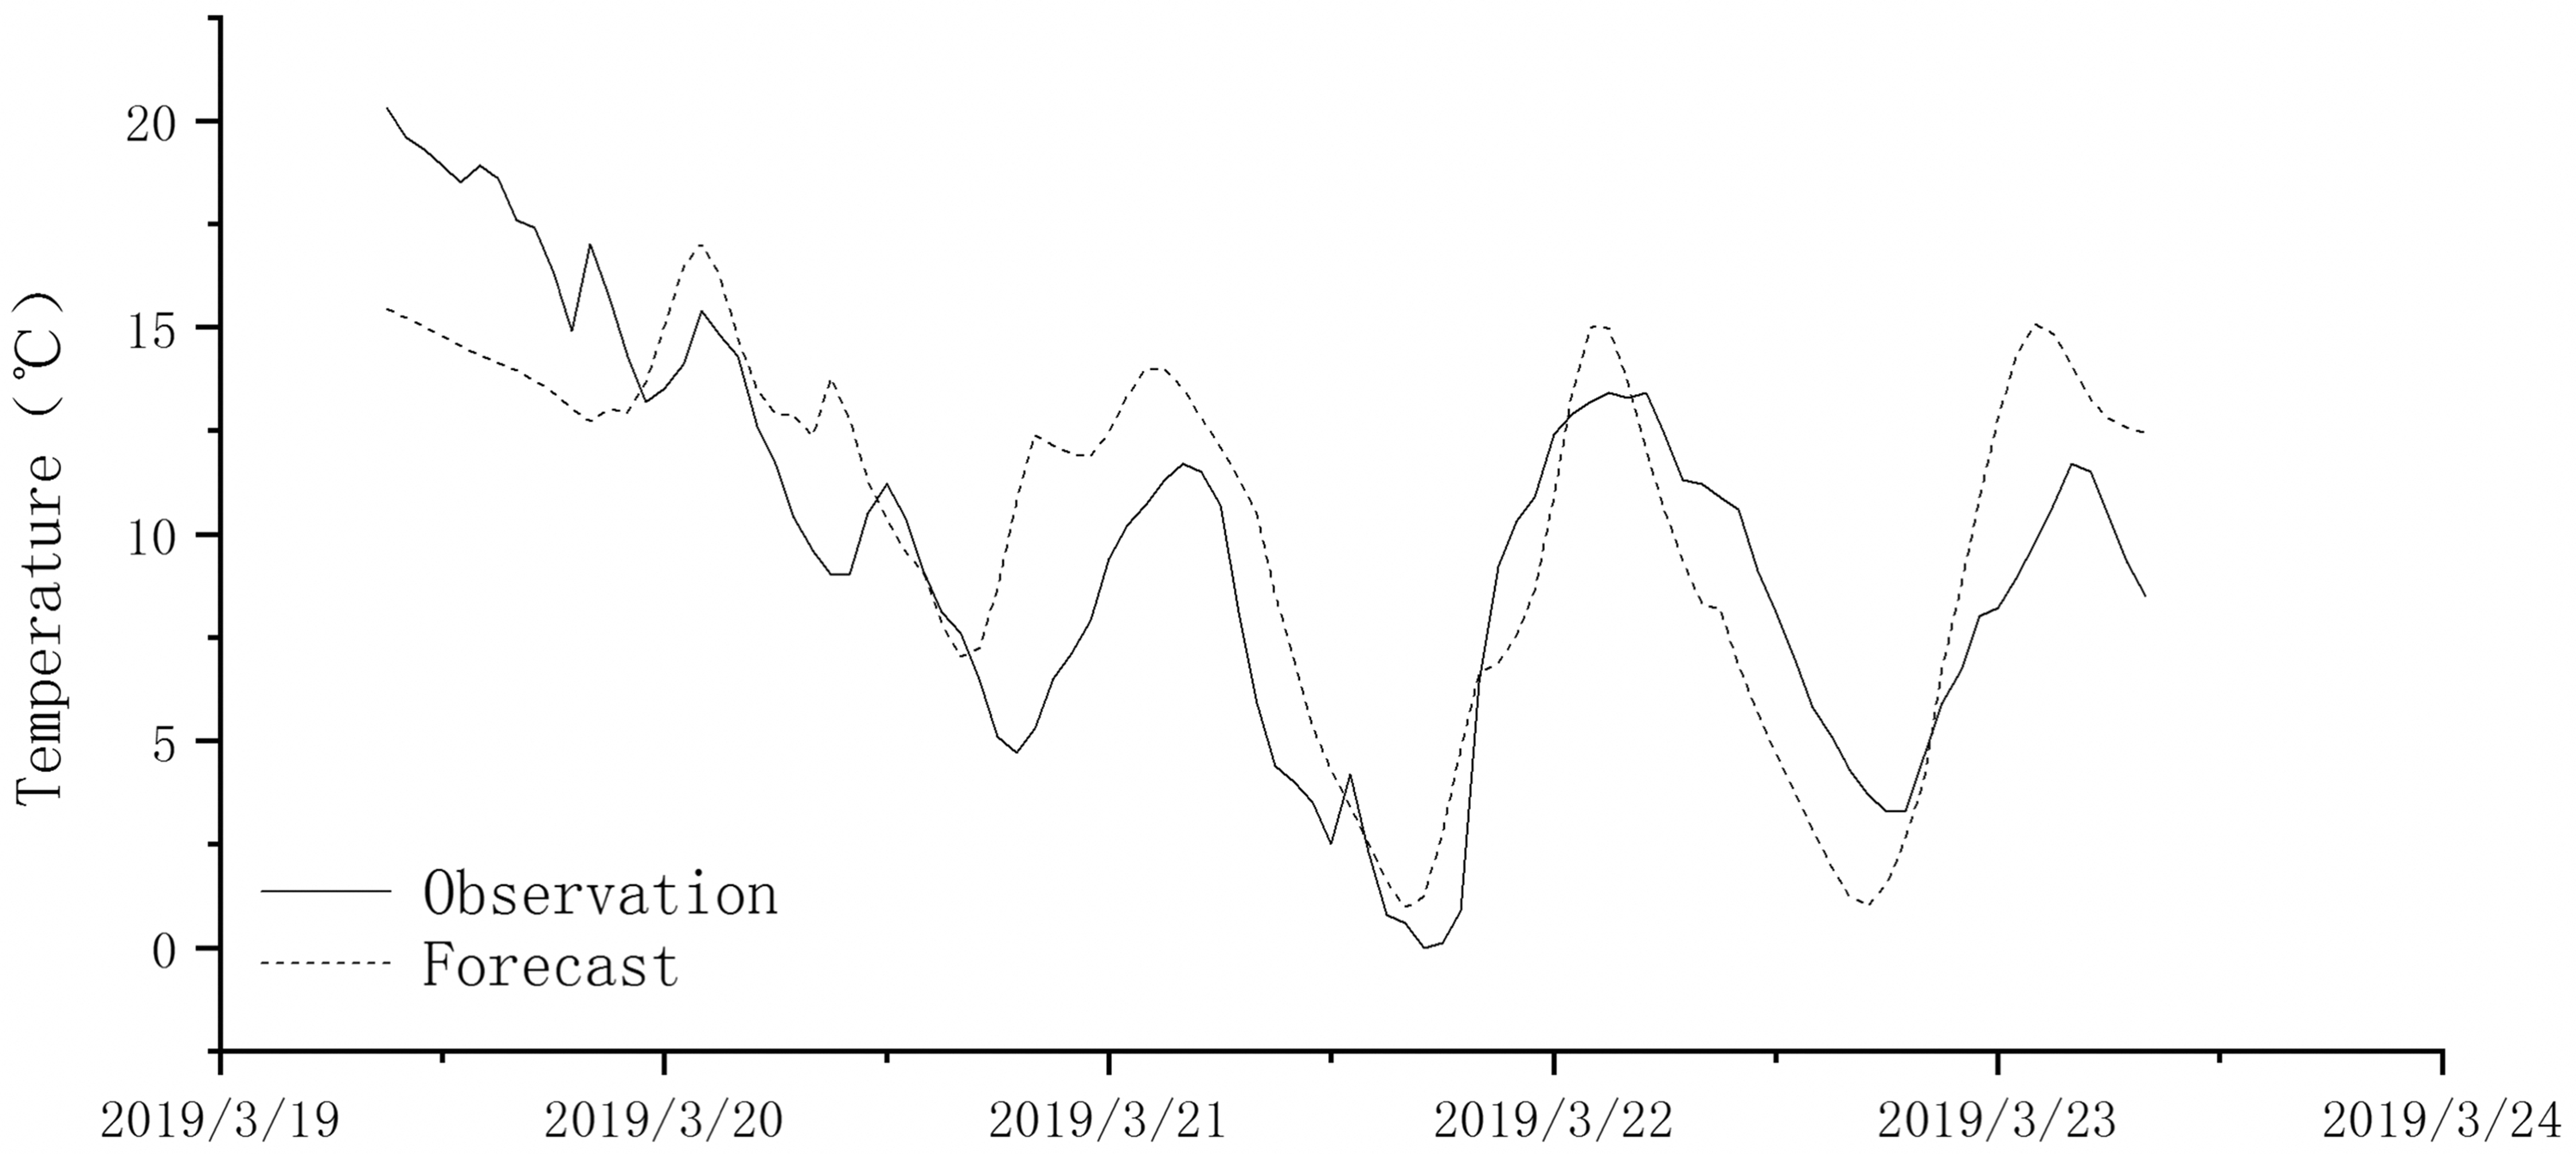
Hourly temperature change in a severe temperature drop process.
Period 2 February–7 February 2019 was chosen as the baseline state. The outdoor temperature during these six days was under relatively small turbulence, so it could reflect the effect of the traditional control strategy on stabilizing indoor temperature. The average indoor temperature in the upper and lower building areas during these six days is shown in Figure 4.
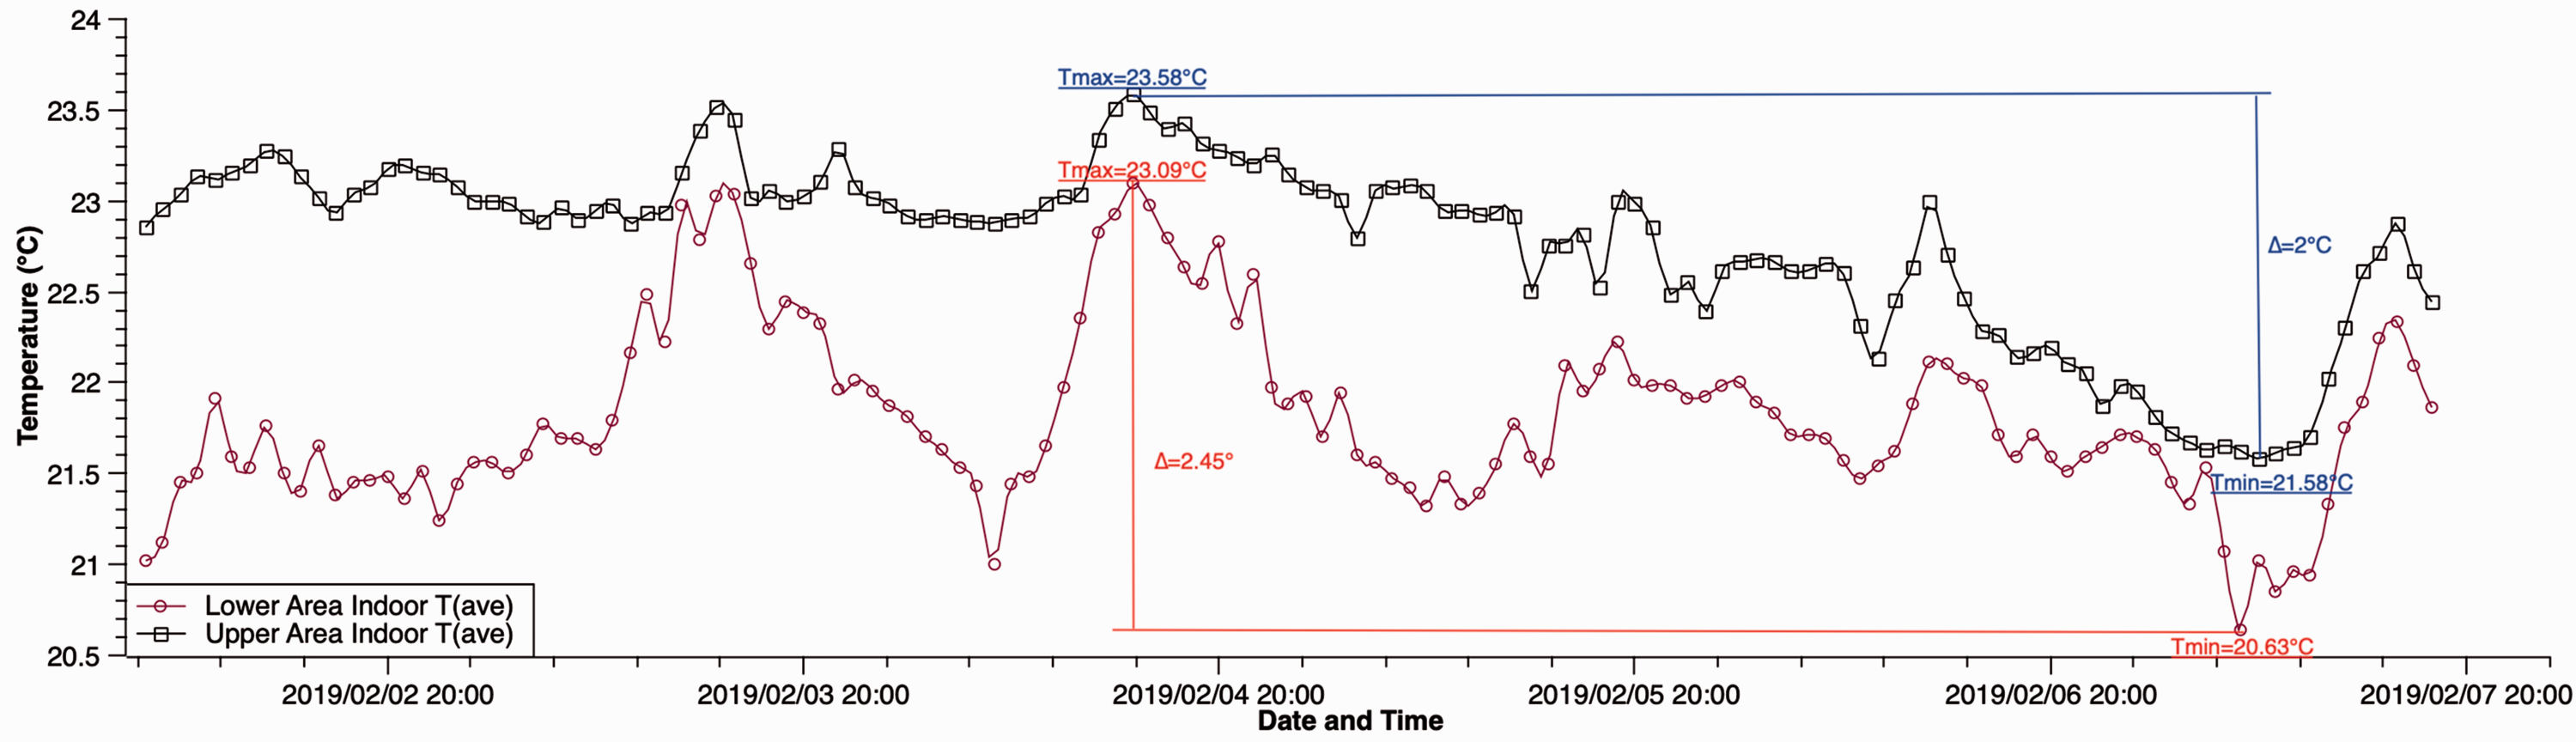
The average indoor temperature comparison of upper and lower building areas from 2 to 7 February 2019.
It can be seen from Figure 4 that, from 00:00 on 2 February to 23:00 on 7 February 2019, the average indoor temperature in both the lower and the upper building regions fluctuated greatly and that the lower building region had greater fluctuation. From the measured data, the average indoor temperature in the lower building area fluctuated from 20.63 to 23.09°C, with a variance of 0.48. The fluctuation range of indoor temperature is 2.45°C, and the maximum hourly fluctuation range within six days was 0.44°C. The average indoor temperature in the upper building area fluctuated from 21.58 to 23.58°C, with a variance of 0.47. The fluctuation range of indoor temperature is 2°C, and the maximum hourly fluctuation range within six days was 0.35°C.
When both the upper zone and the lower zone adopted the original regulation scheme of heating companies, that is under the baseline state, the variances of the indoor temperature are basically the same. And from Figure 4, the change in indoor temperature in the lower area was more obvious than that in the upper area.
We selected 21–23 March (three days) to analyze the effect of the regulatory status, since the outdoor weather temperature changed significantly during those days (Figure 3). There was significant turbulence of the indoor temperature in the lower building region during February; hence, we only applied the aforementioned control method on the lower area, while the upper area was still subject to the original regulation scheme, in order to compare the effects of regulation.
As shown in Figure 5, from 21 to 23 March (three consecutive days), the average indoor temperature in the lower building region fluctuated from 23.5 to 25.06°C, with a variance of 0.31. The average indoor temperature was relatively stable every day. In the upper area, within the same time period, the average indoor temperature fluctuated from 22.28 to 24.3°C, with a variance of 0.47, which is the same with that in February. The average indoor temperature decreased gradually in three consecutive days, with relatively poor stability.
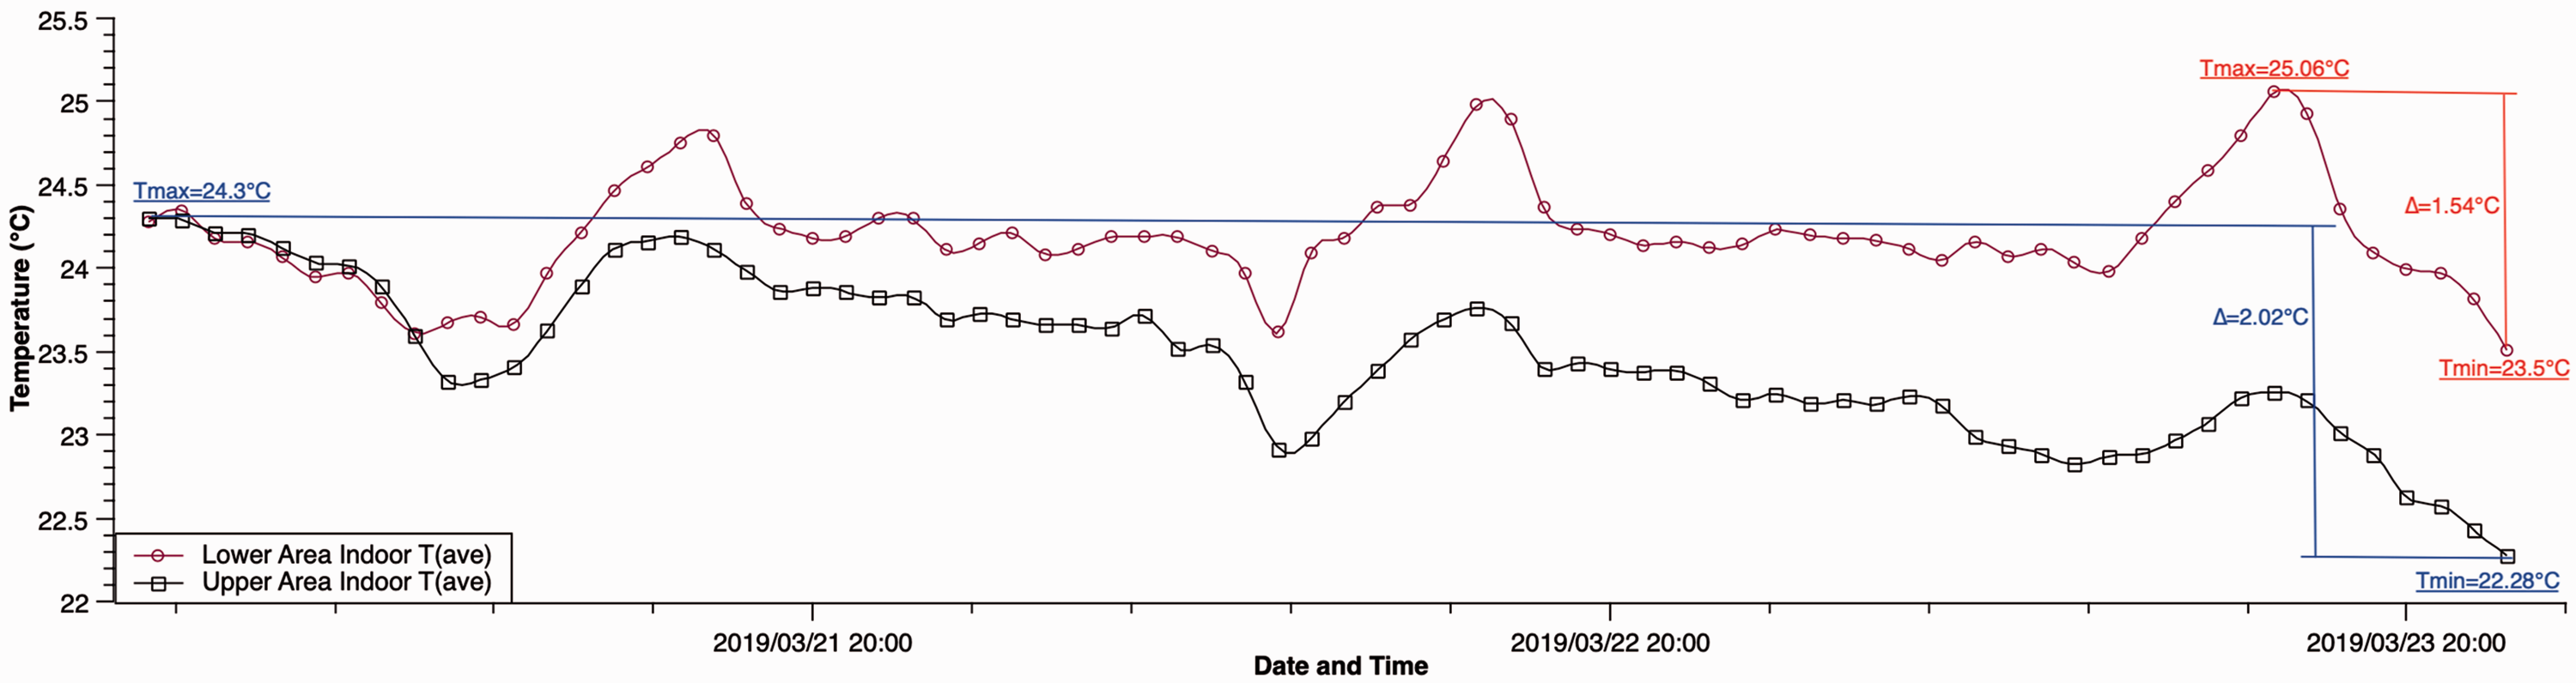
Effect of stabilizing indoor temperature in lower building region from 21 to 23 March 2019.
In addition, before adopting the new control model, the temperature curve of the lower area lied beneath the curve of the upper area, while after imposing the new model on the lower building, the overall indoor temperature of the lower area was relatively higher than that of the upper area. The smaller variance after regulation showed a smaller fluctuation of the indoor temperature; thus, the indoor environment provides a more stable temperature which improved the comfort level.
To present a denser and more visualized comparison between the baseline and the controlled test, we calculated the daily average indoor temperature of the six days discussed earlier and the daily average indoor temperature of the three days discussed above. The controlled object was divided into two parts: 19:00–05:00 and 06:00–18:00, which we labeled “night” and “daytime.” The demand during the daytime and the night was different since the outdoor temperature fluctuation of daytime and night was different as well. The comparison and distinction are shown in Figures 6 and 7.
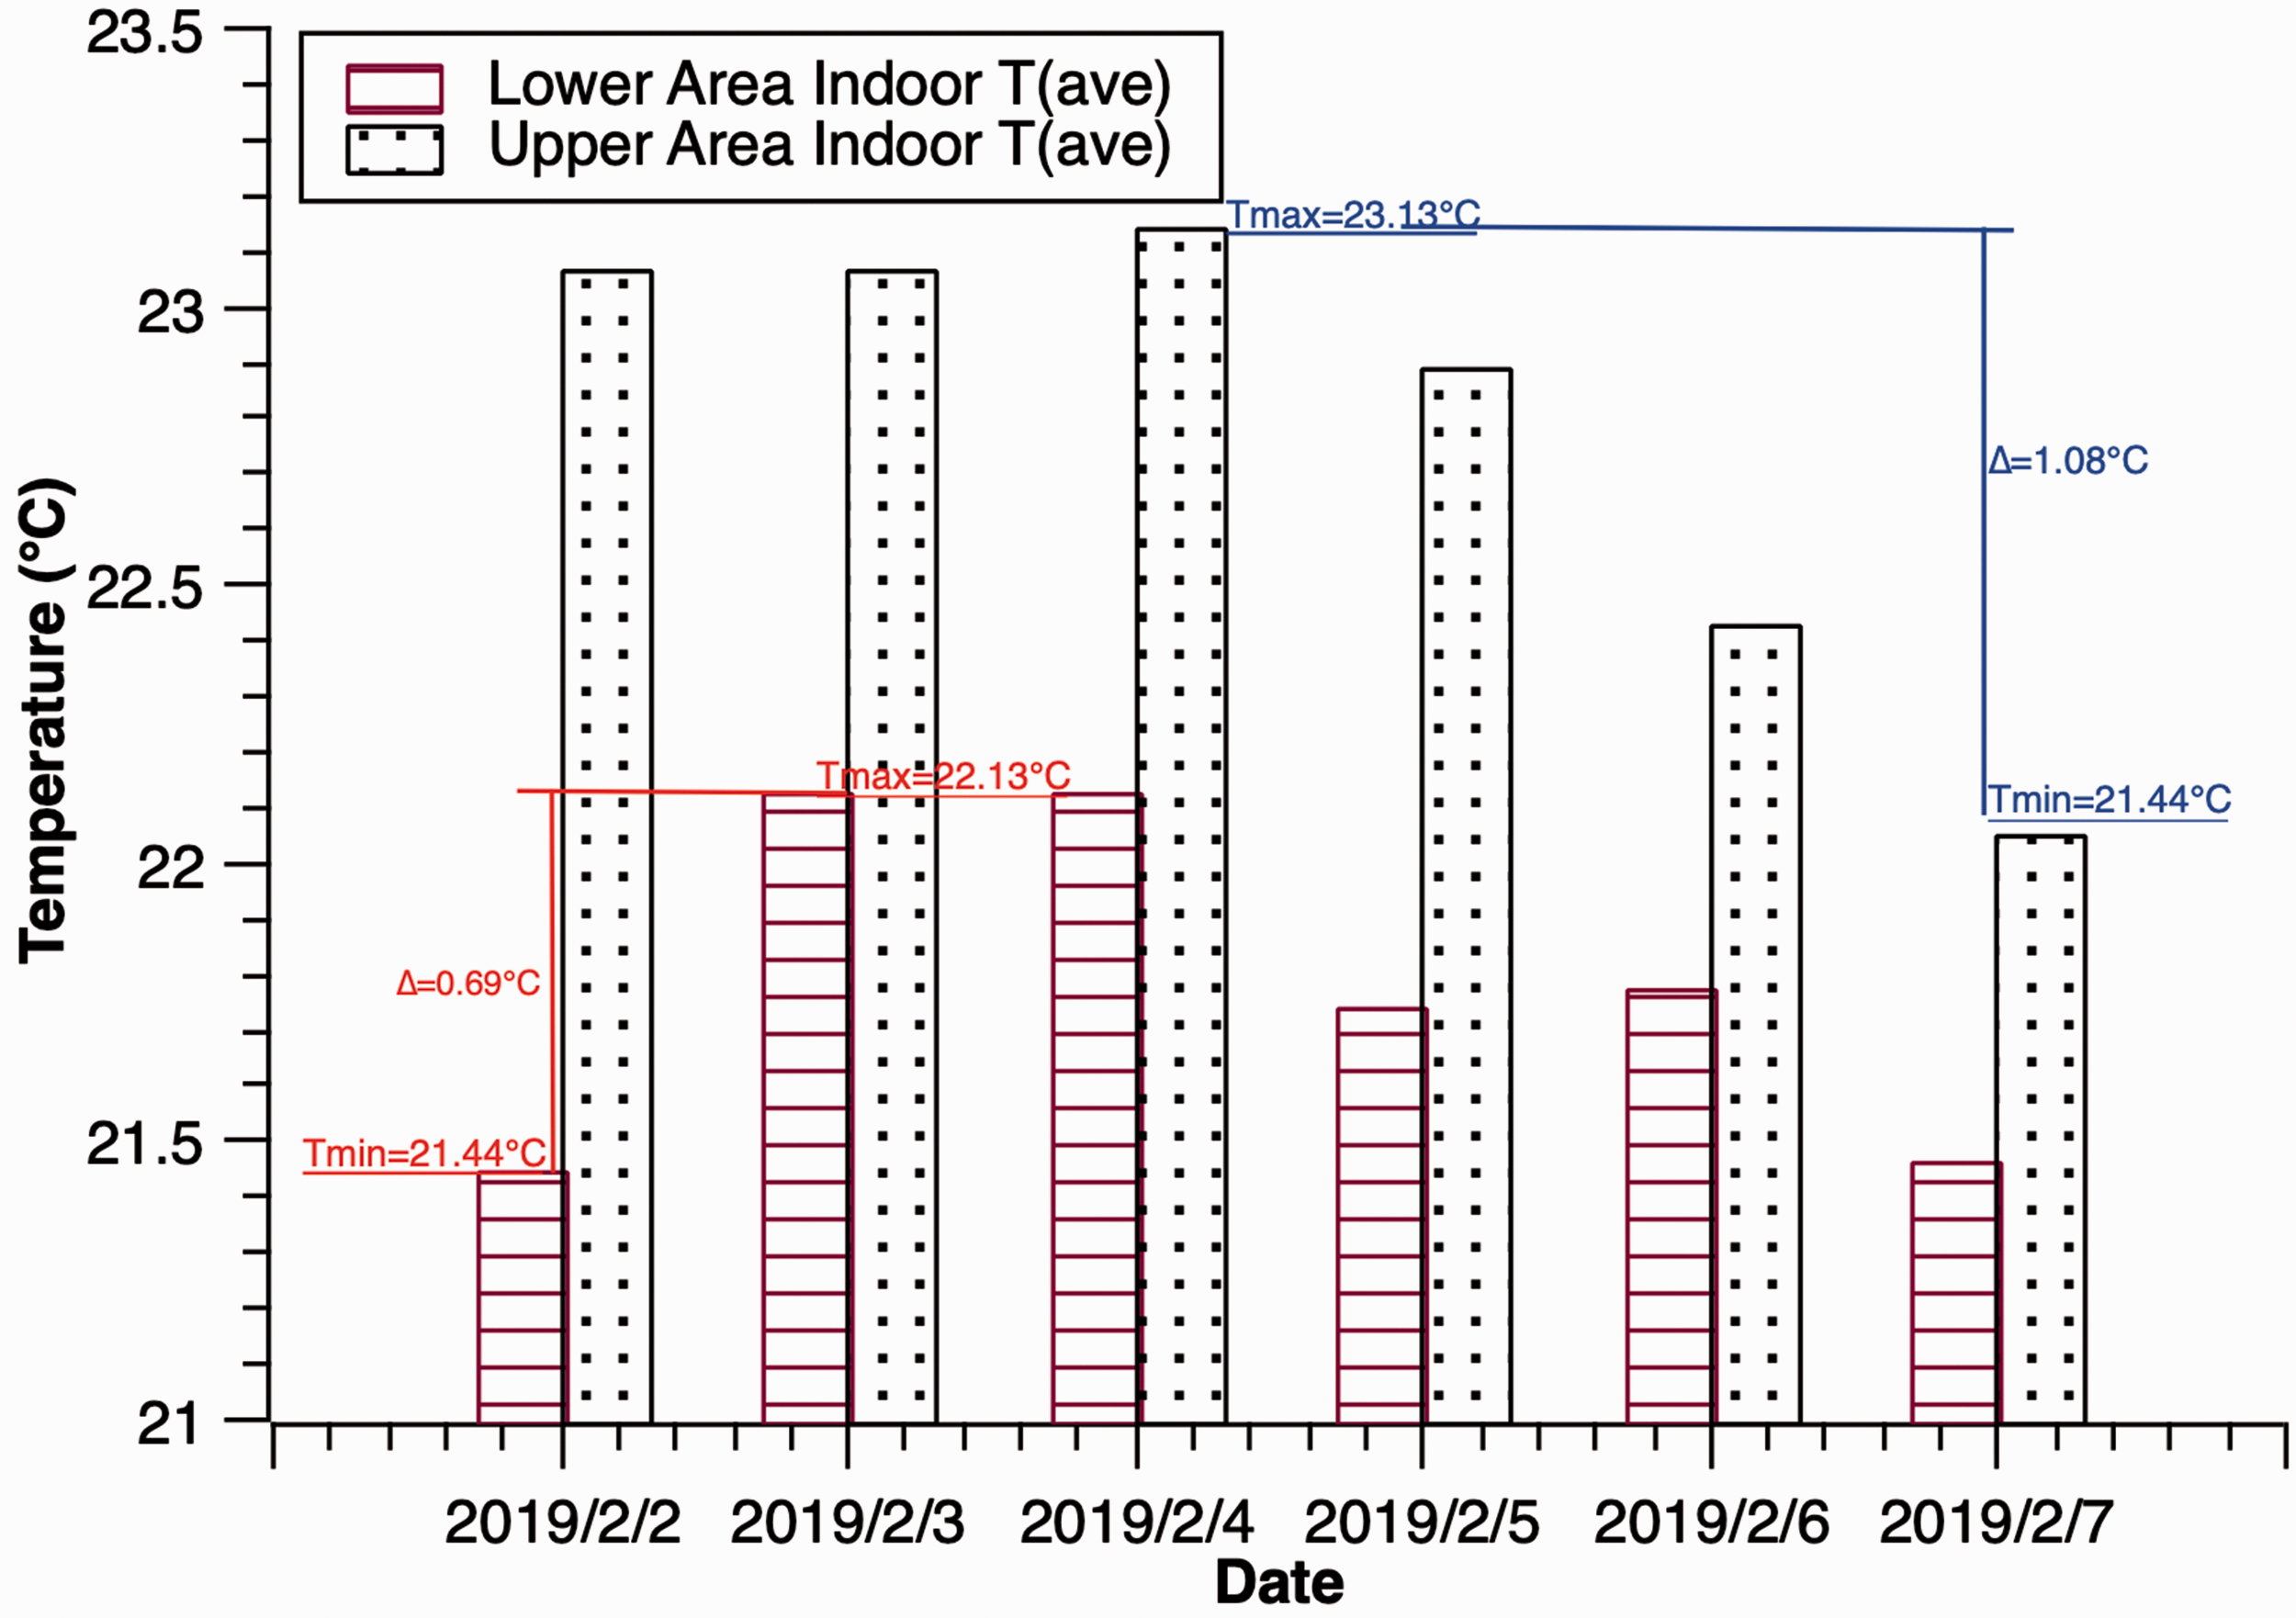
Daily indoor Tave of 2–7 February.
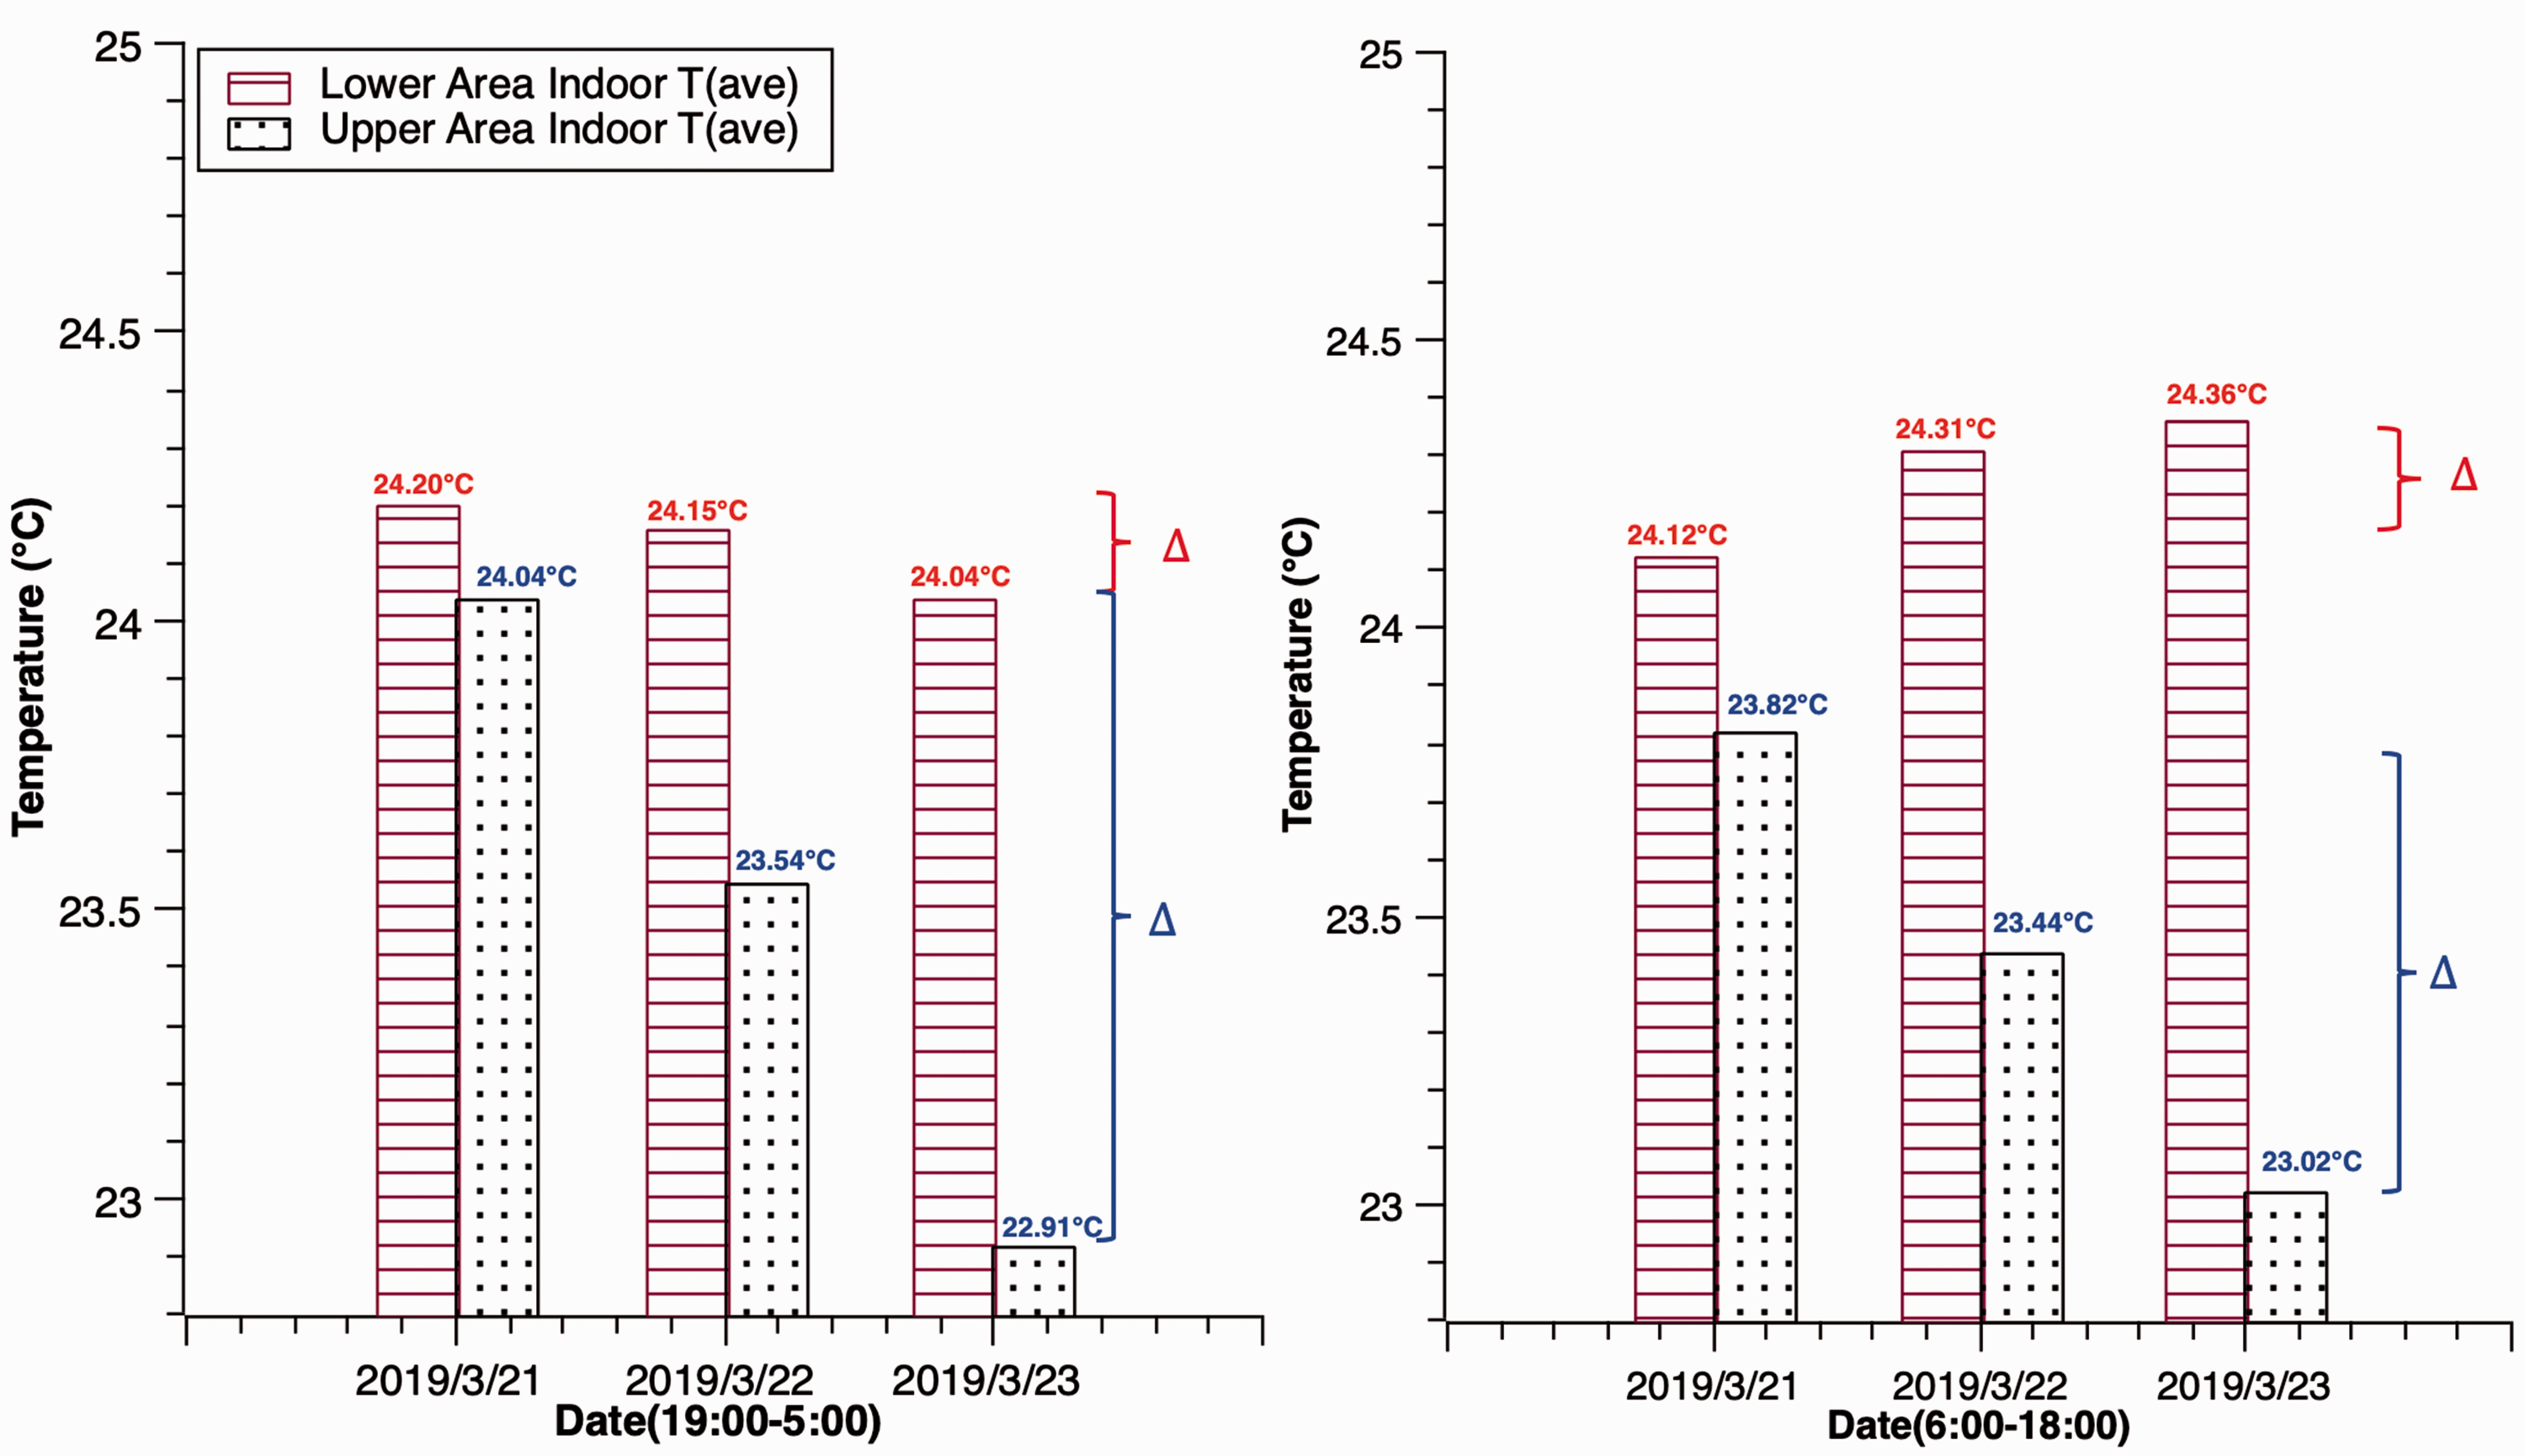
Daily indoor Tave during night and daytime of 21–23 March.
As shown in Figures 6 and 7, as well as the measured data, the daily average temperature of 2–7 February and the average temperature for night and daytime of 21–23 March are presented. A smaller difference in temperature fluctuation in the lower building region is visualized, which could be the effect of the proposed control method.
Note that only the lower building areas are regulated. The upper areas are still subject to the original regulation scheme and the results show that the variance of the hourly indoor temperature of the lower and upper areas was 0.48 and 0.47, respectively. Considering the baseline state, the fluctuations of the lower and upper areas were 0.31 and 0.47. After imposing the control model, the lower area had a much smaller fluctuation. Therefore, it can be concluded that the regulation algorithm could stabilize the indoor temperature when the outdoor weather changes drastically.
Discussion
Energy consumption analysis under stable indoor temperature
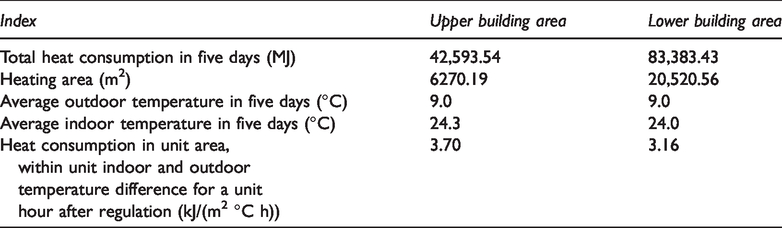
The energy consumption from 2 February to 7 February 2019 in the upper and lower building areas under the baseline state is shown in Table 3. Energy consumption data were obtained by installing heat meters.
The heat consumption of the upper and lower building areas from 2 to 7 February 2019, under baseline state.
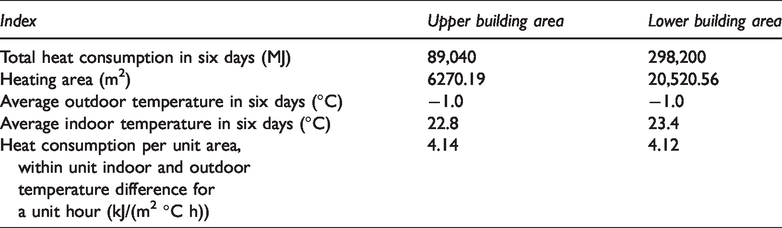
As can be seen from Table 3 in the baseline state, the heat consumption per unit area within unit indoor and outdoor temperature difference for a unit hour in the upper and lower building zones is basically the same, with a difference of less than 5‰. This further verifies that the upper and lower building areas are good references for comparison.
The new regulation scheme is adopted in the lower building area, while in the upper area the original regulation scheme is still adopted. Taking 11–15 March as an example, the hourly energy consumption of the upper and lower areas is shown in Table 4.
The heat consumption from 11 to 15 March 2019 in the upper and lower building areas under the regulation state.
A comparison of Tables 3 and 4 shows that the energy consumption in the lower building area was reduced significantly compared to that in the upper area due to the increase of solar radiation based on outdoor meteorological elements in the new regulation strategy. It can be seen that the new regulation scheme can make full use of solar radiation and reduce the energy consumption of the heating system while maintaining relatively good indoor temperature stability (Liu et al., 2019).
Conclusion
The accuracy of an empirical analysis from the measured data is limited if the dynamic regulation of the heating system is based on several meteorological elements. Hence, it is necessary to theoretically decouple the superposition effect of the building envelope structure and the heating system on indoor temperature. The heating system control scheme based on the integrated meteorological parameters can effectively stabilize indoor temperature, even when the outdoor temperature changes drastically. The new regulation scheme could make full use of solar radiation and reduce the energy consumption of the heating system while maintaining good indoor temperature stability. These types of research always have difficulty with the cooperation of heat supply companies. Hence, more research is needed to further improve the model.
Footnotes
Declaration of conflicting interests
The author(s) declared no potential conflicts of interest with respect to the research, authorship, and/or publication of this article.
Funding
The author(s) disclosed receipt of the following financial support for the research, authorship, and/or publication of this article: This study is supported by the National Natural Science Foundation of China Project “Research on the Regulation Mechanism of Hourly On-demand Heating Based on Multi-parameter Spectrum and Filtering Analysis” (No. 51606182) and Tianjin Meteorological Bureau’s key project “Meteorological Public Service Benefit System” of the 13th five-year plan.