
Abstract
One optimization method of hourly heat load calculation model for heat storage air-conditioning heating system in different climate zones was proposed. A building model is initially built in six different climate zones. Subsequently, the hourly heat load and steady-state design heat load in different climate zones were analyzed. Simultaneously, the hourly heat load additional coefficient of the air-conditioning system with different heating modes on a typical day was compared. It can be found that steady-state design heat load on a typical day is mostly between the peak load and average load of the air-conditioning heating system. Simultaneously, results indicate that the hourly heat load additional coefficient in each climate zone can be fitted to different exponential functions. When the heat storage capacity of building components was changed, the maximum increase of the hourly heat load additional coefficient of the air-conditioning system with intermittent heating was 5%. Thus, the research of the optimal design of hourly heat load calculation method provides a relative reference for performance improvement of the heat storage air-conditioning heating system.
Keywords
Introduction
The issue of energy conservation has received growing attention worldwide. In 2018, China’s energy consumption accounted for 46.5% of the total energy consumption in the building sector, and the total carbon emissions accounted for 51.3% of the total national carbon emissions in the building sector (Efimova et al., 2014). At present, countries pay great attention to countermeasures to reduce the greenhouse effect. In the past, due to the economic benefits of thermal storage technology, it had not been widely adopted. However, the first consideration now was that heat storage technology was beneficial to reduce environmental load, it was widely adopted (Wang et al., 2017). Given the contribution of thermal storage technology to environmental load reduction and economic, this important technology should be further popularized (Pintaldi et al., 2015). Currently, countries around the world focus on using natural energy for heating to reduce energy expenditure. The heat storage air-conditioning system (HSACS) can balance the peak and valley load of the grid, save energy, reduce carbon emissions and operating costs. With the changes in the power supply and demand situation, and the vigorous promotion of clean heating (Dehghan and Fakhar, 2014), the HSACS were widely used in building heating systems (Yue et al., 2018). It was extremely important to accurately calculate the heating load of the HSACS.
The HSACS system was a cycle of heat storage and release. Simultaneously, it considered the additional heat load of intermittent operation (Zhang et al., 2018). Intermittent heating was very common in residential and public buildings in hot summer and cold winter zones (HSCWZ) and hot summer and warm winter zones (HSWWZ), such as hotels, office buildings, and airports. For the HSACS with intermittent heating, a large additional load would be formed within a few hours of the system opening. The additional calculation of the intermittent heating load was more important (Chen and Dong, 2012). TRNSYS was used to analyze the hourly heat load of the design day under different intermittent operation modes (Zhang et al., 2019), and the hourly heat load additional rate of the intermittent operation mode was obtained, which was used to make additional corrections to the hourly heat load of continuous operation mode (Fu and Sun, 2009). The Design-Builder software was used to obtain the additional rate of the HSACS with intermittent heating in different climate zones based on the residential and office building (Wang et al., 2015).
Although many research works had proposed different heat load calculation methods for HSACS, there were certain limitations, such as large errors due to large simulation time accuracy, and no consideration of system heat storage characteristics. In addition, there was no standard for optimization method of hourly heat load calculation model for heat storage air-conditioning heating system in different climate zones. Therefore, it is very urgent and necessary to study the load calculation of HSACS. This paper studied the hourly heat load calculation method for the HSACS with intermittent heating and HSACS with continuous heating, which provided a basis for improving the existing standard heat load calculation methods and related standards, especially for public buildings, such as airports and office buildings. First, a typical public building was selected and the steady-state design heat load was calculated based on traditional steady-state calculations method. Secondly, the TRNSYS 18.0 was used to simulate the hourly heat load of HSACS with continuous heating and HSACS with intermittent heating in public buildings. Simultaneously, the typical daily hourly heat load was calculated. Then, the relationship between the hourly heat load of two heating operation modes is studied, and the hourly heat load coefficient of HSWWZ in different climate zones was calculated (Xu et al., 2017), providing a theoretical basis for further in-depth study of load relations of the HSACS with continuous heating in different climate zones. Finally, the typical daily hourly heat load additional coefficients of two heating operation modes were obtained by the relevant formula. Simultaneously, the degree of influence of different heat capacity composition on the intermittent load additional coefficient was determined.
Method
Based on public buildings in six climatic zones: severe cold zone A, severe cold zone B, severe cold zone C, cold zone, HSCWZ, and HSWWZ, the hourly heat load calculation method of HSACS under continuous heating and intermittent heating were studied. A typical 11-story office building was studied, with a total building area of 7425 m2, as shown in Figure 1. The shape factor is 0.2, and the height of the building is 43 m. Among them, the single-story building area is 676.8 m2. The reinforced concrete floor and aerated concrete inner wall of a typical building are both 100 mm. In addition, the furniture is made of 30 mm thick wooden boards. The floor area of a typical building is 7426 m2, and the inner wall area is 4455.60 m2. The inner wall to floor area ratio is 0.6, and the area ratio of furniture to the floor is 0.12.
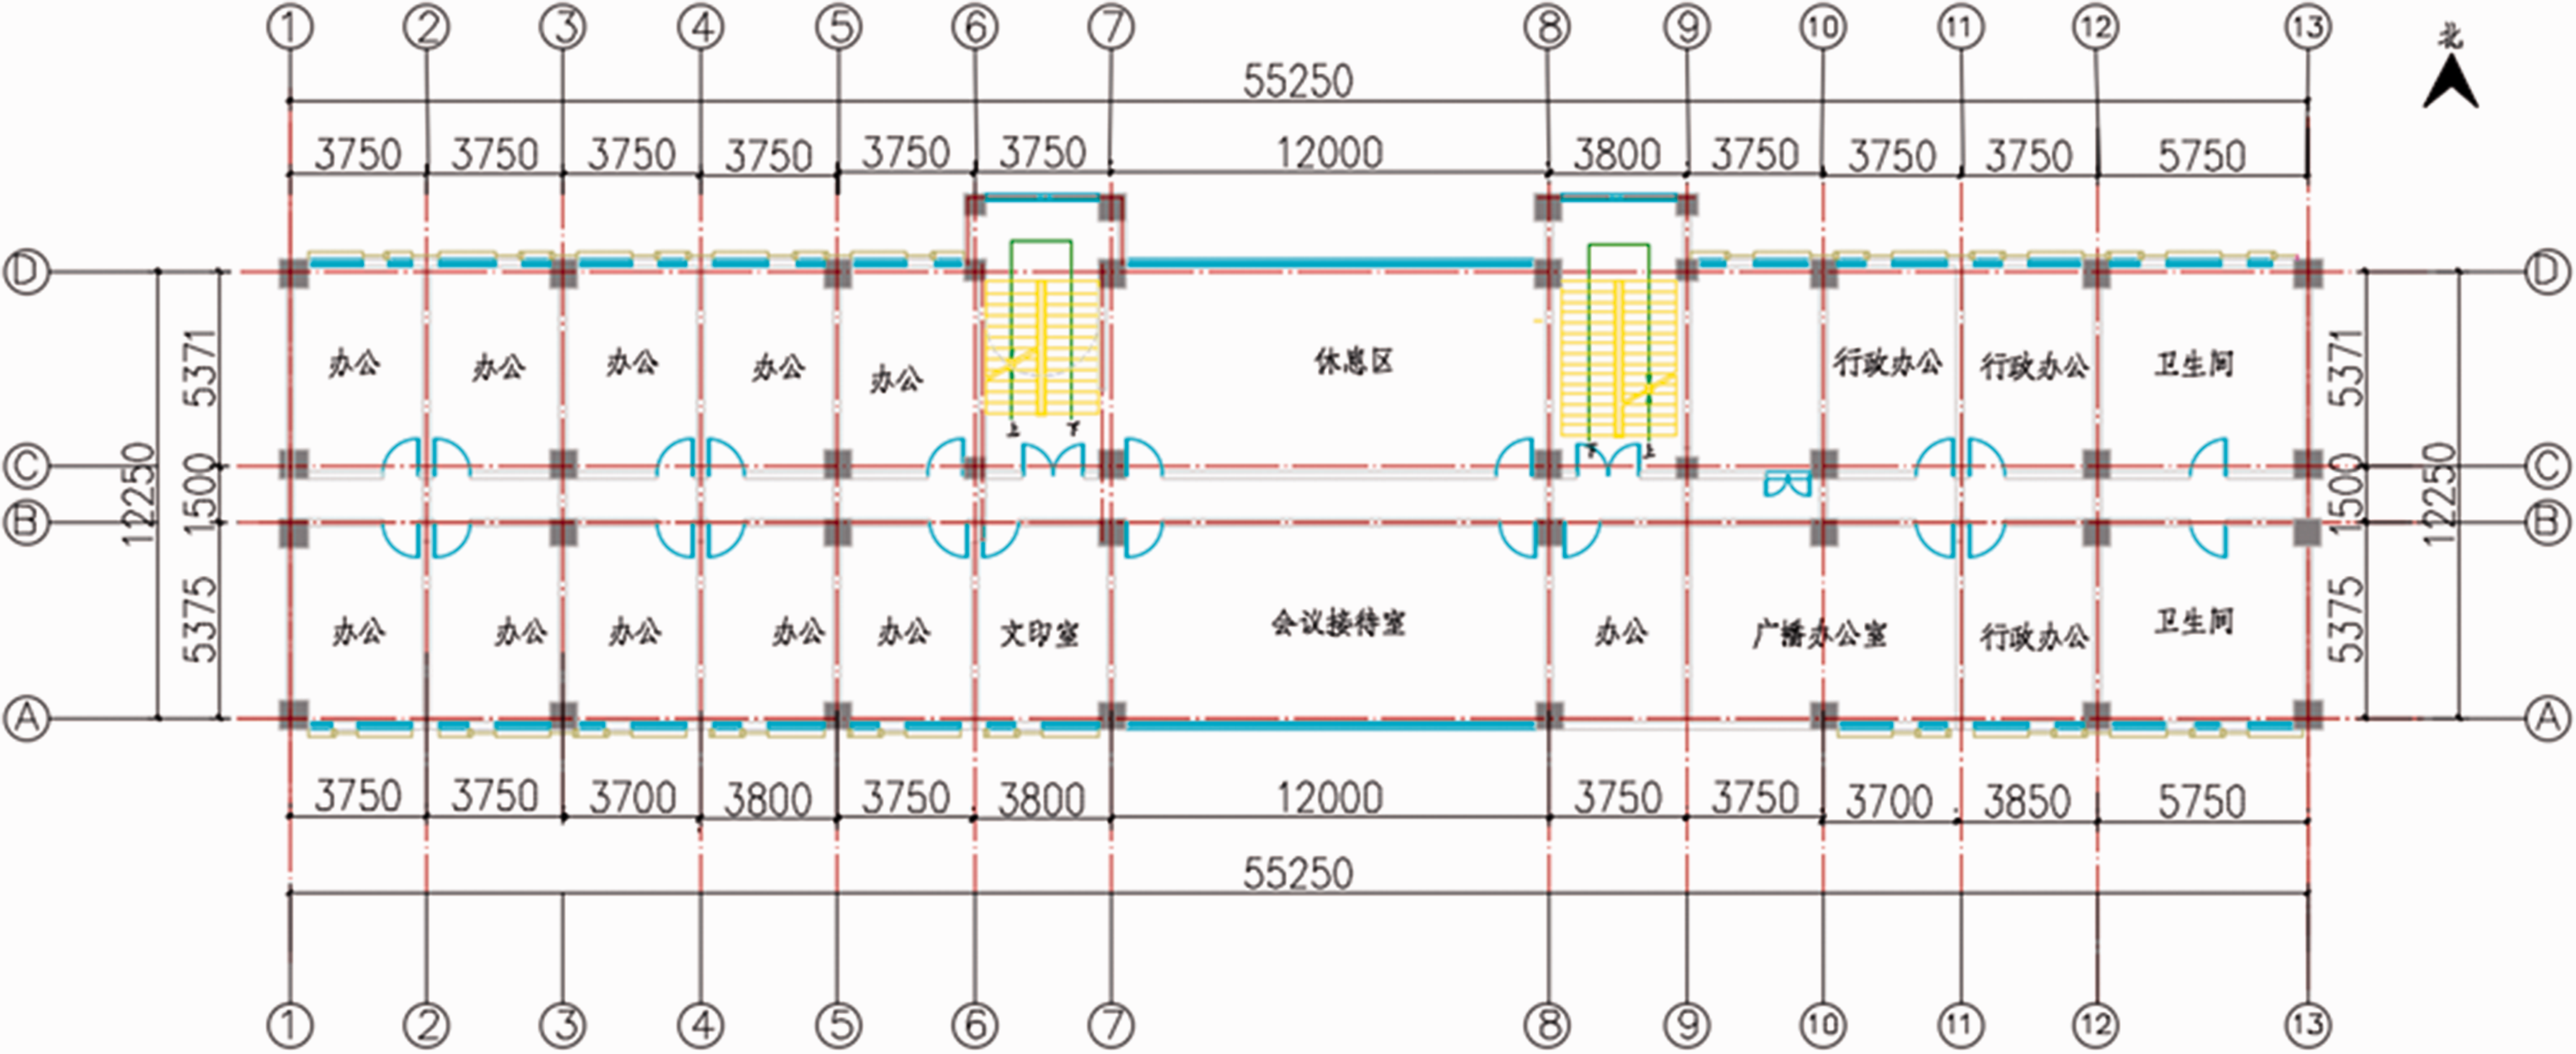
Typical office building model.
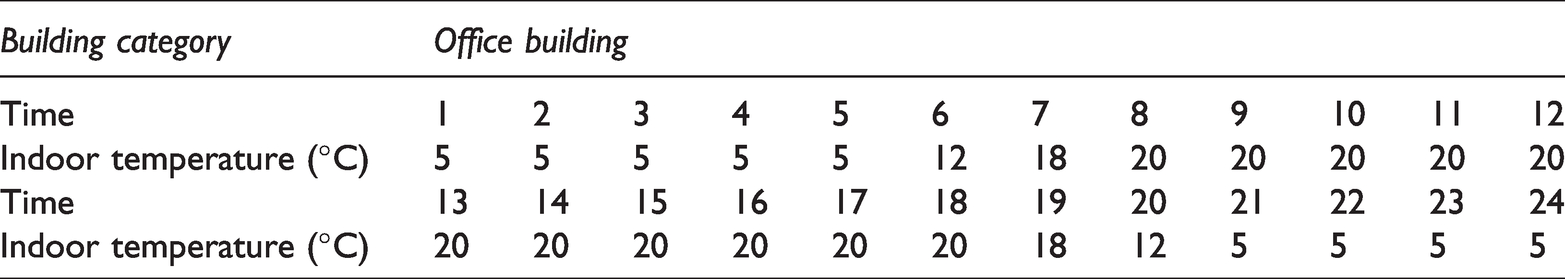
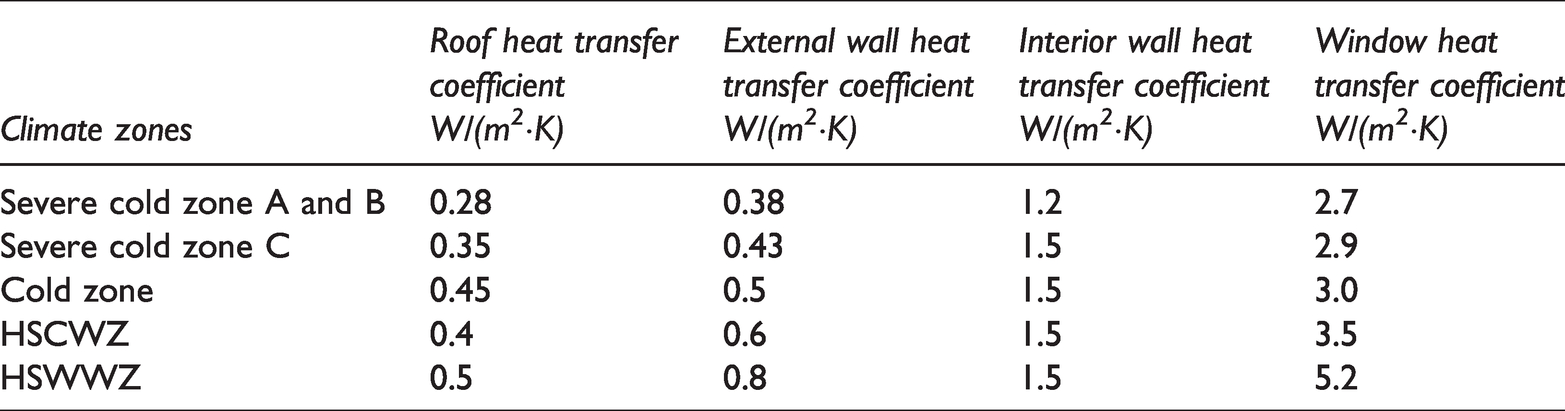
The intermittent load simulation calculation time step in this paper was set to 0.1 h. The indoor temperature of an HSACS with continuous heating was 20°C, and the indoor temperature of an HSACS with intermittent heating was shown in Table 1 (Wang et al., 2019). Simultaneously, the personnel density of a typical office building was set to 8 m2/p, and the personnel fresh air volume was set to 30 m3/h/p. In addition, the operation modes of the HSACS with continuous heating and HSACS with intermittent heating were shown in Figures 2 and 3, respectively. The thermal performance parameters of the envelope structure in different climate zones were shown in Table 2 (Liu et al., 2020).
The indoor temperature of a HSACS with intermittent heating.
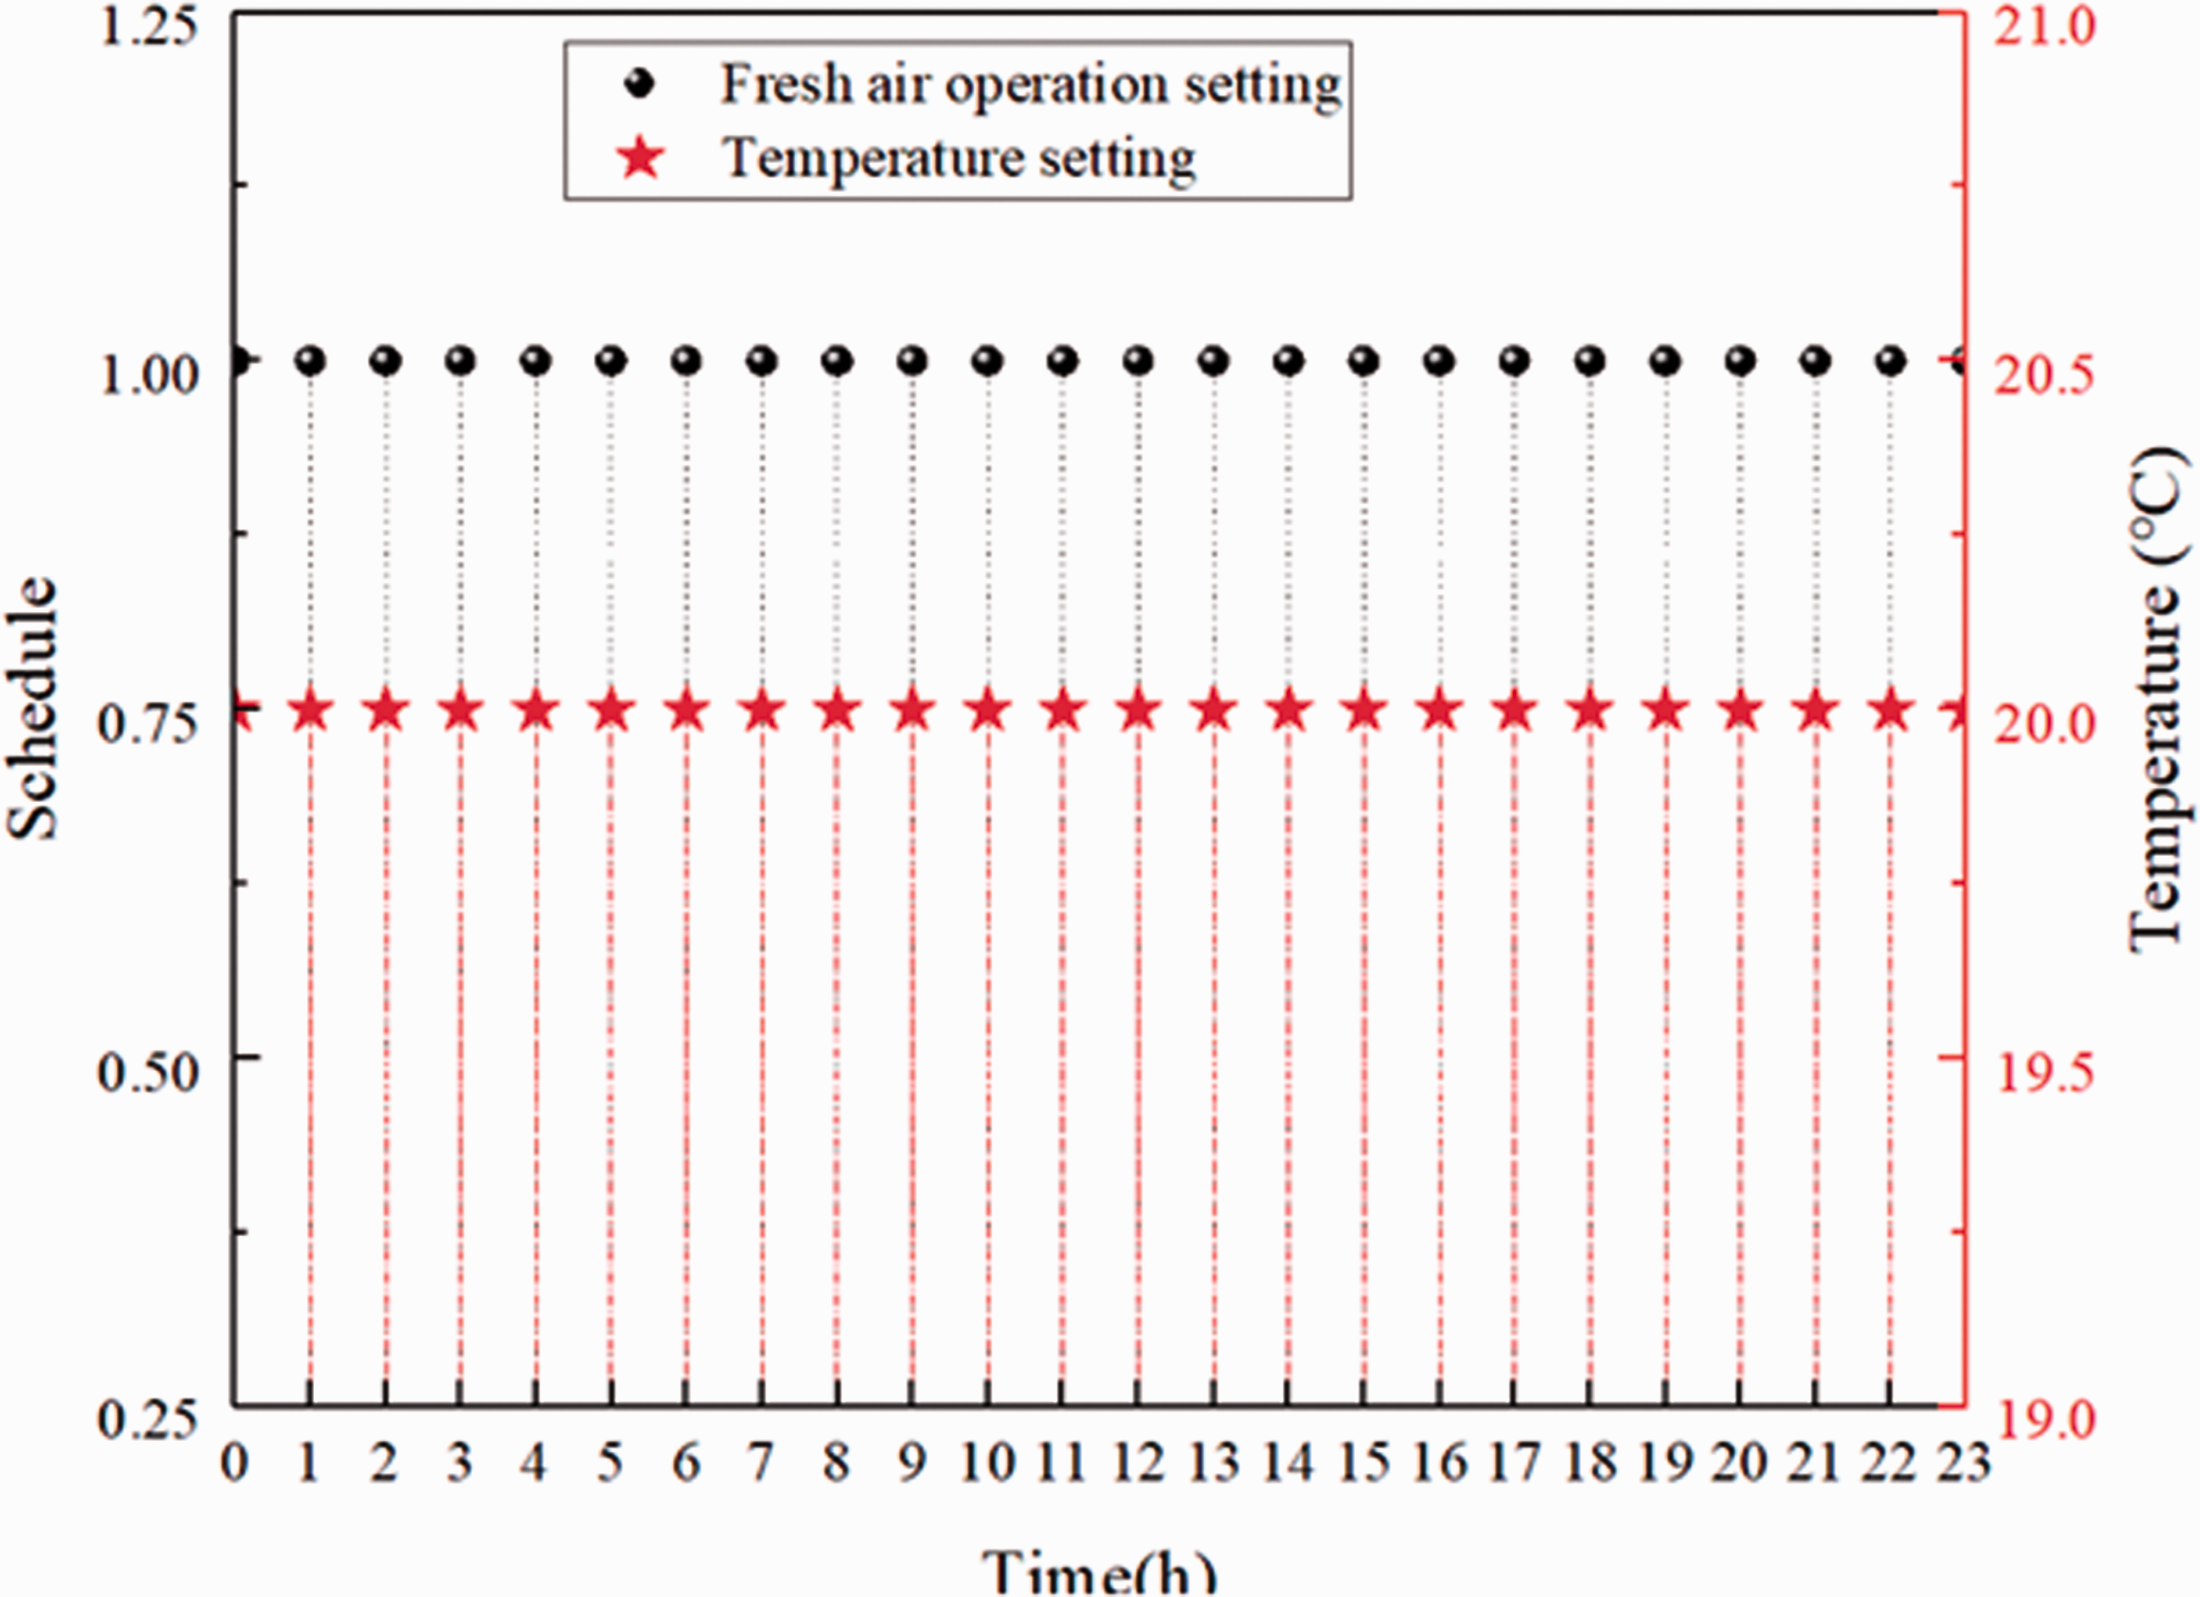
The operation modes of the HSACS with continuous heating.
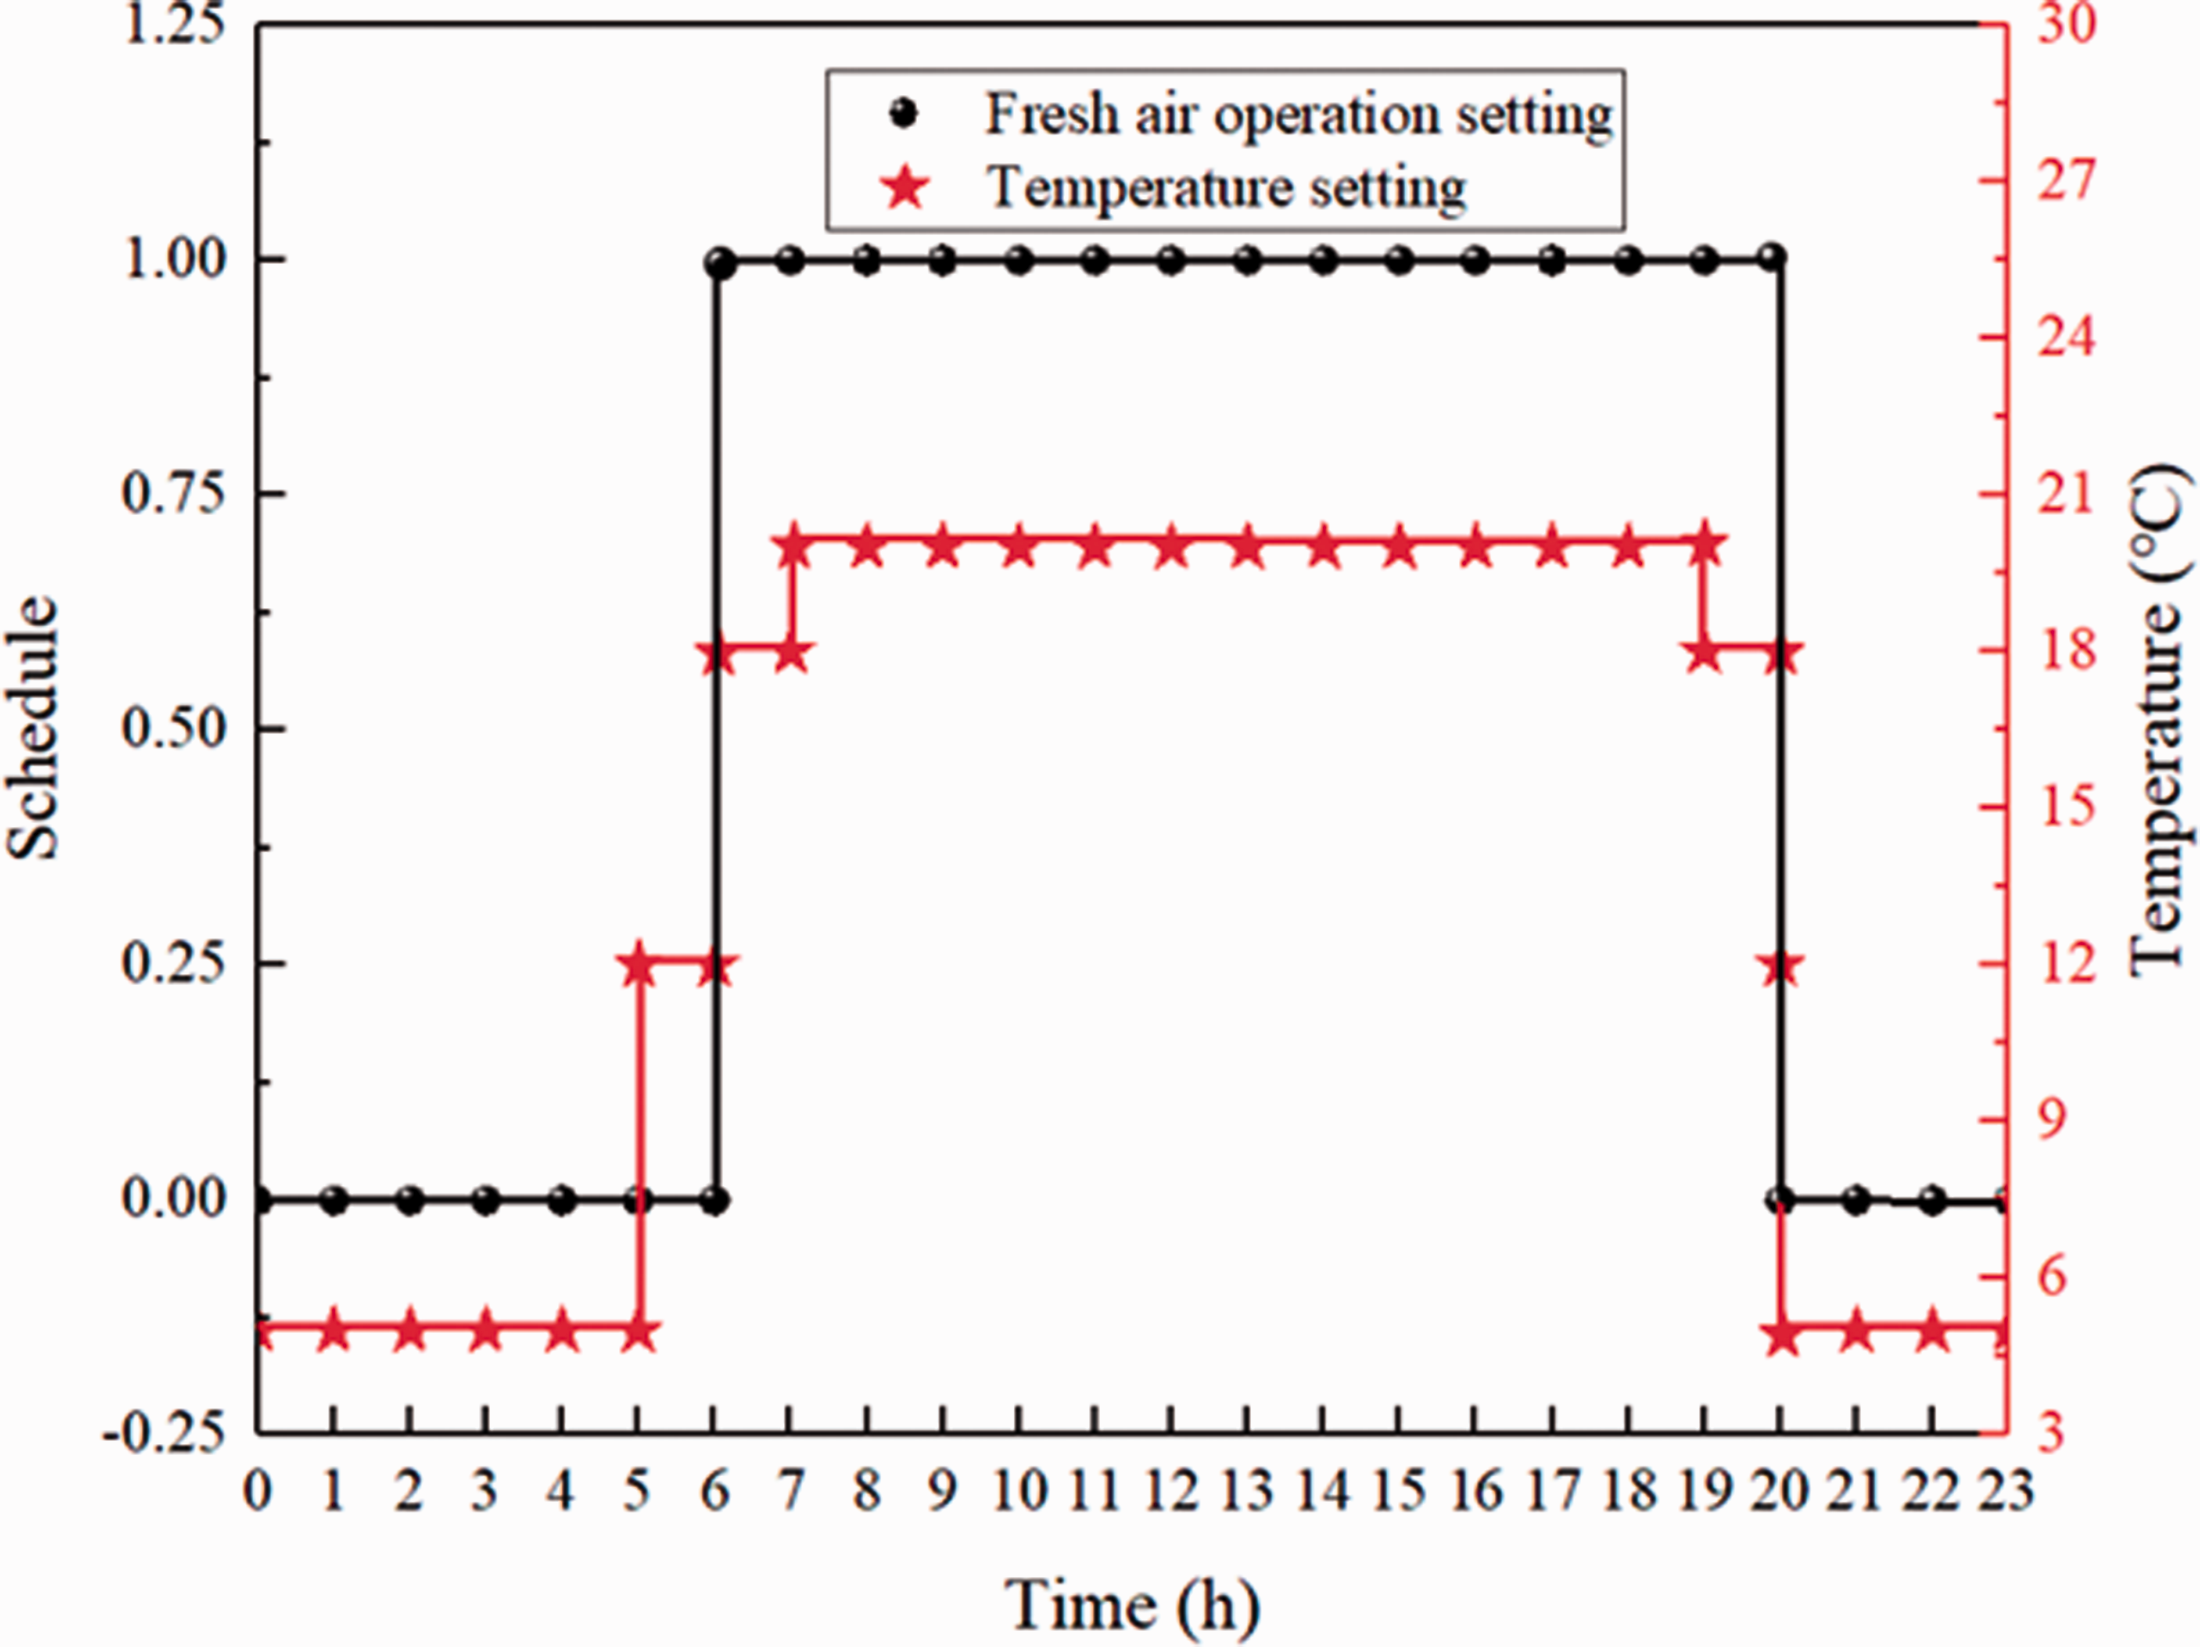
The operation modes of the HSACS with intermittent heating.
The parameters of the envelope structure in different climate zones.
Based on the above detail parameter settings, the building loads calculation model was set, as shown in Figure 4.
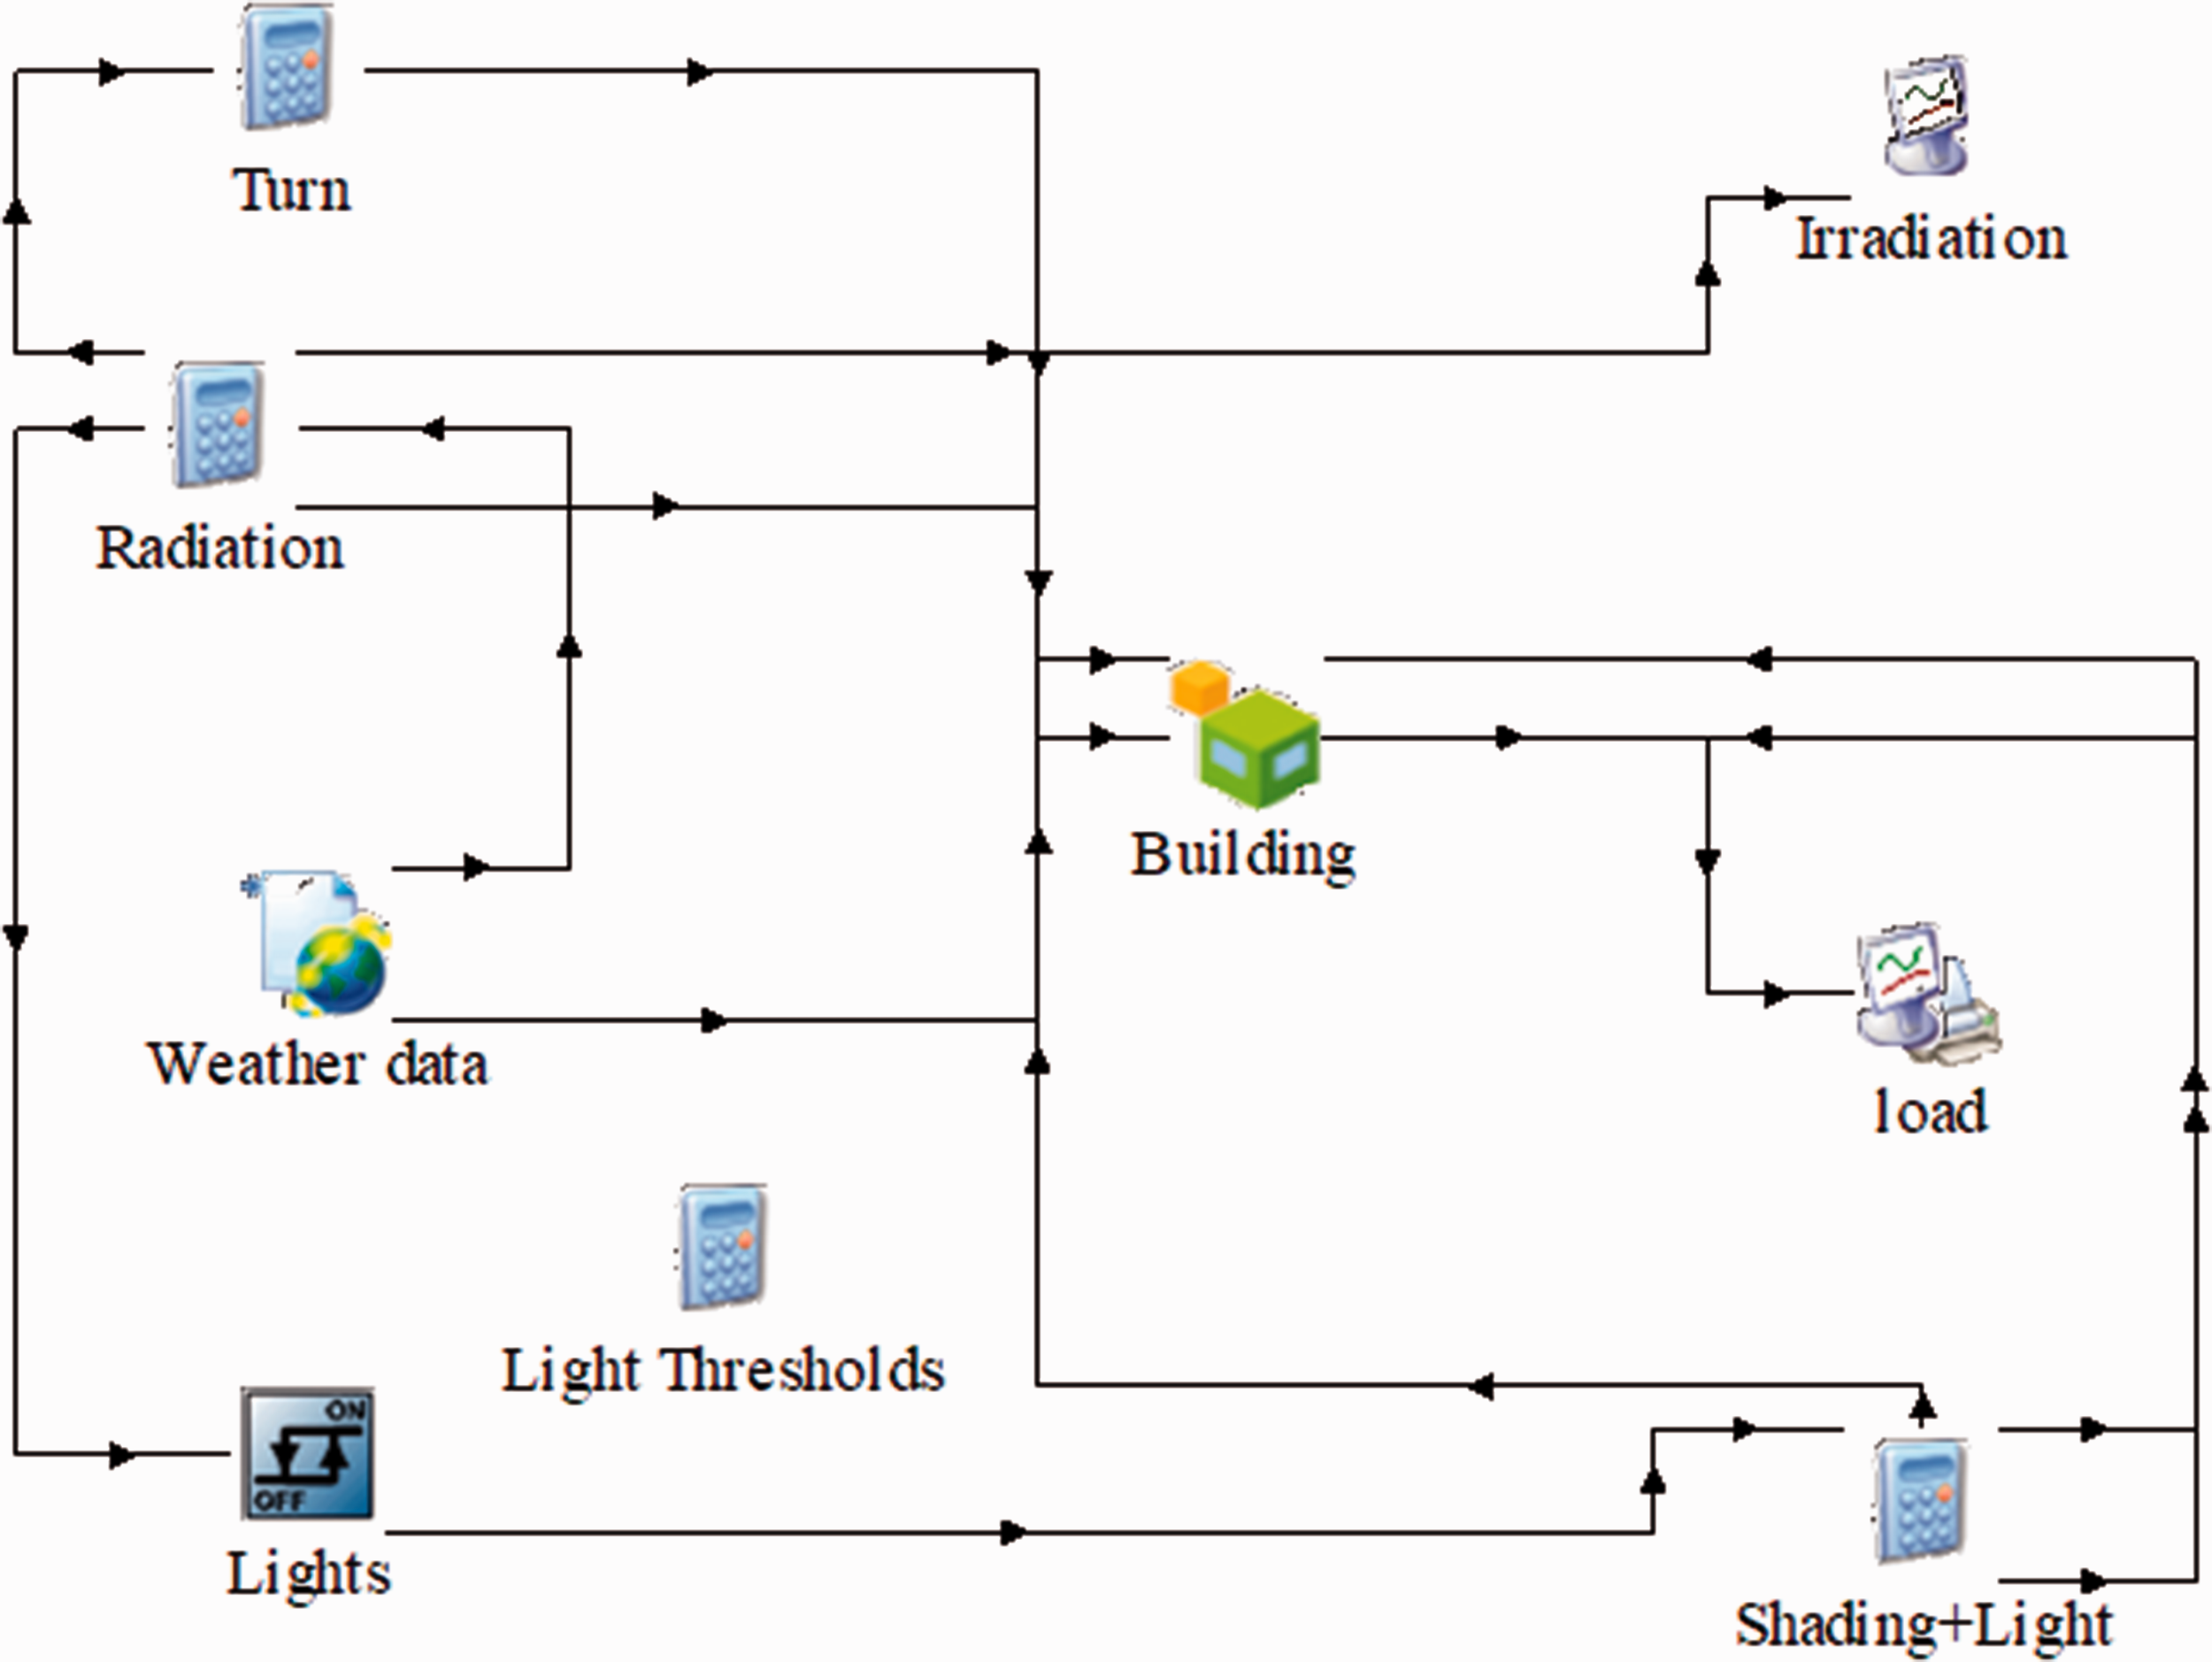
A building loads calculation model.
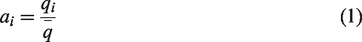
For a HSACS with continuous heating, the hourly heat load coefficient was defined by equation (1)
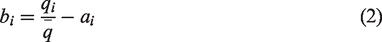
For a HSACS with intermittent heating, the hourly load additional coefficient was defined by equation (2)
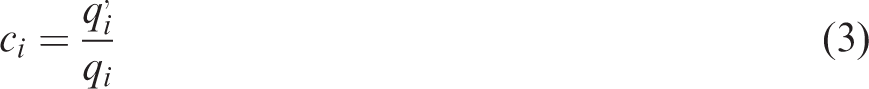
When the internal heat capacity is different, the hourly load additional coefficient of the HSACS with intermittent heating is defined by equation (3)
Results and discussion
Analysis of hourly heat load and steady-state design heat load
The steady-state design heat load was calculated, as shown in Figure 5, based on the public building models of typical cities in these climate zones: severe cold zone, cold zone, HSCWZ, and HSWWZ. The hourly heat load throughout the year was simulated and calculated through TRNSYS software, and the typical day was determined. The hourly heat load of the HSACS with continuous heating on a typical design day in different cities was shown in Figures 6 to 9.
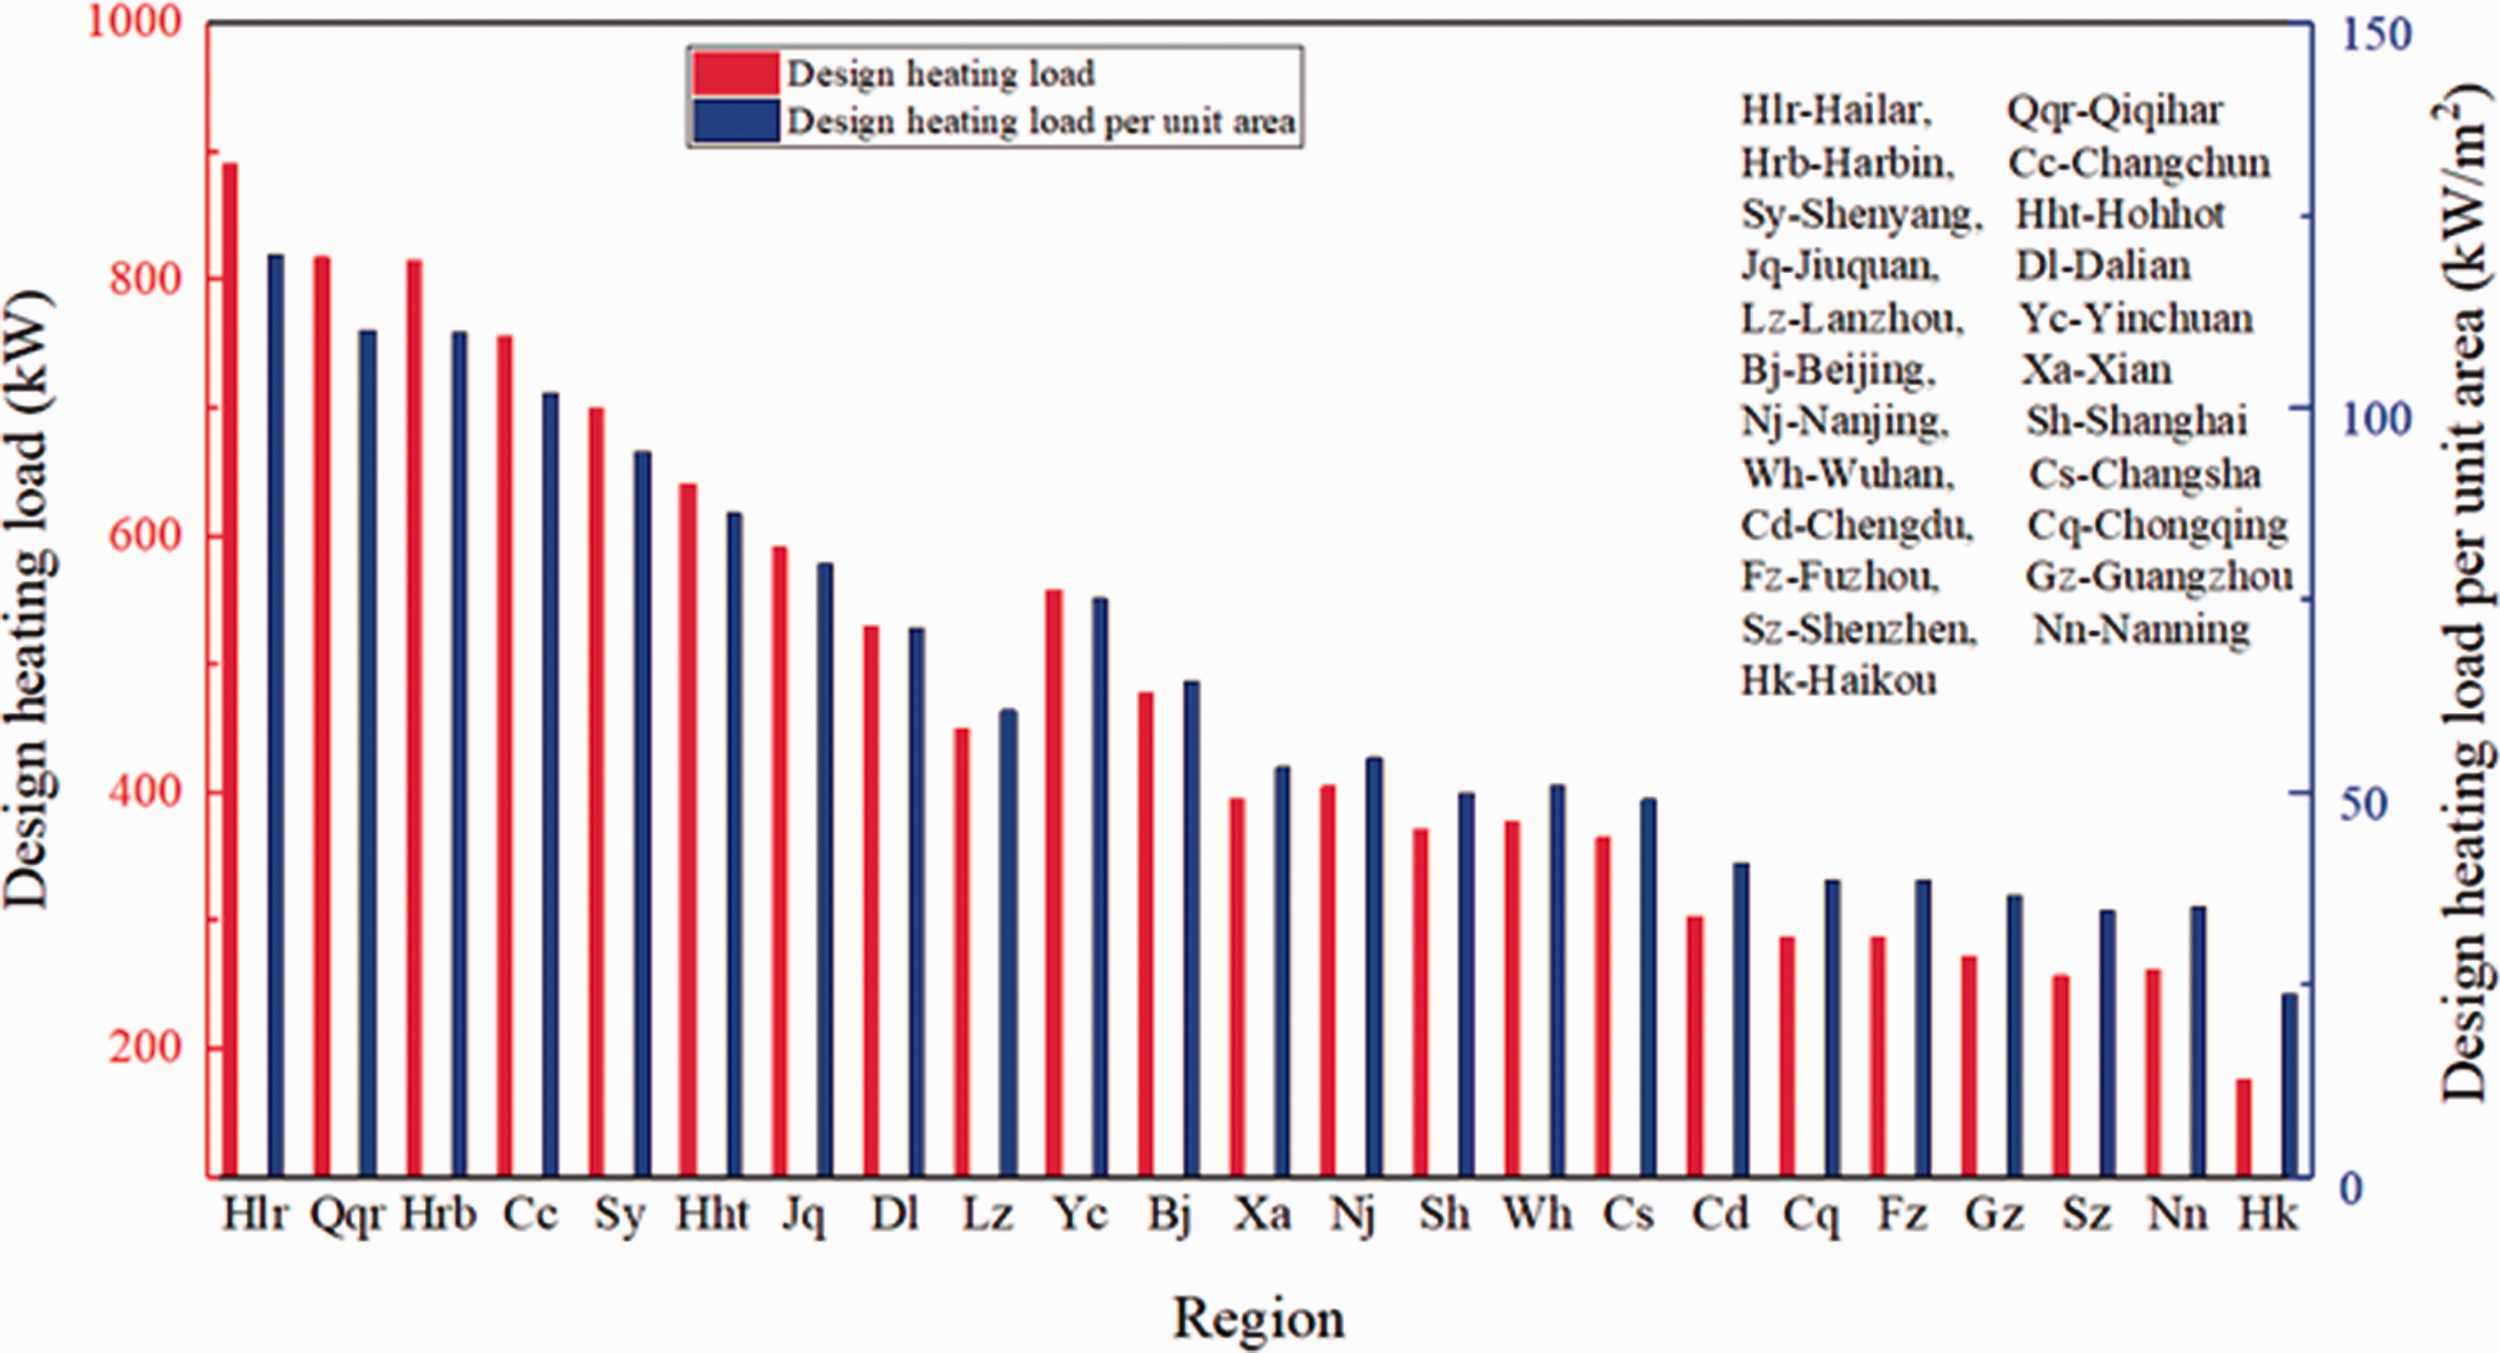
Steady-state design heat load of air-conditioning for typical days in different climate zones.
As can be seen from Figure 6, the maximum hourly heat load appeared at 8 o 'clock and the minimum hourly heat load appeared at 16 o 'clock in severe cold zones. At 8 o 'clock, the maximum hourly heat load occurred in Hailar area, which was 864.4 kWh. Simultaneously, the minimum hourly heat load occurred in Jiuquan area, which was 688.5 kWh. At 16:00, the maximum hourly heat load occurred in Hailar area, which was 646.7 kWh. Simultaneously, the minimum hourly heat load occurred in Shenyang area, which was 493.6 kWh. It can be seen from Figure 7 that the variation trend of hourly heat load was basically consistent in the five cities in the cold zones. the maximum hourly heat load occurred in Yinchuan are at 10:00 compared with other cities, which was 587.8 kWh. At 17:00, the minimum hourly heat load occurred in Yinchuan are at 10:00 compared with other cities, which was 257.8 kWh. As can be seen from Figure 8, the maximum hourly heat load appeared at 8 o 'clock and the minimum hourly heat load appeared at 17 o 'clock in HSCWZ. At 8 o 'clock, the maximum hourly heat load occurred in Nanjing area, which was 482.9 kWh. Simultaneously, the minimum hourly heat load occurred in Chongqing area, which was 314.5 kWh. At 17:00, the maximum hourly heat load occurred in Shanghai area, which was 293.6 kWh. Simultaneously, the minimum hourly heat load occurred in Chongqing area, which was 140.2 kWh. As can be seen from Figure 9, the hourly heat load of Haikou was relatively small compared with other cities in HSWWZ. In general, the trend of hourly heat load variation in different regions can remain consistent.
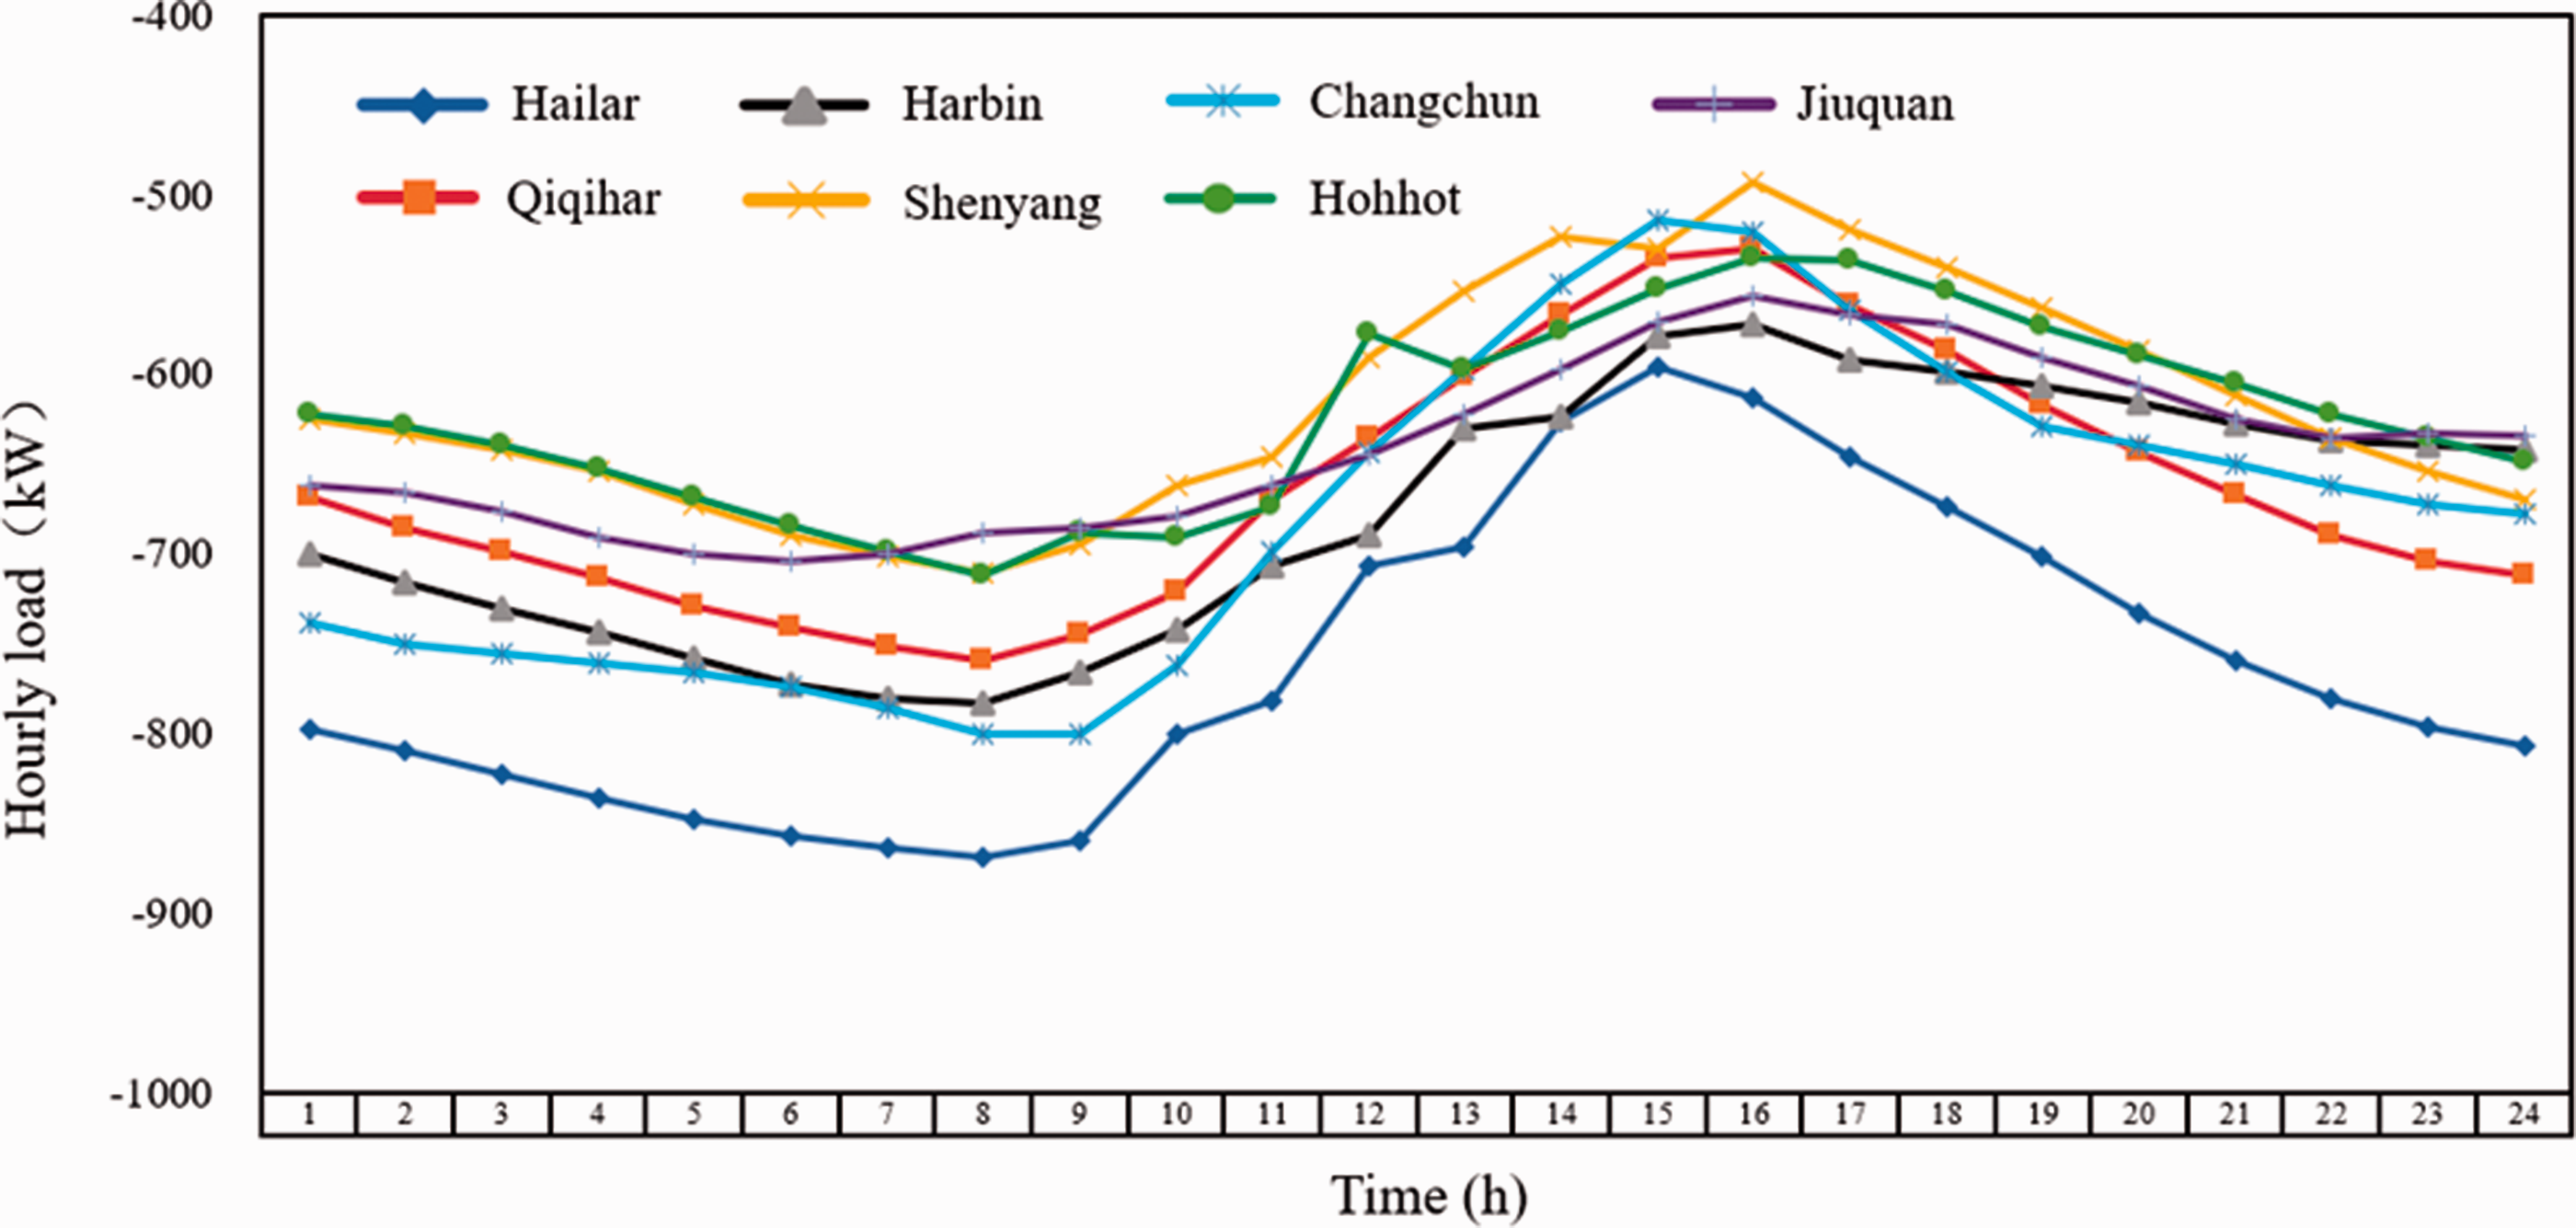
Hourly heat load curve of a typical design day in severe cold zones.
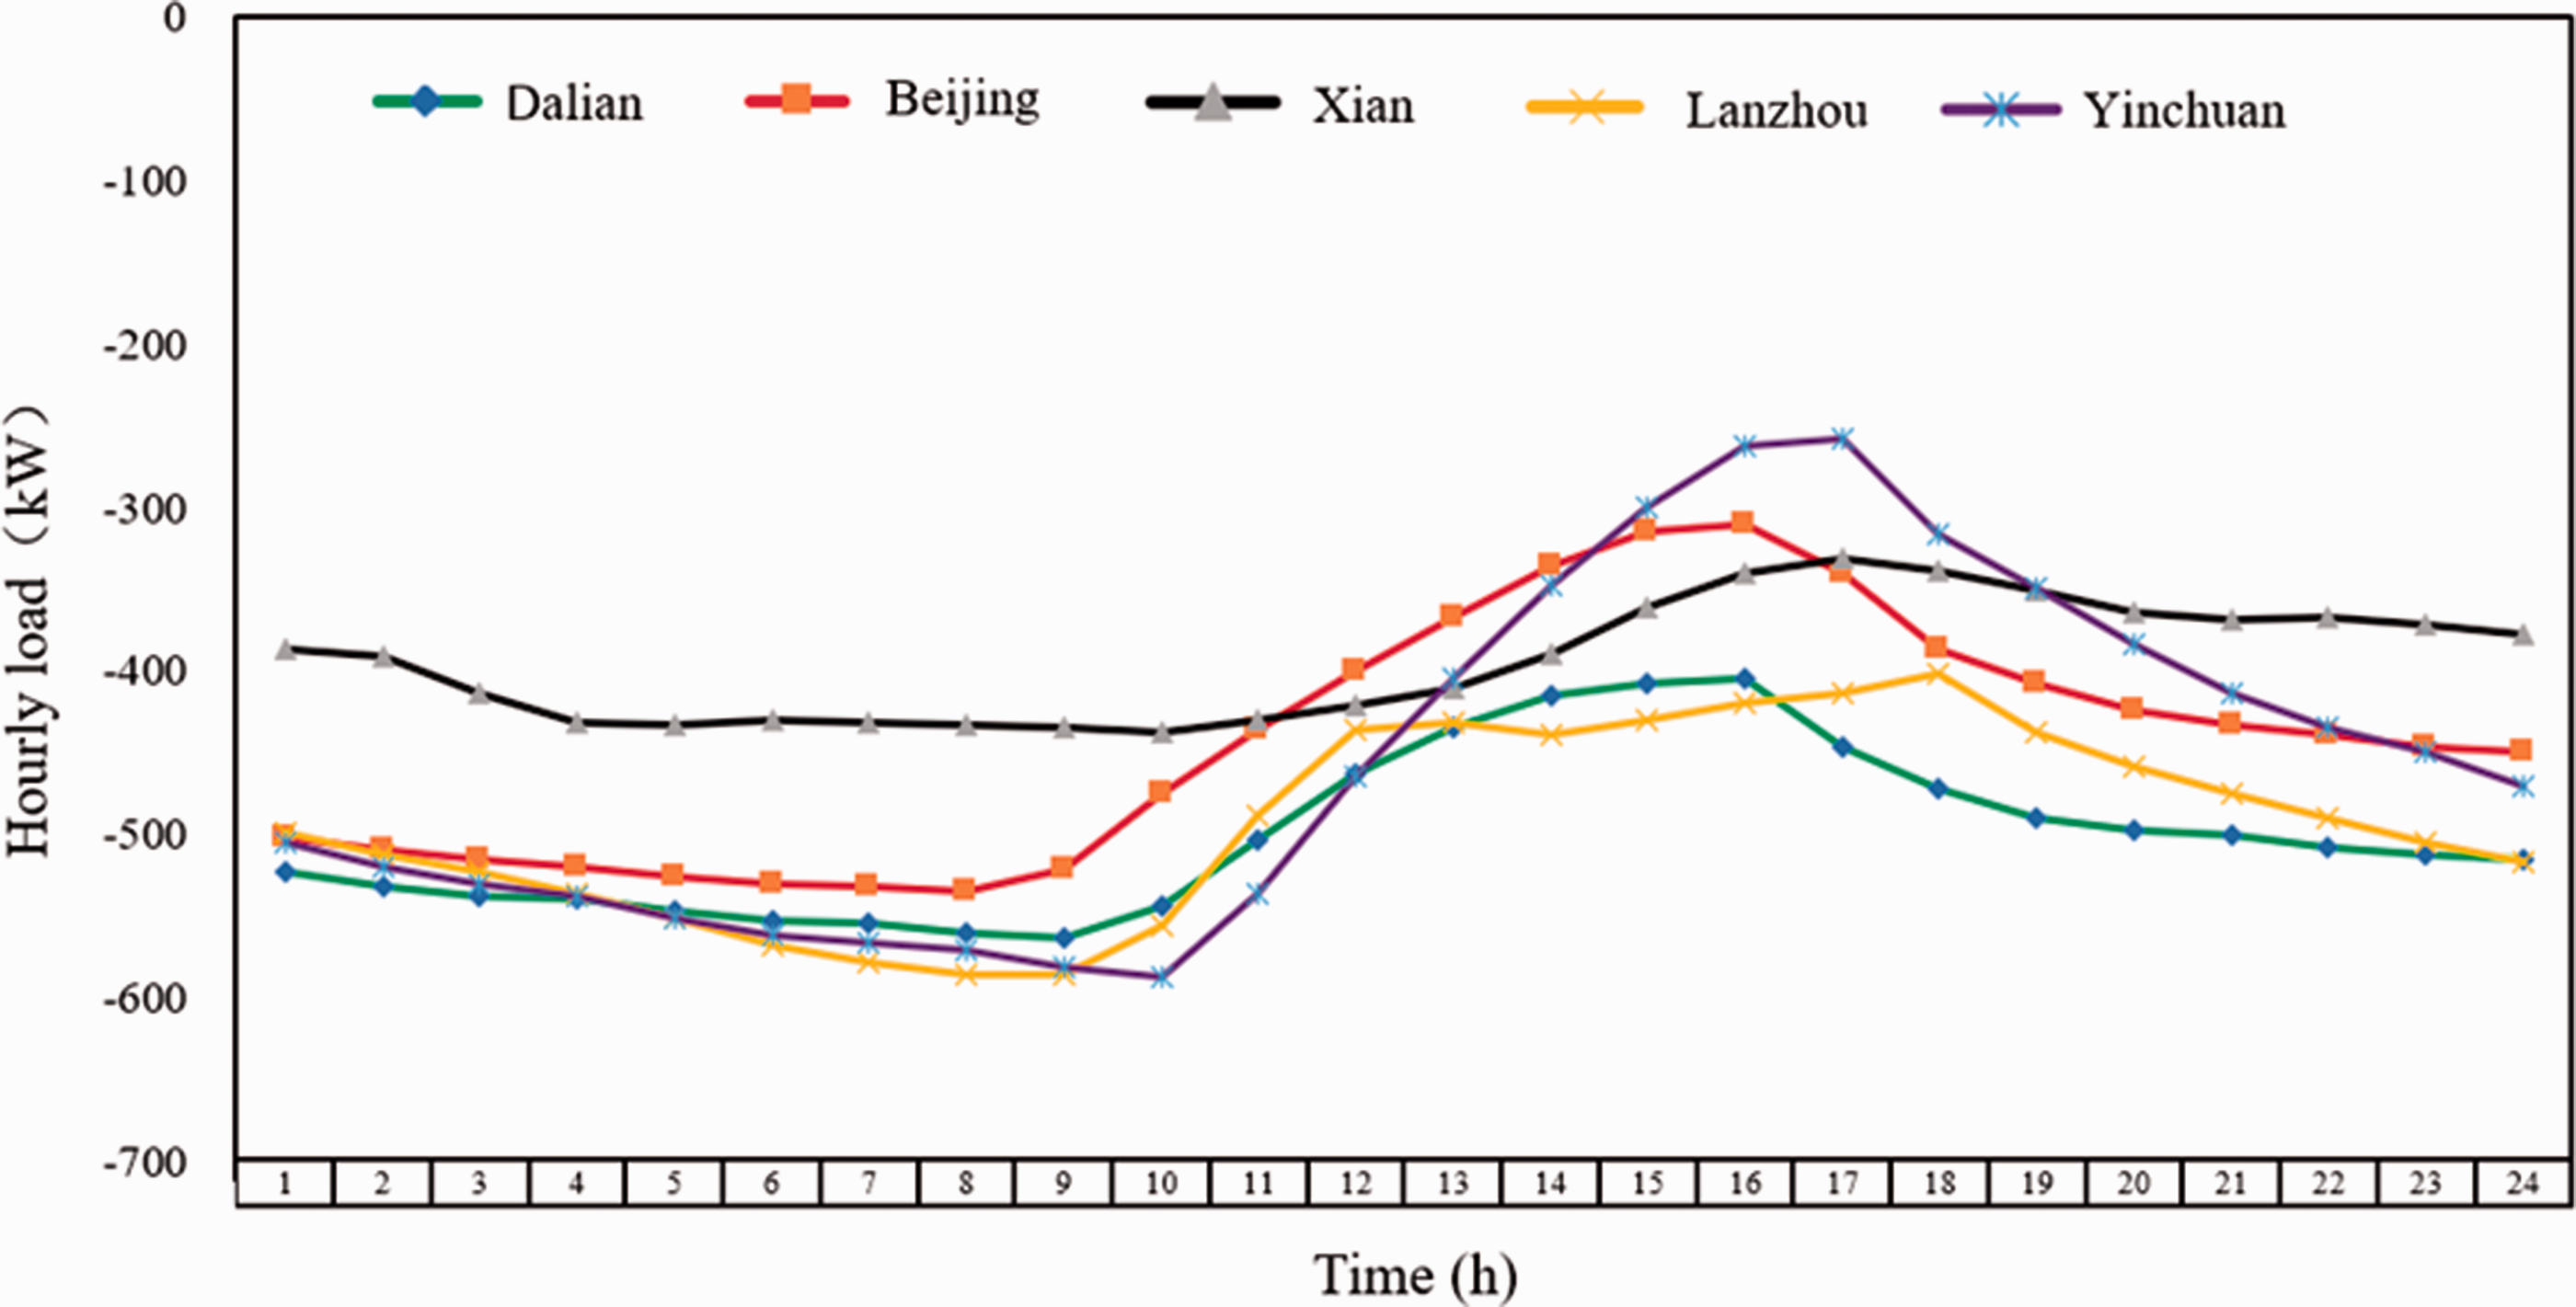
Hourly heat load curve of a typical design day in cold zones.
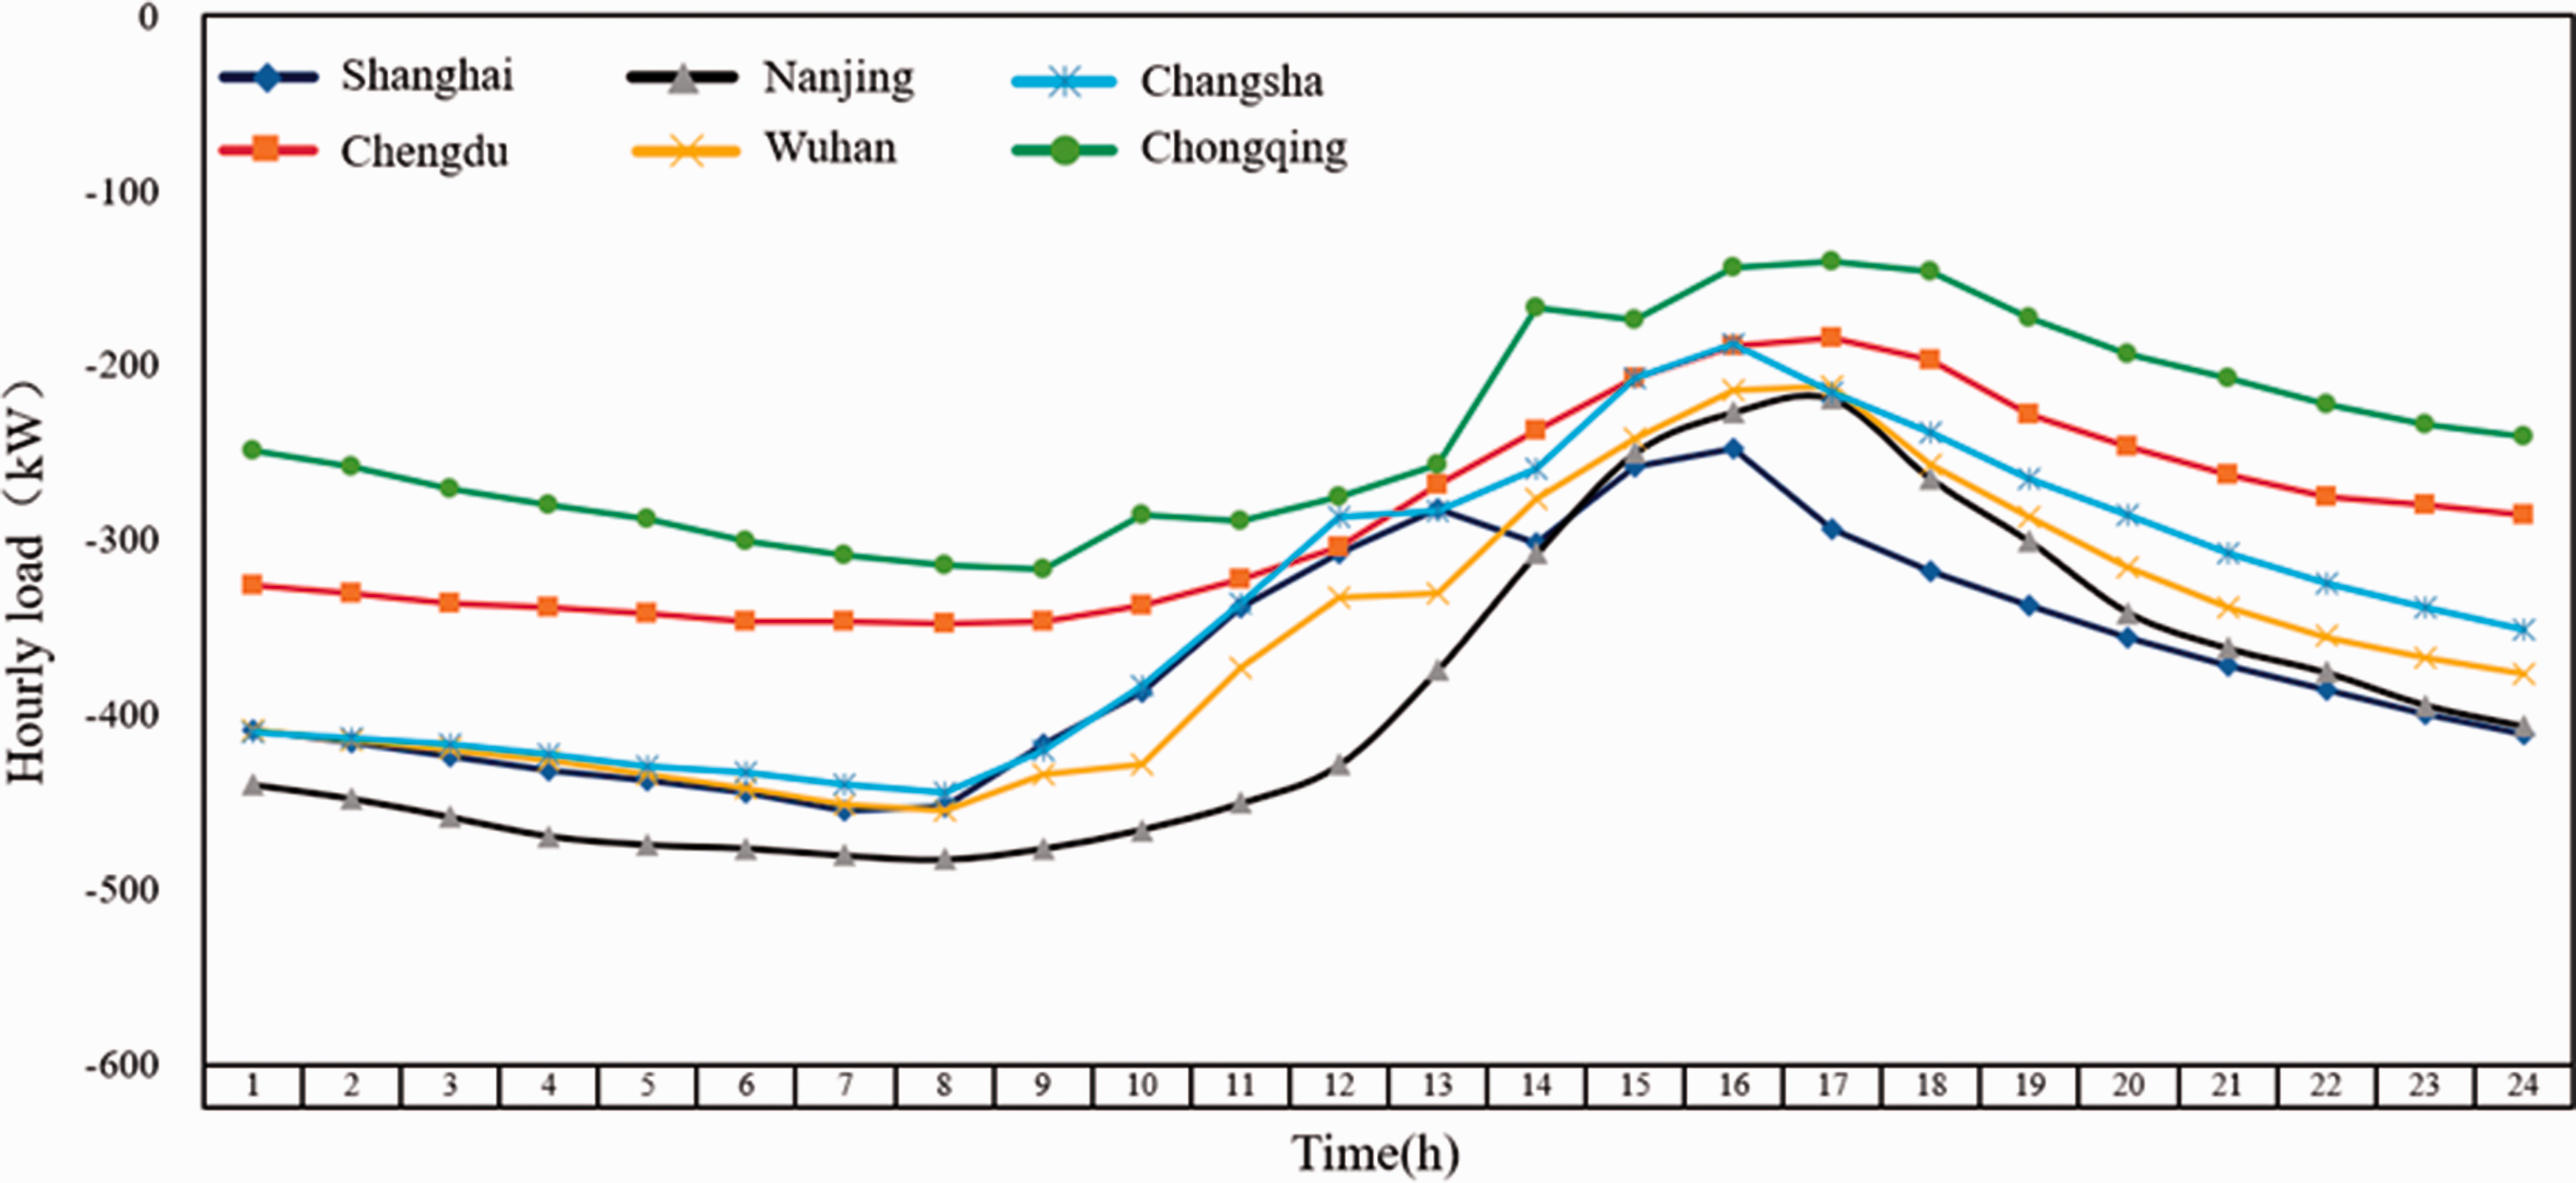
Hourly heat load curve of a typical design day in HSCWZ.
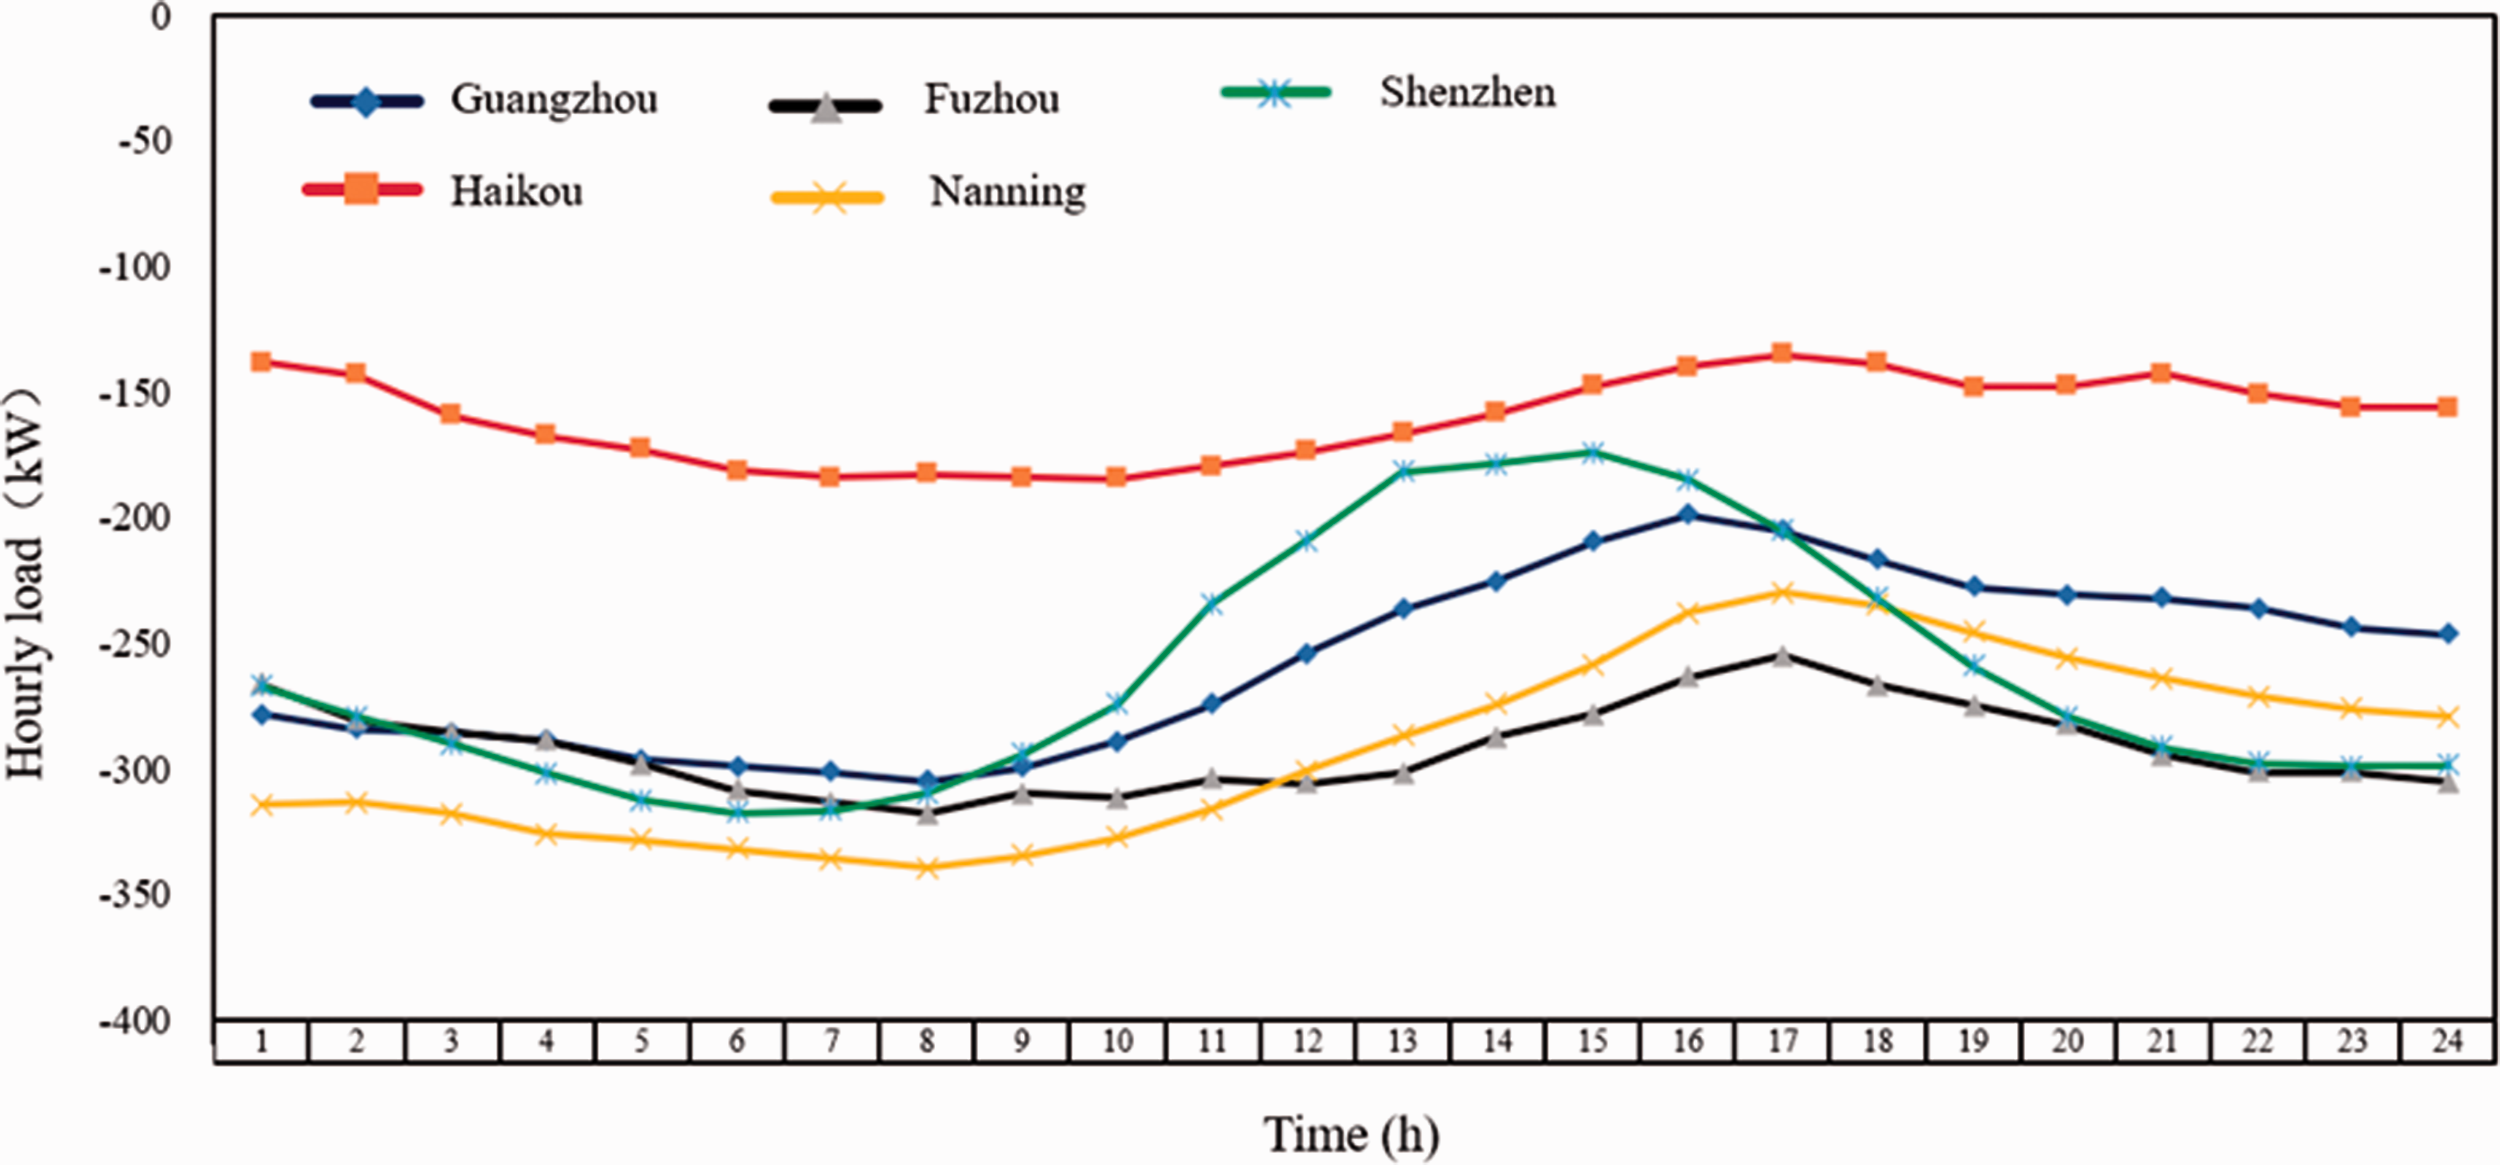
Hourly heat load curve of a typical design day in HSWWZ.
It can be found that steady-state design heat load of the HSACS on a typical day was mostly between the peak load and average load of the HSACS on a typical day by comparing the hourly heat load additional coefficient of the HSACS with continuous heating on a typical day and the steady-state design heat load of the HSACS on a typical day in different climate zones. In addition, it was relatively close to the average load of the HSACS on a typical day. However, due to differences in outdoor temperature conditions, the calculation results of the steady-state design heat load of the HSACS on a typical day in some cities do not meet this trend, as shown in Table 3. The reasons why the steady-state design heat load of the HSACS on a typical day in some areas was not between the peak load and average load of the HSACS on a typical day are as follows:
Comparison of hourly heat load and steady-state design heat load.
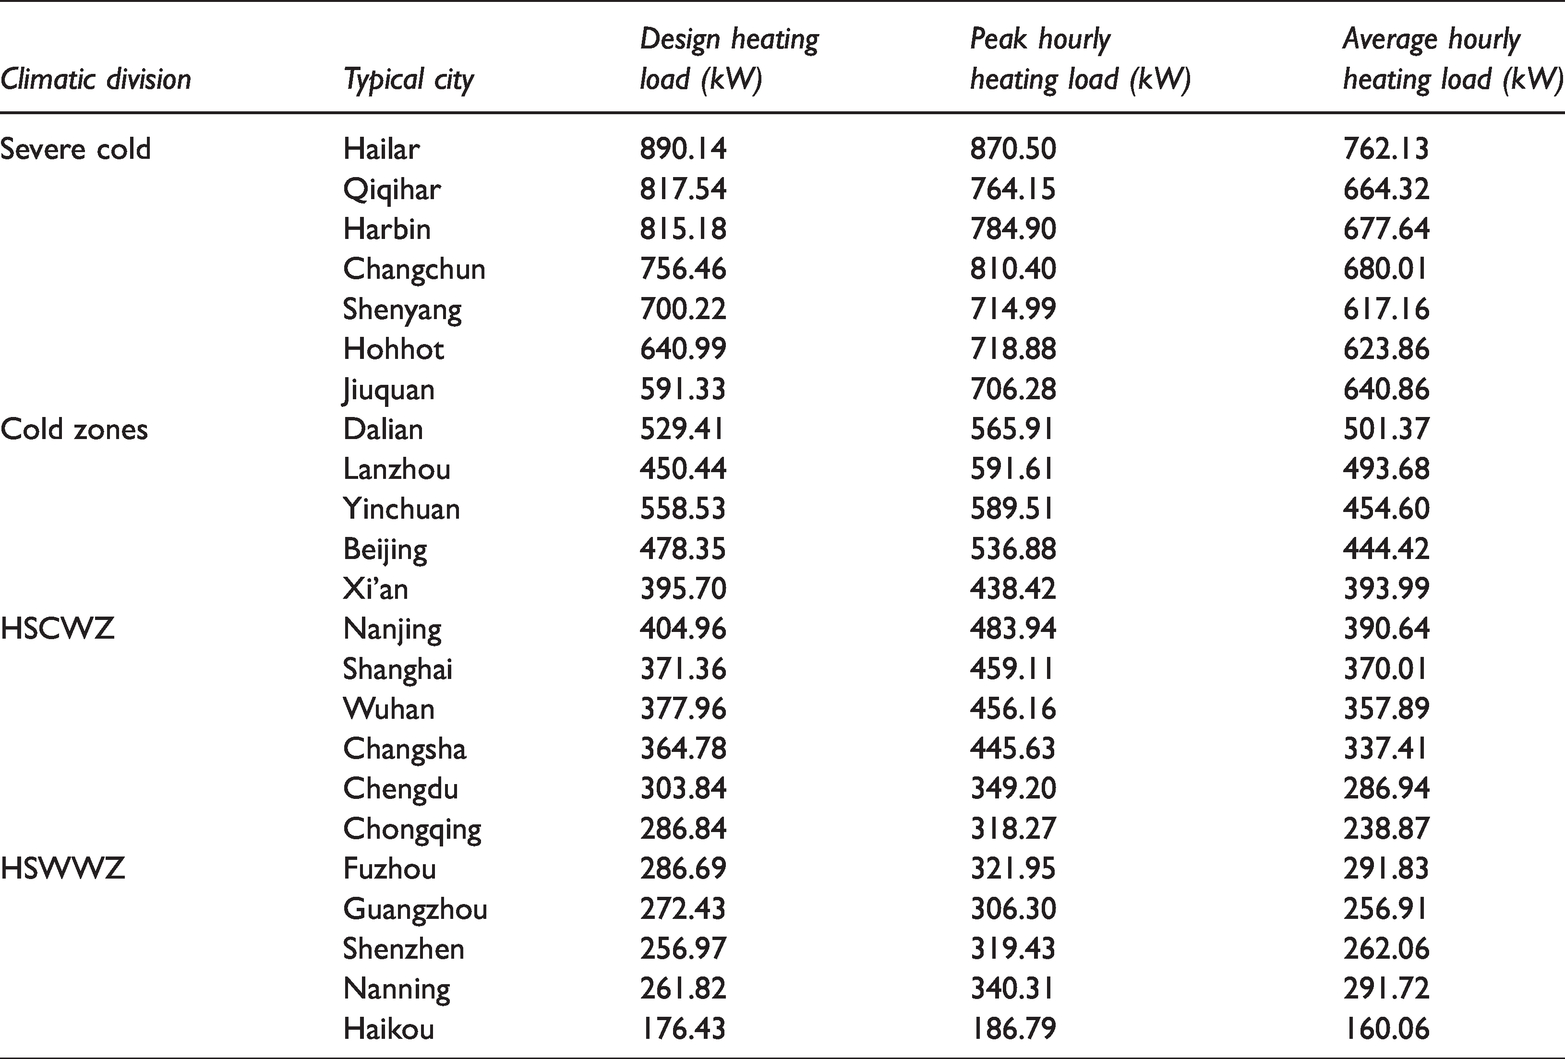
Different sources of weather data: meteorological data for the steady-state design heat load of HSACS on a typical day comes from the design code for heating ventilation and air-conditioning of civil buildings (Fang and Liu, 2010). However, the meteorological data of the hourly heat load of the HSACS comes from the TRNSYS software. The minimum daily average temperature of the coldest month in the software is higher than the daily average temperature of the steady-state design heat load of HSACS in the design code for heating ventilation and air-conditioning of civil buildings (Gu et al., 2004).
Selection differences on typical design days: The lowest daily average temperature of the coldest month in cold zones, HSWWZ are higher than the outdoor calculated temperature for air-conditioning in Appendix of the design code for heating ventilation and air-conditioning of civil buildings. Simultaneously, the load characteristics are not obvious.
Hourly heat load additional coefficient of the HSACS with continuous heating on a typical day
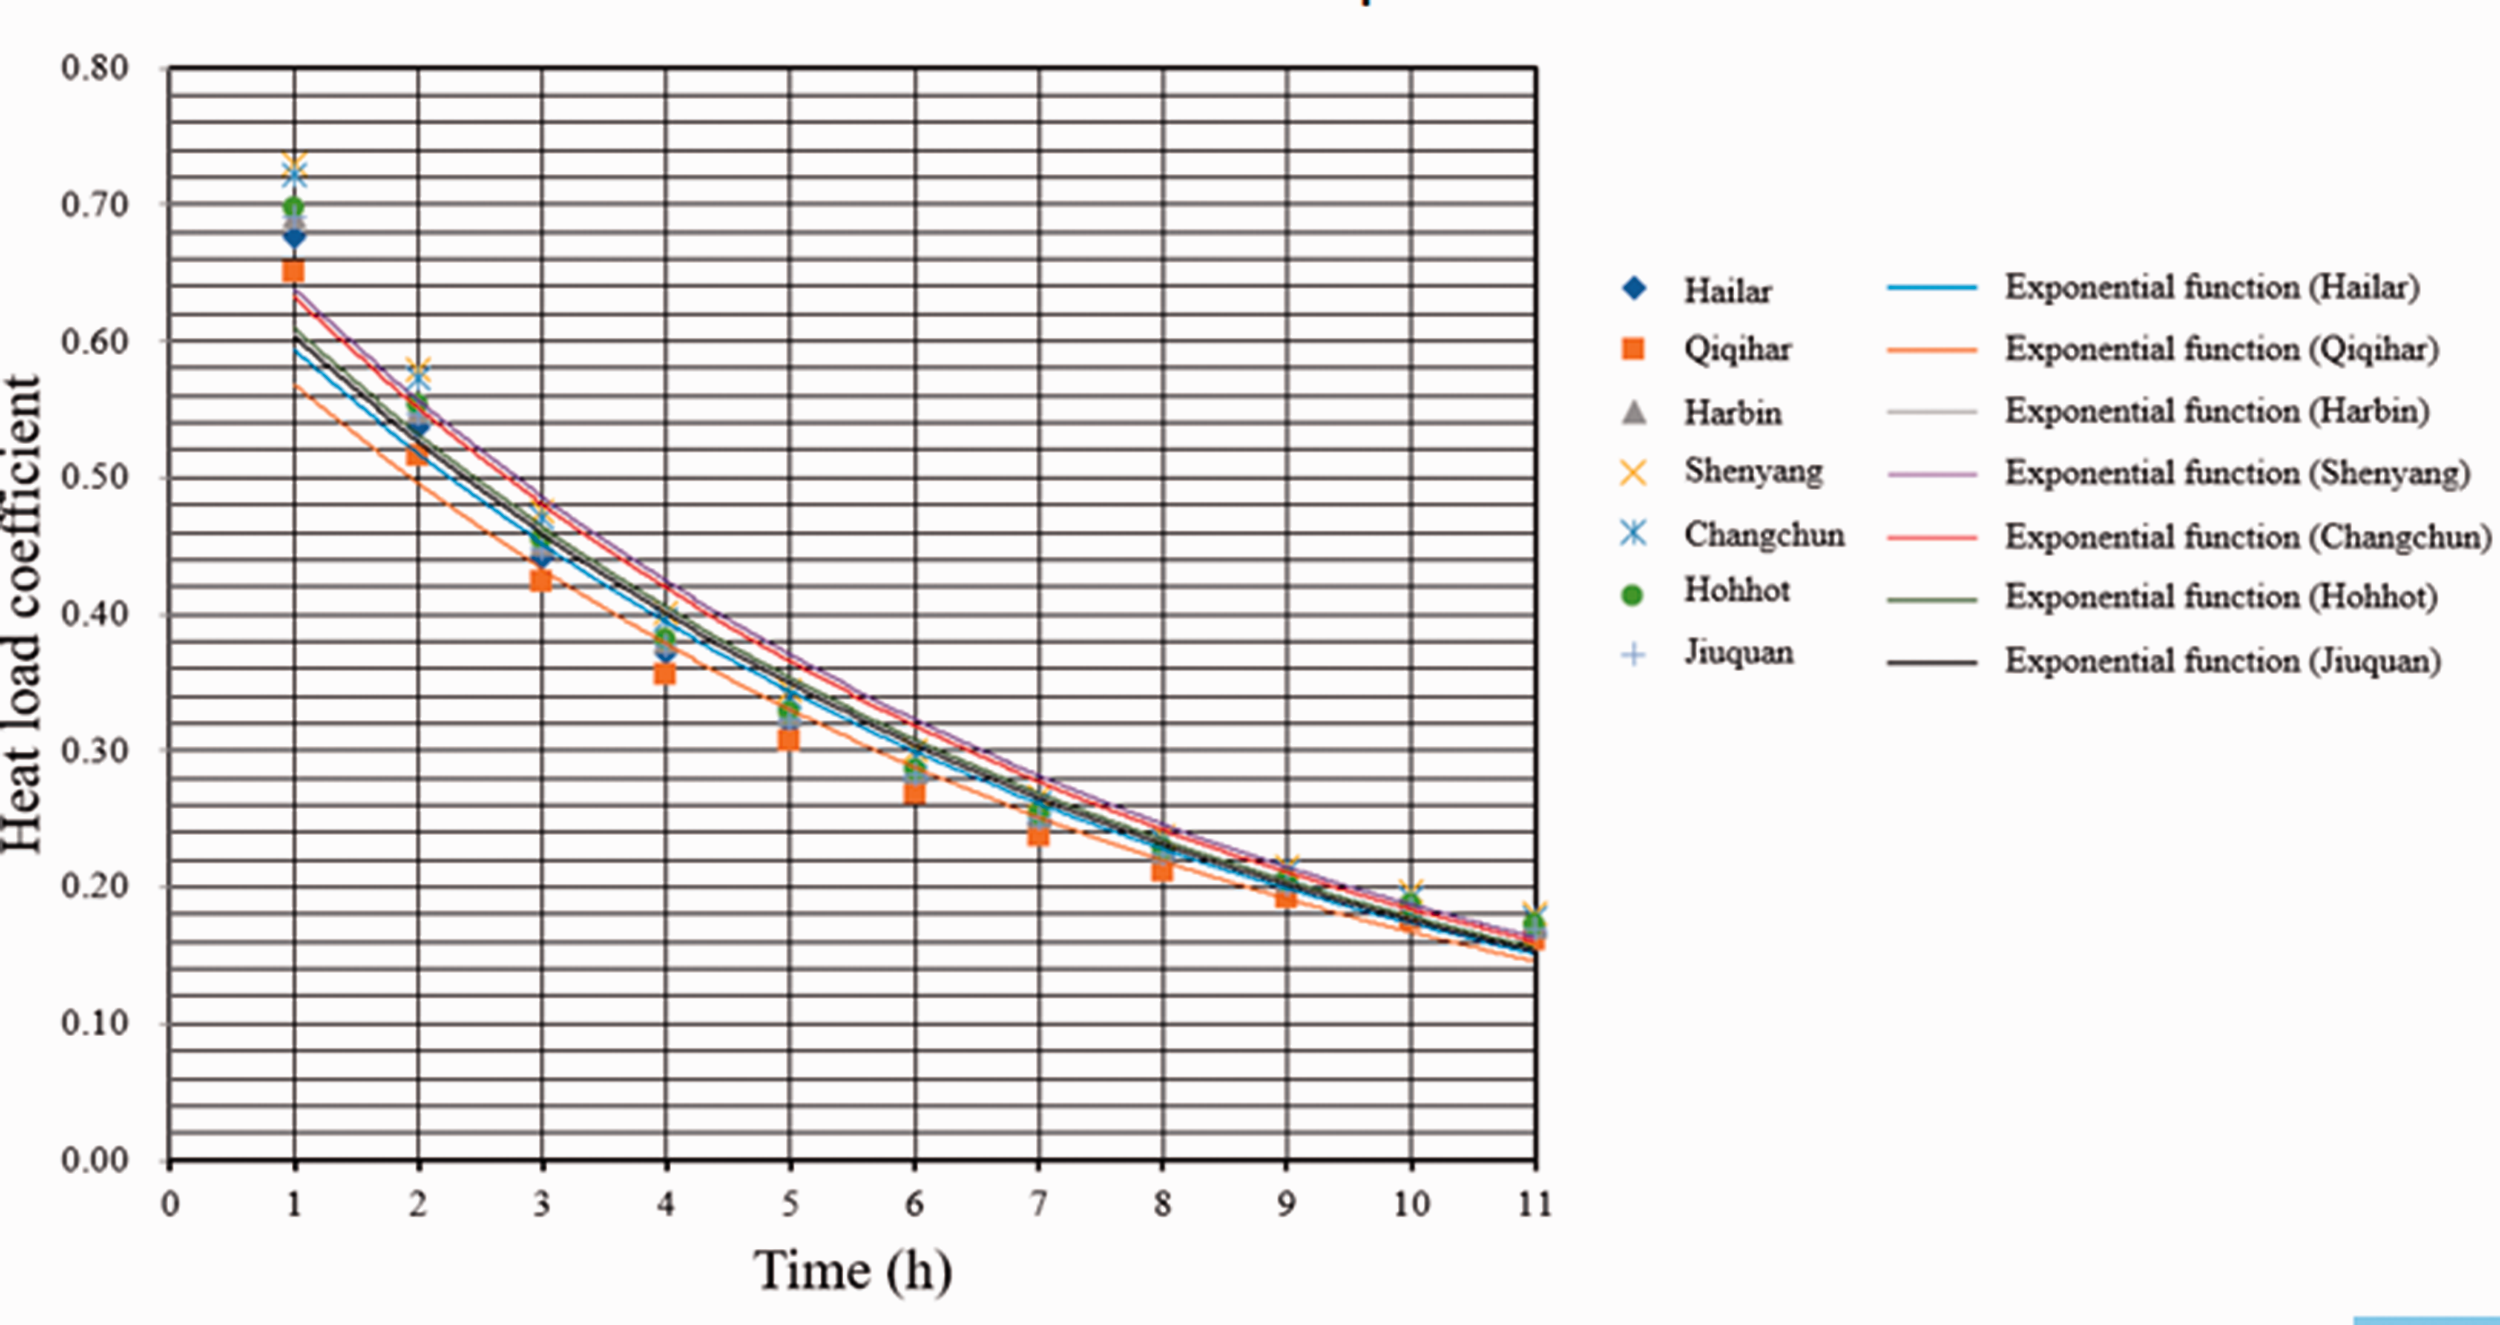
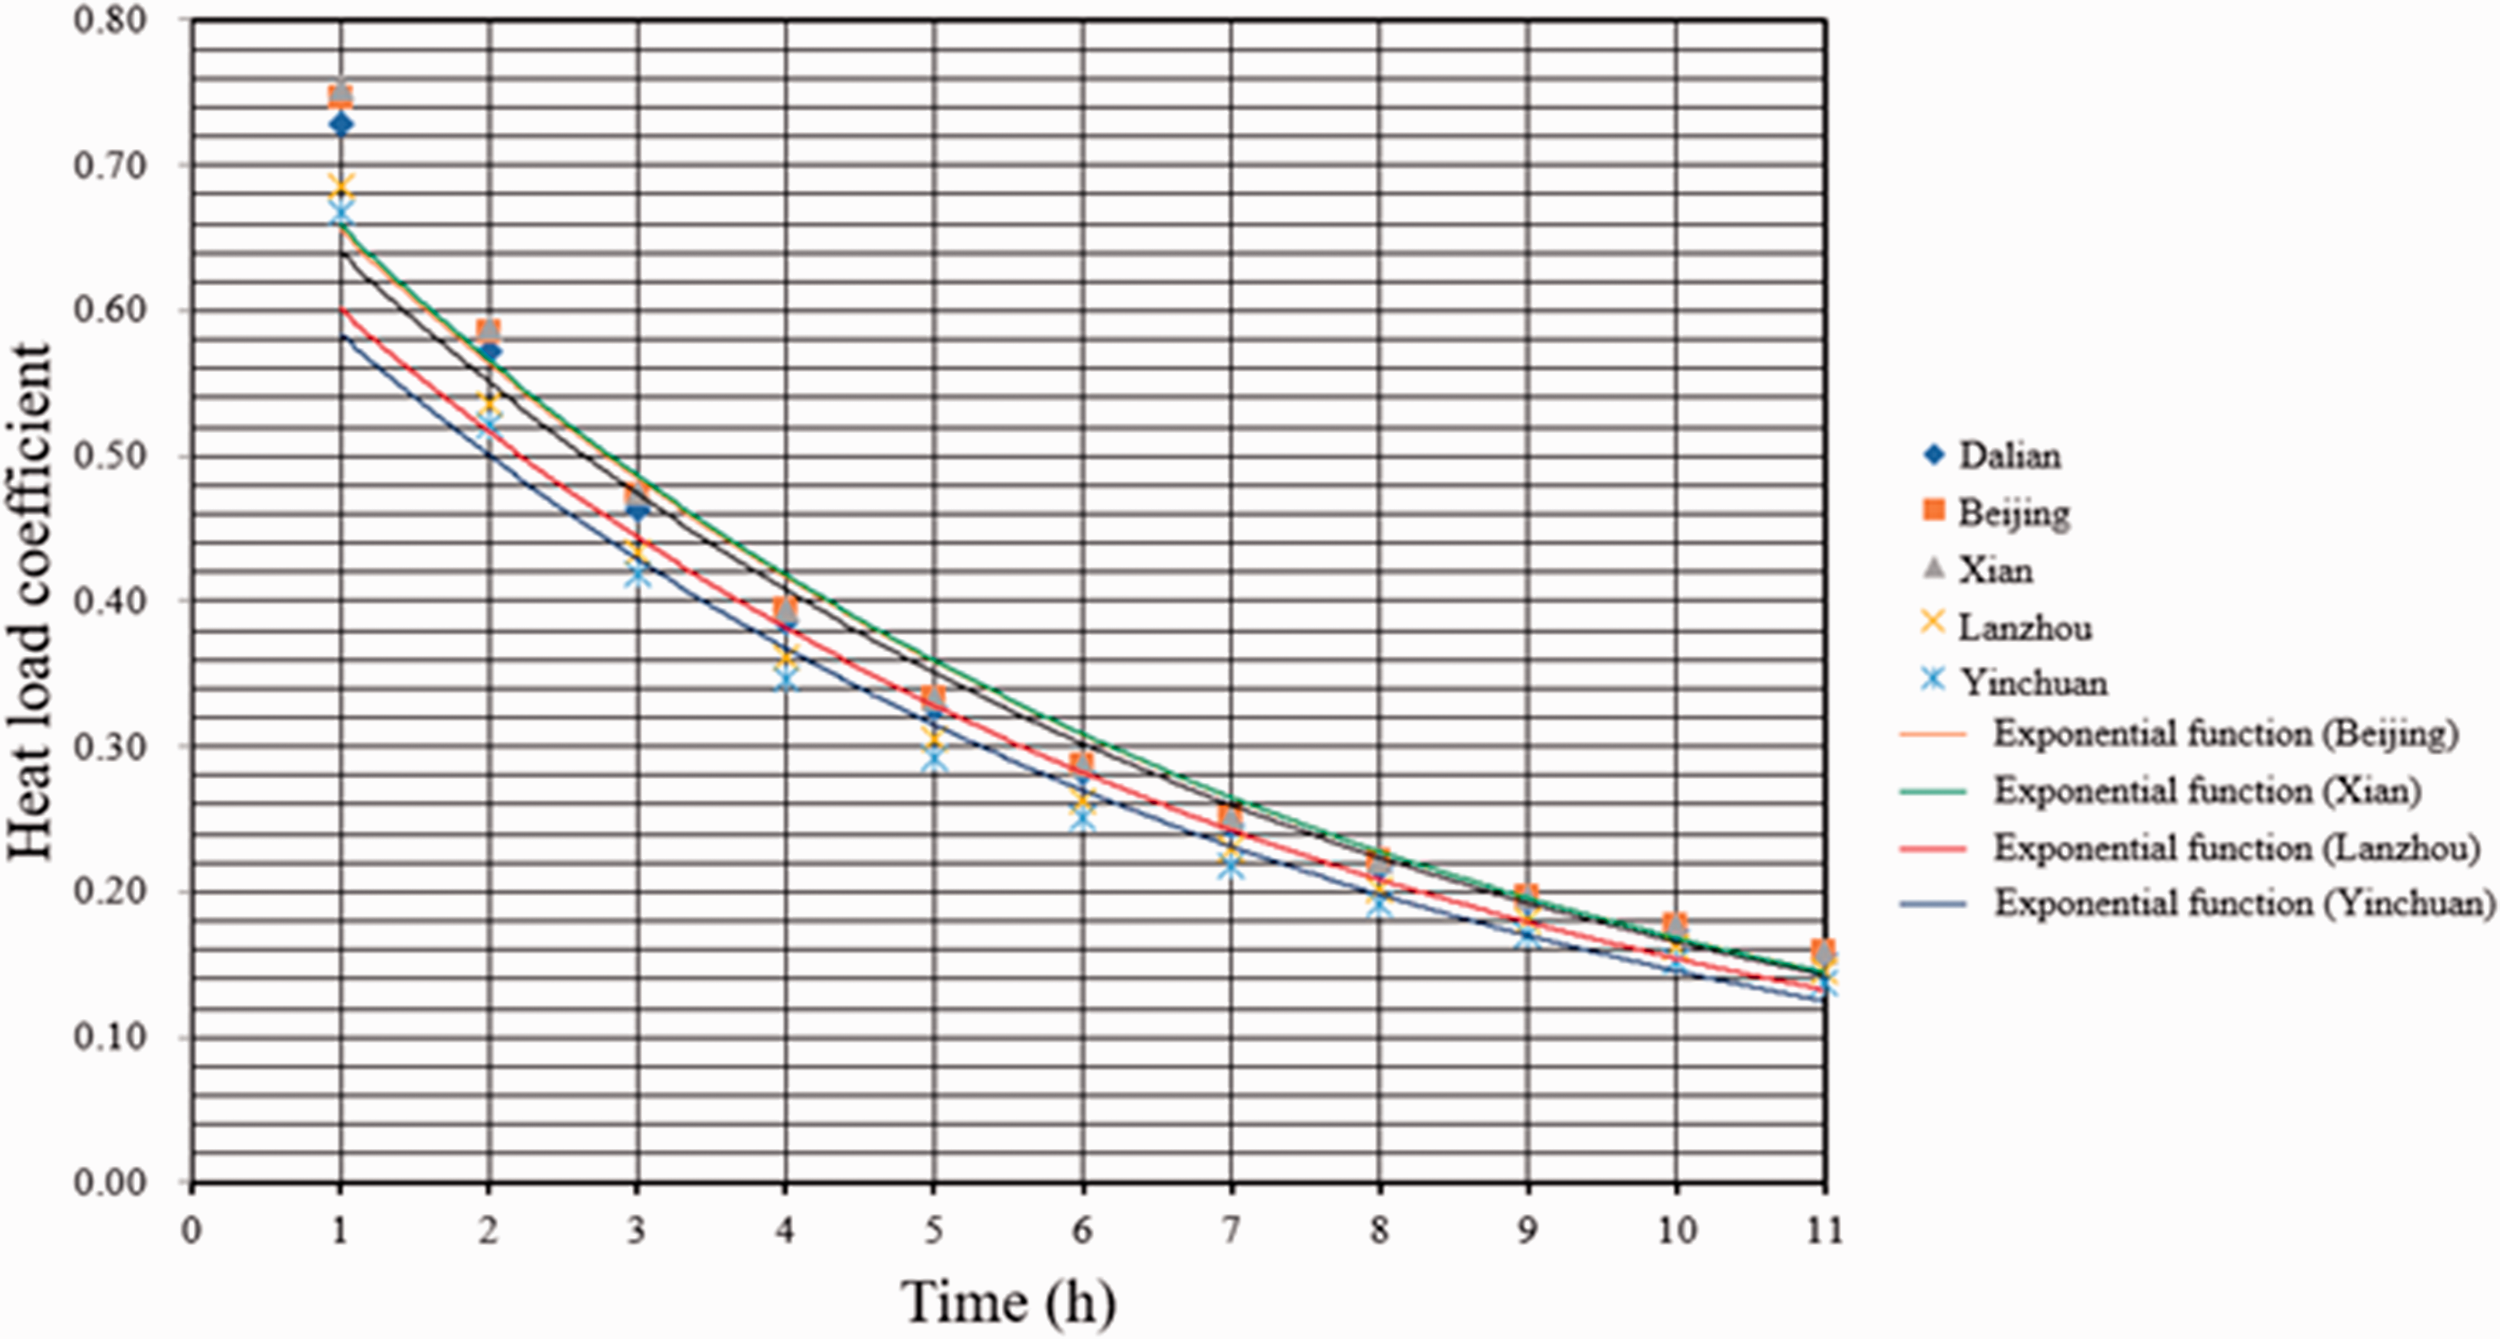
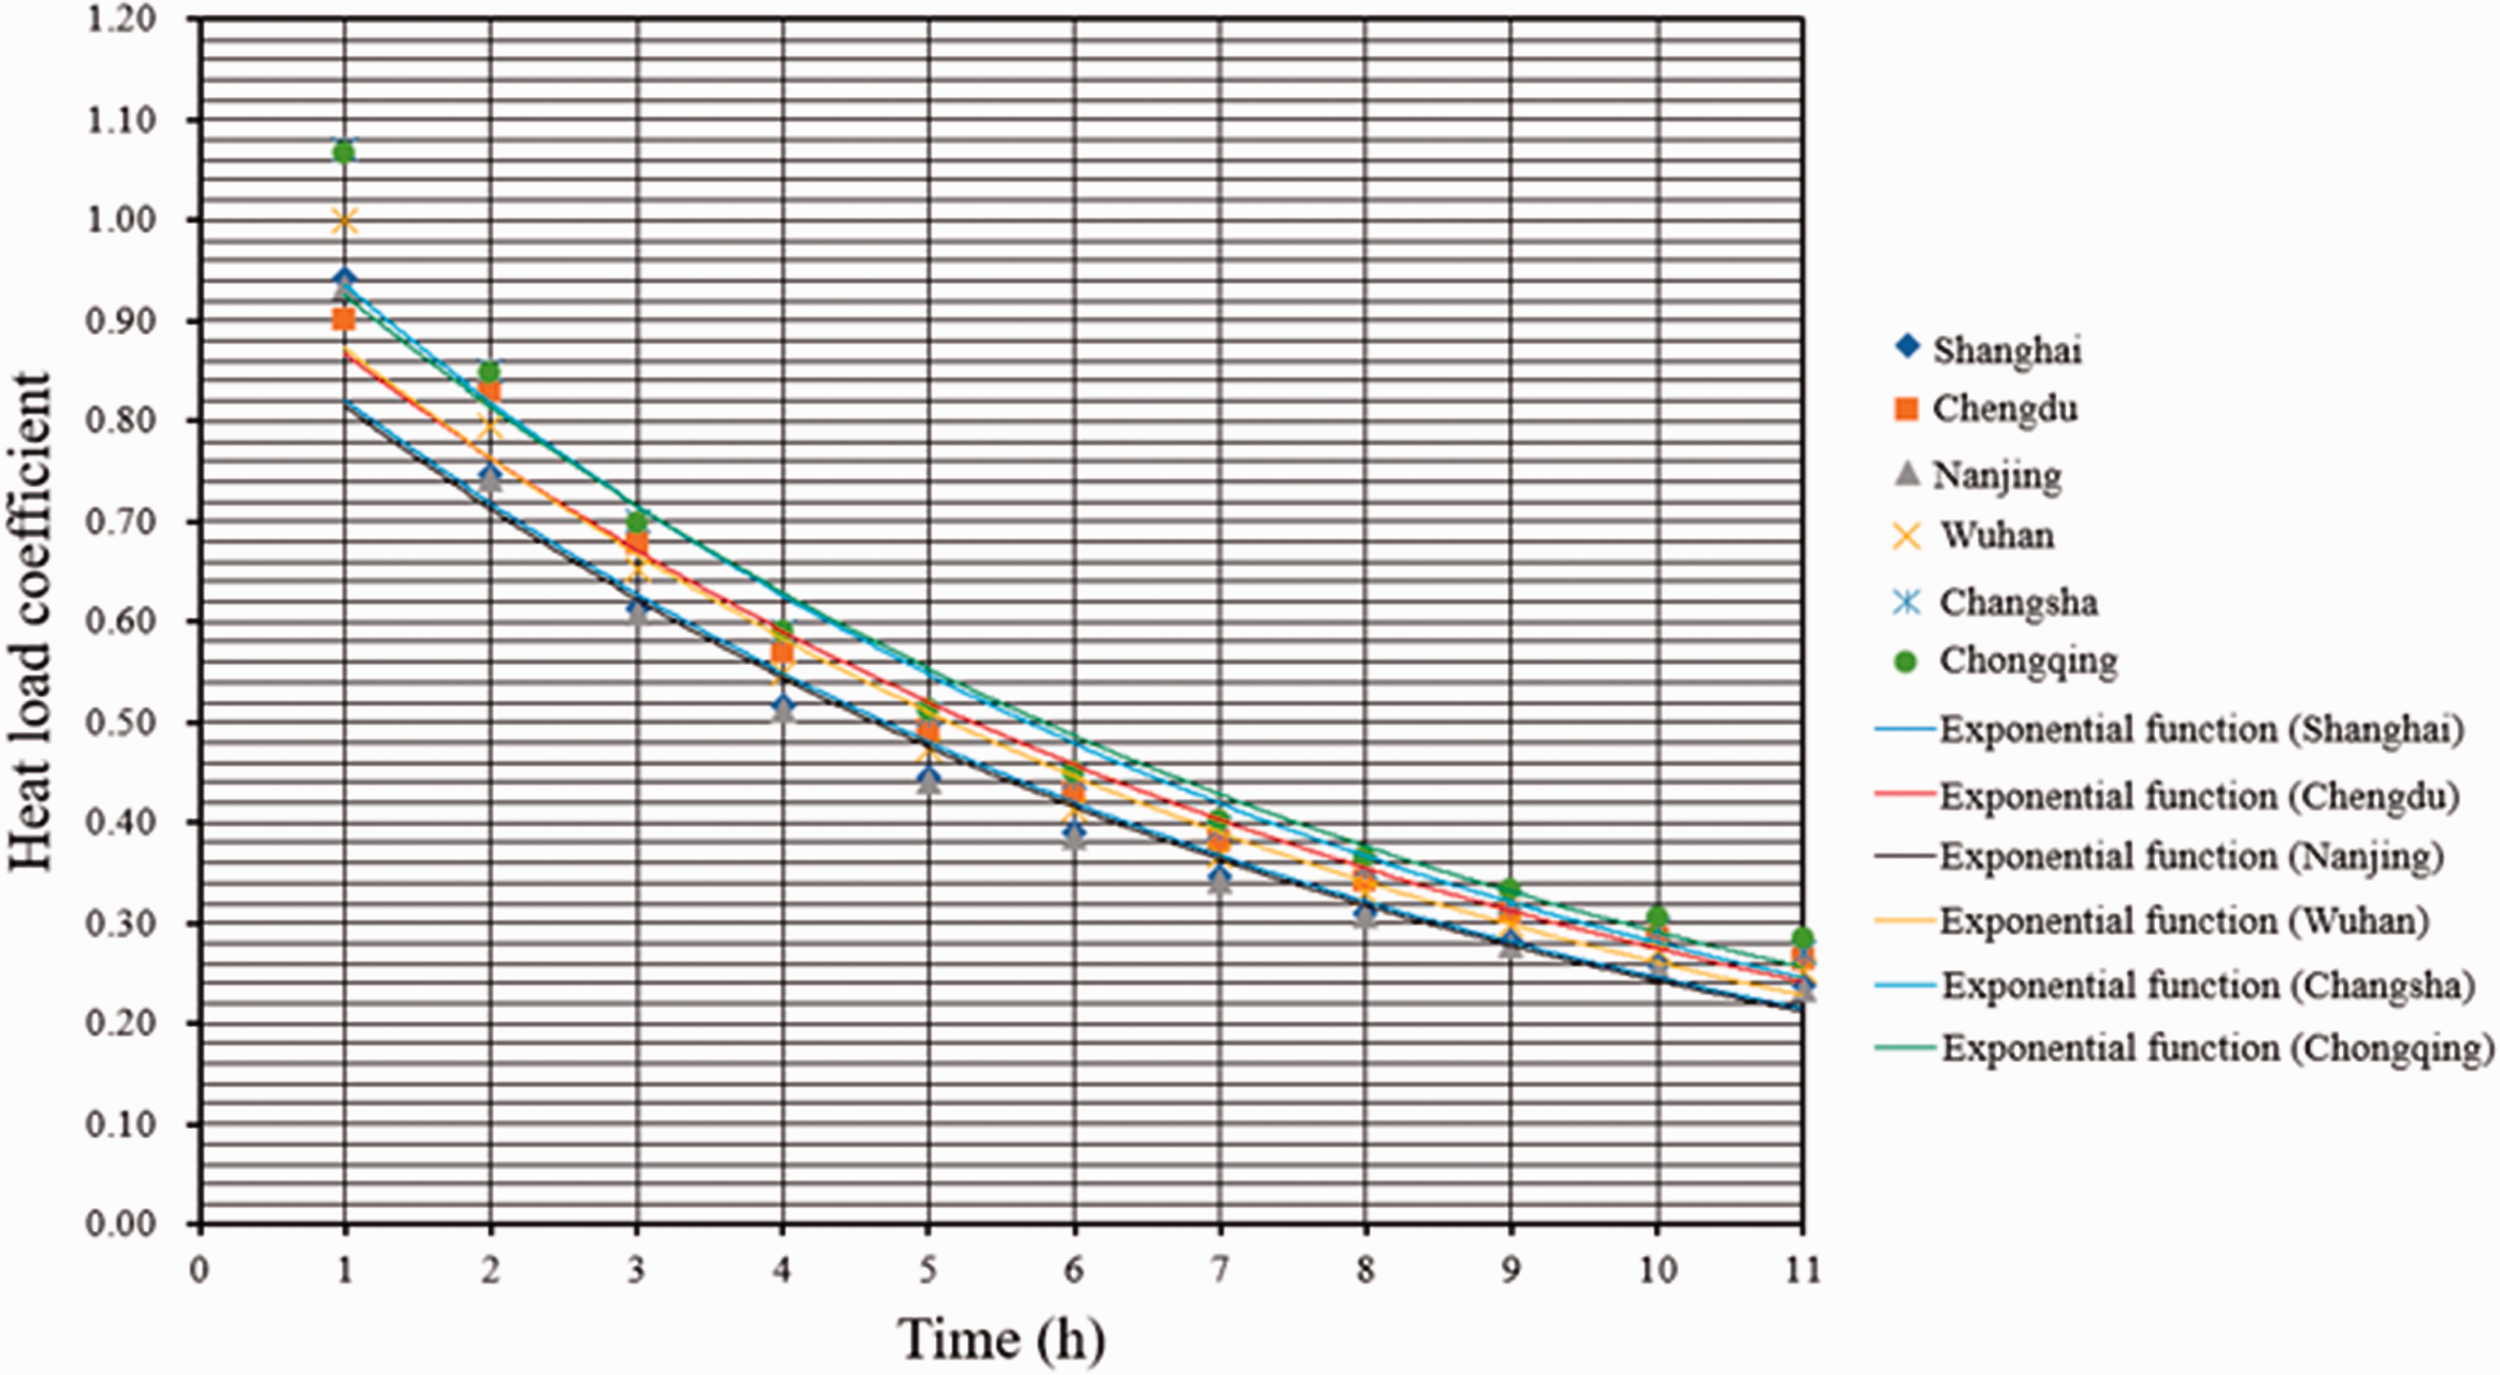
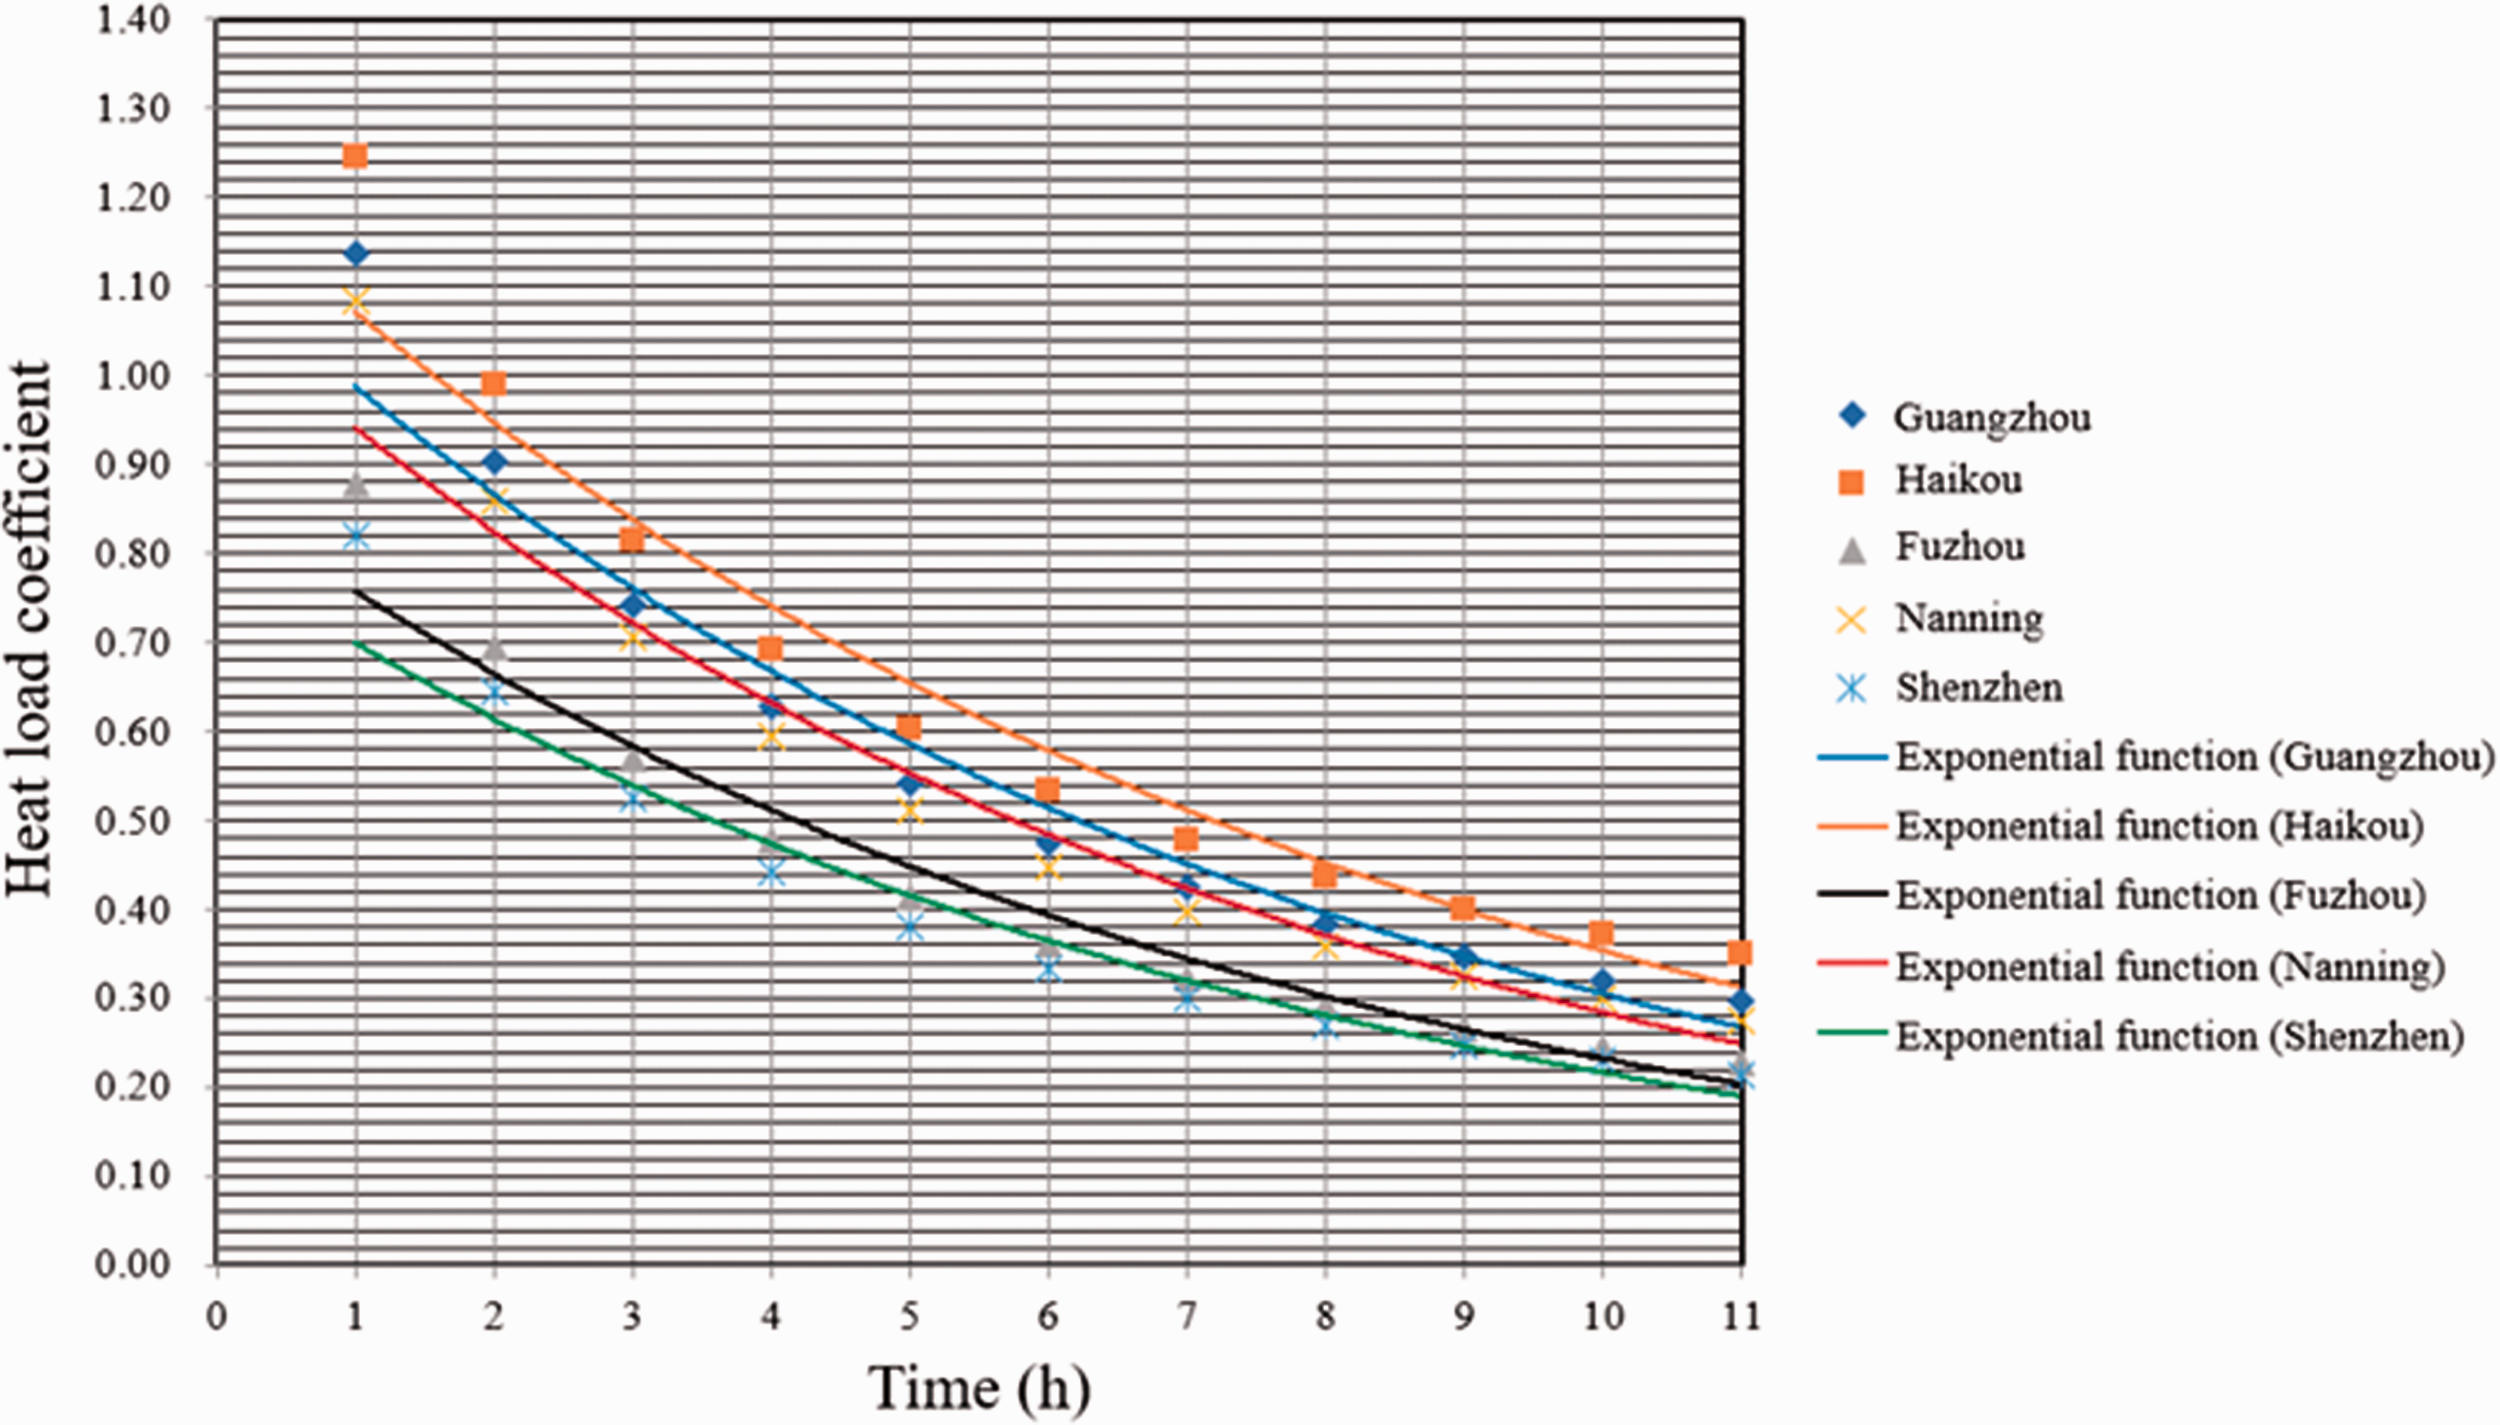
The hourly heat load of a typical day was calculated. Then, Hourly heat load additional coefficient of the HSACS with continuous heating on a typical day was obtained by equation (1). The hourly heat load coefficient curves of typical cities in each climate zone were shown in Figures 10 to 13.
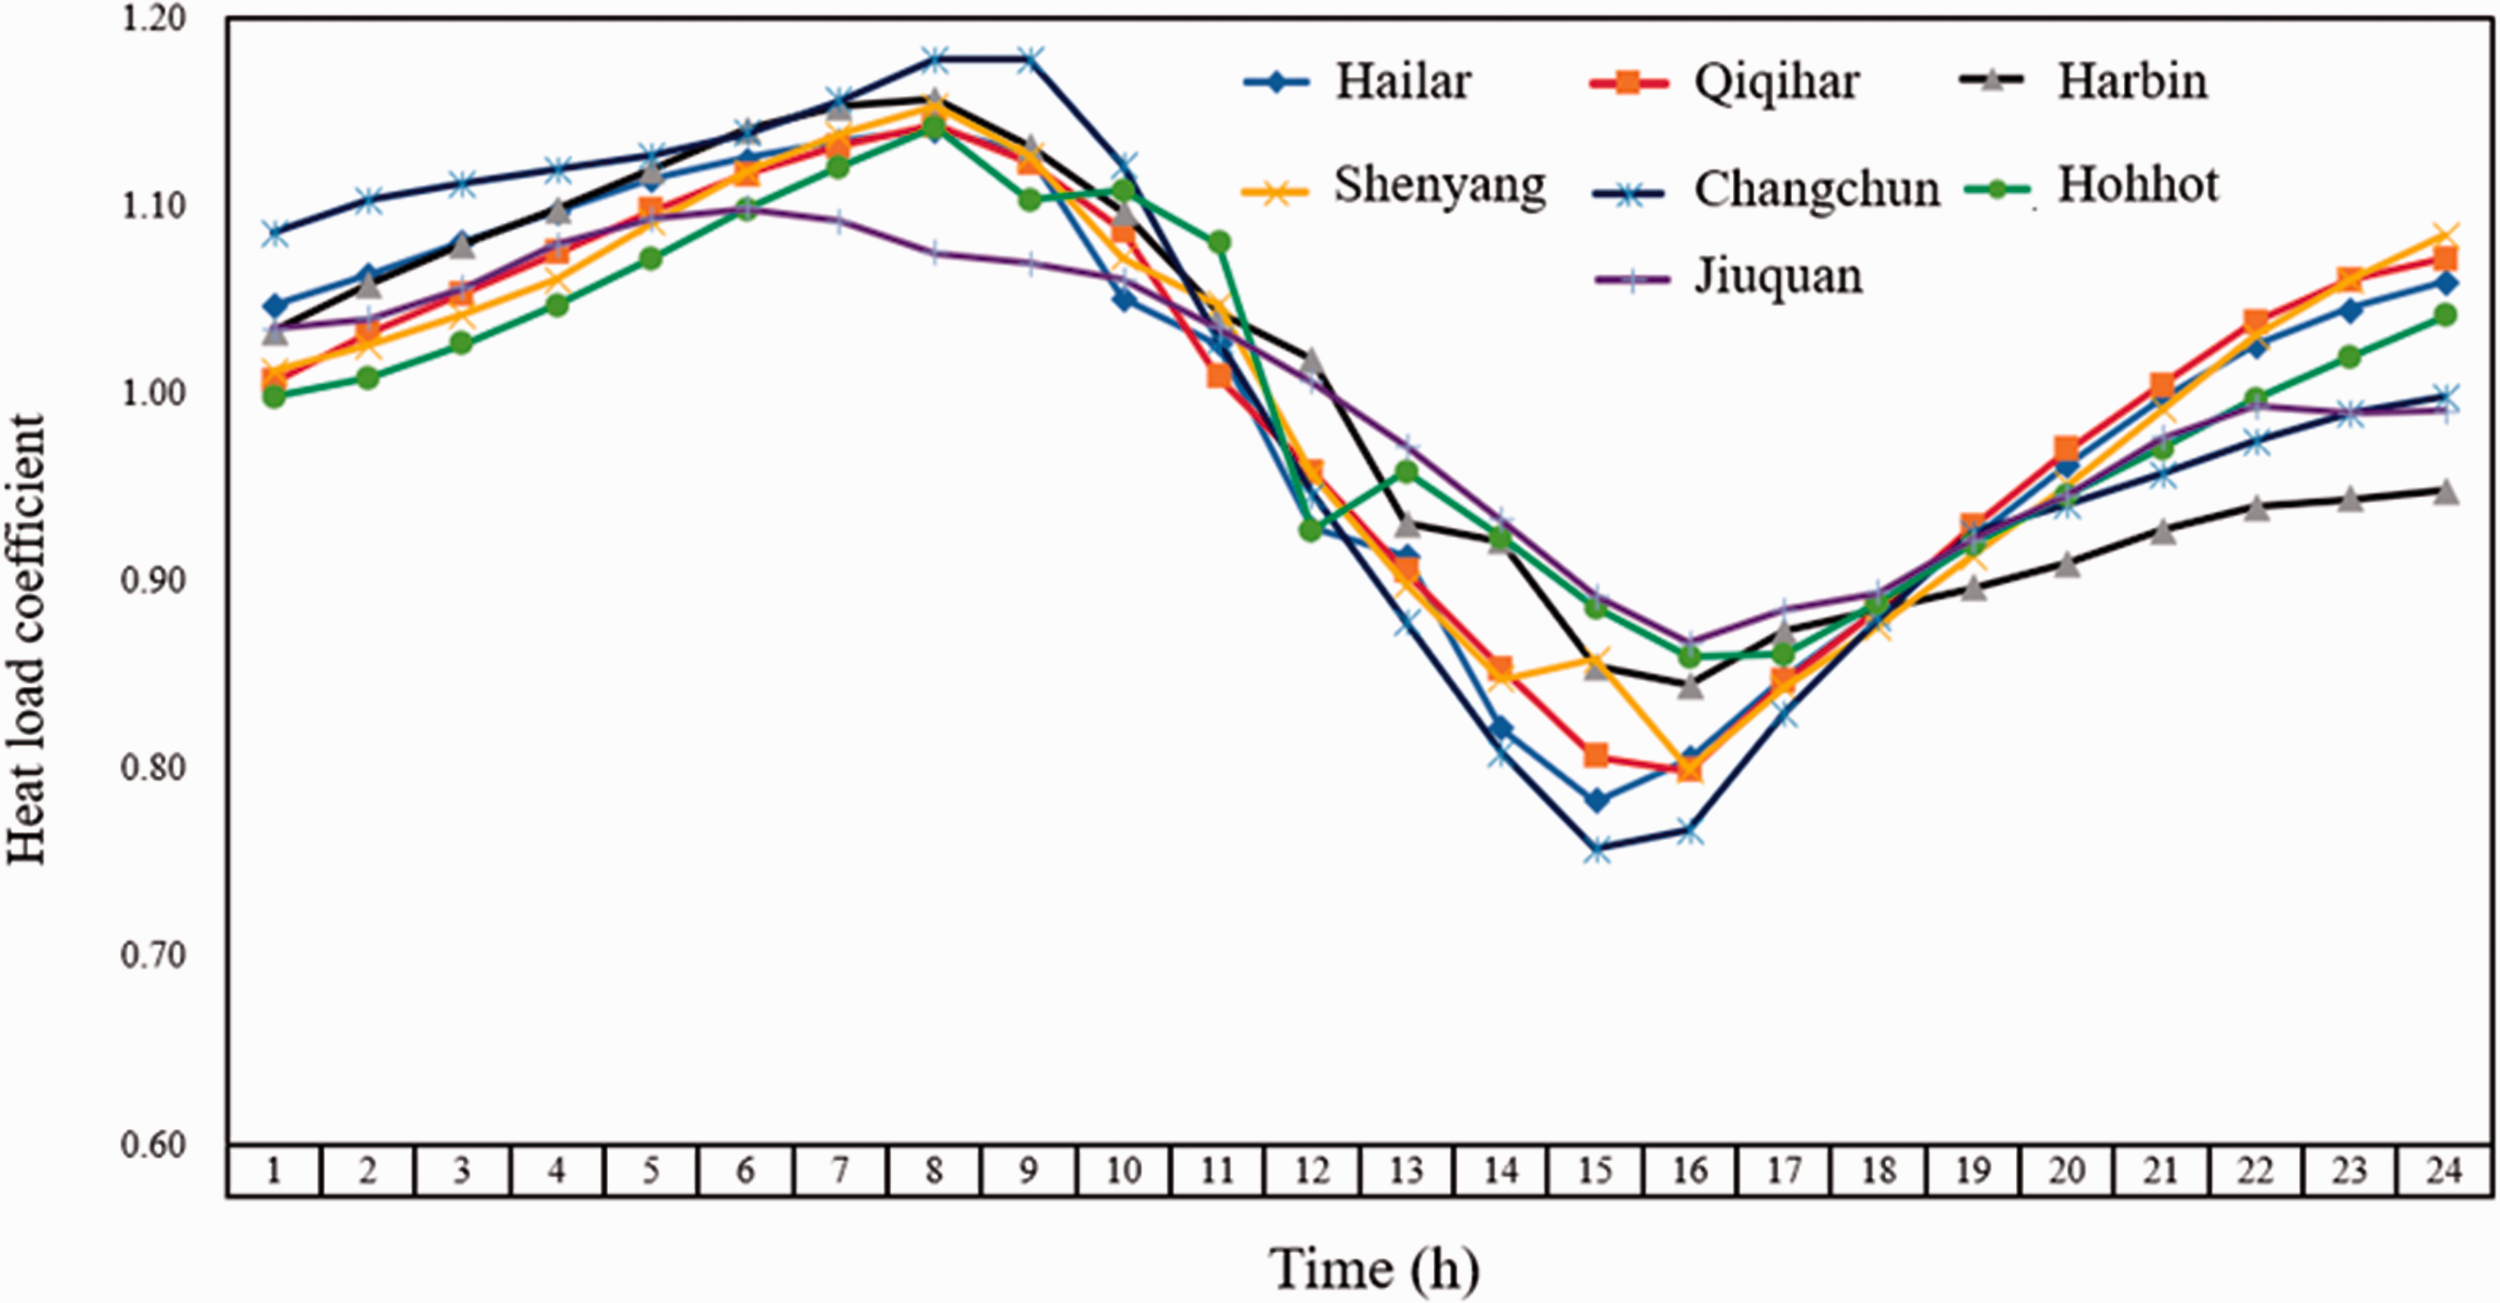
Hourly heat load additional coefficient of the HSACS with continuous heating on a typical day in severe cold zones.
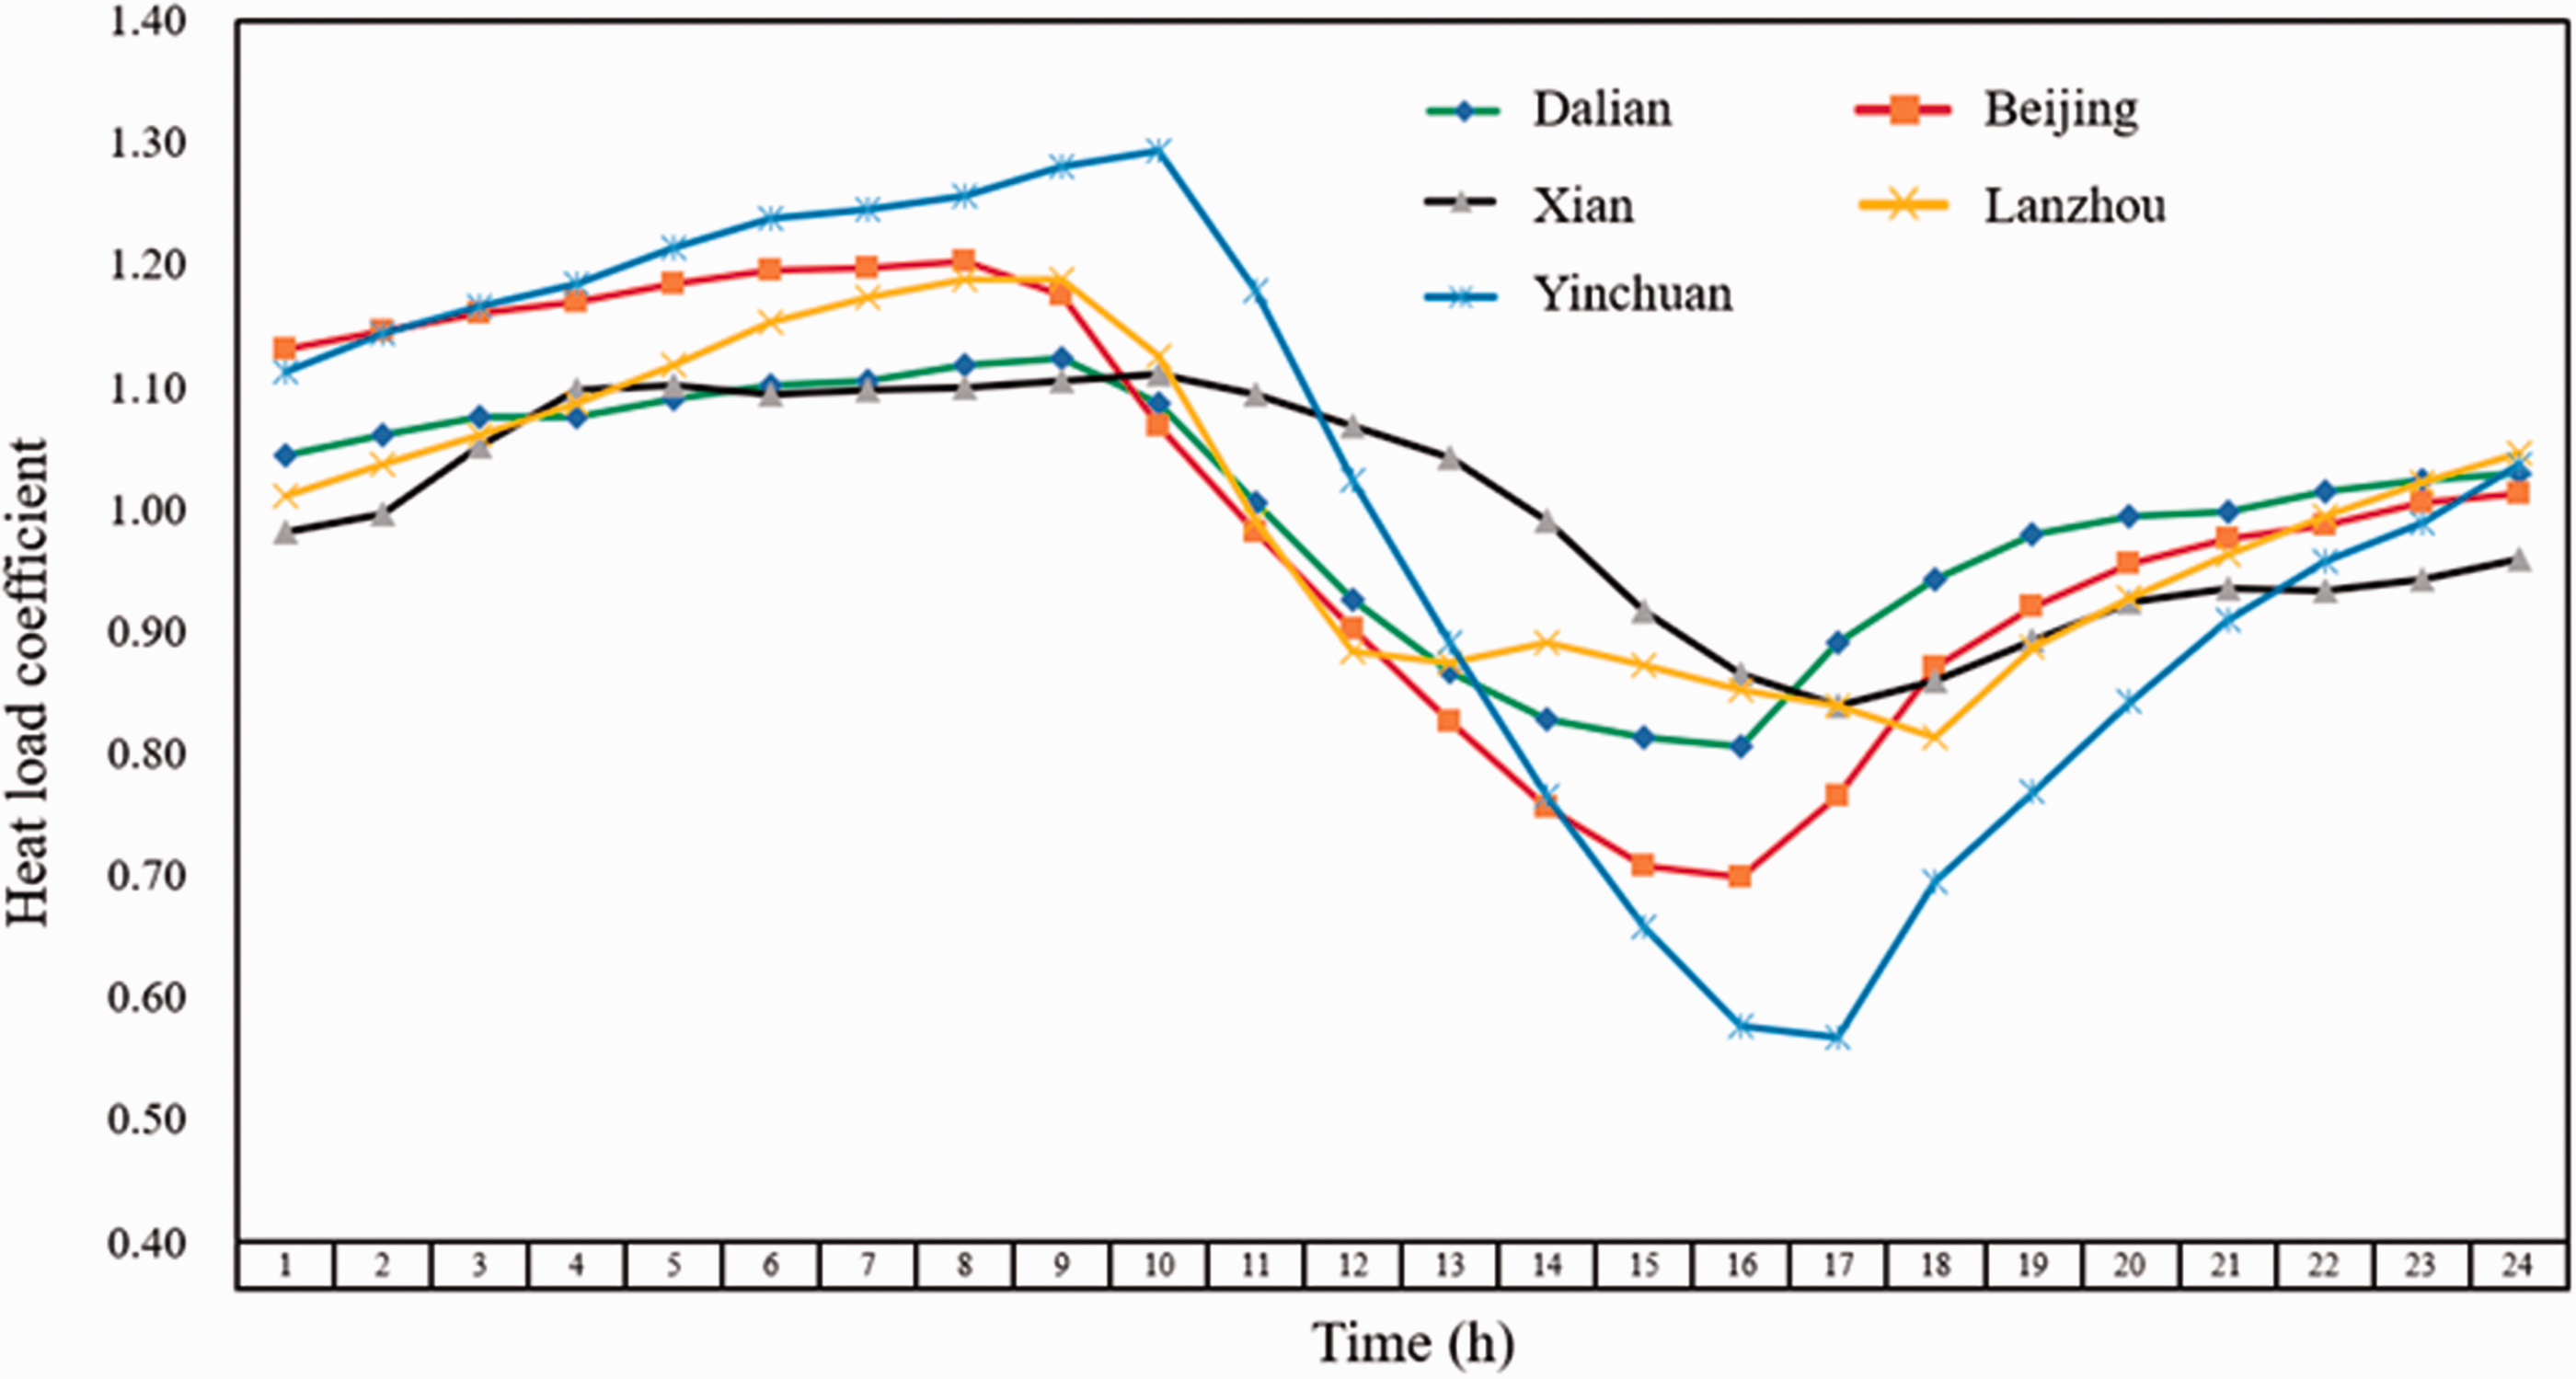
Hourly heat load additional coefficient of the HSACS with continuous heating on a typical day in cold zones.
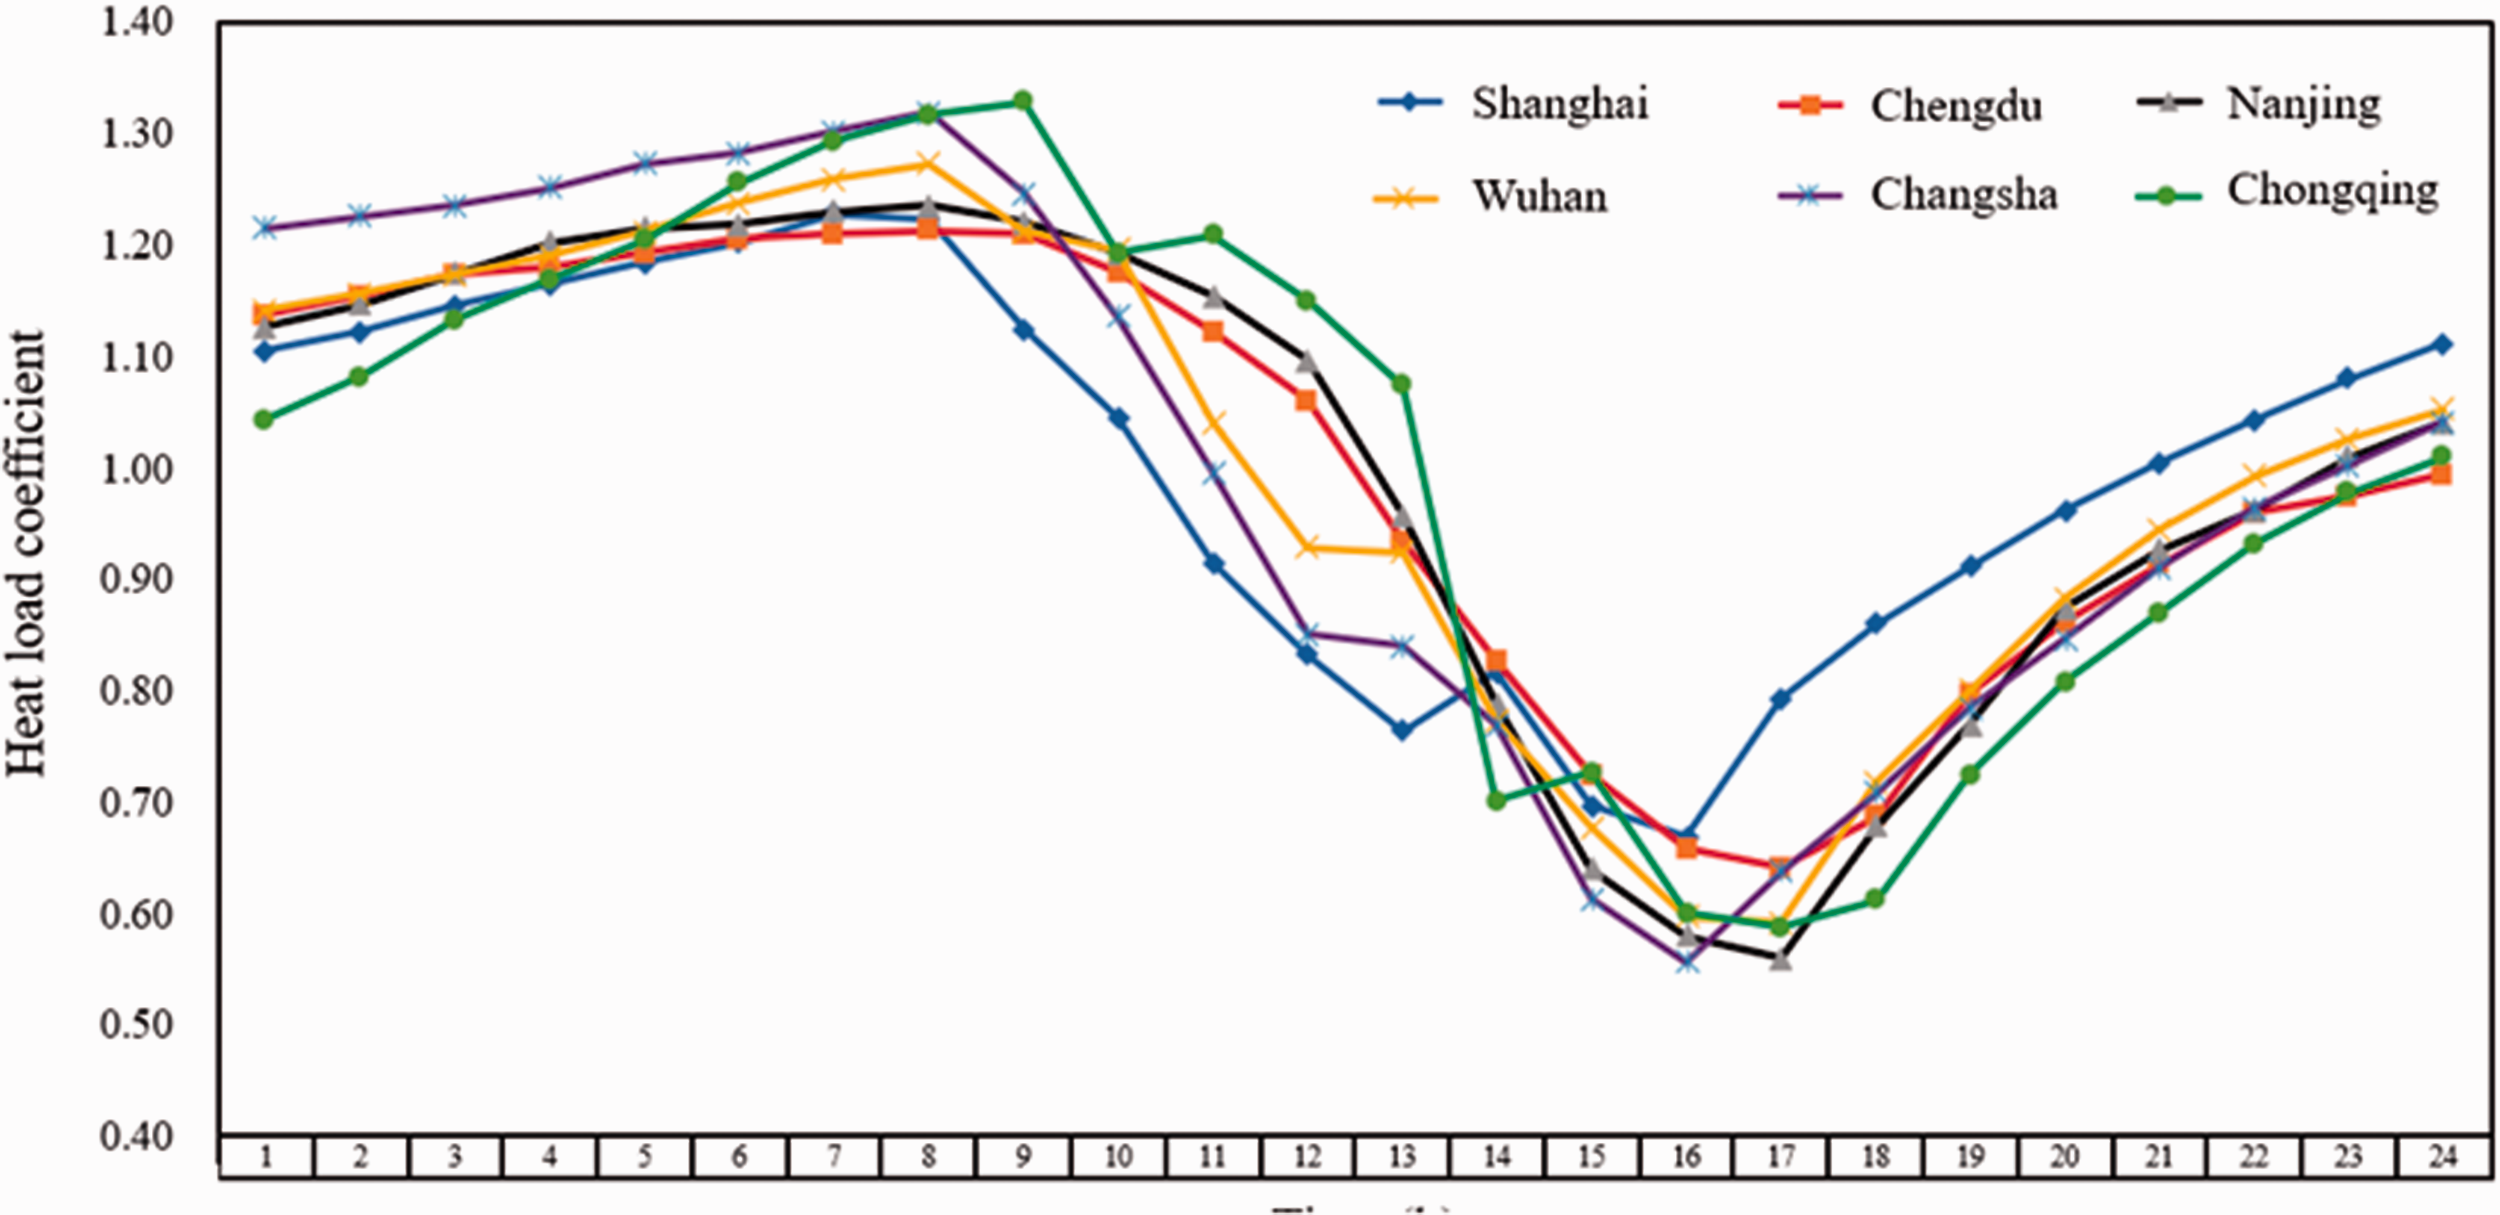
Hourly heat load additional coefficient of the HSACS with continuous heating on a typical day in HSCWZ.
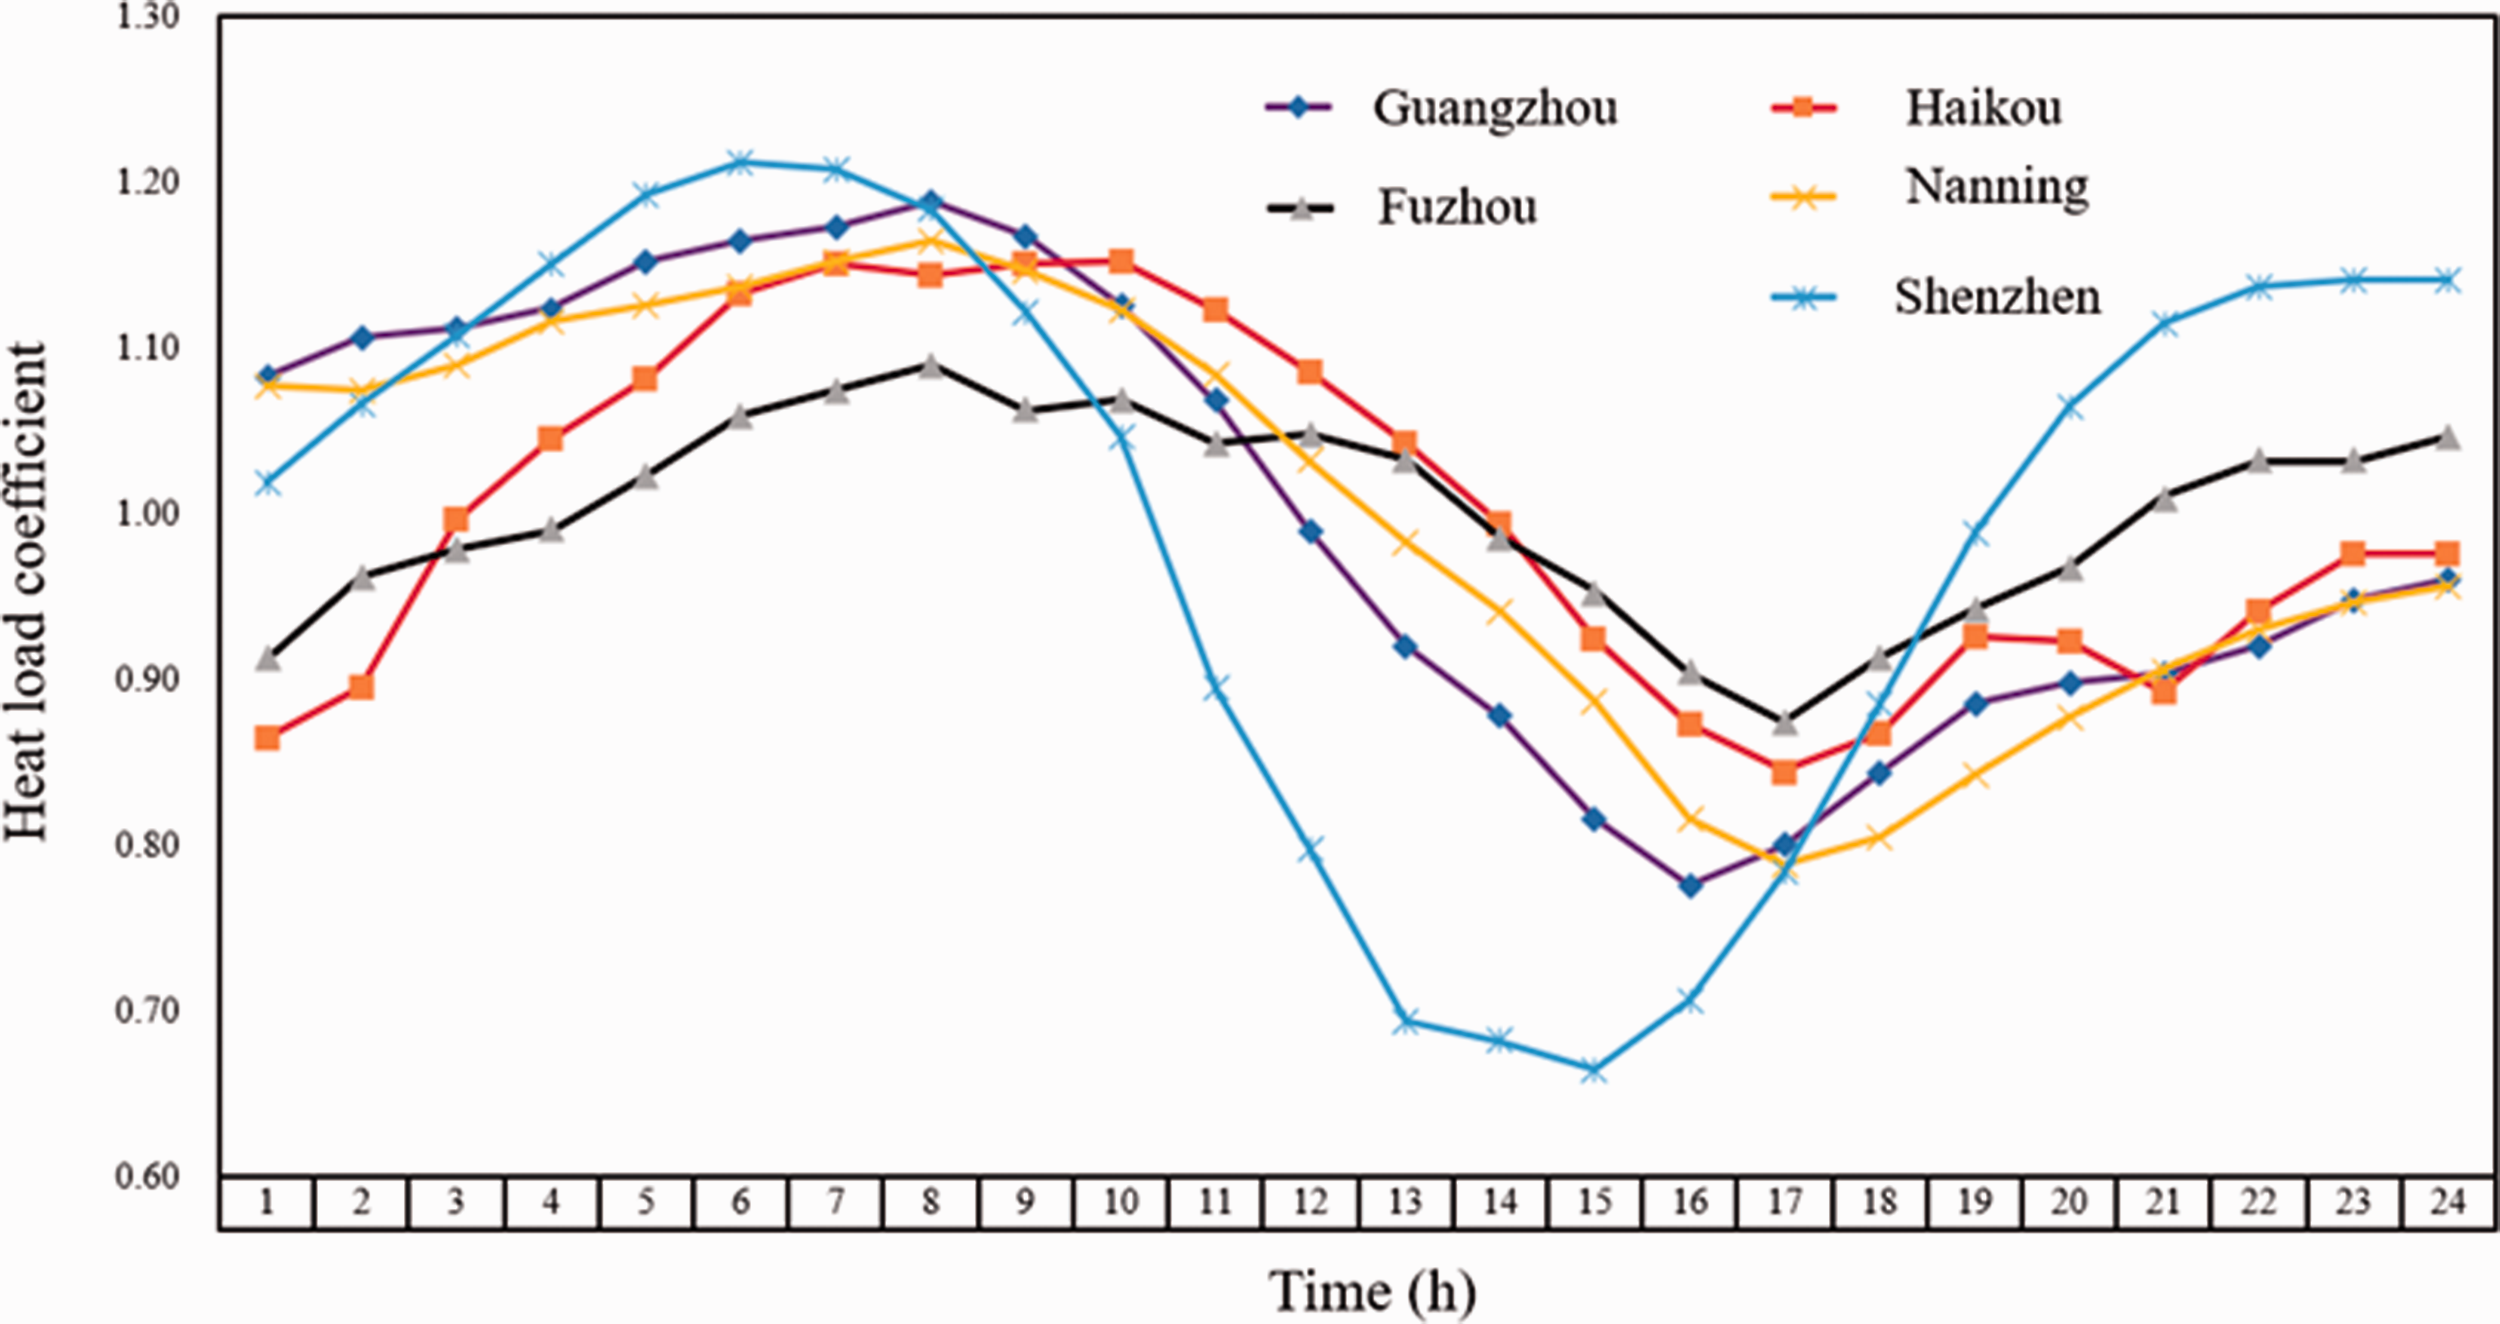
Hourly heat load additional coefficient of the HSACS with continuous heating on a typical day in HSWWZ.
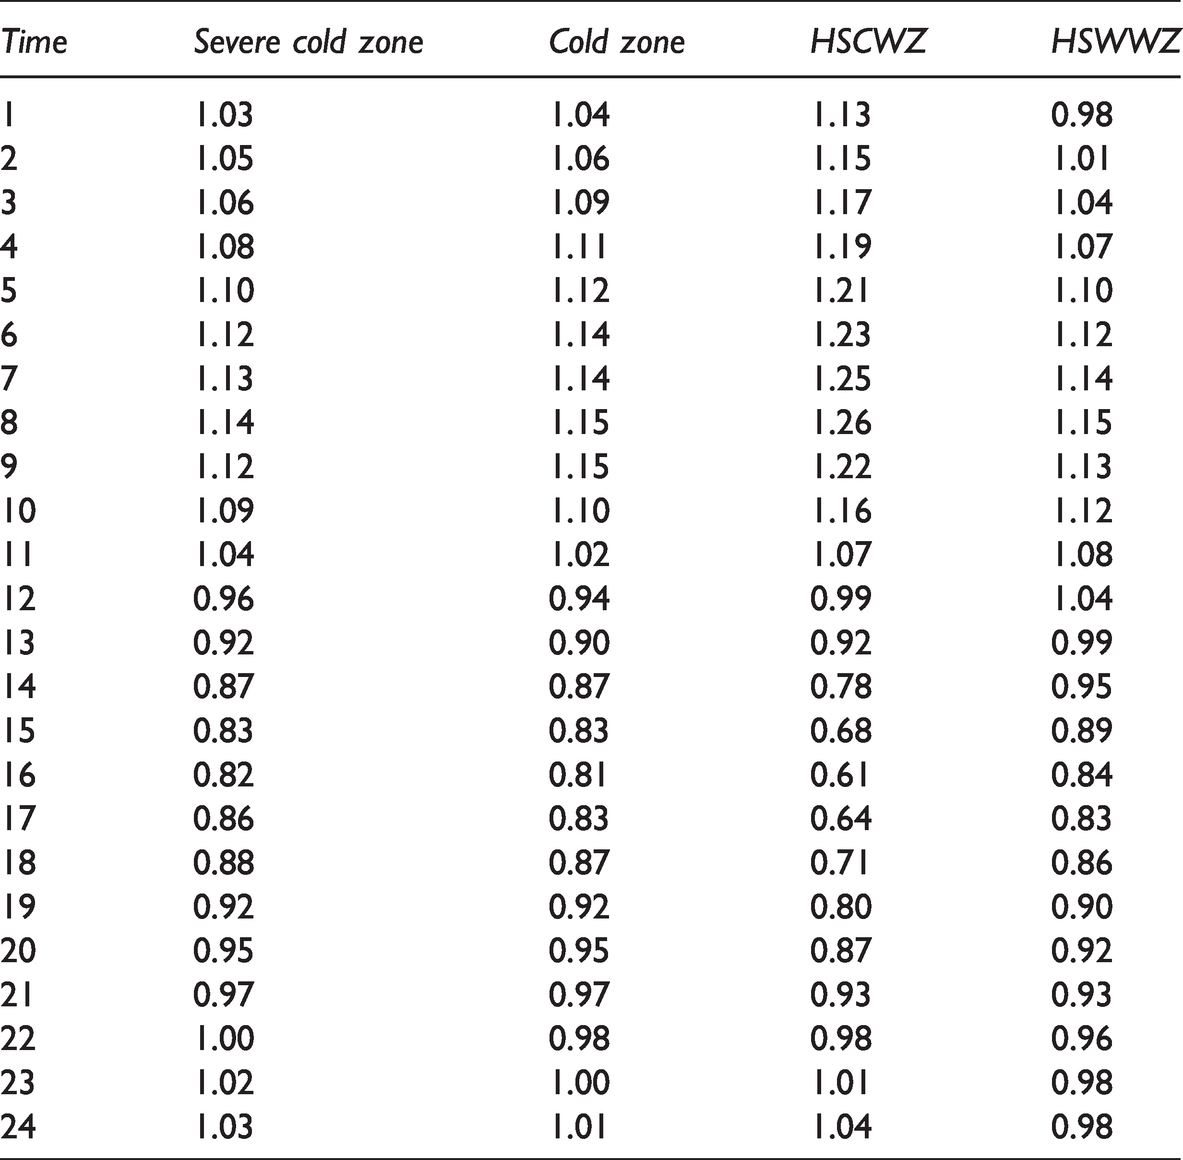
For ease of use, the hourly heat load additional coefficient of a HSACS with continuous heating was averaged. However, the hourly heat load additional coefficient of the HSACS with continuous heating of Yinchuan and Shenzhen had been eliminated due to their large fluctuations, as shown in Table 4. It can be found that hourly heat load additional coefficient of the HSACS with continuous heating in severe cold zones had the same trend, hourly heat load additional coefficient of the HSACS with continuous heating in HSCWZ fluctuated slightly, and hourly heat load additional coefficient of the HSACS with continuous heating in cold zones and HSWWZ fluctuated greatly.
Hourly heat load additional coefficient of the HSACS with continuous heating.
Hourly heat load additional coefficient of the HSACS with intermittent heating on a typical day
Based on the calculation model of the HSACS with continuous heating, indoor temperature, and fresh air operating conditions of the HSACS with intermittent heating on a typical day were set. Hourly heat load additional coefficient of the HSACS with intermittent heating on a typical day in typical cities were calculated by equation (2). The detailed results were revealed in Figures 14 to 17.
Hourly heat load additional coefficient of the HSACS with intermittent heating on a typical day in severe cold zones.
Hourly heat load additional coefficient of the HSACS with intermittent heating on a typical day in cold zones.
Hourly heat load additional coefficient of the HSACS with intermittent heating on a typical day in HSCWZ.
Hourly heat load additional coefficient of the HSACS with intermittent heating on a typical day in HSWWZ.
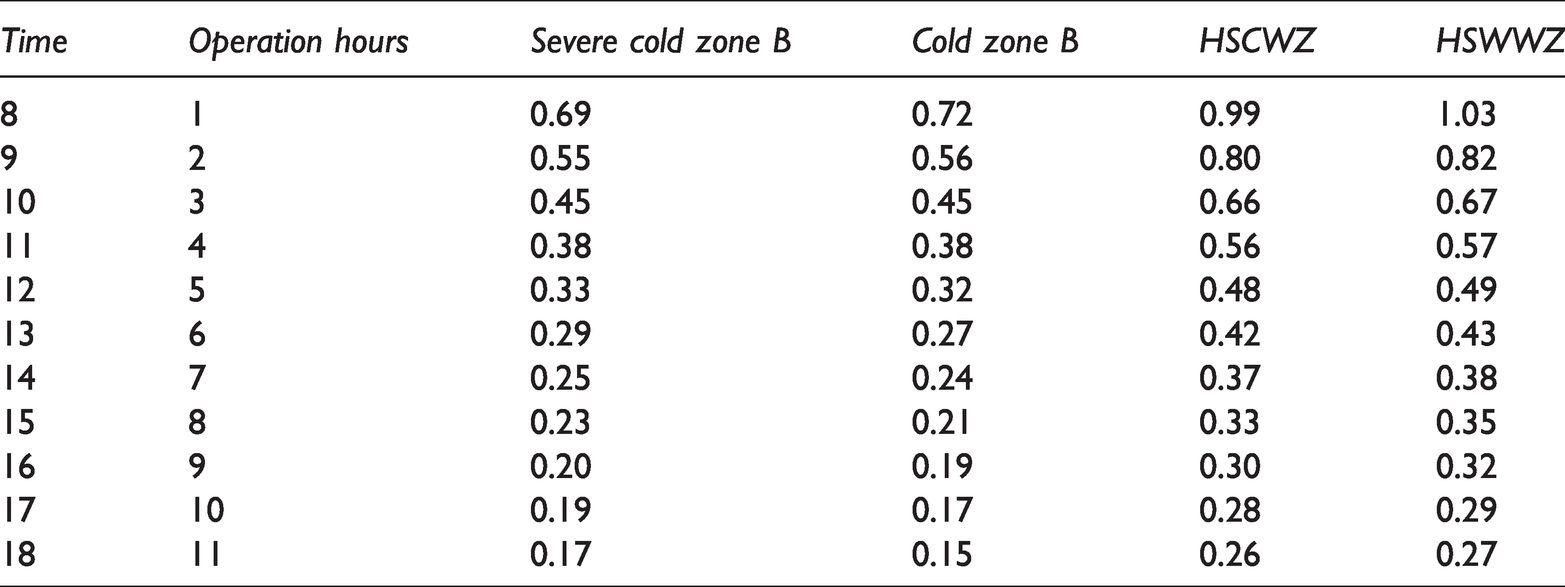
It can be found that the distribution of hourly heat load additional coefficient in each climate zone was relatively regular, and the trends were relatively similar, which can be fitted to different exponential functions. In order to give a simplified algorithm that was easier to use, the calculation results of different climate zones were averaged. Therefore, the hourly heat load additional coefficient of the HSACS with intermittent heating on a typical day in different climate zones can be summarized, as shown in Table 5.
The hourly heat load additional coefficient of the HSACS with intermittent heating.
However, for the hourly heat load additional coefficient of the HSACS with intermittent heating, an extra load would be formed within a few hours of opening the system, because of the building envelope and indoor floor slabs, partition walls, furniture, and other heat storage bodies (Fang and Liu, 2010). When the heat storage capacity of building components or the material of building components was changed, the hourly heat load additional coefficient of the HSACS with intermittent heating is different. Therefore, take Beijing and Harbin as examples, the relationship between the heat storage capacity and the hourly heat load additional coefficient of the HSACS with intermittent heating was analyzed based on the hourly heat load of HSACS with intermittent heating on typical day. The detailed design conditions were as follows:
The area ratio of the inner wall to the floor slab (FS) was changed to 0.50, 0.70, and 0.90, respectively; The area ratio of furniture to the floor (F) was changed to 0.30, 0.50, and 0.70, respectively; Good structure and large heat capacity: the thickness of the reinforced concrete floor was 200 mm; the thickness of the aerated concrete inner wall was 150 mm, FS was 0.90; the thickness of the wooden furniture was 40 mm, F was 0.70; Poor structure and small heat capacity: the thickness of the reinforced concrete floor was 100 mm; the thickness of the cement board inner wall was 50 mm, FS was 0.50; the thickness of the wooden furniture was 30 mm, F was 0.30.
The hourly heat load additional coefficient of the HSACS with intermittent heating was calculated by equation (3), as shown in Tables 6 and 7. It can be seen from Table 6 that when FS was changed to 0.50, 0.70, and 0.90, respectively, compared with the thermal load coefficient of the benchmark component, the maximum increase of the hourly heat load additional coefficient of the HSACS with intermittent heating was 3%, 2%, and 5%. When F was changed to 0.30, 0.50, and 0.70, respectively, the maximum increase of the hourly heat load additional coefficient of the HSACS with intermittent heating was 2%, 4%, and 5%. When the building component was changed to good structure and large heat capacity, the maximum increase of the hourly heat load additional coefficient of the HSACS with intermittent heating was5%. When the building component was changed to poor structure and small heat capacity, the maximum increase of the hourly heat load additional coefficient of the HSACS with intermittent heating was 5%.
The hourly heat load additional coefficient of the HSACS with intermittent heating under different internal heat capacity in Harbin.
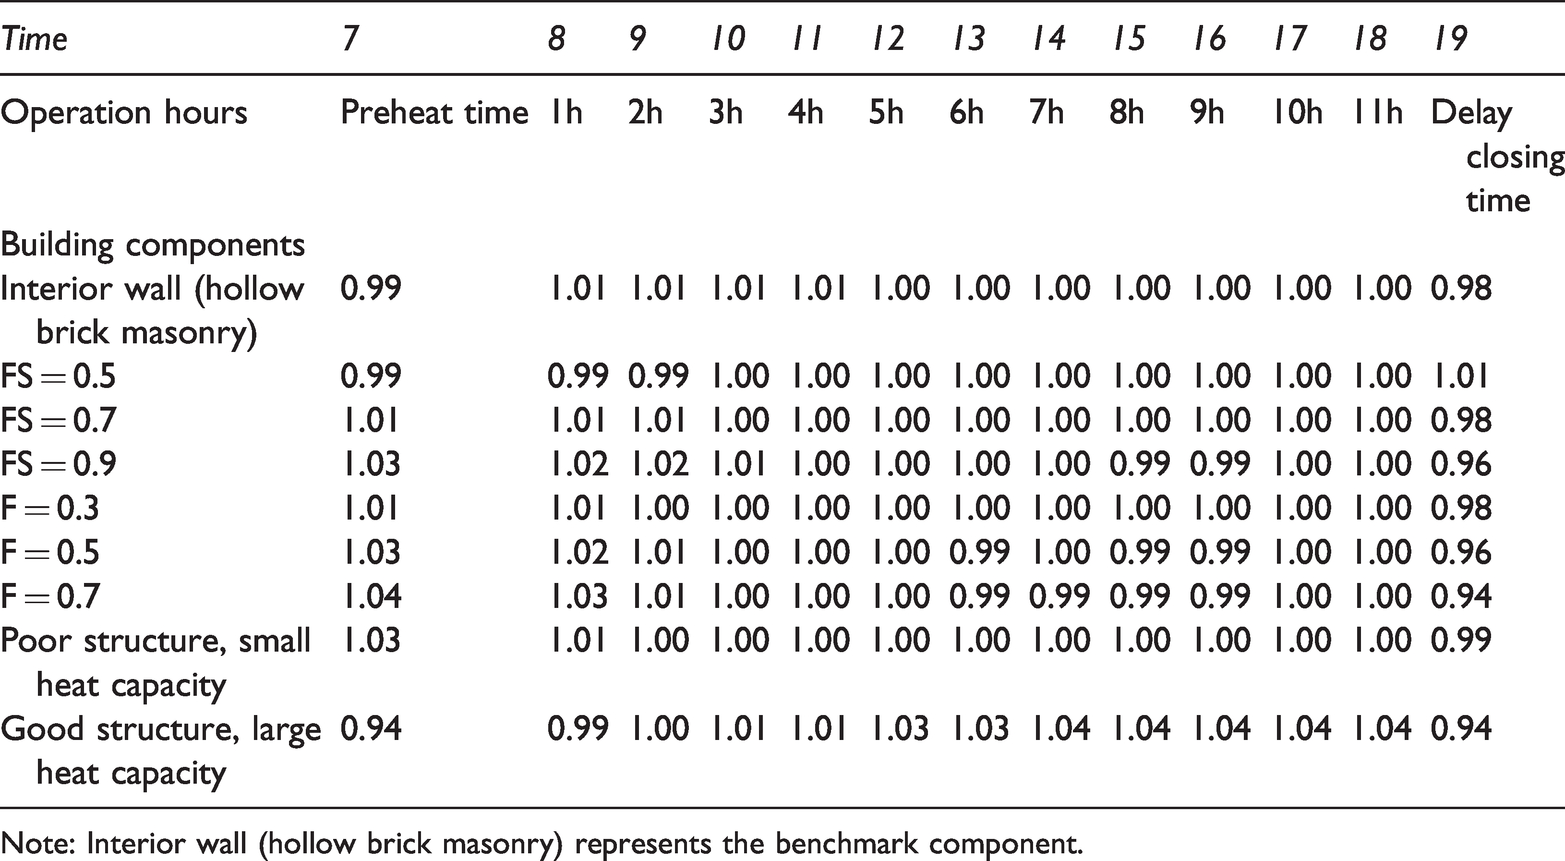
Note: Interior wall (hollow brick masonry) represents the benchmark component.
The hourly heat load additional coefficient of HSACS with intermittent heating under different internal heat capacity in Beijing.
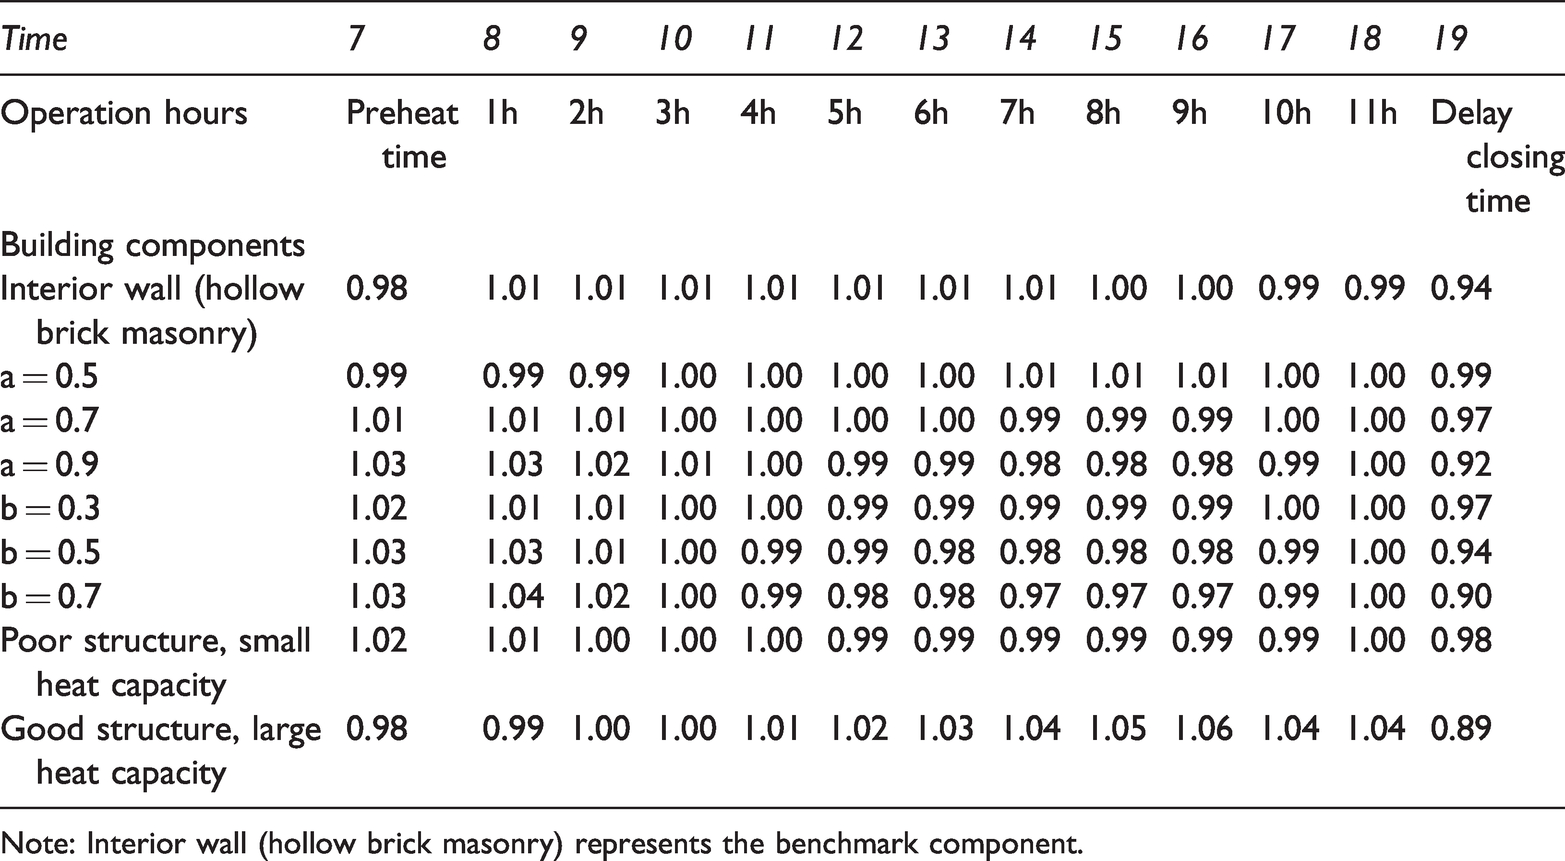
Note: Interior wall (hollow brick masonry) represents the benchmark component.
It can be seen from Table 7 that when FS was changed to 0.50, 0.70, and 0.90, respectively, compared with the thermal load coefficient of the benchmark component, the maximum increase of the hourly heat load additional coefficient of the HSACS with intermittent heating was 5%, 3%, and 5%. When F was changed to 0.30, 0.50, and 0.70, respectively, the maximum increase of the hourly heat load additional coefficient of the HSACS with intermittent heating was 4%, 5%, and 5%. When the building component was changed to poor structure and small heat capacity, the maximum increase of the hourly heat load additional coefficient of the HSACS with intermittent heating was 3%. When the building component was changed to good structure and large heat capacity, the maximum increase of the hourly heat load additional coefficient of the HSACS with intermittent heating was5%. Therefore, when the heat storage capacity of building components or the material of building components was changed, compared with the thermal load coefficient of the benchmark component, the maximum increase of the hourly heat load additional coefficient of the HSACS with intermittent heating was 5%.
Conclusions
OPTIMAL DESIGN OF HOURLY HEAT LOAD CALCULATION METHOD FOR HSACS IN DIFFERENT CLIMATE ZONES CAN BE STUDIED, AND DRAW THE FOLLOWING CONCLUSIONS:
THERE WAS THE SAME TREND IN THE HOURLY HEAT LOAD ADDITIONAL COEFFICIENT OF THE HSACS WITH CONTINUOUS HEATING IN SEVERE COLD ZONES. THE HOURLY HEAT LOAD ADDITIONAL COEFFICIENT OF THE HSACS WITH CONTINUOUS HEATING FLUCTUATED SLIGHTLY IN HSCWZ. HOWEVER, THE HOURLY HEAT LOAD ADDITIONAL COEFFICIENT OF THE HSACS WITH CONTINUOUS HEATING FLUCTUATED GREATLY IN COLD ZONES AND HSWWZ. THERE WAS A REGULAR DISTRIBUTION OF HOURLY HEAT LOAD ADDITIONAL COEFFICIENT IN EACH CLIMATIC ZONE, WHICH CAN BE FITTED TO DIFFERENT EXPONENTIAL FUNCTIONS. WHEN THE HEAT STORAGE CAPACITY OF BUILDING COMPONENTS OR THE MATERIAL OF BUILDING COMPONENTS WAS CHANGED, COMPARED WITH THE THERMAL LOAD COEFFICIENT OF THE BENCHMARK COMPONENT, THE MAXIMUM INCREASE OF THE HOURLY HEAT LOAD ADDITIONAL COEFFICIENT OF THE HSACS WITH INTERMITTENT HEATING WAS 5%.
Footnotes
Declaration of conflicting interests
The author(s) declared no potential conflicts of interest with respect to the research, authorship, and/or publication of this article.
Funding
The author(s) received no financial support for the research, authorship, and/or publication of this article.