
Abstract
Previous studies on Chepaizi Uplift mainly focused on its reservoirs, and the potential source rocks natively occurred was ignored. During the exploration process, dark mudstones and tuffaceous mudstones were found in the Carboniferous interval. These possible source rocks have caused great concern about whether they have hydrocarbon generation potential and can contribute to the reservoirs of the Chepaizi Uplift. In this paper, the potential source rocks are not only evaluated by the organic richness, type, maturity, and depositional environment, but also divided into different kinetics groups. The Carboniferous mudstones dominated by Type III kerogen were evolved into the stage of mature. Biomarkers indicate that the source rocks were deposited in a marine environment under weakly reducing conditions and received mixed aquatic and terrigenous organic matter, with the latter being predominant. The effective source rocks are characterized by the total organic carbon values >0.5 wt.% and the buried depth >1500 m. The tuffaceous mudstone shows a greater potential for its lower active energy and longer hydrocarbon generation time. Considering the hydrocarbon generation potential, base limits of the total organic carbon and positive correlation of oil–source rock together, the native Carboniferous mudstones and tuffaceous mudstones might contribute to the Chepaizi Uplift reservoirs of the northwestern region of the Junggar Basin, especially the deeper effective source rocks should be paid enough attention to.
Keywords
Introduction
The Chepaizi Uplift is located in the western margin of the petroliferous Junggar Basin, covering an area of approximately 10,500 km2. After decades of exploration and development, the northwestern Junggar Basin has become an important petroleum production base in northwestern (NW) China (Lei et al., 2005; Zhang et al., 2012). Exploration in the Chepaizi Uplift began in the 1950s. Since 2005, light oil has been found in the Lower Neogene Shawan Formation (N1s) in wells P2, P206, P8, and so on. Otherwise, commercial oil has been obtained in the Carboniferous interval in 2011 in the eastern Chepaizi Uplift (Li et al., 2011; Wang et al., 2014). Remarkable exploration results have been achieved in the Chepaizi Uplift for its good structural conditions, abundant oil sources, and favorable oil and gas accumulation conditions (Song et al., 2007).
Numerous investigations involving tectonic evolution and oil reservoir characteristics have been made in the Chepaizi Uplift (He et al., 2005; Meng et al., 2016; Shen et al., 2010; Xu et al., 2018). In addition, many geochemical studies have been carried out on the source rocks in the Junggar Basin (Chen et al., 2016; Ding et al., 1994; Long et al., 2013). The Chepaizi Uplift rose continuously and structurally kept its height relative to that of the surrounding areas, which favors oil and gas migration. Meanwhile, more than one oil source kitchen is distributed around the Chepaizi Uplift (the Changji Sag in the southeast, the Mahu Sag in the northeast, and the Sikeshu Sag in the southwest), thus developing many sets of source rocks (the Permian, Jurassic, Cretaceous, and Paleogene source rocks) with different hydrocarbon generation potential. Therefore, the analysis of oil and its source has been a hot issue for a long time (Li et al., 2011; Xiao et al., 2014a; Zhang et al., 2007). In addition, it is generally accepted that the mudstones in the Permian interval in the neighboring Changji Sag and the mudstones in the Jurassic interval in the Sikeshu Sag were the main source contributors for the petroleum that was found in the Chepaizi area (Cao et al., 2005; Chang et al., 2018; Yang et al., 2015; Zhang et al., 2013).
During the exploration process, thick dark mudstones and tuffaceous mudstones were found in the Carboniferous interval in wells such as P66 and P67. Widespread concern has arisen with regard to these native potential source rocks. The exploration has proven that the Carboniferous has great potential for oil and gas discovery, and some good Carboniferous source rocks have been found elsewhere in the Junggar Basin (He et al., 2010). However, there are few studies on the Carboniferous mudstones natively developed in the Chepaizi area for their deeper buried and lower total organic carbon (TOC) values. Previous studies have shown the existence of effective source rocks with low abundance of organic matter in deep petroliferous basins, which has also been proved by many exploration examples at home and abroad (George and Ernest, 1989; Hunt, 1967; Pang et al., 2014). Another major reason is the presence of two hydrocarbon-producing sags (Changji Sag and Sikeshu Sag) near the Chepaizi reservoirs. As a result, the local potential source rocks have been ignored for a long time. The problem of whether these mudstones have hydrocarbon generation potential and contribute to reservoirs in or around the Chepaizi area was not clearly understood.
In the paper, the source rocks natively occurred in the Chepaizi Uplift were systemically investigated, including the organic abundance, type, maturity, paleoenvironment, and kinetic characteristics of hydrocarbon generation. The determination of effective source rocks combined with the oil–source correlation, could help to further understand the source contributions for native potential source rocks.
Geological setting
The Chepaizi Uplift is part of the West Rise of the Junggar Basin. It borders the Zhayier Mountain, the Hongche Fault, the Sikeshu Sag in its northwest, east direction, and south direction, respectively. And the Changji Sag, a significant hydrocarbon generating zone, is located in the eastern Chepaizi separated by the Hongche Fault (Figure 1). The Chepaizi Uplift, which experienced a series of tectonic movements, including the Hercynian, Indosinian, Yanshanian, and Himalayan movements, is an inherited large-scale paleohigh (Xiao et al., 2014b).
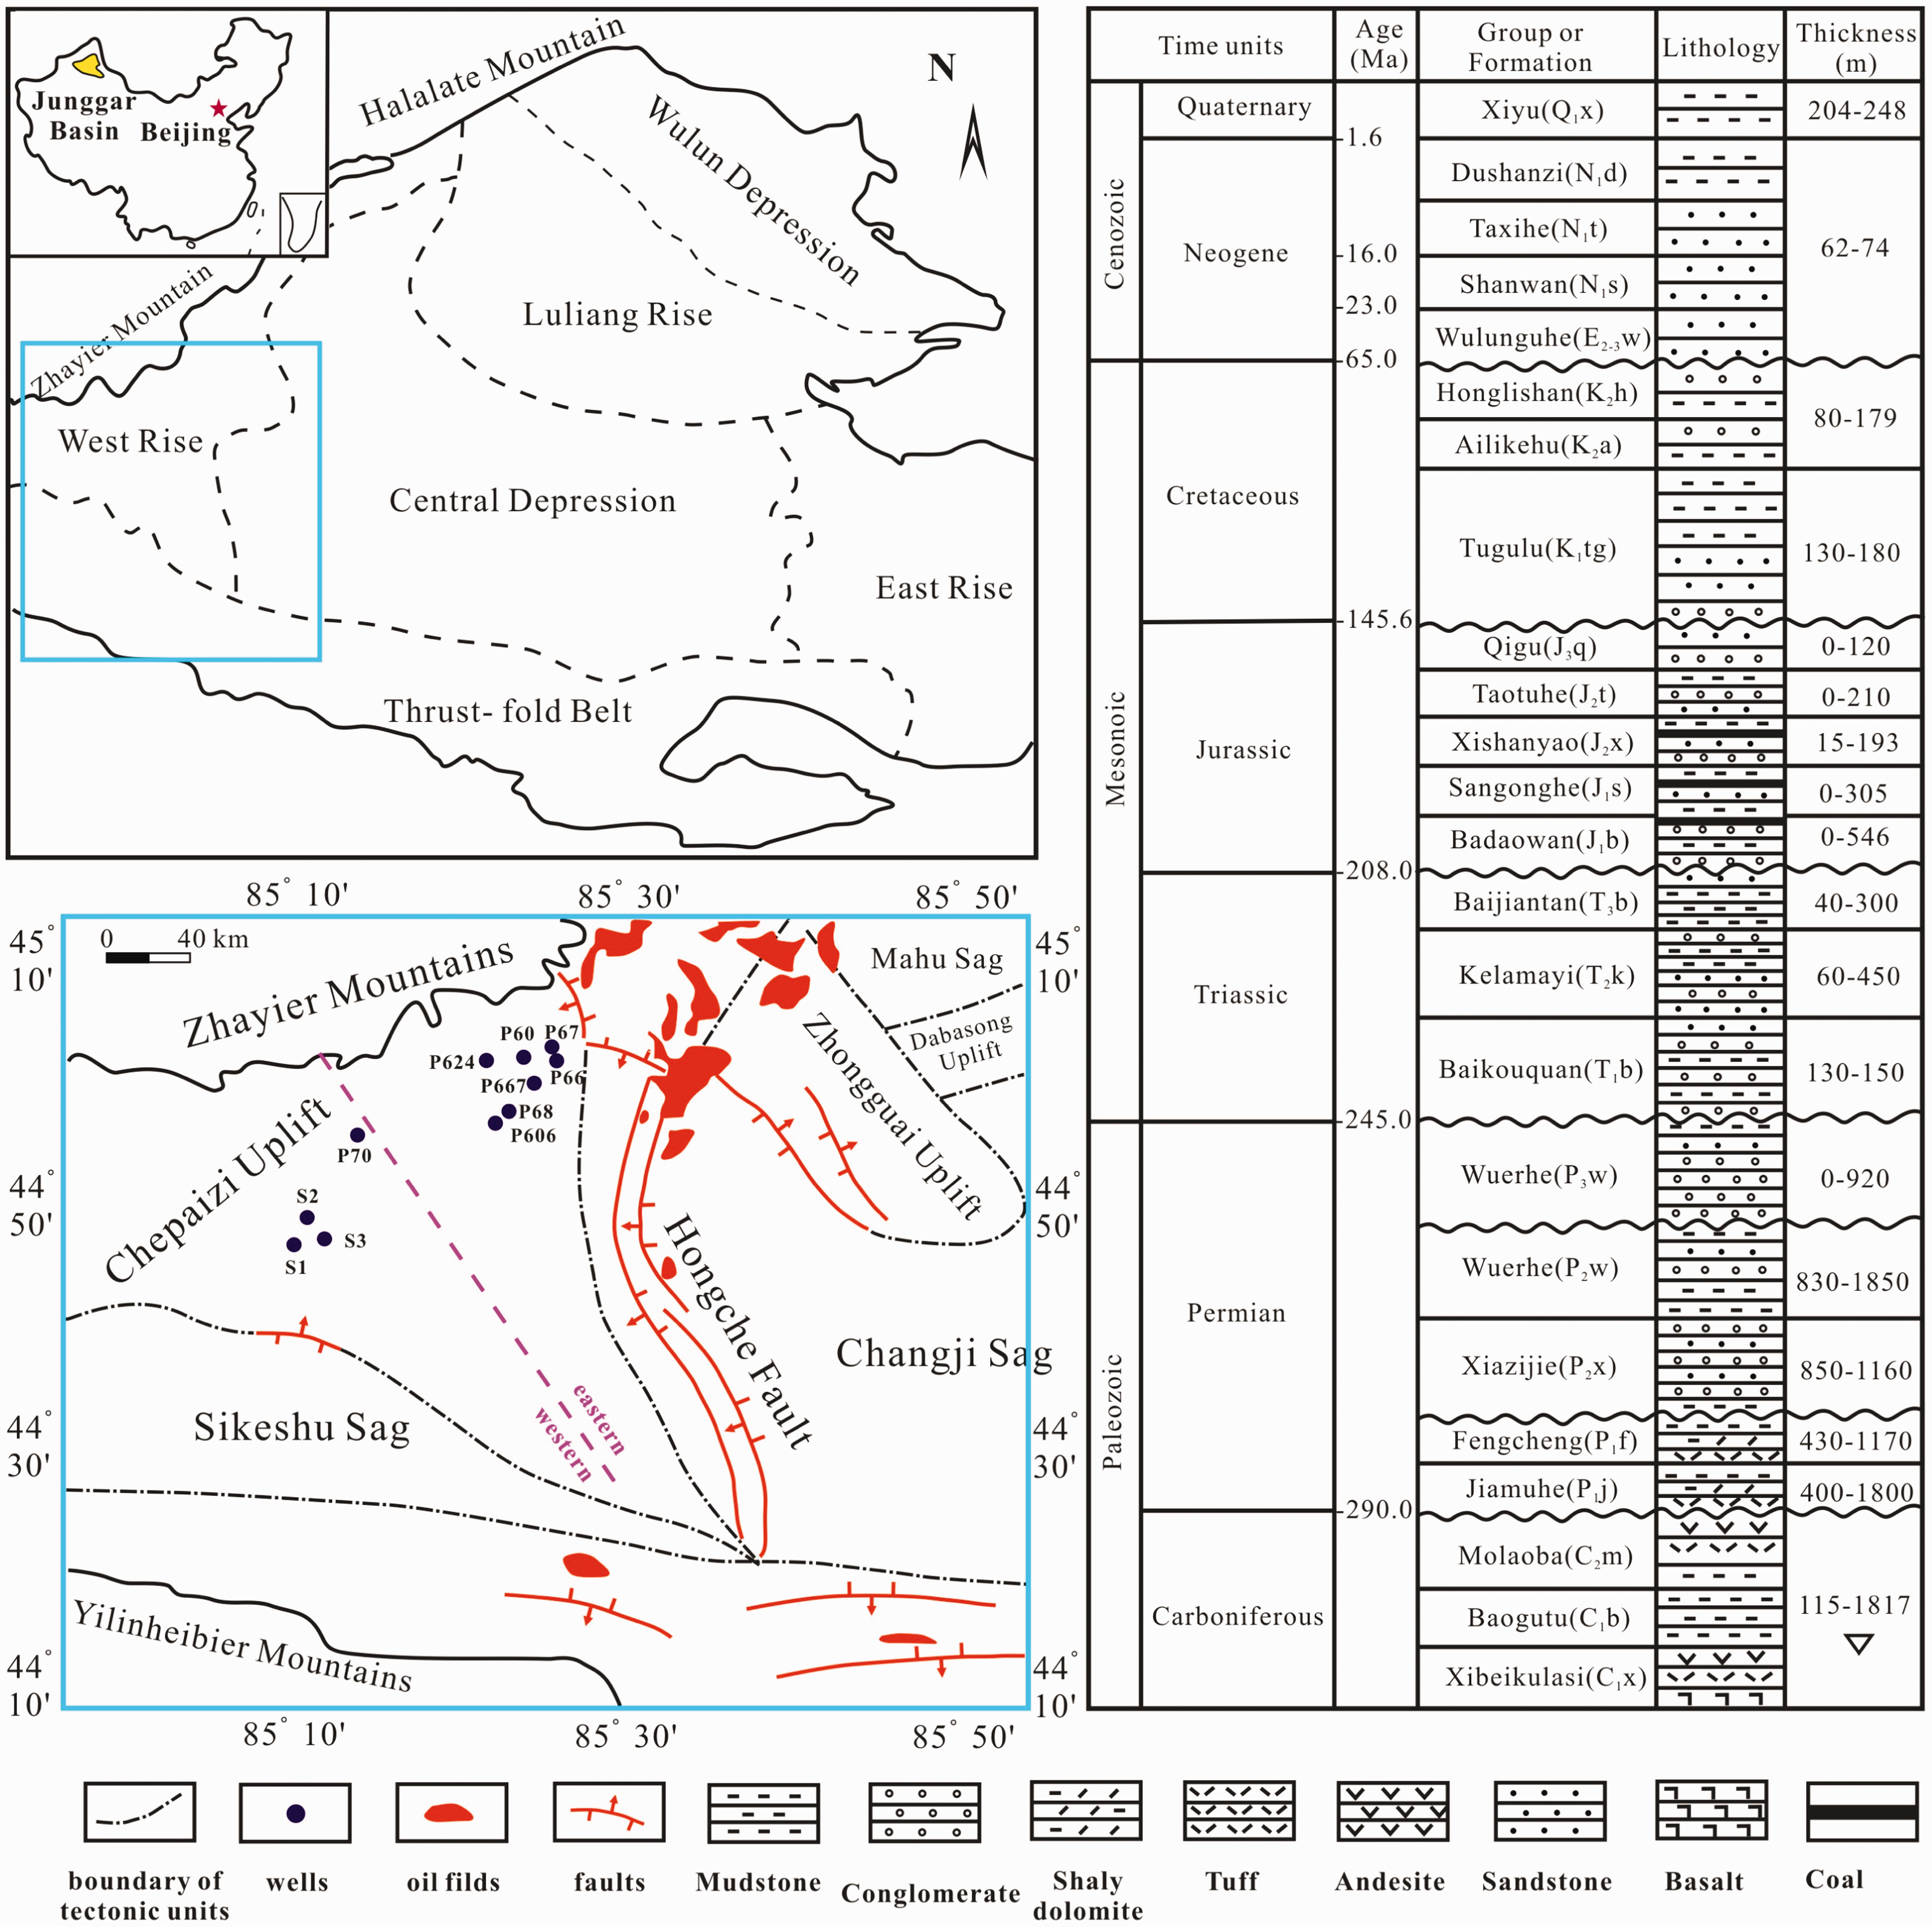
Simplified map showing locations of the samples investigated and nearby discovered oilfields.
From the late Carboniferous epoch to the present, the Chepaizi area has experienced three major periods of tectonic evolution: the late Carboniferous to Jurassic with a strong uplift stage, the Cretaceous to Paleogene with a slow settling phase, the Neogene to Quaternary with rapid subsidence, and today with a wide flat slope (Cai et al., 2019; Hu et al., 2016; Xu et al., 2019). For stratigraphy (Figure 2), the basement consists of Carboniferous volcanic rocks with a buried depth of 150–2300 m. Lacking of the Permian, Triassic, and Jurassic deposits is common in the Chepaizi area. Only a few small fault zones in the study area have relatively thin Triassic and Jurassic sediments (He et al., 2008; Lei et al., 2005). And the Cretaceous, Paleogene, Neogene, and Quaternary strata cover Carboniferous volcanics directly. All the strata are relatively thin and become thinner toward the northwest.
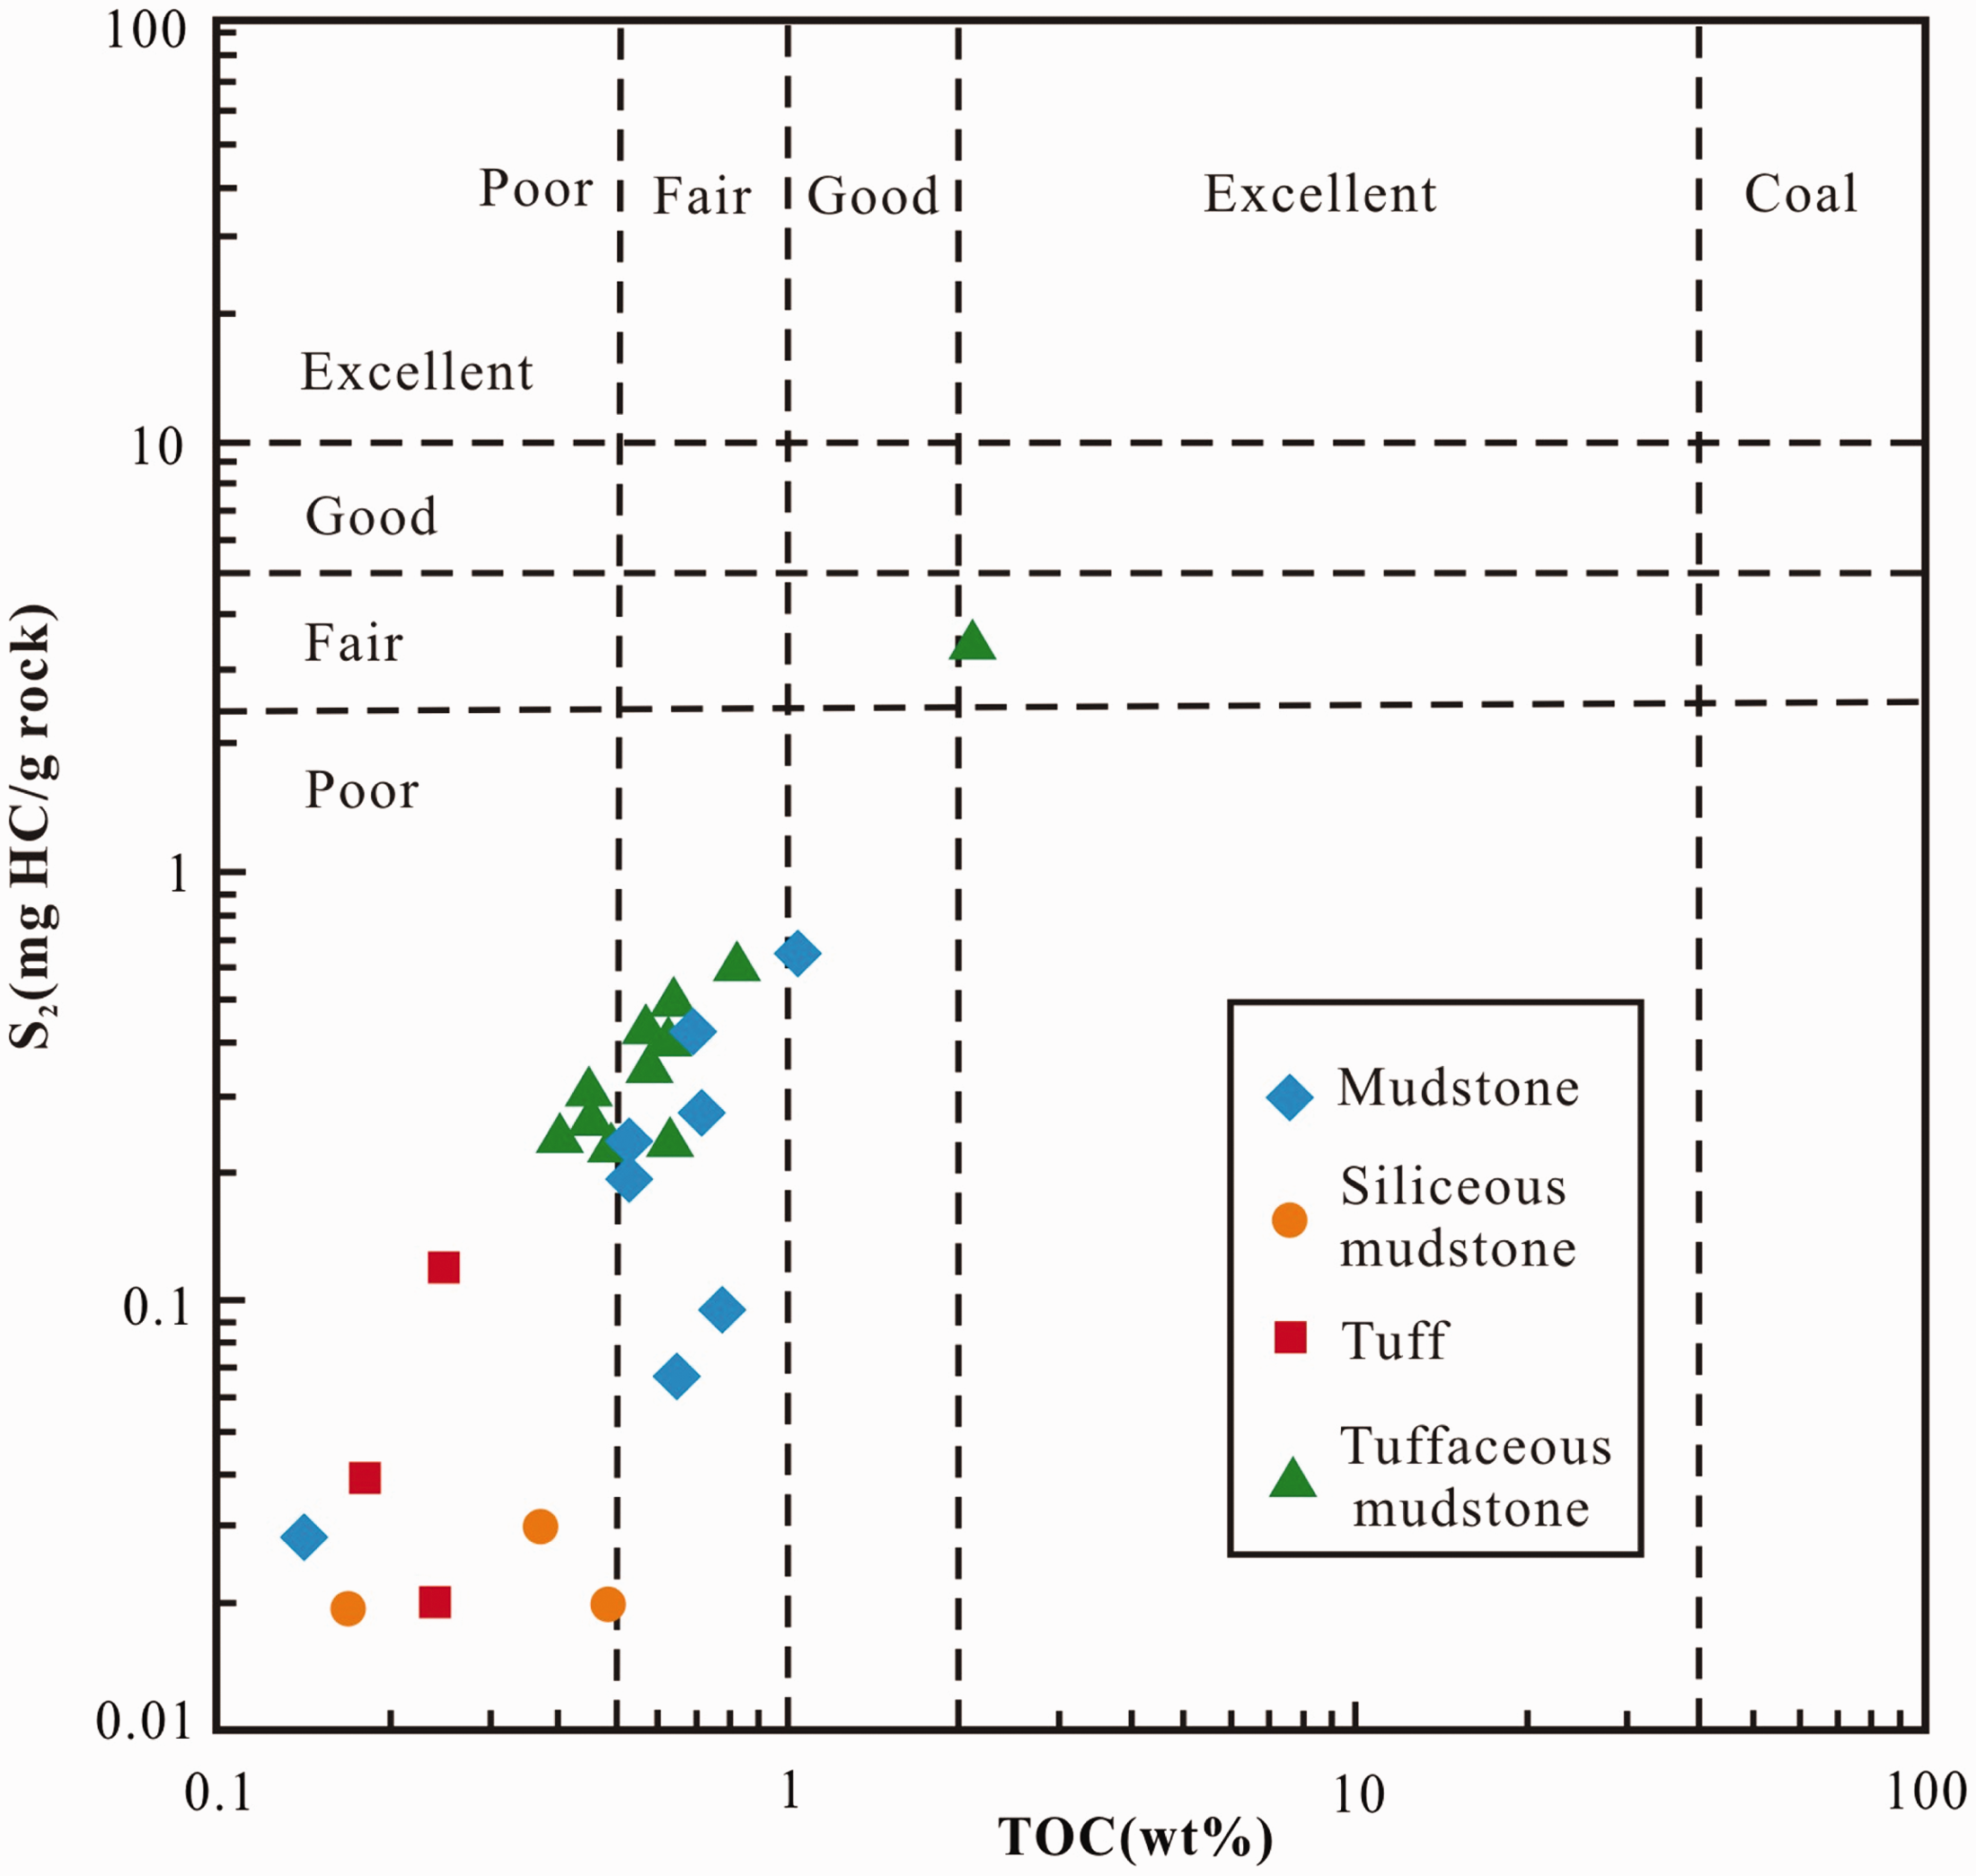
Plot of S2 versus TOC showing the hydrocarbon potential and source rock efficiency for samples in the Chepaizi Uplift, northwestern Junggar Basin.
The native Carboniferous source rocks that have recently been found were mainly located in coastal shallow marine deposits. The early Carboniferous developed semi-deep marine facies in the western Junggar Basin (Wang et al., 2013), and it is speculated that source rock with good hydrocarbon generation might be existing in the nearby area (He et al., 2010). The Carboniferous source rocks of the Chepaizi Uplift attracted little attention. More research has focused on the Permian mudstones in the Changji Sag and the Jurassic mudstones in the Sikeshu Sag which were considered as the main contributions to the petroleum around the Chepaizi area. The Permian interval has two sets of source rocks (the Lower Permian Fengcheng Formation (P1f) and the Middle Permian Wuerhe Formation (P2w)), which were both considered to be source rocks with good hydrocarbon generation potential (Shi et al., 2005). The Jurassic interval in the Sikeshu Sag has three sets of source rocks. Among them, the Lower Jurassic Badaowan Formation (J1b) with thick dark mudstone containing carbonaceous mudstone and coal seam was considered to be a main source rock (Long et al., 2013; Tan et al., 2014).
Materials and methods
In this study, 25 rock samples were collected from exploration wells (Figure 1) to investigate the organic richness, type, maturity, and the depositional environment. In addition, 6 and 16 oil samples were respectively selected from the Carboniferous and Neogene reservoirs of the Chepaizi area to correlate source rocks. A series of geochemical analyses were performed, including Rock-Eval pyrolysis, gas chromatography (GC), gas chromatography-mass spectrometry (GC-MS) and stable carbon isotopes.
Rock-Eval pyrolysis
Substantial amount of information obtained from Rock-Eval pyrolysis is essential for a comprehensive understanding of the properties of source rocks (Peters, 1986). The rock pyrolysis experiment was performed on the instrument Rock-Eval-II. First, the temperature was kept at 300°C for 3 min. It was then heated from 300°C to 600°C at a rate of 50°C/min and kept at 600°C for 1 min. Finally, the S3 (CO2) values were carried out in the following 4 min. Throughout the whole process, we could obtain data on the free hydrocarbon (S1), the pyrolysic hydrocarbons (S2), the CO2 (S3) released during pyrolysis in the rocks, and the temperature of maximum pyrolysis yield (Tmax). Then, we can easily get some parameters, including the hydrogen index (HI), oxygen index (OI), production index (PI), and petroleum potential yield (S1 + S2).
GC and GC-MS analysis
To study paleoenvironment of the source rocks, five rock samples were selected for extraction by the Soxhlet technique using dichloromethane/methanol (93:7, v/v). After the asphaltenes were removed from the extracts by n-hexane, the extracts were separated into saturated hydrocarbons, aromatic hydrocarbons, and resin fractions using routine column chromatography (silica gel/alumina = 3:1) by sequential elution with n-hexane, dichloromethane/n-hexane (2:1, v/v), and dichloromethane/methanol (9:1, v/v), respectively. Then, the saturated hydrocarbon fractions were analyzed by using GC and GC-MS. The GC experiments were performed on Agilent 7890A. First, it was carried out for 5 min at an incipient temperature of 100°C. The temperature was then raised to 300°C at a rate of 4°C/min. Finally, keep the temperature for 20 min. There was a constant flow of nitrogen (N2) at 1 mL/min. The GC-MS experiments were performed on Agilent 7890A and Agilent 5975C. First kept the temperature at 50°C for 1 min. Then, the temperature was raised to 310°C at 3°C/min. Keep this temperature for 15 min. Helium gas (He) was used for carrier gas with a constant current of 1 mL/min.
Kinetic analysis
Some samples were performed on the Rock-Eval-II for the hydrocarbon generation kinetic analysis of the selected samples. The constant temperature heating method was adopted, and the initial temperature is 200°C. Then the temperature was raised to 600°C at a rate of 10°C/min, 20°C/min, 30°C/min, 40°C/min, and 50°C/min, respectively. The relationship between the amount of product and the temperature (or the time) was recorded, and then, parameters such as the activation energy, pre-exponential factor, and hydrocarbon generation potential were obtained through standard procedures.
Organic petrology analysis
Six Carboniferous source rock samples were selected for organic petrography analysis in order to obtain maceral composition and vitrinite reflectance (%Ro). The samples were polished and treated using standard rock petrological preparation techniques (Taylor et al., 1998). Then, the test was performed on an OPTON-II microscope under 800× magnification and 18°C.
Carbon isotope composition
The stable carbon isotope of some oil and oil extracts obtained from rock samples was performed on a Finngan MAT-252 with a constant flow of CO2 gas. And the relative Vienna Peedee Belemnite (VPDB) values were obtained by MAT-252 double injection method.
Data analysis method
In addition, statistical method was used to study oil–source rock relationship. Hierarchical cluster analysis (HCA) was performed by using the Statistical Package for the Social Sciences (SPSS version 20.0). First, the parameters were homogenized; then, they were analyzed by the SPSS software based on Euclidean measure interval and Ward’s cluster method (Shi et al., 2019; Xue, 2004).
Results
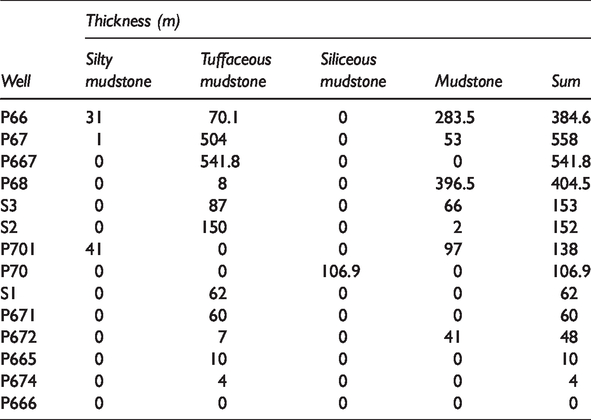
Thickness of the mudstones
We calculated the thickness of potential source rocks in the Chepaizi area. The mudstones with different thickness were found in the Carboniferous interval in all the wells except for well P666. And there were mainly dark mudstones, dark tuffaceous mudstones, gray carbonaceous mudstones, and siliceous mudstones. Most of the mudstones buried more than 1500 m had a thickness of 4–558 m with an average of 187 m (Table 1).
Thickness of the potential source rocks in the Carboniferous formation.
Total organic carbon and rock pyrolysis data
The Carboniferous source rocks in the Chepaizi Uplift have a TOC content of 0.14–2.12 wt.% (mean 0.58 wt.%), a lower HI value of 4.08–159.75 mg HC/g TOC (mean 47.31 mg HC/g TOC) and a Tmax value of 414–530°C (mean 464°C), respectively (Table 2). Among them, the mudstone samples and tuffaceous mudstone samples have higher TOC values of 0.14–1.06 (mean 0.63 wt.%) and 0.40–2.12 (mean 0.71 wt.%), respectively. The siliceous mudstones have lower TOC values that vary from 0.17 to 0.49 wt.% and the tuff samples have the lowest TOC values of 0.18–0.25 wt.%.
Geochemical data from Rock-Eval pyrolysis for the samples in the Chepaizi Uplift.
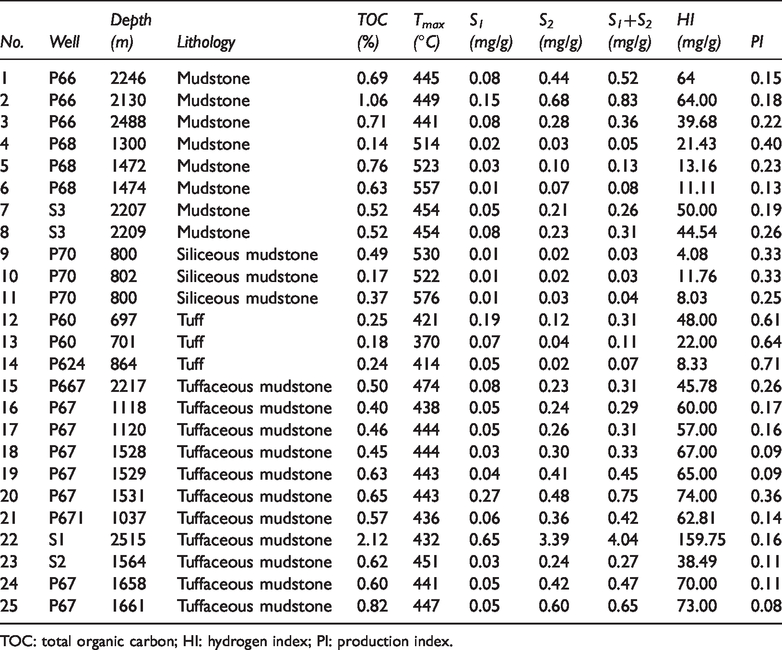
TOC: total organic carbon; HI: hydrogen index; PI: production index.
Molecular biomarker parameters
To investigate the sedimentary environment of the mudstones, we also calculated some parameters, including the high carbon preference index (CPI), the ratio of C19 tricyclic terpanes/C23 tricyclic terpanes (C19TT/C23TT), C24 tetracyclic terpanes/C24 tricyclic terpanes (C24Tet/C24TT), and pristine/phytane (Pr/Ph) etc. At the same time, some parameters of the oils around the Chepaizi were counted to study the oil–source relationship. More detailed results are shown in Tables 3 and 4.
Results from GC and GC-MS for some selected parameters of the Carboniferous source rock samples in the Chepaizi Uplift, northwestern Junggar Basin.
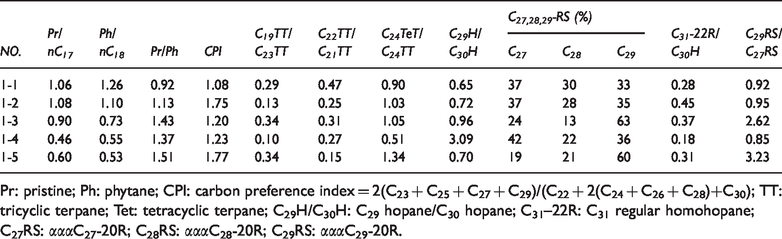
Pr: pristine; Ph: phytane; CPI: carbon preference index = 2(C23 + C25 + C27 + C29)/(C22 + 2(C24 + C26 + C28)+C30); TT: tricyclic terpane; Tet: tetracyclic terpane; C29H/C30H: C29 hopane/C30 hopane; C31–22R: C31 regular homohopane; C27RS: αααC27-20R; C28RS: αααC28-20R; C29RS: αααC29-20R.
Calculation results for some selected biomarkers of source rock samples and oils from the northwestern Junggar Basin for studying the oil–source correlation.
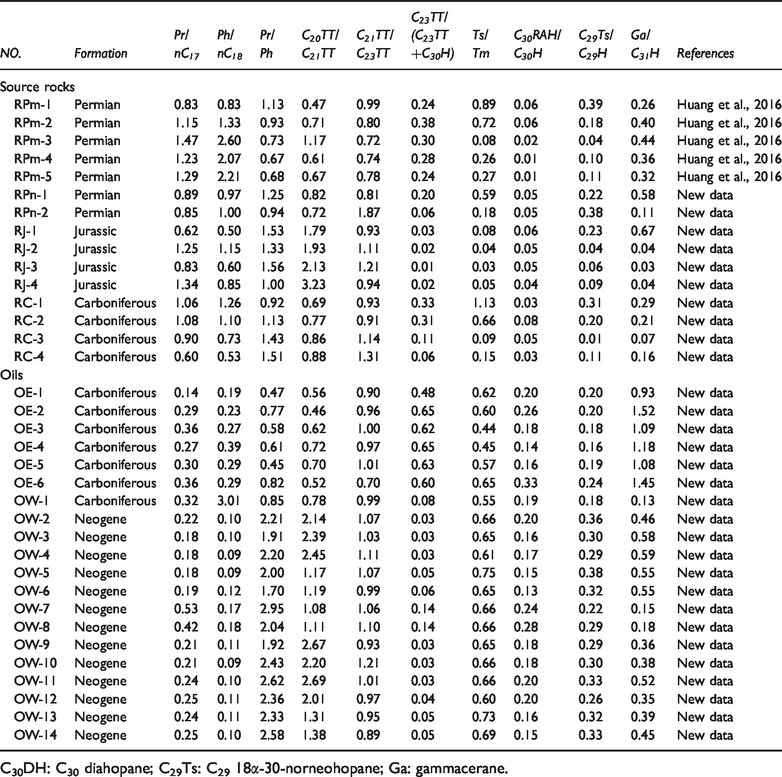
C30DH: C30 diahopane; C29Ts: C29 18α-30-norneohopane; Ga: gammacerane.
Discussion
Evaluation of potential source rocks
Total organic carbon and petroleum potential
The organic richness plays an important role in source rock characterization, which can be evaluated by the TOC and S1 + S2 values (Peters and Cassa, 1994; Tissot and Welte, 1984). The mudstone samples and tuffaceous mudstone samples have fair source rock potential and a small part of them is good. While the tuff and siliceous samples are characterized by poor potential for their lower TOC and S1 + S2 values (Table 3).
The TOC by itself is not necessarily an absolute indicator of controlling the amount of hydrocarbon generation and should be associated with the amount of hydrocarbons produced during pyrolysis (S2) (Dembicki, 2009; Peters, 1986). The TOC values and the S2 content show a good positive correlation (Figure 2), which indicates that the tuff and siliceous samples with relatively low S2 values have poor hydrocarbon generating ability, and the mudstone samples and tuffaceous mudstone samples are located in fair to good zone.
Type of organic matter
It is necessary to know the organic matter type, which is as significant as knowing the petroleum potential, for different types of the organic matter leading to various hydrocarbon generation abilities and properties. It was suggest that HI could be used to identify organic matter types (Ehsan et al., 2016; Peters and Cassa, 1994; Petersen and Nytoft, 2006; Tissot and Welte, 1984). In this study, the source rocks can be considered to be kerogen Type III due to their lower HI values, with a small amount of Type II (Figure 3(a)).
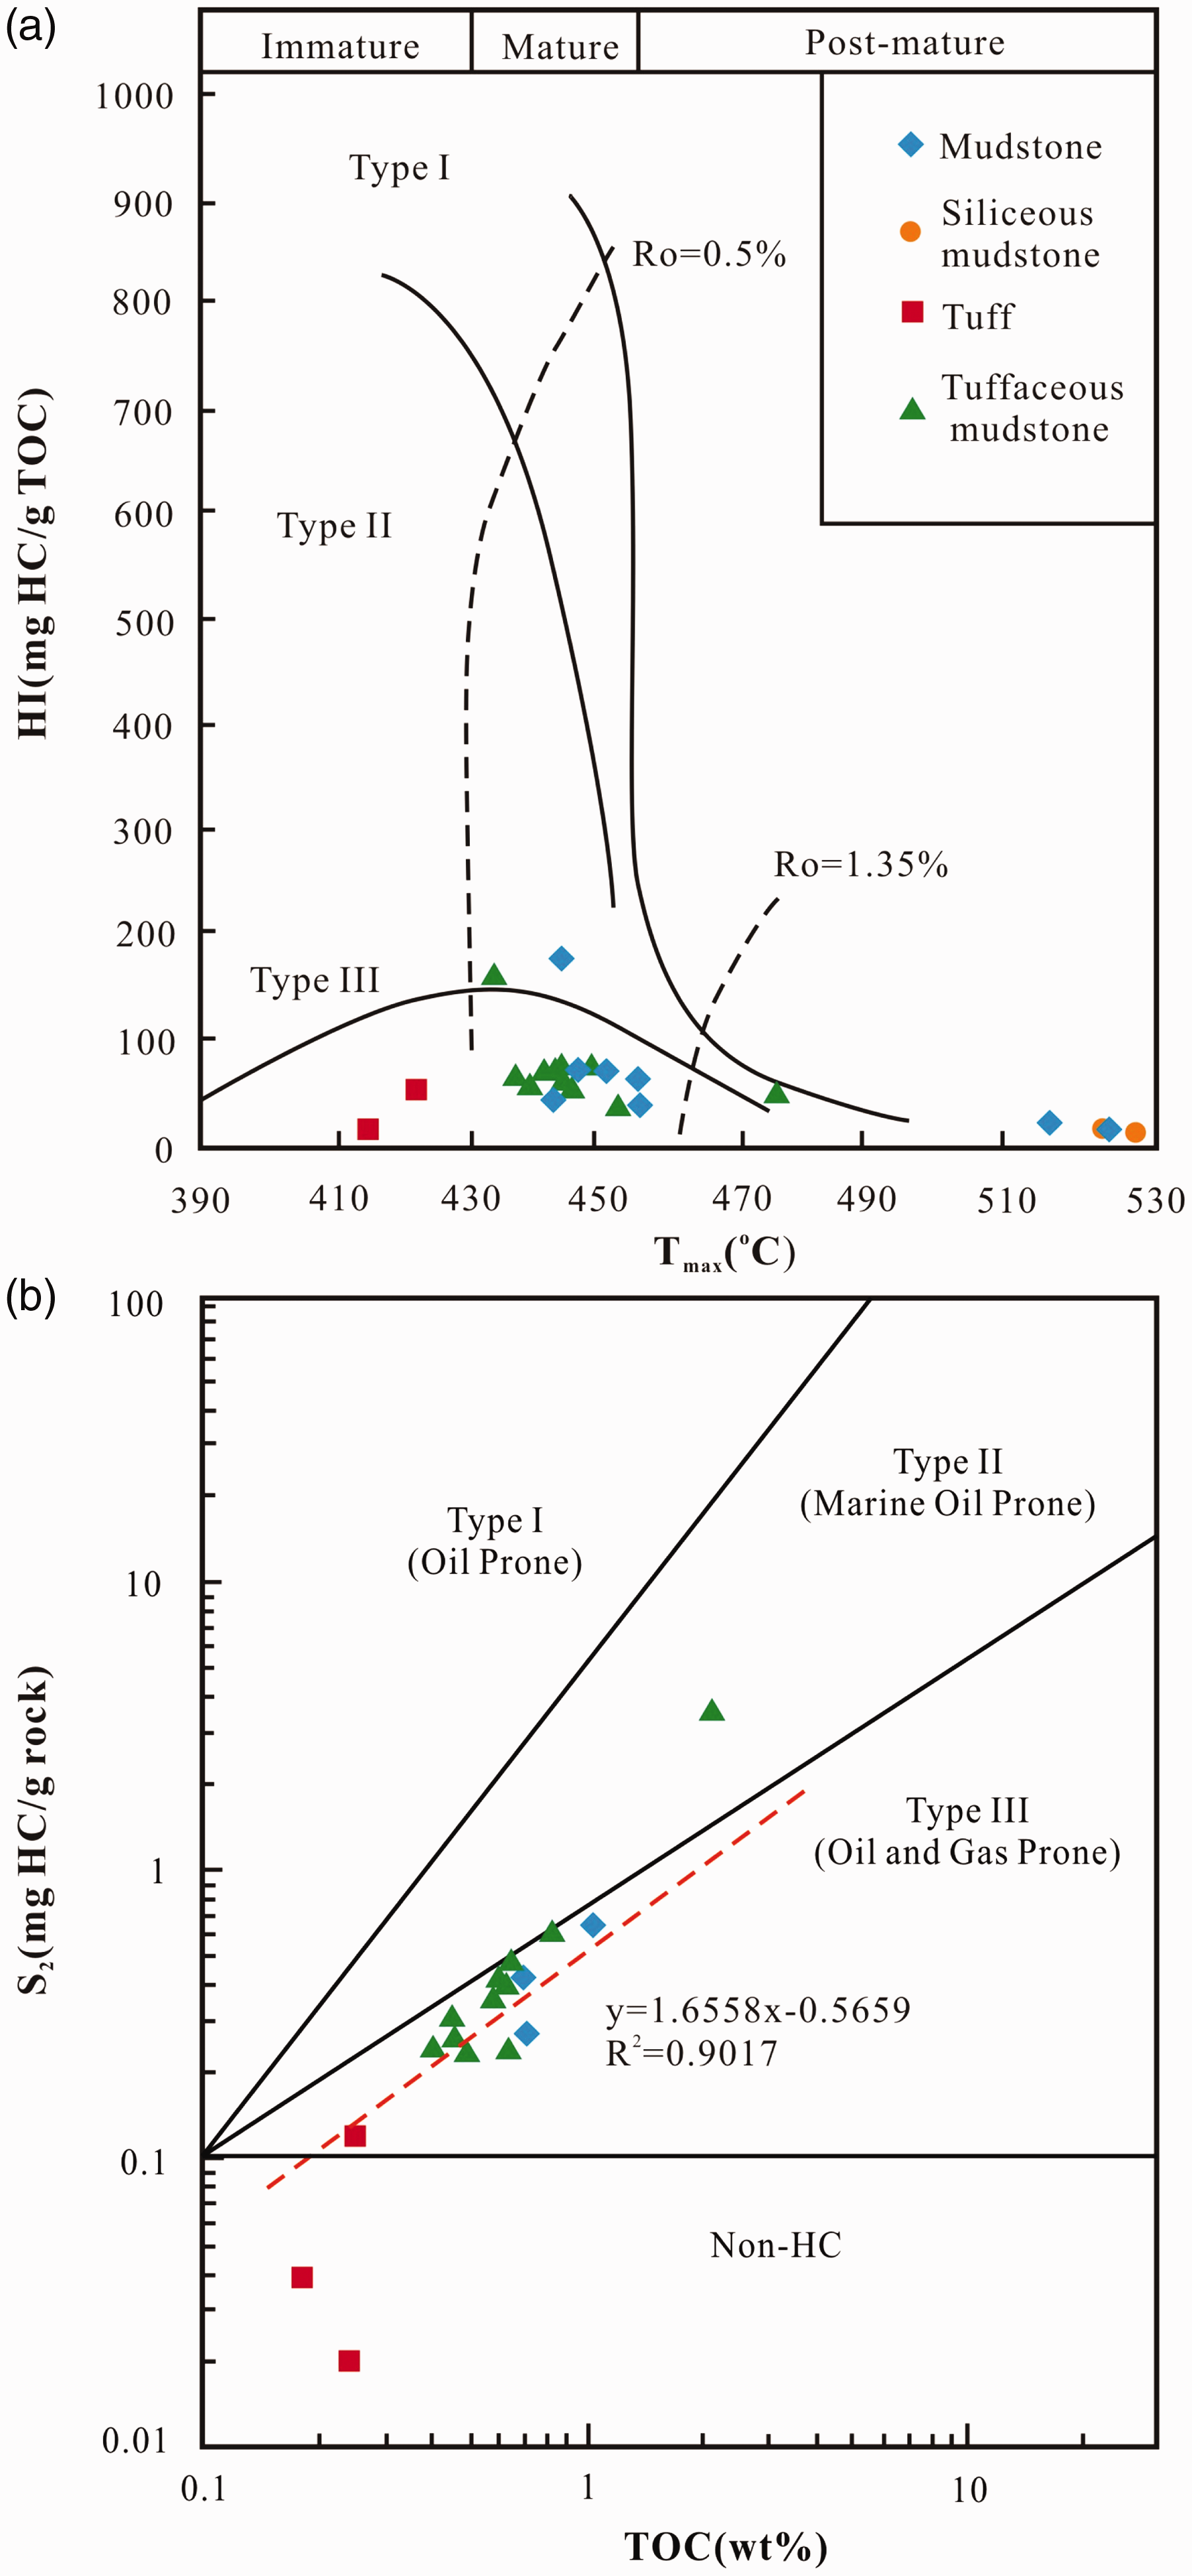
Plot of HI versus Tmax (a) and correlation of S2 against TOC (b) showing the type of organic matter.
Based on the cross table of TOC against S2, the type of organic matter can also be effectively discriminated when the Tmax = 430–435°C, and using the plot can eliminate the adsorption of mineral matrix (Langford and Blanc-Valleron, 1990; Mohammed and Abdulghani, 2016). As Figure 3(b) shows that the slope of samples regression line is close to that of the II–III boundary line. It indicated that the samples may be mixed organic matter with Type II and Type III, with the latter being predominant.
In addition, the maceral composition for the Carboniferous source rocks is studied. According to Figure 4, the same conclusion can be obtained. All the samples are characterized with large amounts of vitrinite and less liptinite and inertinite, indicating Type II–III and Type III organic matter, which can produce oil and gas when they reach maturity (Sun et al., 2010a, 2010b).
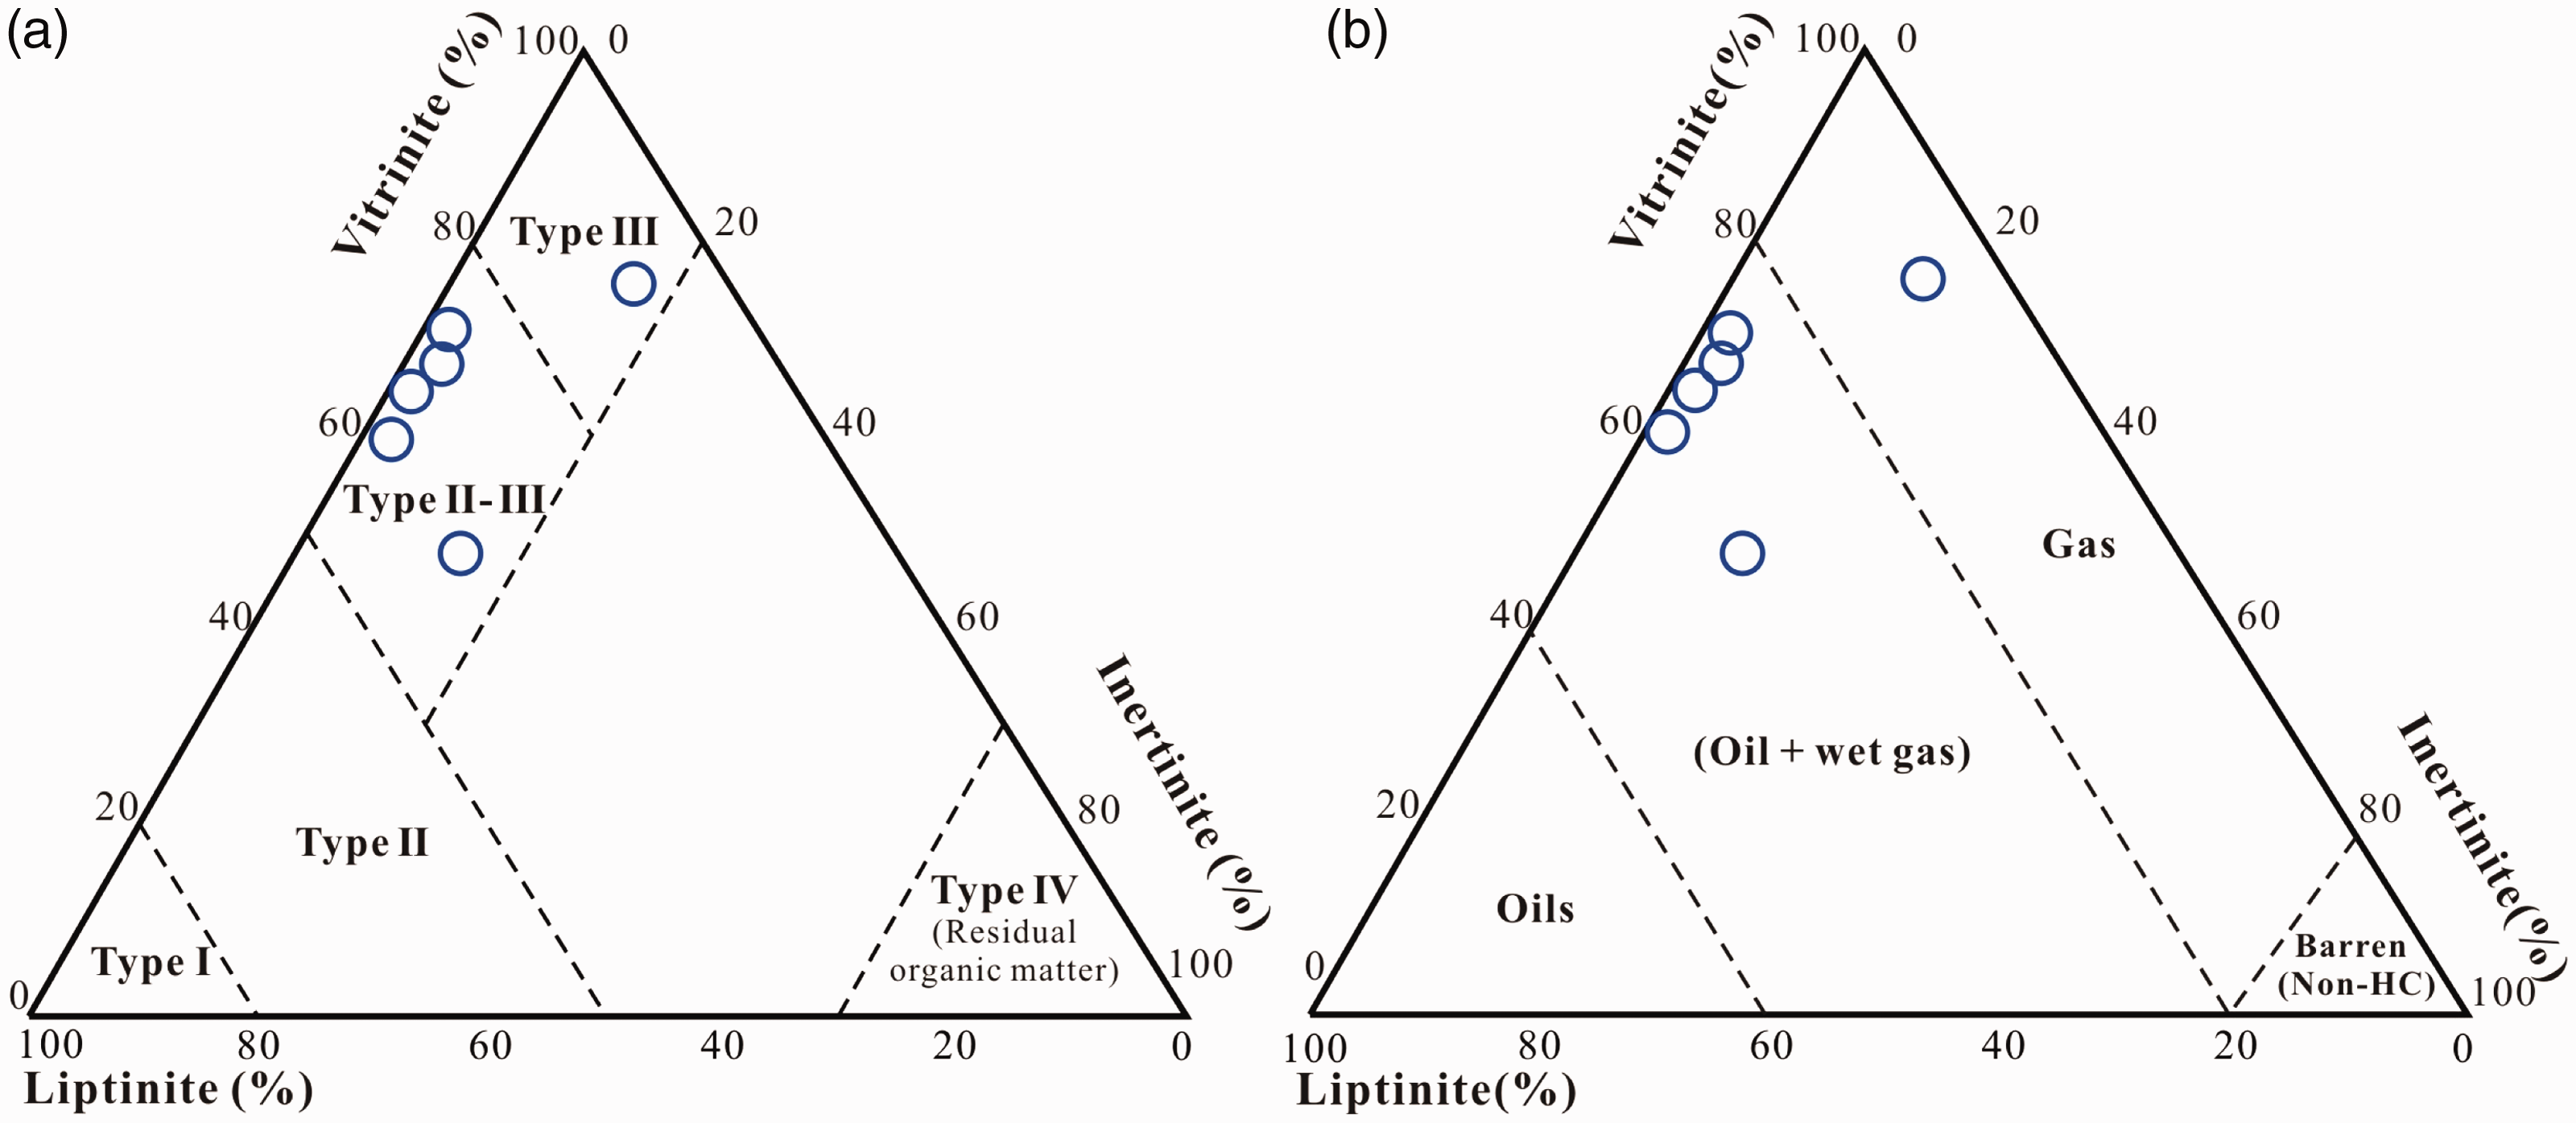
The maceral composition for Carboniferous source rocks showing (a) type of organic matter and (b) kinds of hydrocarbon generation (modified after Mohammed and Abdulghani, 2016).
Maturity of organic matter
The organic matter must reach a certain degree of thermal evolution so that it can expel hydrocarbon (Chang et al., 2013b). Generally, Tmax value is an effective parameter to indicate the source rock is mature or not (Ehsan et al., 2016). While, the type of organic matter cannot be ignored in studying the maturity of the organic matter (Hunt, 1996; Peters, 1986). In this study, the plot of Tmax versus HI was used to explain maturity and kerogen types for the samples that were obtained from the study areas (Figure 3(a)). This result indicates that most the samples in the Carboniferous interval reach mature stage, and a few of them reach the late stage of thermal evolution. According to the plot of Tmax against PI, only the mudstones and tuffaceous mudstones of the Carboniferous source rocks are located in the hydrocarbon generation zone (Figure 5(b); Ebrahim et al., 2016).
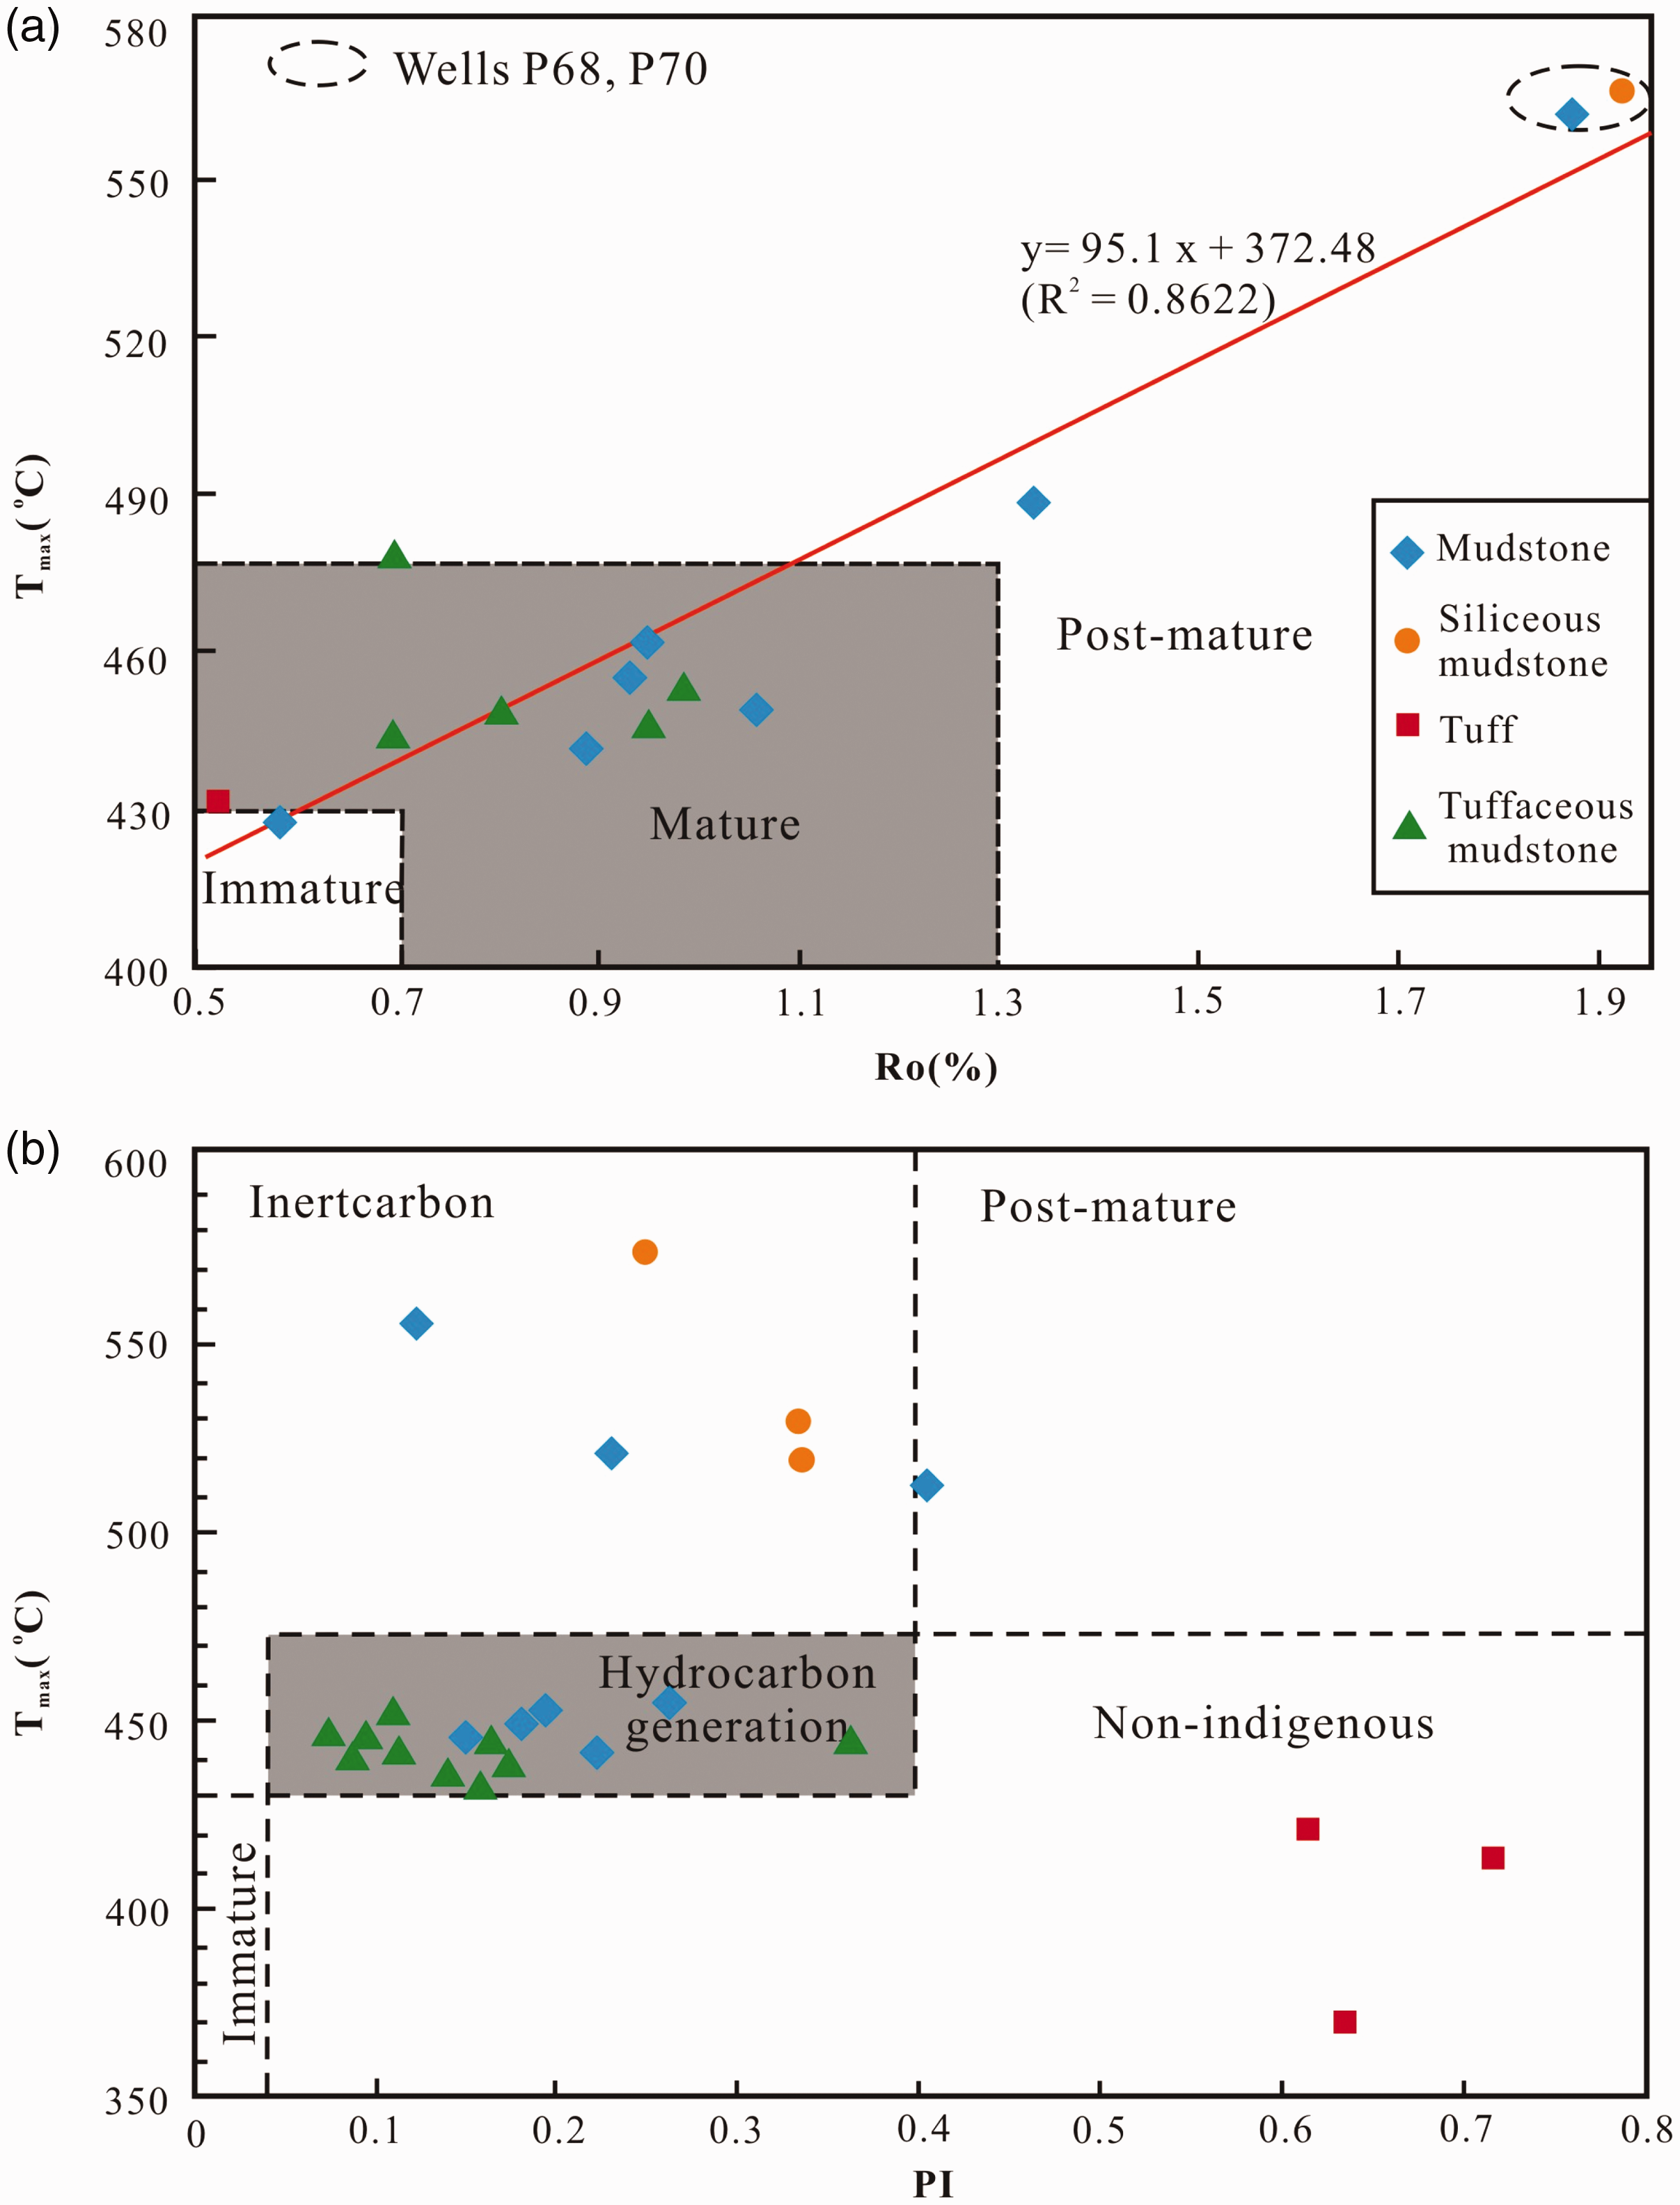
Plot of PI versus Tmax (a) and positive relationship between Tmax and Ro (b) for explaining the thermal evolution of the source rocks.
Note that Tmax values do not change significantly at late stage of thermal evaluation (Peters et al., 2005; Chang et al., 2011). So the measured %Ro values are believed to have high credibility as a marker of maturity (Peters et al., 2005). As Figure 5(a) shows, the %Ro and Tmax values of the rock samples show a good linear relationship (R2 = 0.8622). And the Carboniferous source rocks are considered to reach the mature stage for its %Ro values (0.5–1.9 %Ro, mean 1.01 %Ro), which is consistent with the conclusion obtained from Rock-Eval pyrolysis. Among them, the mudstones and tuffaceous mudstones exhibited mature characteristics and the tuff samples entered in the early stage of thermal evolution. Otherwise, a few samples are characterized with higher %Ro and Tmax values, which is related to their location (wells P70 and P68) and is illustrated below.
Thermal evolution history of organic matter
Burial and thermal history models of the study area are reconstructed. As shown in Figure 6, the Carboniferous source rocks reached the hydrocarbon generation threshold in the middle stage of Early Carboniferous (330 Ma). And it soon reached a major hydrocarbon generation period. An interesting phenomenon is that some presently shallower buried samples were overmature (well P70), while some presently deeper buried samples only reached early stage of thermal evolution (well P66). The reason is that maturity of source rocks is not related to its present burial depth but to the maximum burial depth in geological history. After the Late Carboniferous, due to the uplift and erosion, the %Ro values of the source rocks changed little.
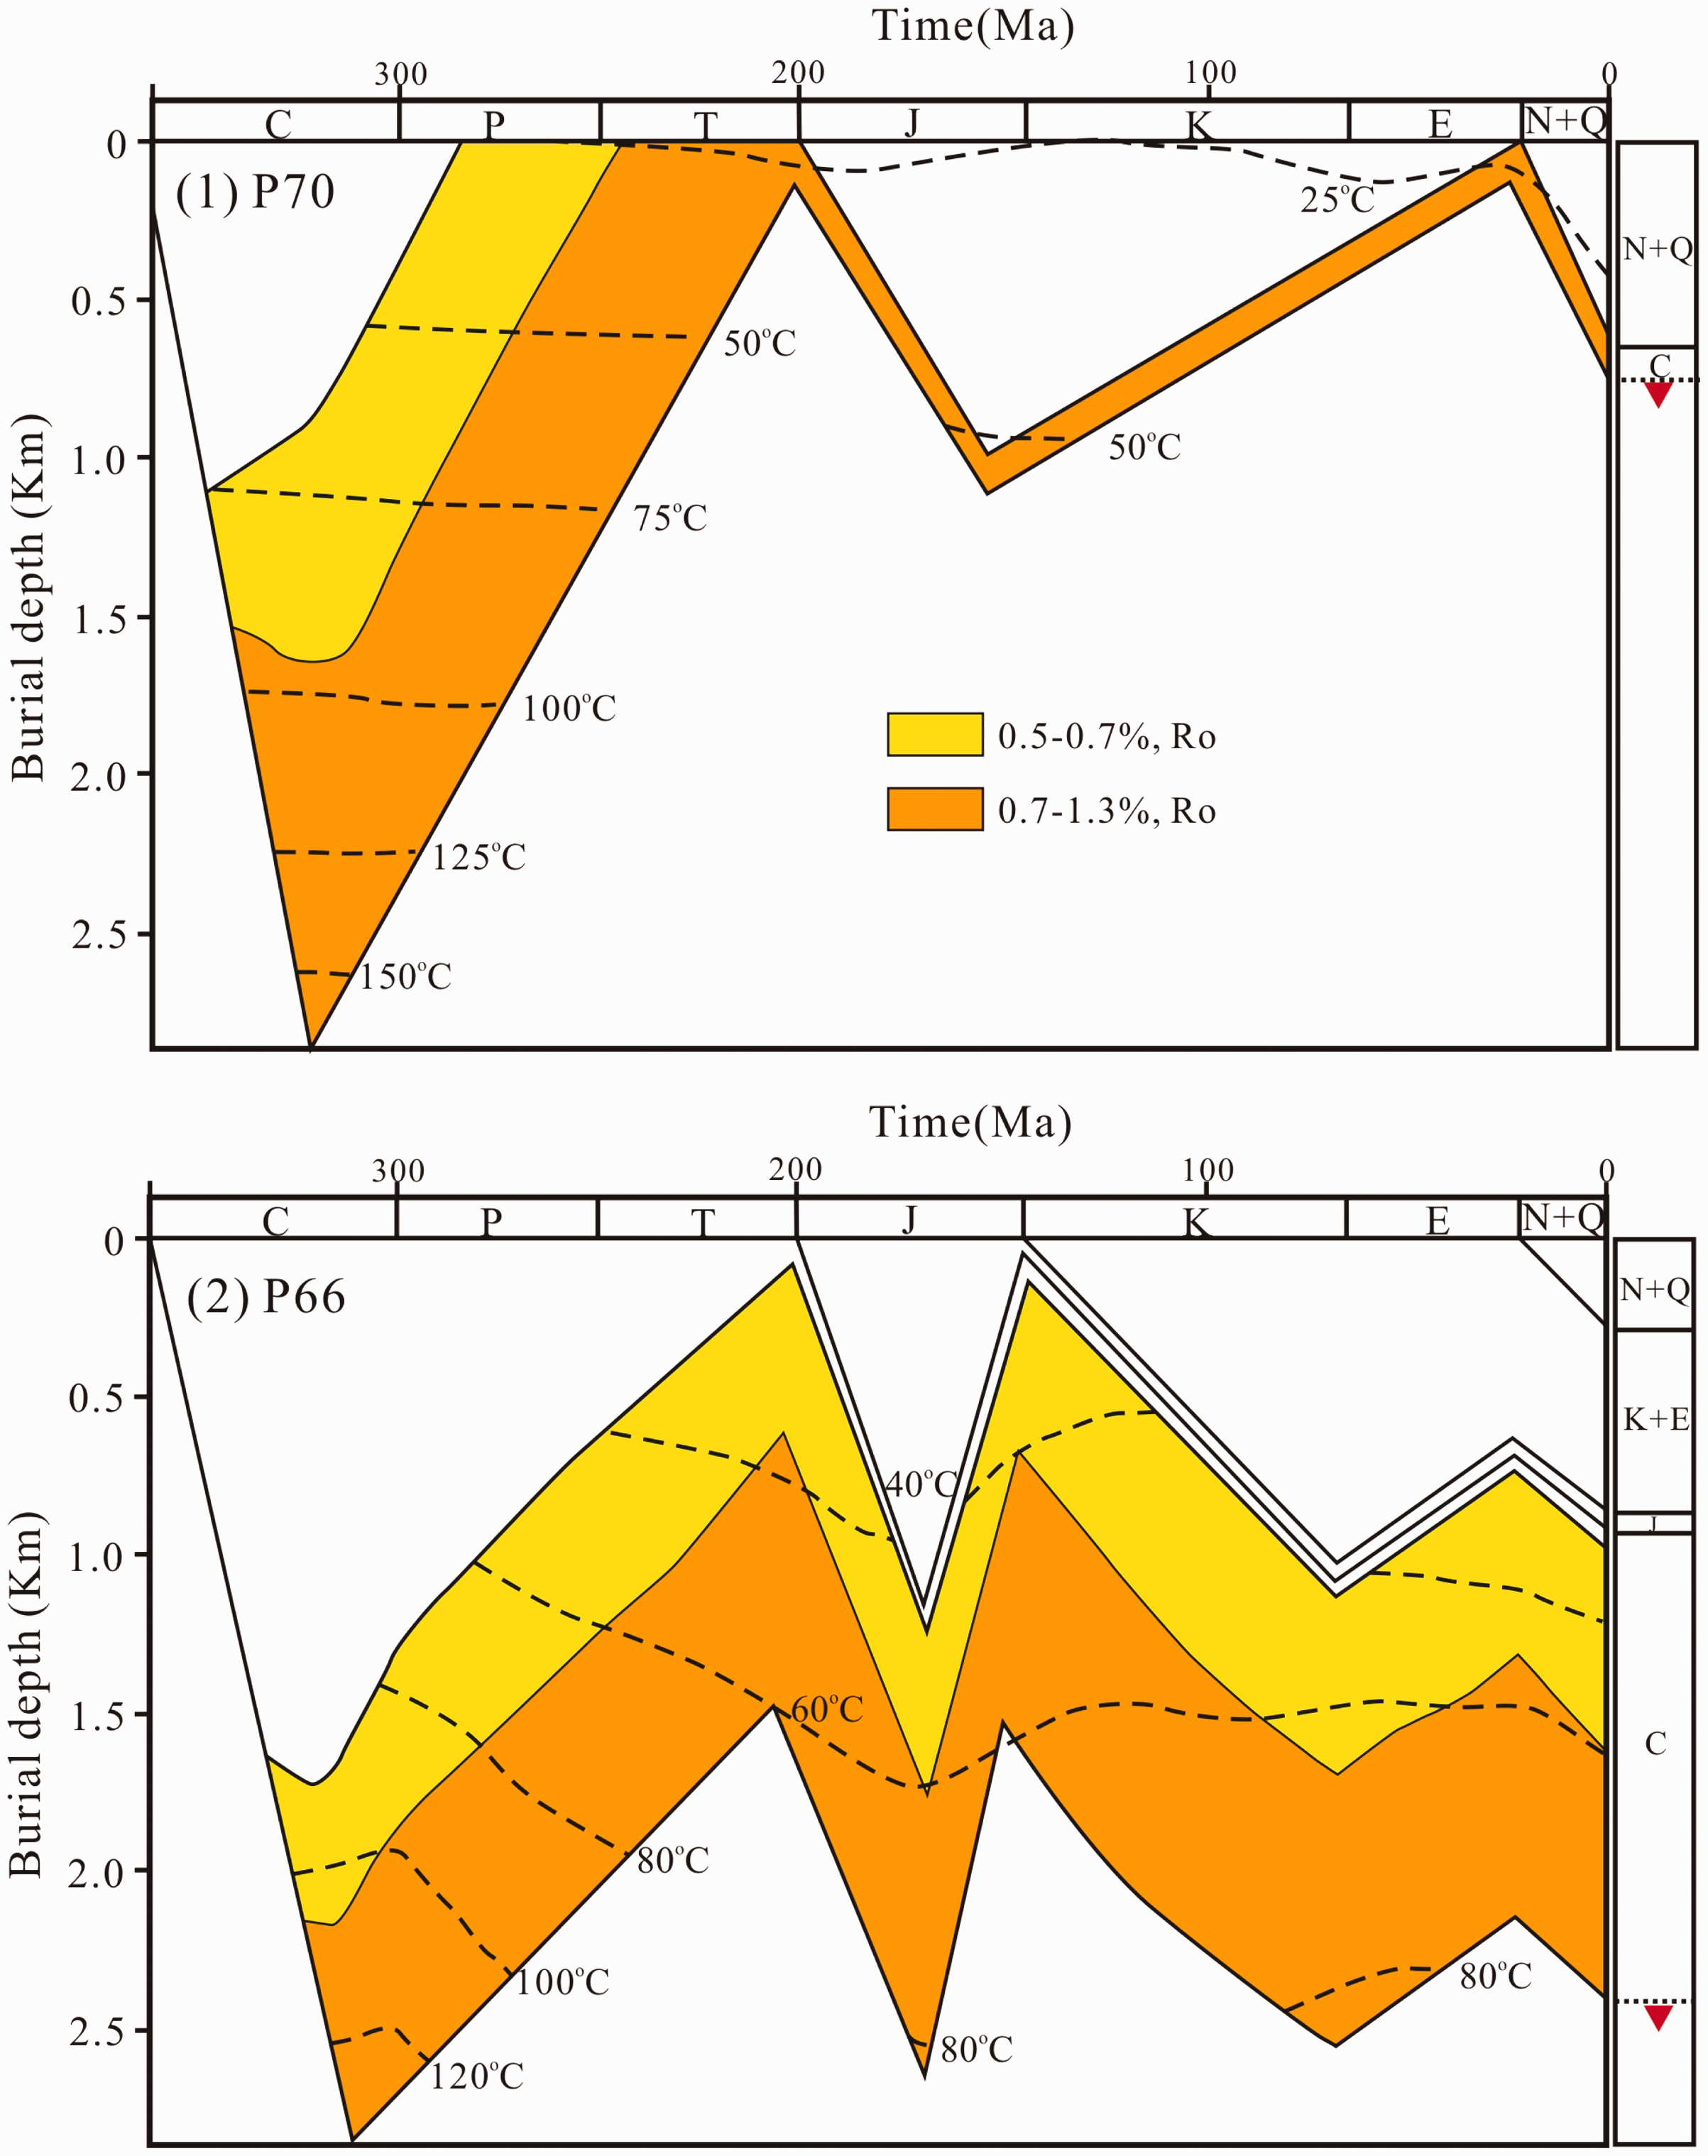
Burial–thermal histories reconstructed for wells P70 and P66 by PetroMod 1D software.
Paleoenvironment
Normal alkanes and isoprenoids
It is generally believed that that the long-chain n-alkanes (>nC23) are derived from higher terrestrial plants (Eglinton and Hamilton, 1967), whereas the short chain n-alkanes (<nC20) are considered to be mainly derived from aquatic organisms (Brassell et al., 1978). Figure 7(a) and 7(b) shows the distribution characteristics of normal alkanes and isoprenoid hydrocarbons. The two Carboniferous source rock samples in Chepaizi Uplift have some differences, one shows a characteristic of bimodal distribution, and the other is dominated by short-chain n-alkanes. It suggests that organic matter comes from a mixture of aquatic and terrestrial plants. More parameters are needed to accurately determine the source of organic matter (Peters et al., 2005).
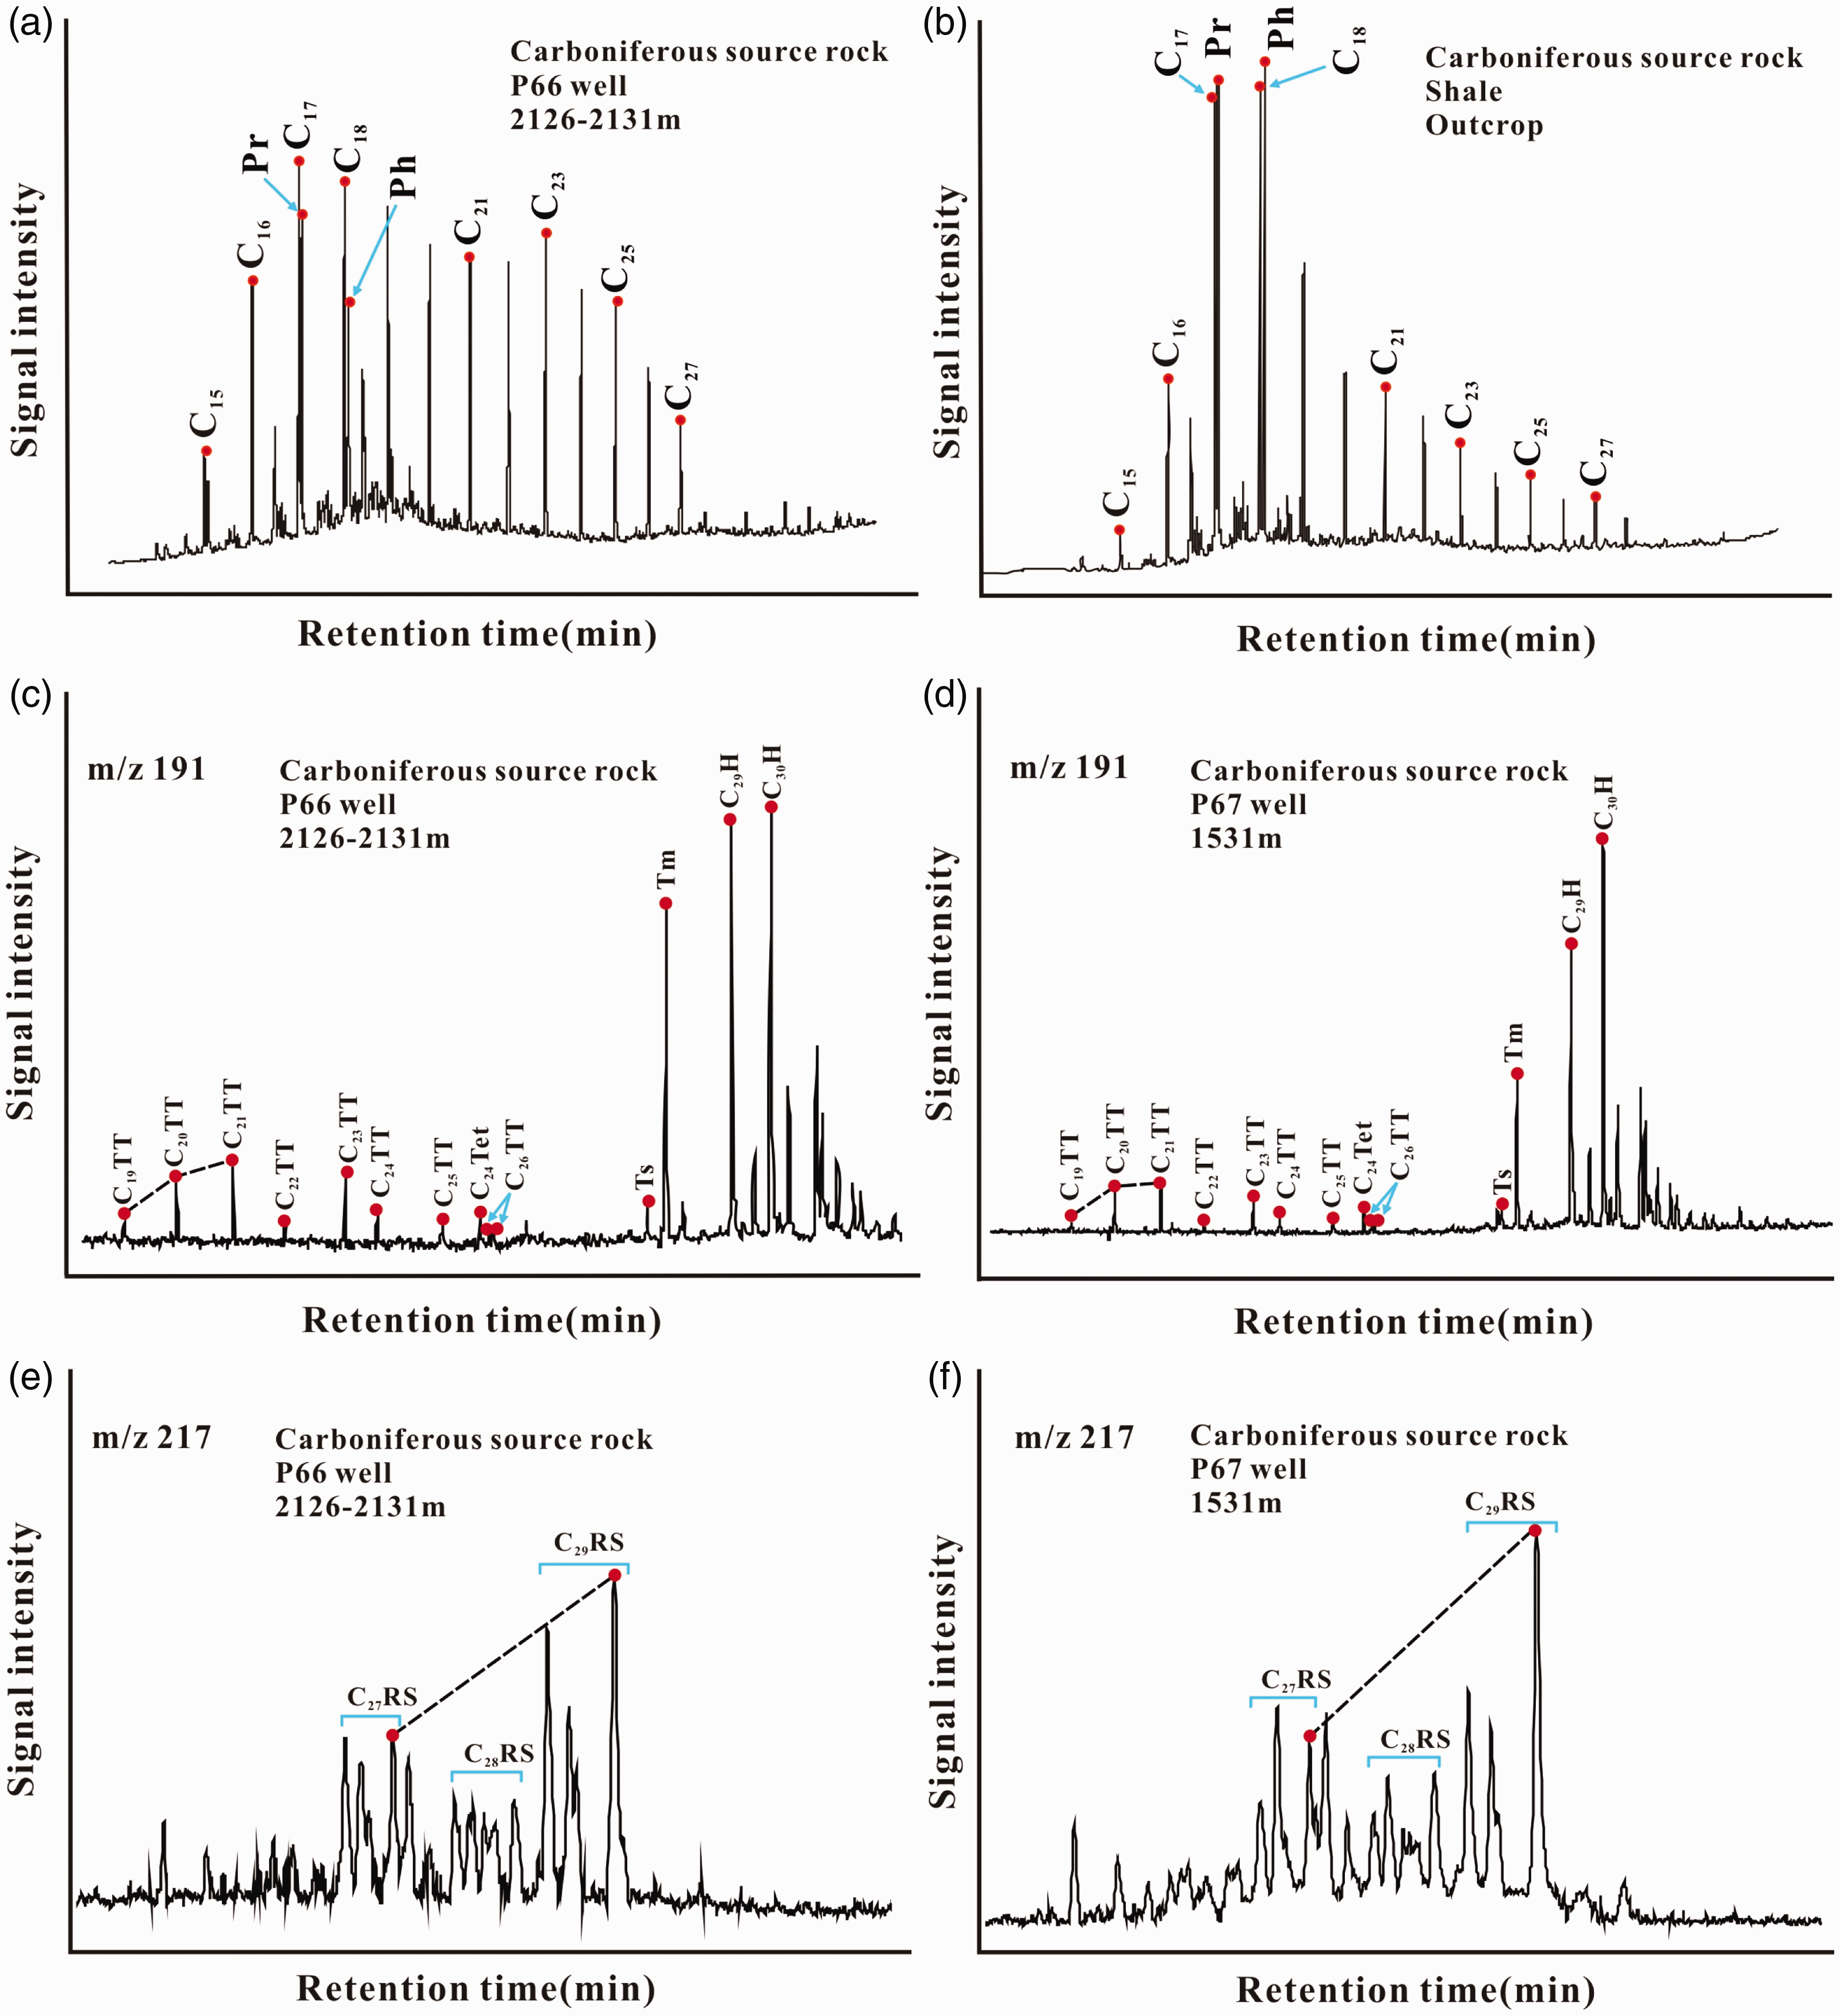
GC and GC-MS analysis of the saturated fraction in the Carboniferous samples: (a) and (b) show the distribution of normal alkanes and isoprenoid hydrocarbons; (c) and (d) show terpanes distribution in m/z 191 mass fragmentograms; (e) and (f) show steranes and disteranes distribution in the m/z 217 mass fragmentograms. C19–C26TT: tricyclic terpanes with different carbon numbers; Ts: C27 18α(H)-22, 29, 30-trinorhopane; Tm: C27 17a(H)—22, 29, 30—trinorhopane; C29H: C29 hopane; C30H: C30 hopane); C27–C29RS: regular steranes with different carbon numbers.
Generally, the CPI values, which have some changes with the thermal evolution of source (Li et al., 2019; Zhao et al., 2017), could indicate the contribution of terrigenous plants (Akinlua et al., 2007; Meyers and Snowdon, 1993). The CPI calculated according to Scalan and Smith (1970) further suggests the contribution of terrigenous or aquatic organic matter (Figure 8(a)). Otherwise, the high CPI value (>1.2) indicates that the source rocks are immature, which contradicts the conclusion that most Carboniferous samples are mature. Therefore, this phenomenon indicates the effect of terrestrial organic matter input (Sun et al., 2005; Zheng et al., 2019).
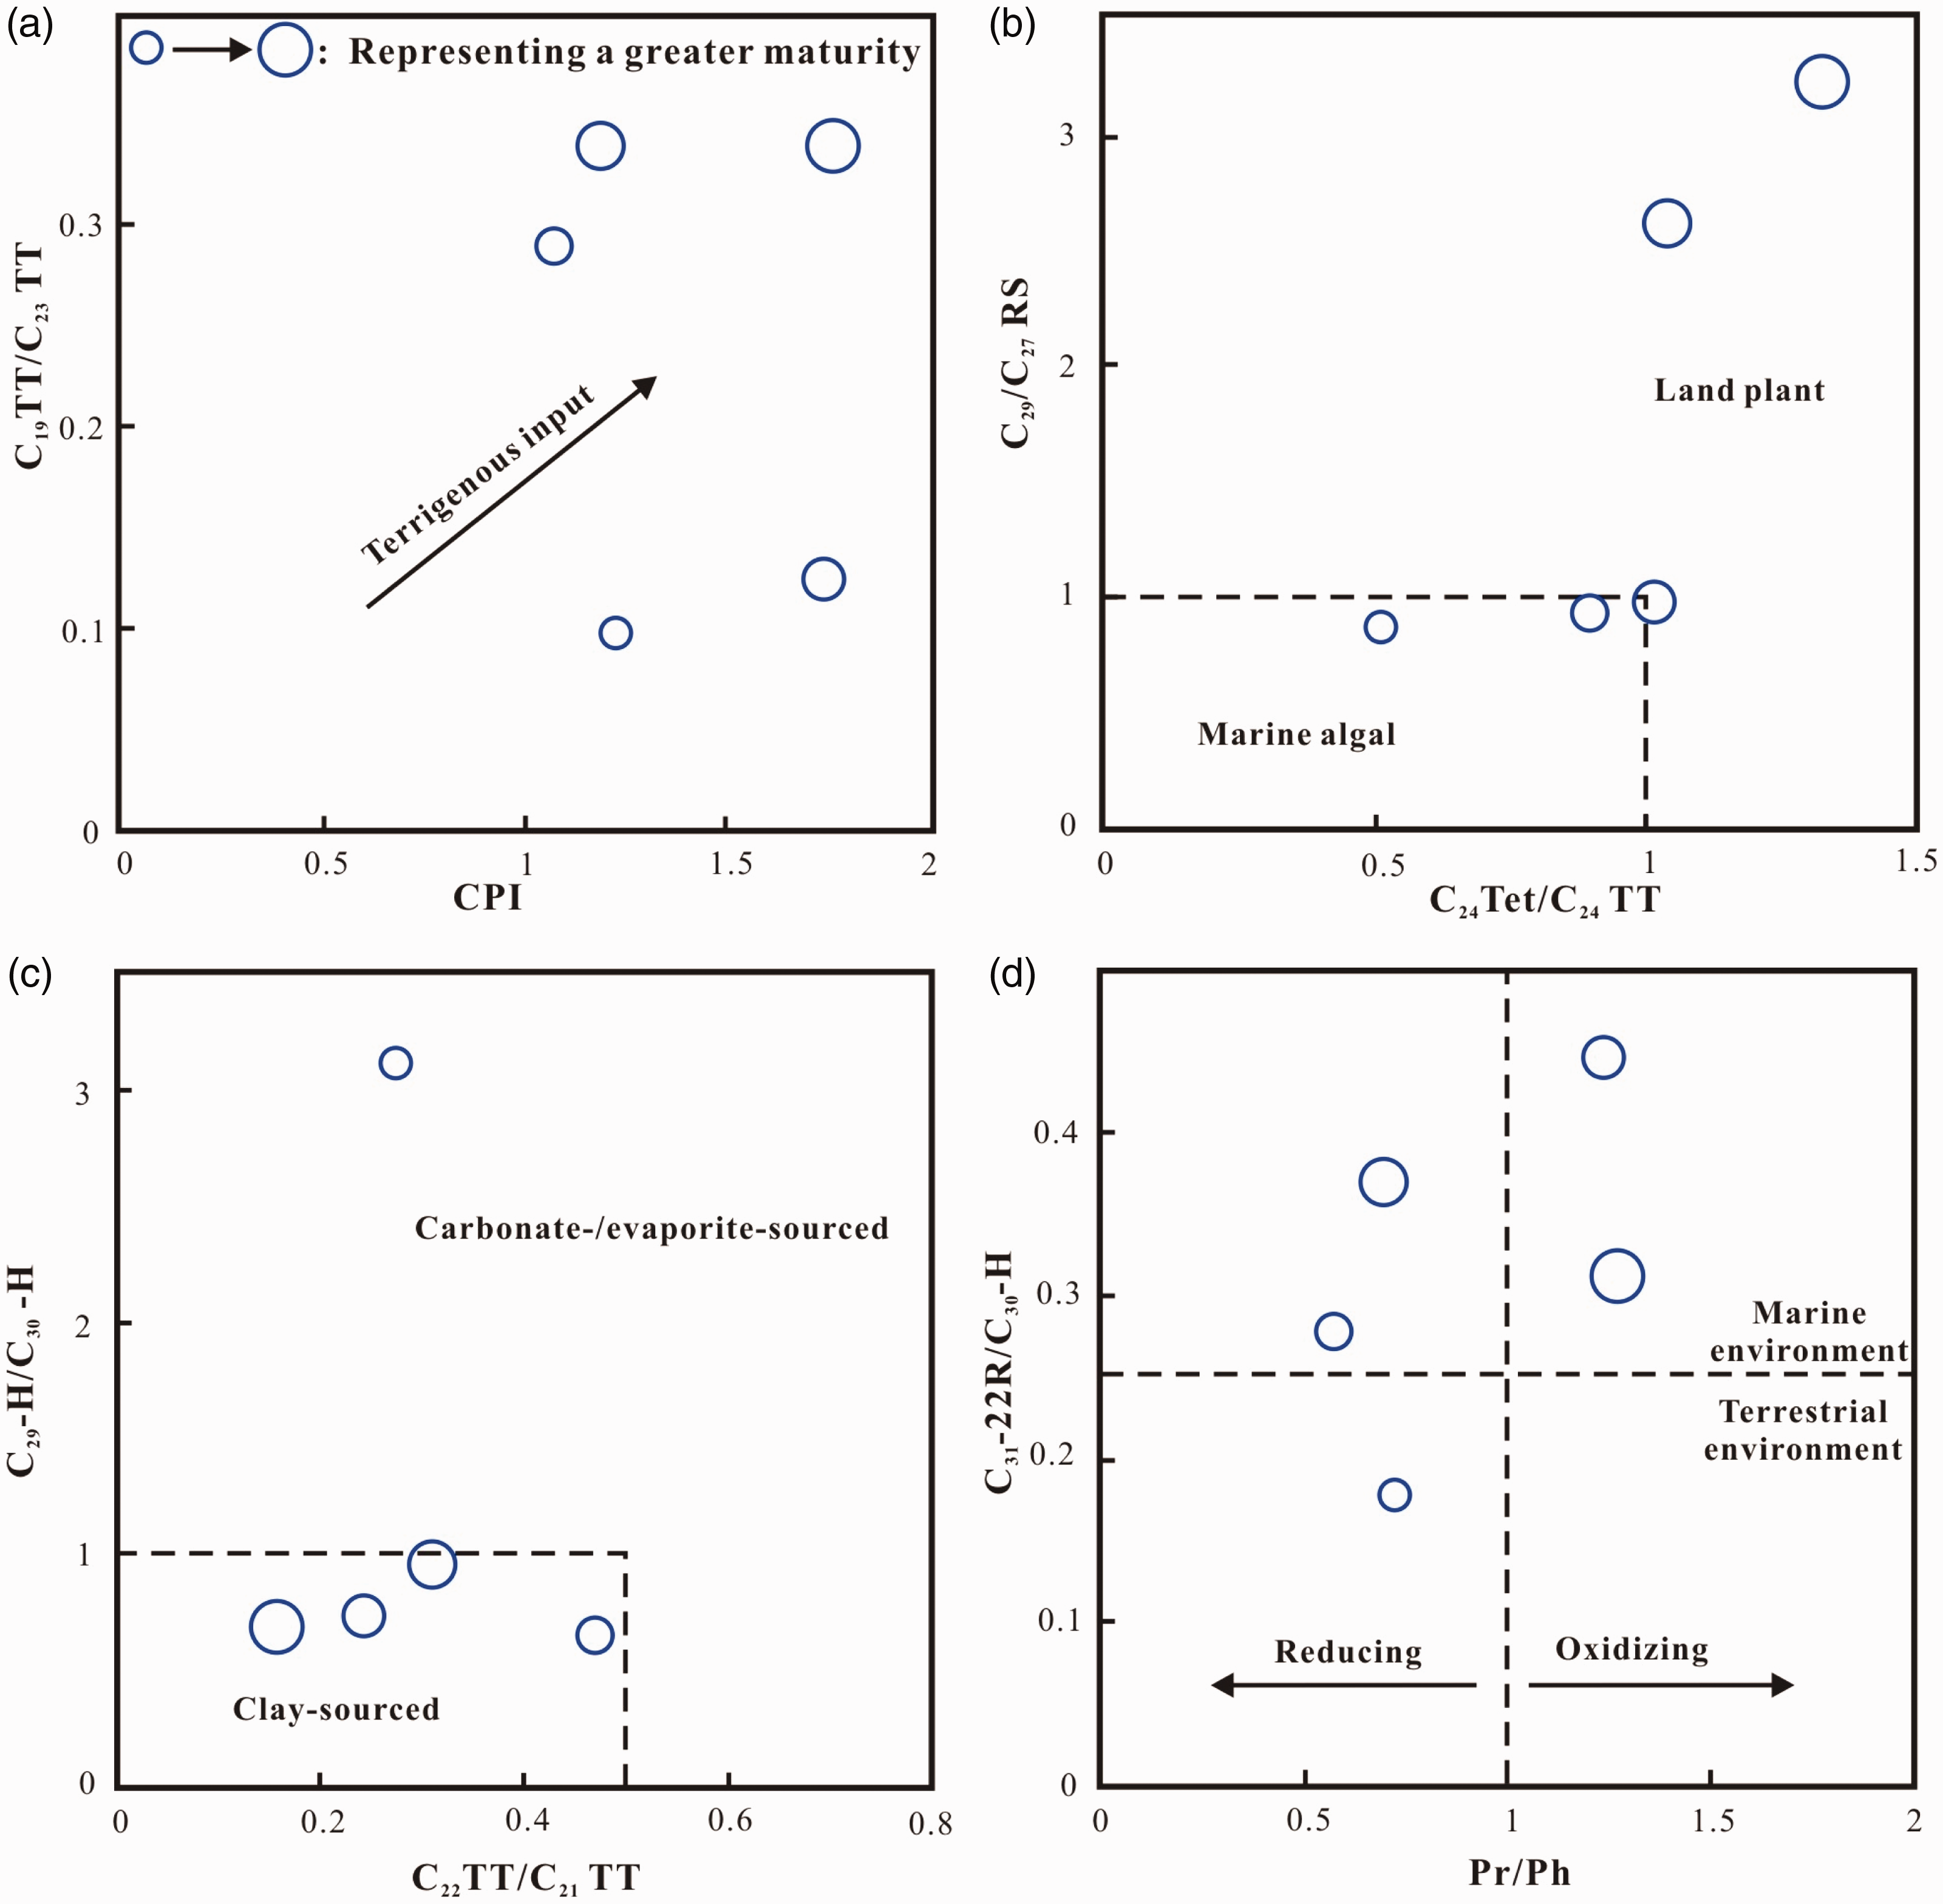
Plot of biomarkers of the samples, showing a mixed organic matter under marine environment.
Apart from the above parameters, the Pr/Ph ratio is also an important indicator of sedimentary environment of organic matter (Didyk et al., 1978;Peters et al., 2005; Sun et al., 2001). In this study, all of the selected samples with Pr/Ph values of 1–2 are regarded as a weakly reduced–weakly oxidized sedimentary environment. The relationship of Pr/n-C17 and Ph/n-C18 shows that there is mixed organic matter under weakly reducing conditions for Carboniferous source rocks (Figure 9; Shanmugam, 1985).
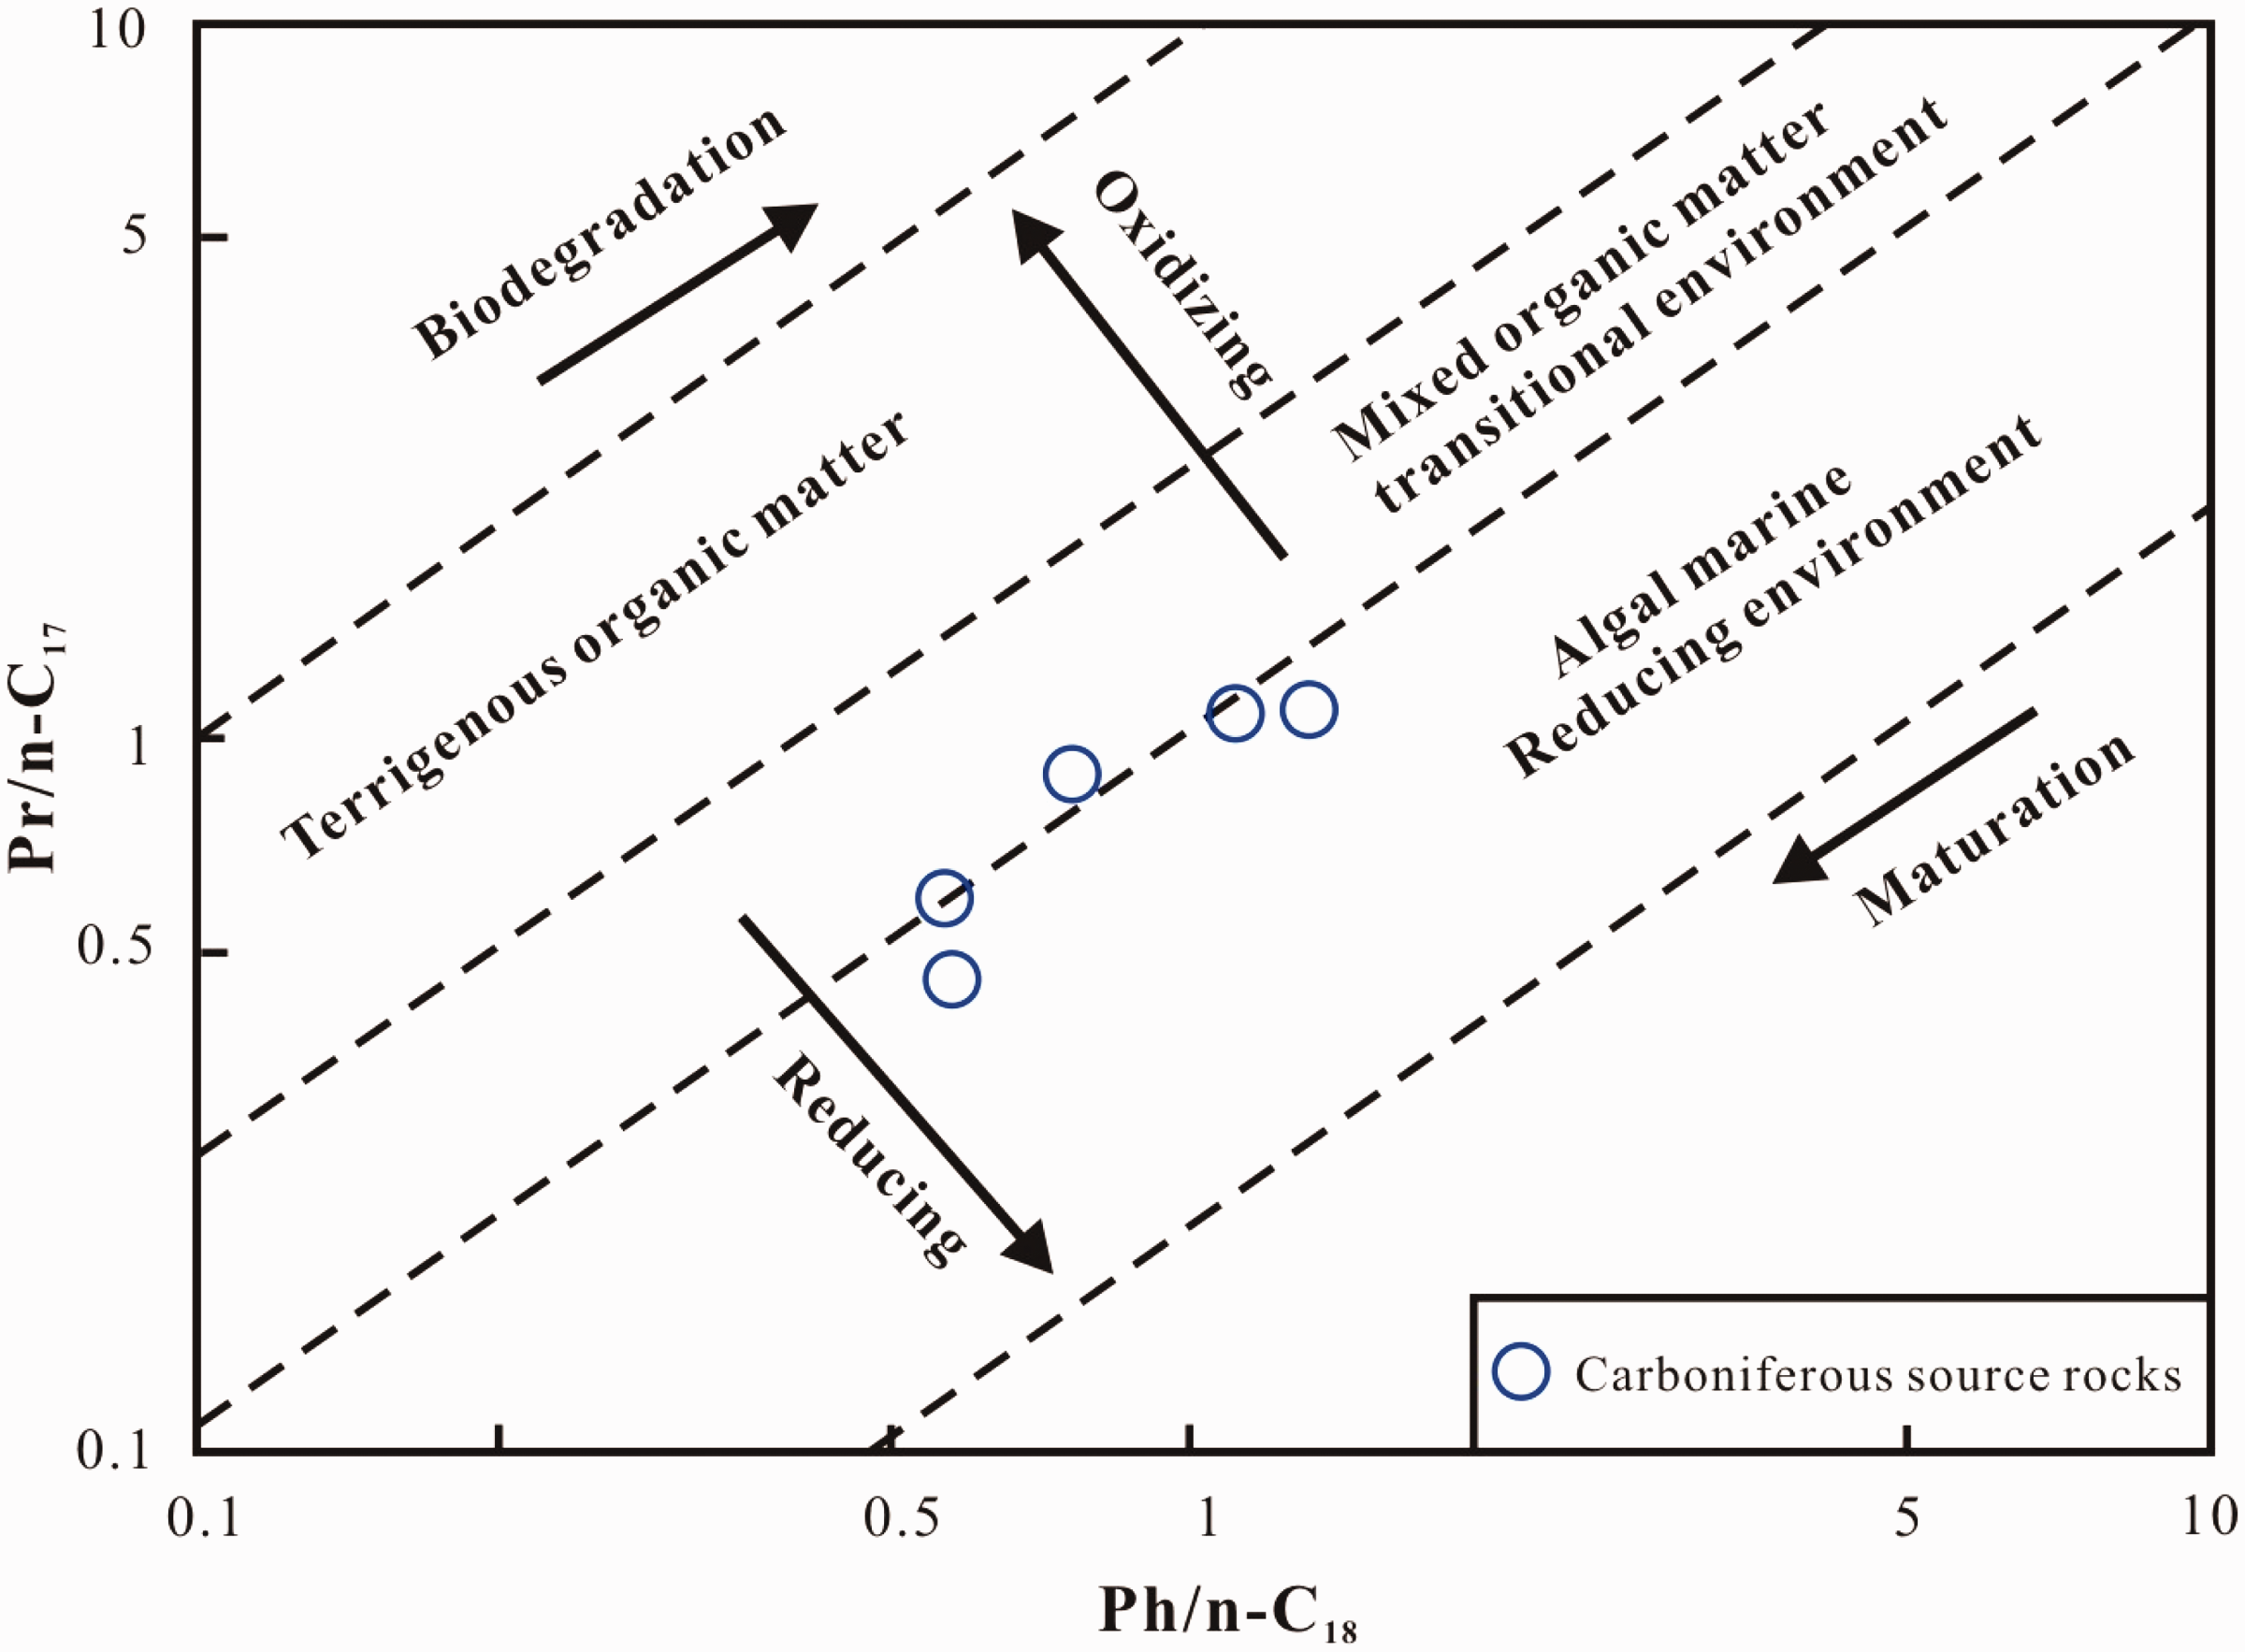
Pr/n-C17 versus Ph/n-C18 ratios of the samples showing a mixed organic matter under weakly reducing conditions.
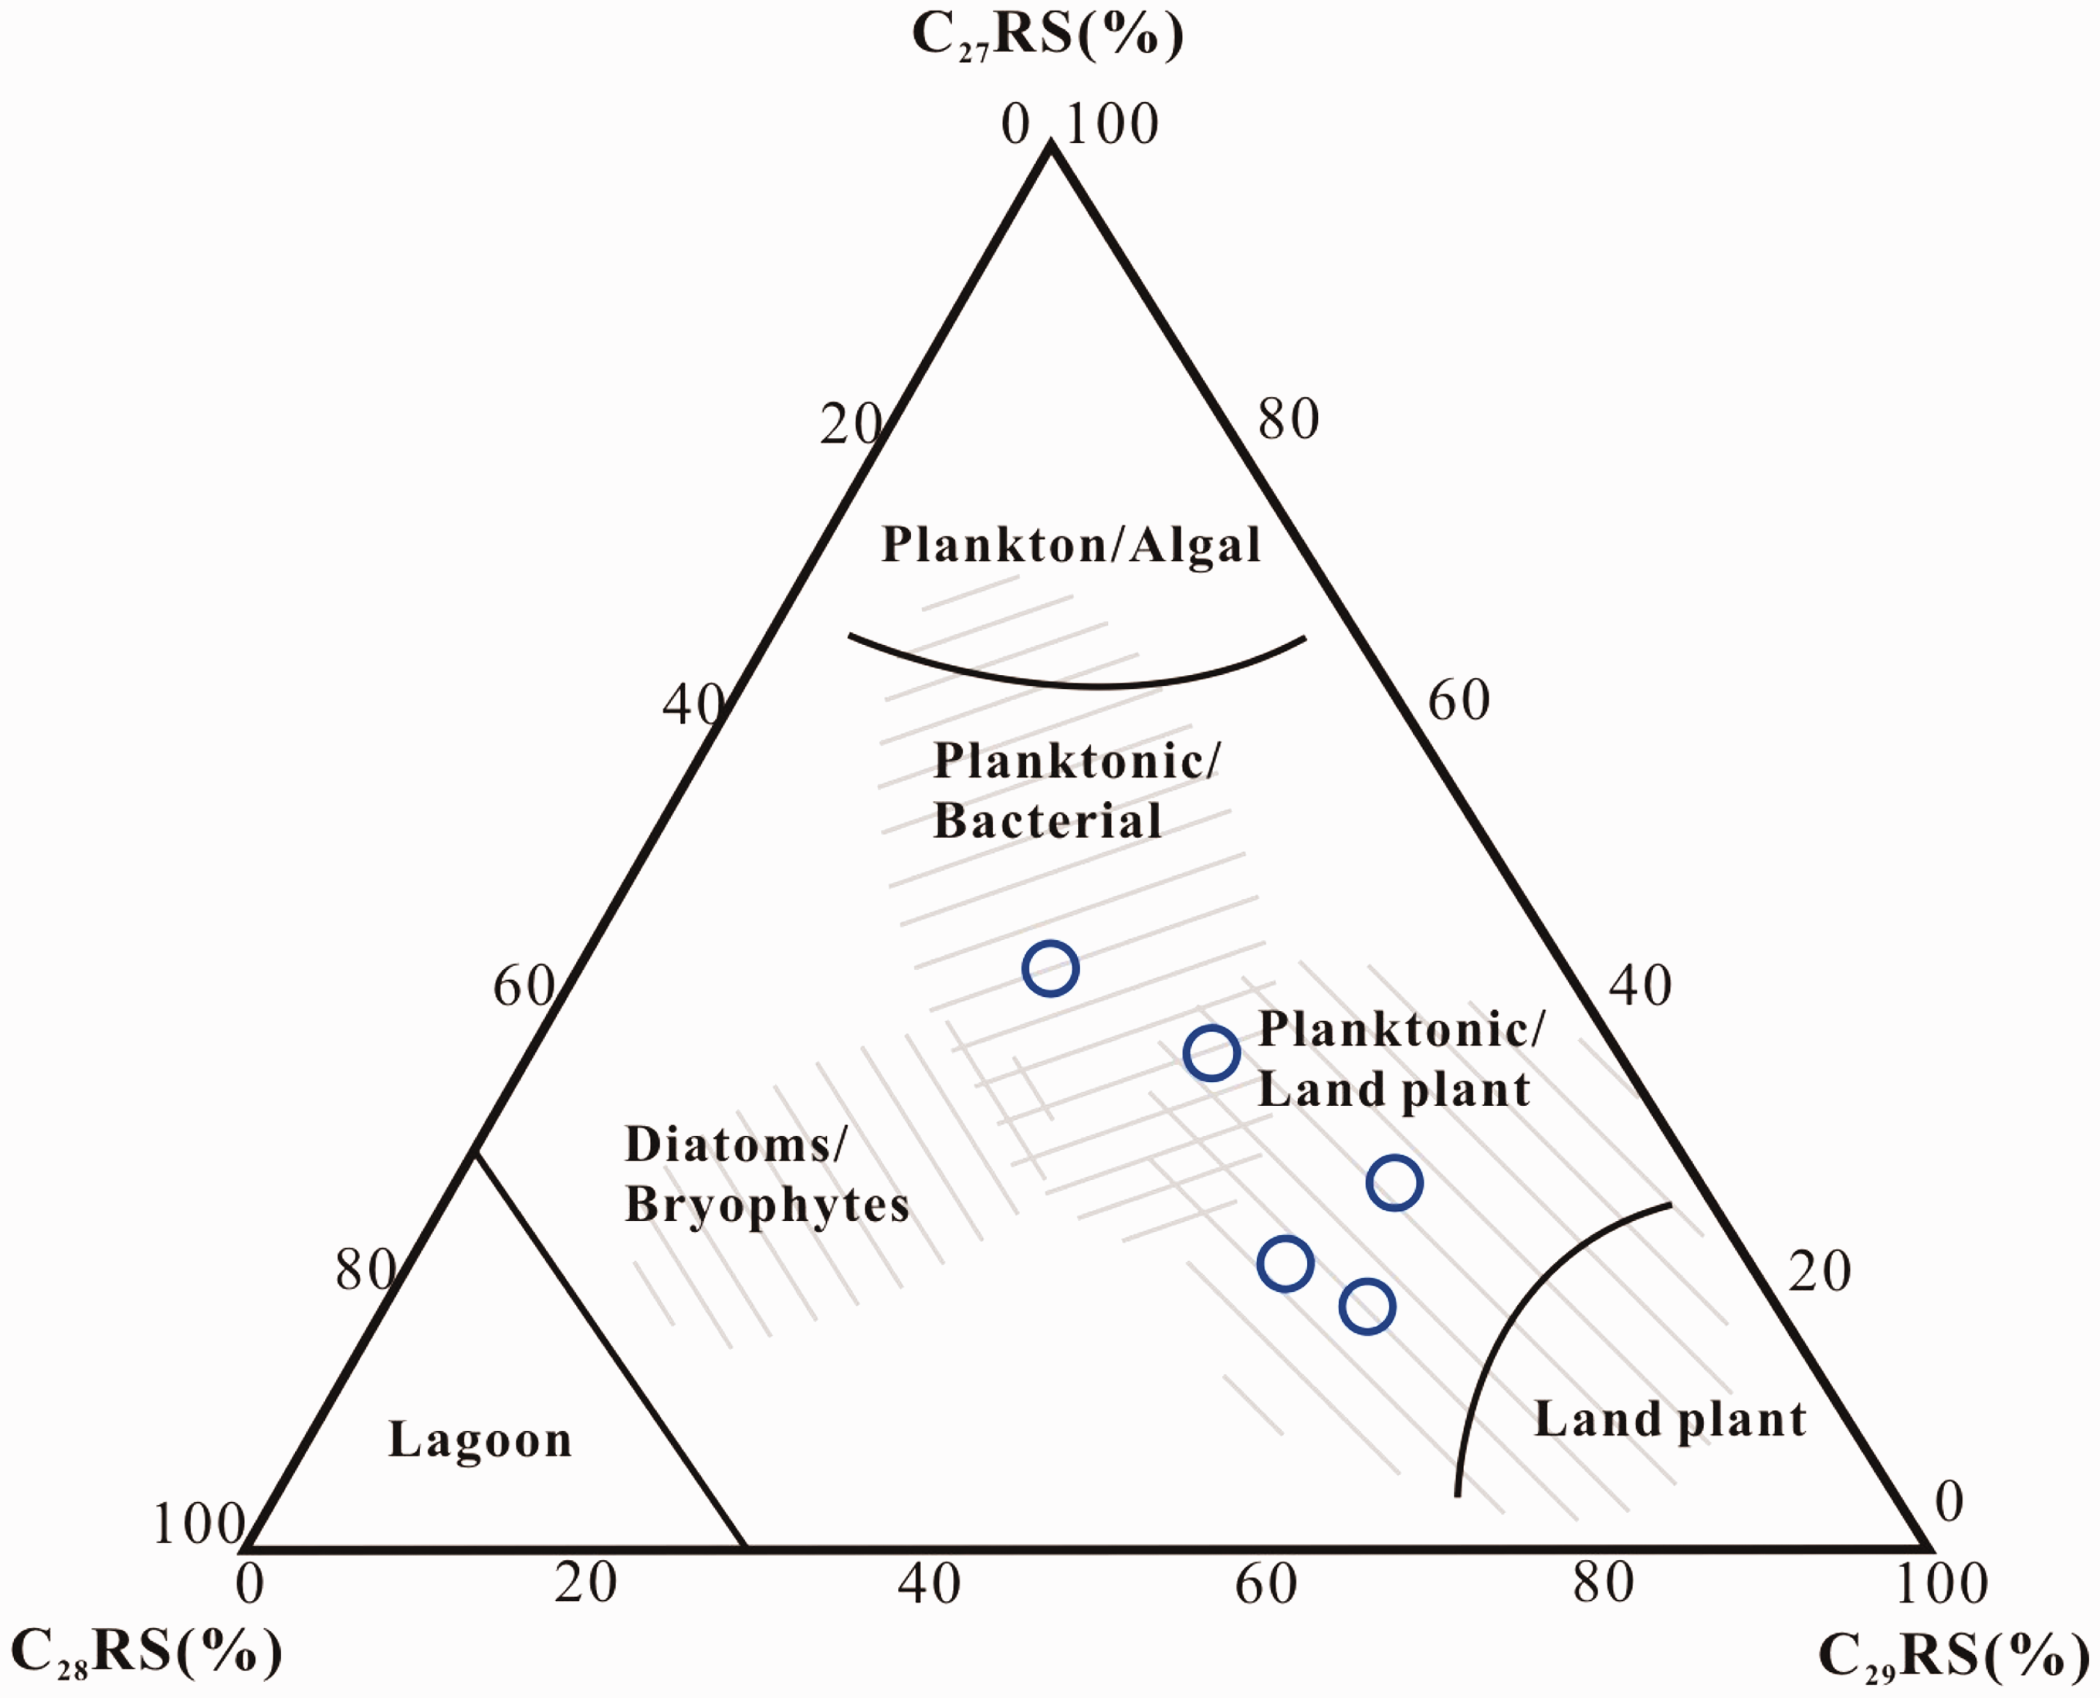
Triangle plot of the regular steranes for the samples in the Chepaizi area.
Terpane and sterane biomarkers
Terpanes are always significant biomarkers in oil, as they can provide some information about the organic matter (Cao et al., 2008; Chang et al., 2016; Hanson et al., 2000; Peters et al., 2005). The distribution of terpanes using GC-MS by monitoring the m/z 191 ions is shown in Figure 7(c) and 7(d). There is a greater contribution of terrigenous organic matter input with the increase the content of C19 and C20 tricyclic terpanes (Reed, 1977; Simoneit, 1977). In our study, the gradually increasing C19/C23TT values of the selected samples indicate the increase of land source contribution (Ehsan et al., 2016; Moldowan et al., 1983). Otherwise, the low C24Tet/C24TT ratios of the Carboniferous samples (mean value is 1.15) are also consistent with the result (Mohammed and Abdulghani, 2016).
Note that the C29/C30 hopane values and the C22/C21 TT values may be related to lithology (Ehsan et al., 2016; Zumberge, 1984). In our study, the low C22/C21TT values (<0.5) and C29/C30 hopane (<1) of most of the samples indicate they are associated with clay-rich rocks (Figure 7(c)). At the same time, the high C3122R-hopane/C30-hopane values with an average of 0.32 indicate a marine environment for Carboniferous sediments (Figure 8(d); Peters et al., 2005).
The relative abundances of C27, C28 and C29 regular steranes (RS) are used to study the organic matter input (Huang and Meinschein, 1979; Wang et al., 2015; Zhao et al., 2017). Meanwhile most samples are characterized by relatively abundant C29 RS sterane and few C27 RS (Figures 8(b) and 10), which supports the above conclusion that the Carboniferous source rocks have both aquatic and terrestrial organic matter contributions, with being greatly affected by the latter.
Oil–source rock correlation
To further investigate the contribution of the Carboniferous source rocks, the oil–source correlation in the Chepaizi area was studied. It has been widely accepted that the Sikeshu Sag and the Changji Sag are two major hydrocarbon-producing regions in northwestern Junggar Basin. In addition, the Jurassic mudstones in the Sikeshu Sag and the Permian mudstones in the Changji Sag were considered to be the main source contributors for the oils in the Chepaizi area (Cao et al., 2005; Chang et al., 2018; Chang et al., 2019; Yang et al., 2015; Zhang et al., 2013). Therefore, the two main source rocks in the western Junggar Basin together with the native Carboniferous source rock in the Chepaizi Uplift were selected to study the oil–source correlation.
The stable carbon isotope values and the tricyclic terpane biomarkers were used to study the oil–source correlation (Chang et al., 2013a; Gormly et al., 1994; Peters et al., 2005). The Jurassic source rocks have the heaviest stable carbon isotope values, the Permian source rocks were lightest, and the values of the Carboniferous source rocks were between them. The whole oils were distinguished clearly based on the stable carbon isotope values (Figure 11(a)). Therefore, the Jurassic source rock was the main contributor for oils of western Chepaizi, while the Permian source rocks and the native Carboniferous source rocks were contributor for oils of eastern Chepaizi. According to the tricyclic terpane parameters, the same conclusion could be made (Figure 11(b)).
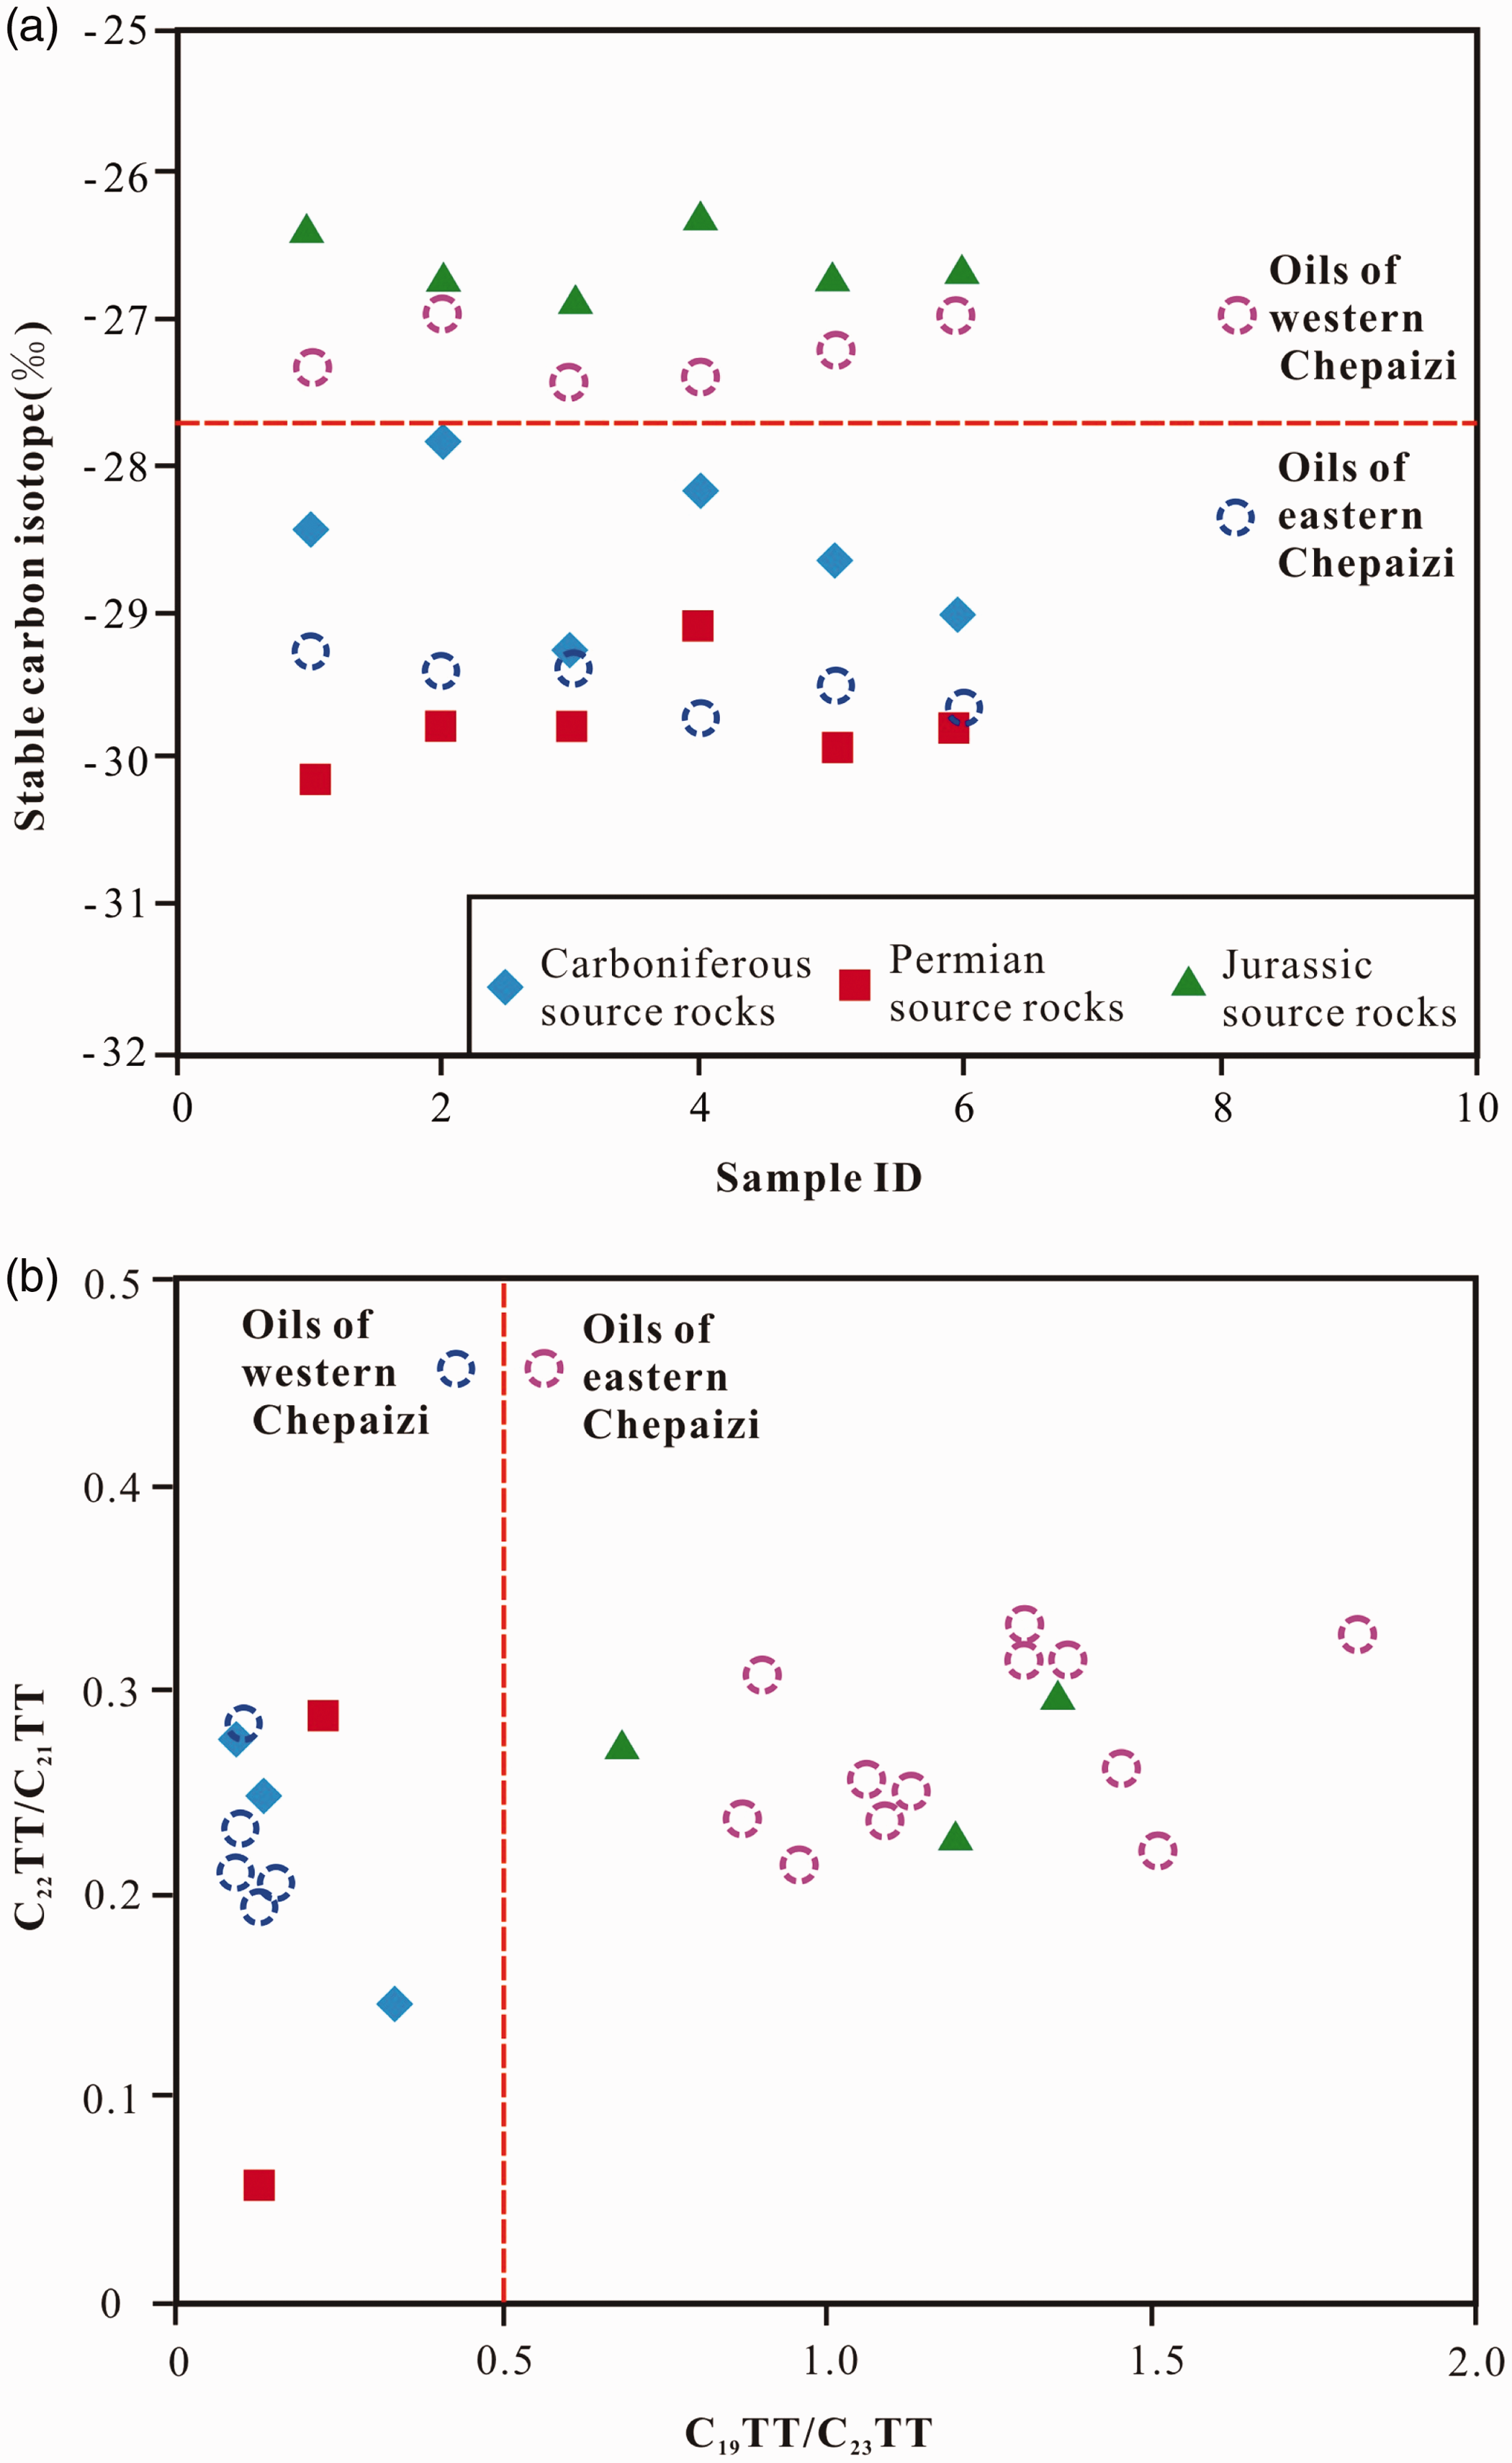
Plot of the stable carbon isotope of source rocks and oils (a) and cross plot of TTs source-related molecular parameters (b) to correlate oil–source.
More parameters, including Pr/nC17, Ph/nC18, Pr/Ph, C20TT/C21TT C23TT/(C23TT + C30H), Ts/Tm, C30RAH/C30H, C29Ts/C29H, Ga/C31H (Table 4), which could indicate sedimentary environment or maturity of the oils (Chang et al., 2013a, 2013b; Gormly et al., 1994; Huang et al., 2016; Peters et al., 2005), were considered to explain the oil–source correlation when the statistical method was used. As Figure 12 shows, two different types were divided when the distance = 24. The native Carboniferous source rocks (RC–1, 2, 3, 4), the Permian source rocks in the Mahu Sag (r/min 1, 2, 3, 4, 5, 6) and in Changji Sag (r/min 1, 2) are related to the oils of eastern Chepaizi (Type I), and the Jurassic source rocks are the oils of western Chepaizi (Type II). The conclusion of the oil–source relationship is consistent with previous study (Wang et al., 2016; Xiao et al., 2014a). Among Type I, the Permian source rocks in the Mahu Sag are not located in the same group, which indicates that the source rocks have some differences in their sedimentary environment, organic lithofacies and maturity (Huang et al., 2016).
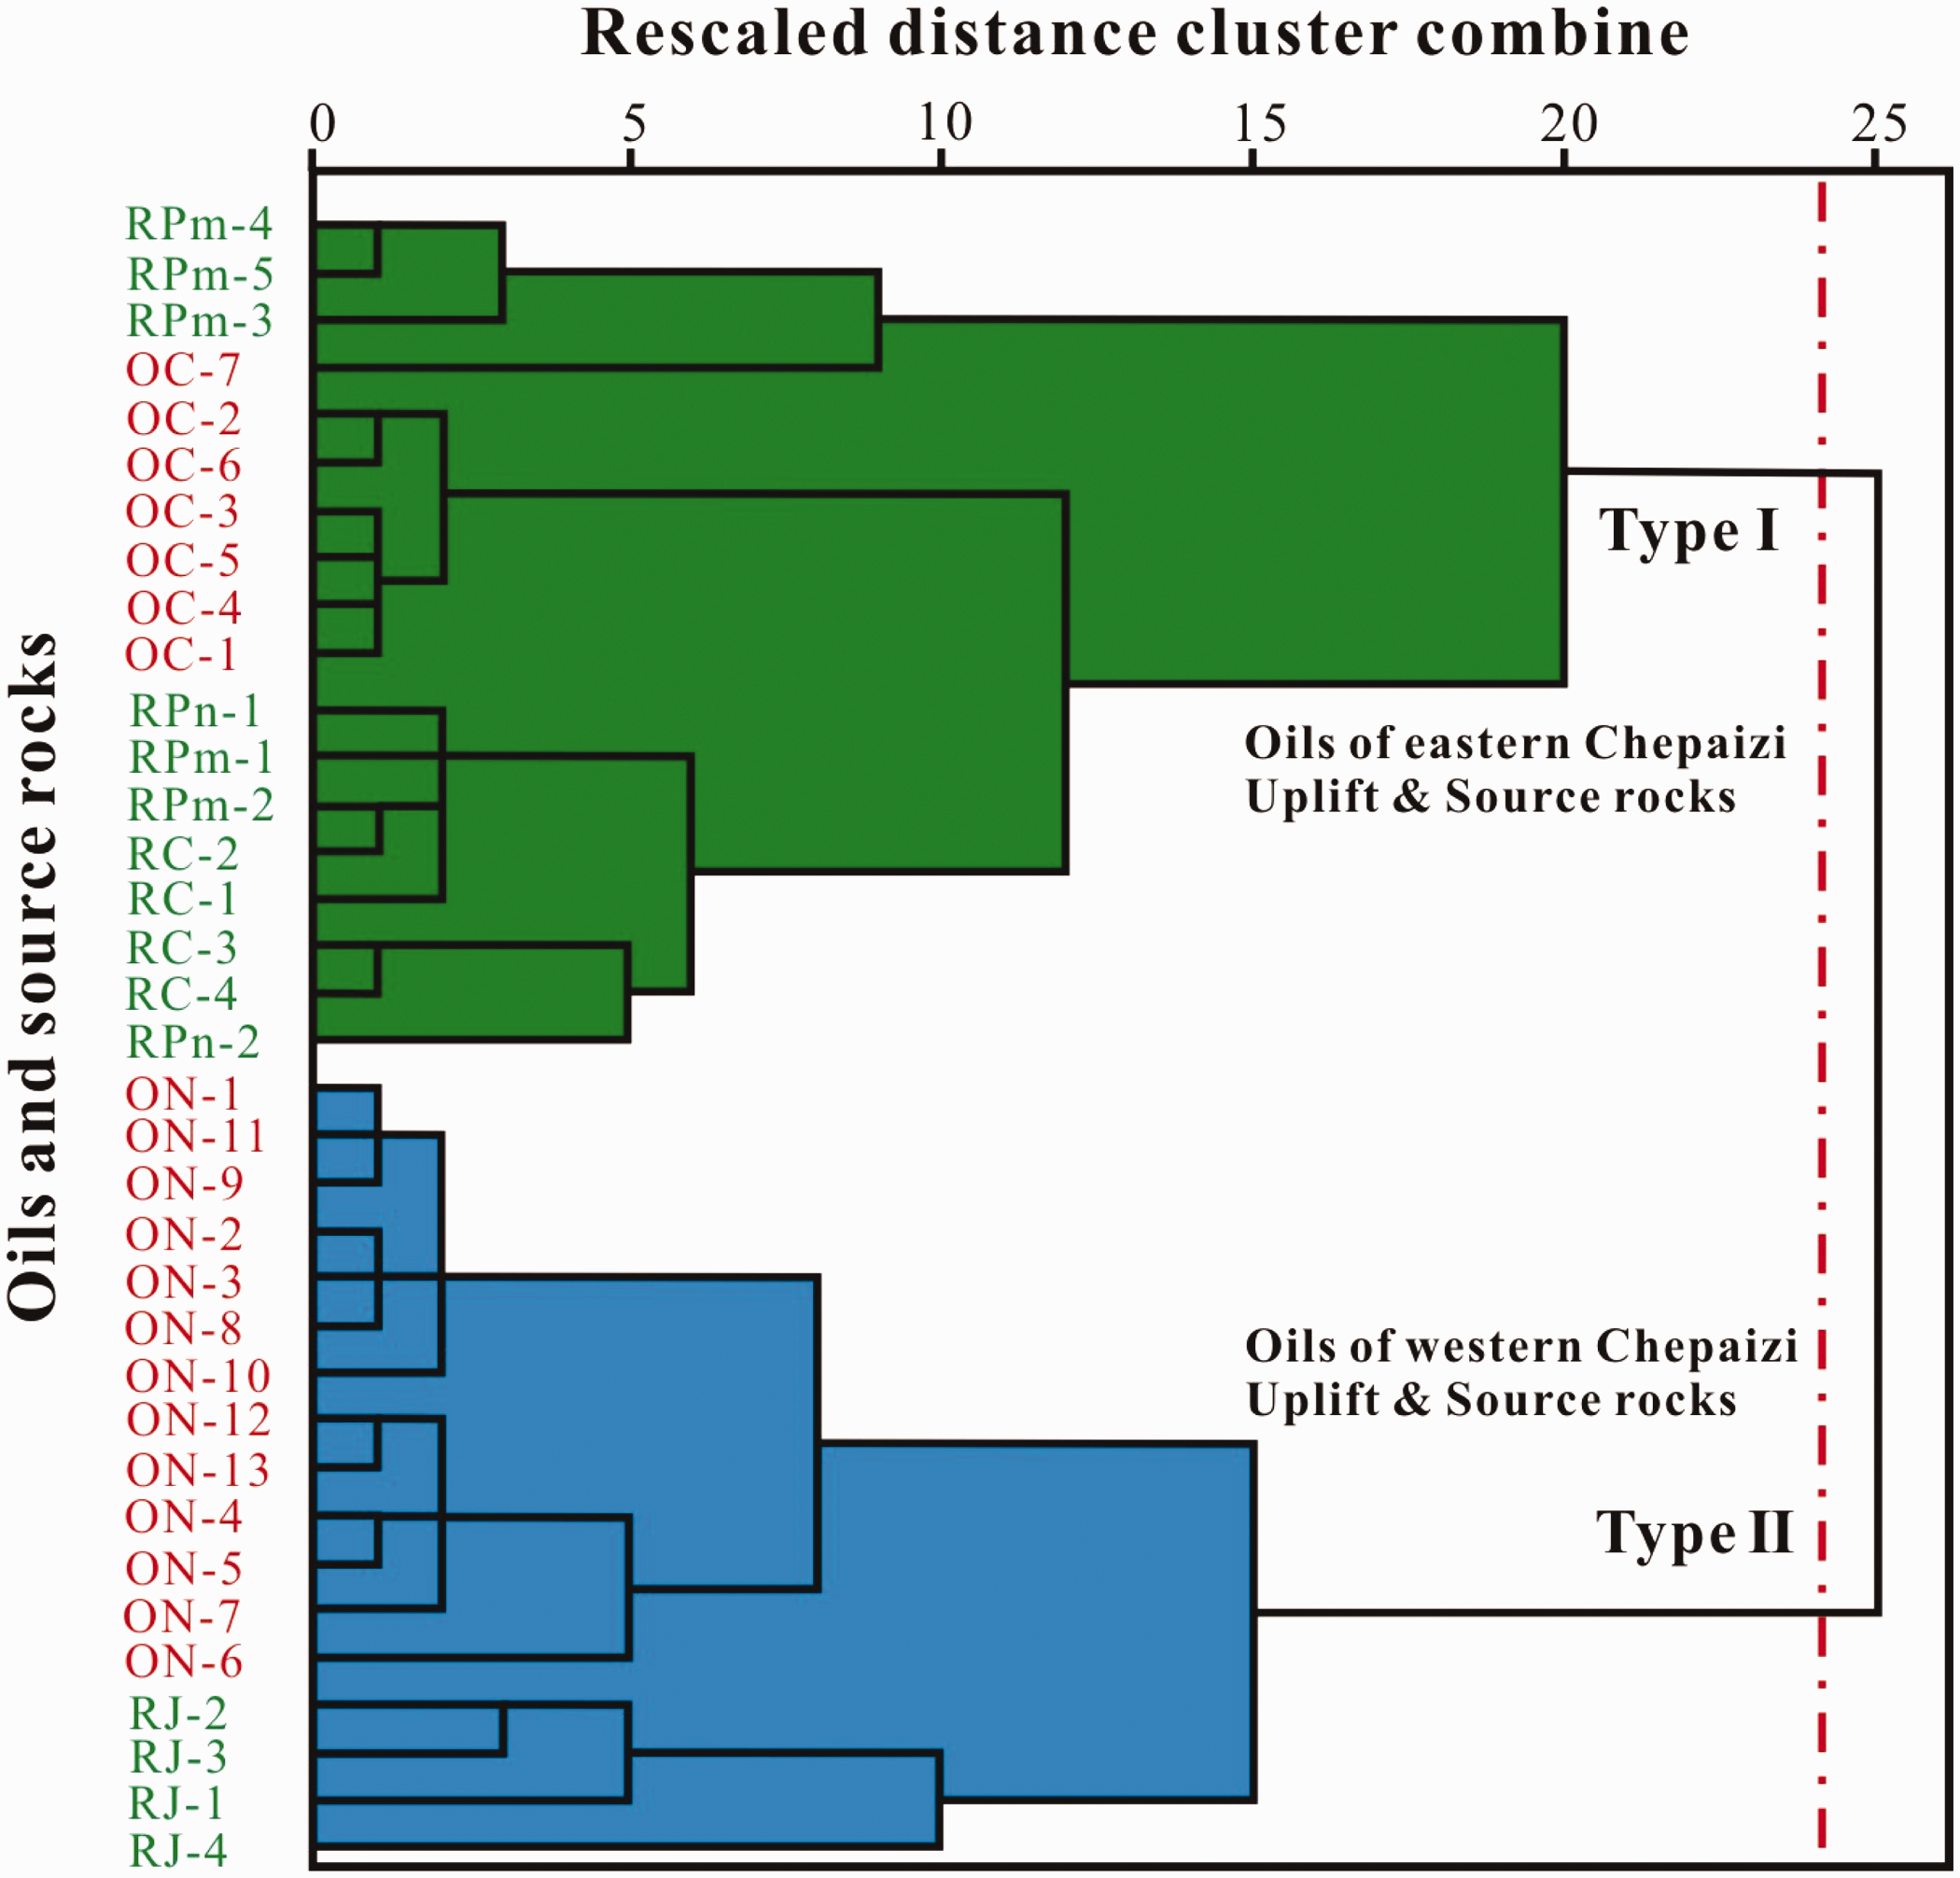
Dendrogram of cluster analysis of the source rocks and oils in the Chepaizi Uplift (using Ward’s method, between groups).
Distribution of effective source rocks
Not all source rocks could make a contribution to oil and gas reservoirs. Therefore, it is indispensable to investigate the base limit of the TOC values in the evaluation of source rocks. There are many arguments about the values of effective source rock, but there is no uniform base limit (Hunt, 1979; Peters and Cassa, 1994; Tissot and Welte, 1984). Effective source rocks emphasize that they can not only generate hydrocarbons, but also expel hydrocarbons. Only considering the hydrocarbon-generating potential has a shortcoming for evaluating the organic matter. Such as the discovery of immature oil and gas and the existence of effective source rocks with low abundance of organic matter (George and Ernest, 1989; Hunt, 1967; Pang et al., 2014). The base limit of TOC values should be applicable to the actual situation in different study area (Li et al., 2019). In this paper, effective source rocks and their burial depth are determined according to the theory of hydrocarbon expulsion threshold, which is verified from the perspective of hydrocarbon generation dynamics.
Determination of the hydrocarbon expulsion threshold
Generally, the source rocks could produce hydrocarbon when they reach certain conditions during burial. After the amount of hydrocarbon generation meets the needs of self-adsorption, pore water dissolution, capillary saturation, and other forms of residue, they could be expelled from the rocks in the form of free phase (Pang et al., 2004, 2014). Only those source rocks that can expel hydrocarbons from rocks can contribute to hydrocarbon accumulation. Even those source rocks that reach the base limit of the TOC but have lower TOC values (<0.5%) should not be excluded from the effective source rocks. The reason is that although they may not be the main contributors for reservoirs in the study area, they have important contributions to the formation and distribution of oil and gas reservoirs (Pang et al., 2004).
The source rocks characterized by same kerogen type and maturity show a good linear relationship between S1 (or S1 + S2, HI) and TOC before the hydrocarbon expulsion occurs. During the thermal evolution of the source rocks from the early stage to late stage, some parameters of the source rocks (S1 + S2, HI, S1) have the characteristics of first increasing and then decreasing corresponding to the TOC values. And the turning point from increasing to decreasing is considered as the hydrocarbon expulsion threshold. Similarly, some parameters, including (S1 + S2)/TOC and S1/TOC, first increase because of hydrocarbon-generation and then decrease due to hydrocarbon expulsion (Li et al., 2019; Pang et al., 2004,2014).
According to the way mentioned above, the hydrocarbon expulsion threshold of source rocks is determined. The (S1 + S2)/TOC and S1/TOC values have a similar variation trend corresponding to the TOC values, and the turning point is very close (Figure 13). Therefore, the base limit of the TOC values (0.5 wt.%) is reliable. In addition, most mudstones (87.5%) and tuff mudstones (72.7%) reach this threshold, while all tuff and siliceous samples are not in this region. It indicated mudstone samples and tuff mudstones have better hydrocarbon-generating potential compared with the tuff and siliceous samples in the study area.
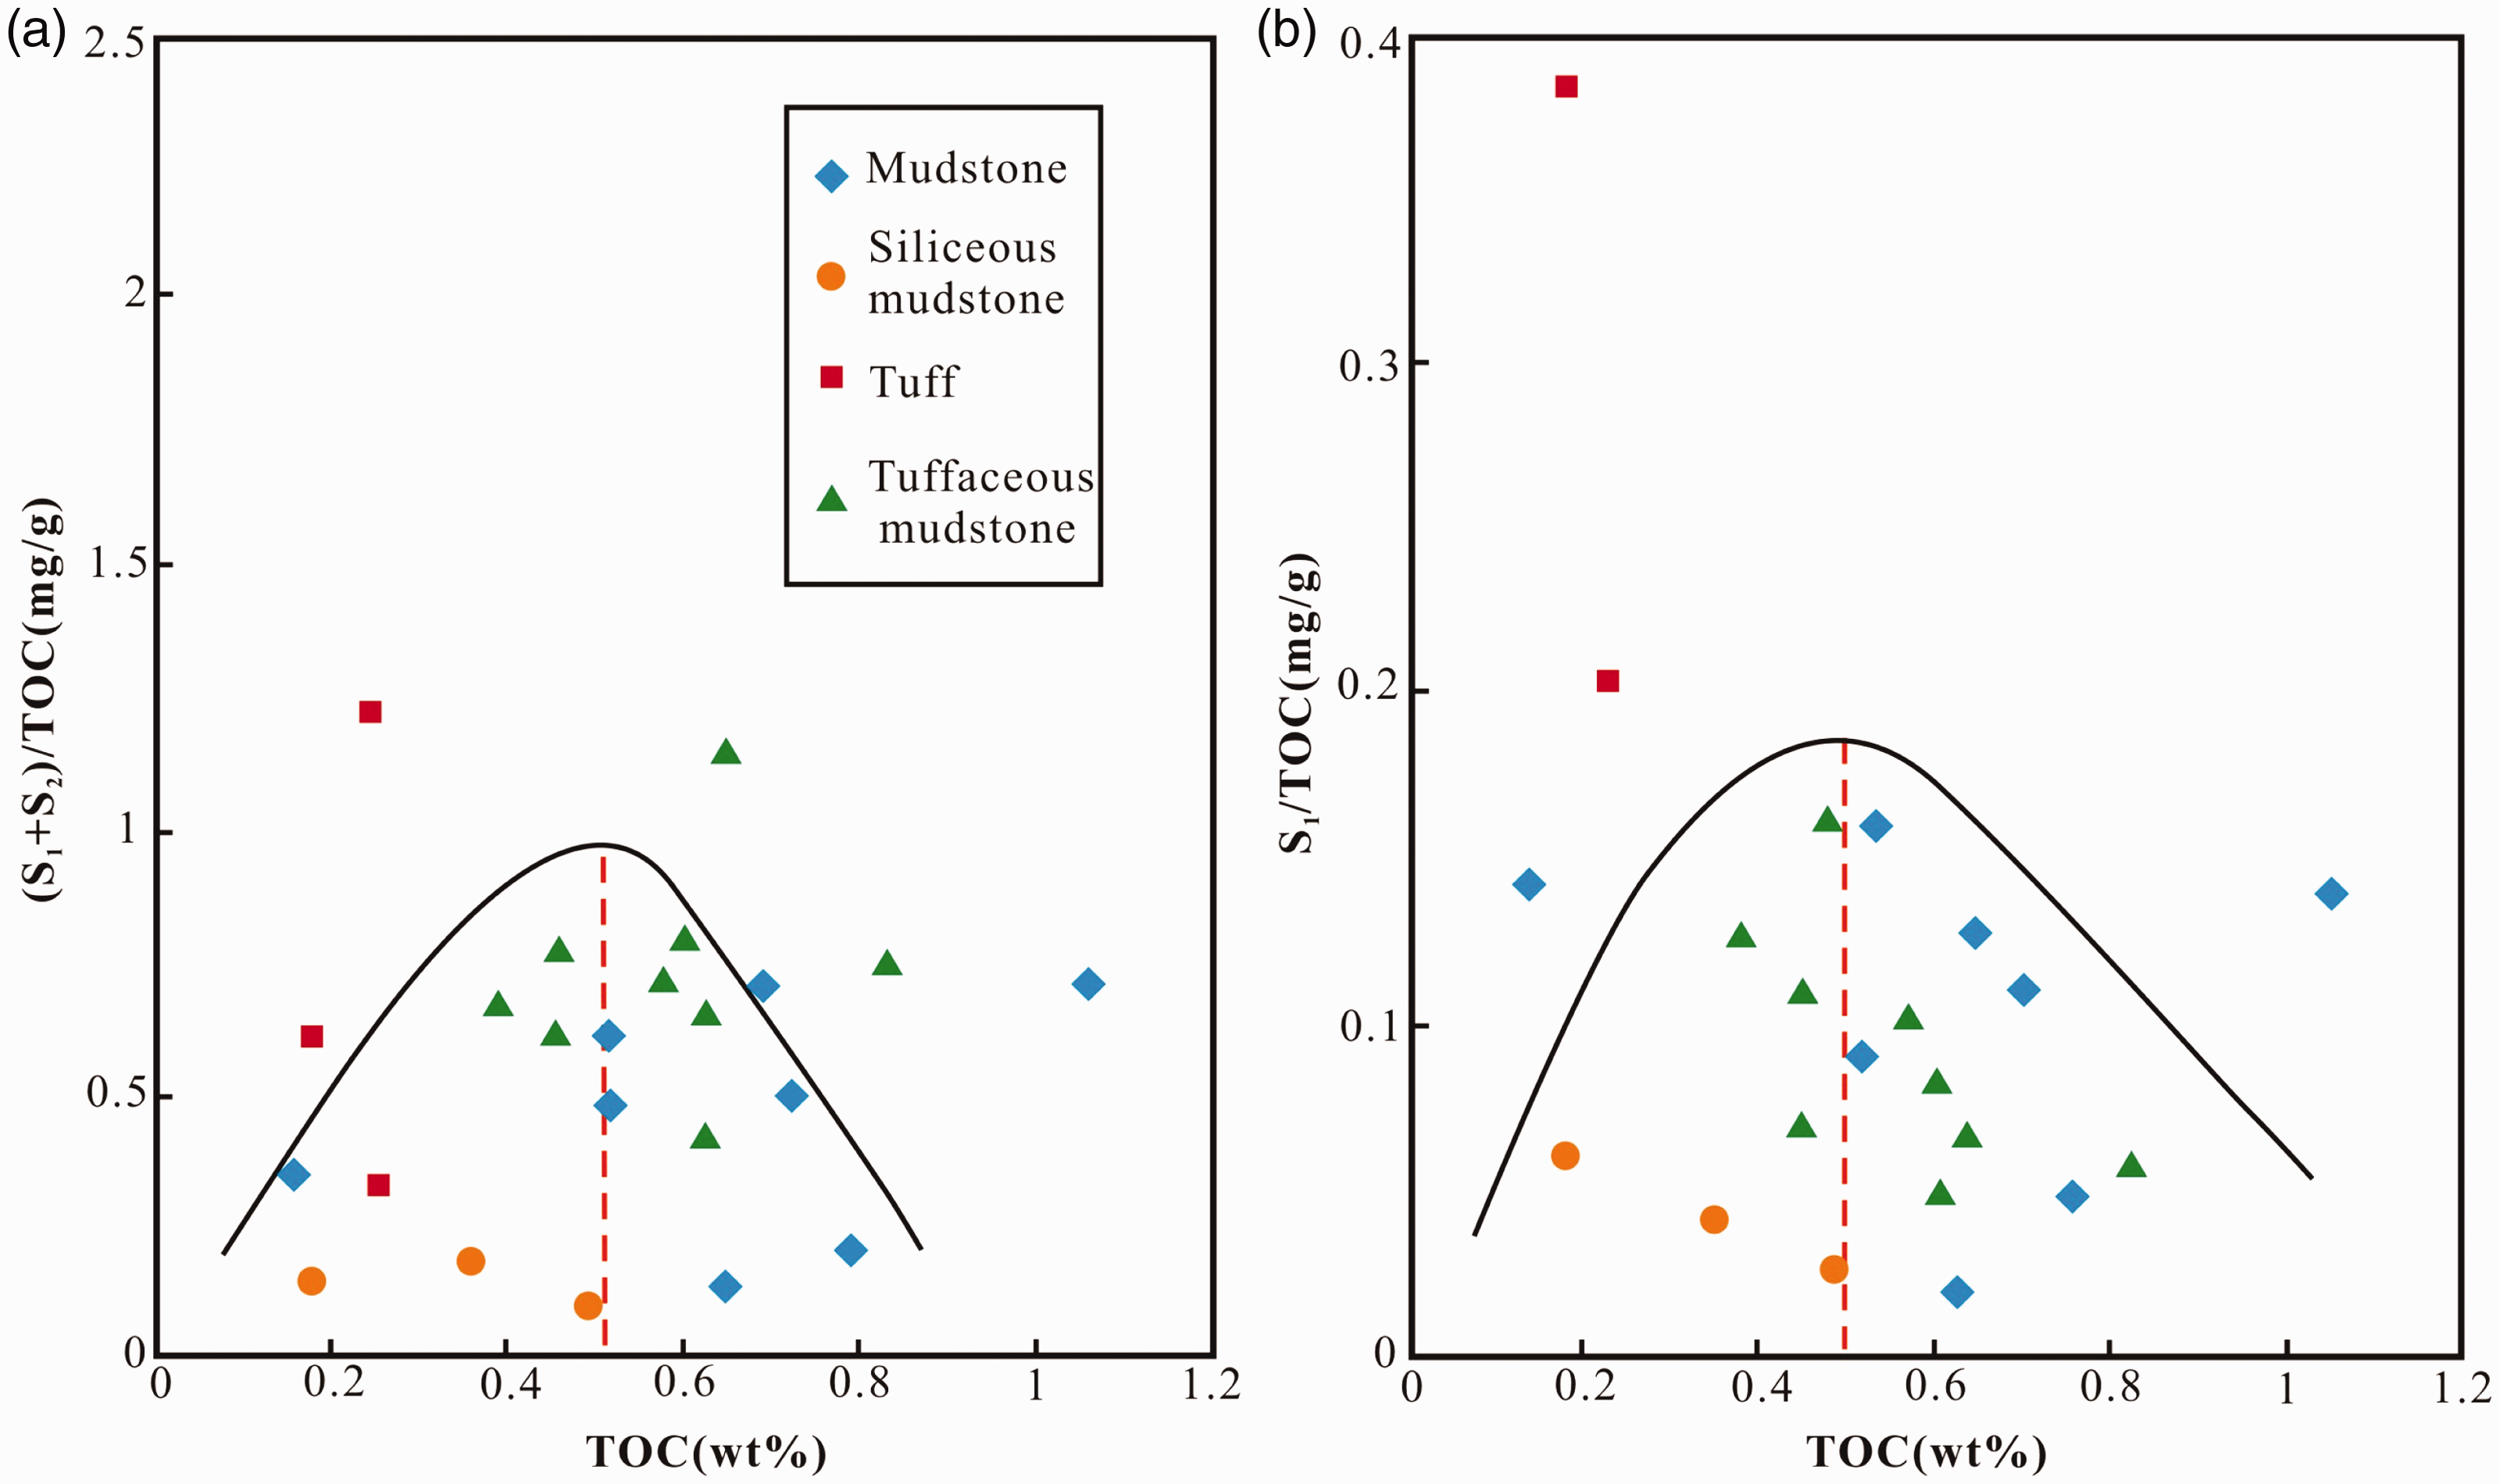
Plot of the (S1 + S2)/TOC versus TOC (a) and plot of the S1/TOC versus TOC (b) showing the base limit of TOC.
Based on this theory, the hydrocarbon expulsion threshold of the buried depth could be obtaind for effective source rocks. The trend line turns at the same point (about 1500 m) in Figure 14(a) and 14(b). Otherwise, the samples with a depth of more than 1500 m reached the mature stage for its high Tmax (Figure 14(c)) and good correlation with %Ro (Figure 5(a)). Therefore, we consider that source rocks that buried depth greater than 1500 m and have a TOC > 0.5 wt.% are effective source rocks (Figure 14(d)).
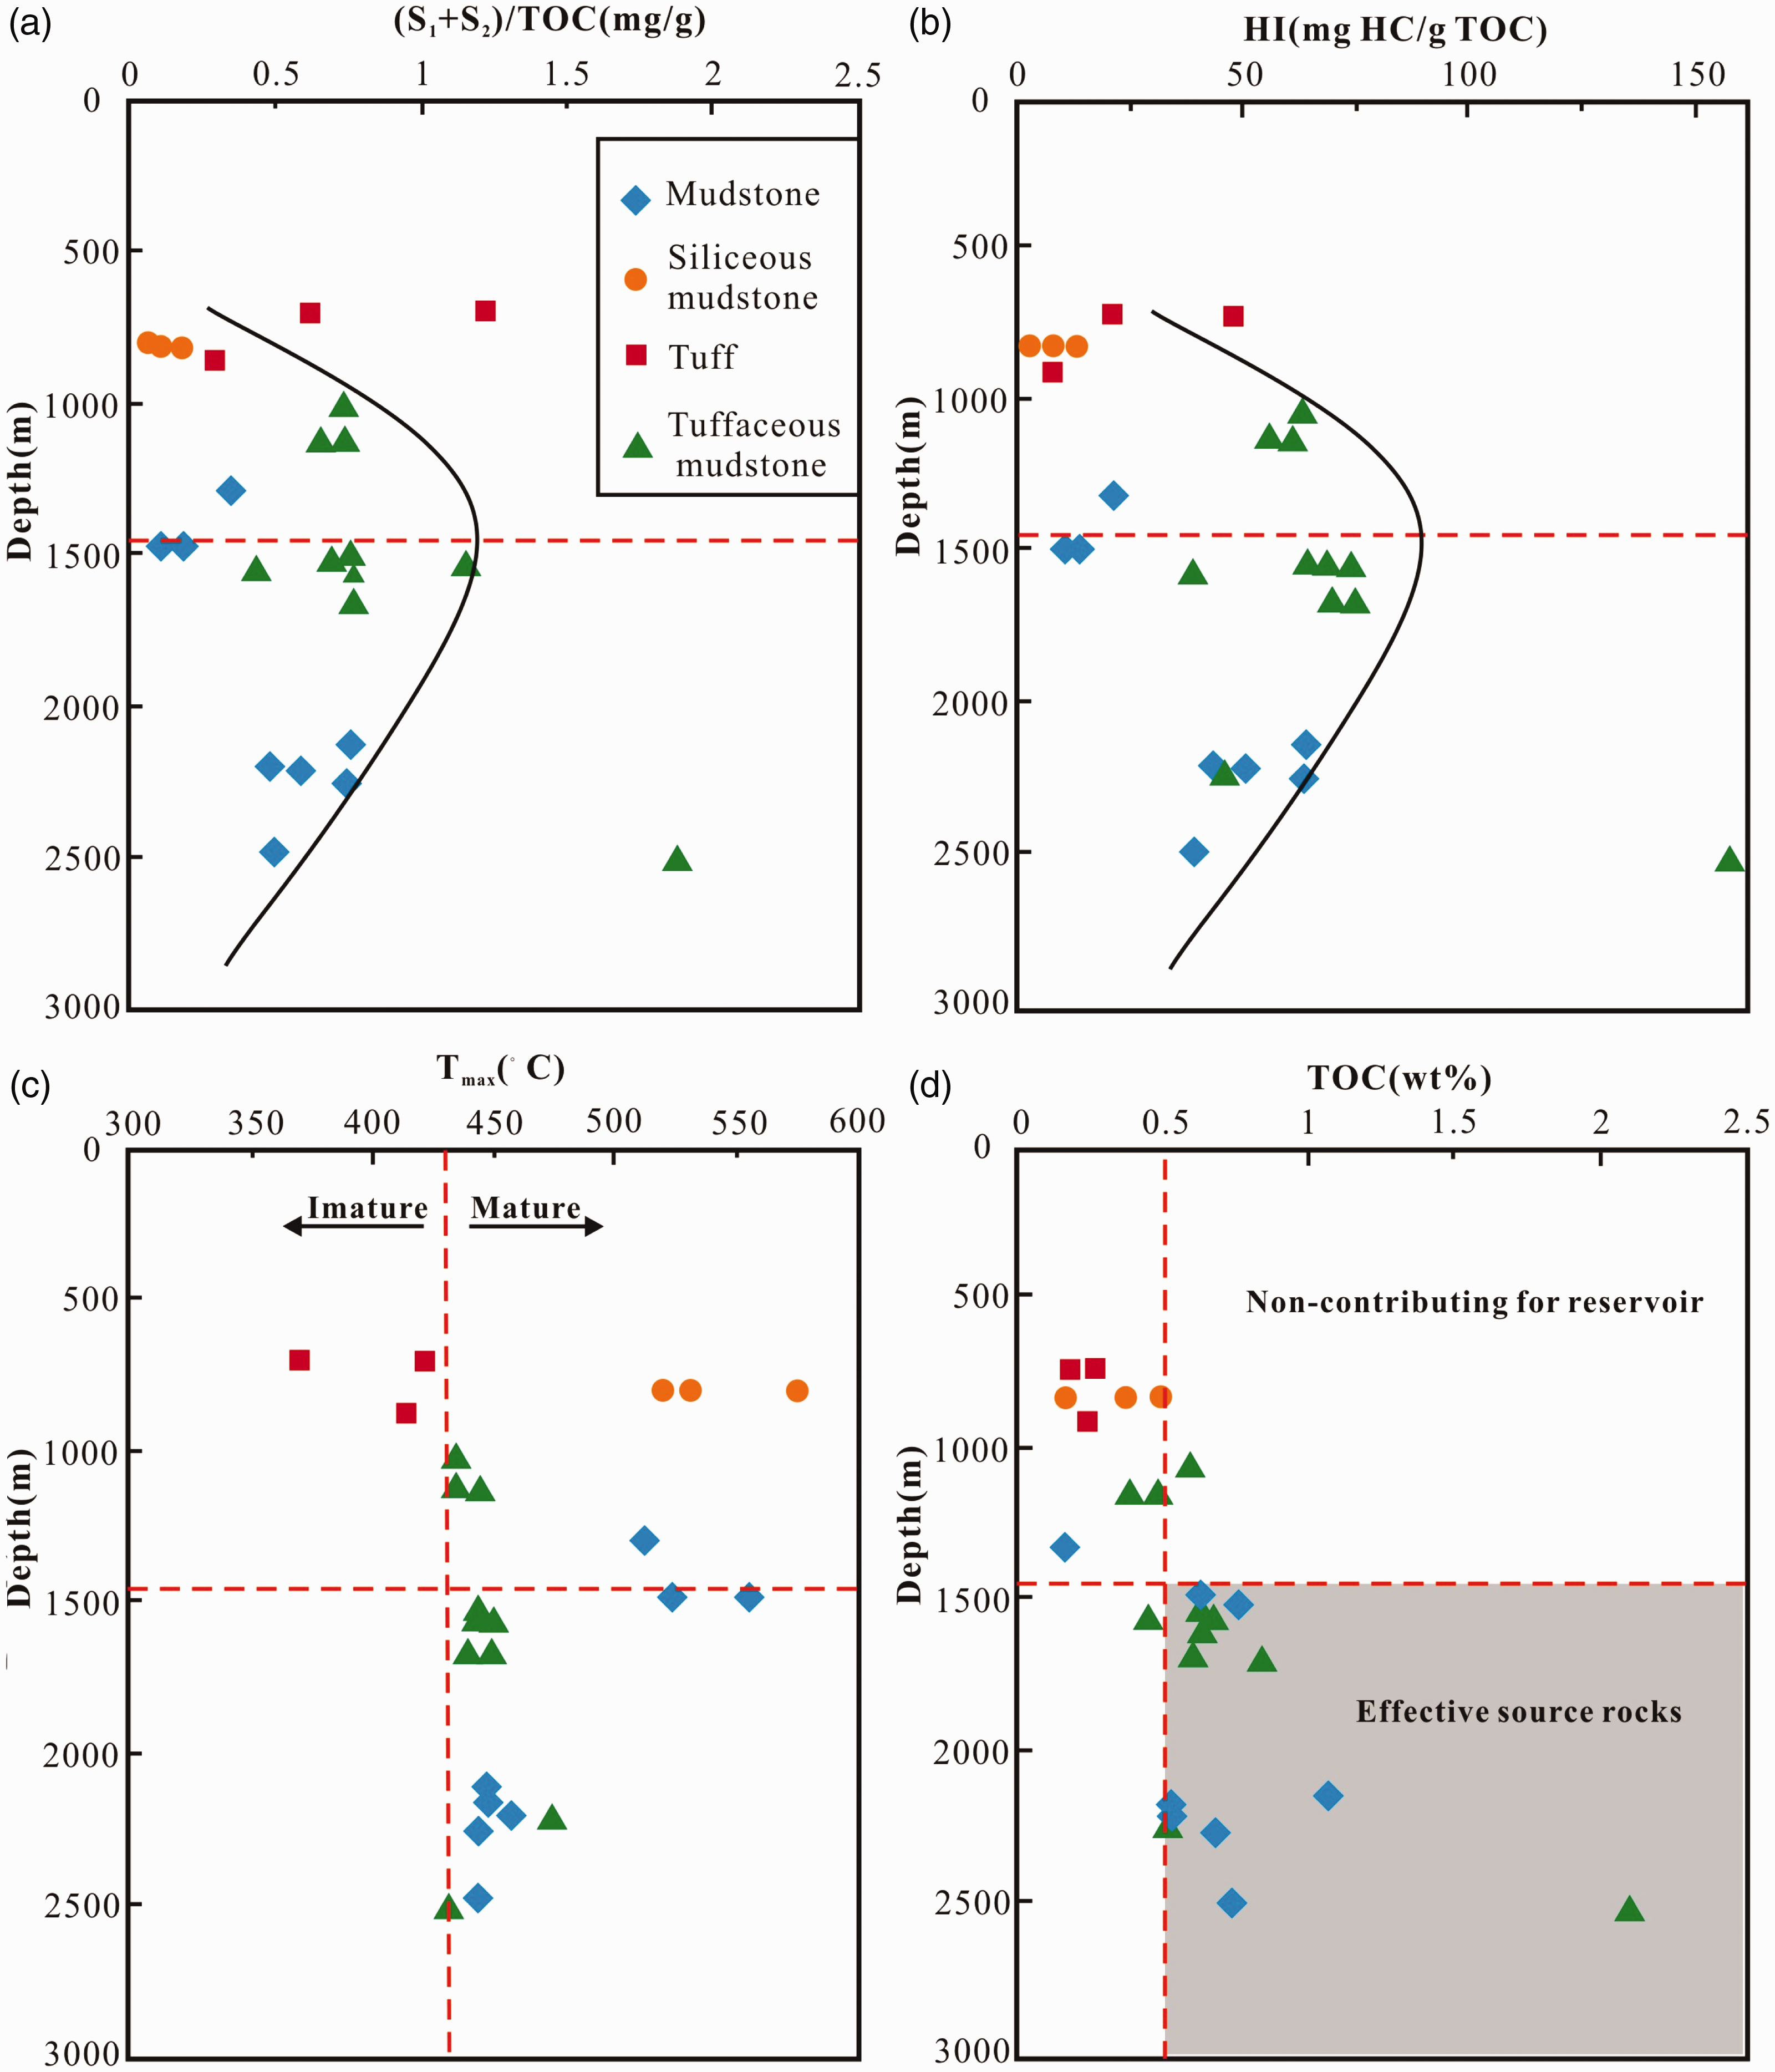
Plot of the (S1 + S2)/TOC, HI, Tmax and TOC versus buried depth of the samples determining effective source rocks.
Distinct kinetic types
It is not enough to evaluate source rocks only by Rock-Eval and TOC. Because the thermal stability of the source rocks samples was not considered, and it is closely related to the hydrocarbon generation dynamics of source rocks (Chen et al., 2017; Yan et al., 2014). The hydrocarbon generation capacity of the Carboniferous source rocks can be clearly demonstrated by comparing the main source rocks in the northwestern Junggar Basin, including the Permian mudstones in the Changji Sag and the Jurassic mudstones in the Sikeshu Sag.
Figure 15 compares the hydrocarbon generation kinetic characteristics, as well as the energy range of the main hydrocarbon generation period. The principal activation energy (Ea) values, to some extent, could reflect whether the source rock is prone to hydrocarbon generation (Figure 15(a)). The main frequency position of Ea is 240–260 KJ/mol. The higher hydrocarbon generation rate (HC%) of samples from sags are consistent with the conclusion of being the major contributors to oils. Both mudstone and tuffaceous mudstone from the Carboniferous formation show lower HC% compared with the samples from sags. Between them, tuffaceous mudstone has a better generation hydrocarbon capacity for its relative higher HC%.
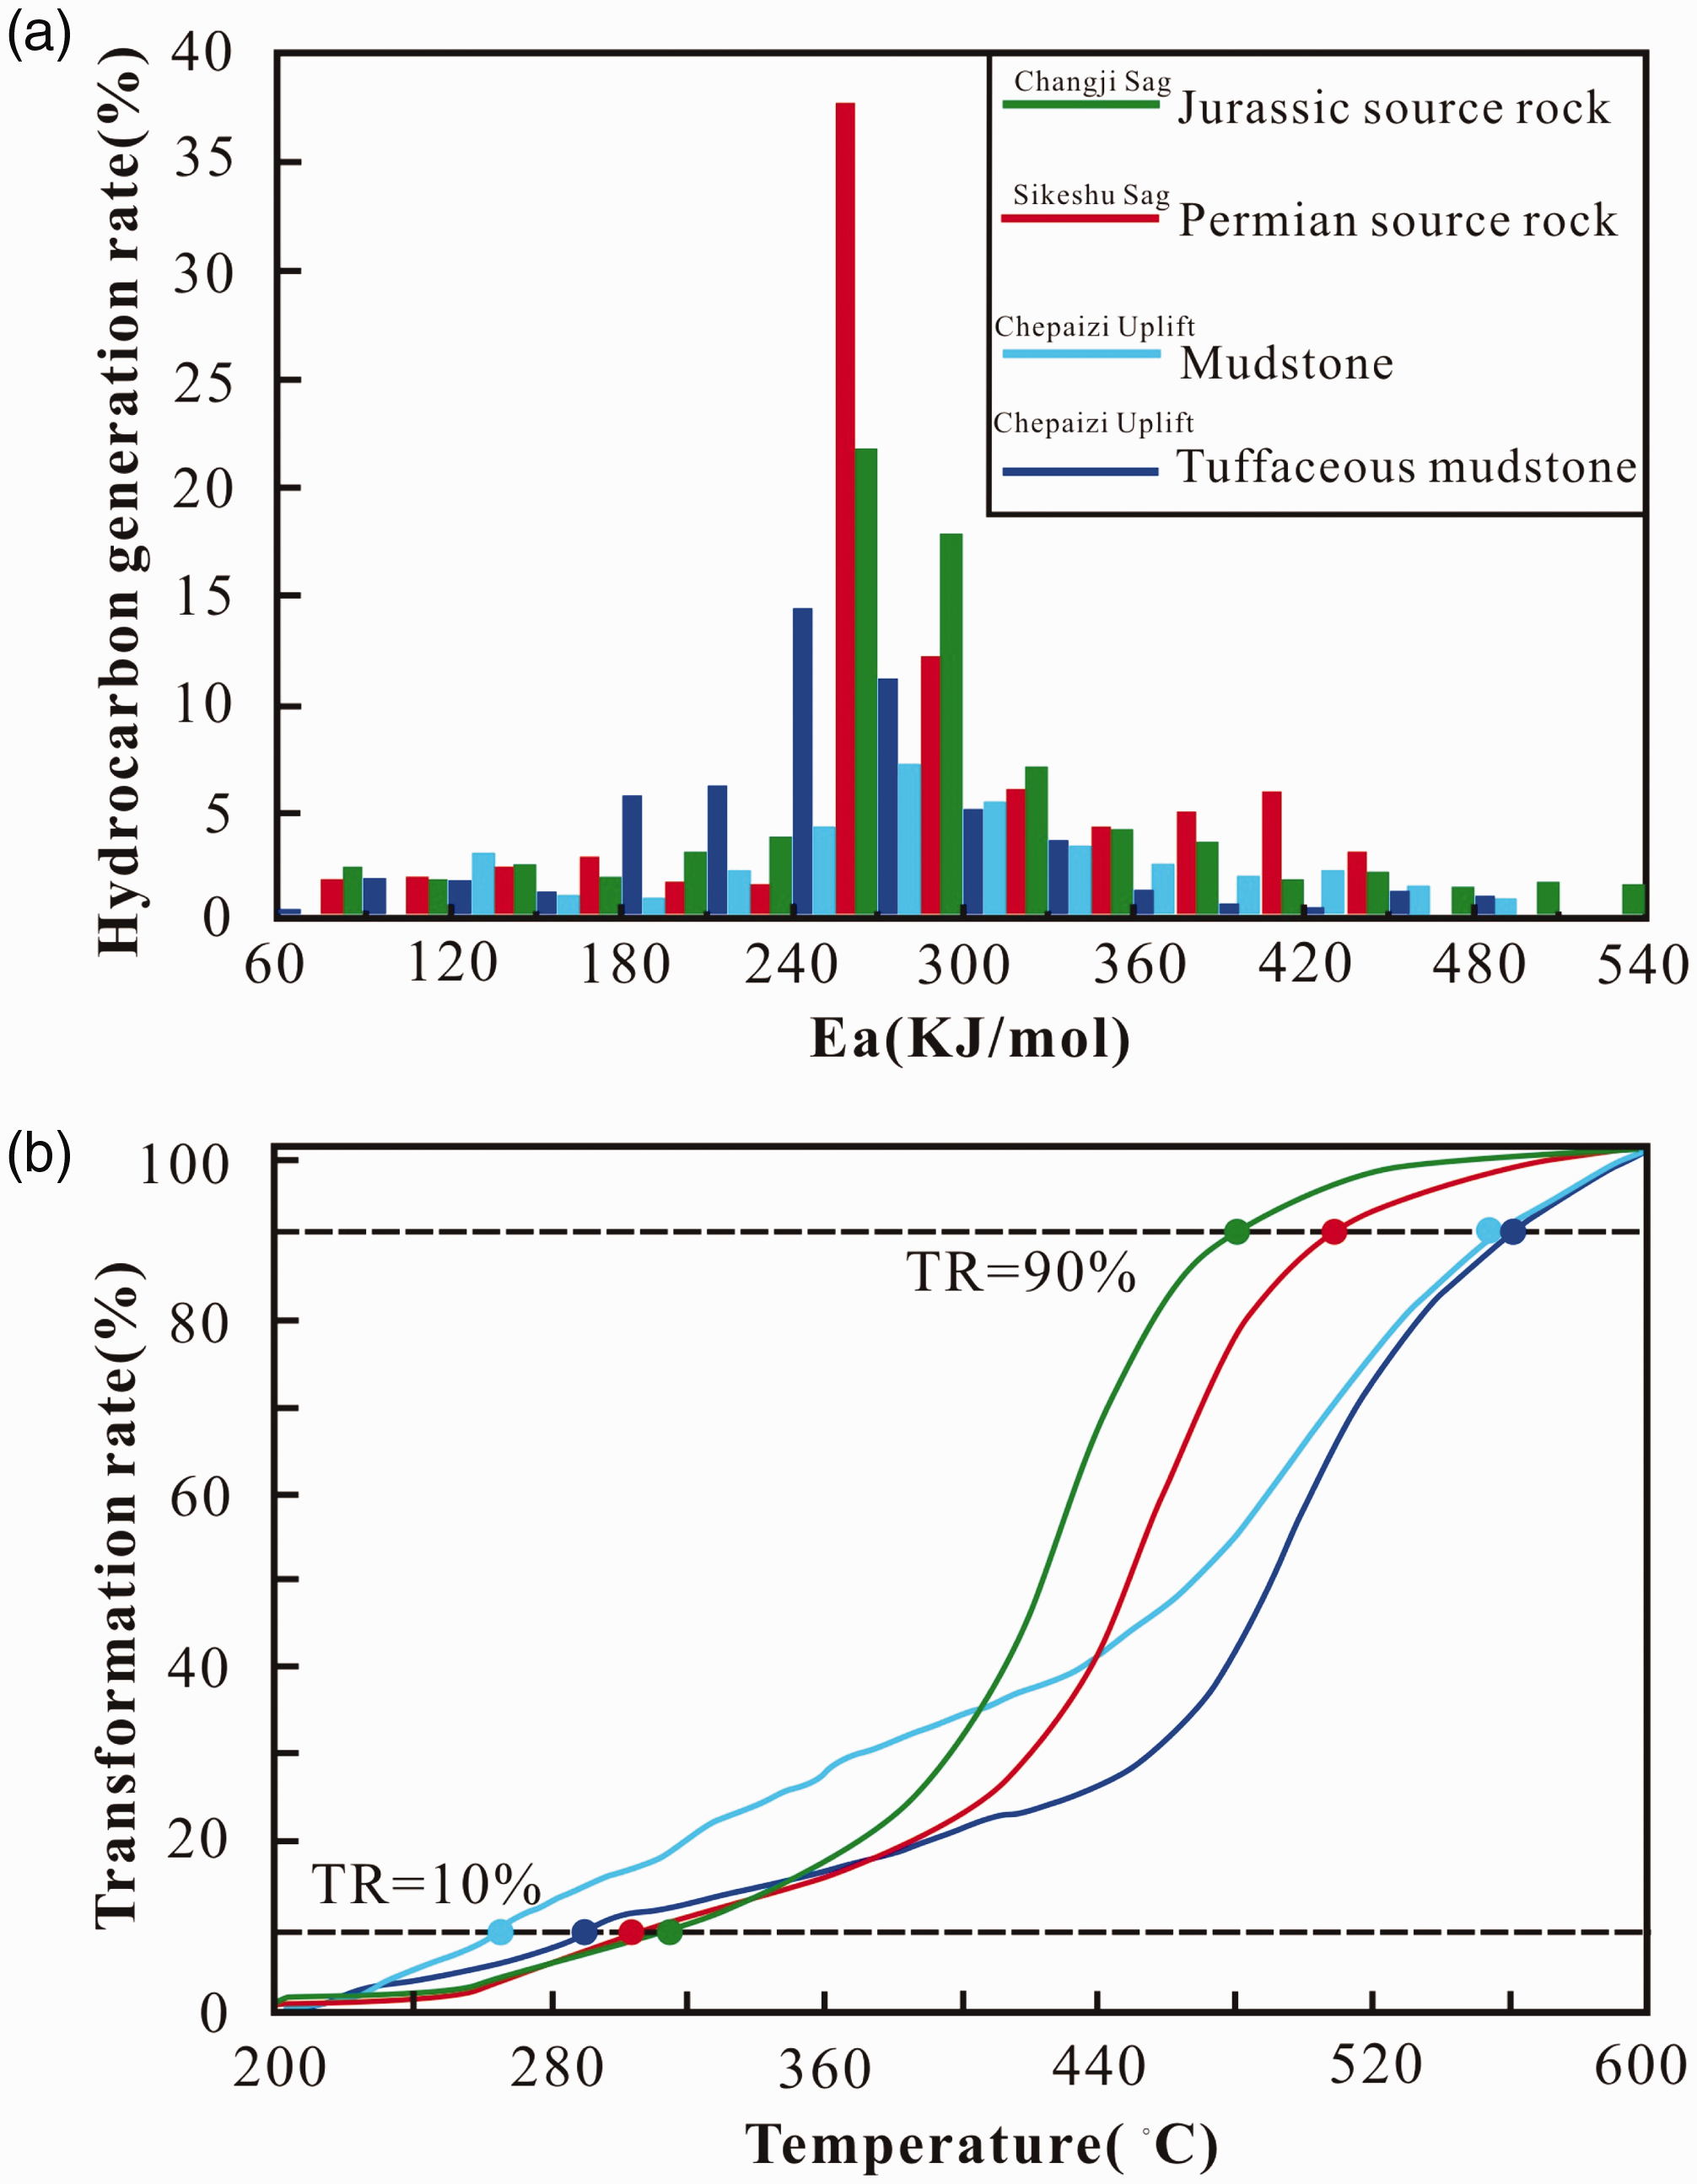
Characteristics of the hydrocarbon generation potential: (a) distribution of activation; (b) the change of the transformation ratio by temperature.
Figure 15(b) shows the change of the cumulative hydrocarbon generation rate (TR) with the temperature, which increased by 20°C every minute in the laboratory. The onsets of oil generation (TR = 10%) for the samples start at different temperature, which increased from samples of Chepaizi uplift to samples of sags, while the end of hydrocarbon generation temperature (TR = 90%) increased by the opposite way. The results indicate that samples of Chepaizi Uplift are characterized by a stronger ability of continuous hydrocarbon generation for their wider range of temperature.
Prediction of good source rocks
The Carboniferous source rocks were generally considered as poor generation potential by Rock-Eval analysis, but some deeper mudstone and tuffaceous mudstone samples showed good ability in producing hydrocarbon. The selected samples showed little difference in kerogen type and maturity, while they located in different kinetic groups, which is one of the reasons why they have different amounts in the pyrolysis process (Peters et al., 2005). From the perspective of geological conditions, the early Carboniferous formation was deposited in reducing marine environments, which lasted for a long time and benefited the development of source rocks (Jin et al., 2009; Yu et al., 2010). In addition, the thick tuffaceous mudstones in the Carboniferous interval provided a large number of minerals that were conducive to the reproduction and growth of organisms in the water (He et al., 2010). Although there is less drilling in the Lower Carboniferous strata, it was found that both the TOC content was improved with the deepening of formation depth according to existing samples (Figure 14). It indicates that the change of sedimentary environment affects the hydrocarbon generation capacity. Moreover, the samples buried deeper have good generation potential for locating different kinetic groups. Therefore, the Carboniferous source rocks especially that buried deeper which have been neglected for a long time have significant exploration potential.
Conclusion
The Carboniferous source rocks are dominated by Type III and II–III organic matter and reach mature stage. Among the rock samples natively developed in the Chepaizi Uplift, the mudstones and tuffaceous mudstones have a better hydrocarbon generation potential compared with tuff and siliceous mudstone samples. Biomarkers indicate that the Carboniferous source rocks were deposited in a marine environment under weakly reducing conditions and mainly received terrigenous organic matter.
The relationship between oils and source was investigated by multiparameter comprehensive analysis. The results show that the oils in the Chepaizi area can be clearly divided into two categories from the perspective of source. The eastern oils have positive correlation with the native Carboniferous source rocks.
It is essential and effective to investigate the hydrocarbon expulsion threshold and hydrocarbon generation dynamics of source rocks. The base limit of TOC values (0.5 wt.%) and the hydrocarbon expulsion threshold of buried depth (1500 m) are obtained. The effective source rocks start hydrocarbon generation with lower activation energy, and have strong ability in continuous hydrocarbon generation with considerable hydrocarbon production. Combined with the positive correlation of source–oils and the beneficial geological conditions, the native Carboniferous source rocks have great potential, especially the deeper mudstones and tuffaceous mudstones should be focused on.
Footnotes
Acknowledgements
We thank the Research Institute of Petroleum and Development of Shengli Oil Company for the approval of this publication. Associated Editor Dr. Cao Jian and anonymous reviewers were deeply acknowledged for their critical comments which greatly improved the early version of this paper.
Declaration of conflicting interests
The author(s) declared no potential conflicts of interest with respect to the research, authorship, and/or publication of this article.
Funding
The author(s) disclosed receipt of the following financial support for the research, authorship, and/or publication of this article: This study was supported by the National Natural Science Foundation of China (Grant No. 41772120), the Shandong Province Natural Science Fund for Distinguished Yong Scholars (Grant No. JQ201311), the SDUST Research Fund (Grant No. 2015TDJH101), and the Graduate Scientific and Technological Innovation Project supported by Shandong University of Science and Technology (Grant No. SDKDYC190313).