
Abstract
The predicted wind power in coastal waters is an important factor when planning and developing offshore wind farms. The stochastic wind field challenges the accuracy of these predictions. Using single-point wind measurements, most previous studies have focused on the prediction of short-term wind power, ranging from minutes to several days. Longer-term wind power predictions would better support decision-making related to offshore wind power balance management and reserve capacities. In addition, larger-scale wind power predictions, based on gridded wind field data, would provide a more comprehensive understanding of the spatiotemporal variations of wind energy resources. In this study, a spatiotemporal ordinary kriging model was developed to predict the offshore wind power density on a monthly basis using the cross-calibrated multiplatform gridded wind field data. The spatiotemporal variations of wind power density were directly quantified through the development of spatiotemporal variograms that integrated spatial and temporal distances. The proposed model achieved a notable performance with an overall R2 of 0.94 and a relative prediction error of 16.35% in the validation experiment of predicting the monthly wind power density from 2013 in the coastal waters of China’s Guangdong Province. Using this model, the spatial distributions of wind power density along Guangdong’s coastal waters at monthly, seasonal, and annual time-scales from 2013 were accurately predicted. The experiment results demonstrated the remarkable potential of the spatiotemporal ordinary kriging model to provide reliable long-term prediction for offshore wind energy resources.
Keywords
Introduction
Development of new renewable clean energy resources, such as wind energy, is one of the most effective ways to reduce excessive traditional energy consumption and control greenhouse gas emissions and global warming. In general, offshore areas contain relatively rich and stable wind energy resources compared to onshore areas (Zheng et al., 2012). Offshore wind has enormous potential in many regions, as many countries search for competitive, zero-carbon energy sources that can be deployed relatively quickly and at a large scale (Global Wind Energy Council (GWEC), 2018). However, the uncertain and intermittent nature of wind field can make power system operations and planning challenging (Jung and Broadwater, 2014). Thus, the industrialization and large-scale utilization of offshore wind energy resources require a comprehensive understanding of the spatial and temporal characteristics of sea surface wind fields. In response to these challenges, wind power prediction can be used to improve the balance management and capacity planning of wind power generation (Tascikaraoglu and Uzunoglu, 2014).
Previous studies have focused on developing statistical methods such as autoregressive moving average, artificial neural networks, and support vector machines to predict short-term wind speed or wind power, ranging from minutes to several days (Amjady et al., 2011; Chen et al., 2014; Li et al., 2018; Liang et al., 2016; Okumus and Dinler, 2016; Shi et al., 2011; Xu et al., 2015; Zhou et al., 2011). However, medium- to long-term trends of wind energy resources are also important to support long-term planning of wind energy developments and power markets (Zheng et al., 2016). It is generally more difficult to achieve long-term prediction, and the approaches designed for short prediction horizons may be deficient for longer terms with respect to prediction performance (Tascikaraoglu and Uzunoglu, 2014). Therefore, specialized methods for long-term wind power prediction are required.
In addition, previous studies have relied upon high-precision single-point wind measurements from buoys or island stations to support short-term predictions of wind speed or wind power (Aghajani et al., 2016; Azad et al., 2014; Cai et al., 2019; Lahouar and Slama, 2017; Li et al., 2018; Liu et al., 2018). This isolated data limit the understanding of the spatial and temporal characteristics of sea surface wind fields and their respective correlations. Alternatively stated, most of the existing prediction methods consider wind power at a specific turbine site, without properly accounting for the spatiotemporal dependence structure in the wind power generation field (Ye et al., 2017). Kim et al. (2017) used remotely sensed sea surface temperatures to statistically hindcast monthly offshore wind speed and wind power density (WPD). The correlations between monthly wind speed and sea surface temperature were analyzed at different time lags but the autocorrelations were still ignored. The correlation analysis between power outputs of wind turbines revealed that high and low levels of correlation for wind farms spaced <100 and >200 km apart, respectively (Holttinen, 2005). Strong autocorrelations are generally found in the distribution of wind energy resources. However, long-term offshore wind power prediction methods, which can take full advantage of the spatiotemporal autocorrelation of WPD, are currently lacking. Furthermore, the lack of larger-scale, dispersed data to support the statistical autocorrelation analysis may impair the prediction performance.
To address the methodological shortcomings of wind power prediction, spatiotemporal kriging—an extension of spatial kriging—can provide an accurate prediction of spatially and temporally correlated variables through the quantification of spatiotemporal autocorrelations or variations (Cressie and Wikle, 2015). Spatiotemporal kriging has recently demonstrated good predictive performance in meteorological and environmental fields (Hengl et al., 2012; Heuvelink and Griffith, 2010; Kilibarda et al., 2014).
To address the data-related shortcomings of high-precision single-point measurements for wind power prediction, both satellite-based microwave remote sensing and numerical simulation are capable of providing gridded sea surface wind field data that provide a more comprehensive understanding of the spatial and temporal variations of wind energy resources in large-scale offshore areas. Achieving this same level of understanding of the sea surface wind field from a limited number of single-point wind measurements would be difficult. The cross-calibrated multiplatform (CCMP) wind field data—produced through the fusion of satellite, moored buoy, and modeled wind data—is one of the most widely used gridded wind analysis products (Atlas et al., 2011; Wentz et al., 2015). The CCMP product provides 6-h ocean vector wind field data on a 0.25° × 0.25° global grid. Zheng and Pan (2014) previously used this product to develop a grade classification map of global ocean wind energy resources. McGregor et al. (2017) recently evaluated two versions of CCMP wind products in the Tropical Pacific, and identified factors that influence the skill of synthesized wind products in terms of mean and trend estimates.
In this study, a spatiotemporal ordinary kriging (STOK) model was developed to predict the offshore WPD on a monthly basis using the CCMP-gridded wind field data. Subsequently, the seasonal and annual offshore WPD values were respectively obtained through average calculations. The spatiotemporal variations of the WPD were directly quantified in the process of model development through the creation of spatiotemporal variogram integrating spatial and temporal distances. To validate the proposed STOK model, the predicted and observed WPD values were compared at monthly, seasonal, and annual time-scales from 2013 in the coastal waters of China’s Guangdong Province.
Materials and methods
Study area
China’s offshore areas offer significant potential for wind energy development. In 2018, China implemented more offshore capacity (1.8 GW) than any other country for the first time (GWEC, 2018). In this study, the coastal waters along China’s Guangdong Province were considered. The Guangdong Government has recently launched a series of offshore wind power projects in key regions with the aim of improving the power generation infrastructure and using offshore wind energy resources in an intensive and sustainable way. Development of an accurate long-term wind power prediction method would be particularly beneficial for Guangdong Province.
Figure 1 depicts the study area as projected into zone 49 N of the Universal Transverse Mercator (UTM) coordinate system using the World Geodetic System 1984 (WGS84). Guangdong Province—with 4114 km of coastline and 419,300 km2 of sea area—has a subtropical and south subtropical maritime monsoon climate that, when combined with specific geographical features, produces a distinctive pattern of high and frequent offshore winds.
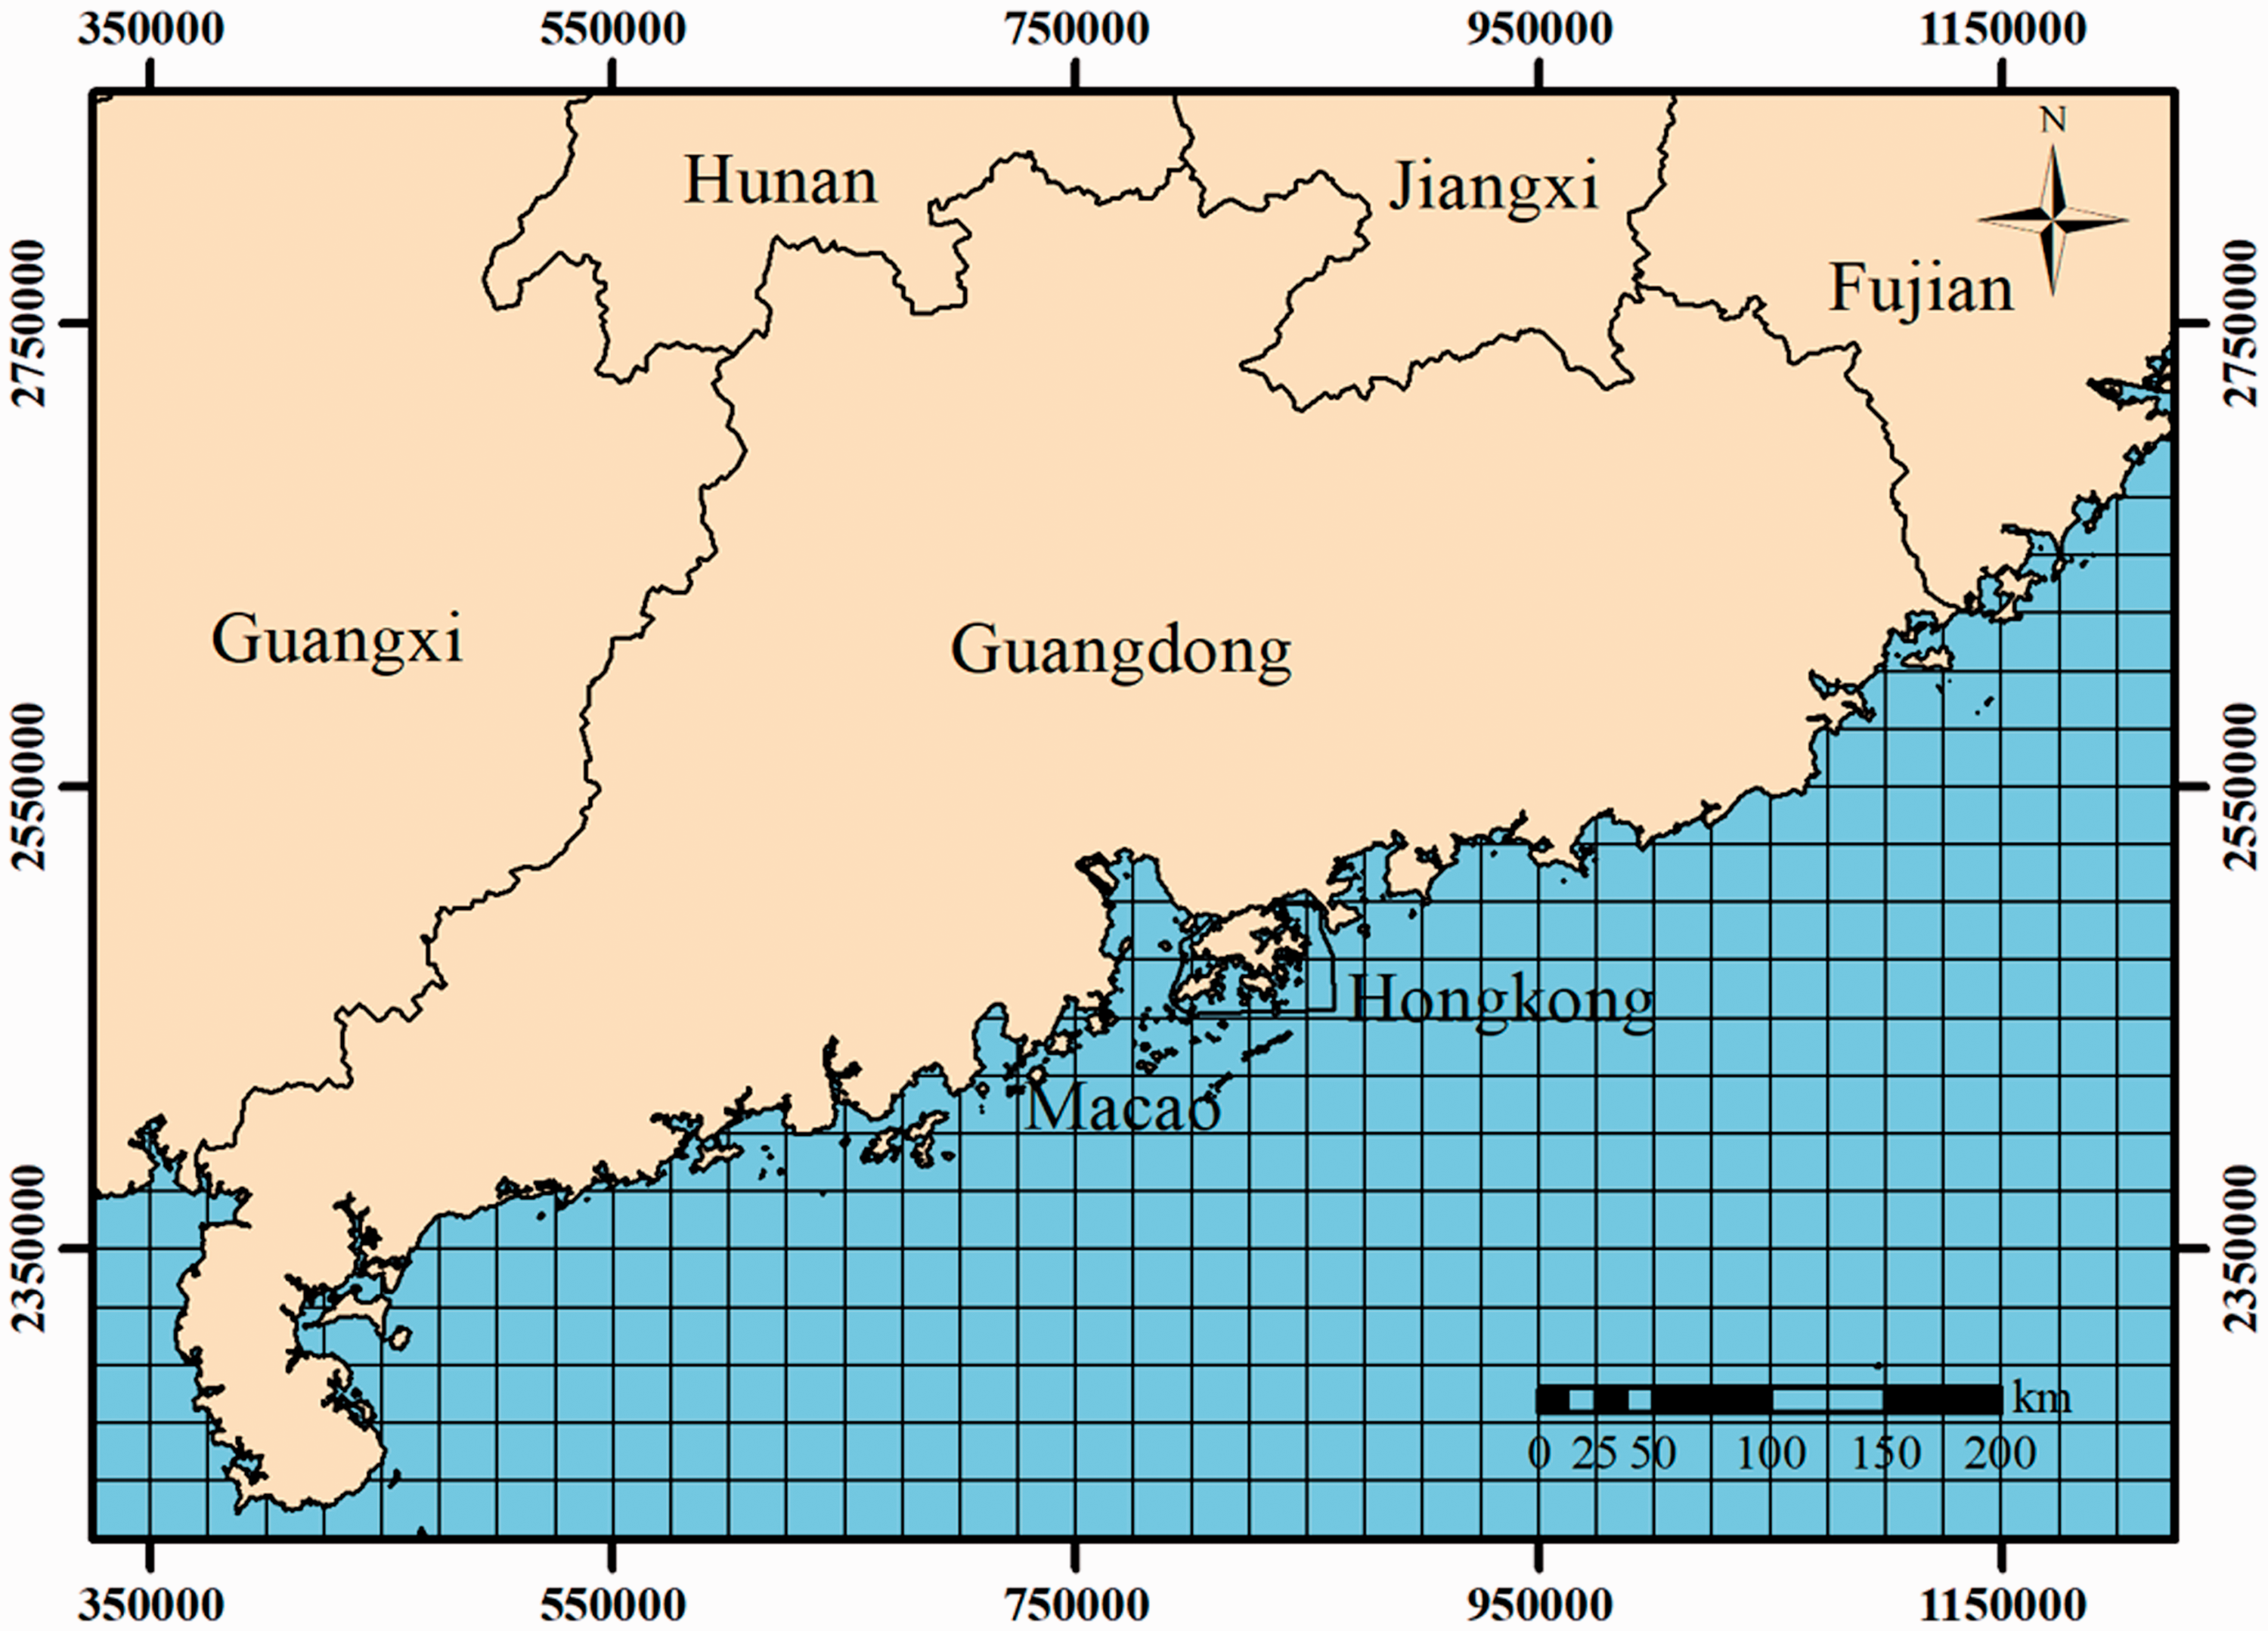
Coastal waters along China’s Guangdong Province.
CCMP wind field data
The CCMP (Version 2.0) gridded surface vector wind analysis product was available from Remote Sensing Systems for offshore WPD calculations. The CCMP data were derived through the cross-calibration and assimilation of ocean surface wind data from various microwave radiometer instrument platforms including the Special Sensor Microwave/Imager, Special Sensor Microwave Imager/Sounder, Advanced Microwave Scanning Radiometer, Tropical Rainfall Measuring Mission’s Microwave Imager, WindSat, and Global Precipitation Measurement Microwave Imager and various microwave scatterometers including the Quick Scatterometer and Advanced Scatterometer. Both radiometer and scatterometer data were validated against ocean moored buoys. The European Center for Medium-Range Weather Forecasts (ECMWF) Reanalysis (ERA)-Interim Reanalysis winds were used in the CCMP processing as the first-guess wind field.
The CCMP wind analysis product combined the cross-calibrated satellite microwave, moored buoy, and ERA-Interim Reanalysis wind fields using a variational analysis method to produce 6-h ocean vector wind field data on a 0.25°×0.25° global grid. To ease calculation of the spatial distances in this study, the CCMP data were projected into UTM/WGS84 49 N consistent with the study area (Figure 1) at a spatial resolution of 25 km.
Methods
Figure 2 shows the workflow of the STOK model for long-term offshore WPD prediction. First, historical CCMP wind field data (2003–2012) were used to produce monthly offshore WPD values that populated a training dataset. Next, the offshore WPD training dataset was used to infer empirical spatial and temporal variograms. Corresponding theoretical spatial and temporal variograms were fitted to obtain a spatiotemporal product–sum variogram. Finally, based on a customized spatiotemporal neighborhood, monthly offshore WPD values for 2013 were predicted using the STOK model. The seasonal and annual offshore WPD values were calculated as the averages of monthly predictions. To validate the proposed STOK model, predicted offshore WPD values were compared with observed WPD values at monthly, seasonal, and annual time-scales from 2013 in the coastal waters of Guangdong Province. A more detailed description of the STOK model development and validation processes follows.
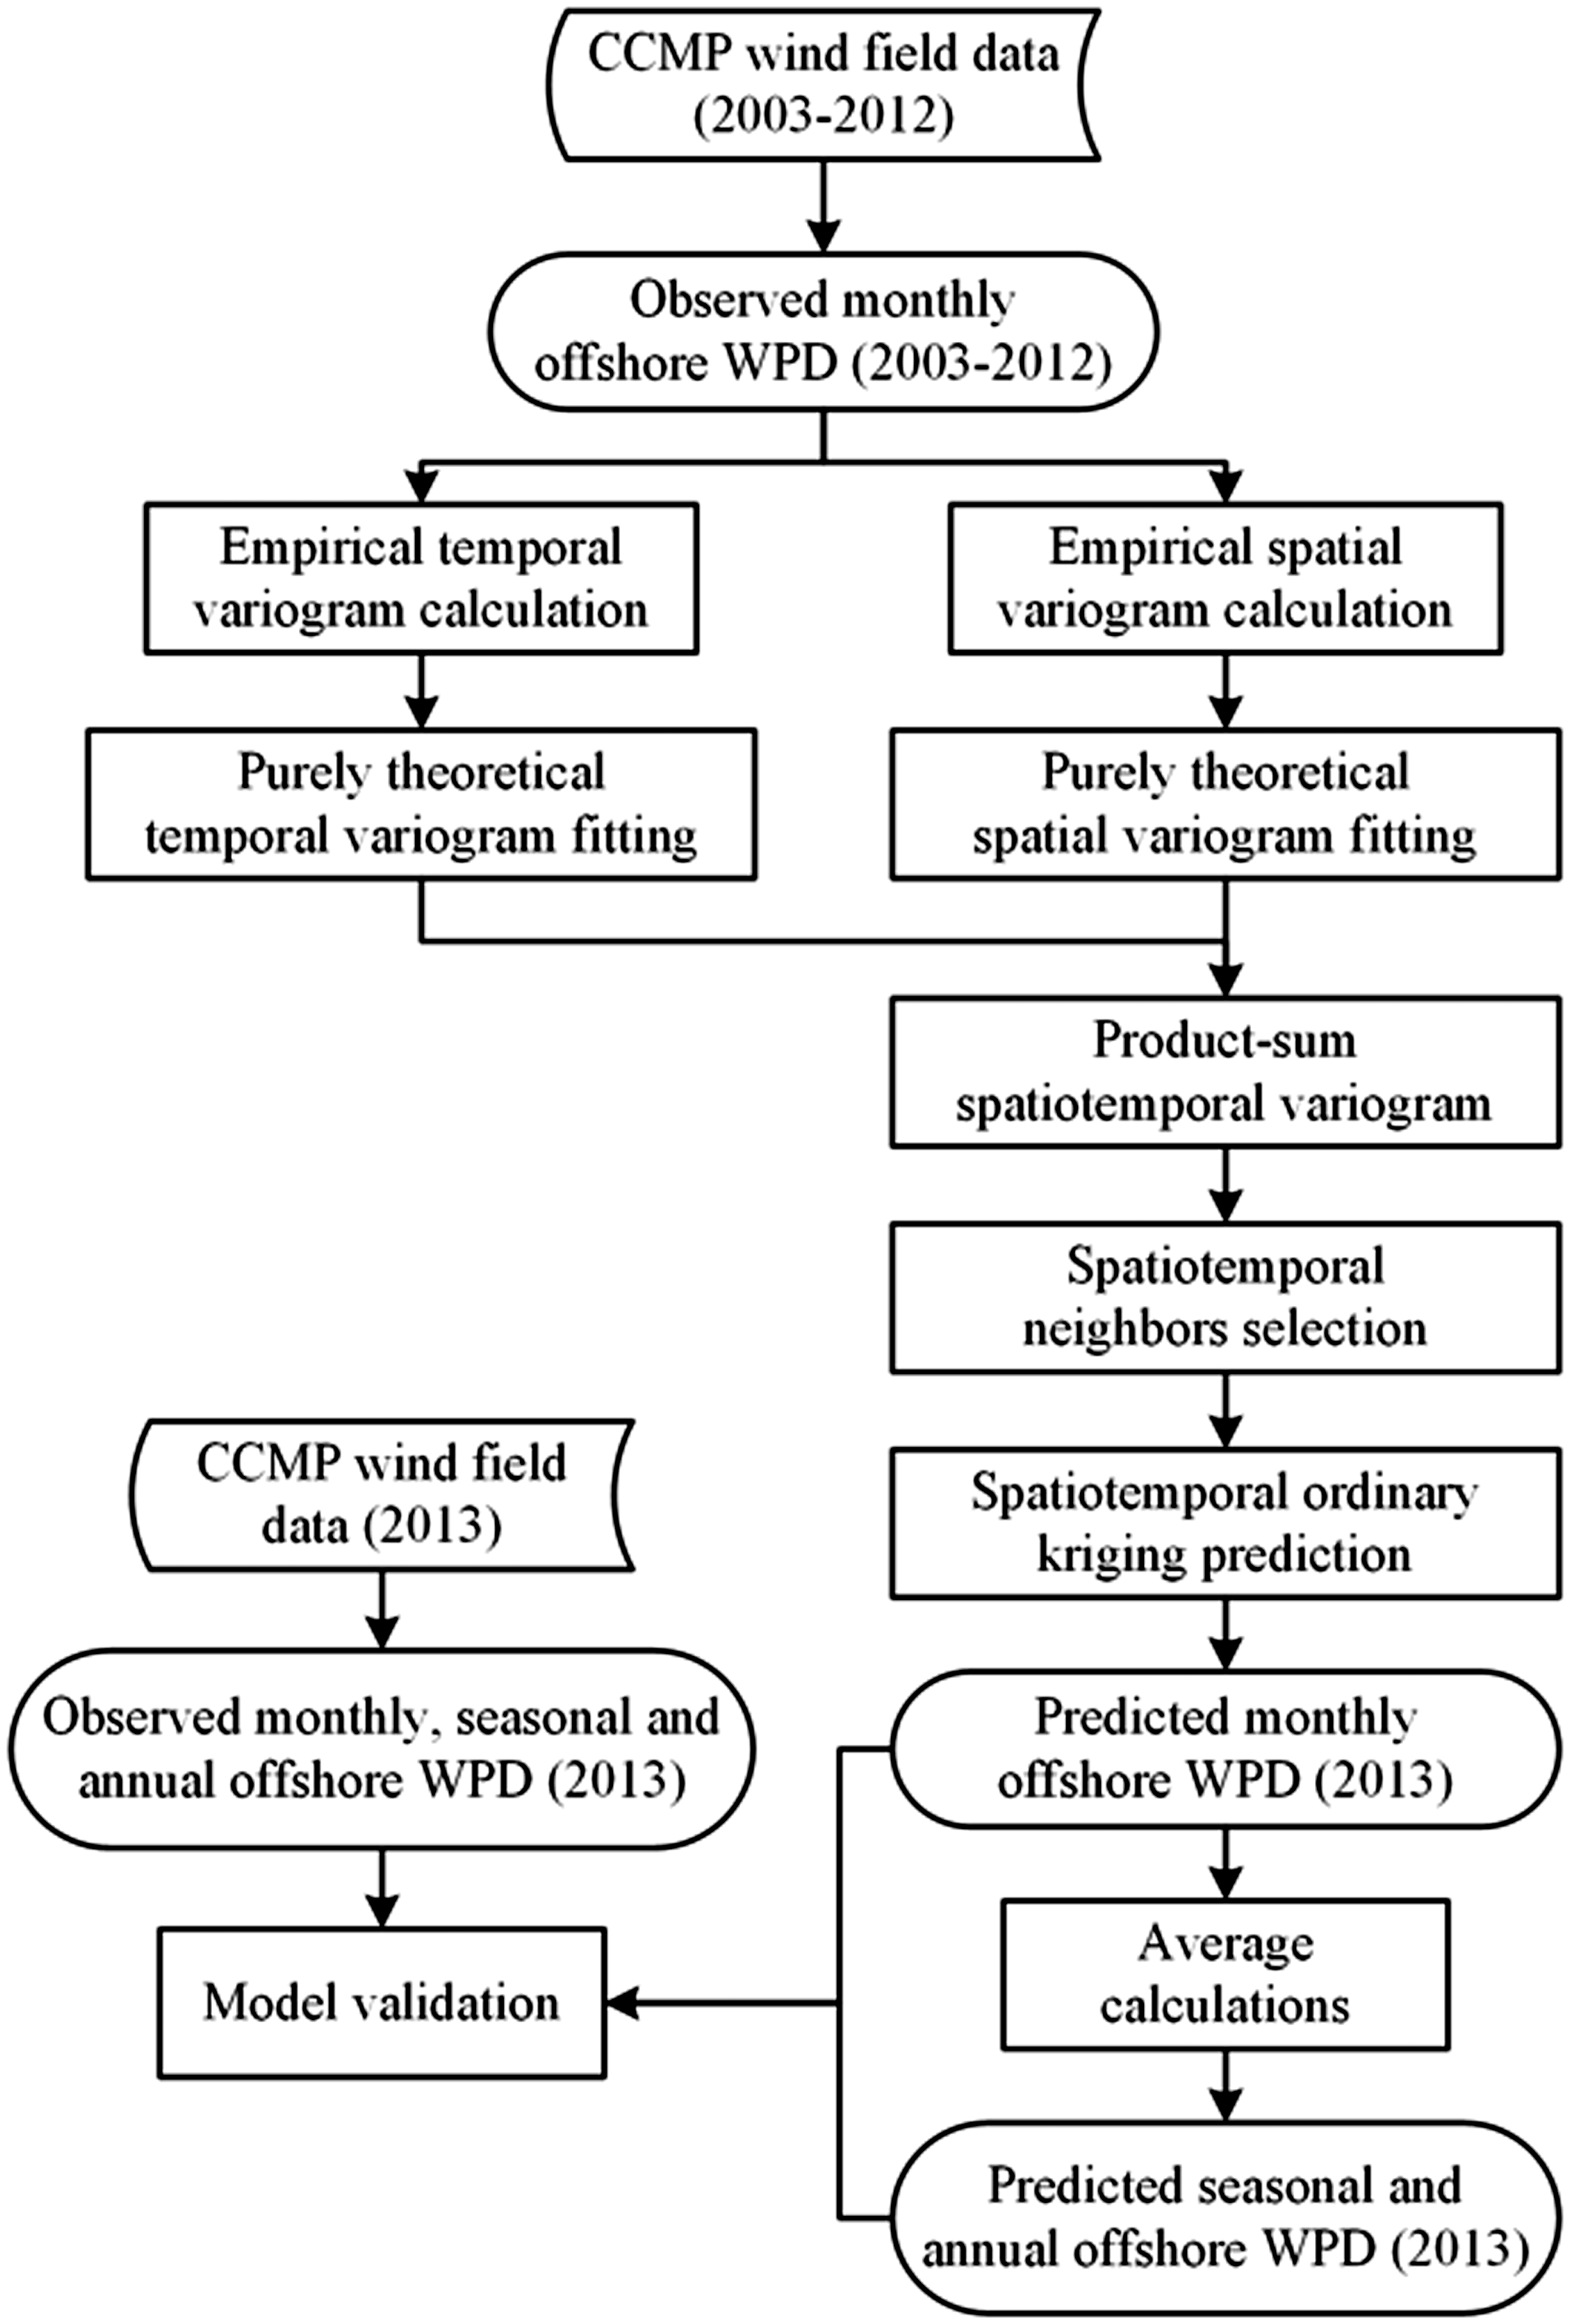
Workflow of the STOK model for long-term offshore WPD prediction.
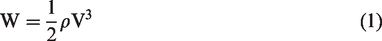
WPD calculation
The WPD values were calculated as follows
STOK model development
According to the regionalized variable theory, the spatiotemporal characteristics of monthly offshore WPD were assumed intrinsically stationary
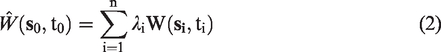
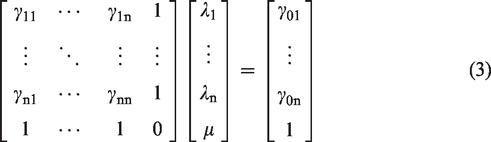
In theory, the STOK model provides the best unbiased predictions at these unobserved spatiotemporal locations (i.e. the estimator’s expected value is equal to the true value, and the prediction error variance is minimized). Based on this feature of the STOK model, a system of linear equations was developed in matrix form to derive the weight coefficients as follows
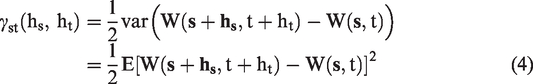
In practice, the empirical spatiotemporal variogram values
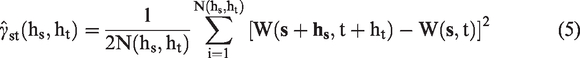
Various spatiotemporal variogram models have been previously developed to account for the differences and correlations between space and time dimensions. In this study, a product–sum model was adopted as follows (De Cesare et al., 2001)

Prediction of the monthly offshore WPD values using the STOK model was performed in the R environment for statistical computing. The gstat package provides full-featured functions for geostatistical modeling, including empirical variogram computing, theoretical variogram model fitting, and spatiotemporal kriging interpolation (Graler et al., 2016; Pebesma, 2004). The companion rgdal package was used for raster data input and output (Bivand et al., 2019).
Evaluation criteria
To assess the prediction performance of the STOK model, a set of accuracy indicators were considered, including the root mean square error (RMSE), mean error (ME), and coefficient of determination (R2). The relative prediction error (RPE), which is the ratio between the RMSE and the mean observed WPD, was used to compare the prediction accuracy by months or individual grid cells. These indicators were calculated as follows
Results and discussion
Empirical and theoretical spatial, temporal, and spatiotemporal variograms
In January 2003 to December 2012 (120 months), 82,080 grid-based offshore WPD measurements were collected in the coastal waters of Guangdong Province to support calculation of the empirical spatial and temporal variograms and their fitted theoretical models. Figure 3 depicts these results.
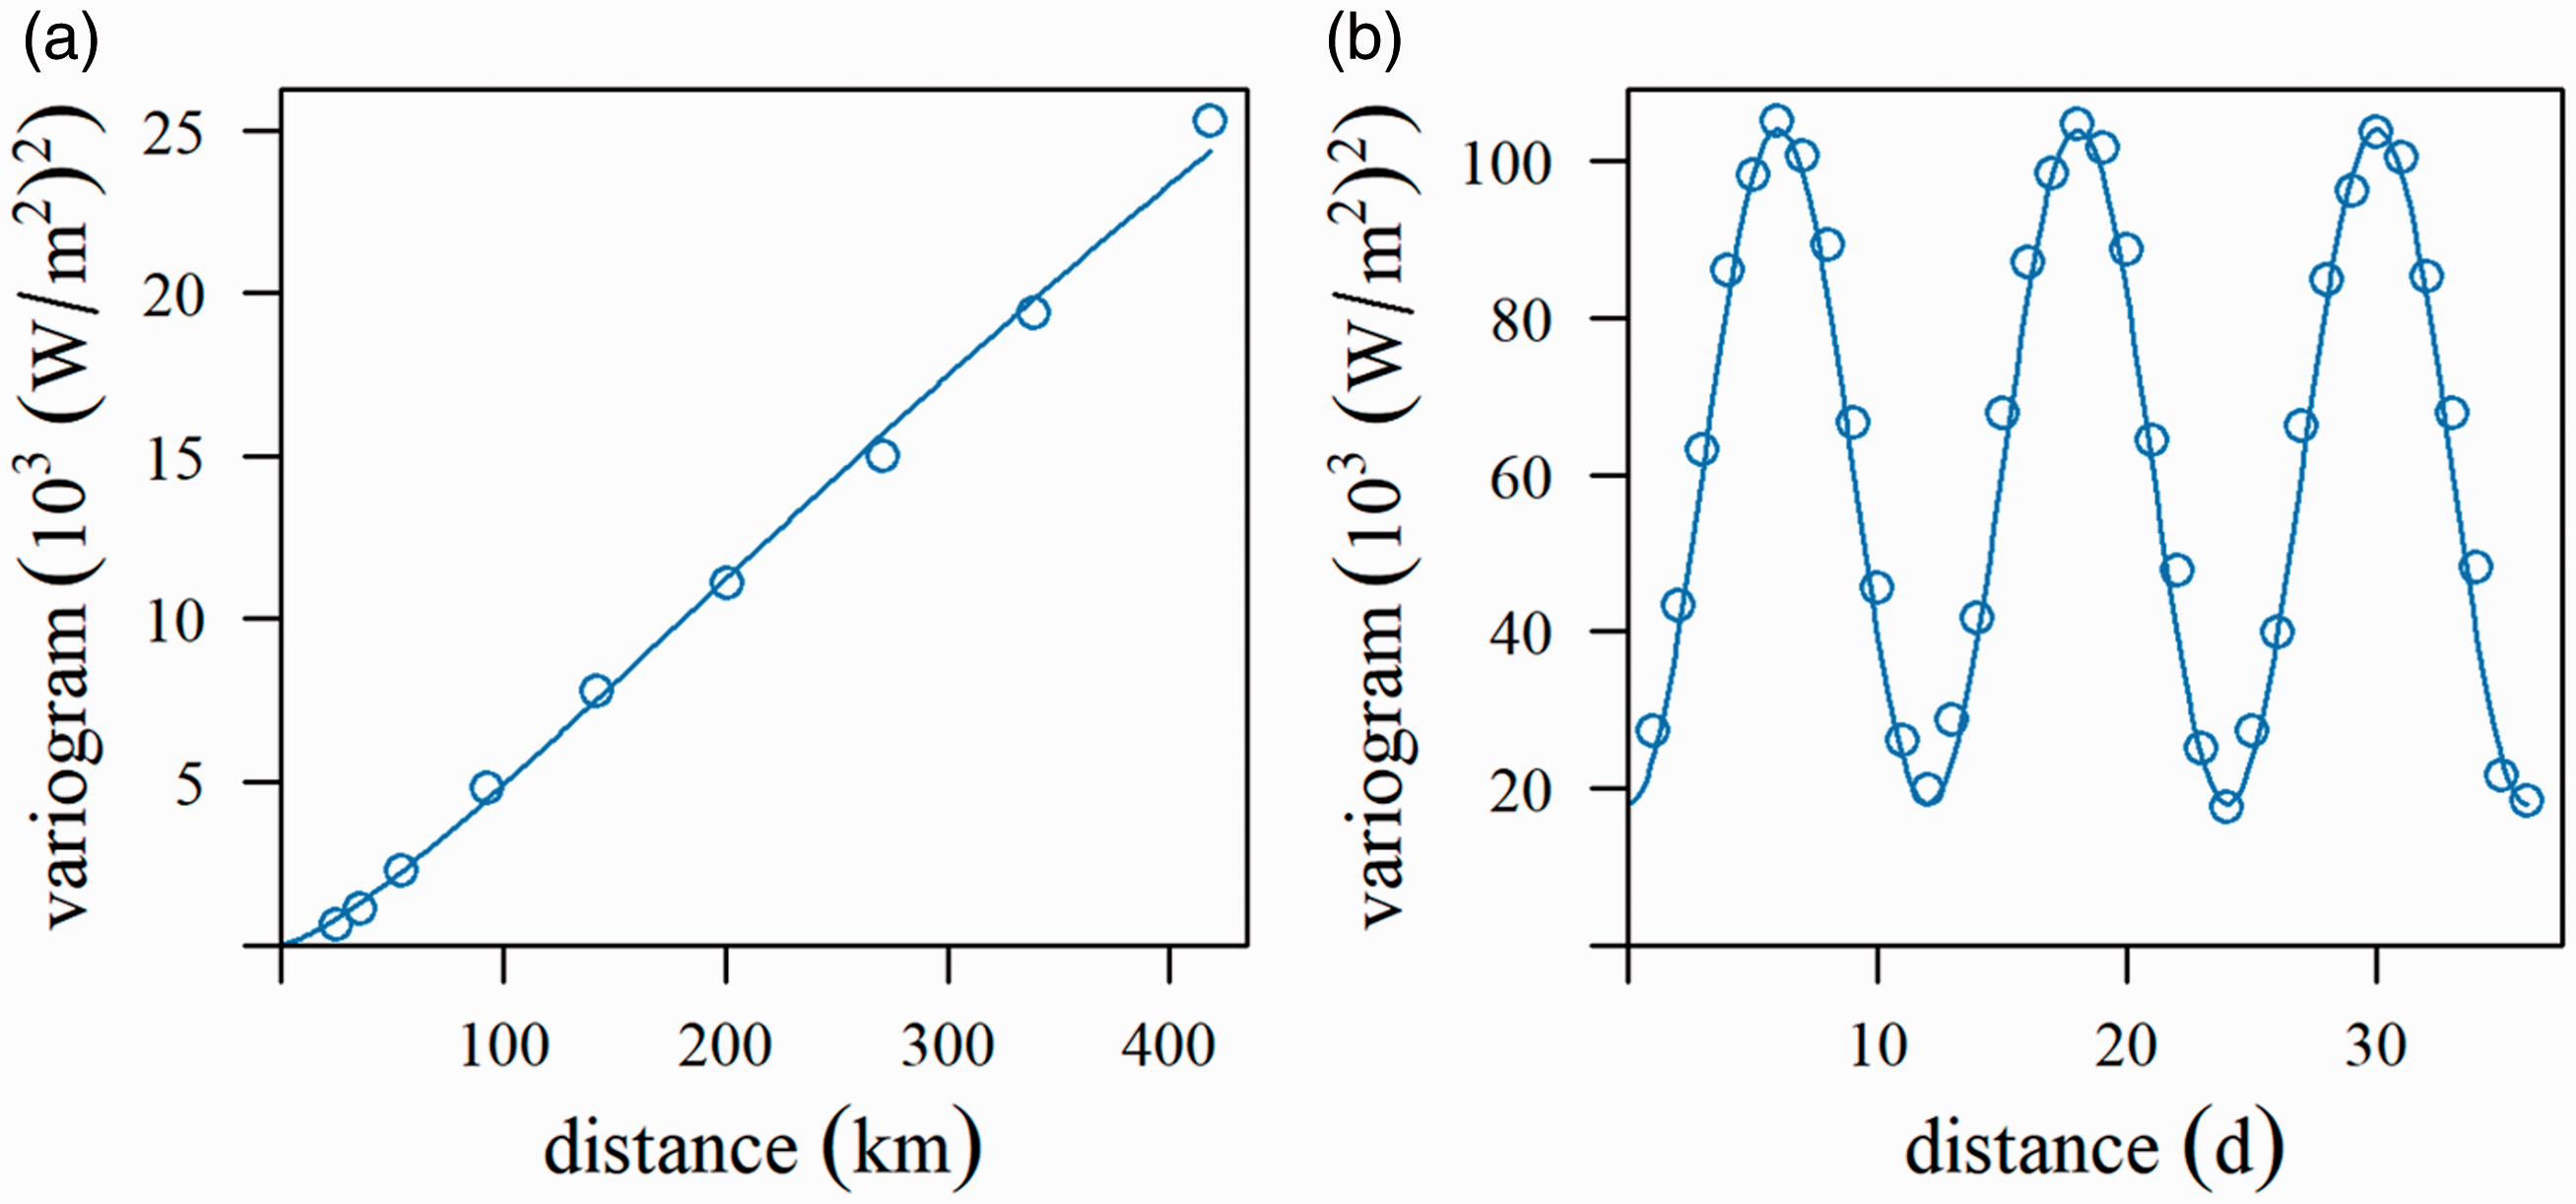
Empirical variograms of monthly offshore WPD and their fitted theoretical models: (a) spatial and (b) temporal.
Using the gstat package, the spatial and temporal variograms were fitted with the Ste (Matern, M. Stein’s parameterization) and Per (periodic) theoretical models, respectively. Table 1 details the corresponding model parameters. Note that the temporal variogram exhibited a periodic structure or “undamped hole effect” (Pyrcz and Deutsch, 2003), corresponding to the monthly offshore WPD periodicity. The Per model adopted a
Fitted theoretical spatial and temporal variogram model parameters.
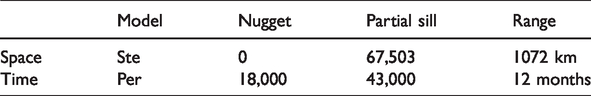
Figure 4 depicts the empirical spatiotemporal variogram of monthly offshore WPD and its fitted theoretical model. The theoretical model was derived as the product–sum of the spatial and temporal variograms (equation (6)) and effectively reflected the spatiotemporal variability in the monthly offshore WPD values. Note that the time dimension exhibited significantly more variability than the space dimension, indicating a high spatial autocorrelation relative to the temporal autocorrelation for monthly offshore WPD (Kilibarda et al., 2014).
Spatiotemporal variograms of monthly offshore WPD: (a) empirical and (b) fitted theoretical model.
Spatiotemporal neighbor selection
Based on the temporal periodicity exhibited in the spatiotemporal variogram of monthly offshore WPD, spatial neighborhoods should be prioritized over temporal neighborhoods when selecting samples for spatiotemporal prediction. In the proposed STOK model, the spatiotemporal neighborhood at location the same month and two adjacent months of d year before month spatial extent within 125 km of location
Note that onshore WPD observations were excluded from the prediction process because of natural differences in the underlying surfaces of onshore and offshore wind fields. Instead, the projected grid was expanded by 5 cells (125 km) in the east, west, and south directions to include more offshore WPD observations.
Model validation
Following determination of the theoretical product–sum spatiotemporal variogram and the customized spatiotemporal neighborhood, the STOK model was used to predict the offshore WPD on a monthly basis. Monthly WPD predictions were made for 2013 based on a reduced set of WPD observations (January 2010 to December 2012). These predicted WPD values were subsequently compared to observed WPD values from 2013 to validate the STOK model’s performance.
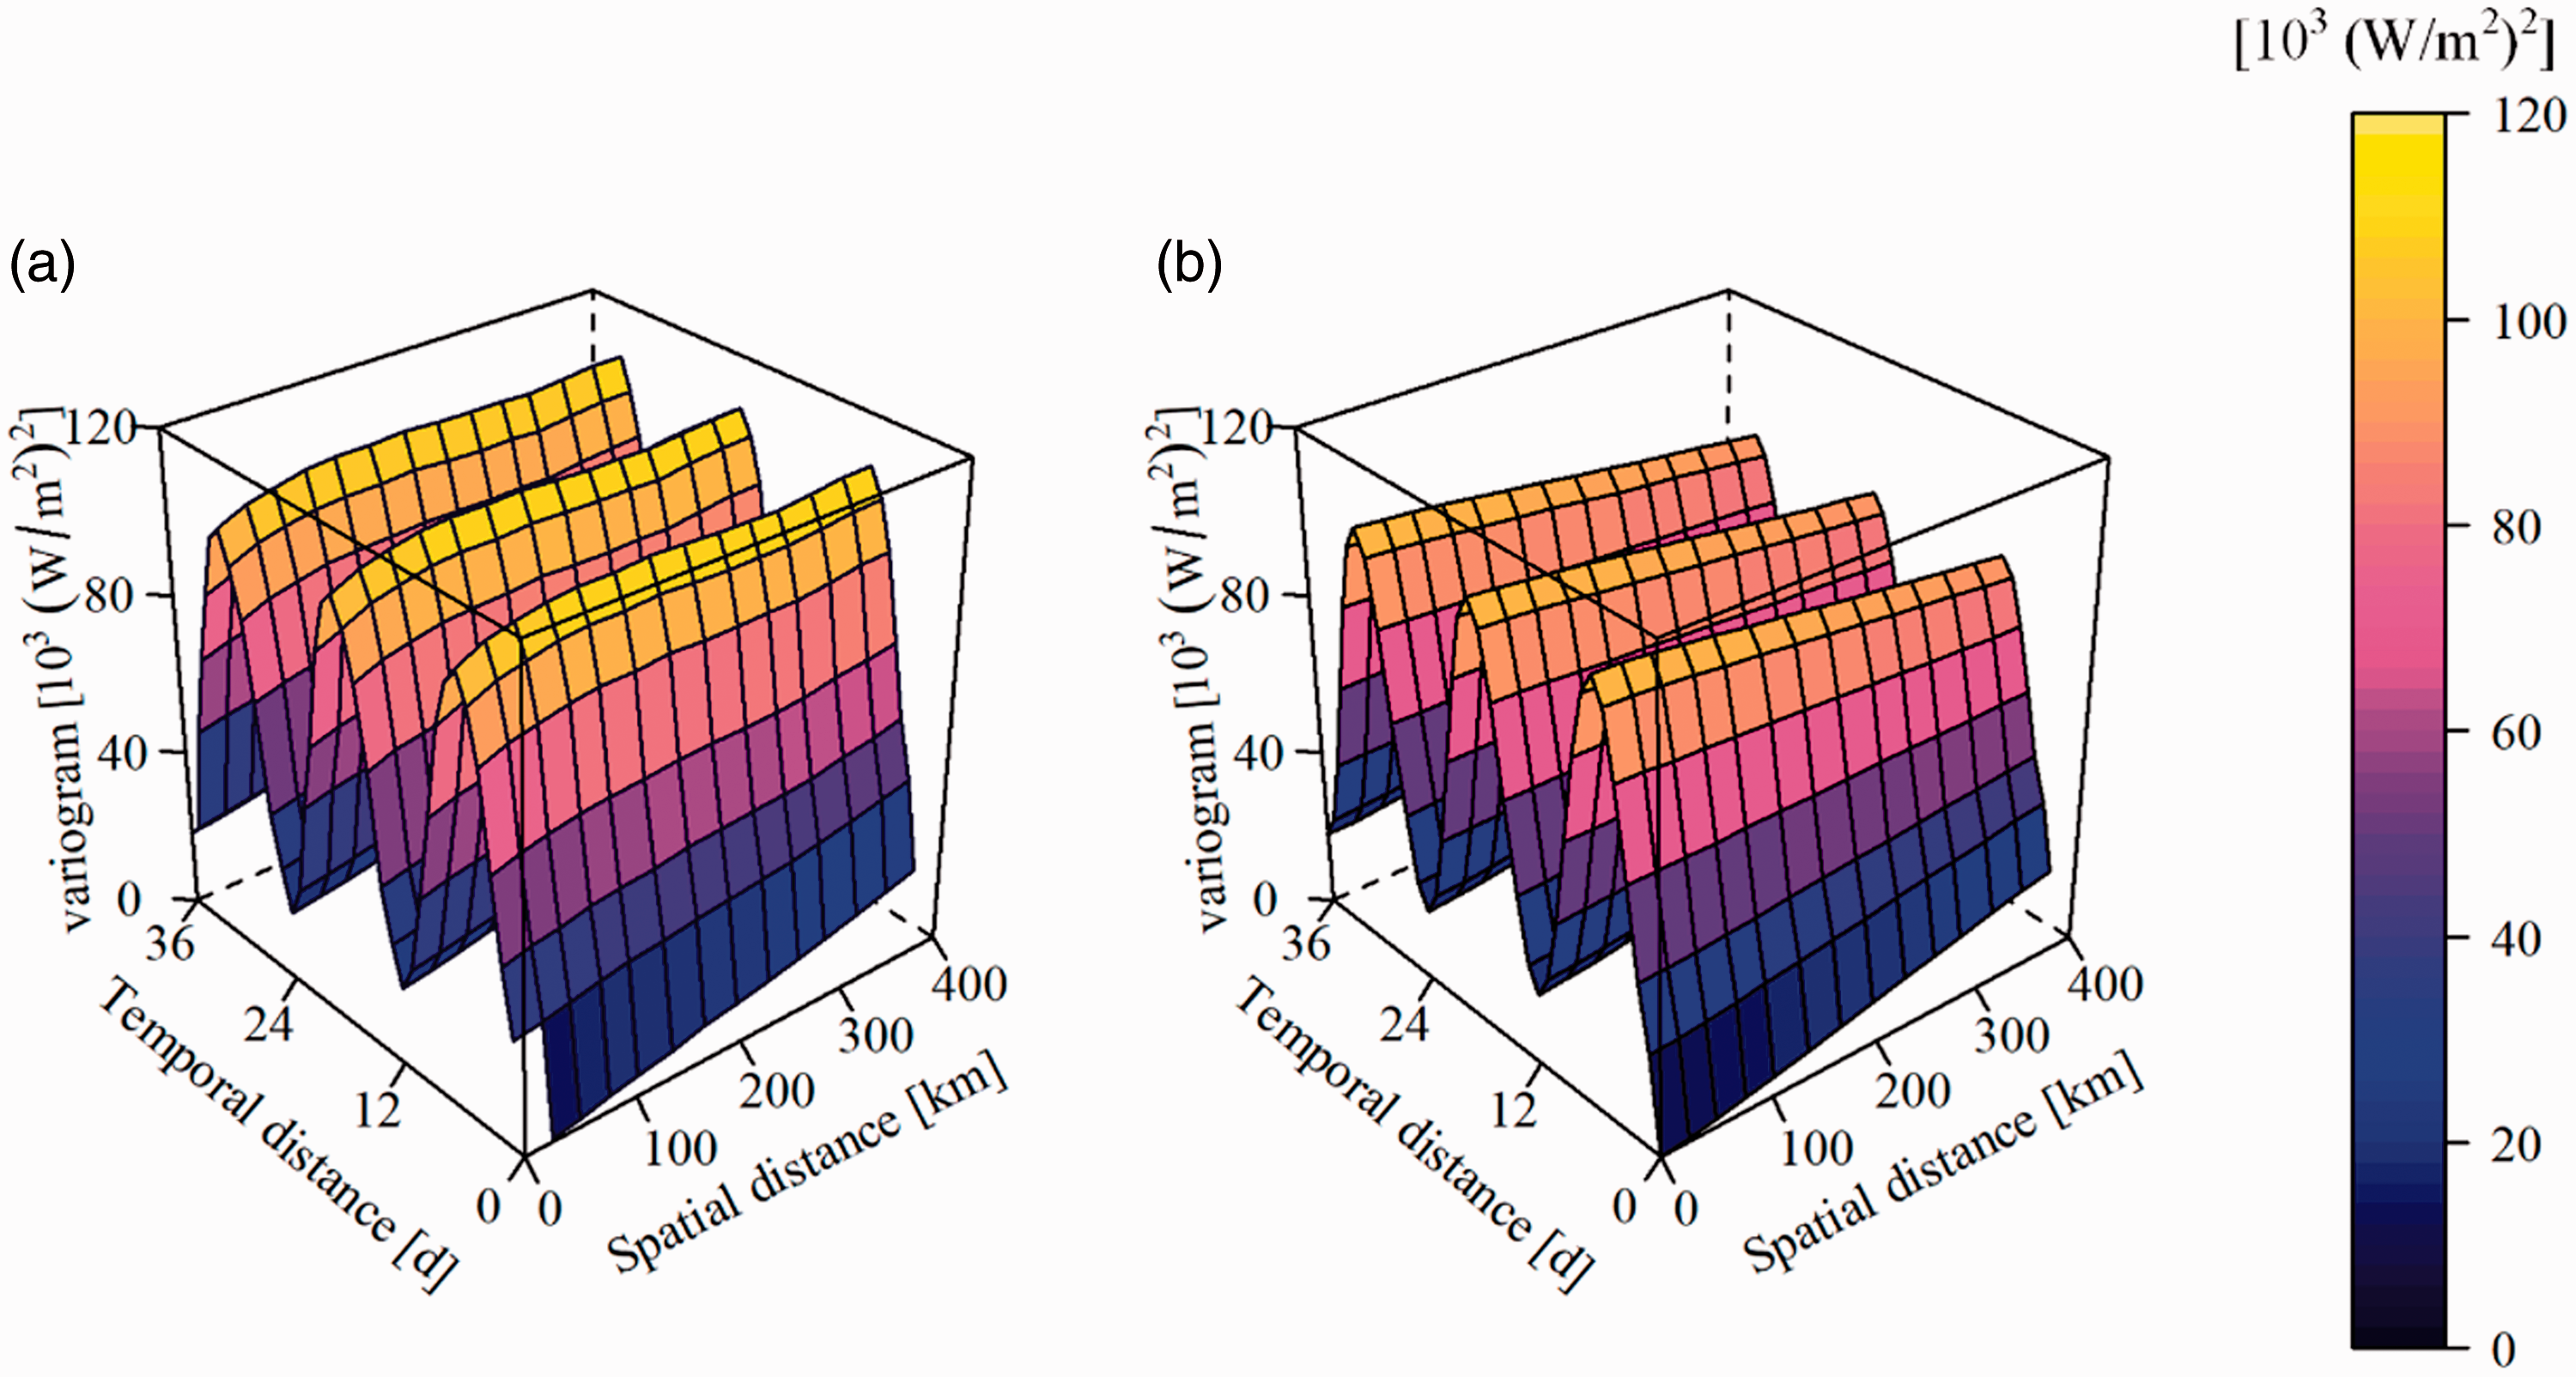
Figure 5 graphically compares the predicted and observed monthly offshore WPD values at the grid cells covering Guangdong’s coastal waters for all months of 2013 using a scatter plot. Based on the set of accuracy indicators considered in this study, the proposed STOK model performed well overall when predicting monthly offshore WPD. It was found that the regression line was almost consistent with the 1:1 reference line, indicating that the WPD predictions were generally unbiased. The R2, RMSE, ME, and RPE values were 0.94, 57.01 W/m2, 9.47 W/m2, and 16.35%, respectively. The pretty high R2 level revealed that >90% of variations in the observed WPD values were explained by the prediction WPD values provided by the STOK model. Furthermore, the relatively low RPE level indicated that the WPD prediction errors were reasonable and controllable when compared to the observed WPD values.
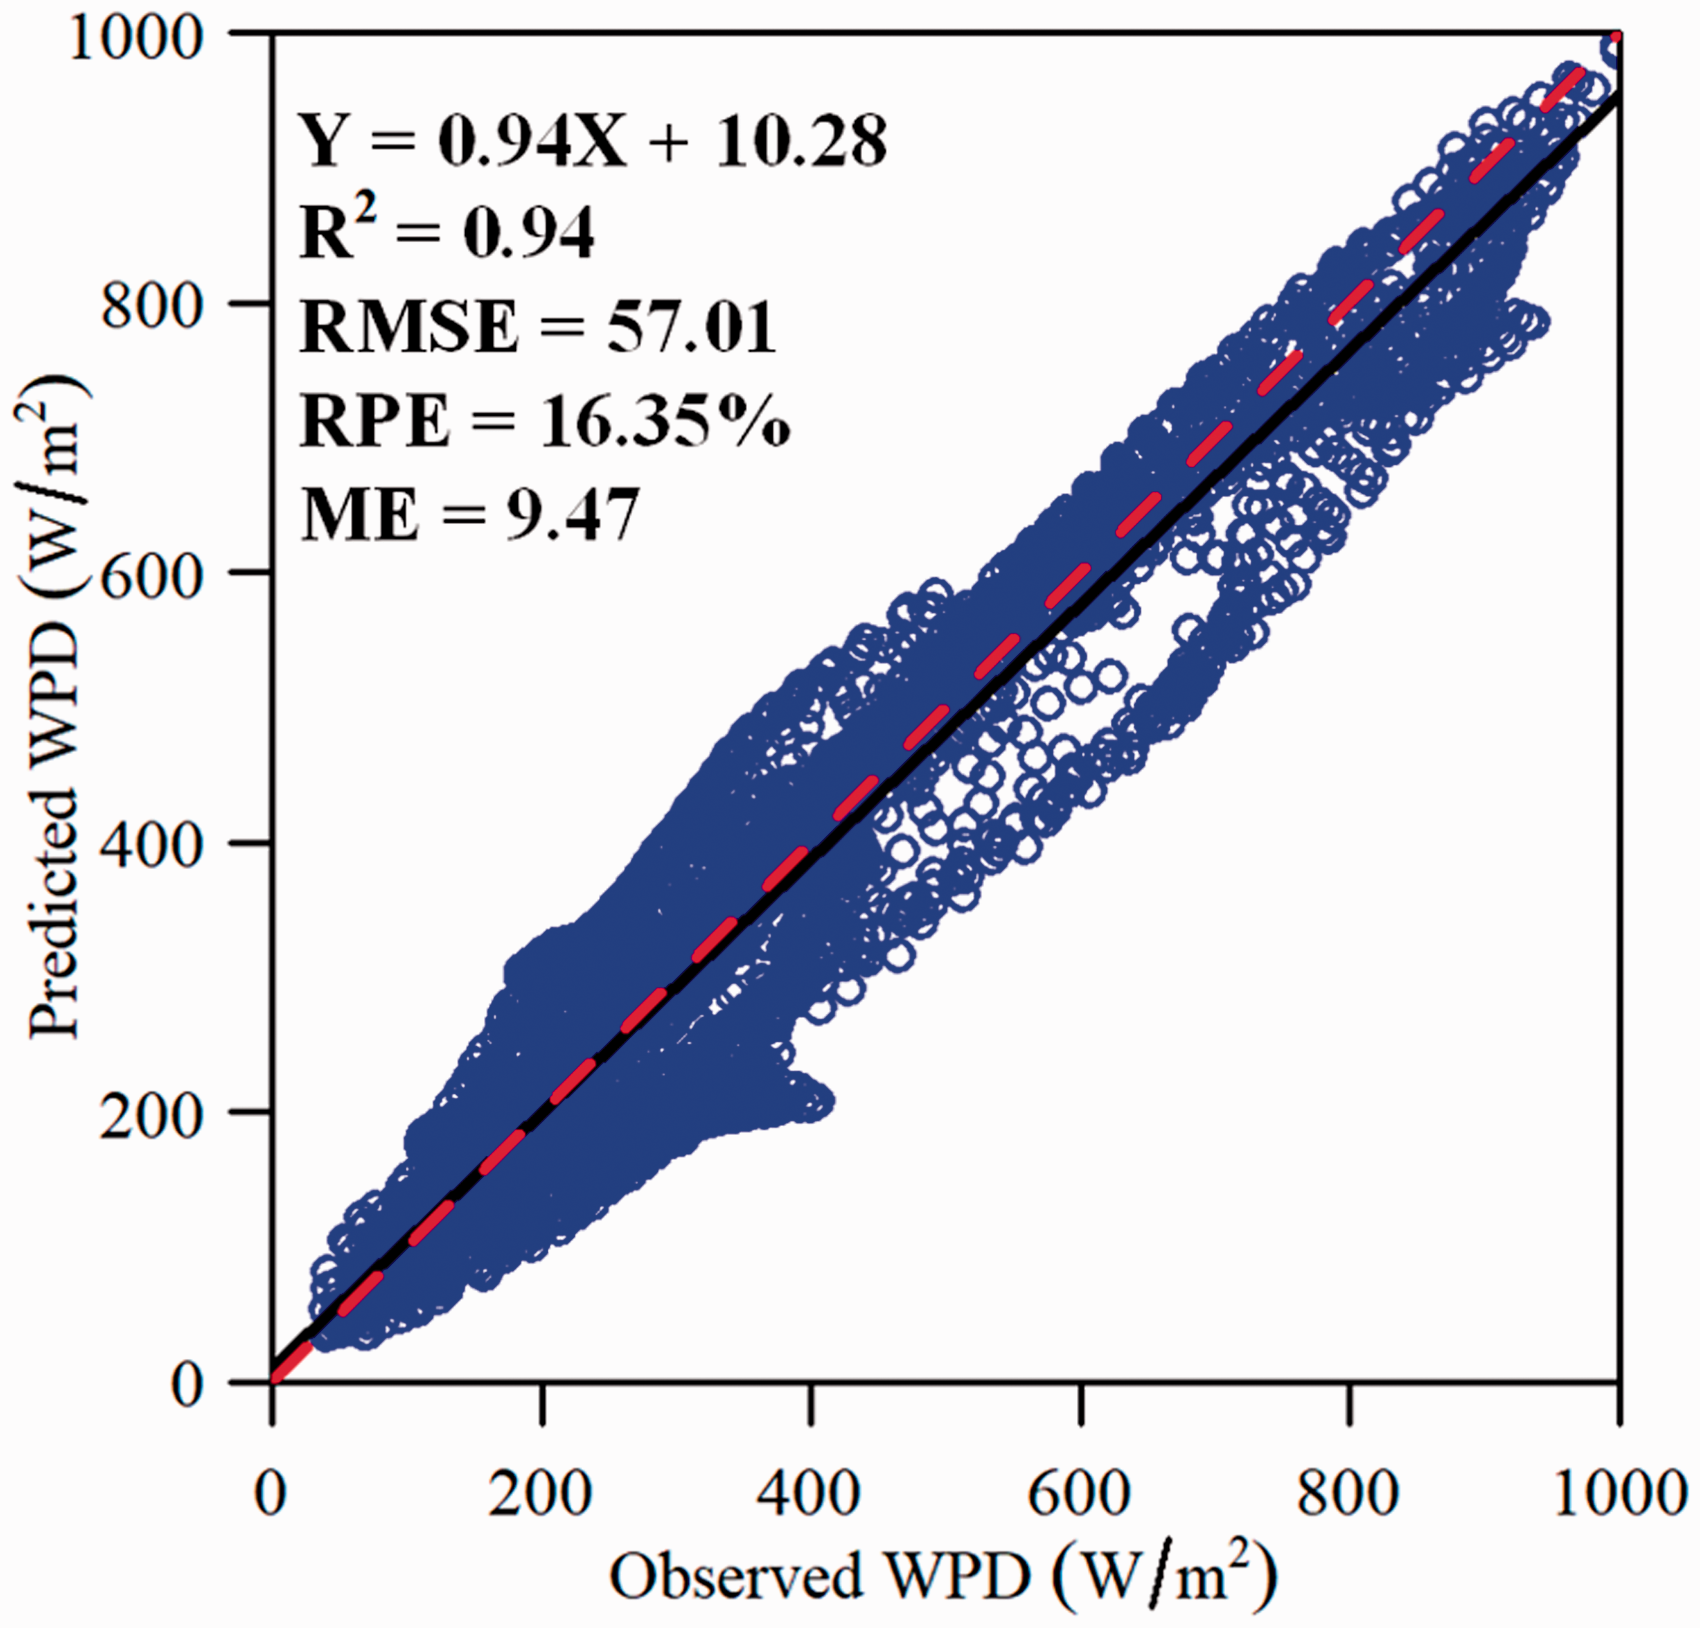
Scatter plot comparison of predicted and observed monthly offshore WPD values at the grid cells covered Guangdong’s coastal waters for all months of 2013. The black solid line is the regression line, and the red dashed line is the 1:1 reference line.
Based on the respective scatter plots, Figure 6 shows the comparison results between predicted and observed monthly offshore WPD values for each month of 2013. Limited deviations between the regression and 1:1 reference lines were observed, and the RPE values were found to be <20% in most months except March and August (34.5% and 38.1%, respectively). The RMSEs and MEs were lowest in July (17.63 and 8.81 W/m2, respectively) and highest in November (111.12 and 100.44 W/m2, respectively). The R2 values were lowest in June (0.71) and highest in both January and December (0.99). The R2 values were ≥0.90 in each of the months except May, June, July, and August (i.e. months with warmer temperatures).
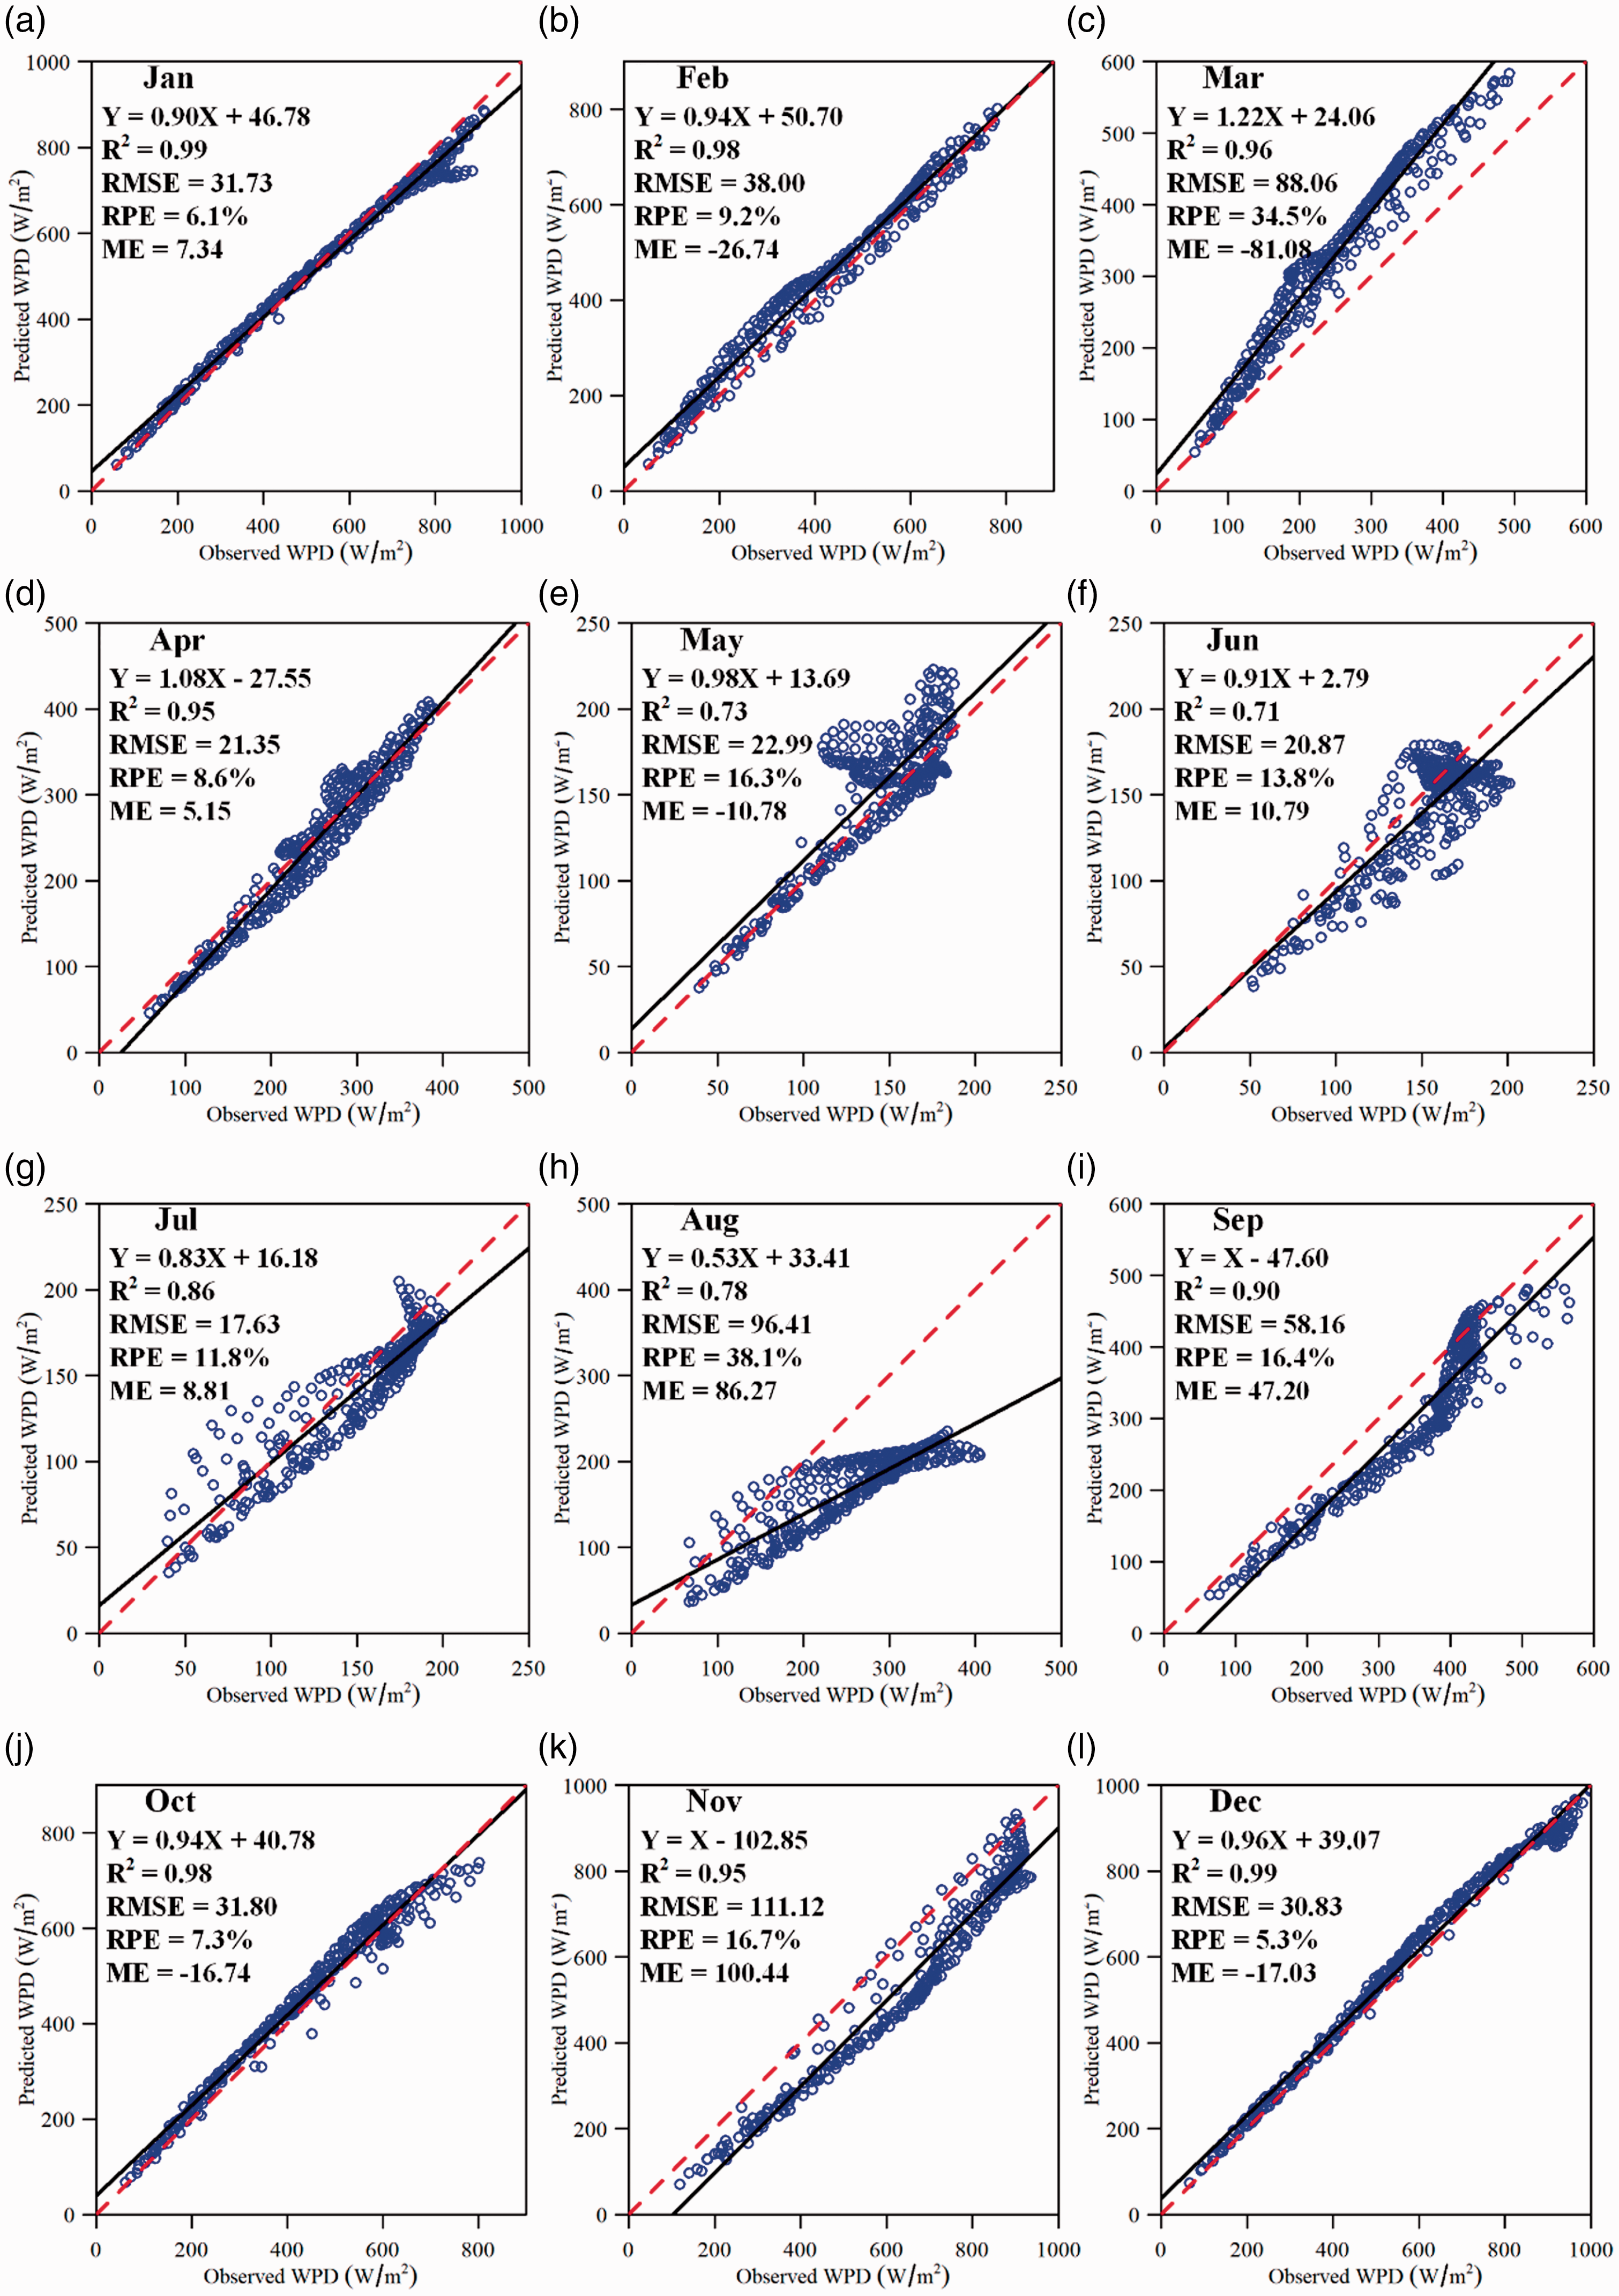
Scatter plot comparisons of predicted and observed monthly offshore WPD values at the grid cells covered the Guangdong’s coastal waters for each month of 2013: (a) January; (b) February; (c) March; (d) April; (e) May; (f) June; (g) July; (h) August; (i) September; (j) October; (k) November; and (l) December. The black solid lines are the regression lines, and the red dashed lines are the 1:1 reference lines.
Through comprehensively analyzing the comparison results of accuracy indicators for each month, it was found that the STOK model provided the worst prediction in August with a limited explanatory power (R2 = 0.78) and a relatively high prediction error (RPE > 30%). Besides in August, note that a certain degree of overestimation or underestimation also occurred in other months (e.g. March and November), violating the unbiasedness property of kriging prediction. This violation may be attributable to possible spatiotemporal nonstationarity in the monthly offshore WPD data (Cressie and Wikle, 2015), i.e. the WPD expected value is not fixed with the spatiotemporal locations. The statistical properties of offshore WPD data may have varied in several months during long-term spatiotemporal modeling. In this case, prediction biases may have been generated, thereby introducing relatively high RMSE and RPE values in March, August, and November. However, from a holistic perspective, the stationarity assumption for the STOK model proved reasonable by the promising prediction results. The prediction biases had a limited impact on the overall prediction performance of the STOK model.
Figure 7 presents the scatter plots of the comparison results between the predicted and observed offshore WPD at seasonal time-scale. The best prediction performance of seasonal offshore WPD occurred in winter with a maximum R2 value (0.99) and a minimum RPE value (4.8%), while the worst prediction performance occurred in summer with a minimum R2 value (0.83) and a maximum RPE value (22.1%). The R2 values for spring and autumn were 0.97 and 0.98, respectively, and the corresponding RPE values were 16.6% and 9.9%, respectively. As shown in the validation results of monthly offshore WPD prediction (Figure 6), the prediction performance of the months in summer (June, July, especially August) was relatively poor. Consequently, the predicted seasonal offshore WPD in summer presented a low accuracy relative to other seasons. Likewise, the prediction biases in November (Figure 6) resulted in the maximum RMSE value (48.13 W/m2) occurring in autumn.
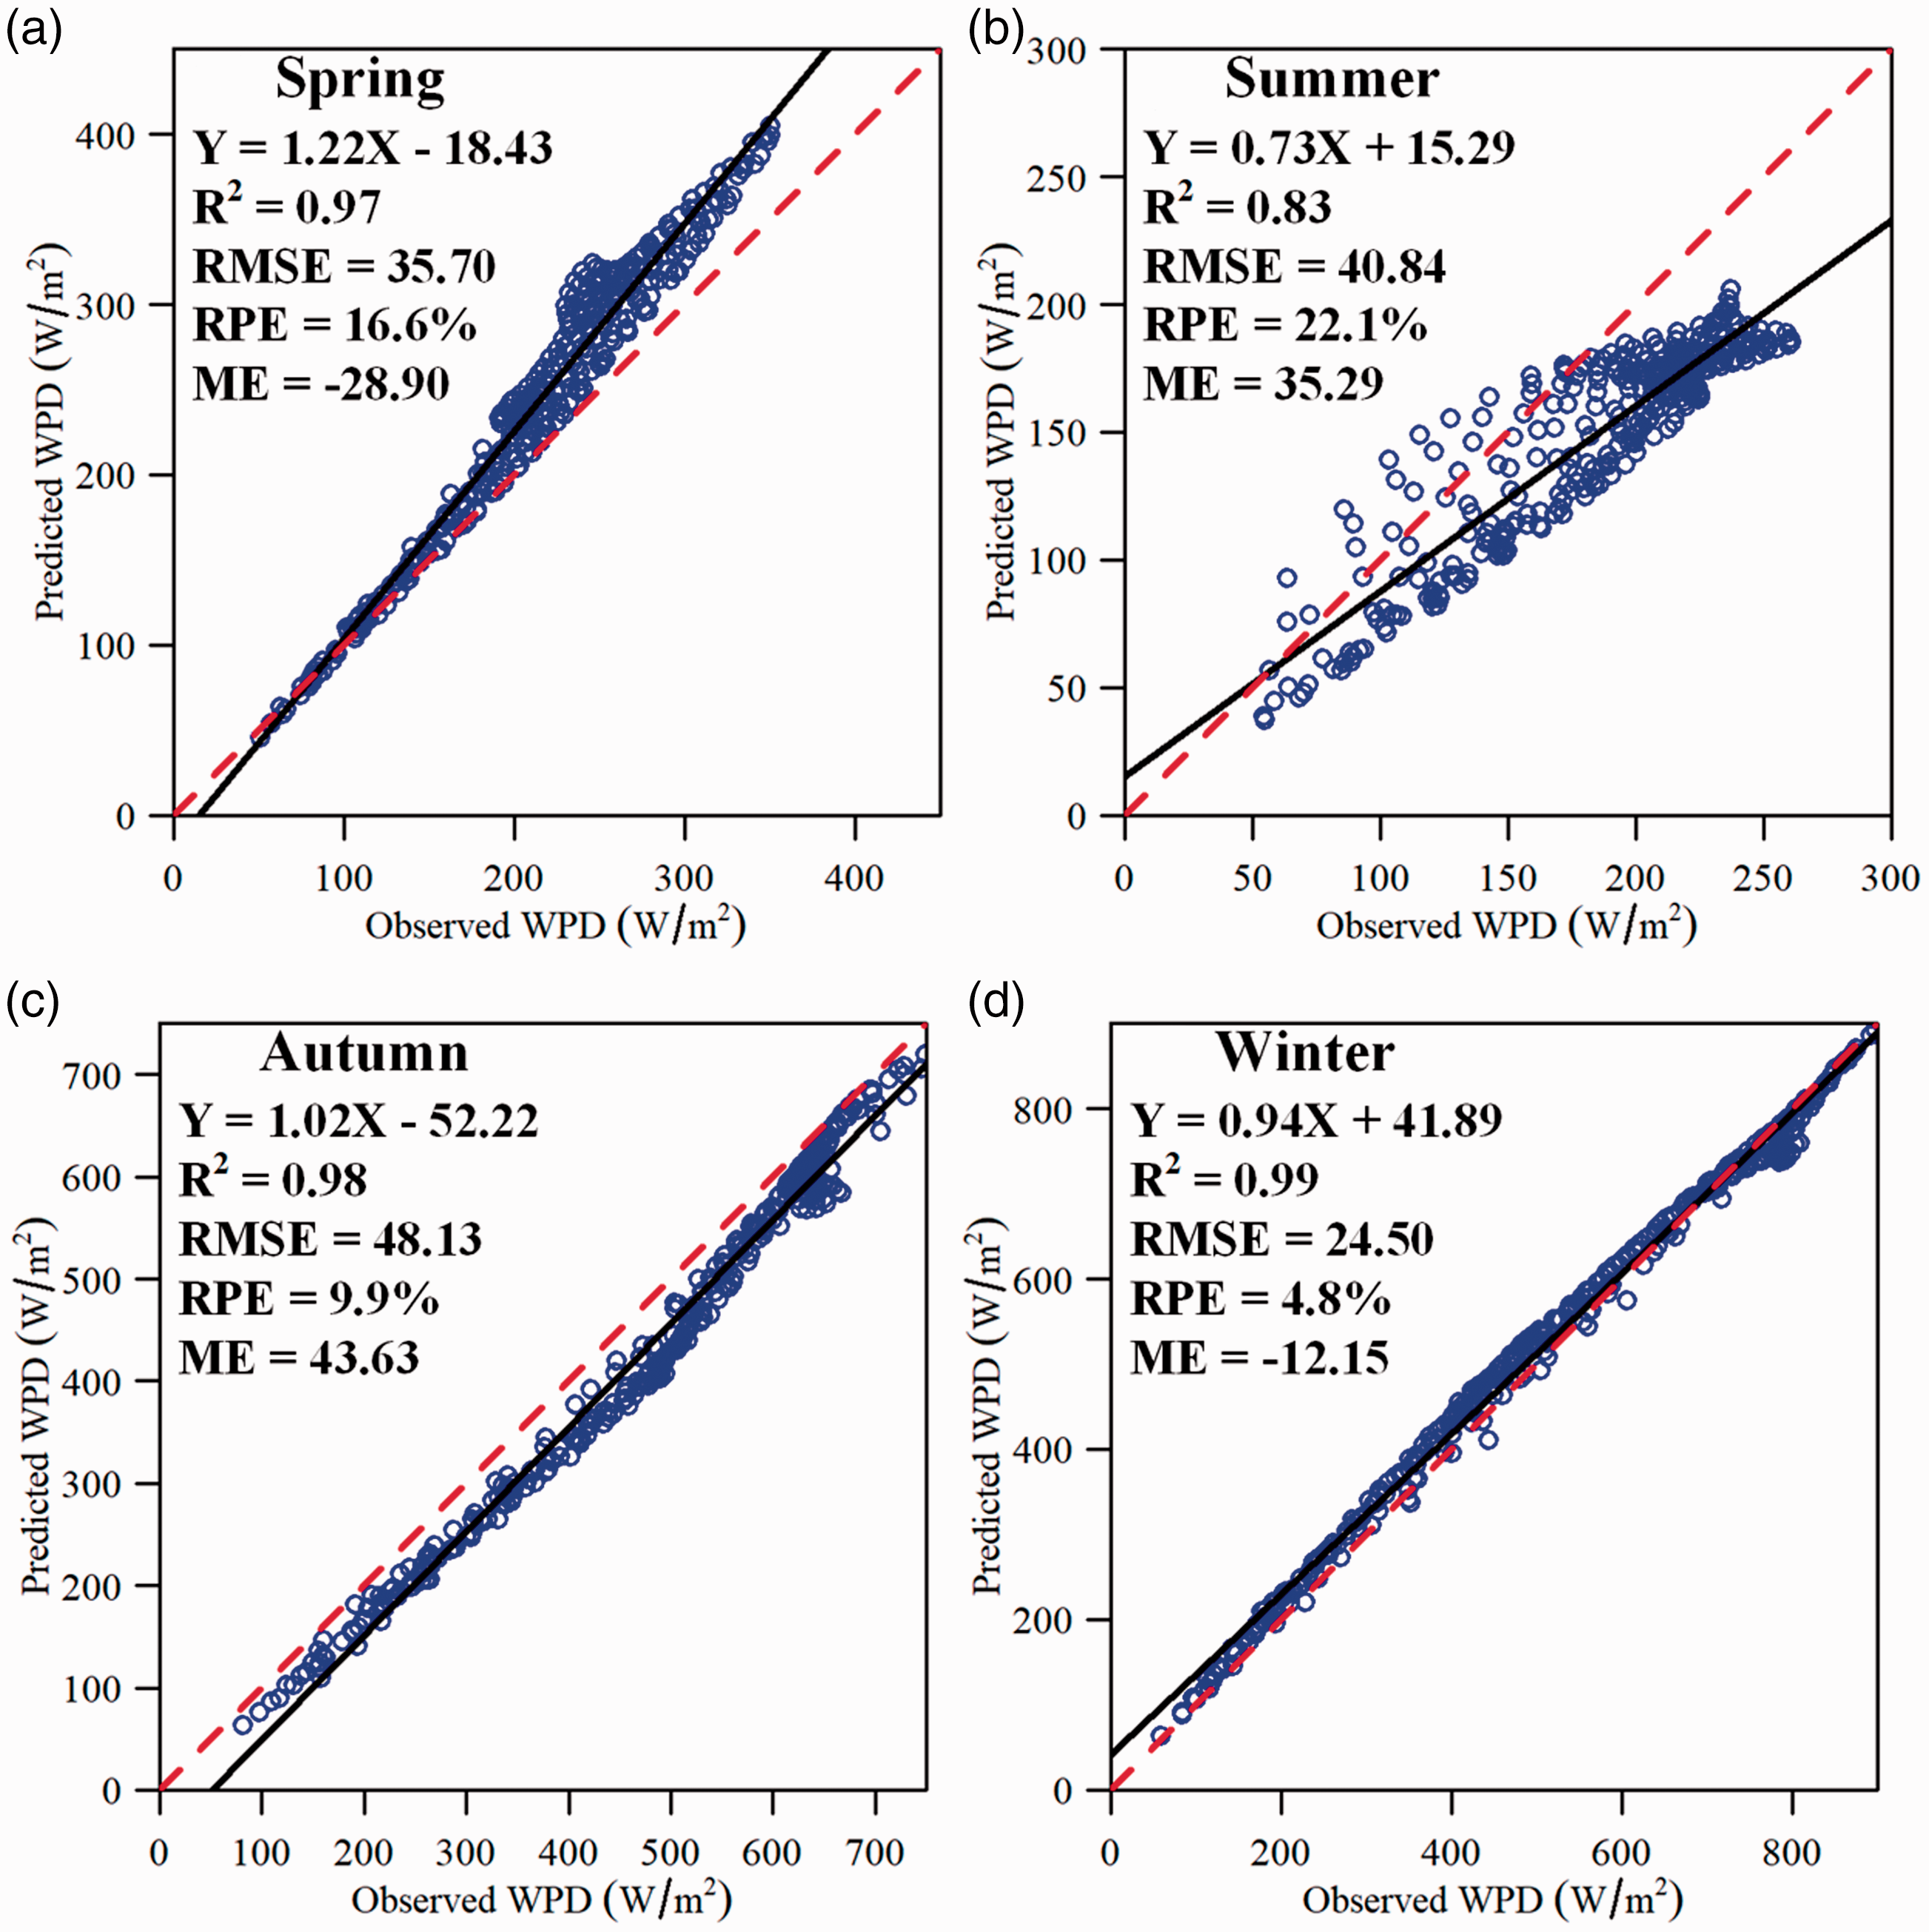
Scatter plot comparisons of predicted and observed seasonal offshore WPD values at the grid cells covered the Guangdong’s coastal waters of 2013: (a) Spring; (b) Summer; (c) Autumn; and (d) Winter. The black solid lines are the regression lines, and the red dashed lines are the 1:1 reference lines.
Figure 8 presents the scatter plots of the comparison results between the predicted and observed offshore WPD at annual time-scale. The annual offshore WPD predictions obtained a remarkable result with R2 up to 0.99 and RPE down to 3.4%. The annual regression line almost coincided with the 1:1 reference line, implying no underestimation or overestimation for predicting annual offshore WPD. This significant performance was mainly attributable to the overall unbiased prediction of monthly offshore WPD provided by the STOK model. In other words, the overall prediction errors of monthly offshore WPD conformed to a normal distribution with expected value of zero, and therefore the calculation of averages made positive and negative errors offset each other.
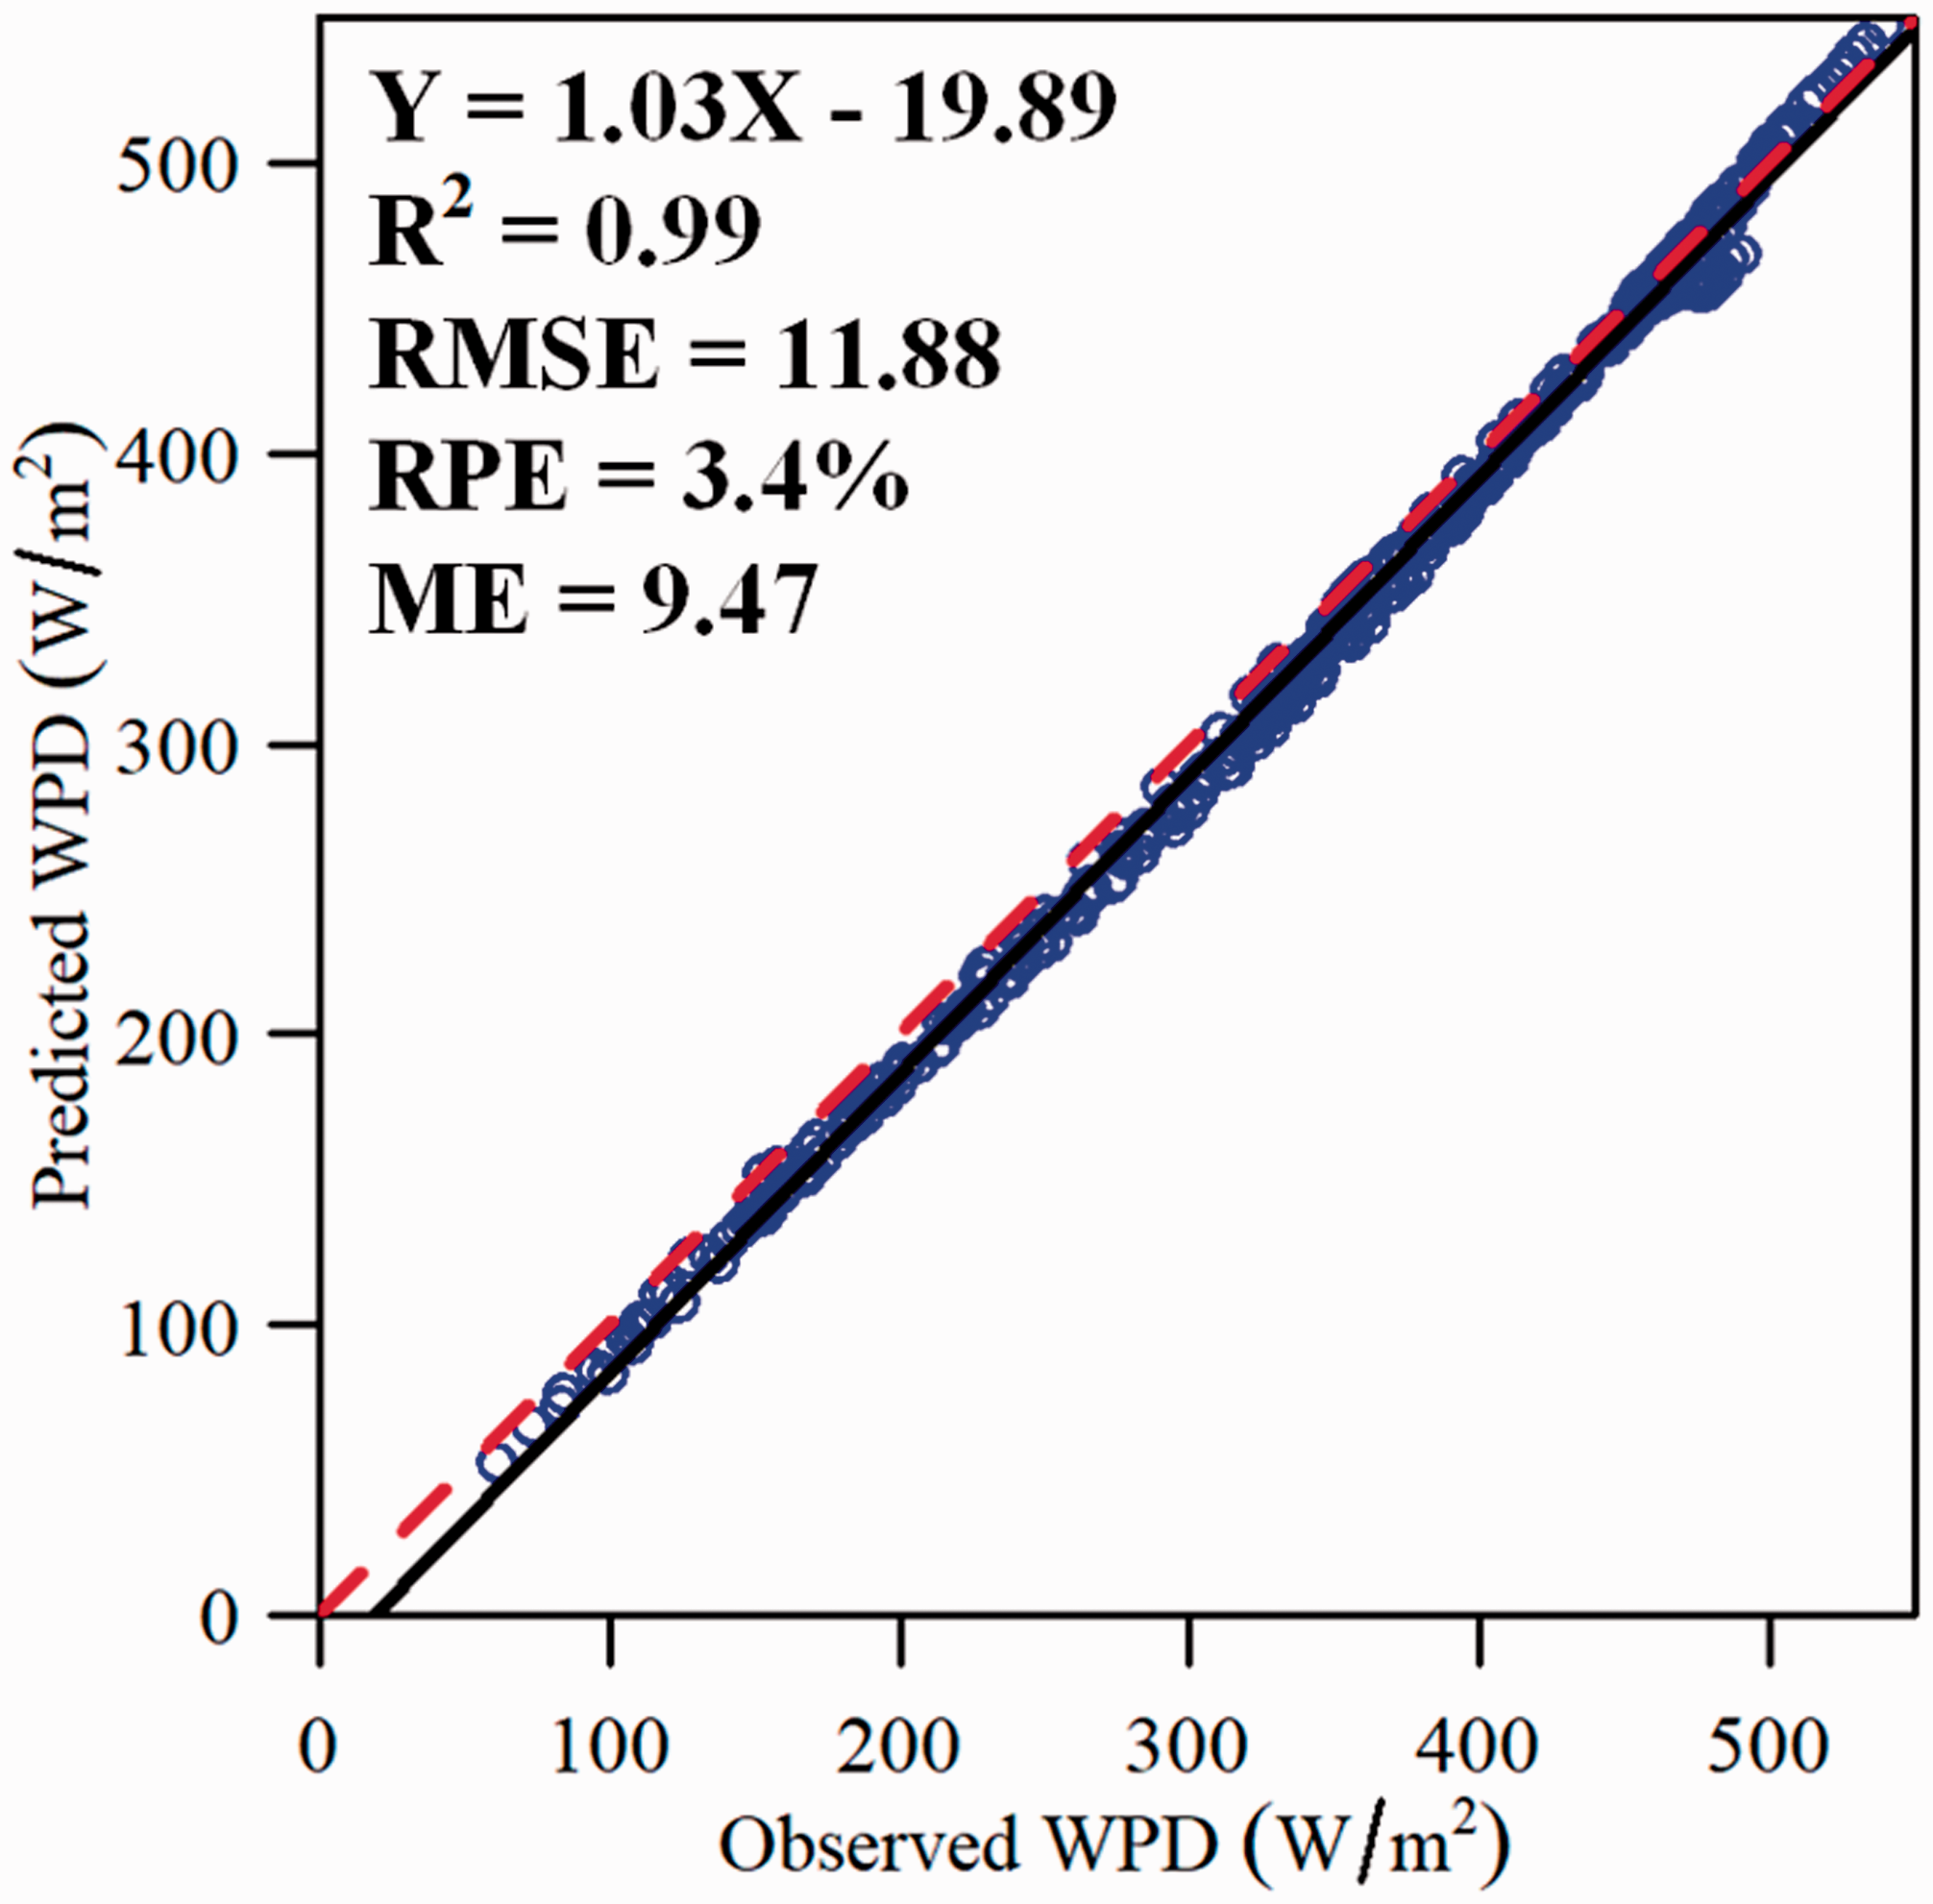
Scatter plot comparisons of predicted and observed annual offshore WPD values at the grid cells covered the Guangdong’s coastal waters of 2013. The black solid lines are the regression lines, and the red dashed lines are the 1:1 reference lines.
In general, the comparison results demonstrate that the proposed STOK model possesses a strong explanatory power for obtaining annual and seasonal offshore WPD from the averages of the predicted monthly offshore WPD values.
Figure 9 shows the spatial distribution of select accuracy indicators (RMSE and RPE) for monthly offshore WPD prediction from 2013 in the study area based on individual grid cell values. In waters 100 km or more from the coast of western Guangdong and the Pearl River Delta (PRD), grid cell RMSEs were generally >60 W/m2. Comparatively, in the coastal waters of eastern Guangdong, grid cell RMSEs were generally <40 W/m2.
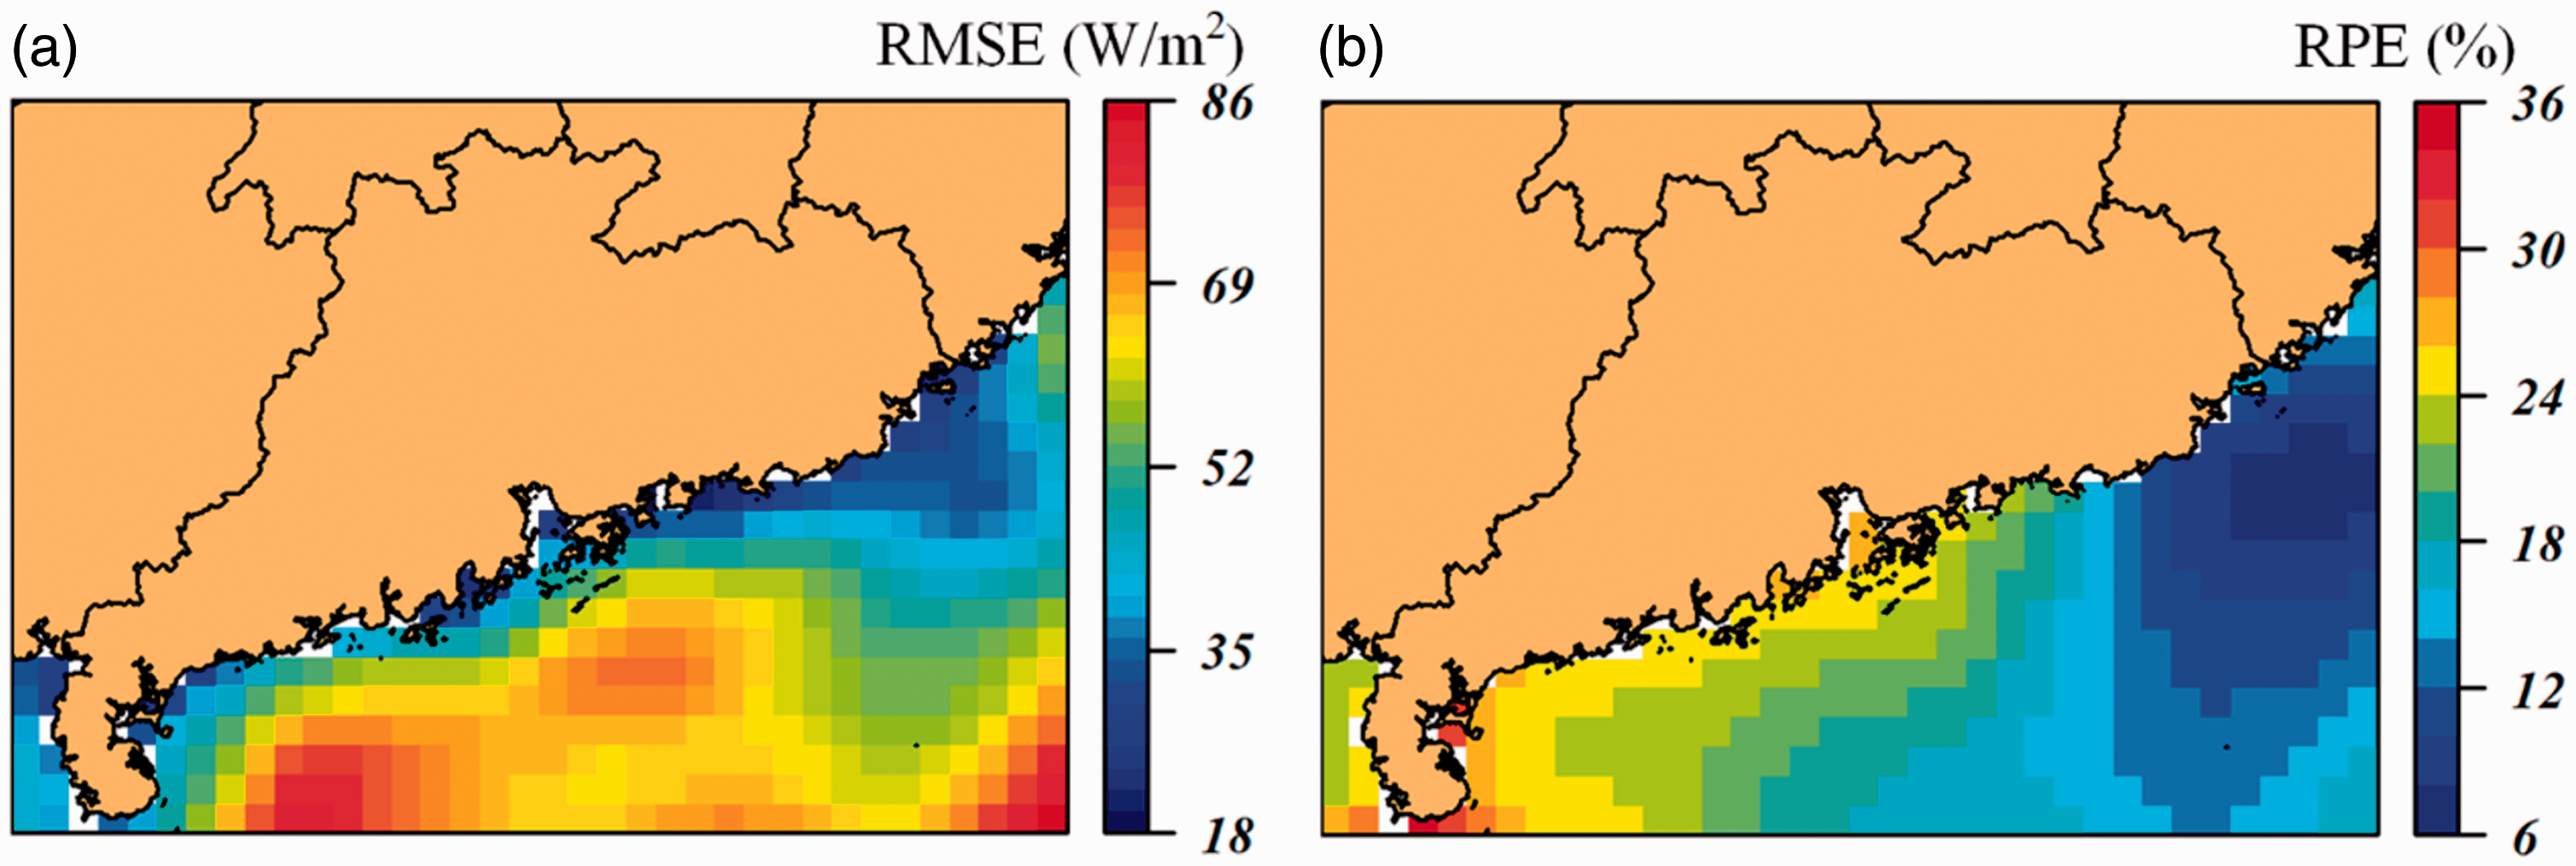
Spatial distribution of accuracy indicators for monthly offshore WPD prediction from 2013 in the Guangdong’s coastal waters: (a) root mean square error and (b) relative prediction error.
Providing a fair and relative comparison of WPD prediction accuracy, RPEs were also considered. Grid cell RPEs were generally <26% except in select waters surrounding the Leizhou Peninsula. In waters near western Guangdong and the PRD, RPEs increased as the distance from the coast decreased. This phenomenon may be attributable to the significant effects of onshore wind fields. Consistent with the RMSE spatial distribution, grid cell RPEs were generally <15% in the coastal waters of eastern Guangdong.
According to the development plan for offshore wind power in Guangdong Province, the coastal waters of eastern Guangdong, which contain the most abundant wind energy resources, represents a key development region. Based on its demonstrated performance in this study for long-term WPD prediction, application of the proposed STOK model would benefit the government’s advanced planning efforts for offshore wind farm development.
Offshore WPD predictions at monthly, seasonal, and annual time-scales
Figure 10 compares the spatial distributions of the predicted and observed monthly offshore WPD values from 2013 in the Guangdong’s coastal waters. The predicted and observed offshore WPD spatial distributions exhibited a consistent pattern for each month, suggesting that the STOK model’s powerful long-term predictive ability would benefit efforts to identify exact coastal regions with abundant wind energy resources. The monthly variations in offshore wind energy resources (i.e. wind power is much higher in colder months than in warmer months) were accurately reflected by the predicted WPD values. Additionally, the prediction results showed that the eastern deep-water offshore area in Guangdong Province contained the richest wind energy resources, not varying with the months. Similar to previous China sea assessment results from Zheng et al. (2013), this area was recognized to be well suited for wind energy utilization.
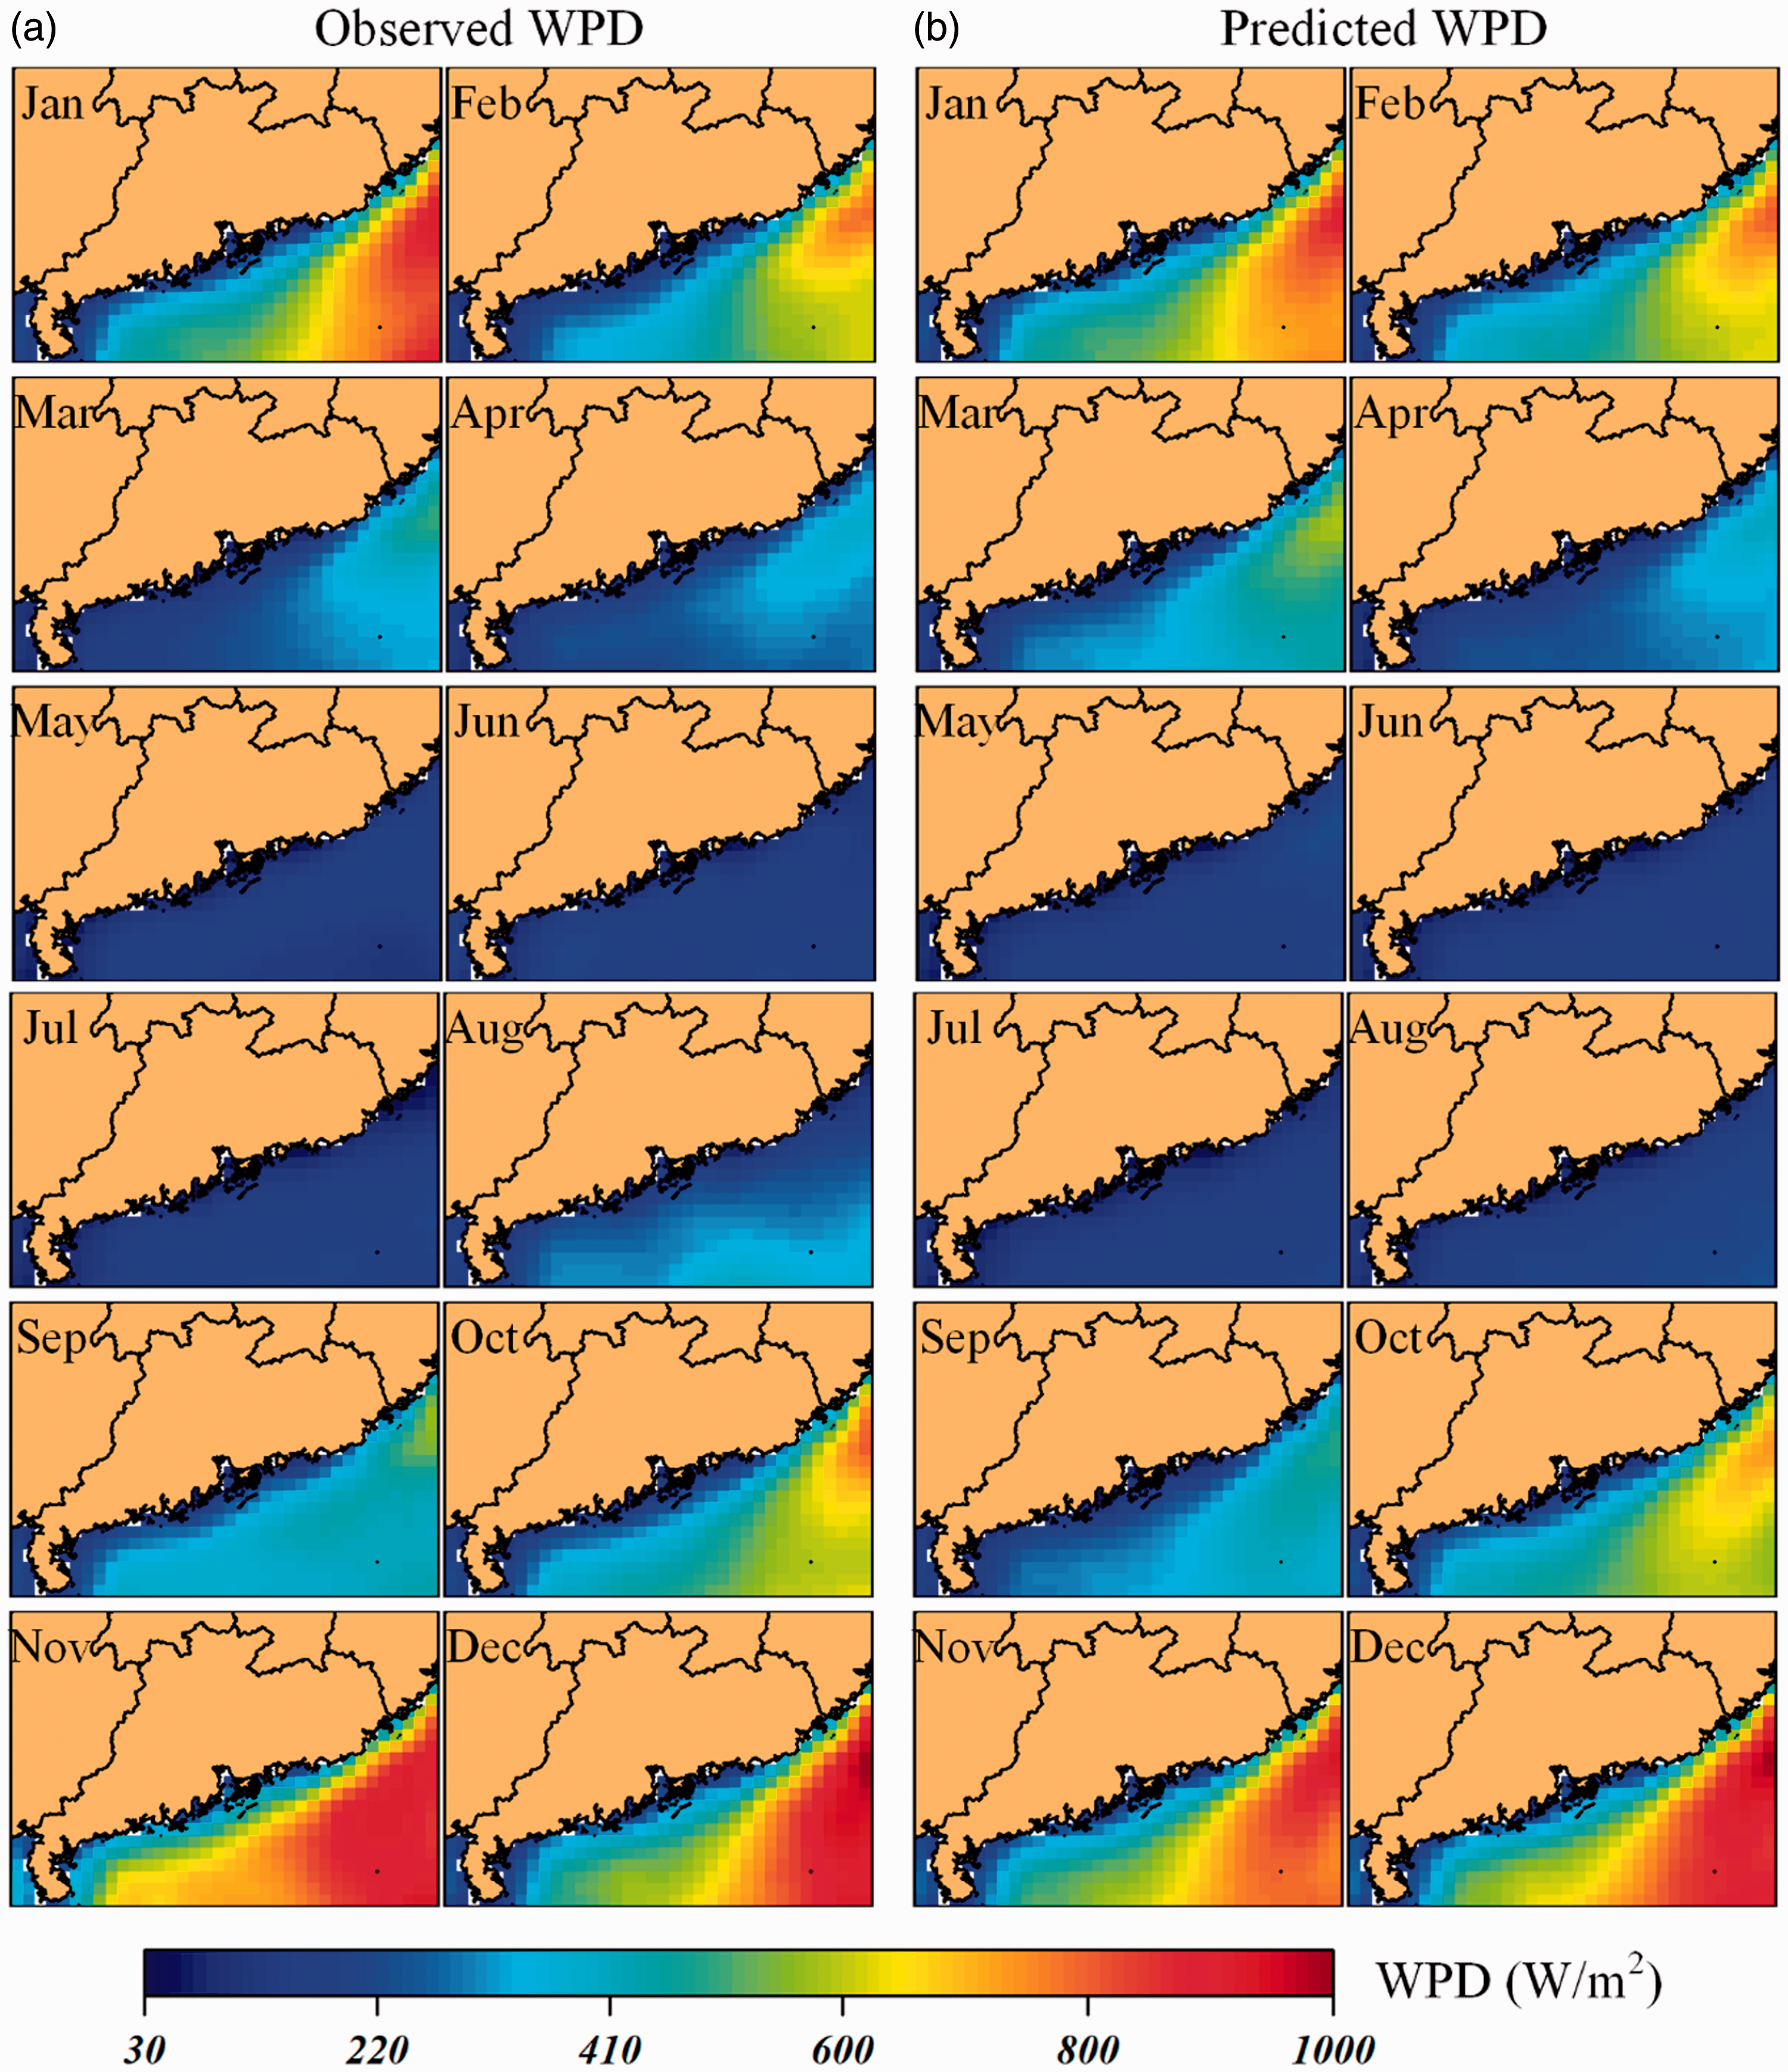
Spatial distribution comparisons of monthly offshore WPD values from 2013 in the Guangdong’s coastal waters: (a) observed and (b) predicted.
Figure 11 compares the spatial distributions of the predicted and observed seasonal offshore WPD values from 2013 in the Guangdong’s coastal waters. Overall, the seasonal offshore WPD distributions exhibited a similar spatial pattern, i.e. higher in the northeast and lower in the southwest. The offshore WPD values were the highest in winter, the lowest in summer, and in the middle in spring and autumn. In winter, both the observations and predictions revealed that rich wind energy resources were widely distributed along Guangdong’s coastal waters, with the WPD values generally exceeding 400 W/m2, and even approaching 1000 W/m2 in the deep waters of eastern Guangdong. However, in summer, the observations showed that only half of the offshore WPD values were <200 W/m2 while the STOK model tended to underestimate the WPD values to a certain extent.
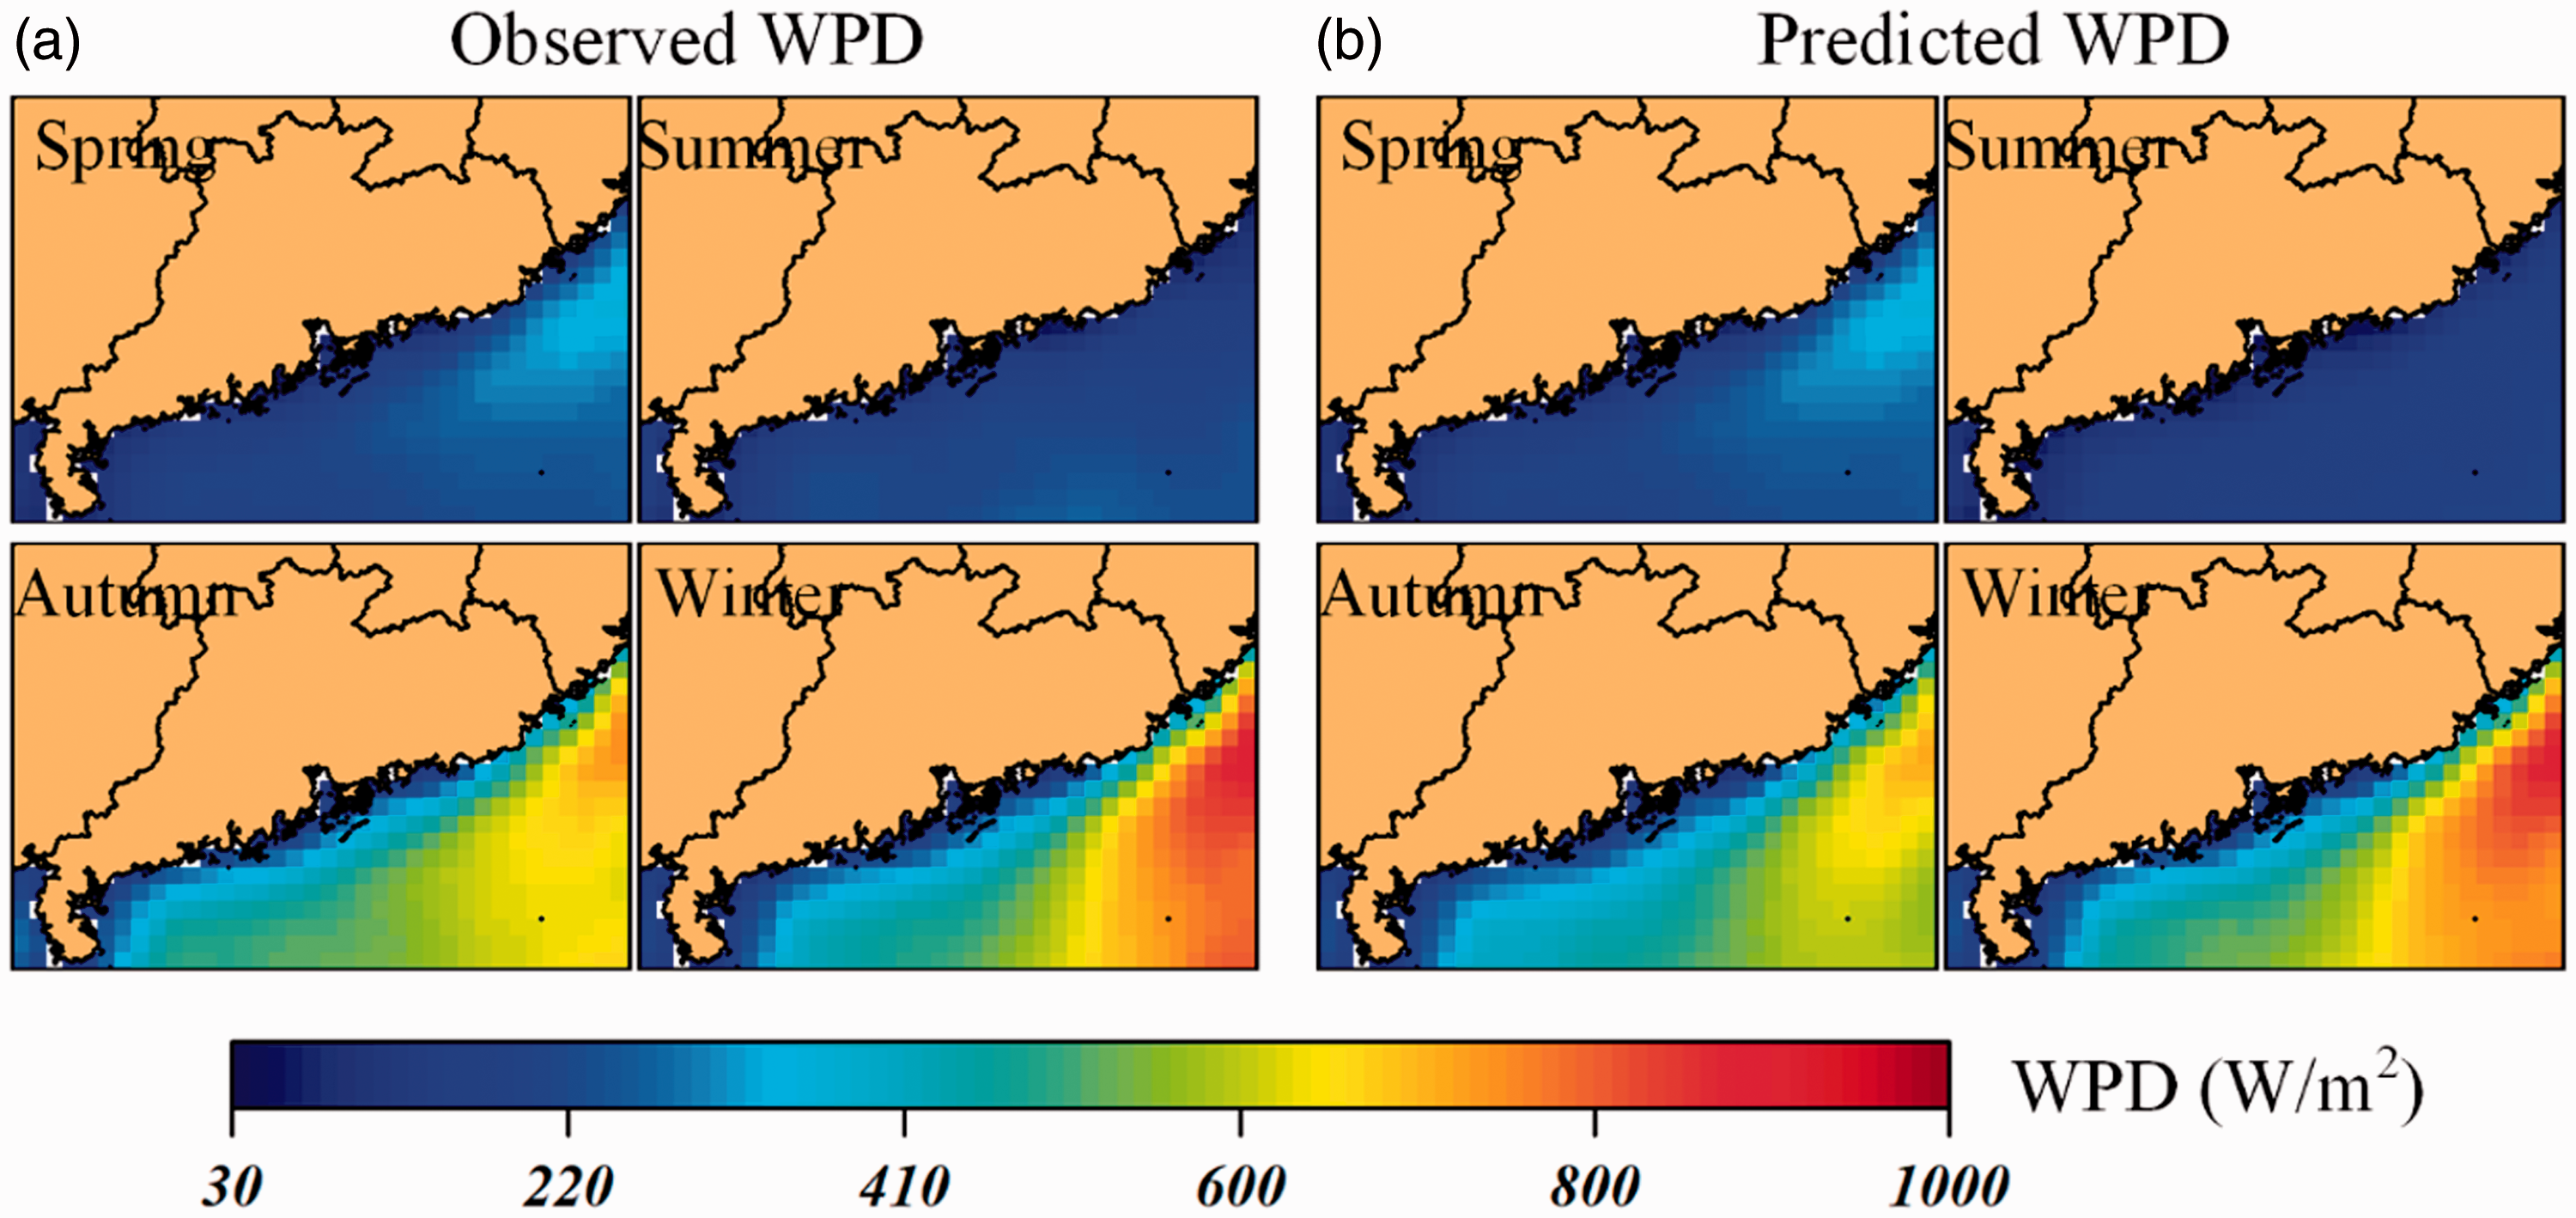
Spatial distribution comparisons of seasonal offshore WPD values from 2013 in the Guangdong’s coastal waters: (a) observed and (b) predicted.
Figure 12 compares the spatial distributions of the predicted and observed annual offshore WPD values from 2013 in the Guangdong’s coastal waters. As introduced in the development plan for offshore wind power in Guangdong Province, the reserves of Guangdong’s offshore wind energy resources can reach 100 GW. The offshore wind energy resources generally increased from southwest to northeast along the coast, and also increased as the distance from coast extended. According to the standard of wind power classification (Zheng and Pan, 2014), most offshore areas of Guangdong Province contained rich wind energy resources as their annual WPD values exceeded 200 W/m2. The deep waters of eastern Guangdong even possessed annual WPD values as high as 550 W/m2. The WPD prediction results revealed the significant offshore wind energy potential in the Guangdong’s coastal waters, and accordingly captured the spatial variability of wind energy resources.
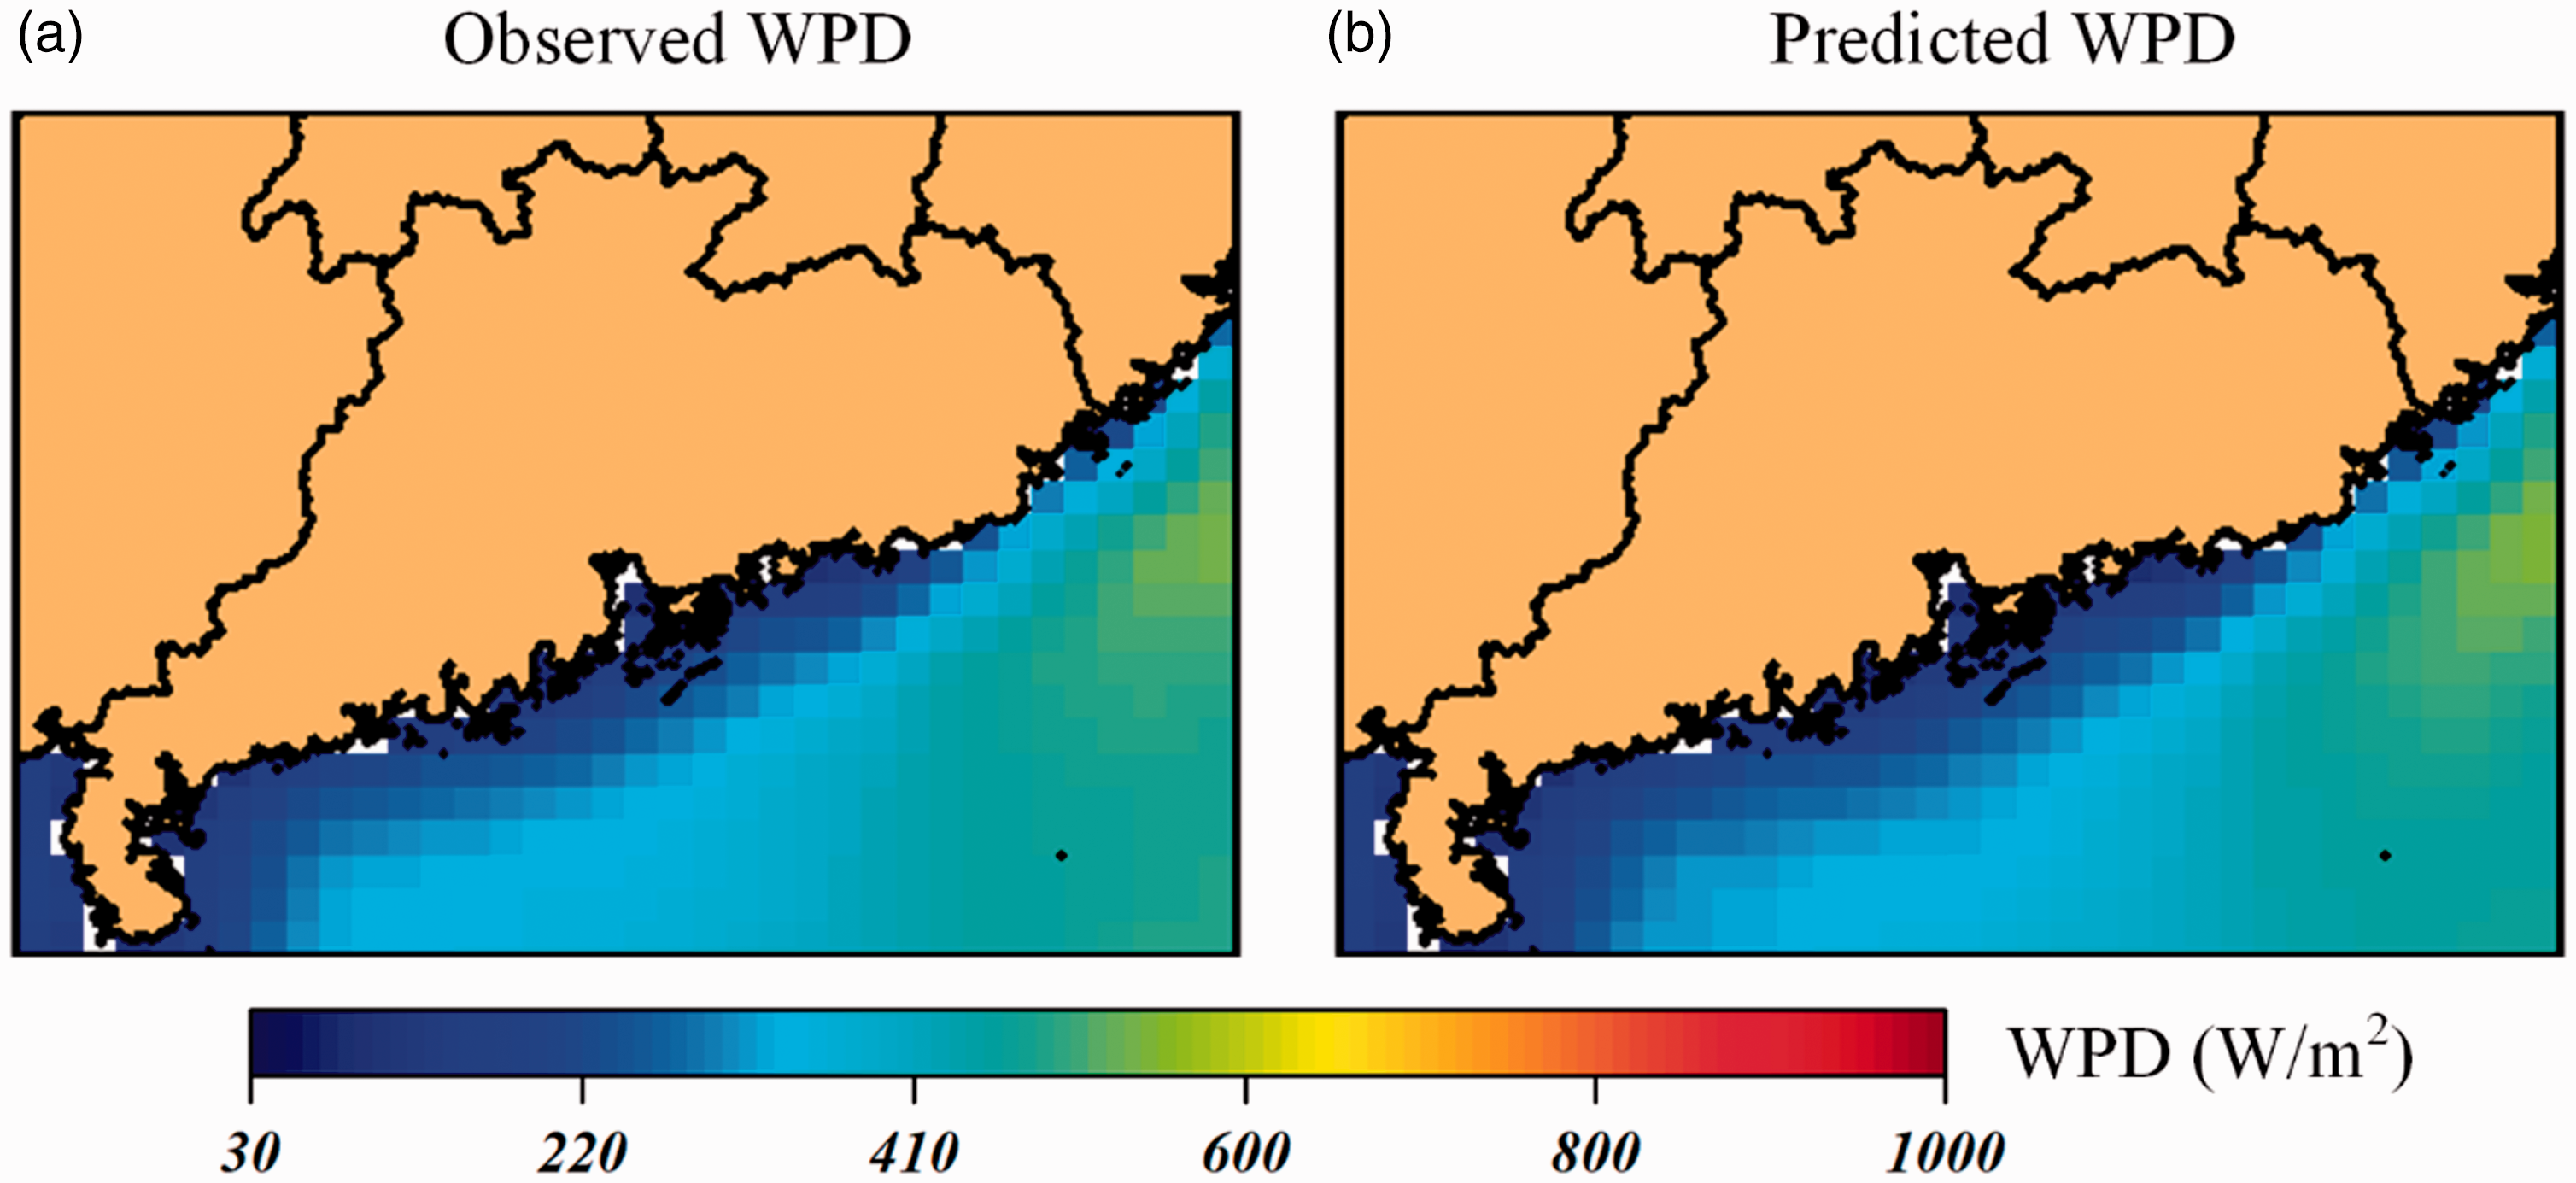
Spatial distribution comparisons of annual offshore WPD values from 2013 in the Guangdong’s coastal waters: (a) observed and (b) predicted.
Conclusions
In this study, an STOK model was developed to predict the offshore WPD on a monthly basis using the CCMP gridded wind field data. To validate the proposed STOK model, monthly WPD values from 2013 were predicted using historical WPD values from 2003 to 2012 in the coastal waters of China’s Guangdong Province. The spatiotemporal product–sum variogram was inferred from historical WPD data, describing the spatiotemporal variability structure of monthly offshore WPD. The periodic structure of the spatiotemporal variogram indicated a high level of autocorrelation over a 12-month period and prioritized the selection of spatial neighborhoods for WPD prediction. The comparison results between the observed and predicted WPD values presented a significant performance of the STOK model. The overall R2 level revealed that the STOK model accounted for >90% of variations in the observed WPD values. The relatively low RPE level indicated that the WPD prediction errors were reasonable and controllable when compared to the observed WPD values. Furthermore, the STOK model accurately predicted the spatial patterns of offshore WPD at monthly, seasonal, and annual time-scales, and identified the coastal waters of eastern Guangdong as having the most abundant wind energy resources.
Overall, the proposed STOK model showed strong potential as a reliable long-term prediction method for offshore wind energy resources. By taking full advantage of the spatiotemporal autocorrelation in offshore WPD data, the STOK model provided a refined characterization of offshore wind energy resources based on spatiotemporal patterns. This comprehensive understanding of the spatiotemporal variation of wind energy resources would benefit the advance planning of the offshore wind energy development.
Initially, we intended to predict monthly offshore WPD values for more than 12 months using the STOK model. Therefore, the historical WPD observations from 2003 to 2012 were selected as training datasets. The WPD observations since 2013 were prepared for validation datasets to detect the valid prediction horizon of the STOK model given the satisfactory results. However, the temporal periodicity exhibited in the spatiotemporal variogram of monthly offshore WPD weakened as the temporal lag increased. The prediction horizon of the STOK model was limited as the prediction accuracy significantly decreased with the extending prediction period. Therefore, through the verification of the WPD prediction results for several years, only the prediction results in 2013 were presented in this study.
The proposed STOK model could not, however, account for the spatiotemporal nonstationarity of the offshore wind field distribution, which may have affected estimation accuracy. In future research, auxiliary variables related to the offshore wind field, such as location coordinates, sea surface temperature, seawater depth, and distance to the coast, will be introduced to model the spatiotemporal variations in offshore WPD data using regression analysis. The detrended residual component, which is assumed spatiotemporally stationary, will be addressed using spatiotemporal simple kriging.
Footnotes
Acknowledgements
Declaration of conflicts of interests
The author(s) declared no potential conflicts of interest with respect to the research, authorship, and/or publication of this article.
Funding
The author(s) disclosed receipt of the following financial support for the research, authorship, and/or publication of this article: This research is jointly supported by the Natural Science Foundation of Guangdong Province (No. 2018A0303130043), the GDAS’ Special Project of Science and Technology Development (No. 2018GDASCX-0902), the Key Special Project for Introduced Talents Team of Southern Marine Science and Engineering Guangdong Laboratory (Guangzhou) (No. GML2019ZD0301), the National Natural Science Foundation of China (No. 41801369 and 41901371), the Science and Technology Planning Project of Guangdong Province (No. 2018B020207002), and the Guangdong Innovative and Entrepreneurial Research Team Program (No. 2016ZT06D336).