
Abstract
Wind generation system is becoming increasingly important as renewable energy sources due to its advantages such as low maintenance requirement and mainly it does not cause environmental contamination. This paper presents the improvement procedure of the transient state and the regulation of the output frequency by adjusting the terminal capacitor. The aim is to provide frequency control of a self-excited induction generator in remote site using different strategies which are based on the adjustment of the reactive power at the outputs of a three-phase self-excited induction generator. A thyristor controlled reactor and a switched resistive load will be used to control reactive power. The proposed particle swarm optimization algorithm technique, location of the thyristor controlled reactor device, and parameter value are optimized simultaneously. The results obtained by this strategy will be compared with those provided by the use of Fuzzy Logic Controller. This study will be conducted through the analysis of the frequency in the steady state and transient case using a developed induction generator numerical model built using MATLAB/Simulink. Simulation and experimental results will be exposed and analyzed considering a resistive inductive load on a laboratory test bench.
Keywords
Introduction
For rural electrification, a large number of communities in isolated sites need renewable energy solutions (Hazra and Sensarma, 2010; Mingjun et al., 2016; Sarsing et al., 2014; Zhang and Ooi, 2013; Zhaoxia et al., 2018). In remote site, the wind turbine equipped with squirrel cage induction machine (IM) presents major benefits if extreme climatic conditions are considered or when the demand for electric power is limited. So for these reasons, the integration of IM in the wind turbines, where the power requested is relatively limited, has become competitive and that can explain their increasing in the electrical energy production (Enany, 2014; Goyal and Palwalia, 2016; Jazaeri and Chitsaz, 2012; Rahim et al., 2009; Yong et al., 2009). The IM is simple, reliable, and requires very little maintenance. It seems the most robust and common for wind energy systems. This induction generator (IG) needs an external supply on reactive power to produce a rotating magnetic flux wave (Ahmed et al., 2004). For this reason, it is necessary to connect capacitor to provide the required reactive power for the machine as well as the connected load. The use of the self-excited induction generator (SEIG) has been discovered for a few decades and was experienced at several remote sites, but the wave quality is not optimized. These difficulties are due to the inverse nature of the problem such as the voltage, the frequency, and the rotor sleep which are unknown at the beginning. In order to address and solve the problem of the unstable operation of this wind turbine generator, many papers propose control strategies and applications of different power electronic controllers for SEIG terminal voltage–frequency control (Aggarwal et al., 2017; Benghanem et al., 2013; Chauhan et al., 2010; Kumar and Palwalia, 2016; Ramirez and Torres, 2007; Rathore and Singh, 2017; Singh et al., 2004). An innovative approach, based on a different IG single-phase equivalent circuit, is described in (Brudny et al., 2008). This solution consists on the use of a non-priority load which will be varied while keeping constant the argument of the total load and capacitor connected at the SEIG stator. The main objective of this work is to propose control strategies to increase the robustness of the regulation system. Also, the study of the transient enhancement of the SEIG by adjusting terminal capacitor connected across the stator terminals will be developed. This work is focused on studying the transient and the steady-state behavior of the SEIG when this one feed an inductive–resistive load.
The idea is to ensure dynamic variation of the capacitor C in accord to the change of reactive power required by the load changes in order to enhance the voltage variation during the transient state.
Therefore, it is necessary to provide means of dynamic compensation of reactive power changes. The procedure is to use a thyristor controlled reactor (TCR) and a regulating impedance to adjust the reactive power at the SEIG outputs.
In this work, our contribution consists of developing a comparative study to analyze the operation of the generator in a controlled area where the frequency is almost constant without the need of a closed loop. For this purpose, the operating points of the SEIG are determined by means of a graphic study based on a theoretical development. Afterwards, one will do the same work using the particle swarm optimization (PSO) algorithm and the obtained results will be compared. Finally, one put the closed loop to control the frequency using a fuzzy logic controller (FLC) and one compare again the different obtained results.
The first section of this paper treats the SEIG operating point computing by means of PSO algorithm. The obtained results will be compared and approved by a numerical and graphical operating point determination. In a later section of this work, a developed strategy based on the FLC to regulate the frequency will be analyzed. Finally, a comparative study to control the frequency and the reactive power at the outputs of the IG will be presented and examined. Computer simulations, experimental tests, and numerical analysis are carried out.
Autonomous wind generator configuration
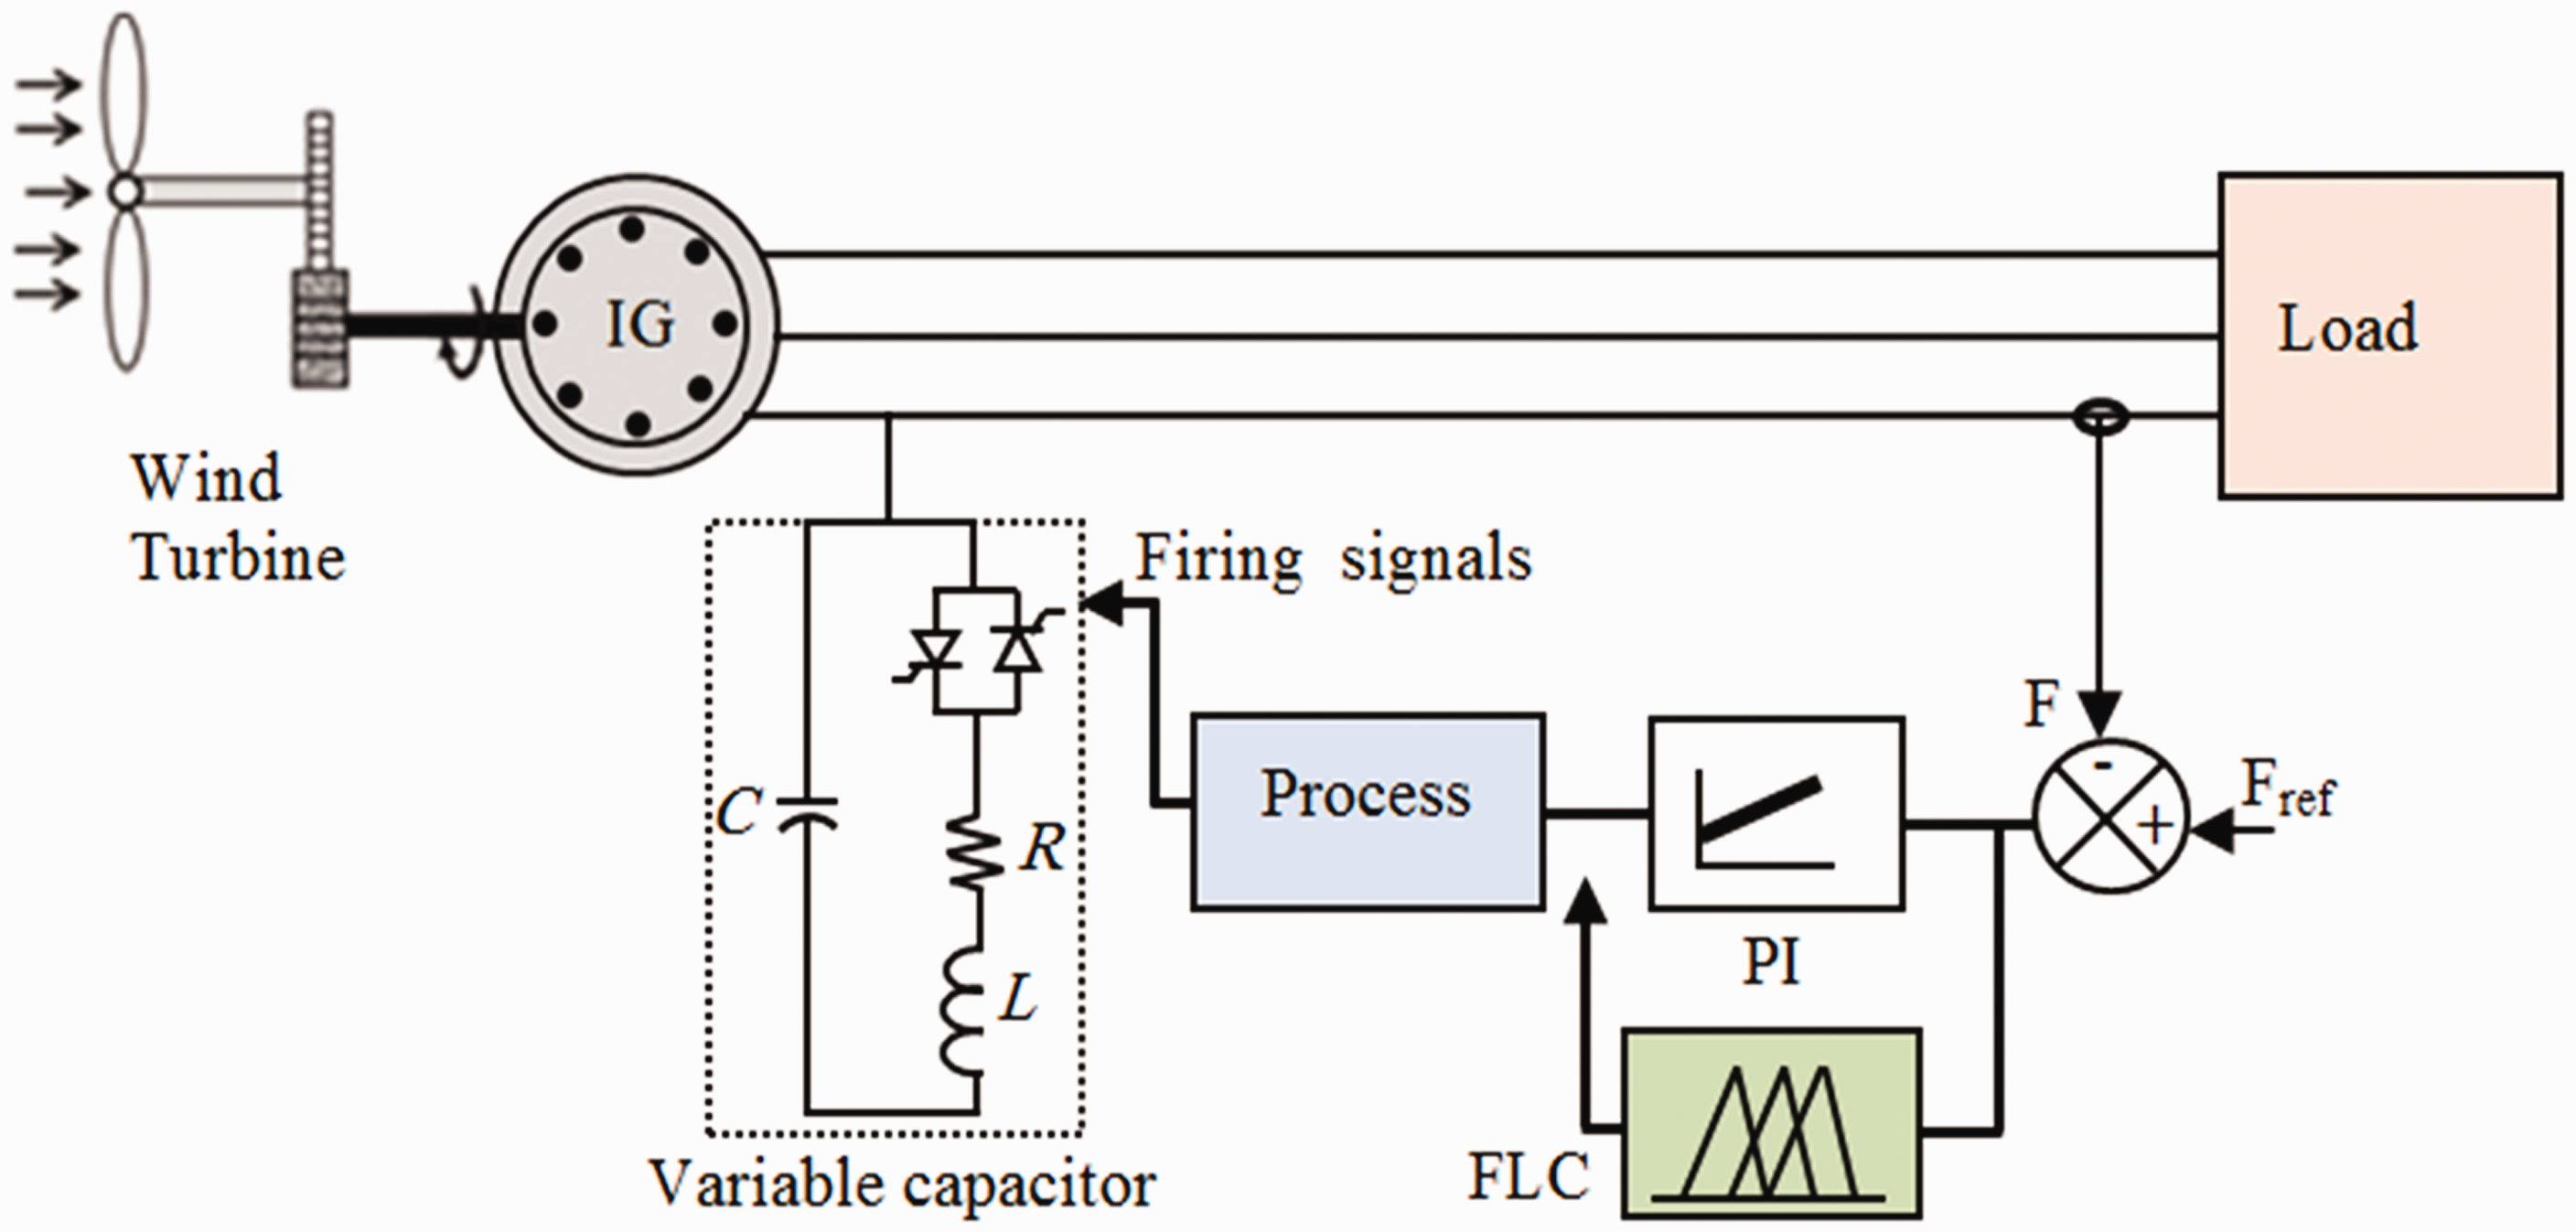
The SEIG system configuration proposed for use in remote site is presented in Figure 1. Driven by the wind, this IG will provide electrical power to supply an inductive–resistive load. A capacitor bank of fixed capacitance CM provides the reactive power required by the machine and the load. This capacitor is placed in parallel with a regulating load (ZR) to act as a variable capacitor which can provide dynamic compensation of the reactive power. In the test bench, a separately excited DC motor is used to ensure the wind turbine power. This motor is controlled by a pulse width modulation chopper, which allows the power regulation at the IG shaft.
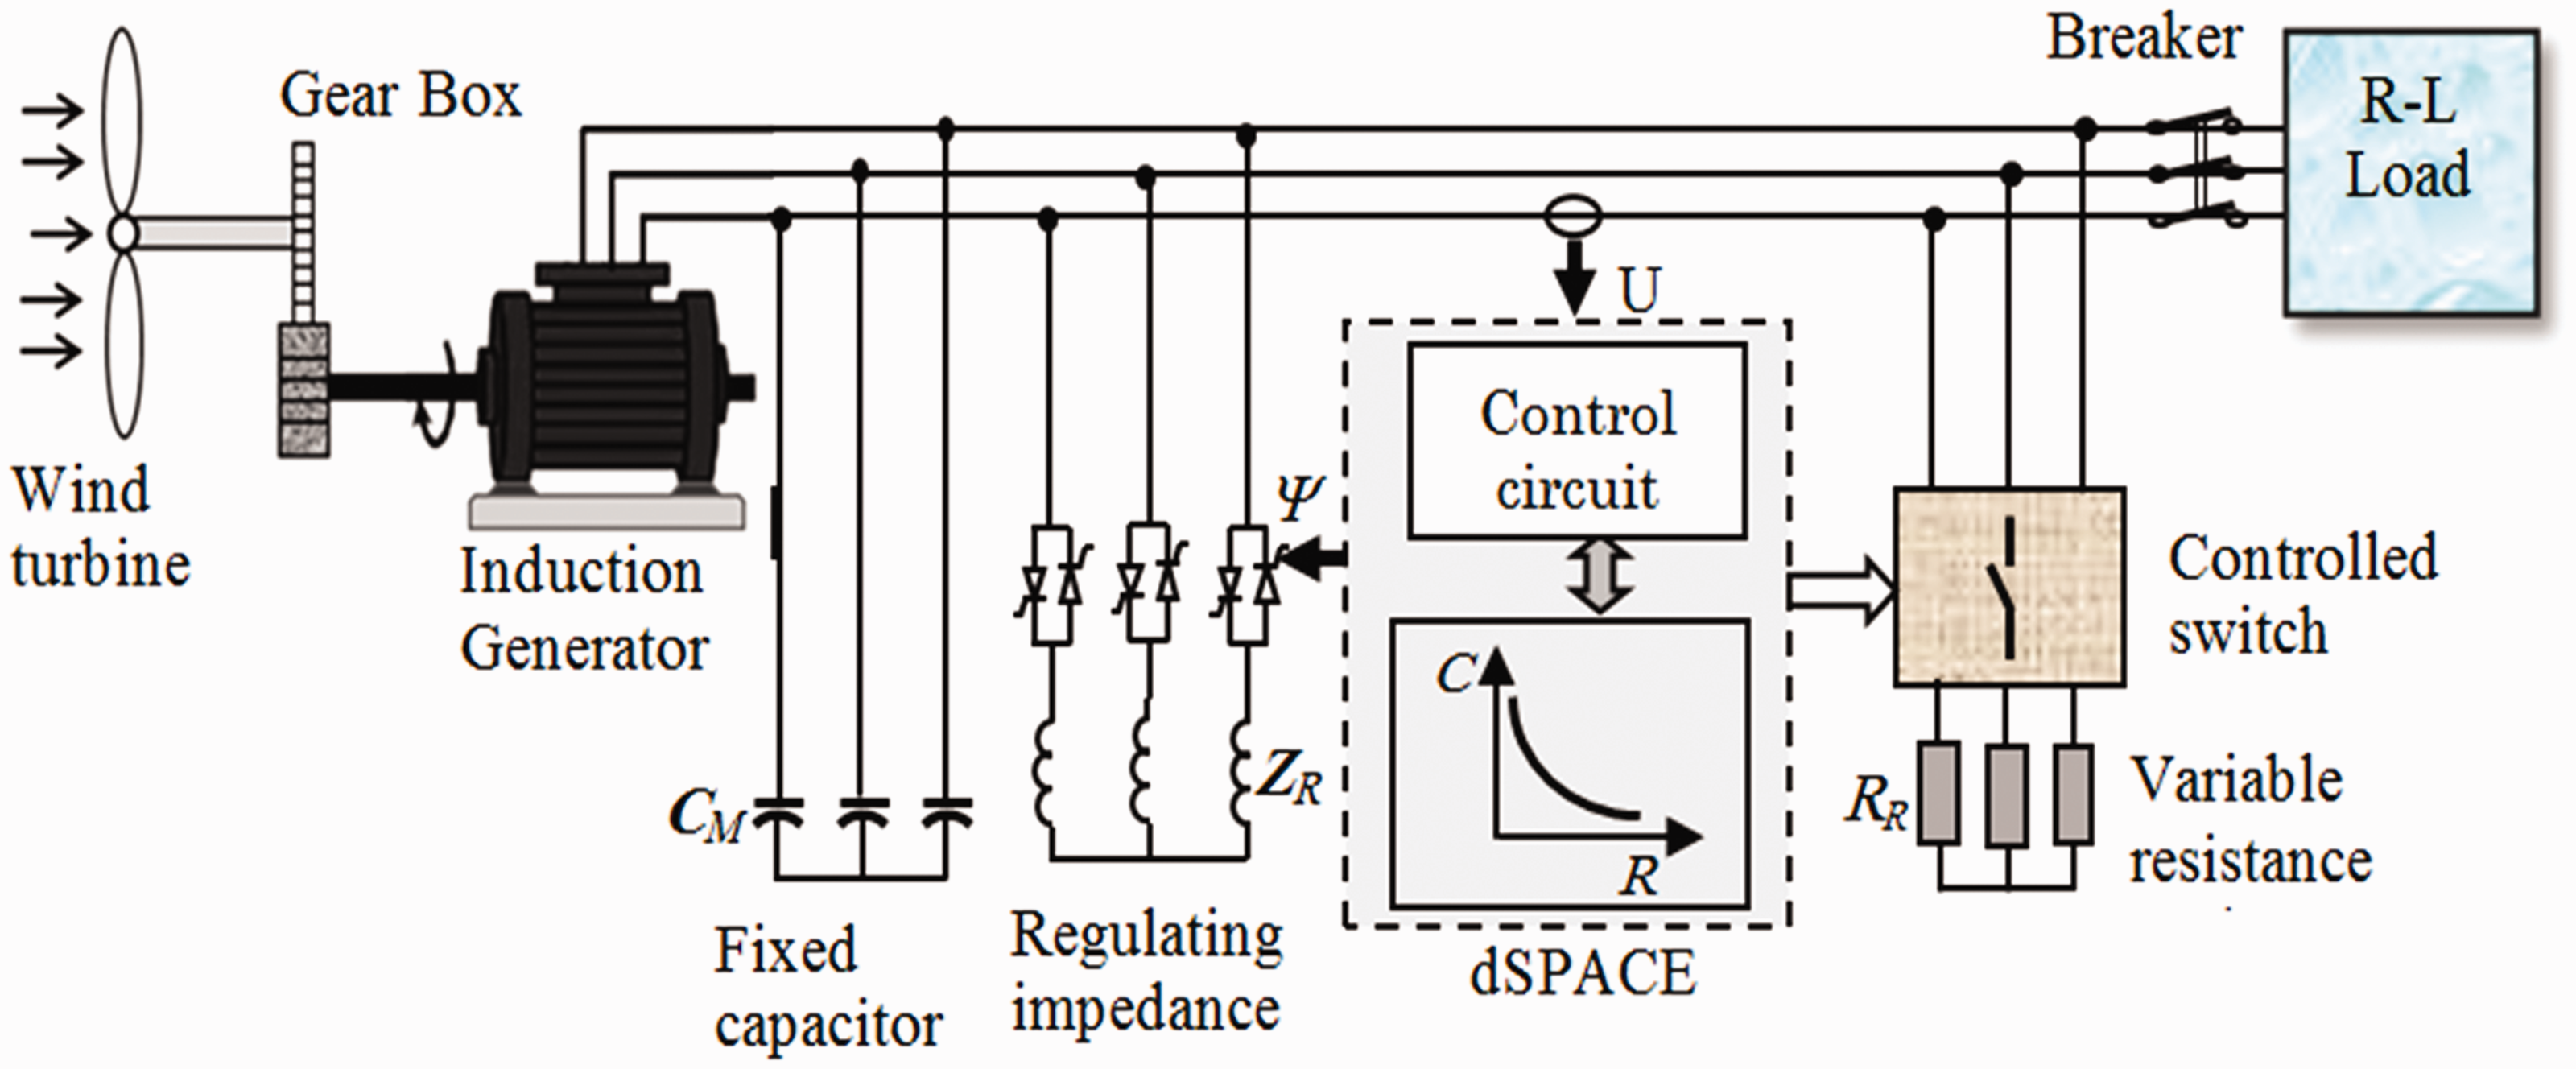
Schematic diagram of a SEIG in autonomous mode.
The objective of the test bench configuration is to provide constant power on the common shaft of the IM and DC machines. Therefore, one performs a voltage and frequency regulation at the output of the SEIG without use of complicated power electronics systems (power electronic converters). In the case of a start-up, only the parameters which characterize the IM and those of the R-L load and C determine ω, s and therefore the angular rotor speed Ω′. Consequently, the DC motor driving the asynchronous generator should not impose its parameters. In fact, at a given time interval, by analogy with the wind turbine blades, the mechanical power Pw applied on the IG shaft should be constant. The other parameters such as, torque, voltage, and current result from the interaction between Pw, the generator, and the load.
SEIG operating point computation
In this section, we will present different methods to compute the operating point of the SEIG. To perform the transient and steady state studies of the IG, the SEIG modeling using space phasor formalism is numerically implemented. By means of the concept of voltage source, Figure 2 presents the single-phase equivalent circuit of a three-phase IM with p pole pairs considering a parallel (R-L) load (Brudny et al., 2008). To provide the required reactive power for self-excitation step and steady state operating, a capacitor is used in parallel with the load.
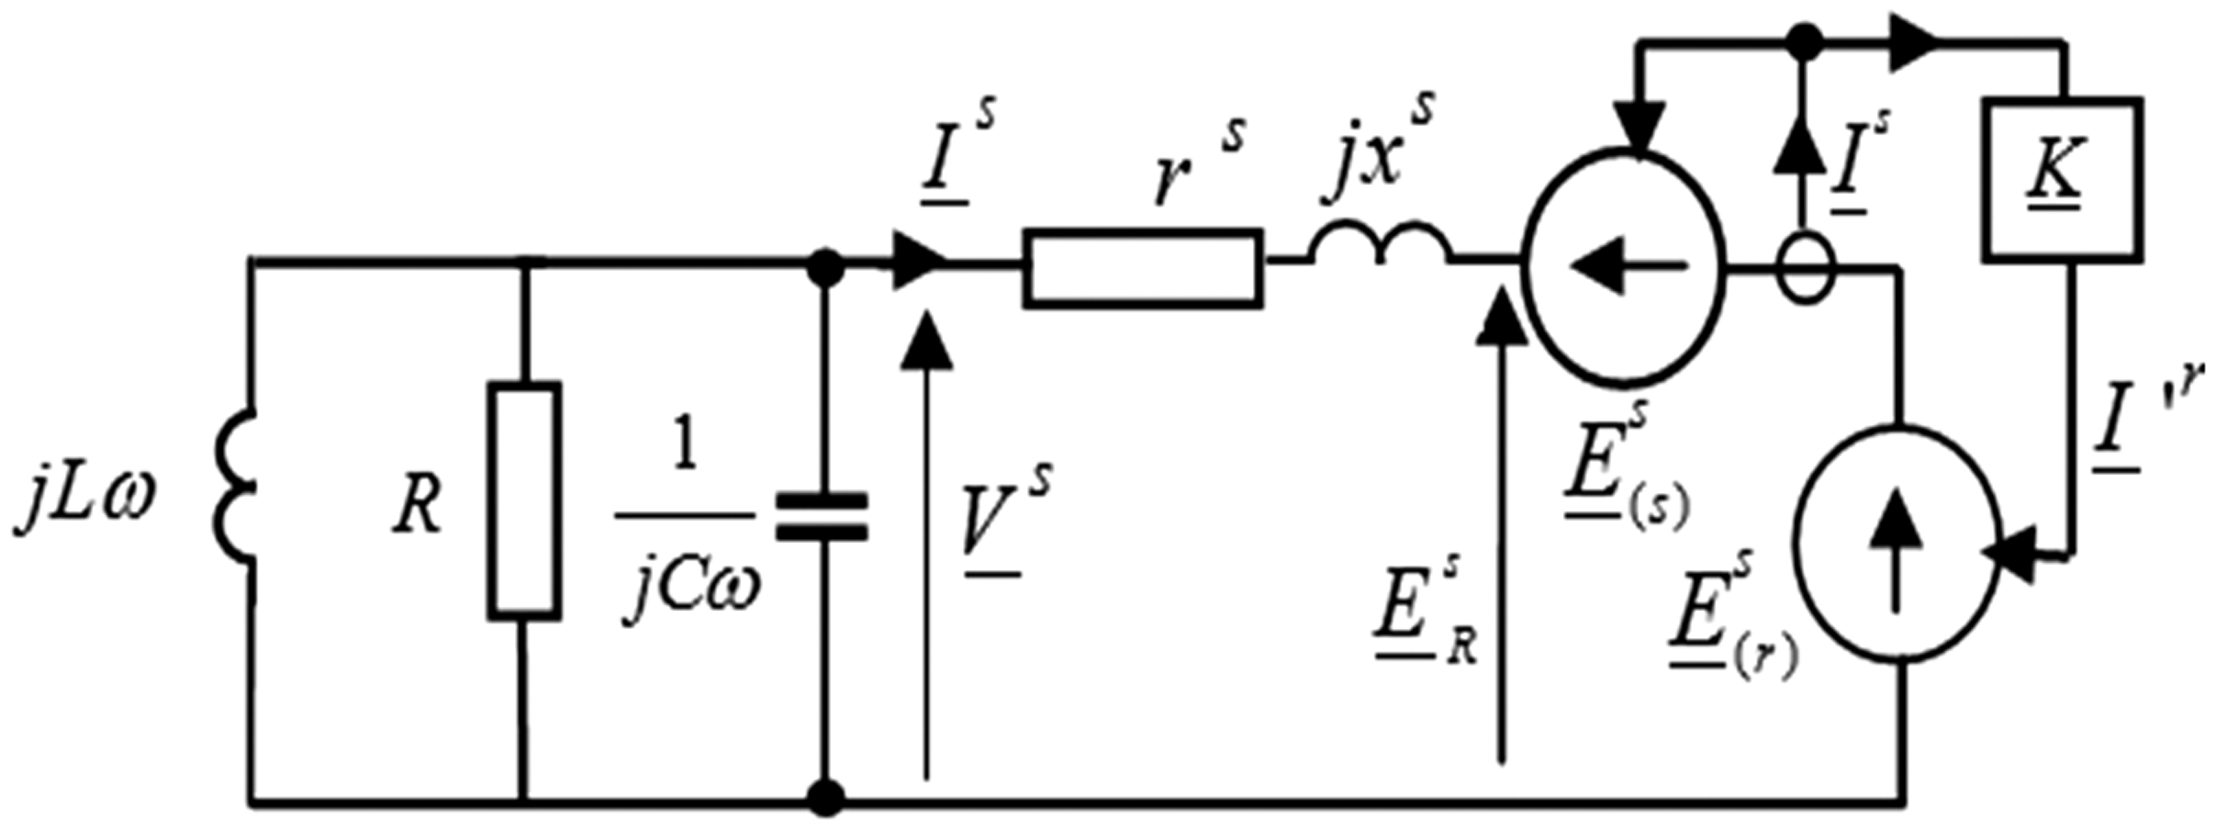
Single-phase equivalent circuit of SEIG.
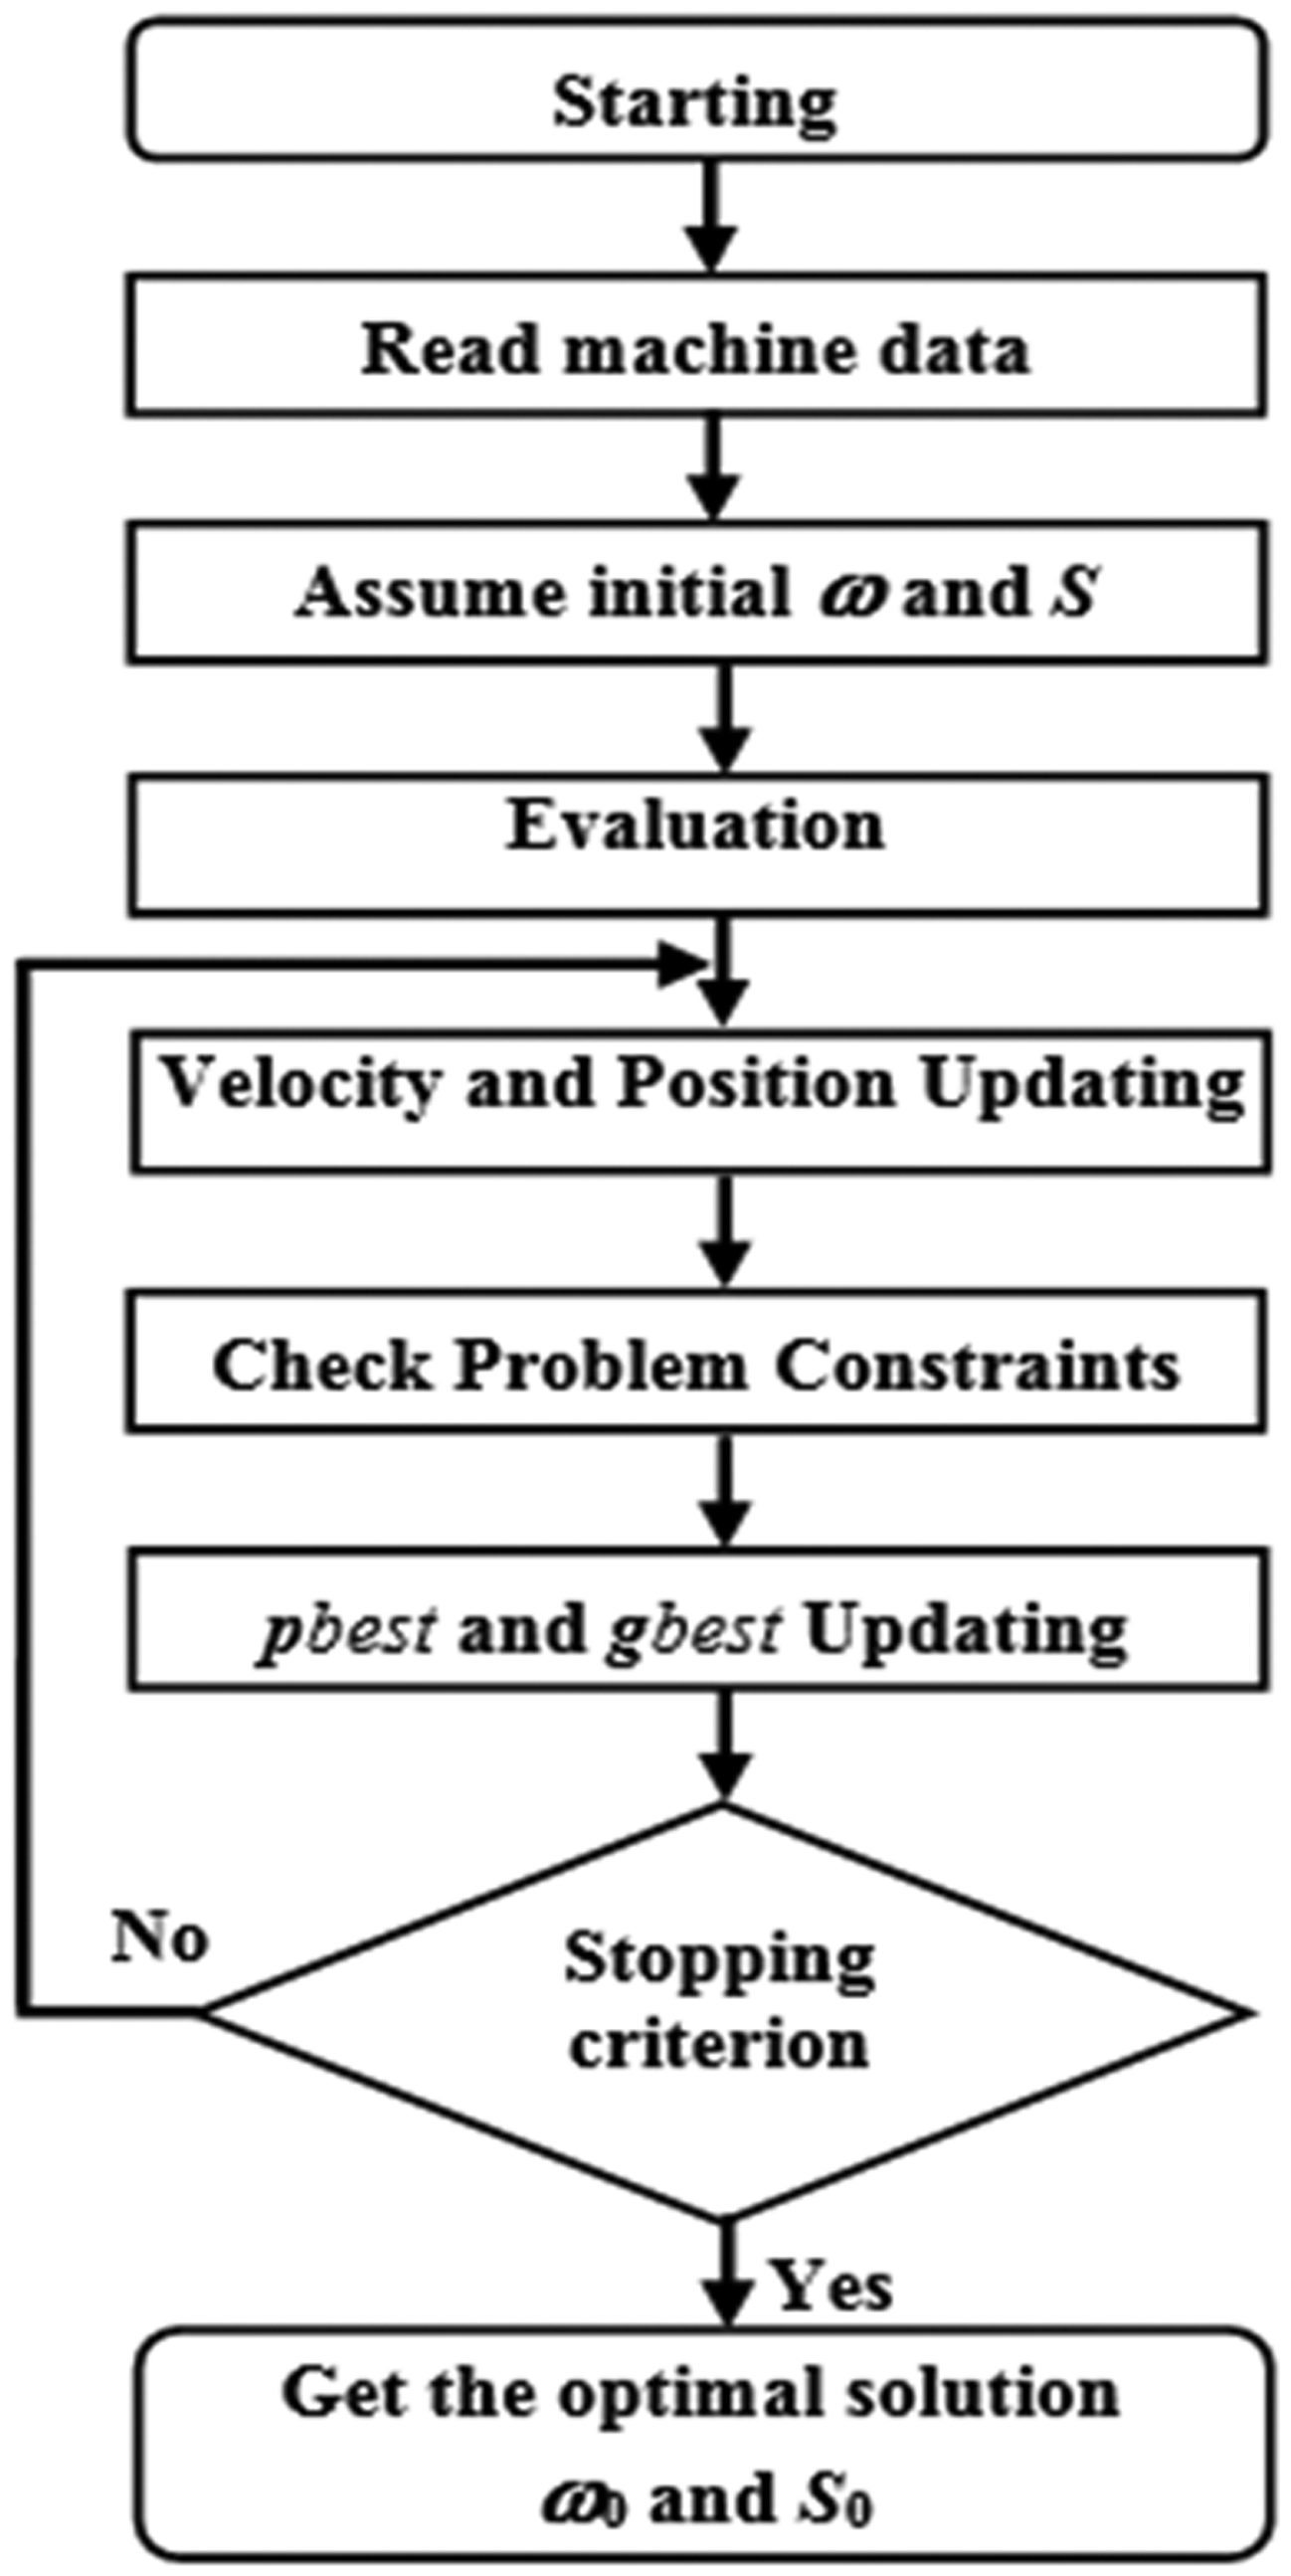
Flow chart of PSO algorithm.
Let us consider S the slip obtained from rotor angular speed:
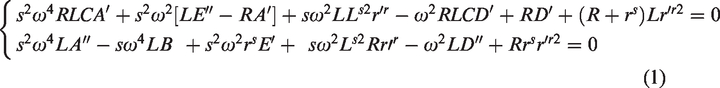
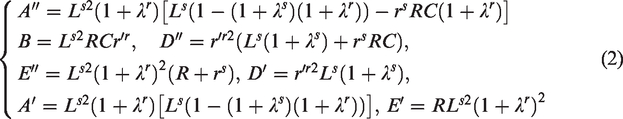
The equations of system 1 show that ω and s depend only on R, C, L, and the machine parameters. Consequently, the IG will be locked on fixed ω and s when these elements are chosen. In order to illustrate the different developments, the considered IG is characterized by the parameters denoted in Appendix A. The various parameters of the machine and that appearing in Figure 2 are given using the conventional no load and blocked rotor tests.
PSO solution
A PSO is one of the modern optimization techniques and can be applied on non-linear and non-continuous optimization problems with both continuous and discrete variables. It has been used in several applications (Babu et al., 2018; Bekakra and Ben Attous, 2014; Bharti et al., 2017; Manas, 2018; Ramdan et al., 2017; Wang and Singh, 2009). PSO is a population-based stochastic optimization technique developed by Kennedy and Eberhart in 1995, inspired by social behavior of bird flocking or fish schooling. In searching procedures by PSO, the particles are flown through the problem space by following the current optimum particles. Each particle keeps track of its coordinates, which are associated with the best solution that it has achieved so far. This solution is called personal best (pbest) and it is kept in the particle memory as the best position on the feasible search space. The best of value obtained so far by any particle in the group is commonly called the global best (gbest).
The basic concept behind the PSO technique consists of changing the velocity of each particle toward its pbest and the gbest positions at each iteration. The velocity and position of each particle can be modified according to the distance between its current position and pbest, and the distance between its current position and gbest. Using equation (3), a certain velocity that gradually gets close to pbests and gbest can be calculated. The current position (searching point in the solution space) can be modified by equation (4)


where
n number of particles in a population, m number of members in a particle (number of variables), vik current velocity of particle i at iteration k, v
i
k + 1 modified velocity of particle i at iteration k + 1, xik current position of particle i at iteration k, x
i
k + 1 modified position of particle i at iteration k + 1, r1, r2 random number between 0 and 1, pbesti pbest of particle i, gbest gbest of the population, c1, c2 acceleration constants.
The constants c1 and c2 represent the weighting of the stochastic acceleration terms that pull each particle toward the pbest and gbest. The random numbers provide stochastic characteristics for the particles velocities in order to simulate the real behavior of the birds in a flock. An inertia weight parameter w was introduced in order to improve the performance of the original PSO model. This parameter provides a balance between global and local explorations, thus requiring less iteration on average to find a sufficiently optimal solution. The inertia weight parameter w often decreases linearly from

By incorporating this parameter into the velocity update equation (6), the modified velocity of each particle can be calculated as follows

PSO algorithm
The general PSO algorithm may be applied to any optimization problem. The steps of the algorithm can be represented as the flow chart shown in Figure 3. The whole PSO algorithm can be described in the following steps:
SEIG operating points.

The initial velocity of each particle can be written as
If If If If
The current searching points are evaluated using the objective function of the target problem. The initial position x0 is set as pbest. Set the particle associated with the best evaluation value among pbests as the gbest.
The current searching points are modified using the state equations (4) to (6) as follows


xik + 1 must satisfy the problem constraints. If xik + 1 violates its constraints, then xik + 1 must be modified toward the near margin of the feasible solution.
If the number of iterations does not reach the maximum number of iterations, then go to step 3. Otherwise, the particle that generates the last gbest is the best evaluation and is considered as the optimal solution. After defining the variation range of w and s and their boundaries which are [300 rd.s−1/316 rd.s−1] for the stator angular frequency
Graphical solution
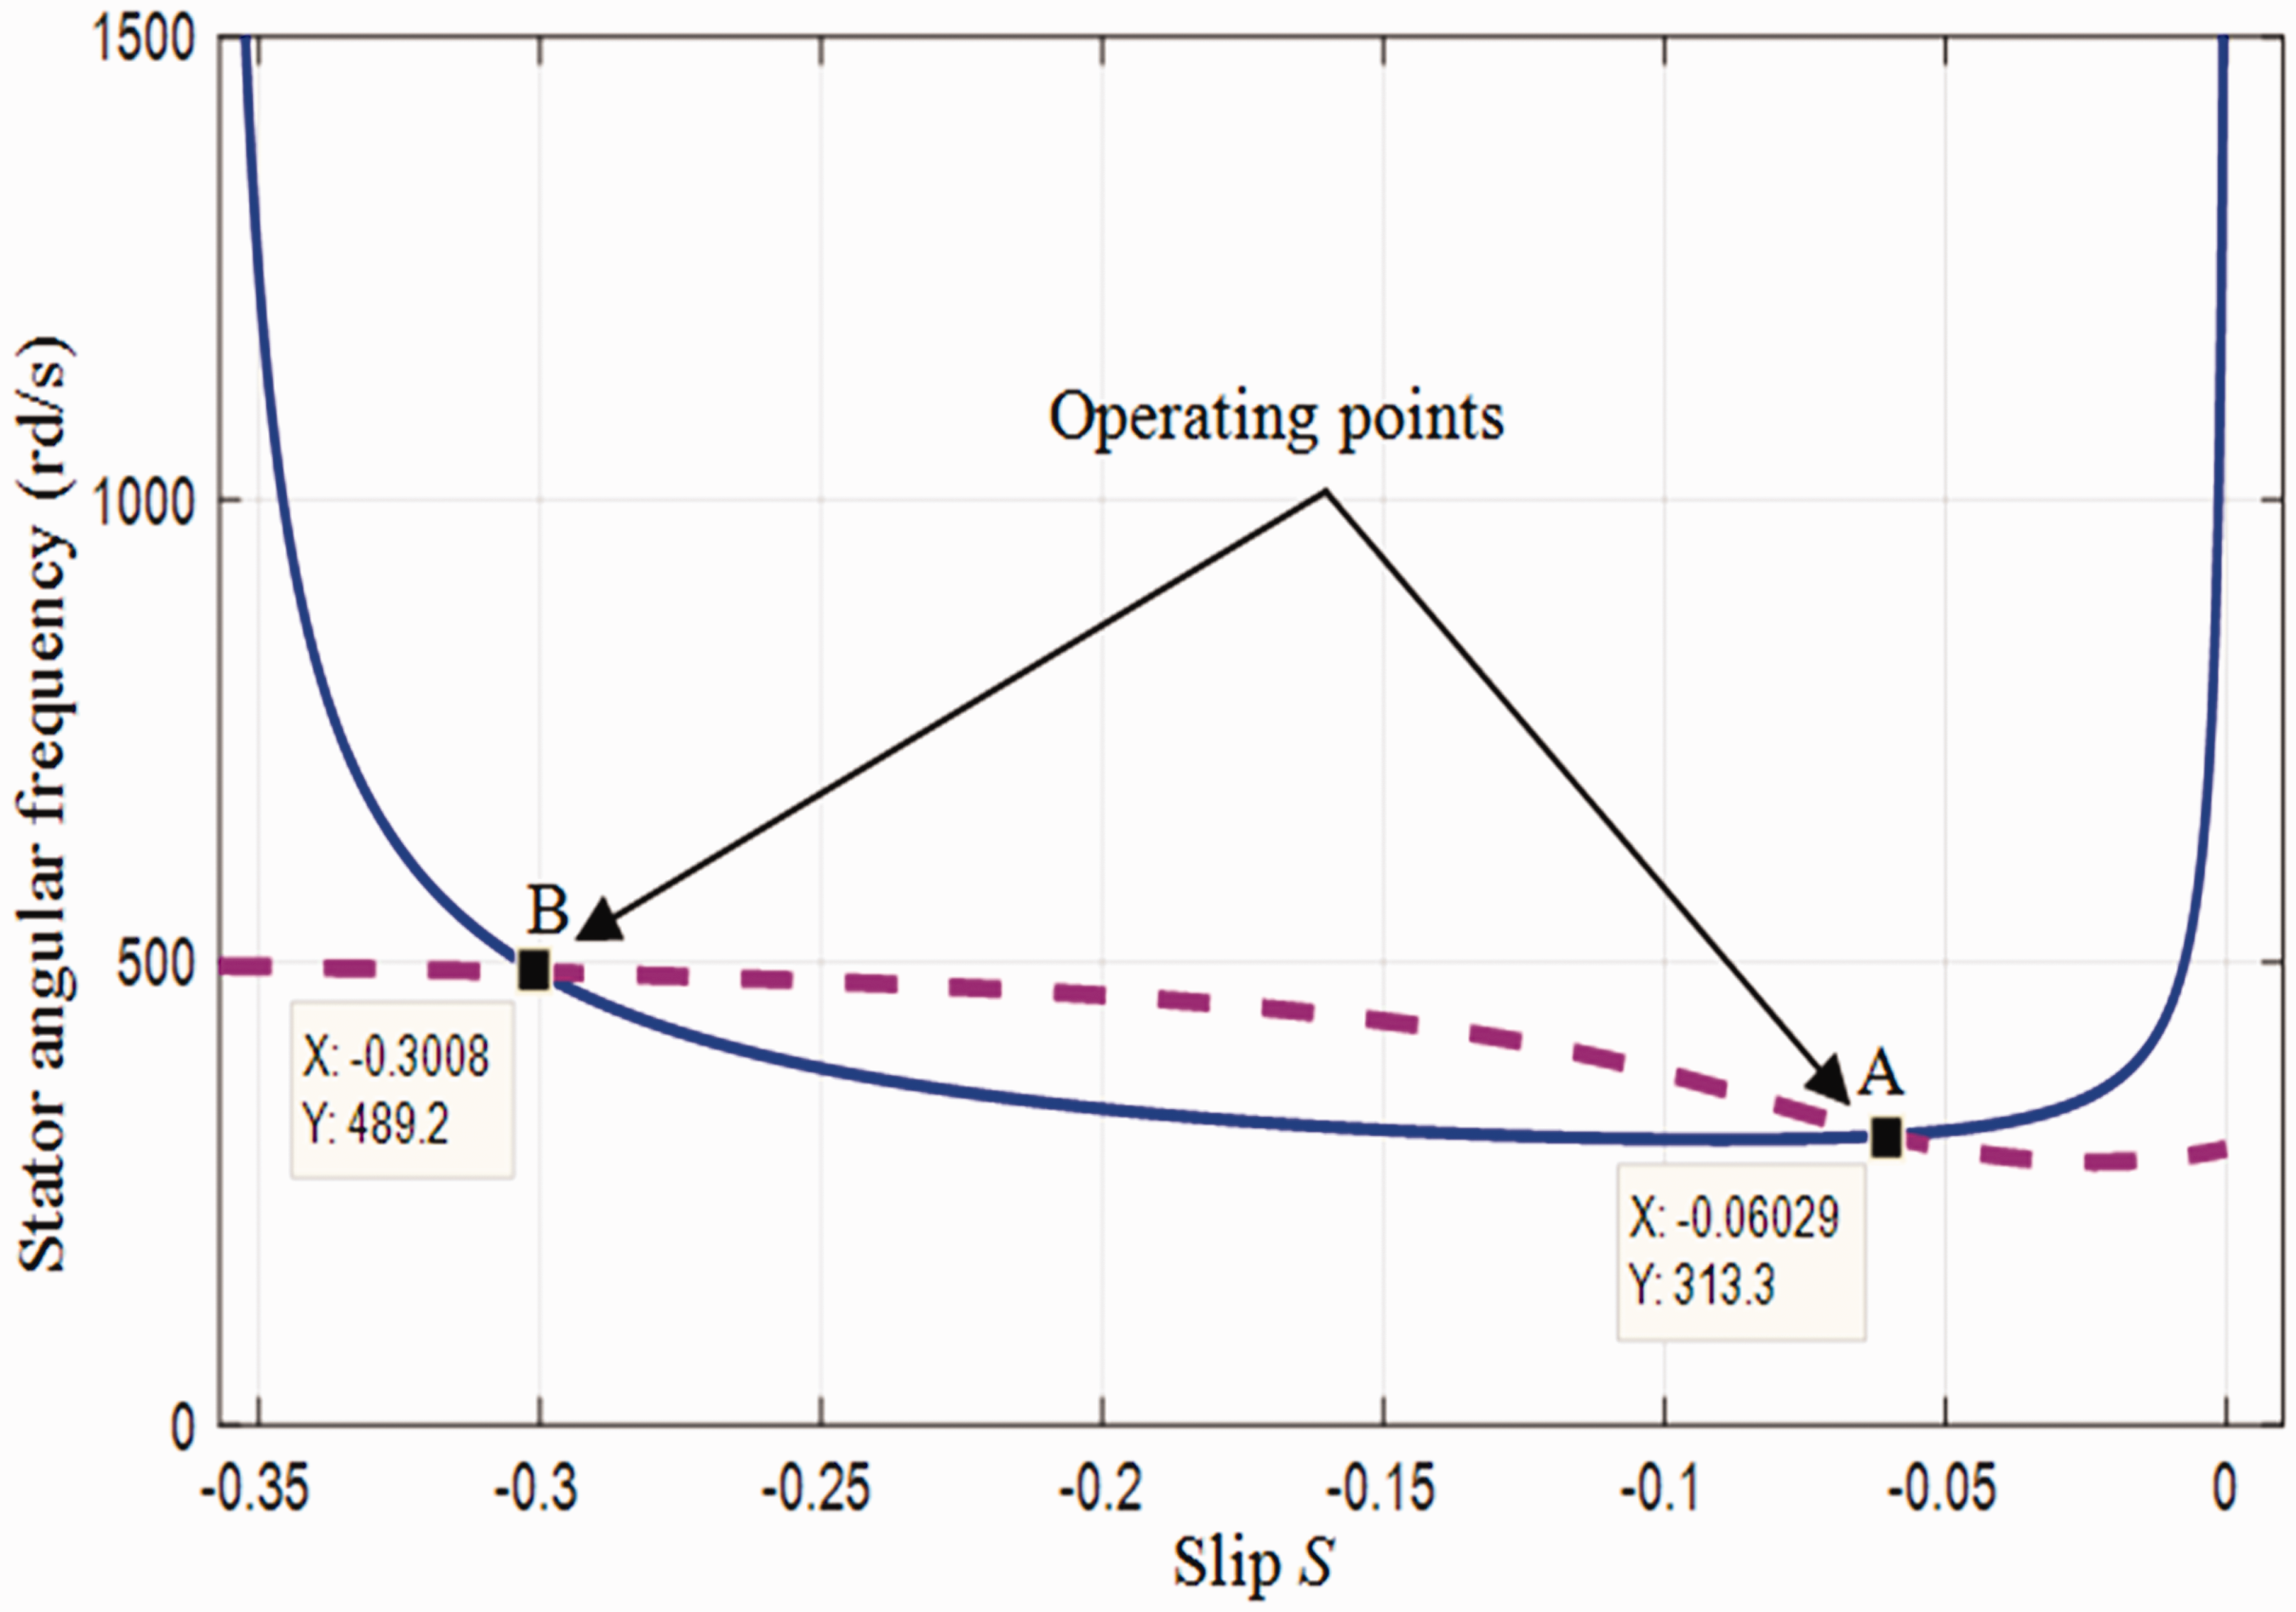
In this section, one presents another procedure to solve the equation system given by equation (1). This method can approve the solutions detailed by graphical method and PSO in the previous section. The resolution of the equation system (equation (1)) leads to the characteristics shown in Figure 4. There are two possible operating points (points A and B) resulting from the characteristics intersections. Implicitly it means that wind generator operation is possible only if w and s satisfy the two equations of this system. Let us consider that ω1 and ω2 are the composed solutions considered in the following study. The operating point (OP) “A”, whose coordinates are sex = –6.029% and ωex = 313.3 rd.s−1, is placed in the characteristic located around ωmin where the variations of ω are relatively restricted.


This area, which contains the operating point A, is classified as stable operating zone. The B operating point is characterized by high values of ω and s which affect directly the stator voltage value. For this reason, this solution is not considered. For each machine, L, R0, and C0 values are chosen in order to place the operating point A in the flattened zone of the curve.
In our case, the numerical application values for considered machine leads to R = R0 = 110 Ω, C = C0 = 87.7 µF, and L = 170 mH. The analytical developments based on the properties which characterize the A operating point show that is possible to keep ω quasi-constant, close to ωex, for R changes when

Impact of L load on the operating point
Considering the machine already presented, we are interested in demonstrating how the operating point is located when the load L varies. Indeed, to appreciate the impact of the L values on the situation of the different operating points which leads to fix the range of L variation, we have taken the initial objectives of the study which consisted in analyzing the behavior of the system when it was connected to the output of the wind generator, an inductive load such as asynchronous motor or pump.
By definition, the pump power must be lower than that of the wind turbine. This peculiarity will be explained by a great magnetizing inductance of the pump compared to that of the wind generator (Ls = 0.534 H). It should be noted that the resistance R0 = 110 Ω is, implicitly, assumed to be constituted of a fixed resistor connected in parallel with the quantity internal resistance of the pump rotor. The cases we are going to deal with are as follows:
L = 0.17 H: Value which is originally chosen L = 0.55 H: Which corresponds to a pump with power similar to that of the wind turbine L = 1 H: Corresponds to a pump with power that is two times lower compared to the wind turbine L = 100 H: Corresponds to a flow on an almost pure resistive load
In order to obtain meaningful comparisons, the values of C and R are adjusted to obtain the same values of ω0 and s0, similar to those previously defined. The obtained results are gathered in Table 1. One can notice that ωex increases with the increase of L, whereas sex keeps a quasi-constant value.
Operating point variation (ωex and sex) versus L changes.
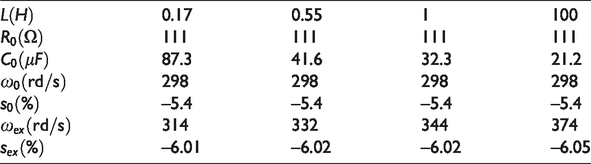
This phenomenon leads to a stable operating system for low values of load L. Indeed, a change in the load state accompanied by a decrease in the slip makes it possible to keep the angular frequency values at a reasonable value even if s is very small. At the same time, ω takes relatively high values for a small change in s when L is large.
Impact of L load on the C capacitor
In practice, the value of L can vary due to the voltage variation. If this variation is significant, it must be taken into account for the computation of the C capacity which provides the reactive power. The relationship (12), used for C calculating, takes into account the possible variations of both L and R. In order to appreciate the L impact on the OPs, it has been depicted in Figure 5 the cases for L taking successively the values 0.136 H, 0.17 H, and 0.204 H. Taking into account the initial OP which is characterized by: R0 = 110 Ω, C0 = 87.7 µF, and L0 = 170 mH, Figure 5 presents the C evolution versus R for different L values.

Impact of L load on the C evolution according to R.
It is noted that for the same value of R, the increase of L causes the decrease of C. Therefore ω takes relatively high values. This can be considered as an adverse effect on the energy performance of the SEIG. For this reason, when L varies, R and C have to be changed according to the relationship (12). This procedure is the aim of the following section.
Reactive power adjustment
Static reactive power compensators or static VAR compensator (SVC) are shunts generating or absorbing reactive power. They can be used to control the voltage, at the points where they are connected, by injecting active or reactive current (Bouzid et al., 2012; Gelen and Yelcinoz, 2010). We can therefore identify them as variable impedance that can be sometimes inductive or capacitive load. The SVC is consisting of capacitors and inductances which are controlled by thyristors. They can allow the voltage regulation by controlling the reactive power quantity which will be provided or removed. The SVC can be considered as variable impedance which may response quickly to modification due to the sudden load variations. The current flowing through the reactance is variable between zero and its maximum value via the regulation of the thyristor firing angle.
Fixed capacitor TCR configuration
The fixed capacitor thyristor controlled reactor configuration (FC-TCR), shown in Figure 6, is used during our carried out study. It is made up of a fixed capacitor in parallel with the TCR which makes it possible to take advantage of existing capacitors for self-excitation IG. It suffices to choose a maximum value of all the capacitors necessary to supply the reactive power demanded by the machine as well as the neighboring charges. This configuration is used when the absorption and production of reactive energy is necessary. The value of the TCR reactance is variable and depends on the firing angle of the thyristors (Haque et al., 1985). Therefore the reactive power absorbed by the TCR is variable. The value of the inductance increases with the increase of the firing angle. This increase causes the decrease of the reactive power which will be absorbed.
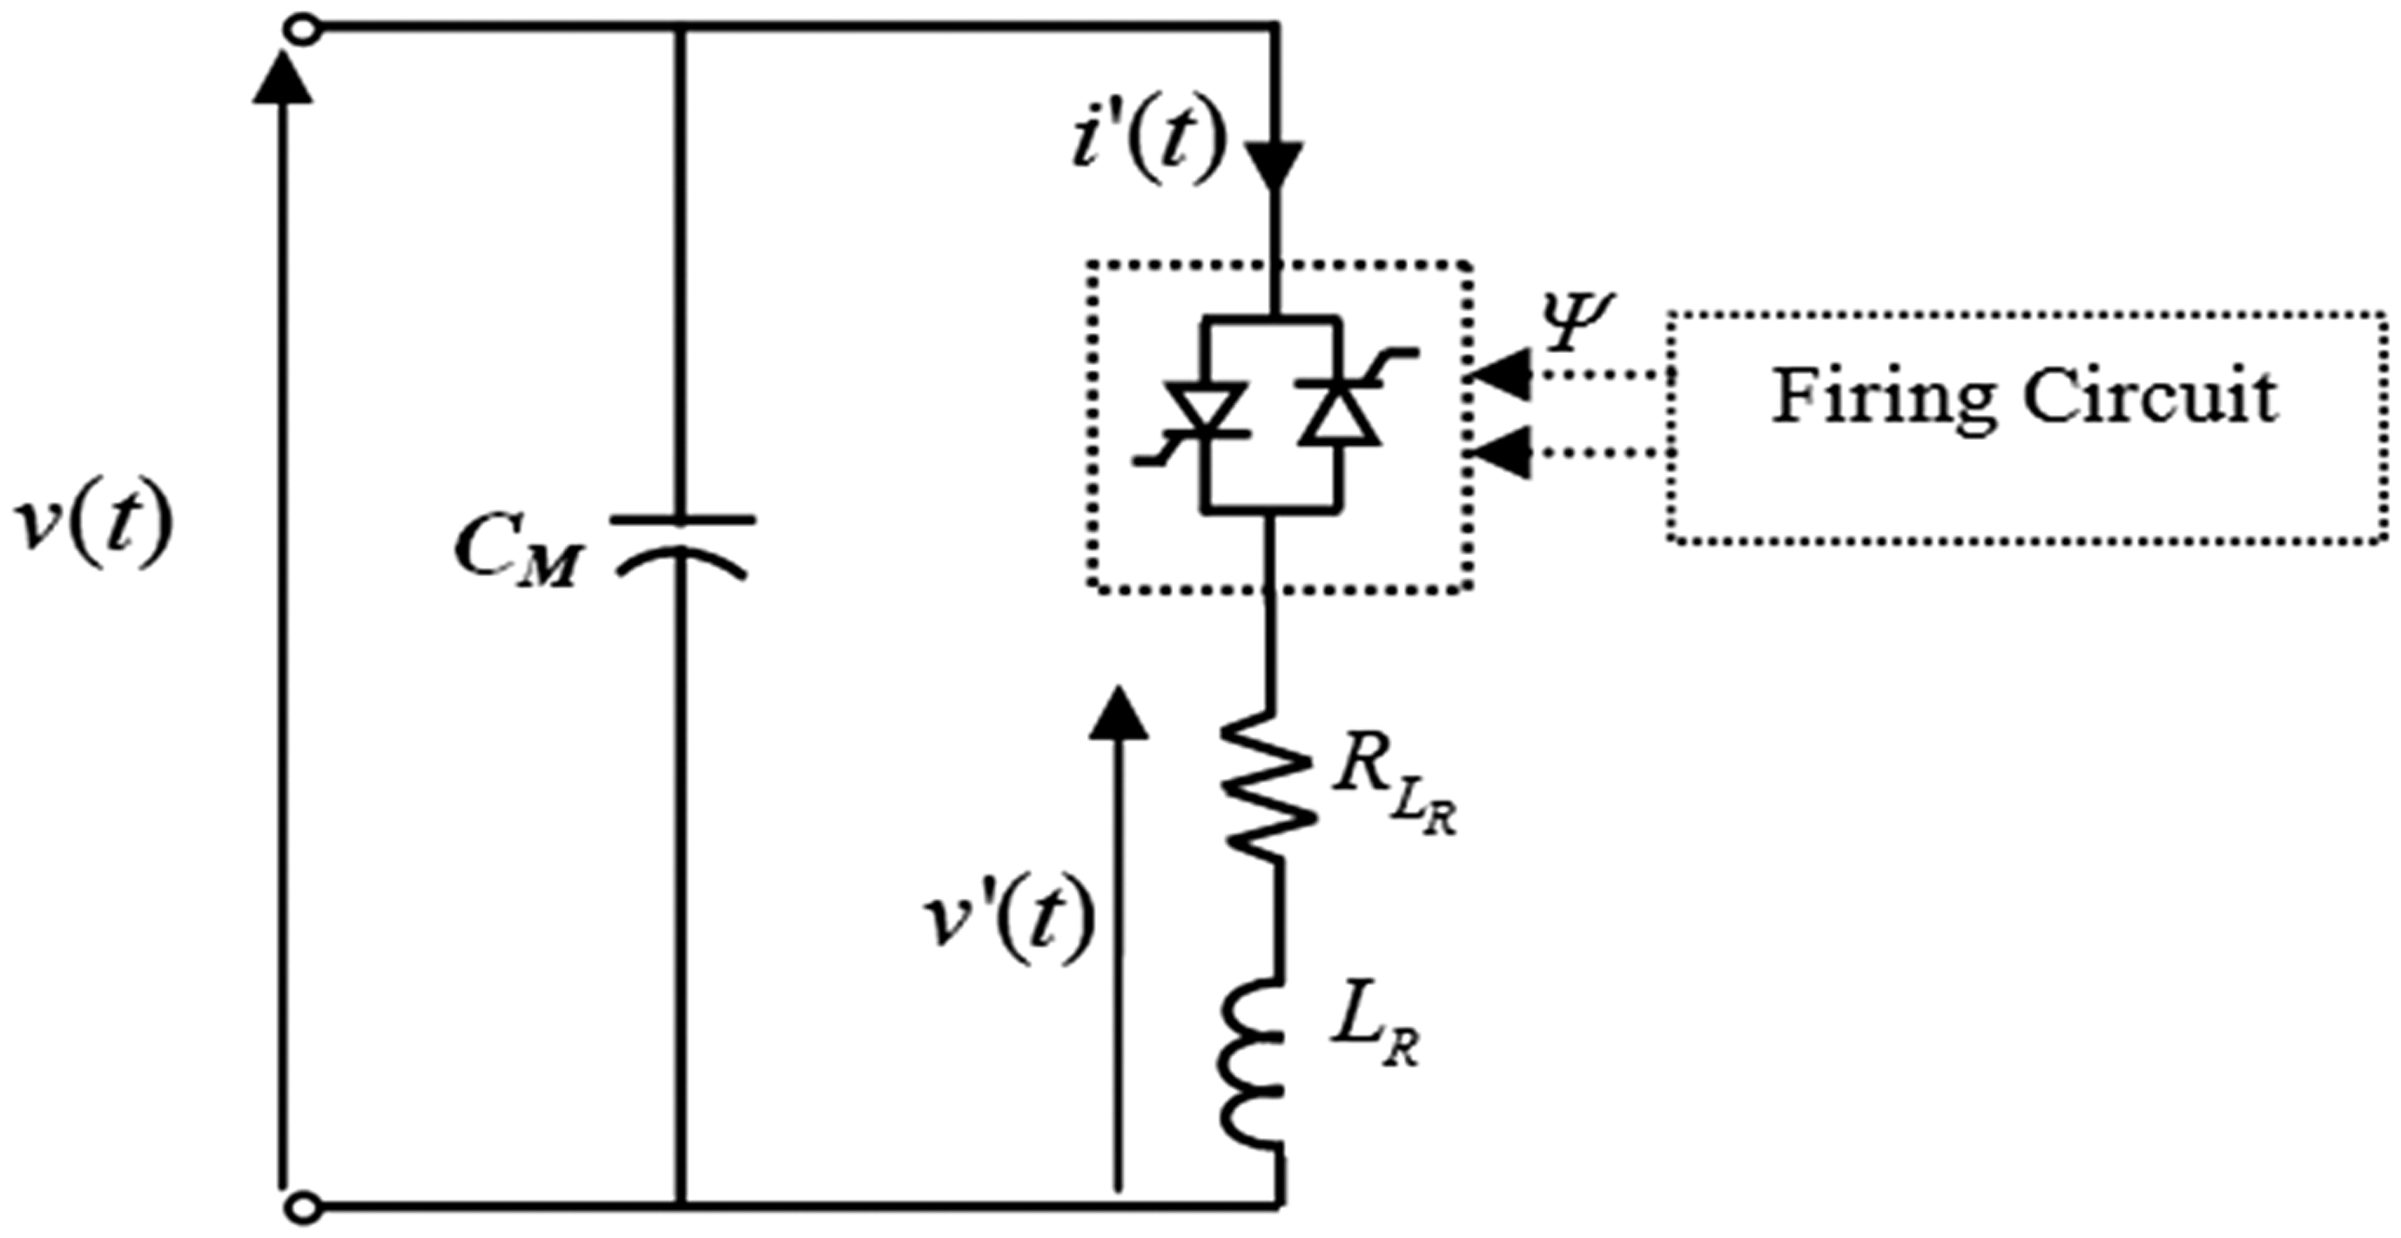
Configuration FC-TCR.
Variable capacitor design
The configuration shown in Figure 6 is used when the production of reactive power or alternatively, absorption and production are needed. For a given R-L load, the first step consists on finding by numerical simulation adequate pairs (R,C) using the analytical method already described. The C changes are obtained using a fixed capacitor CM parallel connected with an LR inductance series connected with a dimmer. The aim is to control the C variations after R changes from the initial values when these operating point change. This procedure is realized by means of a regulating impedance made up of inductor LR in series with resistor RR as shown in Figure 6. The curves of the
Waveforms in the regulating load for a firing angle
Let us assume that LR absorbs a part of reactive power which is provided by the total capacitor CM, the capacitance of capacitor removed 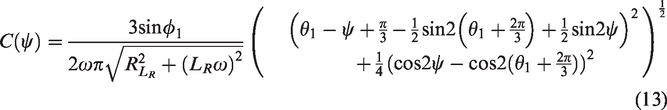

Taking into account the relationship (13), the maximum capacitance CM for each phase is modified via the used dimmer to an equivalent value Ceq given by

Influence of distorting regime
In order to analyze the inductive nature of the circuit and to calculate the C capacitor with accurate values, we will propose an approach which takes into account the distorting regime. Given the symmetry of the dimmer control signals, Fourier analyzes spectrum contains only the odd harmonics. The different powers are expressed by
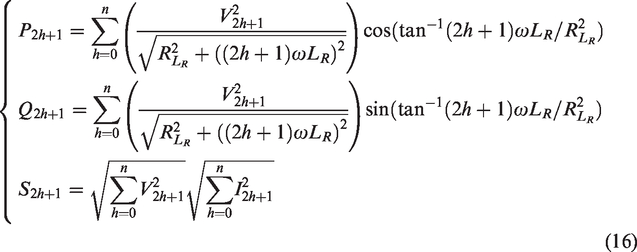
The distorting power is defined by

Where
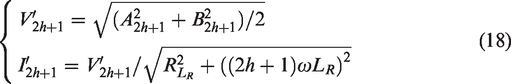
Let us assume that distorting power is a reactive power, so the capacitance of the corresponding capacitor can be expressed as

In our study of three-phase system, there is no harmonic 3 and multiple of 3 (D2k + 1 =D1,5,7, …). Consequently, the relationship (17) must be calculated without considering these harmonic. Therefore, the relationship (15) can be written as

So the variation of the R load is accompanied by a change of a final equivalent capacitor Ceq(ψ) through changing the firing angle ψ. In this case, the equivalent reactive power available on the isolated grid will be defined by

In practice, the evolution of ψ depends on the previously calculated values in order to ensure a relative voltage stability obtained by coupling or decoupling the non-priority loads.
Simulation results
SEIG modeling
The asynchronous generator modeling is carried out using an analytical model based on space vector formalism to study the transient and steady state. The rotor and stator spatial reference (
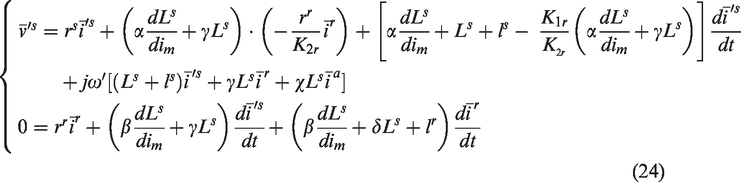
While the equations of the fluxes linked by the stator, the rotor, and the fictitious windings can be expressed as
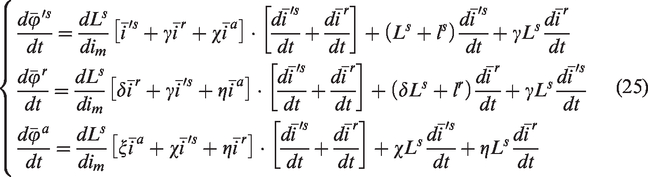
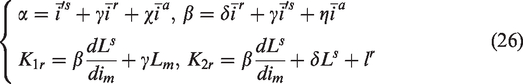
The parameters met in equation (26) are given by:
This model is developed in order to take into account the saturation effect. Nevertheless, in this study, the SEIG model is developed without considering the saturation effect. So, in these conditions,
Impact of the load on the voltage and the frequency
In this section, the given simulation results present the variations of the space vector modulus (Figure 8(a)) and those of the rotor angular speed (Figure 8(b)). The steady state is reached when
SEIG response to sudden change of the load: (a) stator voltage and (b) rotor angular speed.
Load variation at various capacitor state
The instantaneous line-to-line voltage is presented in this section. For a constant wind power 1800 W applied to the SEIG shaft, the variations of the stator voltage at constant C value are shown in Figure 9. The steady state is characterized by a stator line-to-line voltage U = 550 V and a stator angular frequency ω = 313.1 rd.s−1 (49.8 Hz). The analysis is performed by considering a resistive inductive load while driving the SEIG by constant power across its shaft. The case of a load variation is presented in Figure 9(a) at t = 7s. This Figure shows a simulation of the stator instantaneous line-to-line voltage considering an increase in the resistive load (from R0 = 110 Ω to R2 = 85.5 Ω) at constant C = 87.7 µF. It is noticed that, during the load tilting, the voltage tends to decrease with strong oscillations during the transient state because the reactive power provided by C is kept constant. This can be dangerous for the machine and the neighboring devices. On the other hand, the case of a load variation with considered value of the capacity is presented in Figure 9(b). This Figure shows a simulation of the stator instantaneous line-to-line voltage considering an increase in the resistive load while varying C (from 87.7 µF to 95.8 µF). It is remarked an enhancement during the transient. One can notice, by means of C variation, an oscillations improvement and a short transient explained by continuous exchange of variable reactive power between the loads when
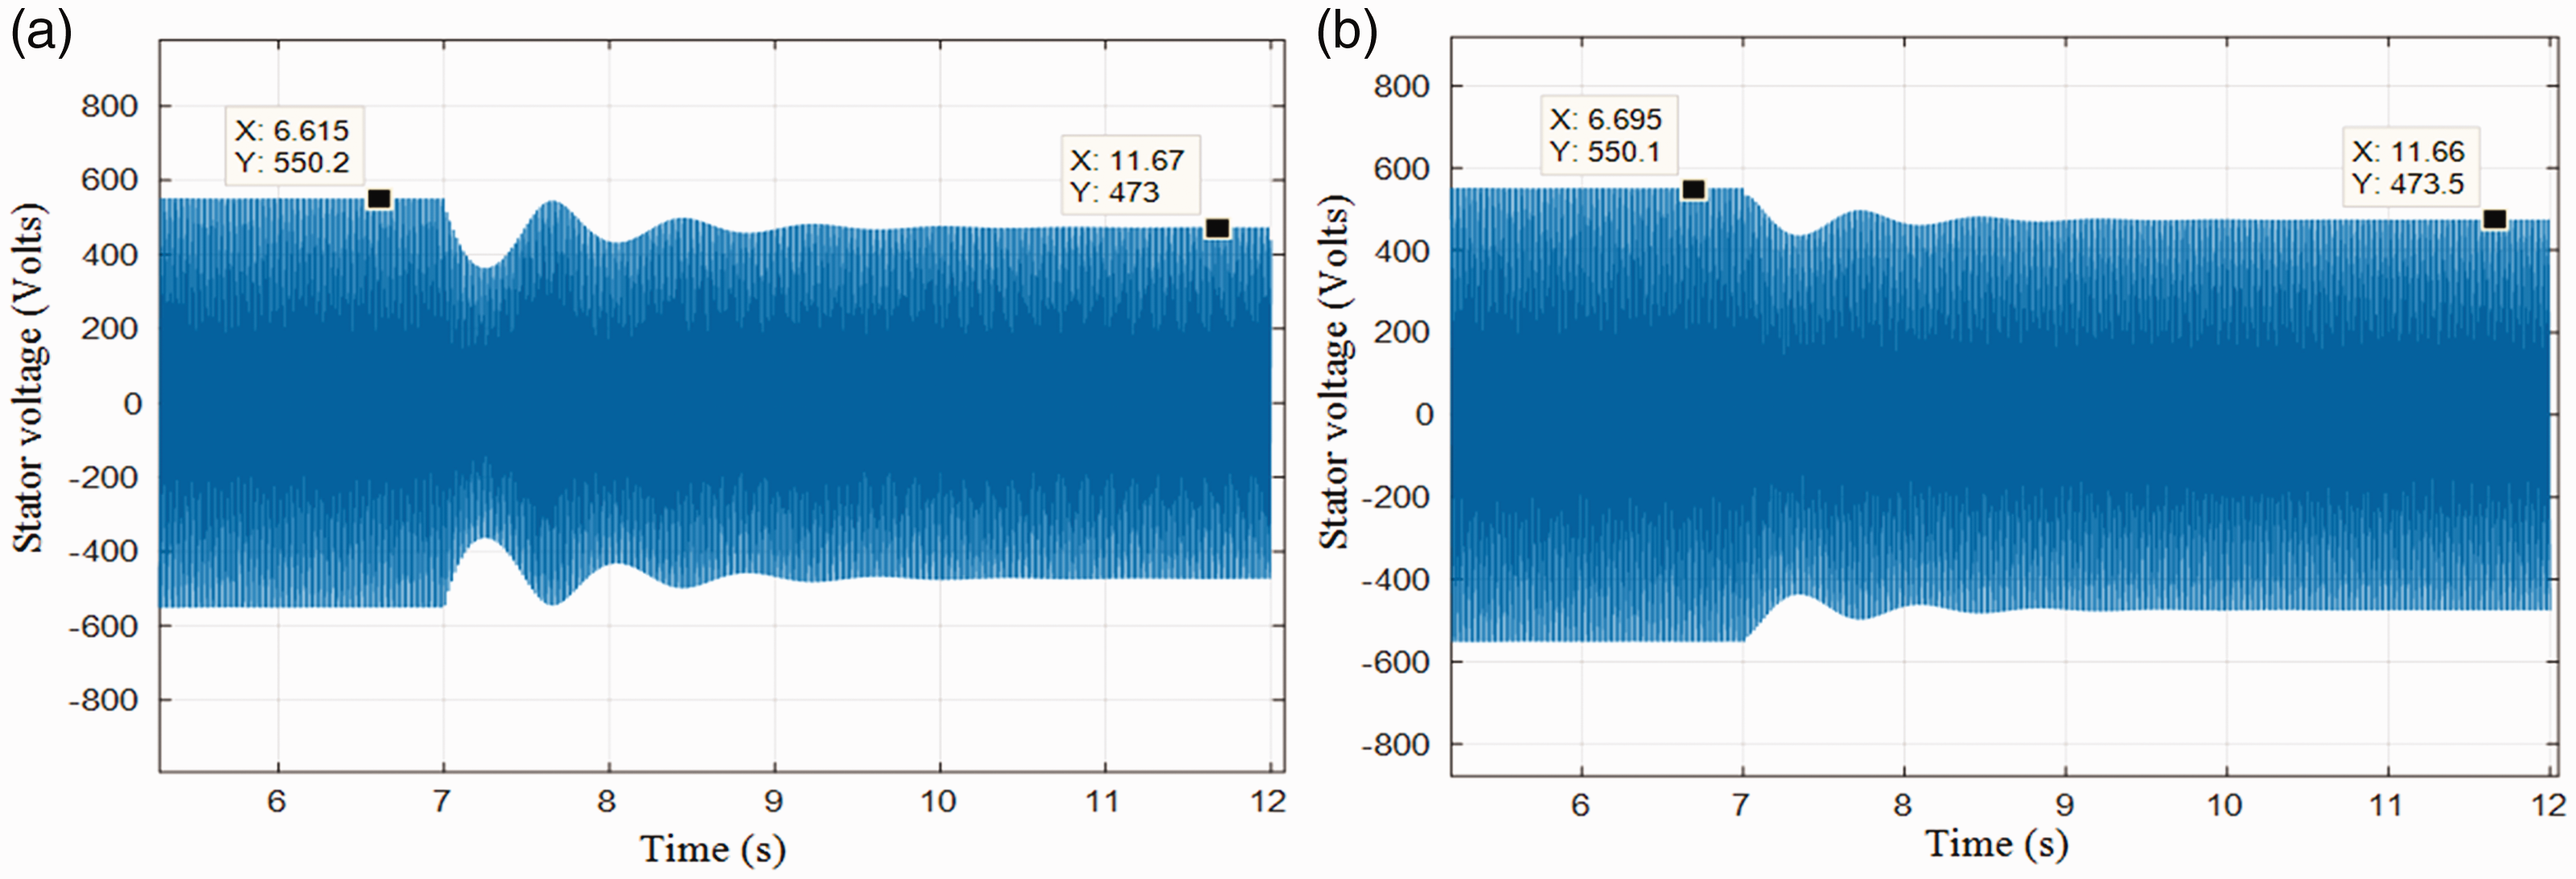
Stator voltage evolution during load change: (a) at constant C capacitor and (b) at variable C capacitor.
One can conclude that changing C with R variation in accord to relation (17) is necessary and it improves the voltage and the frequency stability. So in the case of power wind variation, it is possible to ensure the voltage control by changing the R value (active power) and it is possible to keep quasi-constant the frequency by adapting C respecting relation (22). This adaptation can be ensured by TCR system that feeds regulating inductive load placed in parallel with CM in order to modify the reactive power and therefore the equivalent capacity Ceq.
SEIG frequency regulation
The wind turbine equipped with IG is considered as a nonlinear system. This system presents a marked fluctuation in the magnitude and frequency of the voltage at the outputs of the SEIG. Taking into account the benefits related to the FLC (Galdi et al., 2008; Lin et al., 2007), its use seems to be a good alternative for regulating the frequency because of the linear controller presents difficulties especially for transient states. The configuration of the considered system is given by Figure 10. The fuzzy controller uses the measured f frequency compared with a reference fref. It can involve three levels: measured signals preprocessing, application of the fuzzy rules set, and the decisional and final processing level. It can be implemented easily using a low-cost microprocessor. The fuzzy controller generates a control signal which will be transformed into an analog signal (0–10 V). This signal is proportional to the firing angle applied to the TCR. By this procedure, the reactive power delivered by the CM capacitor and consumed by the inductance LR placed in series with a dimmer will be regulated. The fuzzy controller considered in the studied control scheme is the Mamdany type.
Schematic diagram of fuzzy control scheme.
Considering this configuration for SEIG frequency regulation, the gains at the input and the output of the fuzzy controller are respectively 0.279, 0.988, and 3.799. These gains evaluation are based on the experiment in order to lead to the desired quality setting. In this case, the triangular functions are chosen with normalized interval. The considered error is in the range [–2.9% to 2.9%] and [–29% to 29%] for error variation. The linguistic variables utilized in the membership functions are BN, MN, SN, JZ, SP, MP, and BP where BN means “Big Negative”, BP “Big Positive”, MN “Medium Negative”, MP “Medium Positive”, SN “Smaller Negative”, SP “Smaller Positive”, and JZ “Just Zero”. Figure 11 shows the membership functions of the used FLC input. Whereas, the membership functions of the output is given by Figure 12. Then, the rule-based fuzzy models are summarized and listed in Table 2.
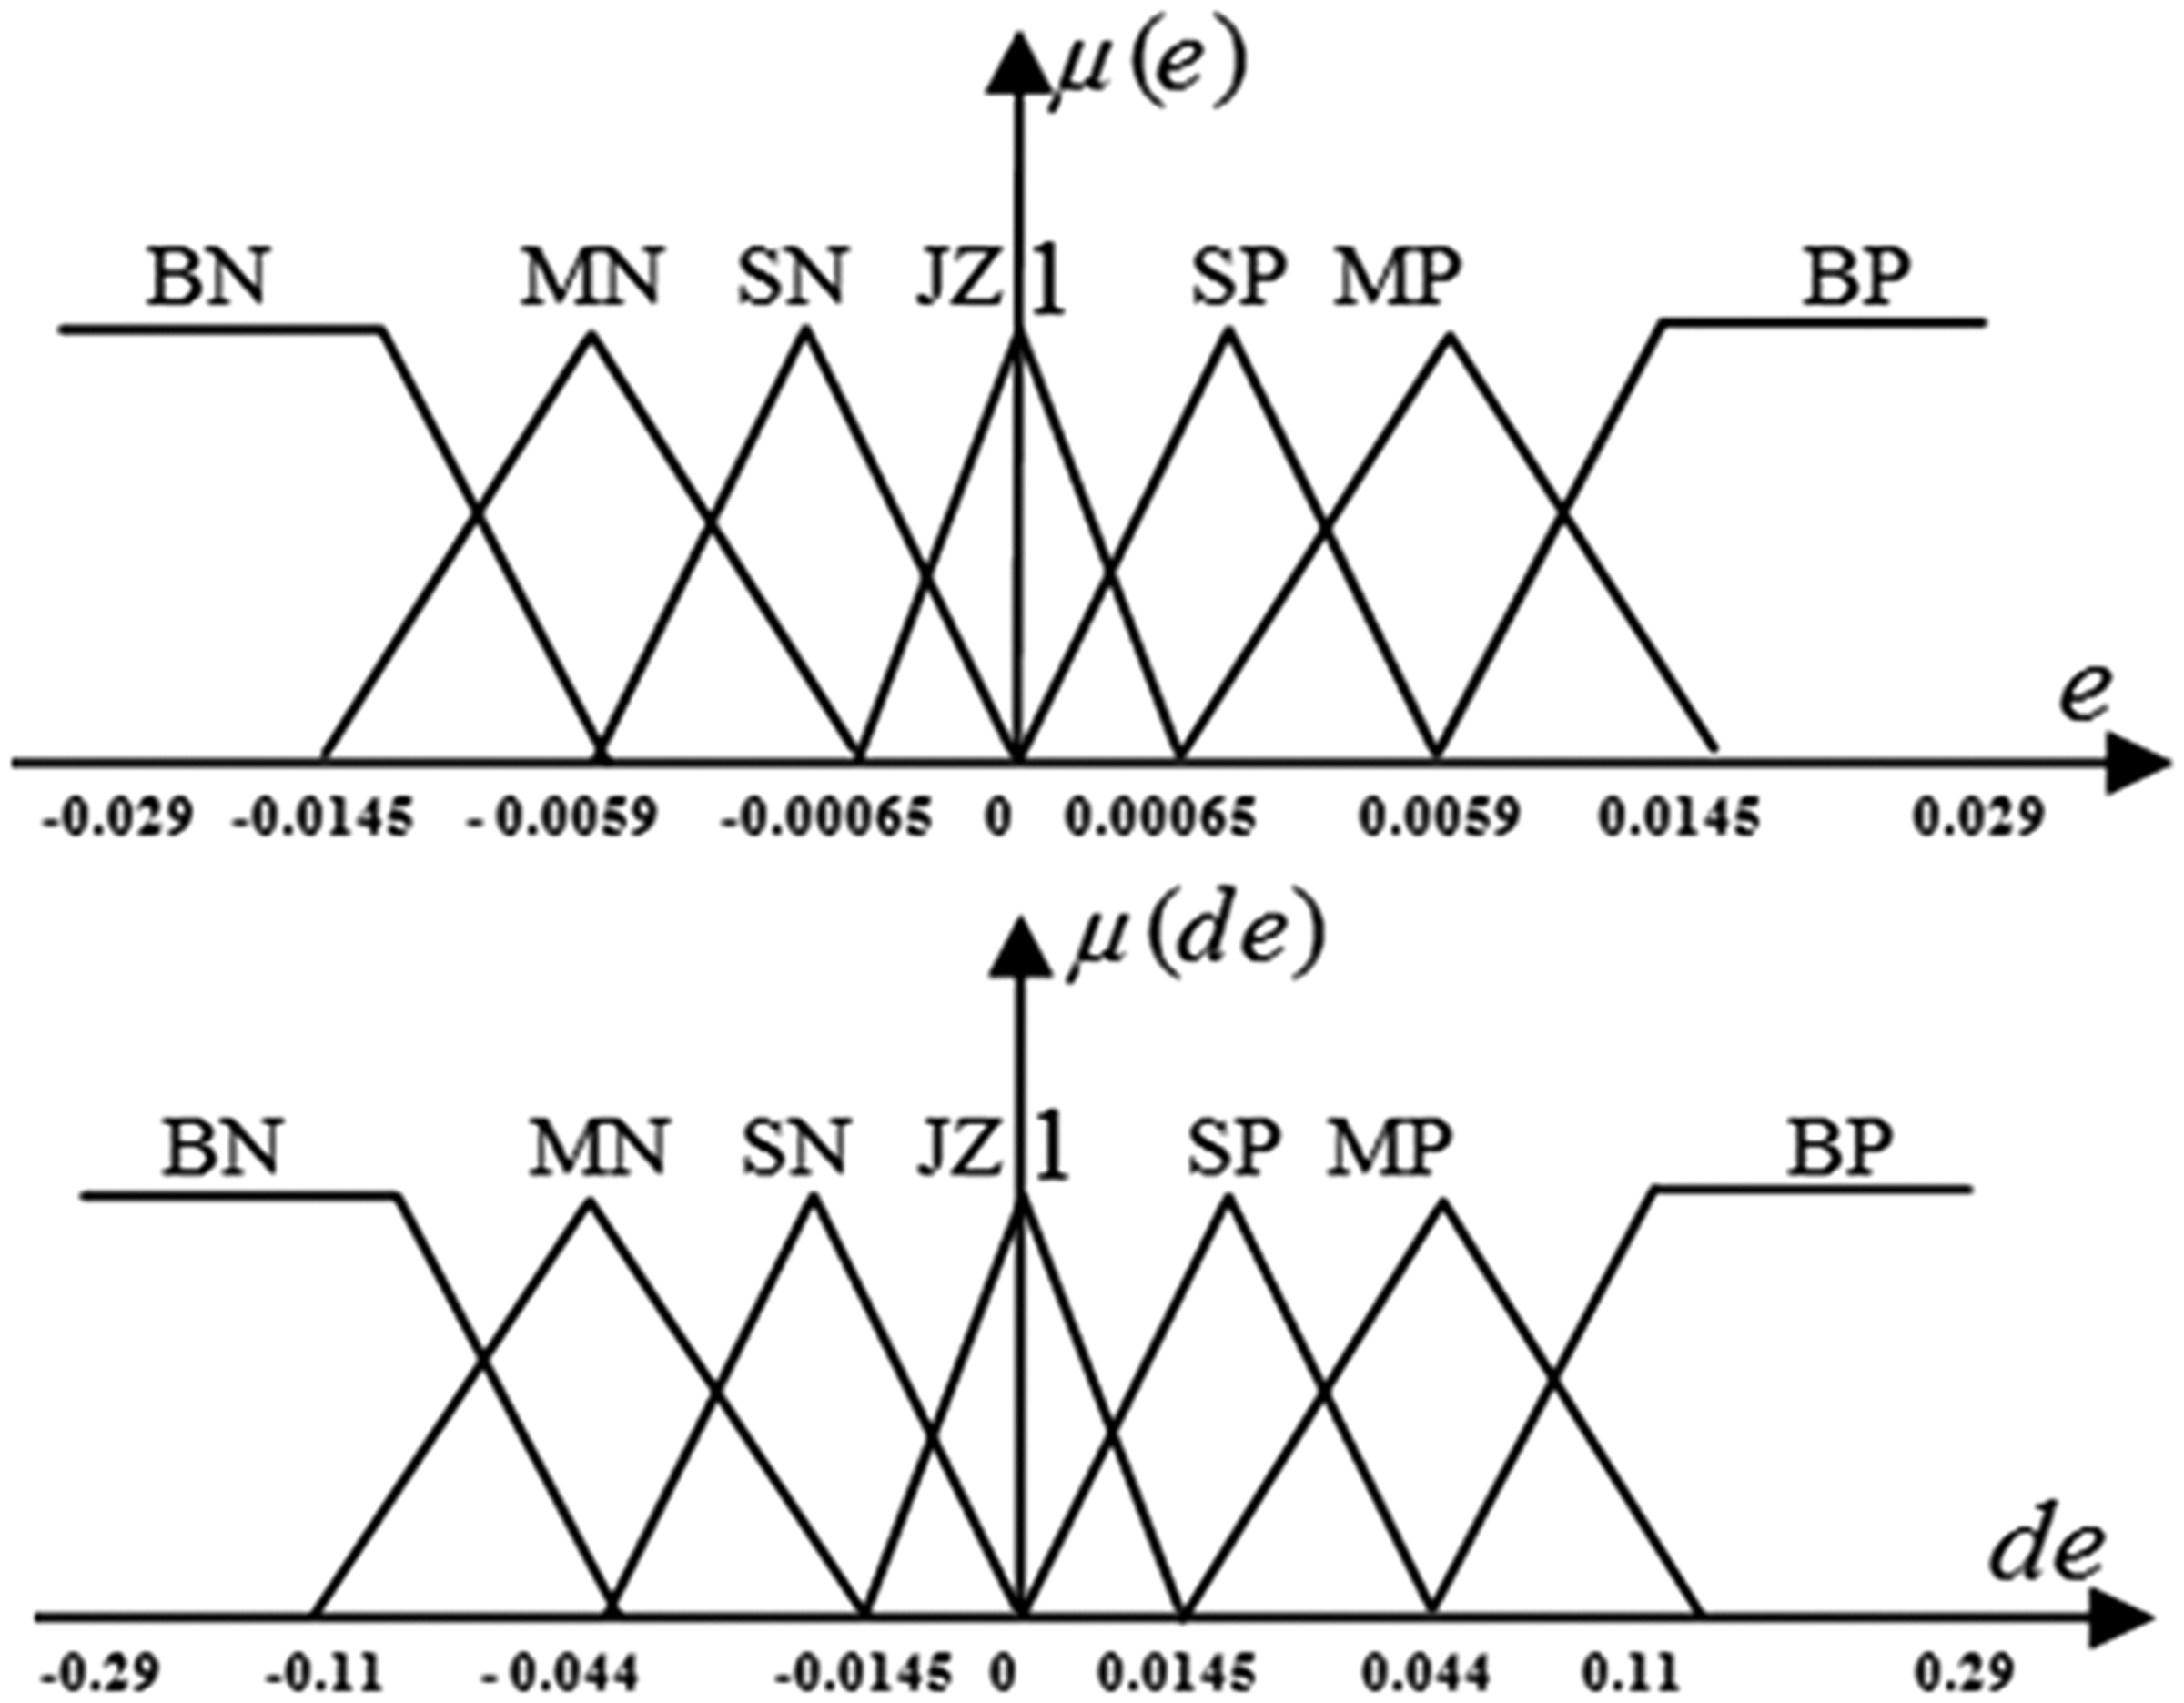
Input membership functions.
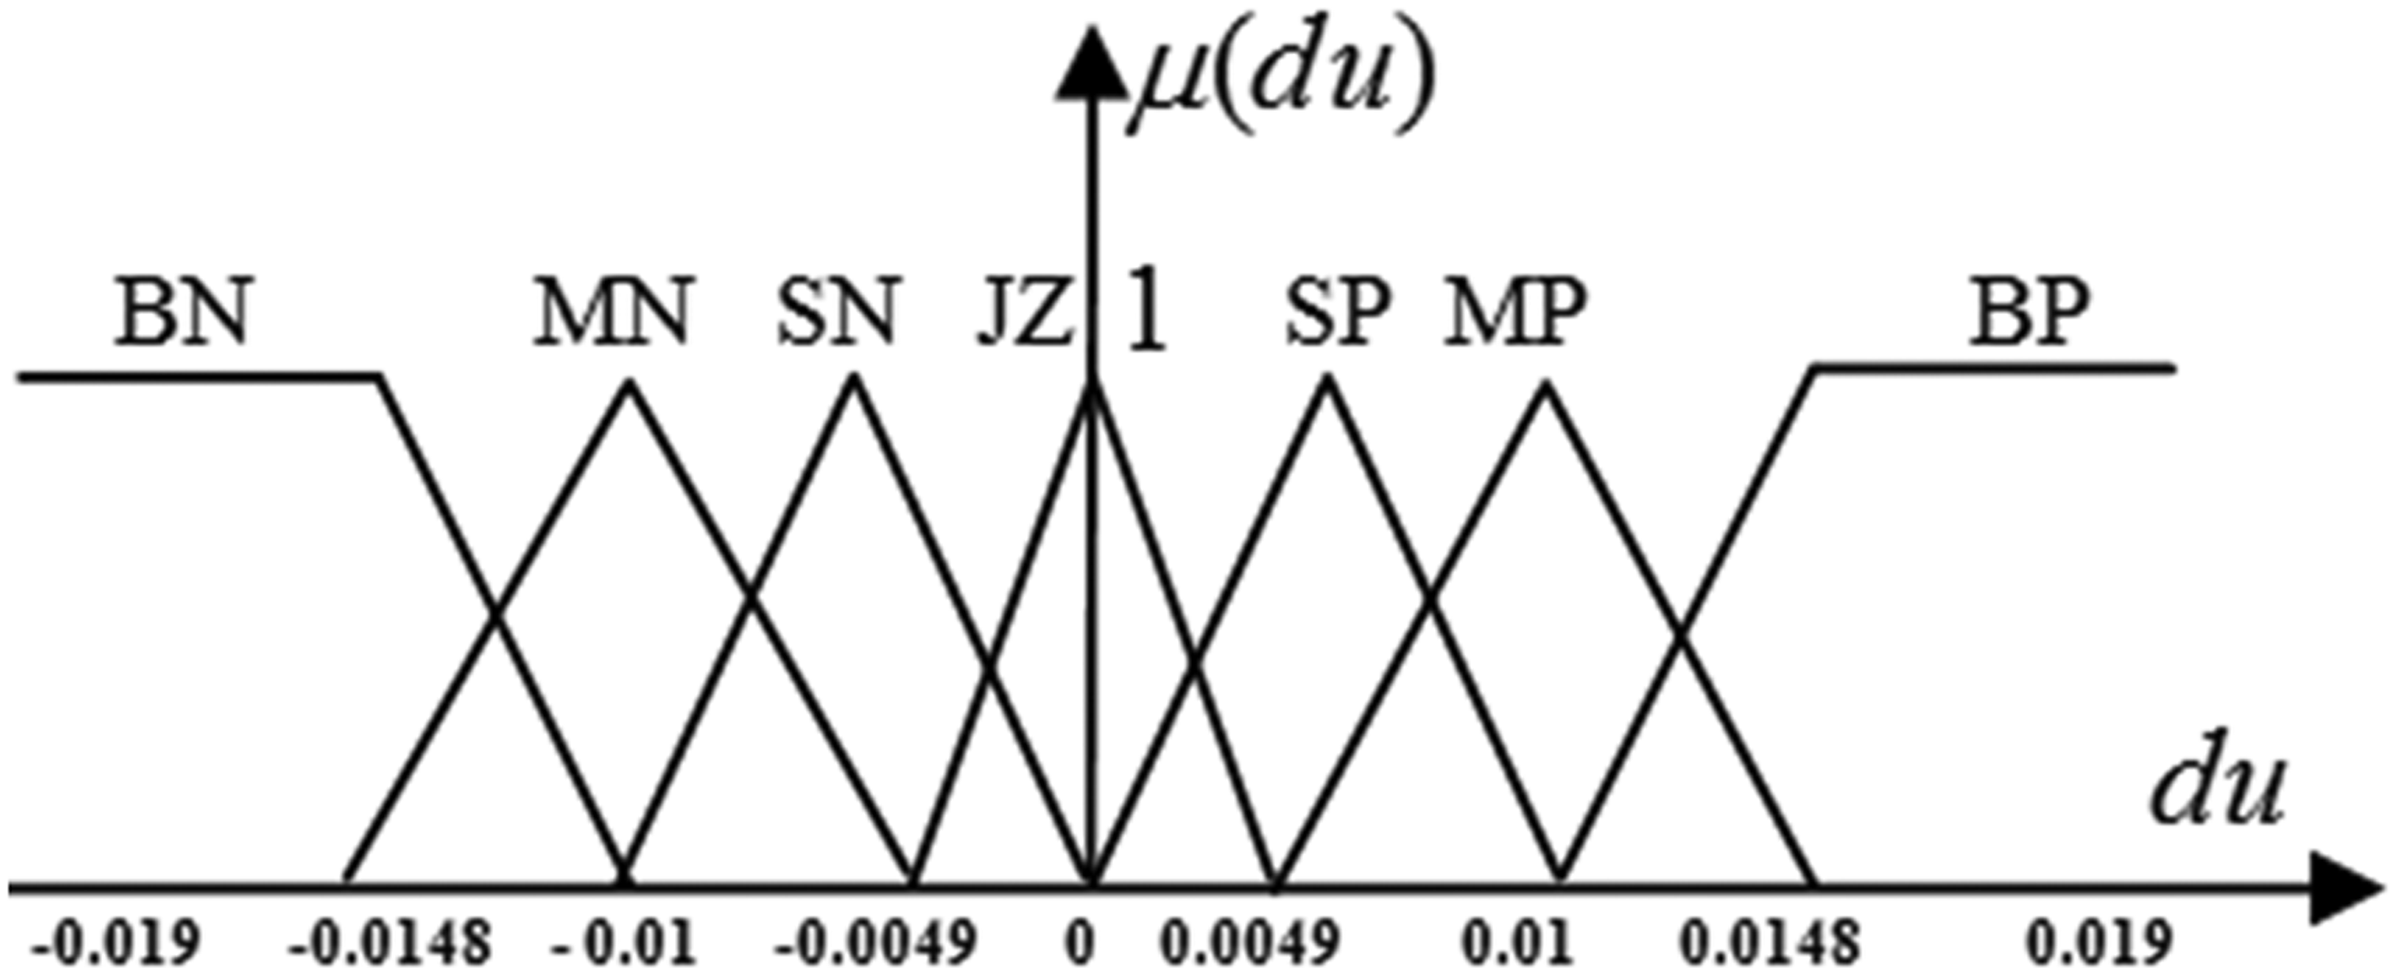
Output membership functions.
Linguistic rule.
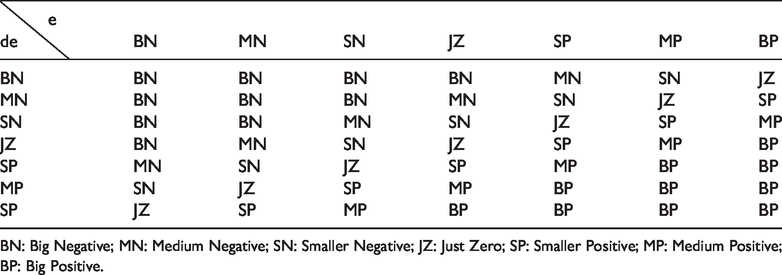
BN: Big Negative; MN: Medium Negative; SN: Smaller Negative; JZ: Just Zero; SP: Smaller Positive; MP: Medium Positive; BP: Big Positive.
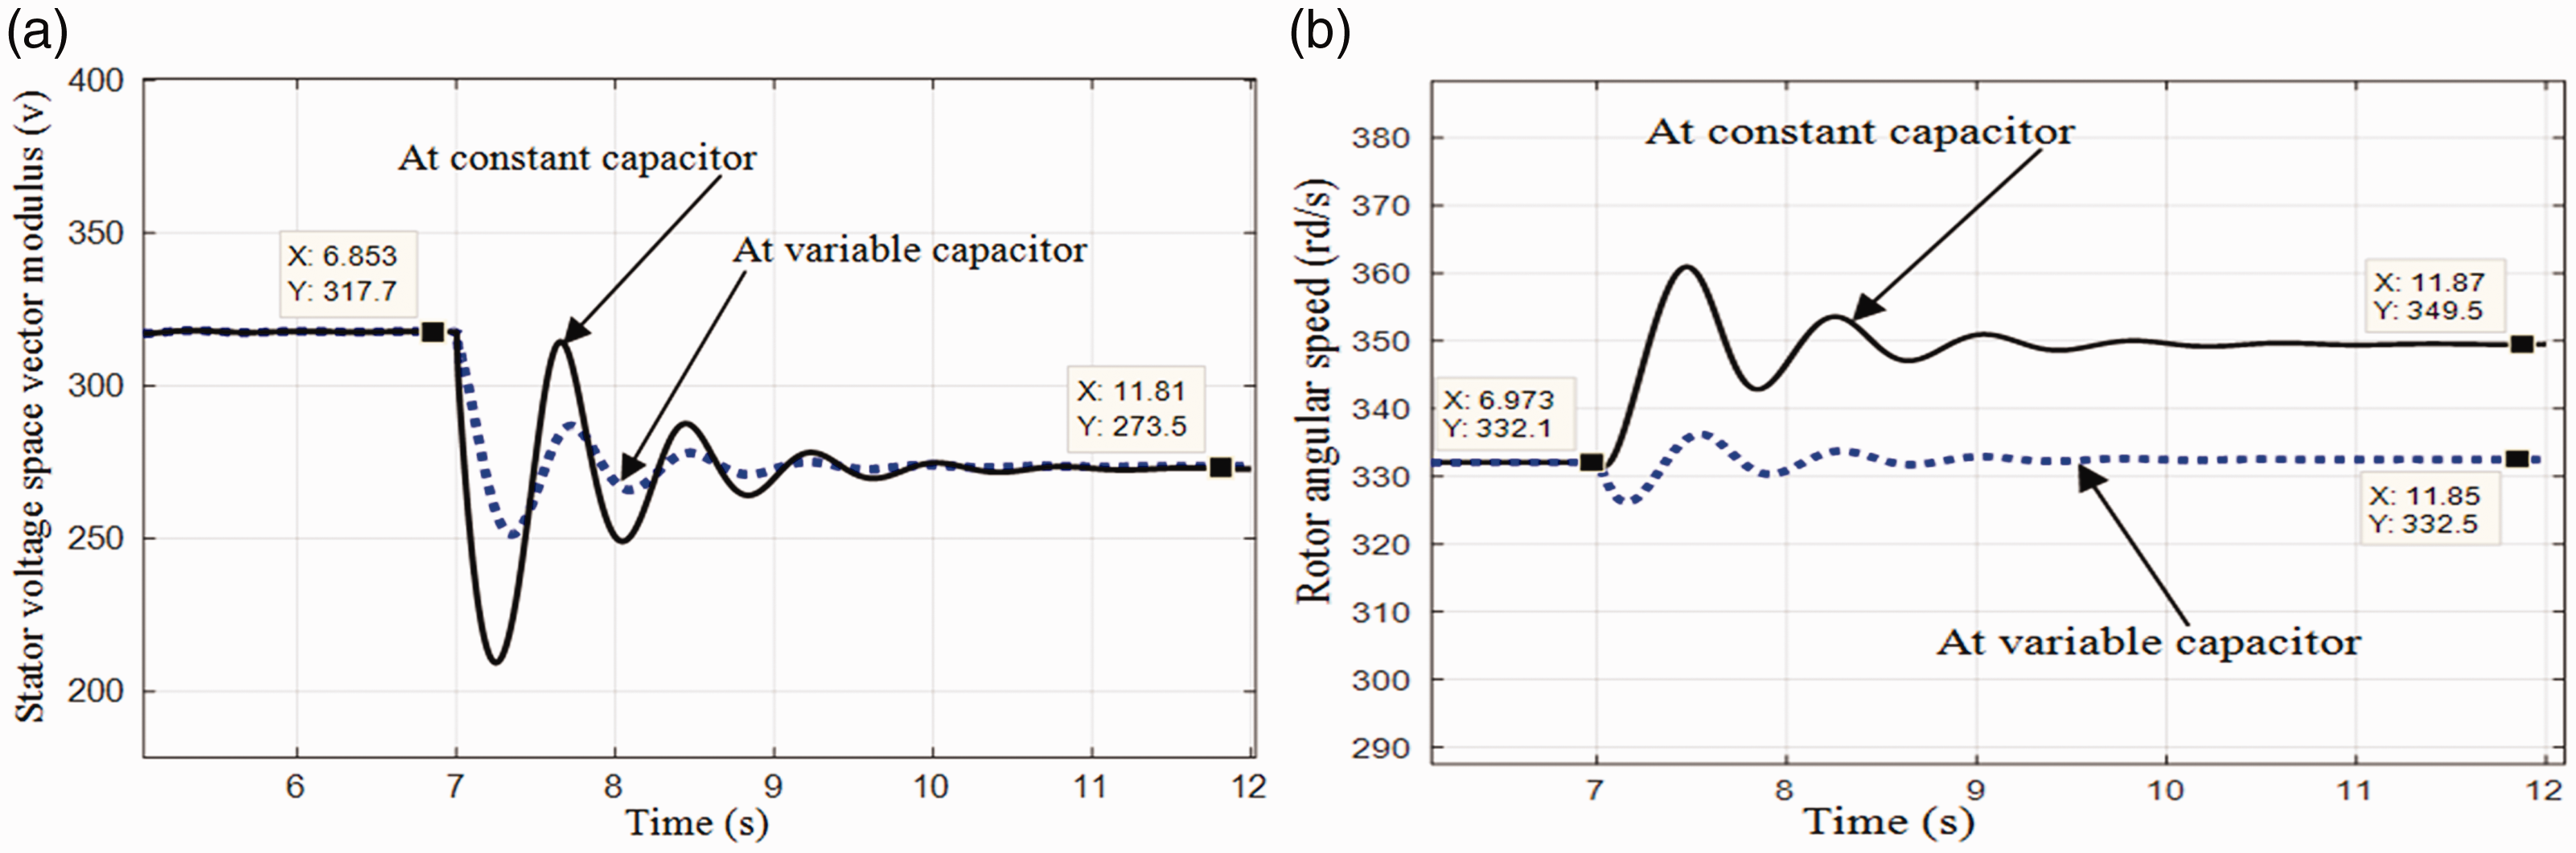
The simulation results of the frequency evolution during a sudden change of the load are presented in Figure 13. It is remarked that the transient state is characterized by a strong oscillation when the capacitor is kept constant (red dotted line). Whereas, one can notice an improvement of the transient if the FLC is used. In fact, the latter has a less oscillations in the amplitude and less duration. But when the proportional integral (PI) controller is used, the curve presents a smaller gap (continuous line).
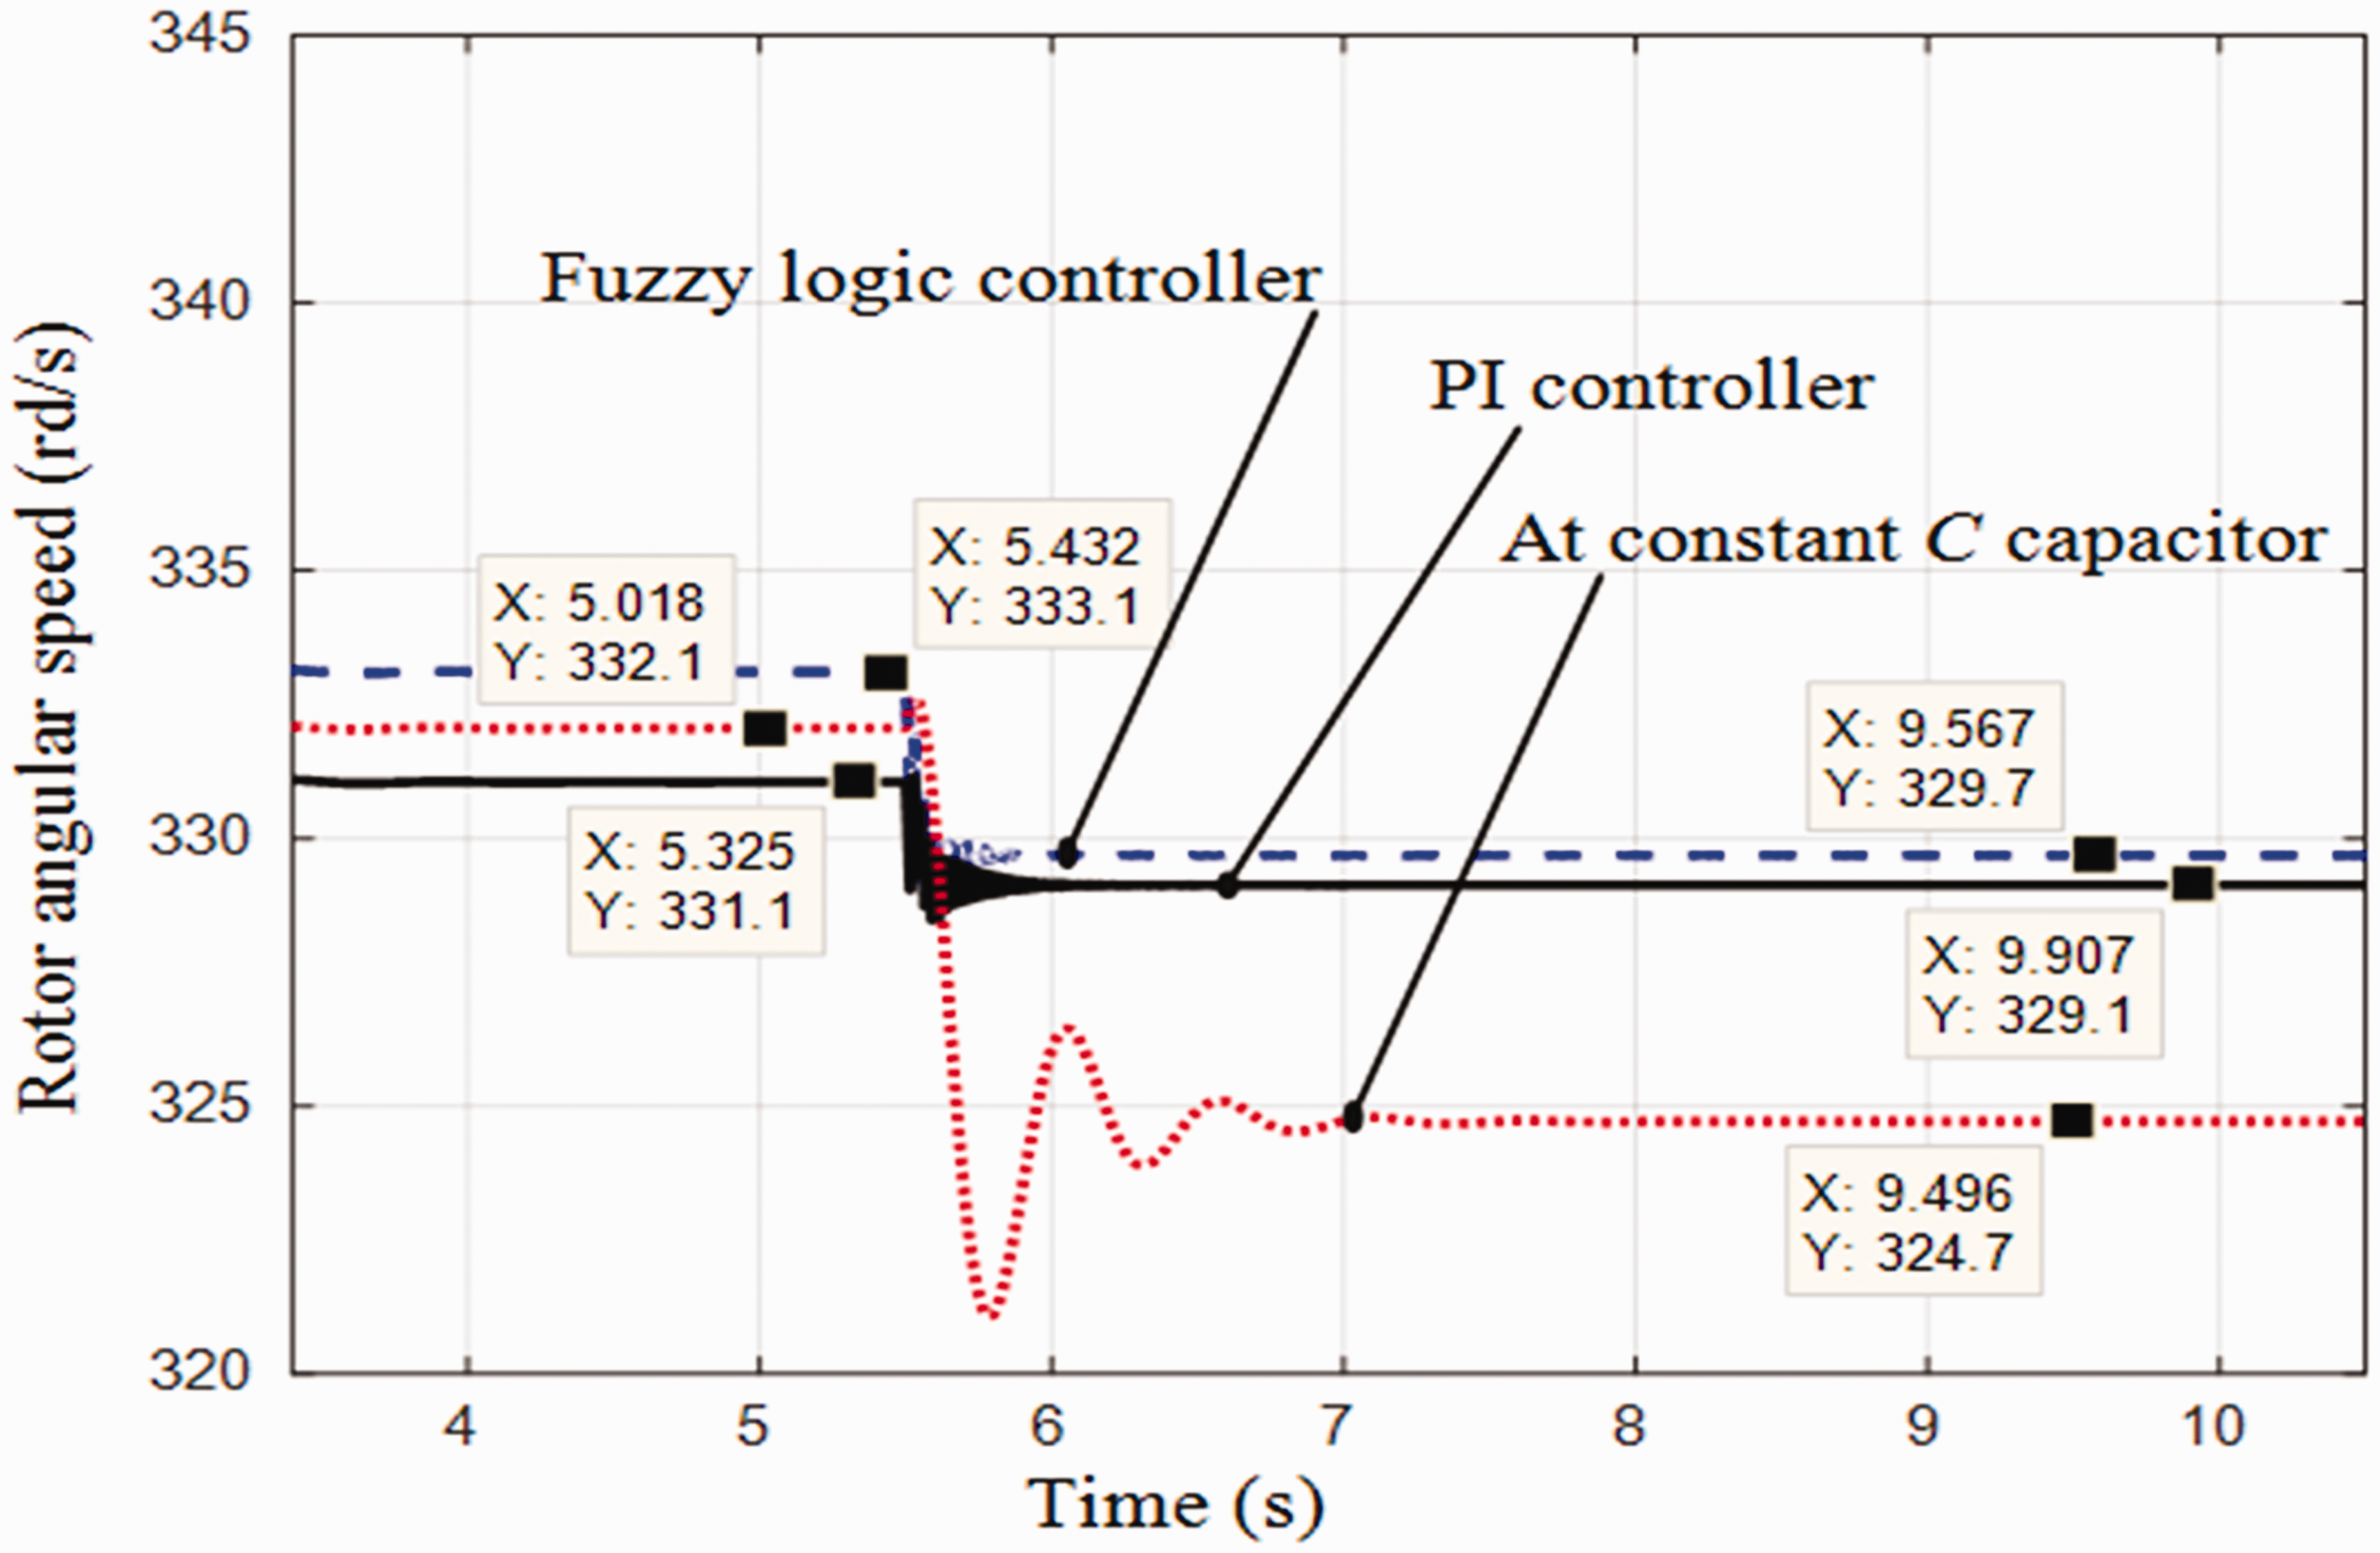
Rotor angular speed behavior during a sudden load variation.
Table 3 gives theoretical values, those obtained by FLC and PI controller. According to these results, one can remark that the frequency extreme variation is obtained for the first case where the capacitor is kept constant. Whereas, the use of fuzzy controller can improve the frequency variation (from 50 Hz to 49.93 Hz).
Angular frequency variation with different control strategies.
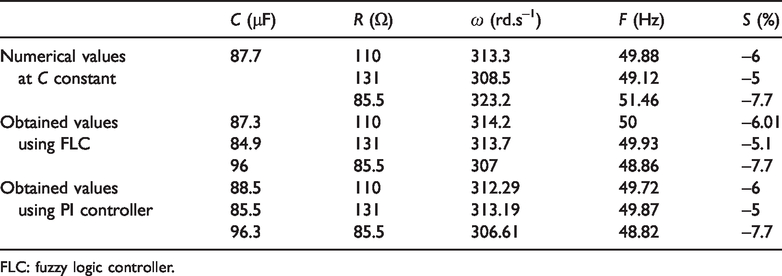
FLC: fuzzy logic controller.
By against for the same change of the load, the frequency scales from 49.88 Hz to 49.12 Hz. One can conclude that the frequency values obtained using FLC are very close. These results show that the FLC controller acts properly for the stabilization of the frequency.
Experimental results
The test bench, shown in Figure 14, is used to emulate the wind turbine operating based on a self-excited asynchronous generator in remote site. In the case of real operation, the IG is driven by the wind which will provide, through the blades, the mechanical power on the common shaft. This laboratory prototype of the proposed SEIG system has been developed to test the performance of the integrated system and to carry out the practical study of the IG. A DC motor fed by a DC power supply and controlled by a dSPACE system via a pulse width modulation (PWM) chopper is used in this test bench. The capacitor bank is placed in parallel with the load will allow the supply of the reactive power required by the IM as well as the load.
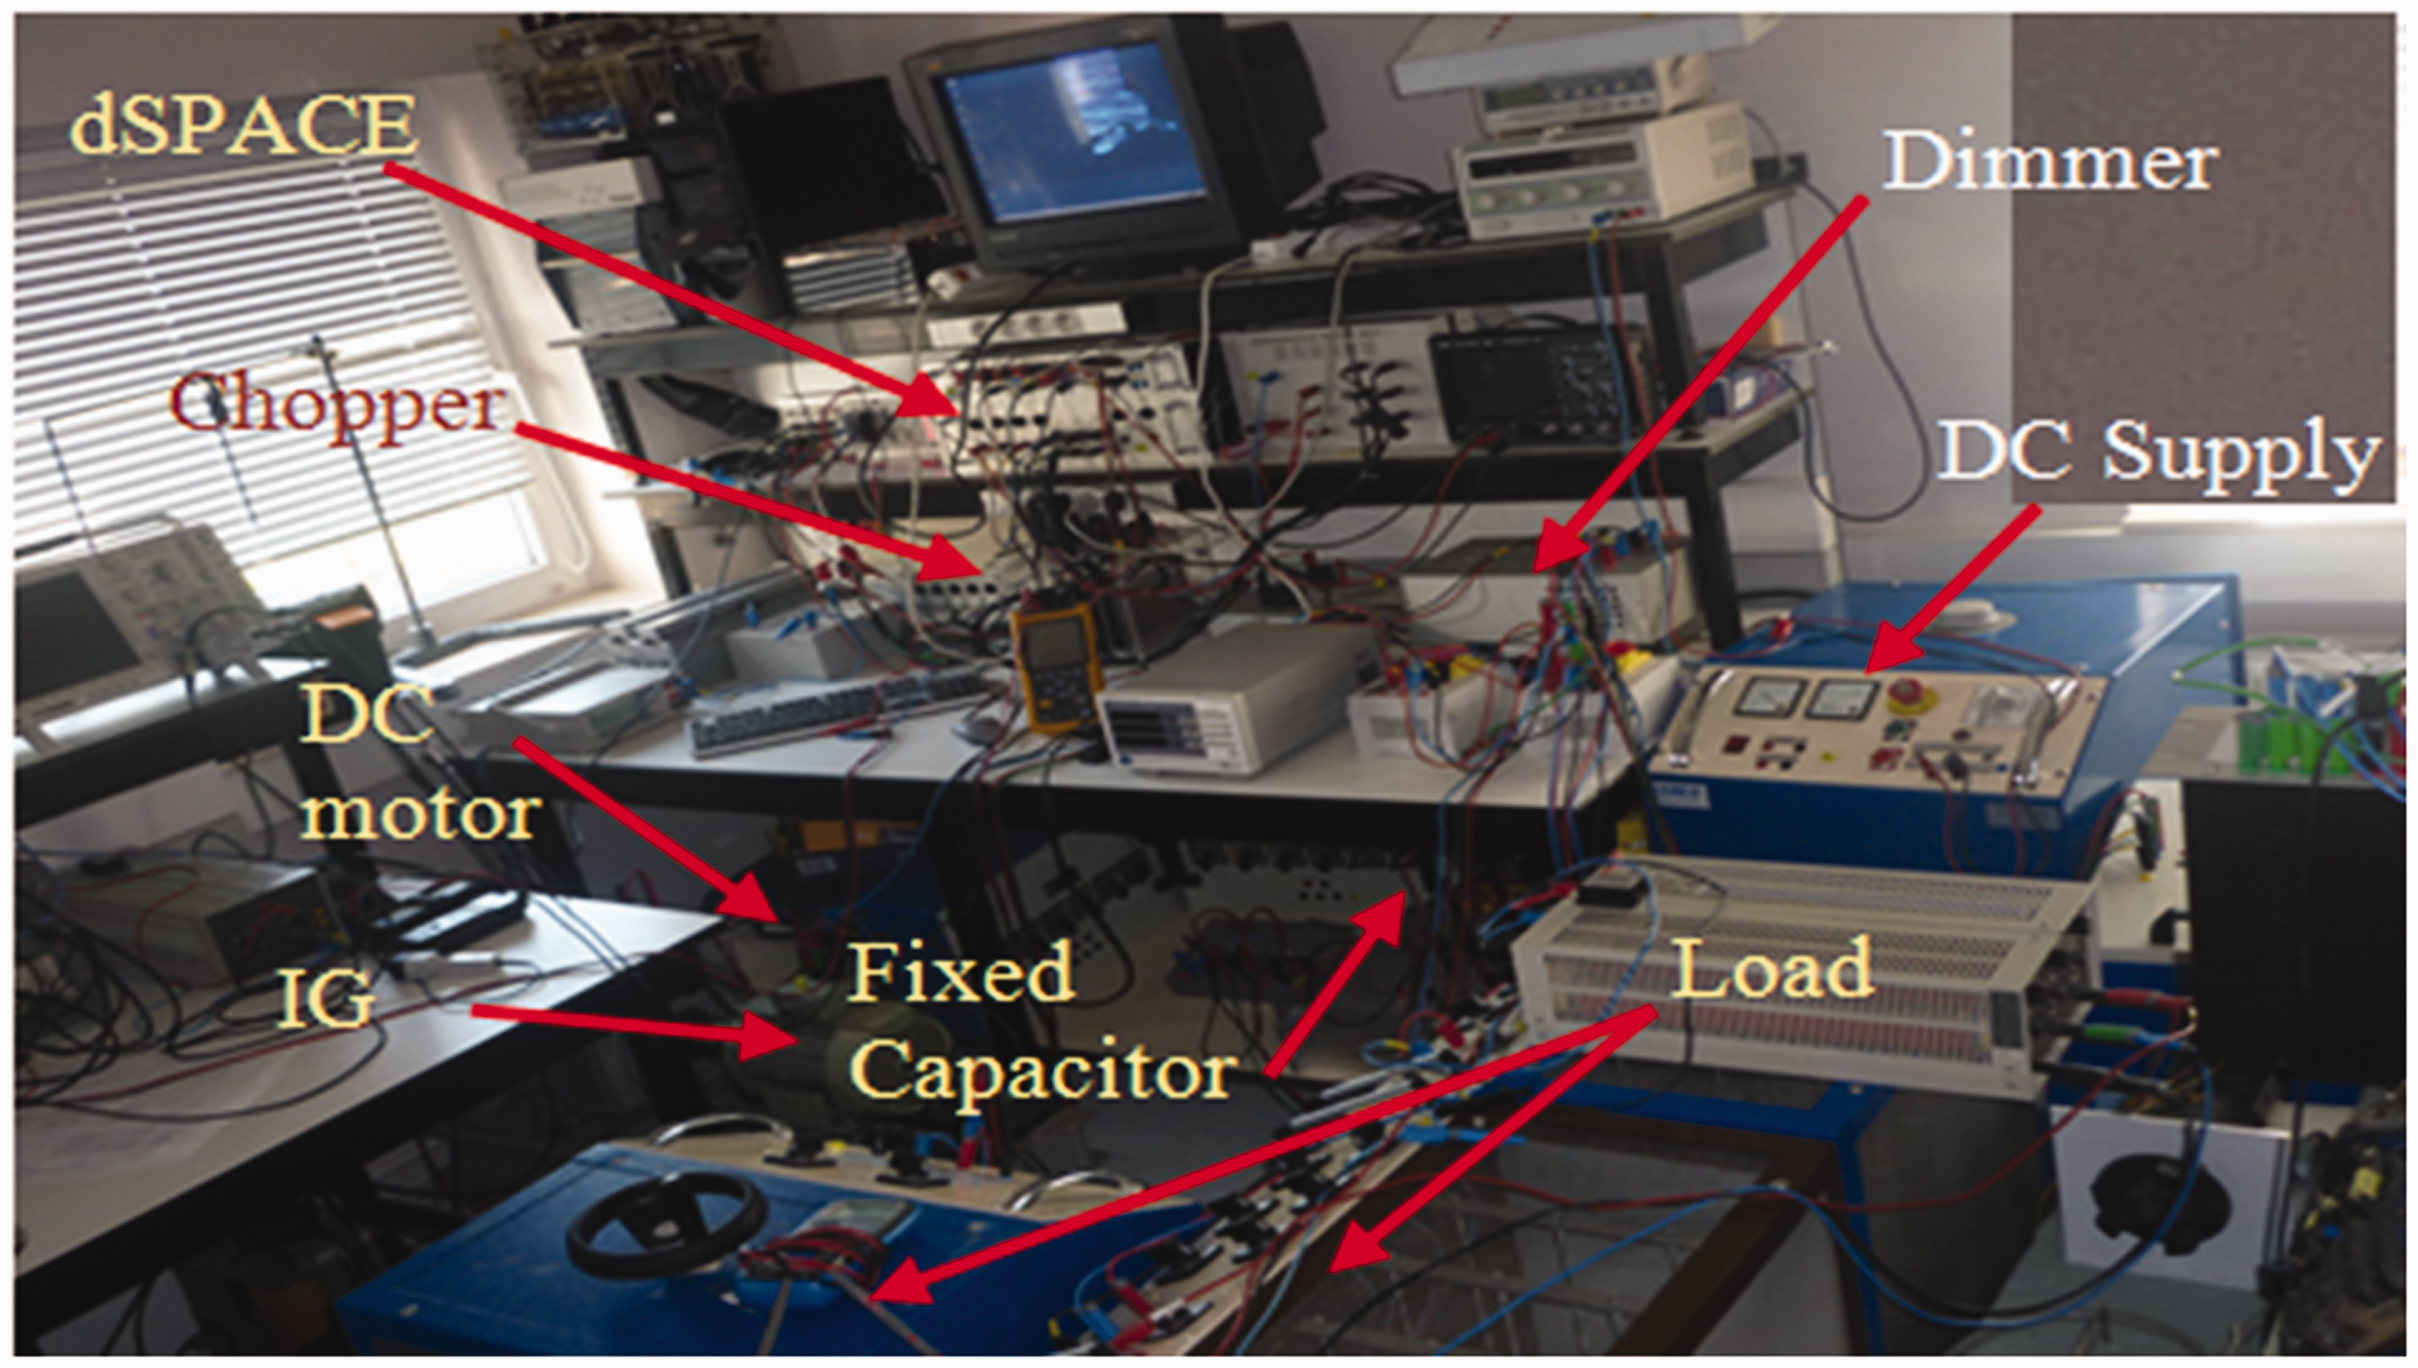
Experimental test bench photo.
Impact of the load change
Figure 15(a) shows the stator voltage experimentally measured at the SEIG outputs during the R load variation while keeping C at constant value. This test is carried out at 1800 W input wind power in the SEIG shaft. This experimental result confirms clearly that the line-to-line SEIG outputs stator voltage is stabilized at 550 V in steady state before load variation. Compared to stator voltage evolution simulated in Figure 9(a), one can remark the same behavior during transient state for the same resistive load variation (from R0 = 110 Ω to R2 = 85.5 Ω). Whereas Figure 15(b) presents the line-to-line stator voltage measured at the SEIG outputs during the R load variation while changing the C capacitor. As a result, the stator voltage tends to decrease slowly with marked improvement of the transient oscillations when adjusting the reactive power by varying C values. This case is simulated and presented in Figure 9(b).
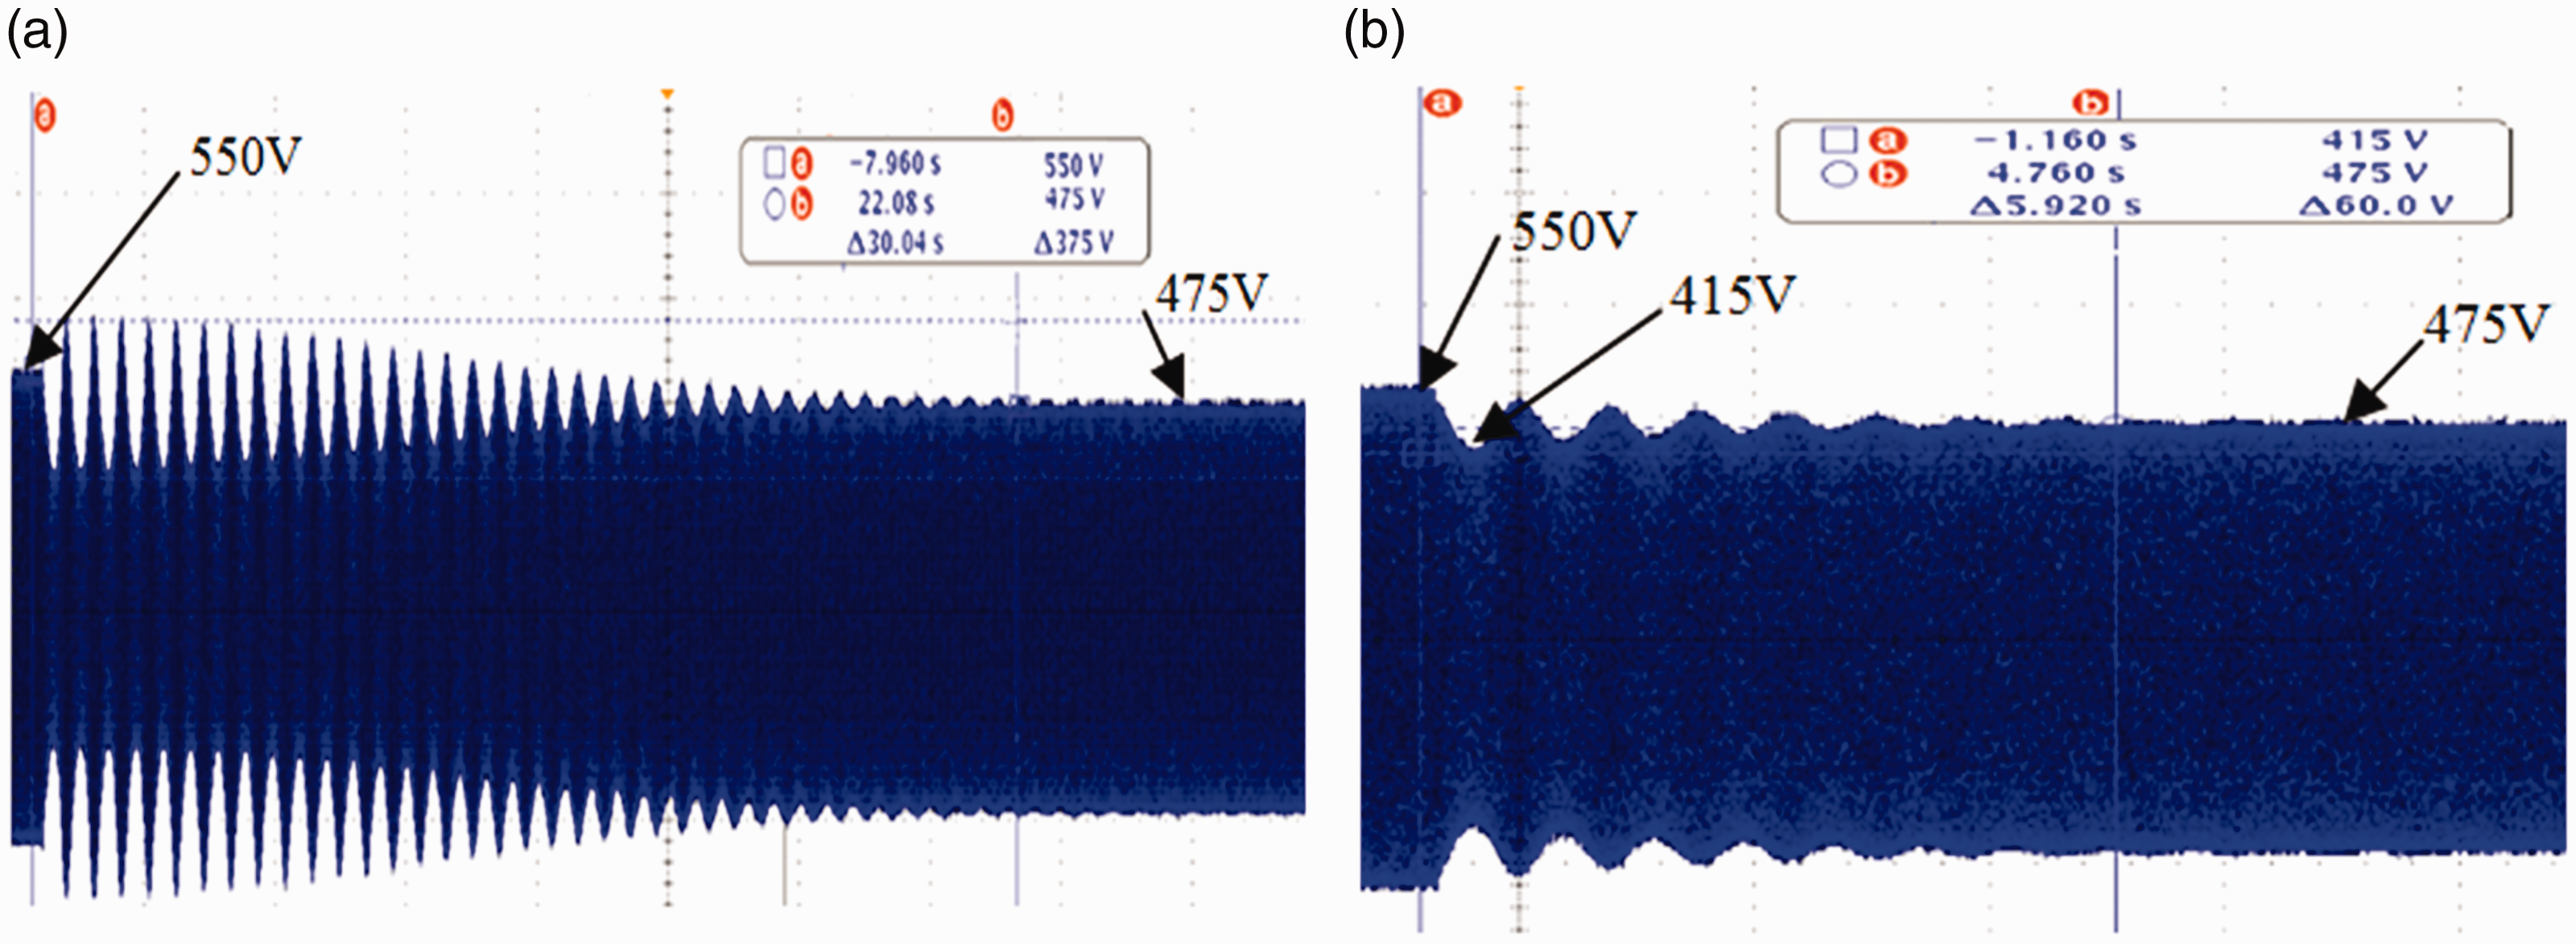
Stator voltage for load variation: (a) at constant capacitor and (b) at variable capacitor.
The simulation and experimental tests show that the capacitor variation is very interesting for voltage and frequency regulation in remote site. In fact, it is noticed, strong oscillations during the transient state which may cause the SEIG disengagement when the capacitor is kept constant. For this reason, it is recommended to change the C capacitors at any change of the load with the appropriate values in order to avoid the voltage collapse and consequently the dropping out of the machine.
Dynamic stability analysis
In remote site, the asynchronous generators need an external supply to provide the reactive power which is necessary for production of the rotating magnetic flux. An IM can operate as a self-excited generator when its rotor is driven by an external prime mover and its excitation is provided by placing capacitor bank at the stator outputs.
To avoid the generator dropping out when it is used in an off grid configuration, the wind generator requires an accurate reactive power regulation. The procedure used in this work consists on the use of the SVC devices, which is composed of FC-TCR as it is presented in Figure 6. The SVC when connected in shunt in the system can provide fast and smooth reactive power control. Also, it can effectively control the system voltage level during the IGs operation. This strategy consists on the variation of the capacitor C with load variation according to the law given by the equation (12) to avoid the voltage instability, even its collapse. When the operating point is chosen and kept in the flattened zone shown in Figure 4, the frequency at the output of the generator is kept constant.
Figure 16(a) and (b) shows the frequency before and after a load variation when the capacitor C is changed according to the equation (12). As it is remarked, the frequency is kept quasi-constant (from 1/20.16 ms to 1/20.08 ms) during this load variation.
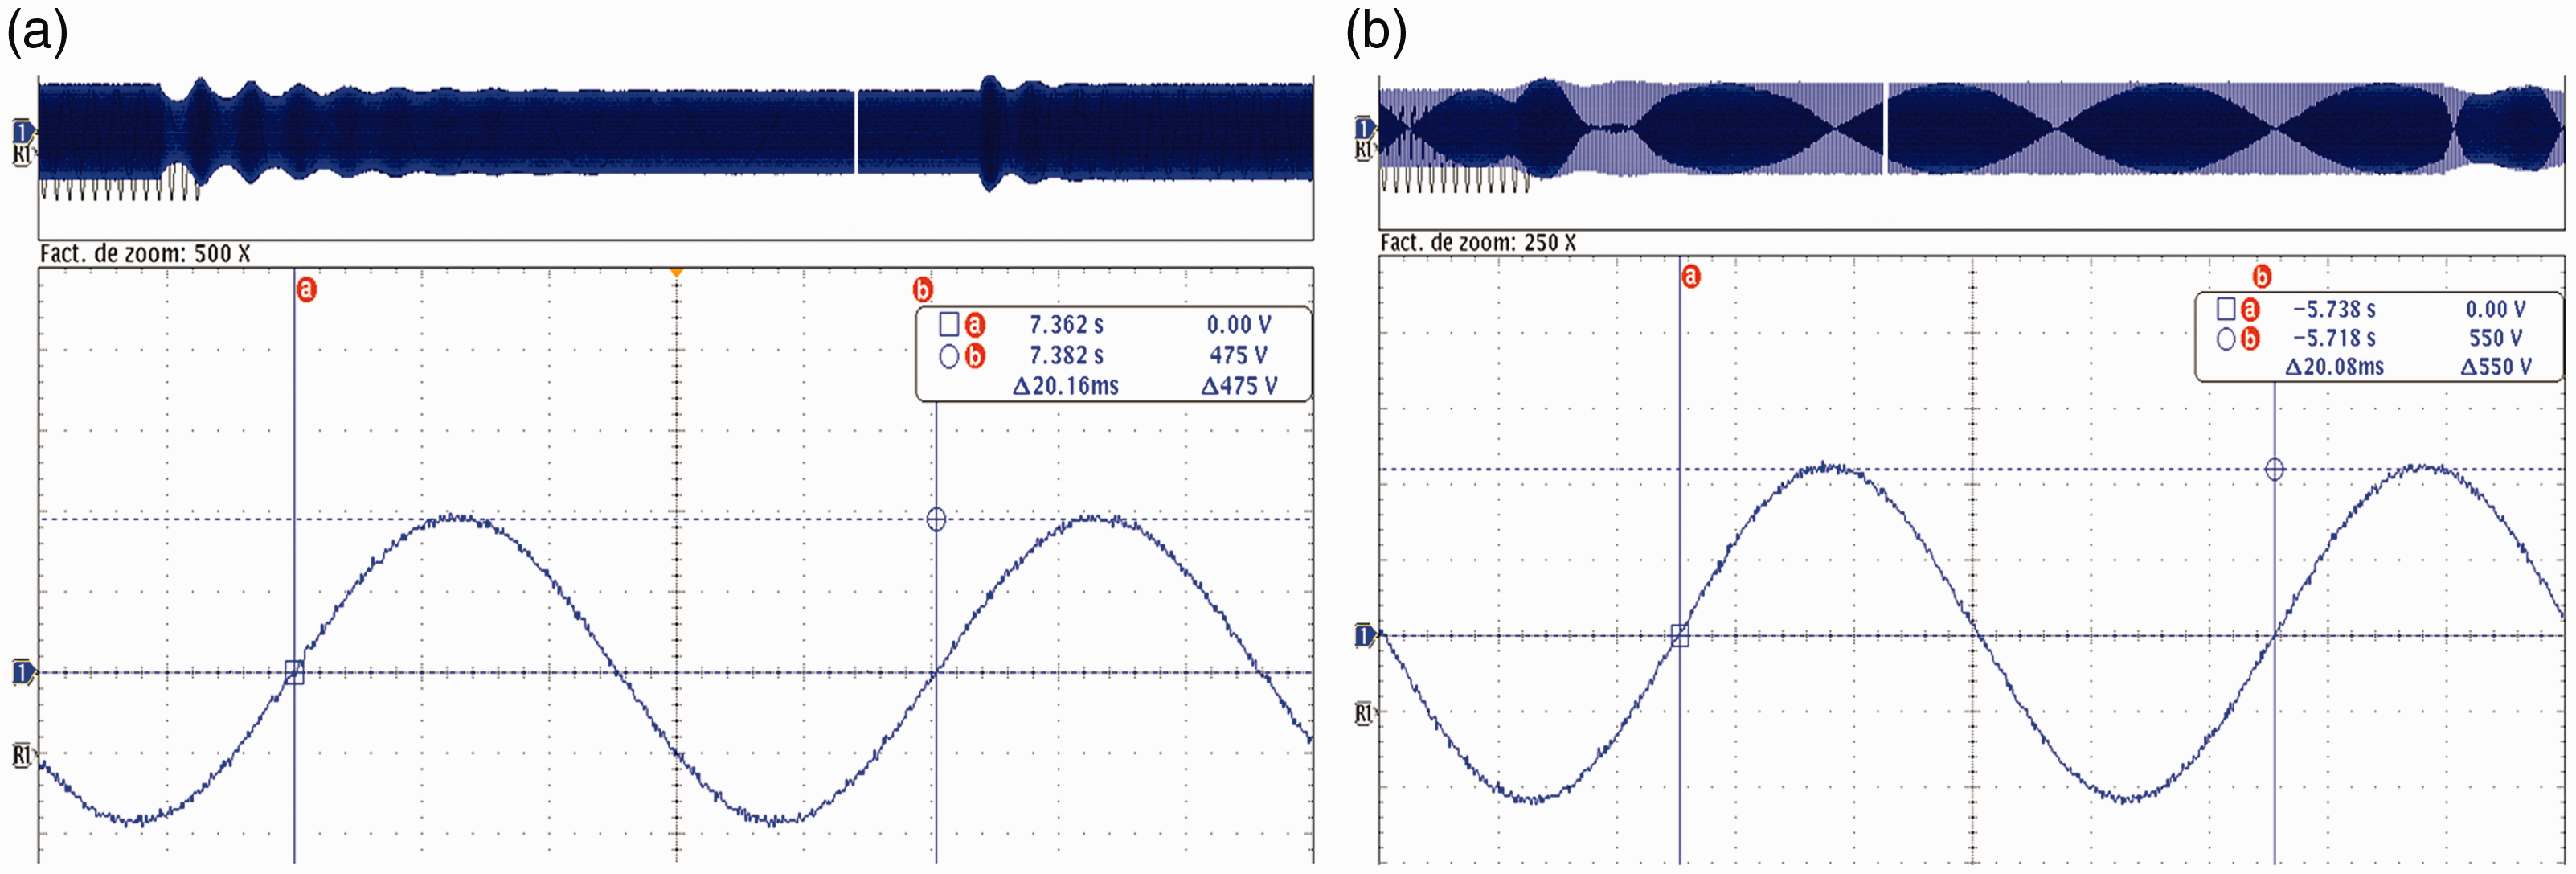
Generator stator voltage variation: (a) before load variation and (b) after load variation.
However, Figure 17(a) and (b) presents a dynamic behavior following a sudden and strong change of the load. As is shown in Figure 17(a), the IG continues to work with significant variation in voltage and sharp oscillations at its outputs. However, Figure 17(b) presents a voltage collapse following the same change of the load, but the capacitor is kept constant which causes the machine dropping out.
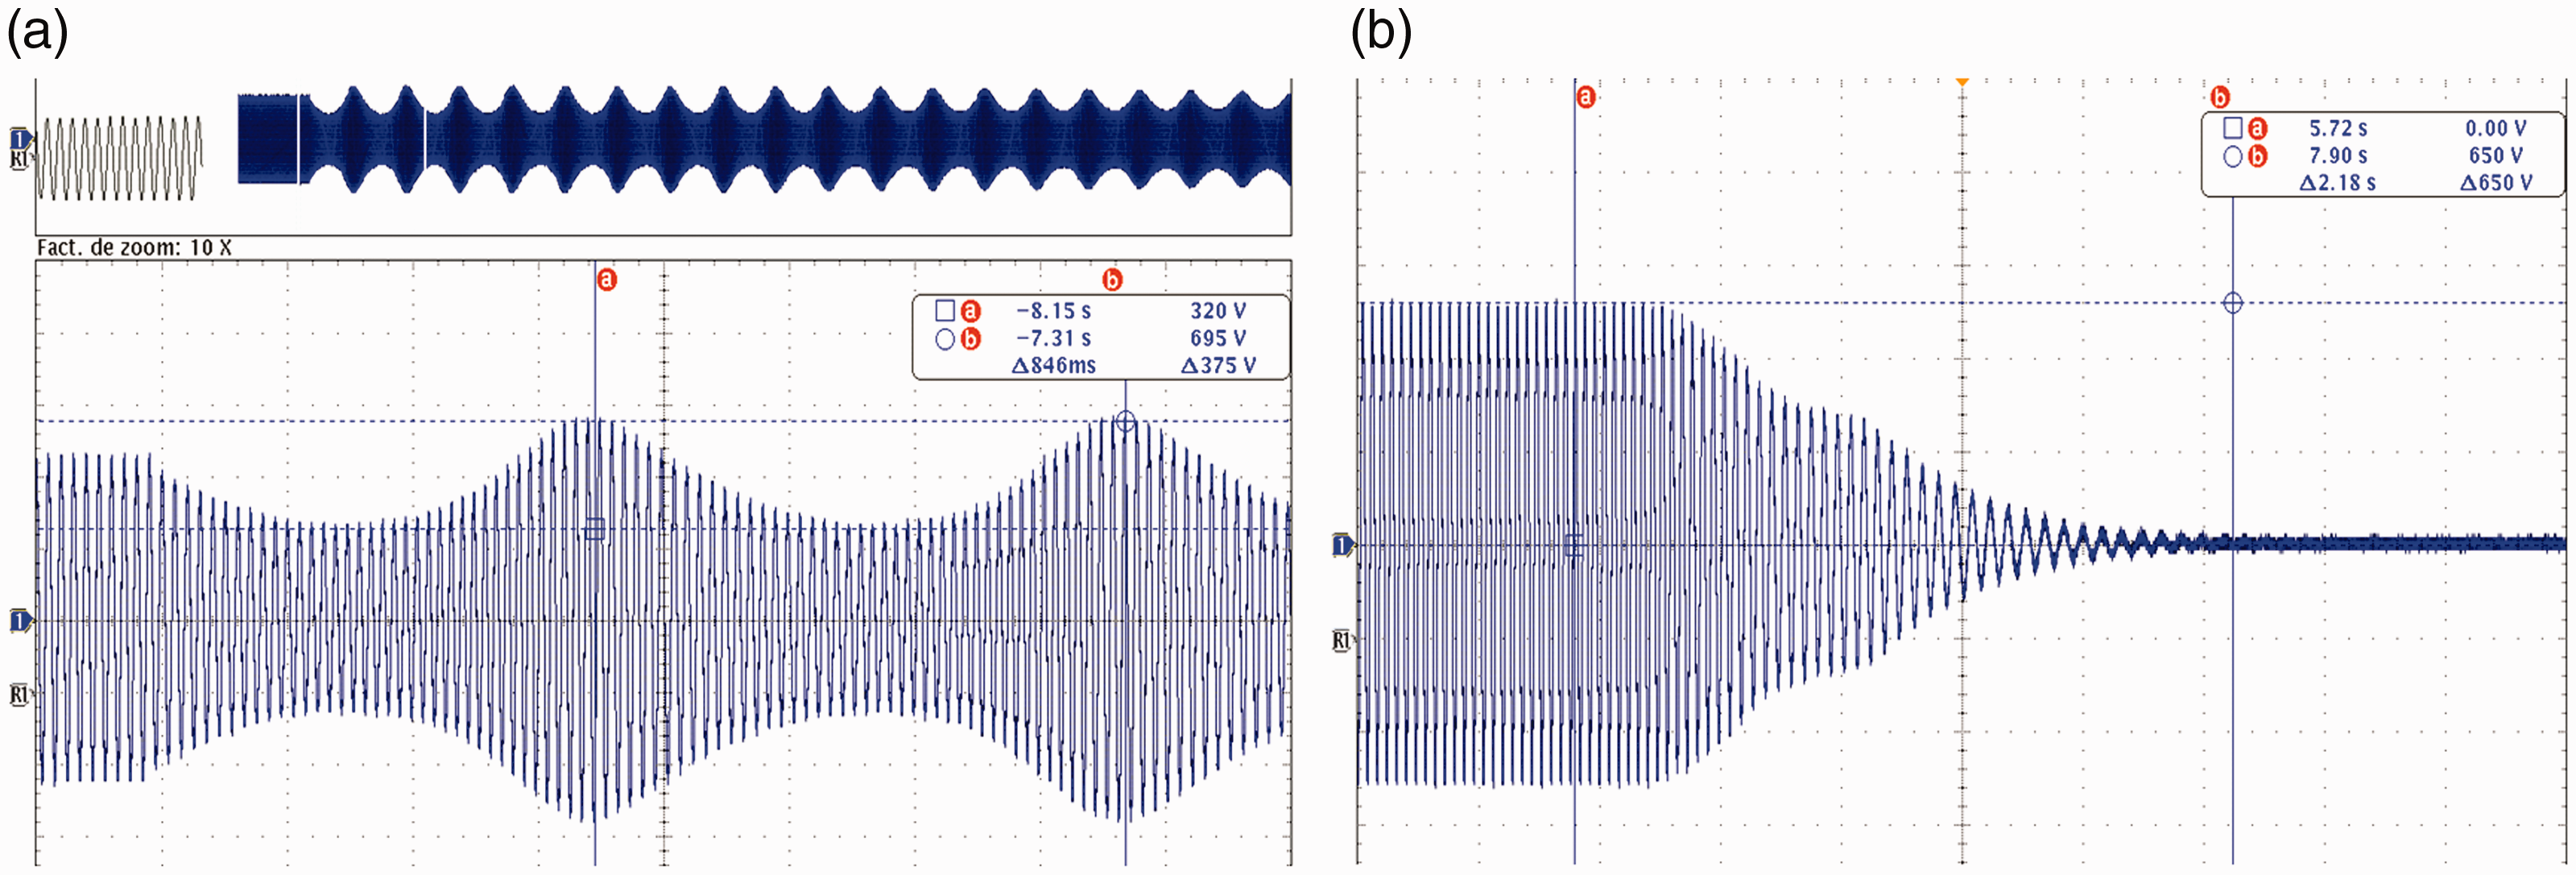
Stator voltage at strong load variation: (a) with changing the C capacitor and (b) with constant C capacitor.
This study shows that this procedure of changing the C capacitor with R changes according to the law given by equation (12) enhances the system stability and reveals the operating zones where the SEIG behavior can be controlled. It also proved operation at a quasi-constant frequency without the need of a control loop. This control law enhances also the transient state. For strong R variations, this control strategy prevents the voltage collapse through changes of the reactive power supplied by the capacitor bank. This reactive power must vary continuously with load variations. In the test bench, the reactive power variation is ensured by a three-phase dimmer.
Reactive power analysis and C capacitor computing
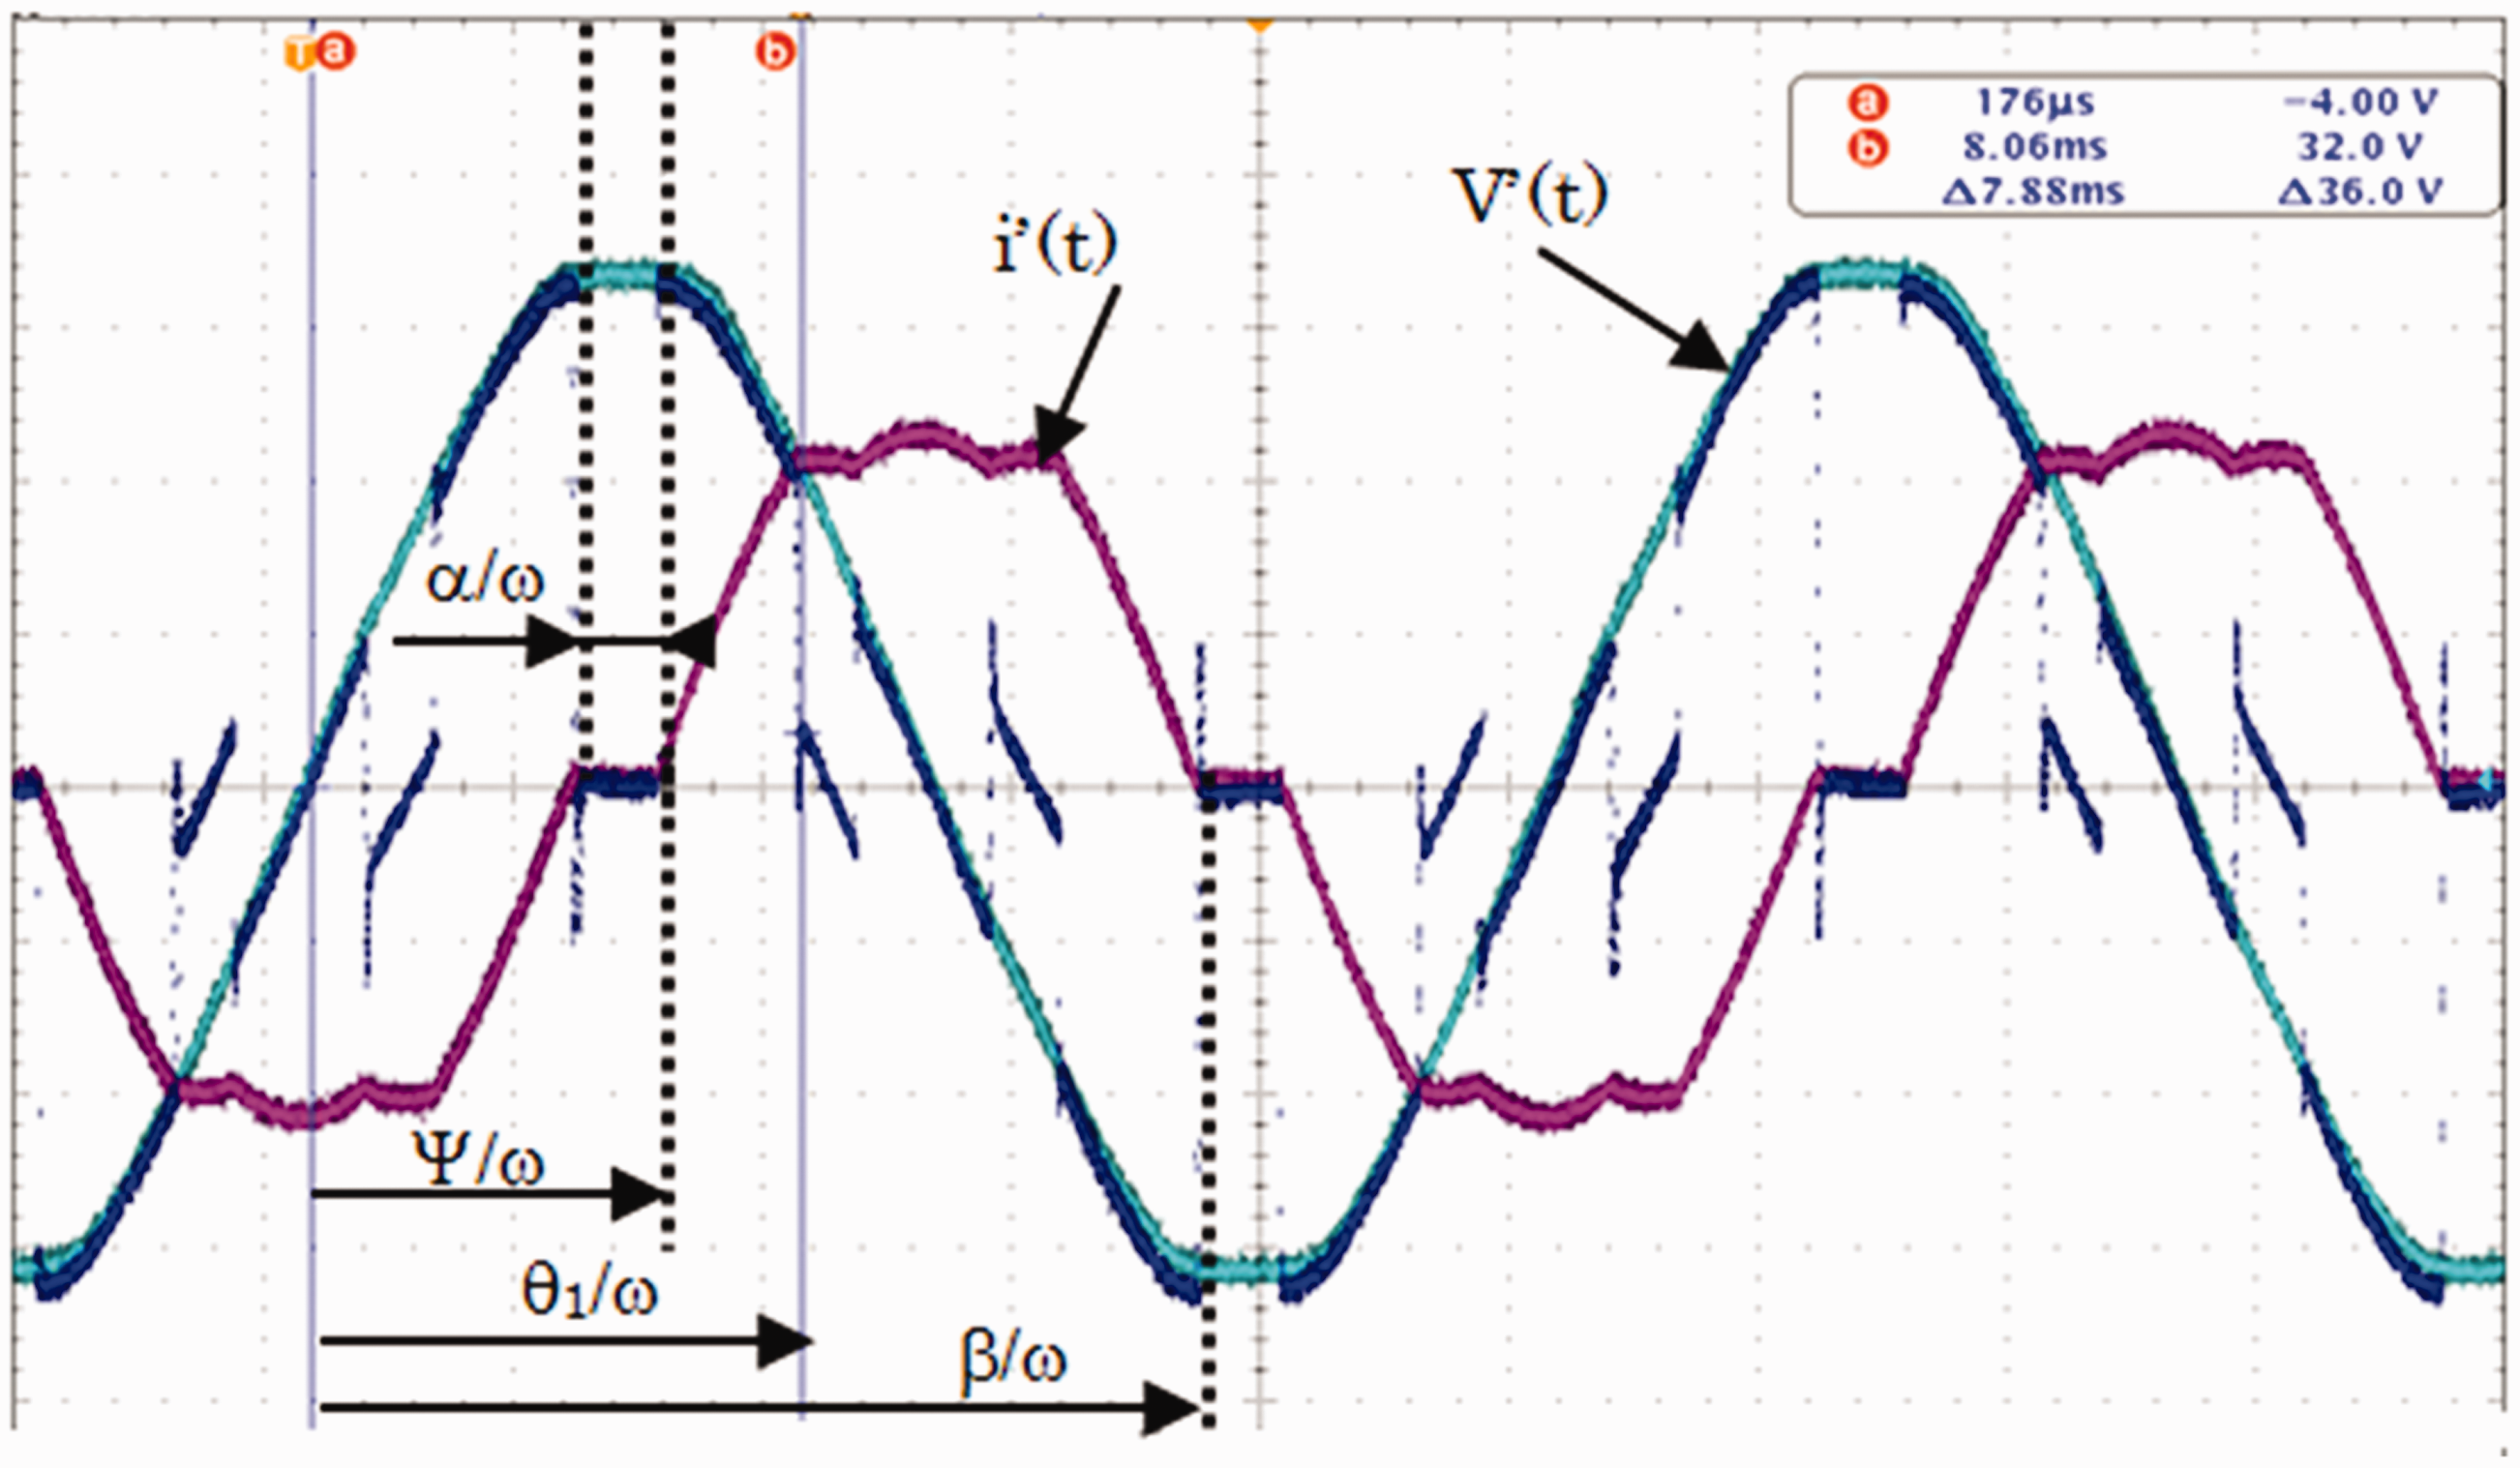
Considering the SEIG operation in remote site, maintaining a constant voltage is ensured by a discrete variation of the resistive load via controlled switch. This load variation concerned only the consumers who are not priority and they can be disconnected or introduced in accord to the wind power changes. According to the relationship (13), the R load variation is accompanied by a capacitor change C = Ceq(ψ) through changing the firing angle ψ. In this case, the equivalent reactive power available on the isolated grid is defined in equation (22). In practice, the evolution of ψ depends on the previously calculated values in order to ensure a relative voltage stability obtained by coupling or decoupling the non-priority loads. The equivalent capacitor Ceq can be determined by the equation (21). This capacitor depends on the firing angle ψ. The experimental study considers that the regulating load consists of an inductance LR = 145 mH in series with a resistance RLR = 1.05 Ω. For the considered load (φ = 88.7°, Q = 43.36), it is possible to work in mode 1 for 88.7° < ψ < 120°. Figure 18 shows the waveforms obtained (voltage and current) for a firing angle ψ = 1.73 rd (5.52 ms).
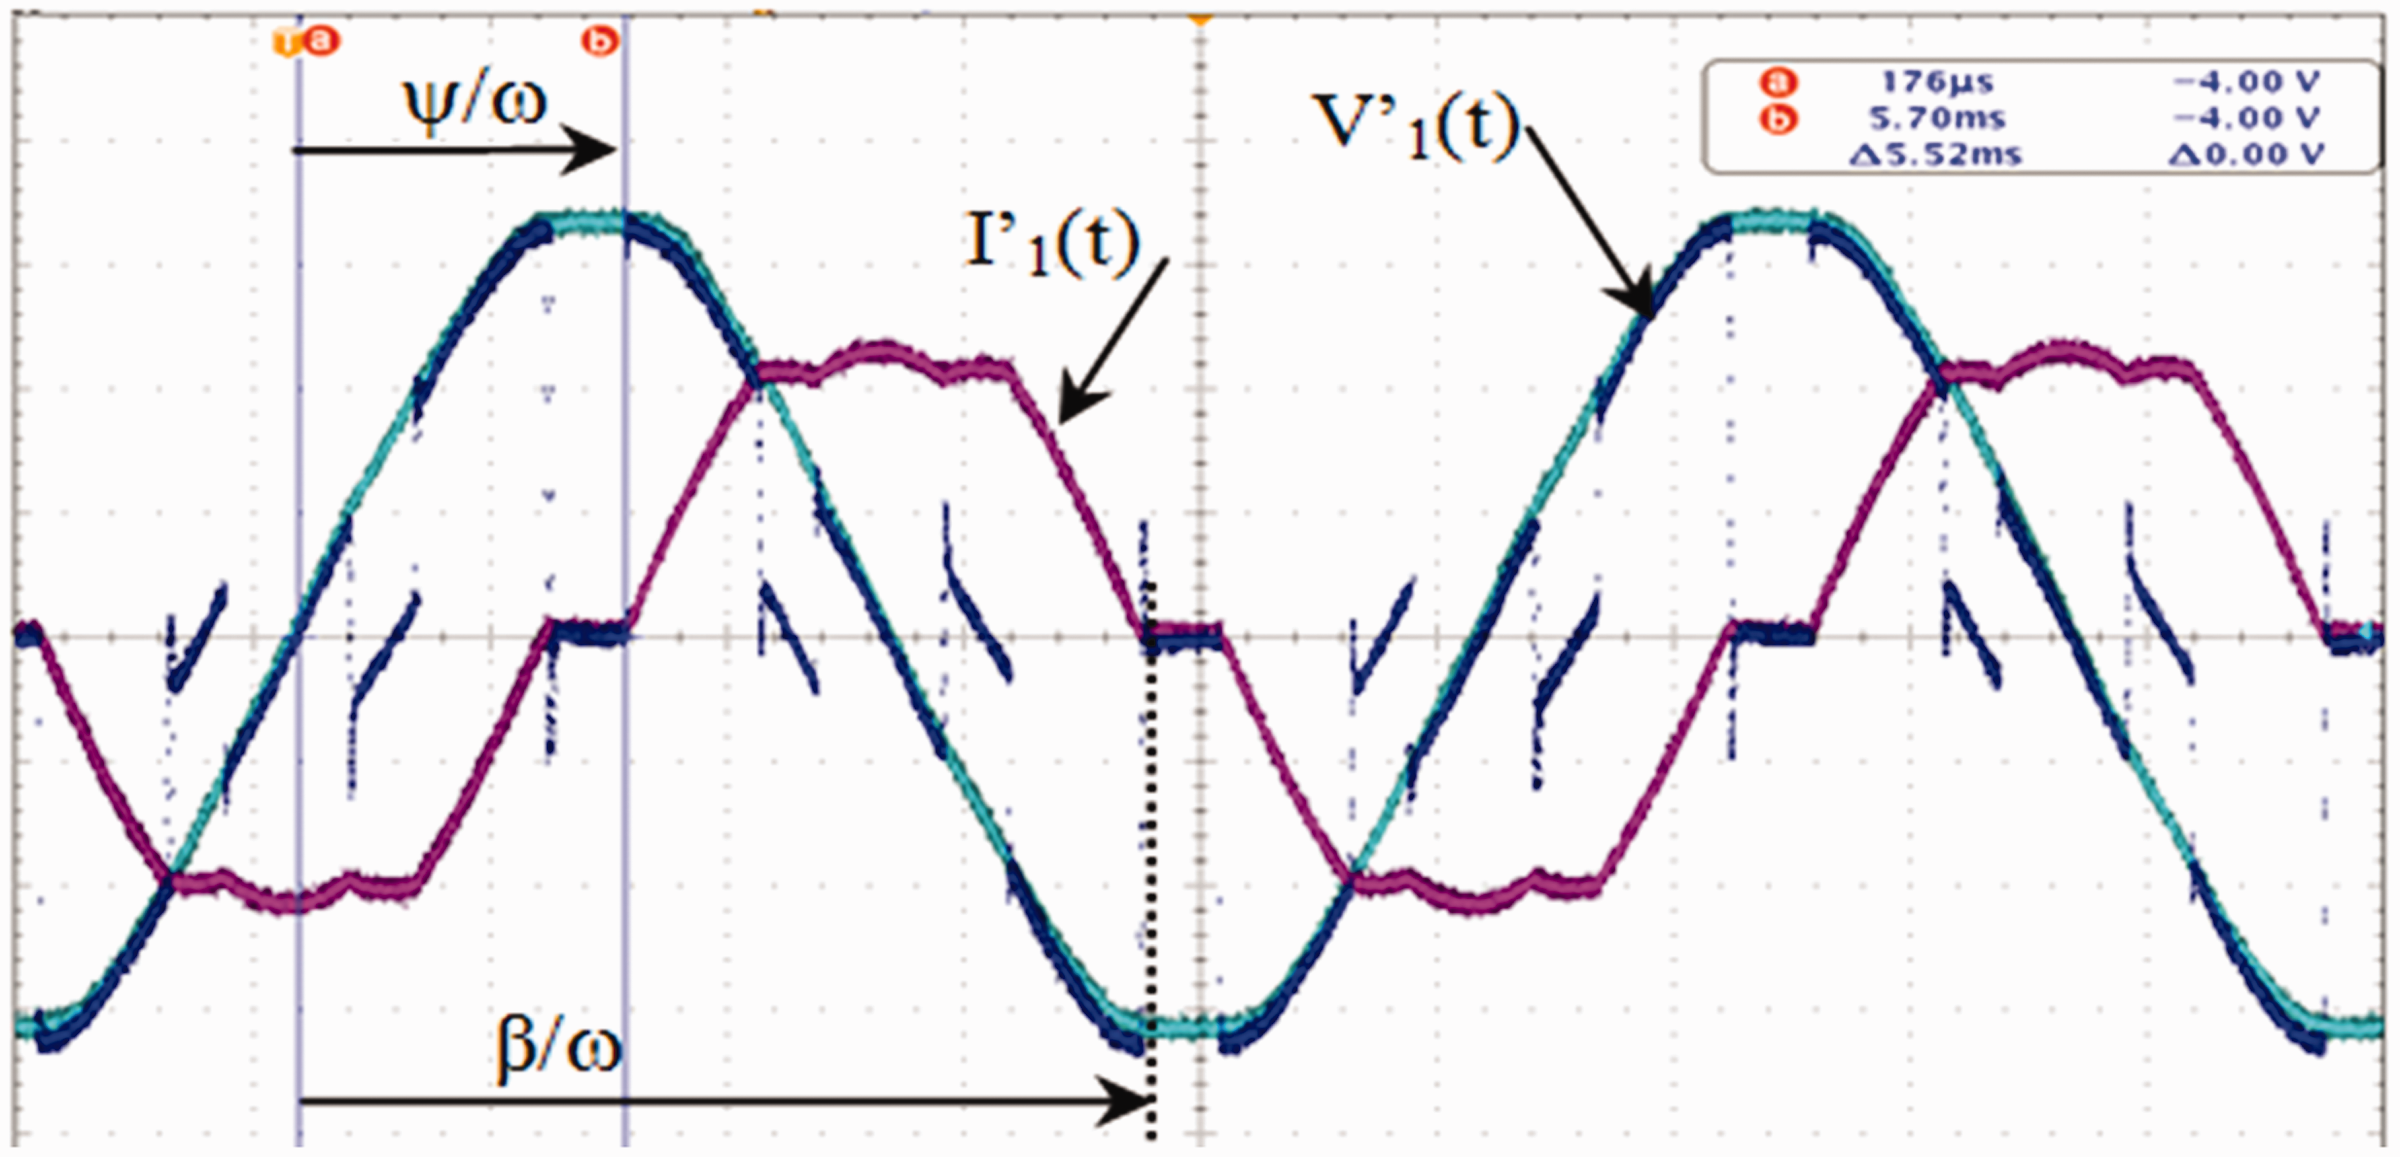
Waveforms for ψ ≈ 99°.
The current cancellation angle 
In our case, 
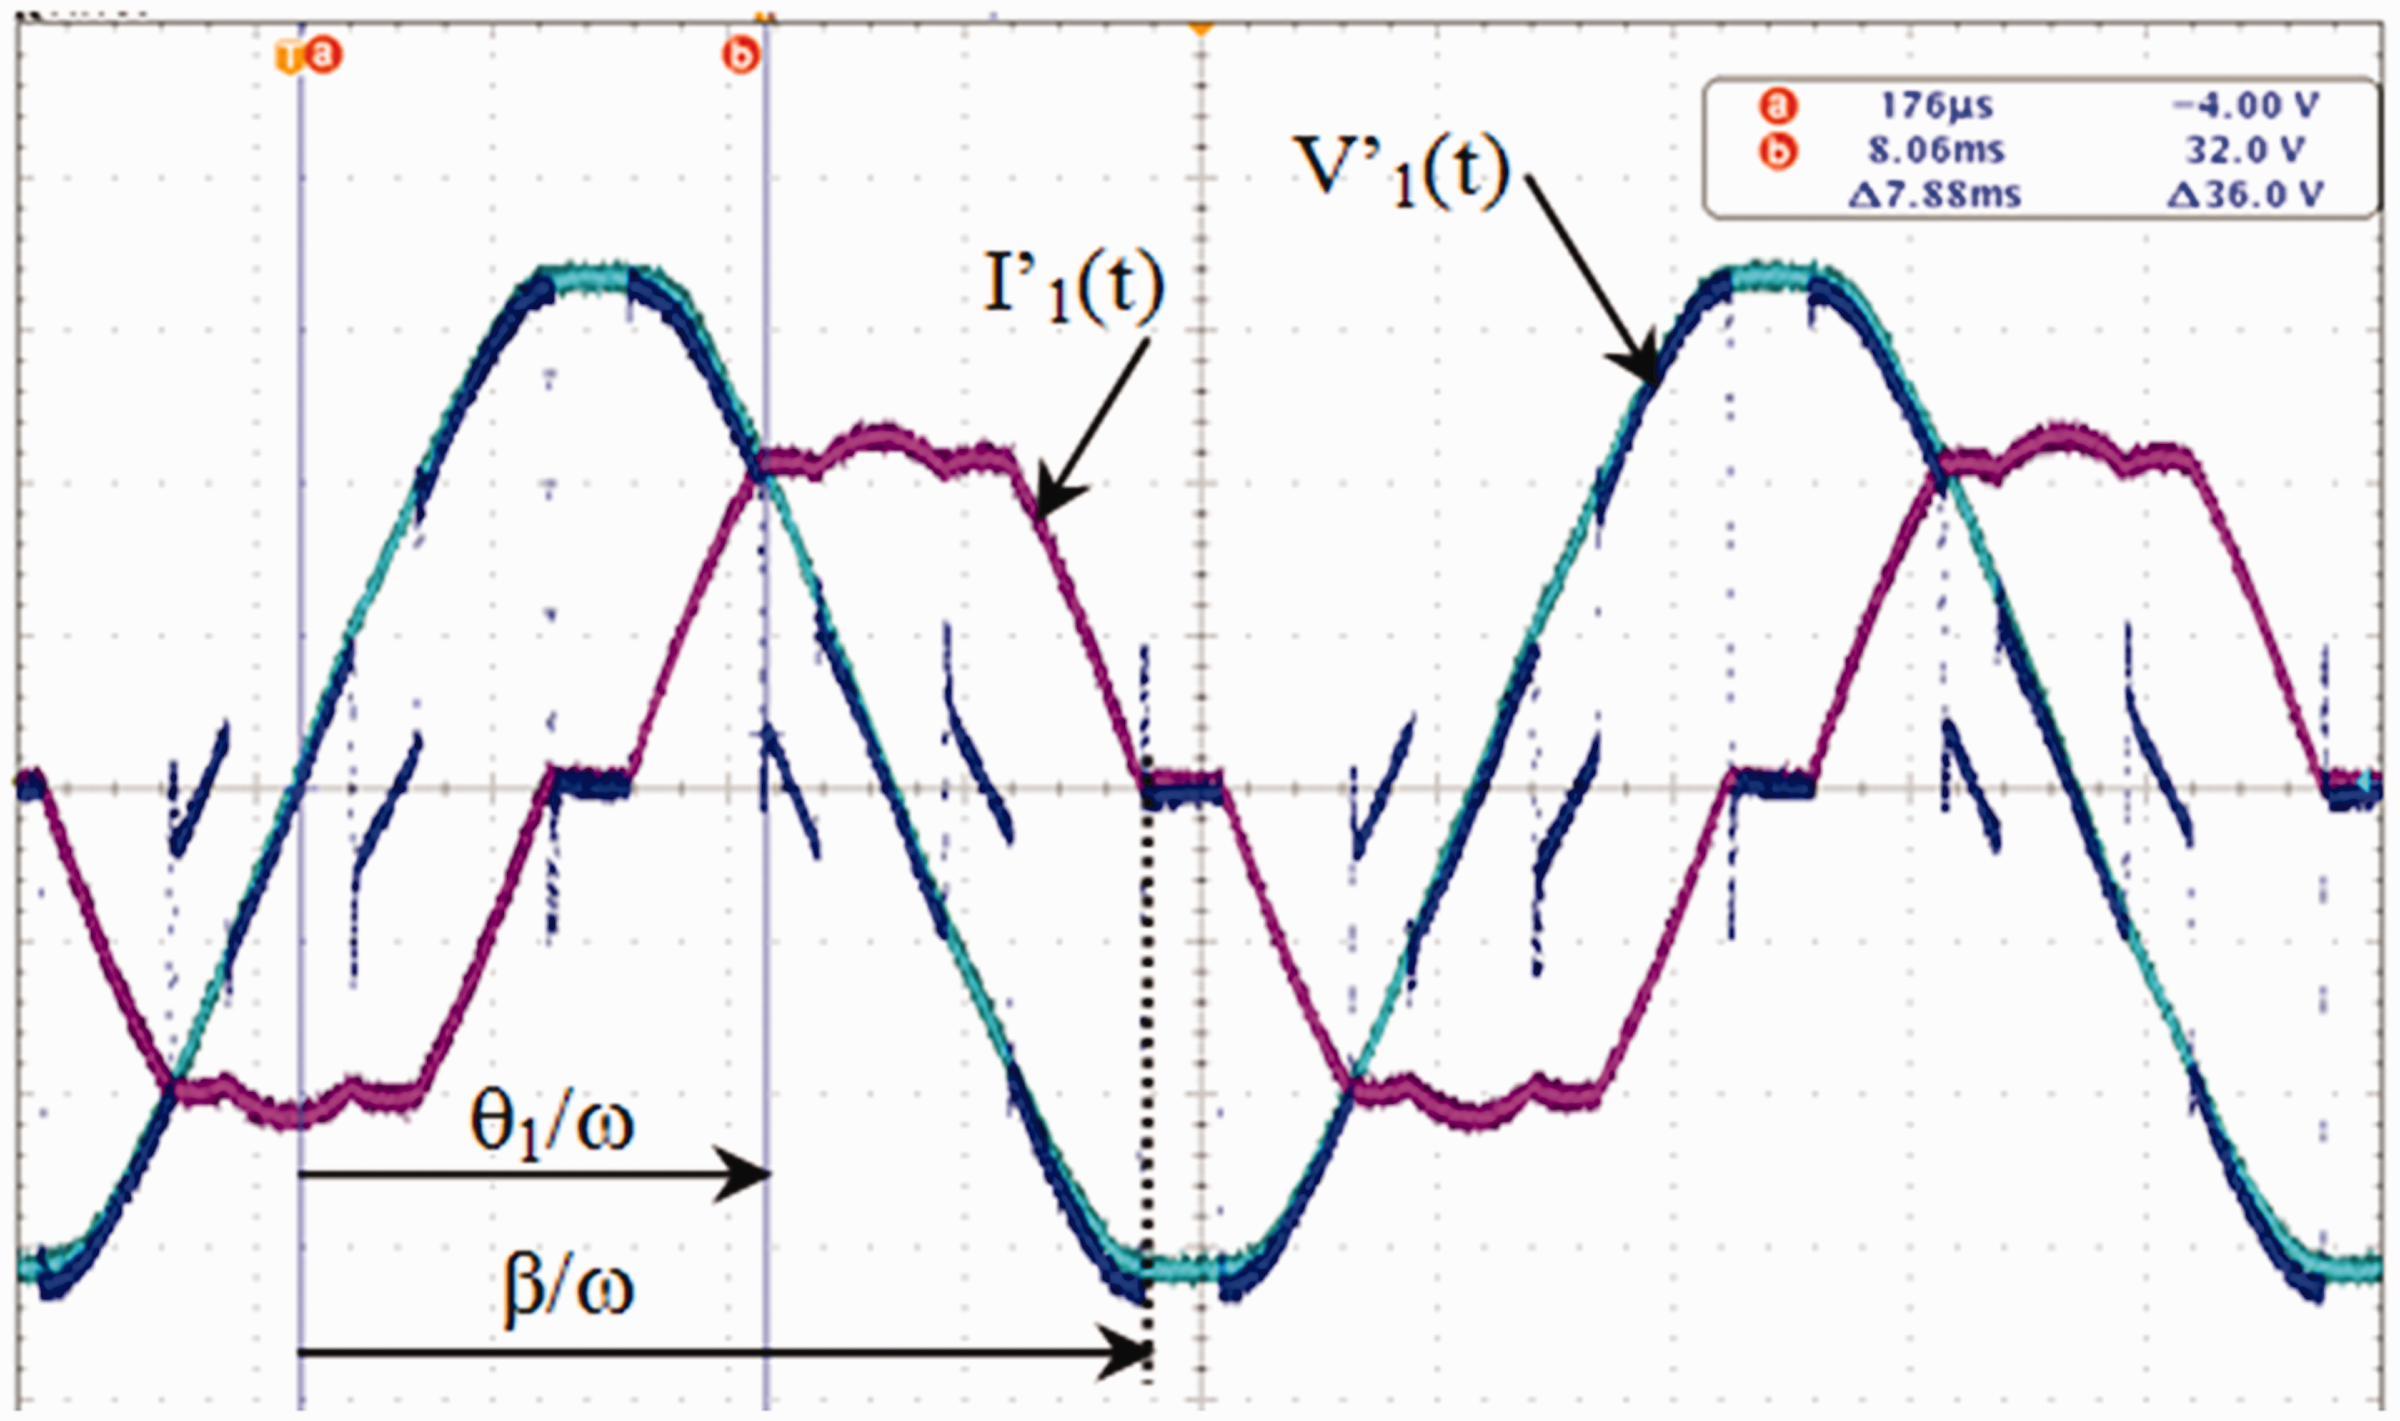
Wave forms for ψ ≈ 99°.
In the studied case,
Figure 20 shows the voltage and current experimental waveforms considering phase 1. For ψ = ψlim = 120°, it can be noticed that the current has a low value which confirms the choice of working in mode 1. According to the relationship (21), for ψ = 1.73 rd, the capacitance value of resulting theoretical capacitor is Cthe = 41.3 µF for a measured value Cmes = 48.9 µF (QL = 2500 VAR, ω = 314 rd.s−1, and U = 403.5 V).
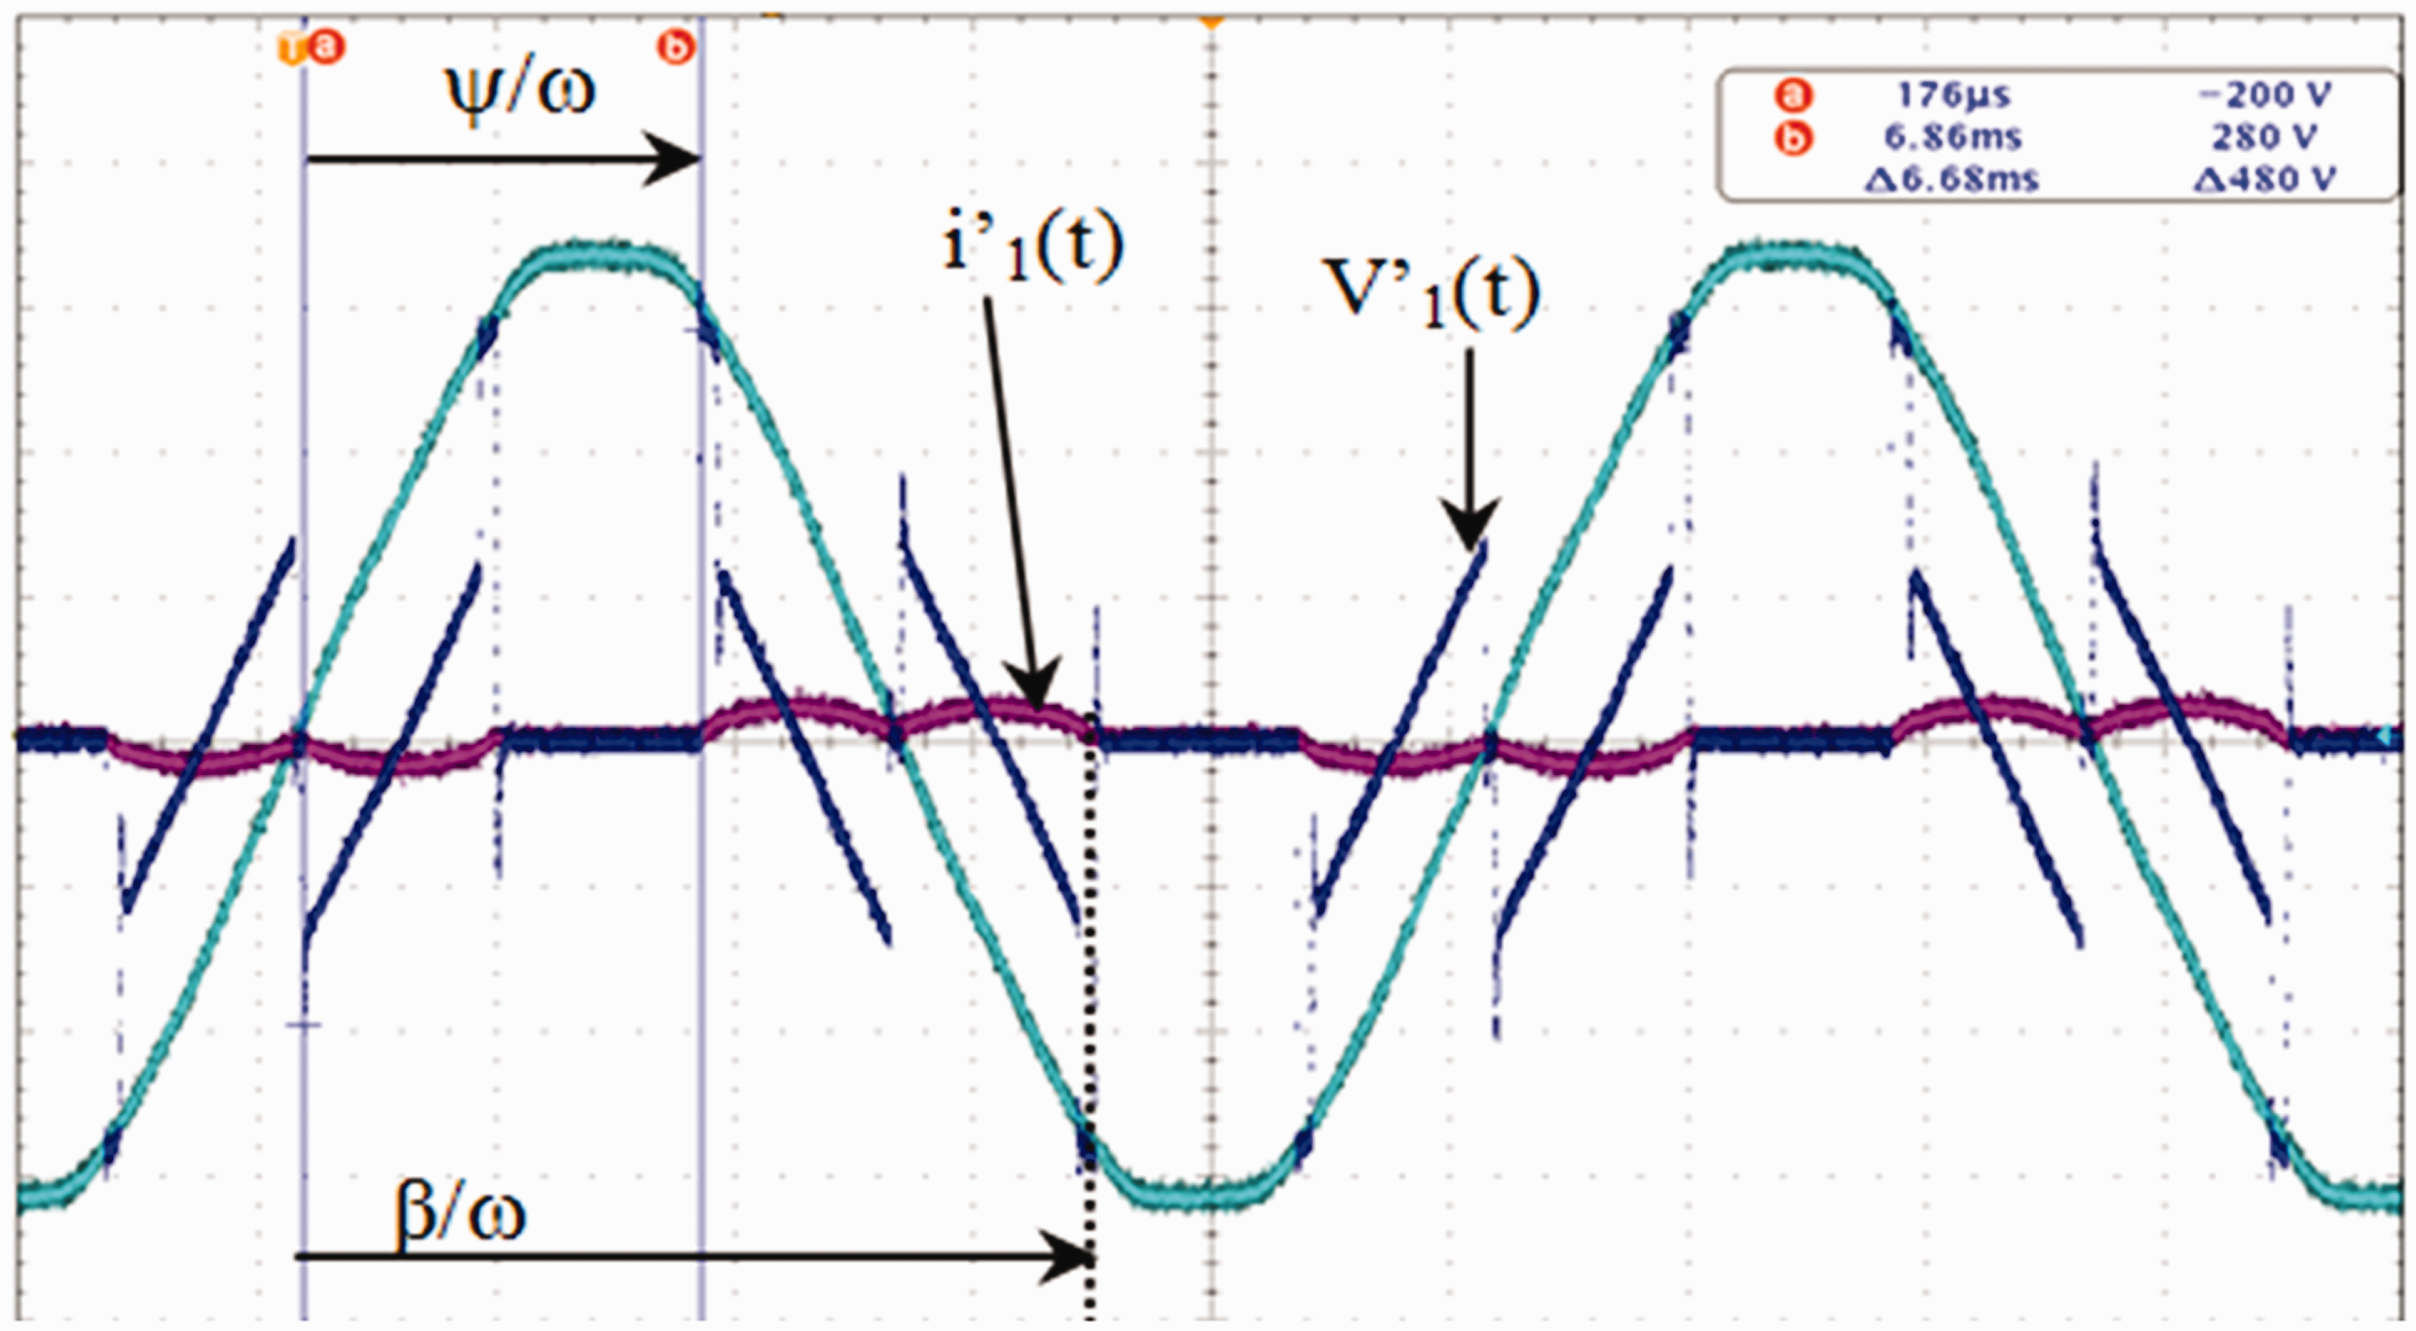
Waveforms for ψ ≈ 120°.
Therefore, the capacitance of the equivalent capacitor corresponding to the reactive power consumed by the regulating load is Cexp = C = 53.1 µF (Cexp = CM – Cmes = 102 µF – 48.9 µF). Taking into consideration the relation (20), the capacitance of the equivalent capacitor corresponding to the distorting power is Cdef = 11.8 µF. Thus, the resulting capacitance of the equivalent capacitor at the generator terminals is Ceq = Cthe + Cdef = 53.1µF. In order to validate the relationship already mentioned, several firing angle values have been checked. The obtained values are presented in Table 4 where the distorting power computing is stopped for n = 7 (D1,5,7).
Theoretical and experimental capacitor values.
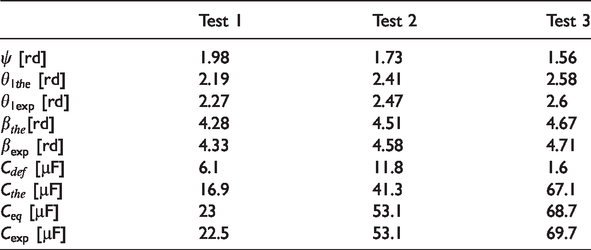
As previously mentioned, with this computing method, theoretical capacitance values Ceq are close to experimental measured values Cexp as indicated in Table 4.
To predict the impact of the TCR on the signals quality of the generator, some measures were carried out at the SEIG outputs. Figure 21 shows the instantaneous evolution of the current (curve 3), the voltage at the output of the IG (curve 1), the current absorbed by the regulating impedance (curve 4), and the voltage at the terminals of this impedance (curve 2). In this case, the
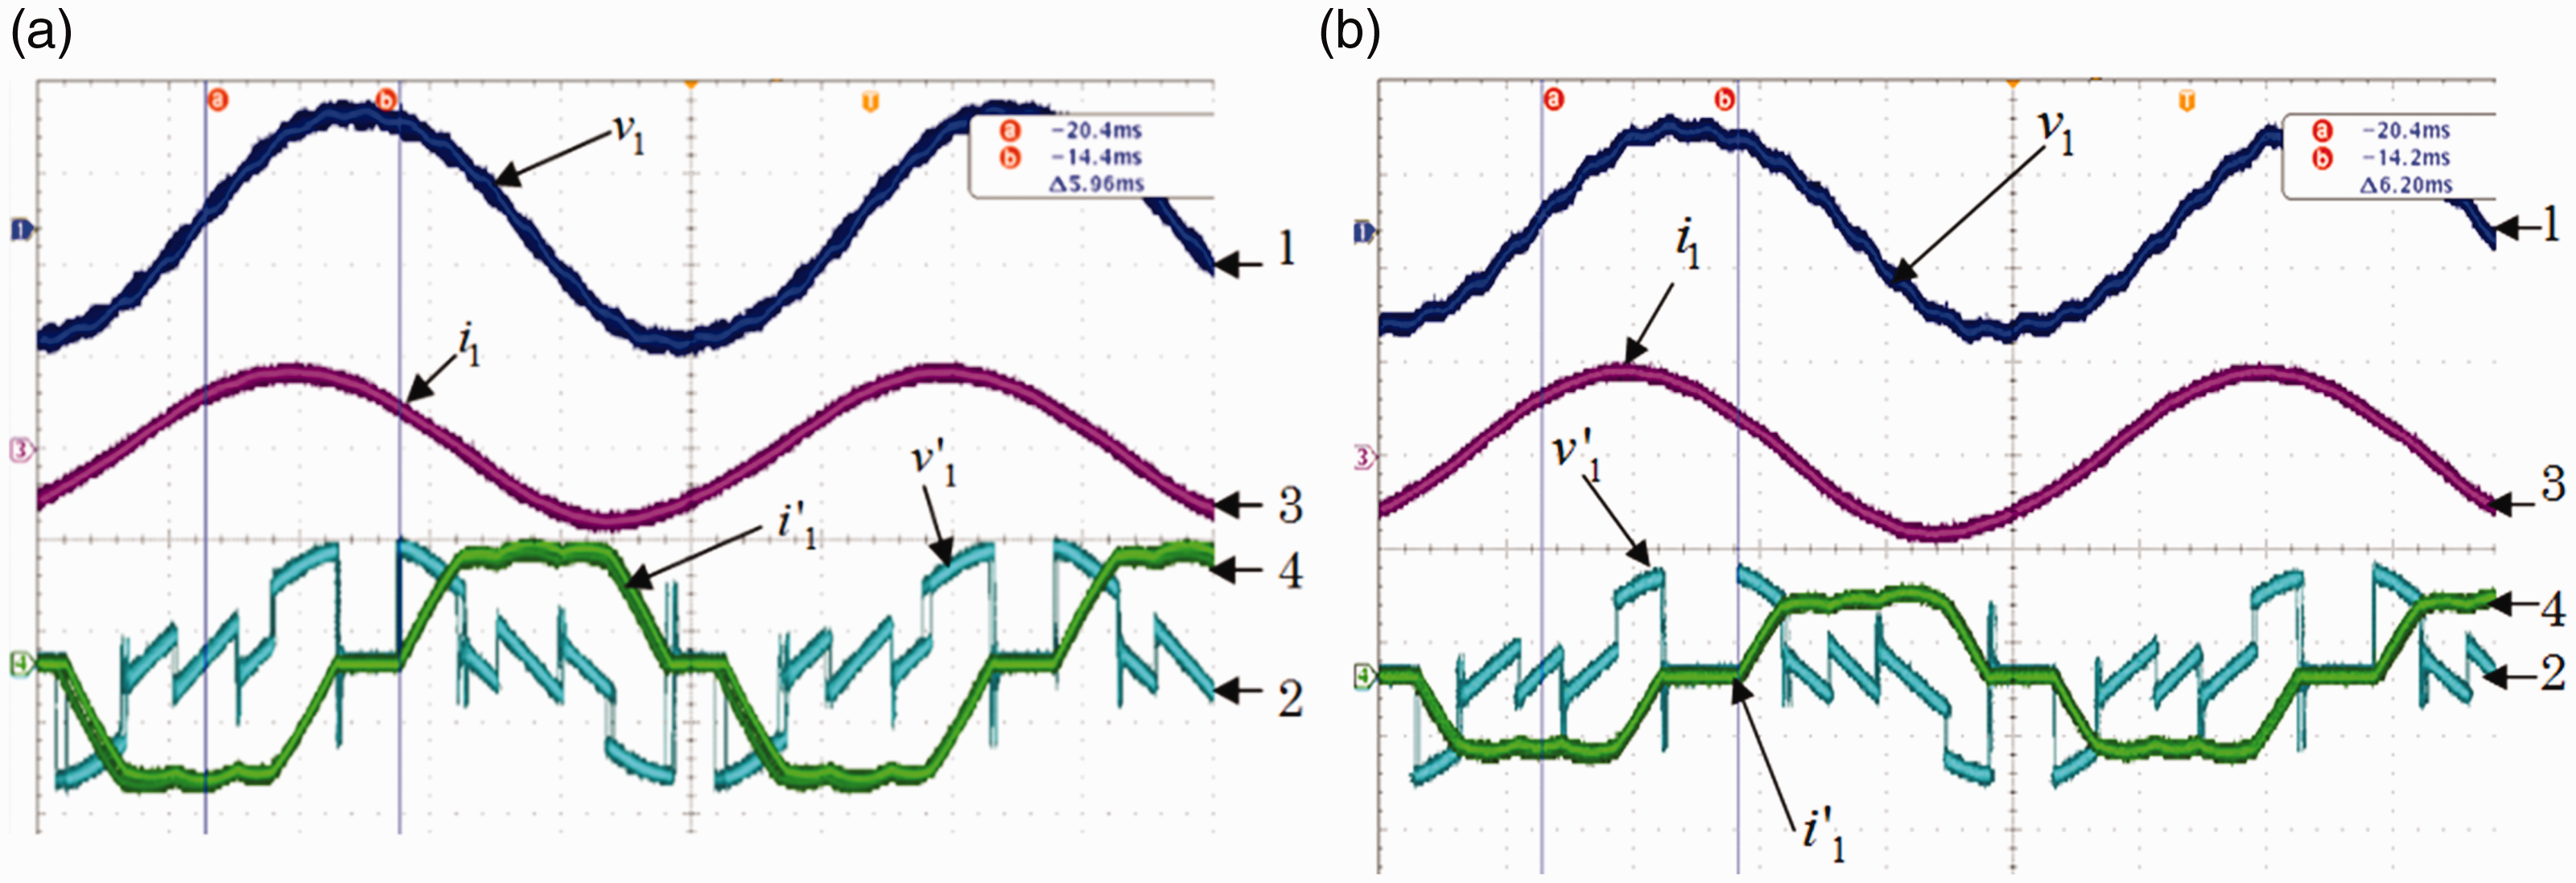
Signals at the output of the SEIG: (a) ψ = 107.28° and (b) ψ = 111.6°.
These quantities are measured directly on phase 1 of the generator without making the transformations to the space vectors to verify the impact of the use of the TCR on the quality of the signals delivered by the SEIG. The curves plotted in Figure 21 show that the stator voltage and current measured at the outputs of the generator are very slightly modified by the use of the dimmer.
Conclusion
In this paper, a robust strategy to enhance the transient state of the SEIG equipping a remote site was developed and analyzed. This study was developed to demonstrate the importance of the reactive power adjustment by varying C value at the stator of the SEIG which supplies an inductive–resistive load in remote site. Some methods such as Newton–Raphson method, PSO method, and graphical development are used to determine the best operating point of the SEIG. Through this analysis, it was revealed that any change of R load accompanied by C capacitor variation can enhance the transient state and can make easy the control of the sudden voltage variations at the SEIG outputs which can cause the voltage collapse. The variable capacitor was obtained by adjusting a fixed capacitors battery while using a dimmer feeding an inductive regulation load. Also in this paper, it was presented an approach able to estimate the equivalent capacitor at the SEIG terminals considering the thyristors firing angle of the dimmer. To perform the transient and steady state studies of the IG, the SEIG modeling using space phasor formalism was numerically implemented. By means of this model, a fuzzy logic and PI controllers were simulated. These results show that the FLC controller acts properly for the stabilization of the frequency and the improvement of the transient state. The numerical simulations and experimental tests have demonstrated that this strategy can carry a significant improvement during transient state and consequently can avoid the SEIG collapse.
A major perspective of this work is to study and design a system for the smooth self-starting of the SEIG. This will prevent overvoltage that appear in the stator of the machine and may cause its stall or destruction of nearby equipment. In this context, we must think to make a thorough study of the starting of the wind generator to avoid significant variations in voltage and current that can trigger protections or disrupt electronic equipment. Another future work consists on the procedure of merging of two or more renewable energy sources, such as solar photovoltaic (PV) system, storage battery, and Wind IG, which can provide better power stability and reliability. Indeed, the operation of such hybrid system becomes more economical since the weakness of one source can be complemented by the strength of the other one.
Footnotes
Declaration of conflicting interests
The author(s) declared no potential conflicts of interest with respect to the research, authorship, and/or publication of this article.
Funding
The author(s) disclosed receipt of the following financial support for the research, authorship, and/or publication of this article: The authors gratefully acknowledge the approval and the support of this research study by the grant no. 7527-ENG-2018–1-8-F from the Deanship of Scientific Research at Northern Border University, Arar, KSA.