
Abstract
In previous studies, two conflicting conclusions existed, which were: (a) the isobutane/n-butane ratio of natural gas increases with the increasing maturity (Ro) of source rocks and (b) decreases with the increasing Ro. In this paper, the correlations between the isobutane/n-butane ratios, dryness of natural gases, and the Ro values of source rocks of 77 gas samples from Cretaceous and Tertiary in Kuqa Depression, Tarim Basin, Triassic Xujiahe Formation in central Sichuan Basin, Carboniferous–Permian in Sulige and Yulin gas field, Ordos Basin, China, and 80 shale gas samples from Mississippian Barnett Shale in the Fort Worth Basin, the United States are analyzed to reveal the evolution of the isobutane/n-butane ratios, then mathematical models of the isobutane/n-butane ratios and Ro are attempted to be established. Results show that the isobutane/n-butane ratio initially increases and then decreases with increasing Ro, both coal-derived gas and oil-type gas. Diverse types of kerogens may be responsible for the different corresponding Ro values when the isobutane/n-butane ratios of gases reach their maximum values. The initial increase in the isobutane/n-butane ratios with increasing Ro is the reason that isobutane is mainly generated at a higher rate by carbonium ion reaction of α-olefins with protons during kerogen primary cracking at lower maturity, whereas free radical reactions to form n-butane relatively quickly during oil cracking at higher maturity and isobutane cracked at a higher rate during the wet gas cracking stage may result in the terminal decreases in the isobutane/n-butane ratios. Besides, mathematical models of the isobutane/n-butane ratios of different types of natural gas and maturity are established. Therefore, the maturity of gas source rock can be obtained quickly based on the models using the isobutane/n-butane ratio combined with other component information (such as dryness, wetness, etc.), which is of great significance to the characterization of natural gas maturity and gas source rock correlation.
Keywords
Introduction
Natural gas is mainly composed of methane, ethane, propane, butane, light hydrocarbon, nitrogen, carbon dioxide, and rare gas. Chemical and isotopic compositions are the most important parameters for characterizing the geochemical properties of natural gases. In particular, methane and ethane components and their isotopes are widely used in genetic type analysis, maturity estimation, gas source rock correlation, migration tracer, and secondary transformation identification of natural gas (Dai, 2018; Dai et al., 2012; Galimov, 2006; Jenden et al., 1988; Kotarba and Lewen, 2013; Prinzhofer and Huc, 1995; Schoell, 1983; Sechman et al., 2017). Due to the influence of isotopic fractionation caused by pyrolysis, methane and higher hydrocarbons should become increasingly enriched in the 13C isotope with increasing thermal stress, i.e. with increasing maturity of their source rocks (Berner and Faber, 1996, 1988; Dai, 1992; Faber et al., 1988; Liu and Xu, 1999; Schoell, 1983; Stahl, 1977). Thus, the identification of natural gas maturity is mainly based on the mathematical formulas of source rock maturity and methane isotope (δ13C1) obtained by thermal simulation experiments or empirical formulas so far. For a long time, different scholars have been concerned about whether the parameters that reflect the maturity of gas source rock can be sought from the composition of natural gas, such as dryness or wetness (Dai et al., 2016), Bernard parameter (Bernard et al., 1978), heptane (C7) fraction concentration (Philippi, 1975; Thompson, 1983), the isobutane/n-butane (iC4/nC4) and i-pentane/n-pentane ratio (Qin et al., 2019; Wang et al., 2017), etc. Generally, for thermogenic natural gas, the methane content will gradually increase with increasing thermal stress, i.e. with increasing maturity of their source rock (Berner and Faber, 1988; Dai et al., 2016; Tissot and Welte, 1984). The Bernard parameter (C1/(C2+3)), also having the same tendency, increases with increasing maturity (Bernard et al., 1978). Similarly, the wetness (
Geological and geochemical backgrounds of the samples
In order to exclude the influence of the organic type of natural gas source rocks, the natural gas compositions and stable carbon isotopes data of gases produced from different types of kerogens were collected, respectively, from previous studies (He et al., 2015; Li et al., 2007a; Tao et al., 2009; Qin et al., 2018a, 2018b, 2019; Dai et al., 2014b, 2005b; Yu et al., 2013; Zumberge et al., 2012), including 77 gas samples in Cretaceous and Tertiary in Kuqa Depression, Tarim Basin, Triassic Xujiahe Formation in central Sichuan Basin, C–P in Sulige and Yulin gas field, Ordos Basin, China, and 80 shale gas samples from Mississippian Barnett Shale in the Fort Worth Basin, the United States, respectively (Table 1 and Supplemental Material). The geological and geochemical backgrounds of the samples are as follows (Table 2).
Chemical and isotopic compositions of the gases used in this study.
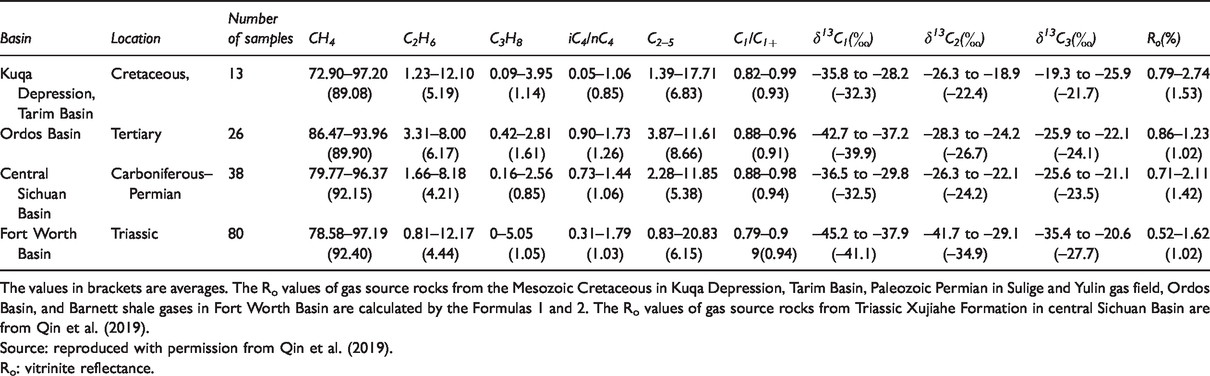
The values in brackets are averages. The Ro values of gas source rocks from the Mesozoic Cretaceous in Kuqa Depression, Tarim Basin, Paleozoic Permian in Sulige and Yulin gas field, Ordos Basin, and Barnett shale gases in Fort Worth Basin are calculated by the Formulas 1 and 2. The Ro values of gas source rocks from Triassic Xujiahe Formation in central Sichuan Basin are from Qin et al. (2019).
Source: reproduced with permission from Qin et al. (2019).
Ro: vitrinite reflectance.
The characteristics of geological and geochemical backgrounds of the samples.
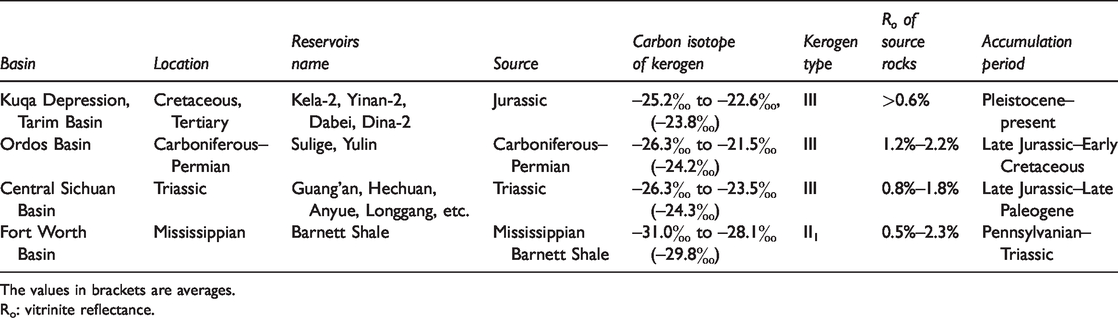
The values in brackets are averages.
Ro: vitrinite reflectance.
The Kuqa Depression, located in the southern piedmont of the southern Tianshan orogenic belt in the Tarim Basin, is composed of five tectonic belts and three sags, namely the Northern Monoclinal belt, Southern Slope, and Kelasu, Yiqikelike, Qiulitage structural belt, and Wushi, Baicheng, and Yangxia sags (Hu et al., 2014; Xu et al., 2011). In the past few decades, several tight gas fields, including Kela-2, Yinan-2, and Dabei gas fields in the Kelasu tectonic zone, the Dina-2 gas field in the Qiulitage tectonic belt have been discovered in Cretaceous and Tertiary reservoirs (Zou et al., 2006). Hydrocarbon gas is the dominant component of natural gas with a relatively high dryness ranging from 0.77 to 1.00 in Kuqa depression (Liu et al., 2007a). Most discovered gas reservoirs have mainly experienced large-scale gas charging since the Pleistocene (∼3 Ma) (Guo et al., 2016; Li et al., 2014, 2015; Liang et al., 2003; Lu et al., 2012; Sun et al., 2018; Wei et al., 2019; Zhang et al., 2011; Zhao et al., 2005; Zhu et al., 2019), and are generally believed to be mainly originated from Jurassic coal-bearing source rocks (Liang et al., 2003; Wei et al., 2019; Zhang et al., 2011; Zhu et al., 2012; Zou et al., 2006). The Jurassic source rocks, composed of 400 m–1100 m of coal-bearing clastic rocks deposited in swamp-lacustrine settings, are widely distributed throughout the Kuqa Depression (Chen et al., 2012; Liu et al., 2007b). Most of the organic matter was derived from terrestrial higher plants, and the carbon isotope of kerogen was between –25.2‰ and –22.6‰, and the average value was –23.8‰ (Liang et al., 2003; Shi, 2000; Zhu et al., 2012). The thermal maturity (Ro) of source rocks is generally greater than 0.60%, and have a higher Ro value in the center and lower value in the edge of depression (Liang et al., 2003; Tang et al., 2014). Some samples data in this paper are mainly selected from typical tight gas reservoirs in Kuqa Depression, including Kela-2, Yinan-2, and Dabei and the Dina-2 gas field. These gas reservoirs are mainly derived from Jurassic coal-bearing source rocks during the similar charge timings (since ∼3 Ma), but the maturity of natural gas is different (Guo et al., 2016; Li et al., 2014; Lu et al., 2012; Sun et al., 2018; Wei et al., 2019; Yu et al., 2017; Zhang et al., 2011; Zhao et al., 2005). The current Kela-2 and Dabei are dry gas reservoir/field, whereas the Dina-2 and Yinan-2 are wet gas reservoirs. Obviously, the thermal maturity of source rocks controls the distribution of natural gas, thus the relatively lower maturity of source rocks in Yangxia sag, resulting in the wet gas in Yinan-2 and Dina-2 gas reservoir (Liang et al., 2003). This gas distribution difference also suggests that there is no significant large-scale lateral migration in these tight gas reservoirs.
The Ordos Basin is a large sedimentary basin located near the western margin of the North China craton in central China (Shuai et al., 2003). Several large tight gas reservoirs have been discovered in the Upper Paleozoic, such as the Sulige, Wushenqi, Yulin, Daniudi, and Mizi gas fields (Dai et al., 2005a; Li et al., 2018; Ma, 2005). The Upper Paleozoic natural gases in the two large gas fields are coal-derived gas and characterized by major dry gases and minor wet gases (Dai et al., 2005a; Li et al., 2012a, 2012b). The gases are generally thought to be generated from Upper C–P coal measures with the main gas reservoir being in the Lower Permian Shanxi Formation (Dai et al., 2005a, 2014; Feng et al., 2016; Hu et al., 2010a, 2010b; Li et al., 2012a, 2012b; Liu, et al., 2007b; Shuai et al., 2013; Zhao et al., 2014). The C–P coal-measure source rock, present in this area, is mainly a transitional marine-terrestrial stratum, including coal, mudstone, and limestone (Fu et al., 2005; Li et al., 2012b). The high-quality gas source rocks of C–P, which extensively develop in this area, have a high content of organic carbon, medium hydrocarbon potential, and type III kerogens, and the carbon isotope of kerogen was between –26.3‰ and –21.5‰ with the average value of –24.2‰ (Dai et al., 2001, 2003; Li et al., 2012a; Zhong and Chen, 2002). The vitrinite reflectance values for the C–P strata in the gas field areas range from 1.2% to 2.2% (Dai et al., 2003; Zhao et al., 1996). Some samples data in this paper are mainly selected from typical tight gas reservoirs in the Sulige and Yulin gas fields. The natural gas in the Sulige and Yulin gas field may be charged by a continuous process, and experiences one main gas accumulation period, mainly occurring at the Late Jurassic and Early Cretaceous, belonging to the near-source gas charging and cumulative gas accumulation (Hu et al., 2010a; Li et al., 2012a, 2012b; Mi et al., 2004; Zhang et al., 2014).
The Xujiahe Formation, consisting of six members, is mainly composed of a set of coal deposits originated from fluvial, lacustrine, and swamp facies and commonly developed in the central Sichuan Basin (Dai et al., 2009, 2012; Yang et al., 2009; Zhao et al., 2010). The first, third, and fifth members (T3x1, T3x3, and T3x5) of this formation are dominated by gas prone dark mudstones and coals. The source rocks are intercalated with the sandstone-dominated second, fourth, and sixth members of the Xujiahe Formation (T3x2, T3x4, and T3x6), thus leading to three separate self-contained petroleum systems in the region (Dai et al., 2009). Several large-scale gas fields have been discovered in the Xujiahe Formation in the Central Sichuan Basin, such as the Xujiahe reservoir in the Anyue gas field, Guang’an gas field, Hechuan gas field, and a series of small and medium gas fields (Qin et al., 2018c). The natural gases are characterized by wet gas with a dryness generally lower than 0.95, and believed to be derived from the black mudstone and coal-bearing mudstone source rocks of the formation’s T3x1, T3x3, and T3x5 (Dai et al., 2009, 2012; Wang et al., 2013). The coal-bearing source rock mainly have type III kerogens, and the carbon isotope of kerogen was between –26.3‰ and –23.5‰ with the average value of –24.3‰ (Dai et al., 2009, 2012; Zhang, 2013). The maturities of the source rocks, characterized by vitrinite reflectance (Ro), range from 0.8% to 1.8% (Dai et al., 2012). Some samples data in this paper are mainly selected from typical tight gas reservoirs (Guang’an, Hechuan, Anyue, Longgang, etc.) in the Xujiahe Formation in the Central Sichuan Basin. The hydrocarbon filling and accumulation of these reservoirs was a successive process which lasted from Late Jurassic to Late Paleogene (Tao et al., 2009, 2014; Zhang et al., 2015), and tight gas accumulation is in situ, and natural gas has not experienced large-scale migration (Qin et al., 2018c, 2019; Tao et al., 2009).
In recent years, the Barnett Shale of the Fort Worth Basin has been a major target for exploration and development of unconventional shale gas in the USA (Curtis, 2002). The shale serves as both the reservoir and source rock (Hill et al., 2007a; Montgomery et al., 2005), with no significant modification by migrated hydrocarbons (Wood and Sanei, 2016). General geological reviews, petrographic analyses, and organic geochemical evaluations of the Barnett Shale play have recently been published (Bowker, 2007; Hickey and Henk, 2007; Hill et al., 2007a, 2007b; Jarvie et al., 2007; Loucks and Ruppel, 2007; Montgomery et al., 2005; Pollastro, 2007; Pollastro et al., 2007). This organic-rich succession of black shales, which averages 4.5 wt.% total organic carbon (TOC), is thermally mature (Ro = 0.5%–2.3%) for hydrocarbon generation over most of the Fort Worth Basin area. The source rock mostly contains type II1 kerogen of marine algal source and deposited in a deep foreland marine basin under upwelling conditions, and the carbon isotope of kerogen was between –31.0‰ and –28.1‰ with the average value of –29.8‰. The origin of the gas is thermogenic, probably derived from both kerogen cracking and secondary cracking of previously generated non-migrated hydrocarbons (Rodriguez and Philp, 2010; Wood and Sanei, 2016). The peak maturity of the Barnett Shale in the Fort Worth Basin is reached perhaps in the latest Pennsylvanian and maintained through the Permian and into the Triassic, and the unconventional shale gases are continuous accumulations within the Barnett Shale (Ewing, 2006; Hill et al., 2007a; Pollastro et al., 2007).
By analyzing the geological and geochemical background of the selected samples, the hydrocarbon filling and accumulation of the tight gas reservoirs are successive process, and tight gas accumulations are almost in situ, and natural gas has not experienced large-scale horizontal and vertical migration. Meanwhile, the selected Barnett shale gases in the Fort Worth Basin, the United States, are typical “self-generation and self-accumulation” gas reservoirs. Shale gases represent gases at their site of generation (Price and Schoell, 1995) and therefore provide representative in situ samples to investigate the complex physicochemical processes in the kerogen-hydrocarbon-water-matrix systems at varying temperature and pressure. In addition, the selected natural gas samples are all thermogenic gas (analyzed in next section), so the effect of biodegradation on iC4/nC4 ratio can be avoided. All the source rocks for the analyzed coal-type gases mostly contain type III kerogen and have similar carbon isotopes (Table 2). In this case, the isotopic and component fractionation of natural gas, the effect of carbon isotope difference in the same type kerogen, and the influence of accumulation processes may have little influence, which lays a foundation for studying the iC4/nC4 ratio evolution characteristics of different types of natural gas.
Geochemical characteristics and genesis of natural gas
Chemical and isotopic compositions of natural gas
Methane is the dominant component of the natural gases analyzed for the four study areas with concentrations ranging from 72.90% to 91.20%, with an average of 91.65% (Table 1, Figure 1). The contents of heavy hydrocarbon gas (C2–5) range from 0.83% to 20.83% with an average of 6.44%. The dryness (C1/∑C1–5) is widely distributed, between 0.79 and 0.99, showing the coexistence of wet and dry gas. The methane content of gases from Cretaceous in Kuqa Depression, Tarim Basin, ranges widely (72.90%–97.20%), and the dryness ranges from 0.82 to 0.99, with an average value of 0.93 (Figure 1, Table 1). The methane contents of gases from Triassic Xujiahe Formation in central Sichuan Basin have a relatively narrow distribution, ranging from 86.47% to 93.96% with an average value of 89.90%, and the dryness ranges from 0.88 to 0.96, with an average value of 0.91. The gases from Sulige and Yulin gas field, Ordos Basin, has a high methane content, ranging from 79.77% to 96.37% with an average value of 92.15%, and the dryness ranges from 0.88 to 0.98 with an average value of 0.94. The shale gases from Mississippian Barnett Shale in Fort Worth Basin have the highest methane content, ranging from 78.58% to 97.19% with an average value of 92.40%, and the dryness ranges from 0.79 to 0.99 with an average value of 0.94.
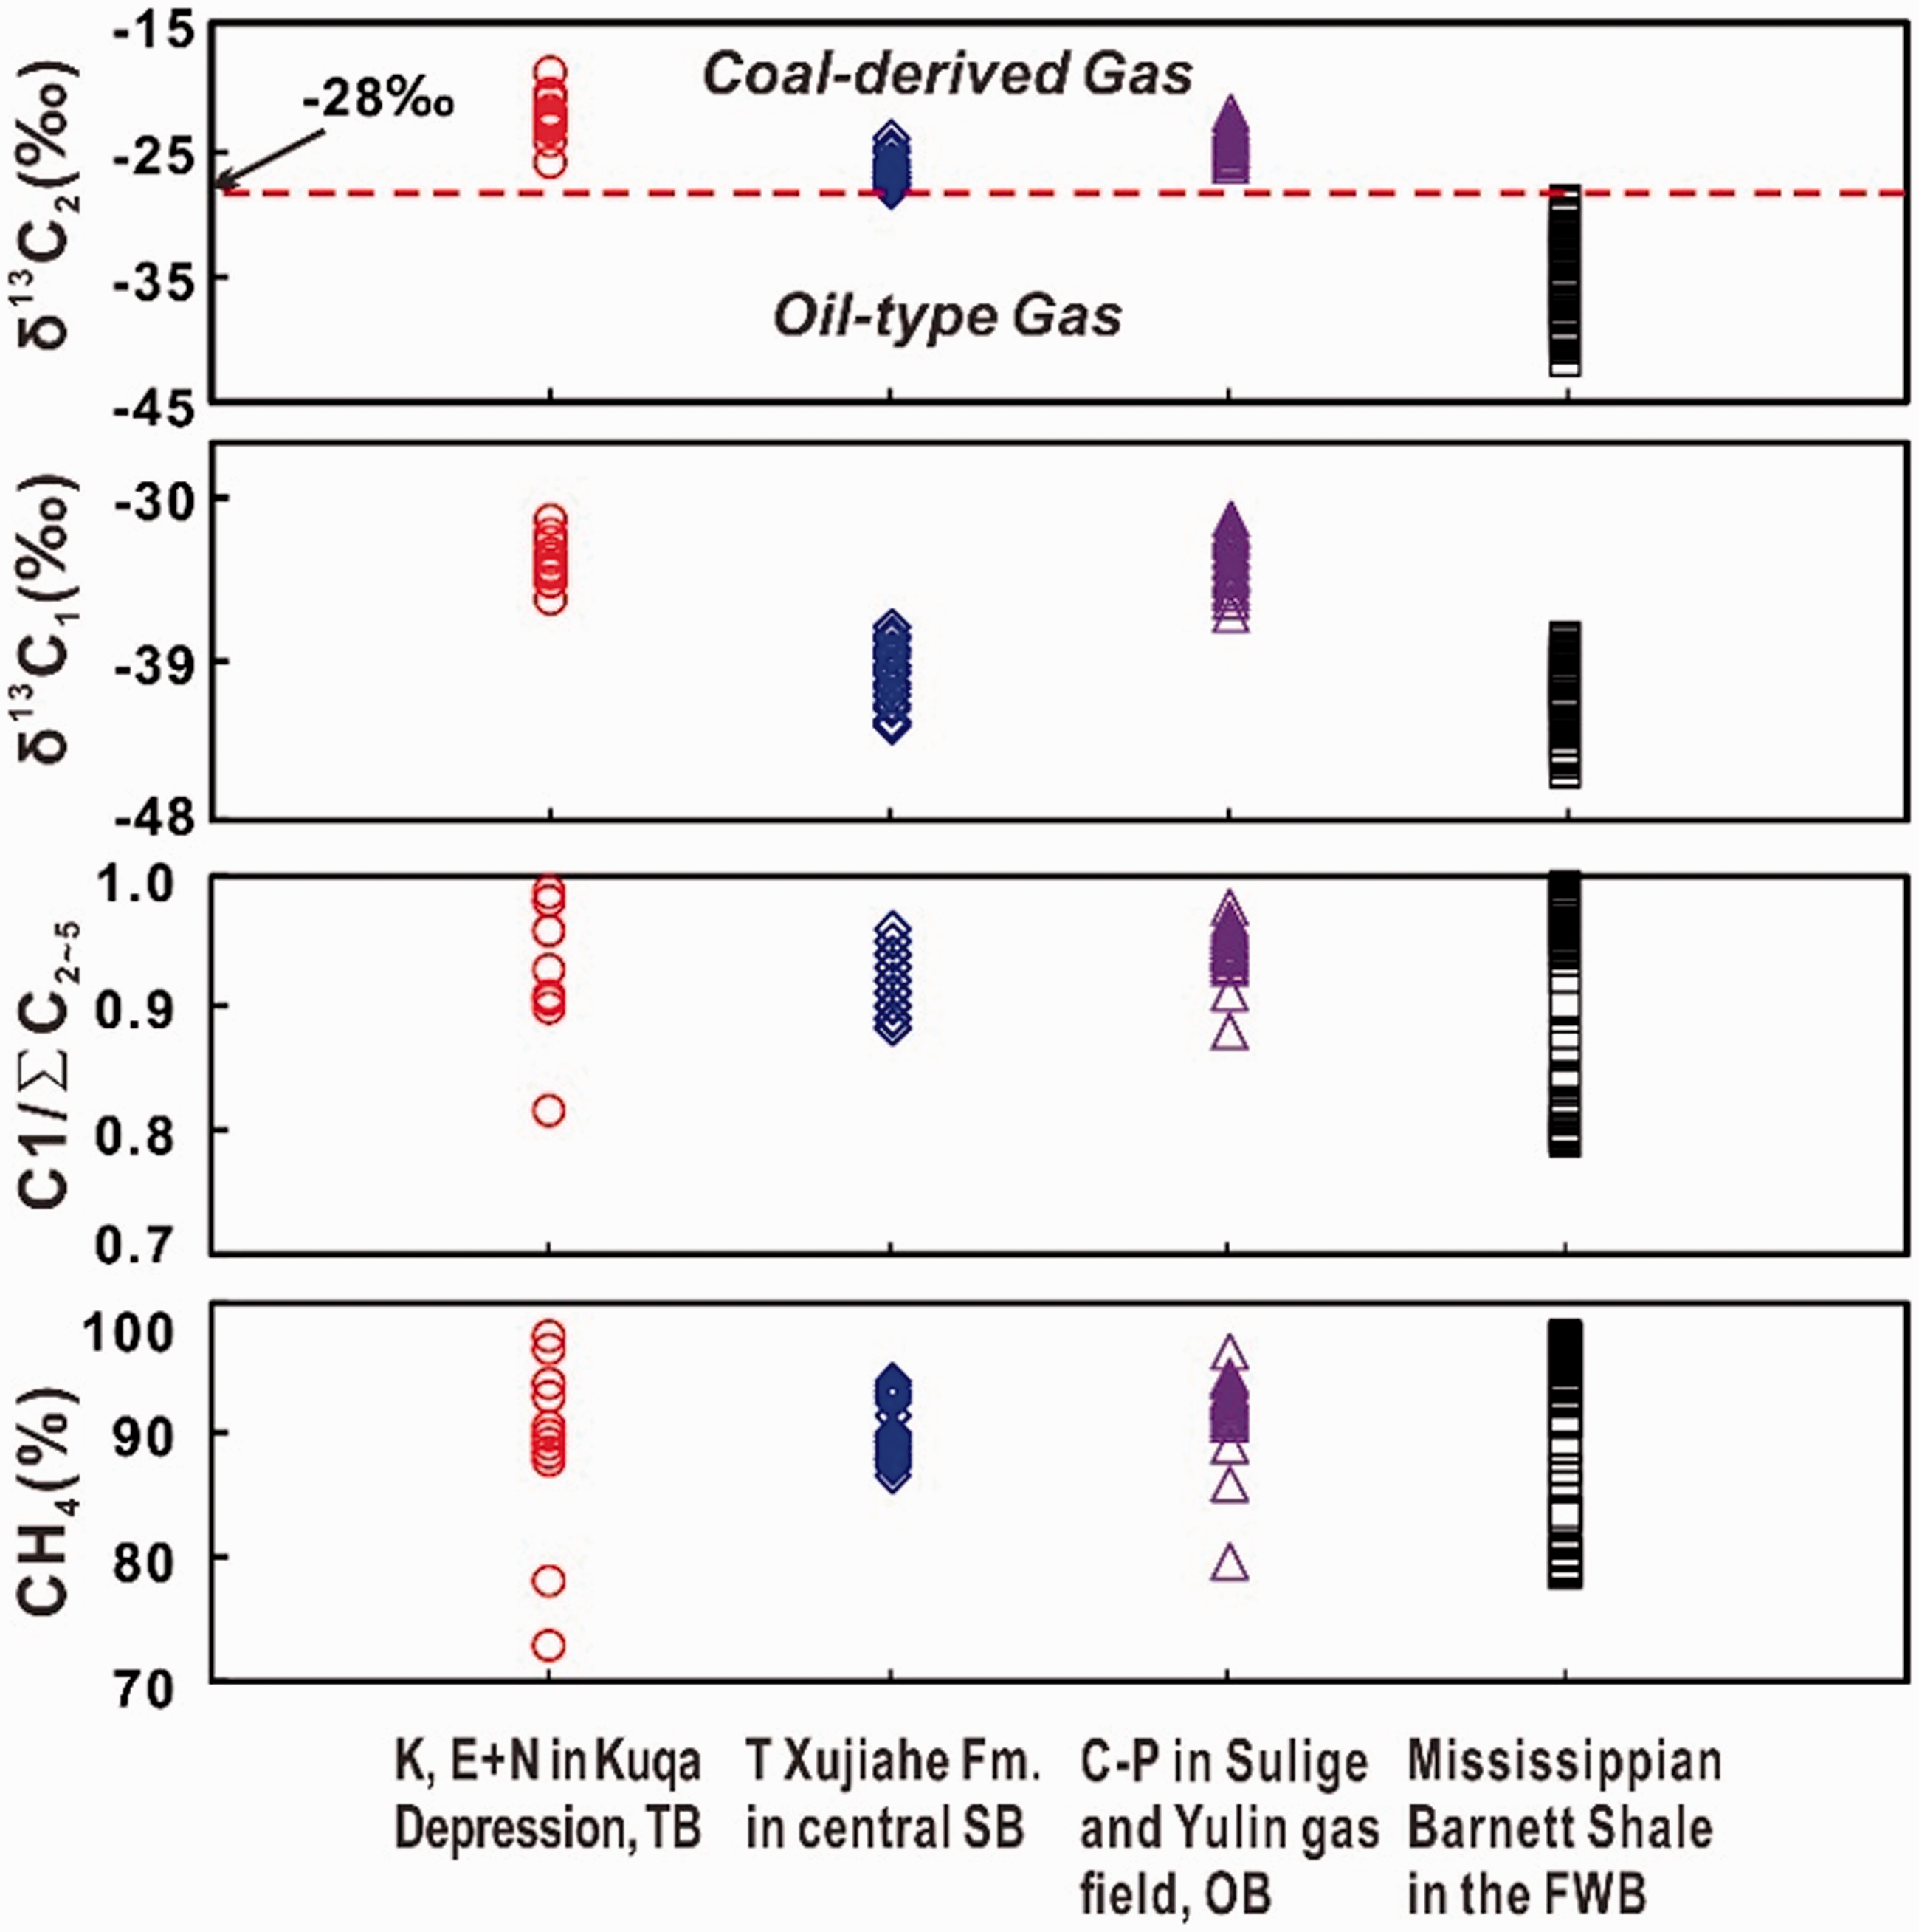
Chemical and isotopic compositions of the gases from Cretaceous and Tertiary in Kuqa Depression, Tarim Basin, Triassic Xujiahe Formation in central Sichuan Basin, Carboniferous–Permian in Sulige and Yulin gas field, Ordos Basin, China, and Barnett shale gases in Fort Worth Basin, the United States.
Methane stable carbon isotope ratios (δ13C1) for the gases from the four study areas (Cretaceous and Tertiary in Kuqa Depression, Tarim Basin, Triassic Xujiahe Formation in central Sichuan Basin, C–P in Sulige and Yulin gas field, Ordos Basin, China, and Mississippian Barnett Shale in the Fort Worth Basin, the United States) is –35.8‰ to –28.2‰, –42.7‰ to –37.2‰, –36.5‰ to –29.8‰, and –45.2‰ to –37.9‰, with the average value of –32.3‰, –39.9‰, –32.5‰, and –41.1‰, respectively. As a whole, stable carbon isotopic values of methane and ethane (δ13C2) of natural gases produced from Kuqa Depression, Tarim Basin, and Sulige and Yulin gas field, Ordos Basin are heaviest, whereas the values from Mississippian Barnett shale gases are lightest, and stable carbon isotopic values of natural gases produced from Triassic Xujiahe Formation in central Sichuan Basin are between the three other study areas (Figure 1, Table 1).
Genetic types of natural gas
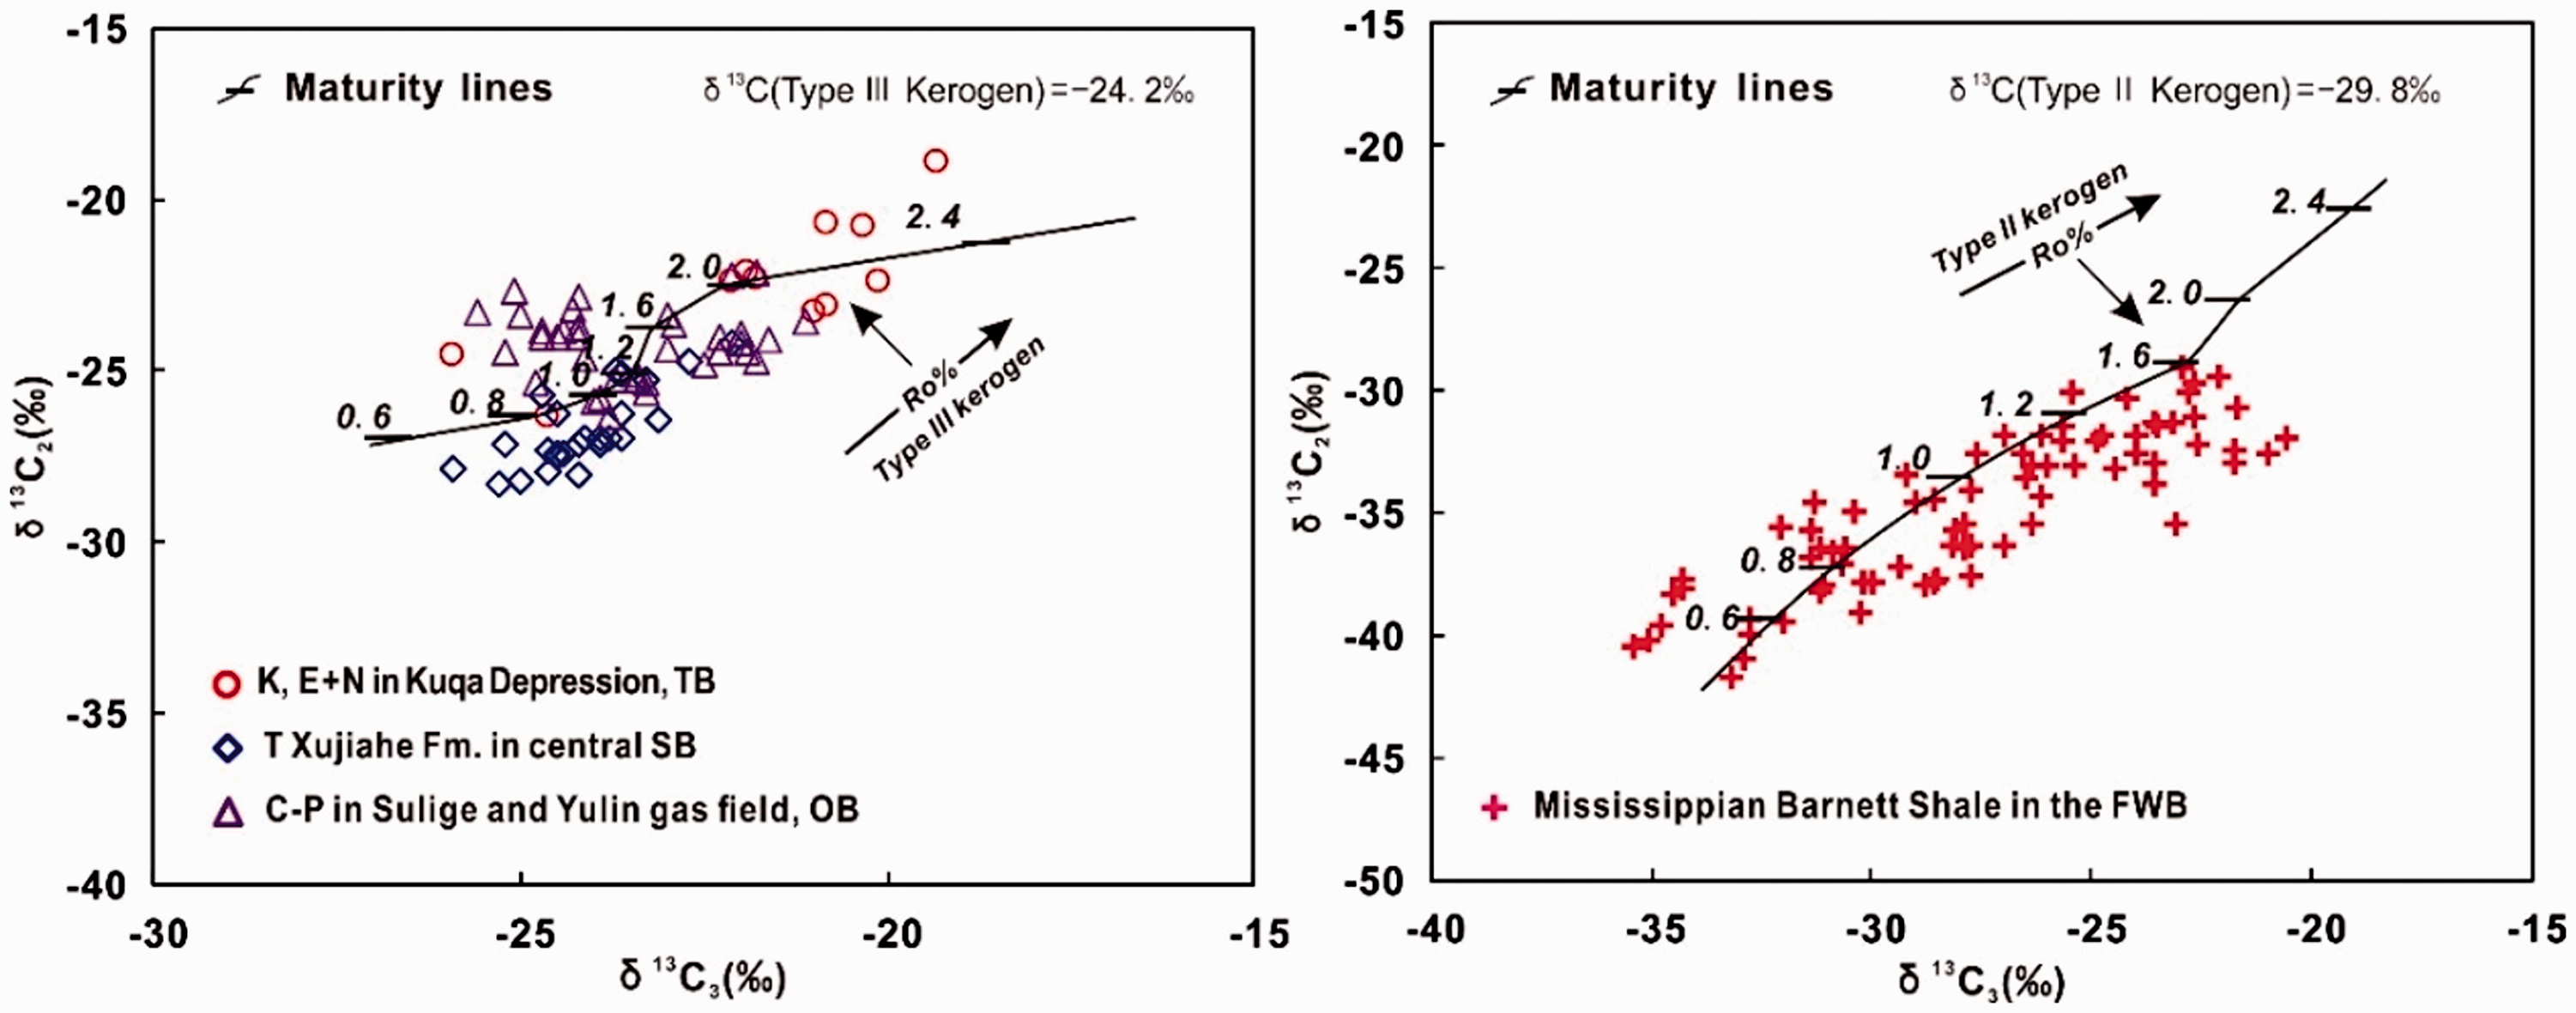
The chemical composition and stable carbon isotopic ratios of thermogenic natural gas are closely related to the sedimentary environment, kerogen type, and thermal evolution degree of the source rock, so they are widely used to determine the genetic type of natural gas and maturity of gas source rocks (Berner and Faber, 1996, 1988; Dai et al., 2016; Faber et al., 1988; Schoell, 1983; Stahl, 1977). Maturity has a significant effect on the δ13C1 relative to the δ13C2, whereas the δ13C2 may be predominantly controlled by their source rather than maturity (Dai et al., 2005b; Galimov, 2006). Therefore, the δ13C1 is usually used as a proxy to ascertain the maturity of gas source rocks, whereas the δ13C2 is the common and effective indicators to distinguish coal-derived from oil-type gas (Dai, 2018; Dai et al., 2005b; Galimov, 2006). Numerous empirical studies of gas geochemistry in sedimentary basins have suggested a cutoff point in the δ13C2 for differentiating the origin of thermogenic gases in these basins (Dai, 2018; Dai et al., 1992; Galimov, 2006; Gang et al., 1997). Generally, the δ13C2 less than –29.0‰ is oil-type gas generated from sapropelic kerogen (Galimov, 2006), while the value greater than –28.0‰ is coal-derived gas generated from humic kerogen (Dai, 2018; Dai et al., 1992; Gang et al., 1997). The gases from Cretaceous and Tertiary in Kuqa Depression, Tarim Basin, Triassic Xujiahe Formation in central Sichuan Basin, and C–P in Sulige and Yulin gas field, Ordos Basin are mainly coal-derived gases, while the gases produced from Mississippian Barnett Shale in the Fort Worth Basin are mainly oil-type gas based on the values of δ13C2 (Figure 1). However, a few gas samples produced from Triassic Xujiahe Formation in central Sichuan Basin are oil-type gases, and some shale gas samples produced from Fort Worth Basin are coal-derived gases. Dai et al. (1992) proposed a δ13C1–δ13C2–δ13C3 plot for discriminating coal-derived and oil-type gases. The consistent conclusion can be recognized on the Dai et al. (2014c) plot (Figure 2).
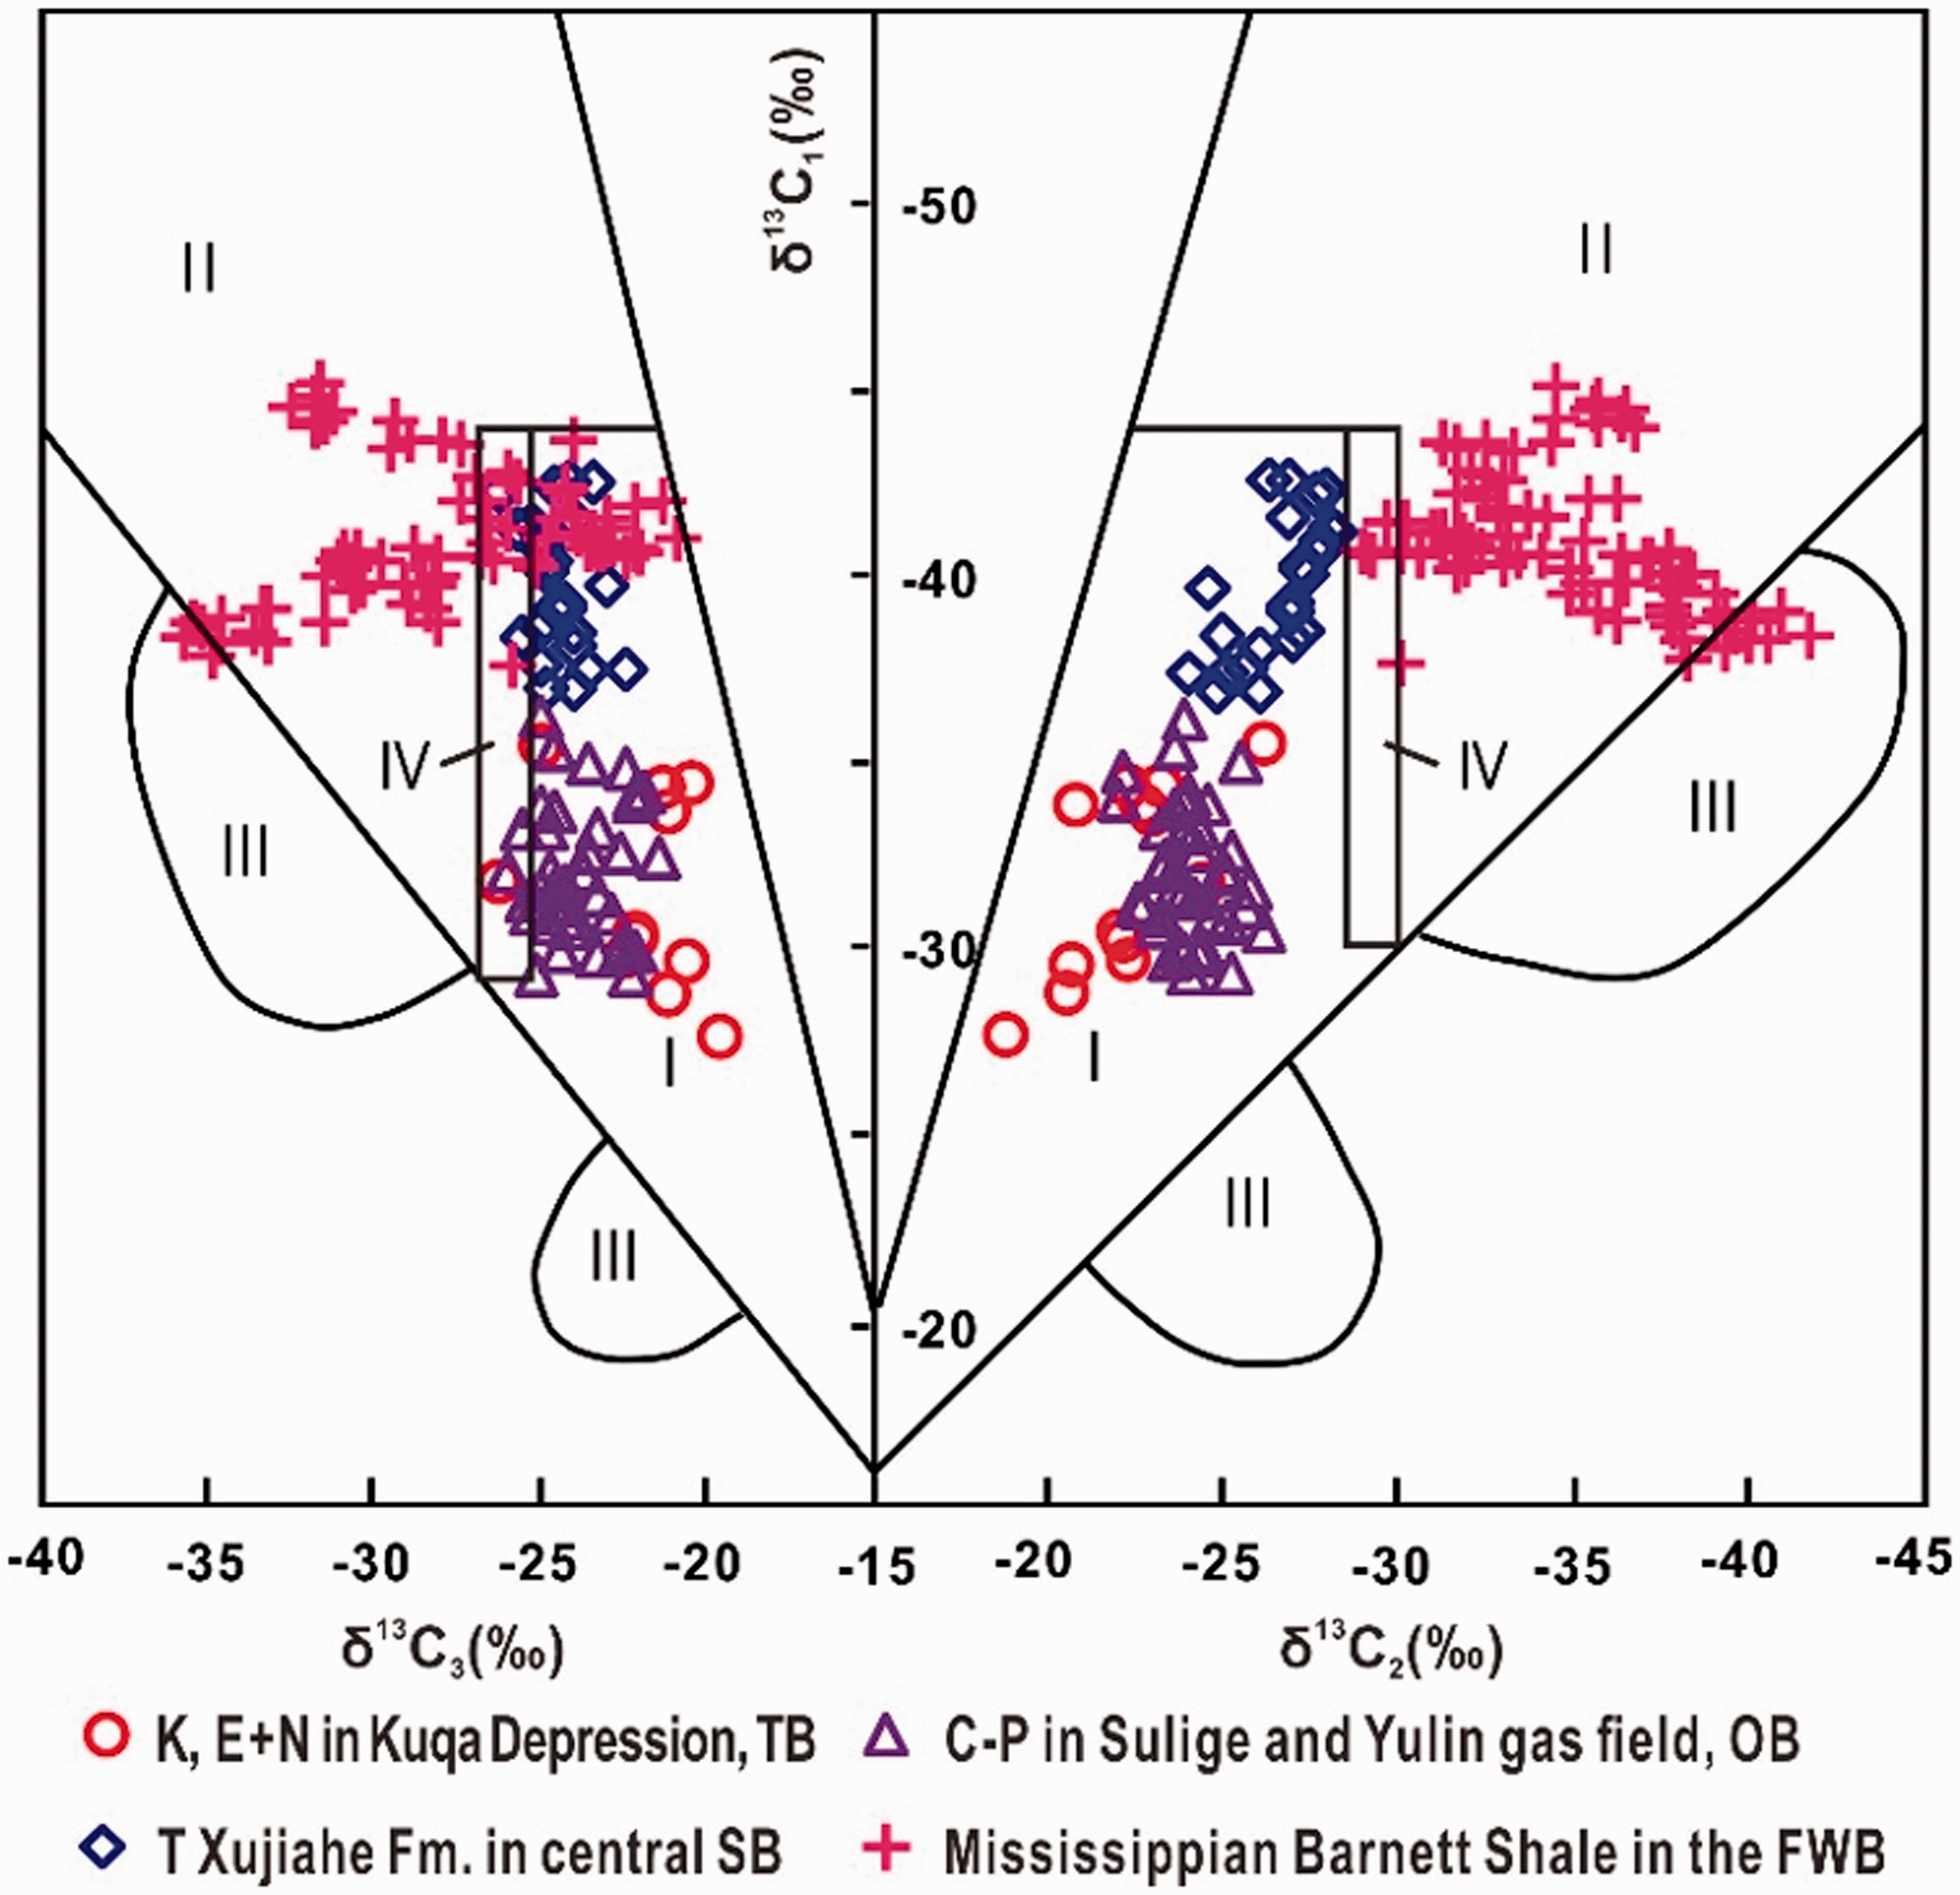
Plot of δ13C1–δ13C2–δ13C3 diagram for the gases from the four study areas analyzed, indicating genetic types of the gases.
The δ13C1 versus C1/C2+3 diagram can also identify gas types (Whiticar, 1999). The gases produced from the four study areas are all organic and thermogenic based on their Bernard parameters (C1/C2+3 = 4.56–116.92) and the δ13C1 ratios (–45.2‰ to –28.2‰) (Figure 3). The gases from Cretaceous and Tertiary in Kuqa Depression, Tarim Basin, Triassic Xujiahe Formation in central Sichuan Basin, and C–P in Sulige and Yulin gas field, Ordos Basin mainly distribute along the tendency of type III kerogen, suggesting that the gases are mainly humic sourced (Figure 3). Nevertheless, the gases produced from Mississippian Barnett Shale in the Fort Worth Basin are mainly sapropelic gases mixed with a few humic ones. The δ13C1 and C1/C2+3 values of gases from Triassic Xujiahe Formation in central Sichuan Basin distribute between types II and III kerogen tendency, indicating the gases are sourced from mixed sapropelic and humic gases. In addition, the maturities of their source rocks are systematically lower than that of three other areas (Figure 3). Oil-type gas will enrich 12C, while coal-derived gas will enrich 13C at the same maturity on account of stable carbon isotope inheritance effect of source rocks (Dai et al., 1992; Galimov, 2006). Stahl and Carey (1975) and Dai (1992) established the relationship between the δ13C1 of oil-type, coal-derived gas and Ro of source rock based on the chemical and isotopic compositions of natural gas from numerous basins as follows


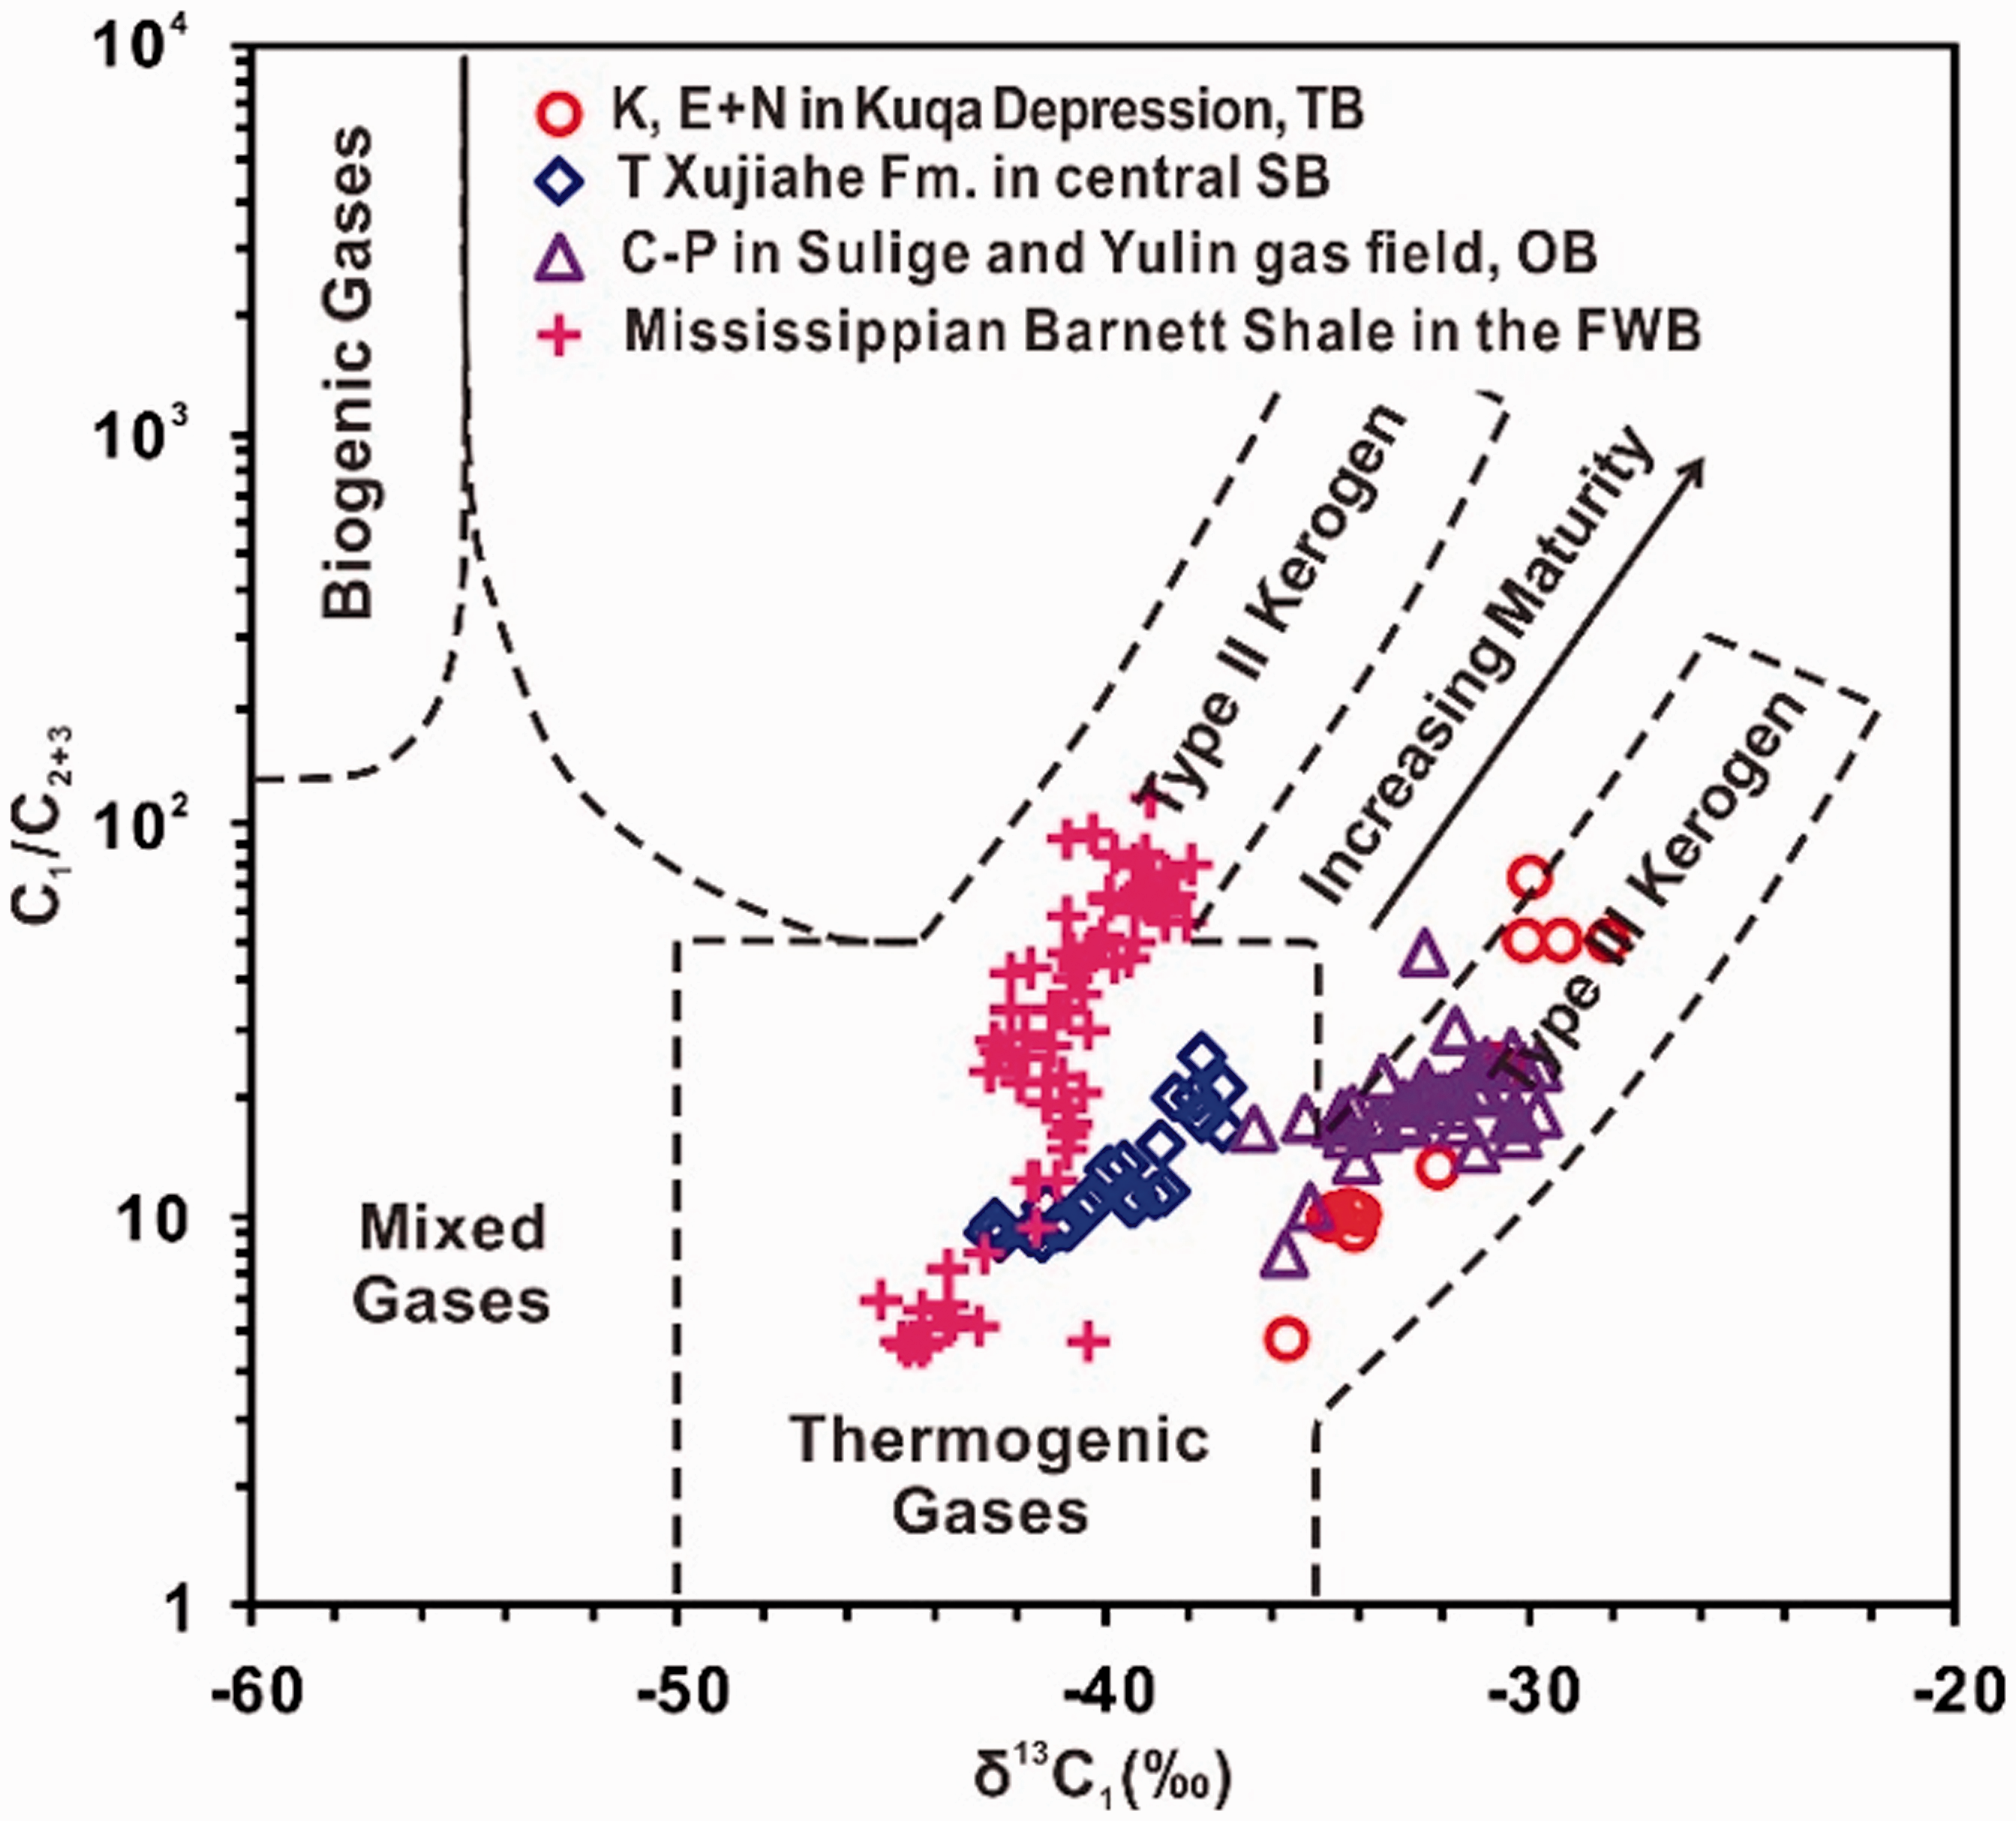
Plot of δ13C1–C1/C2+3 diagram for the gases from the four study areas analyzed, suggesting genetic types of the gases.
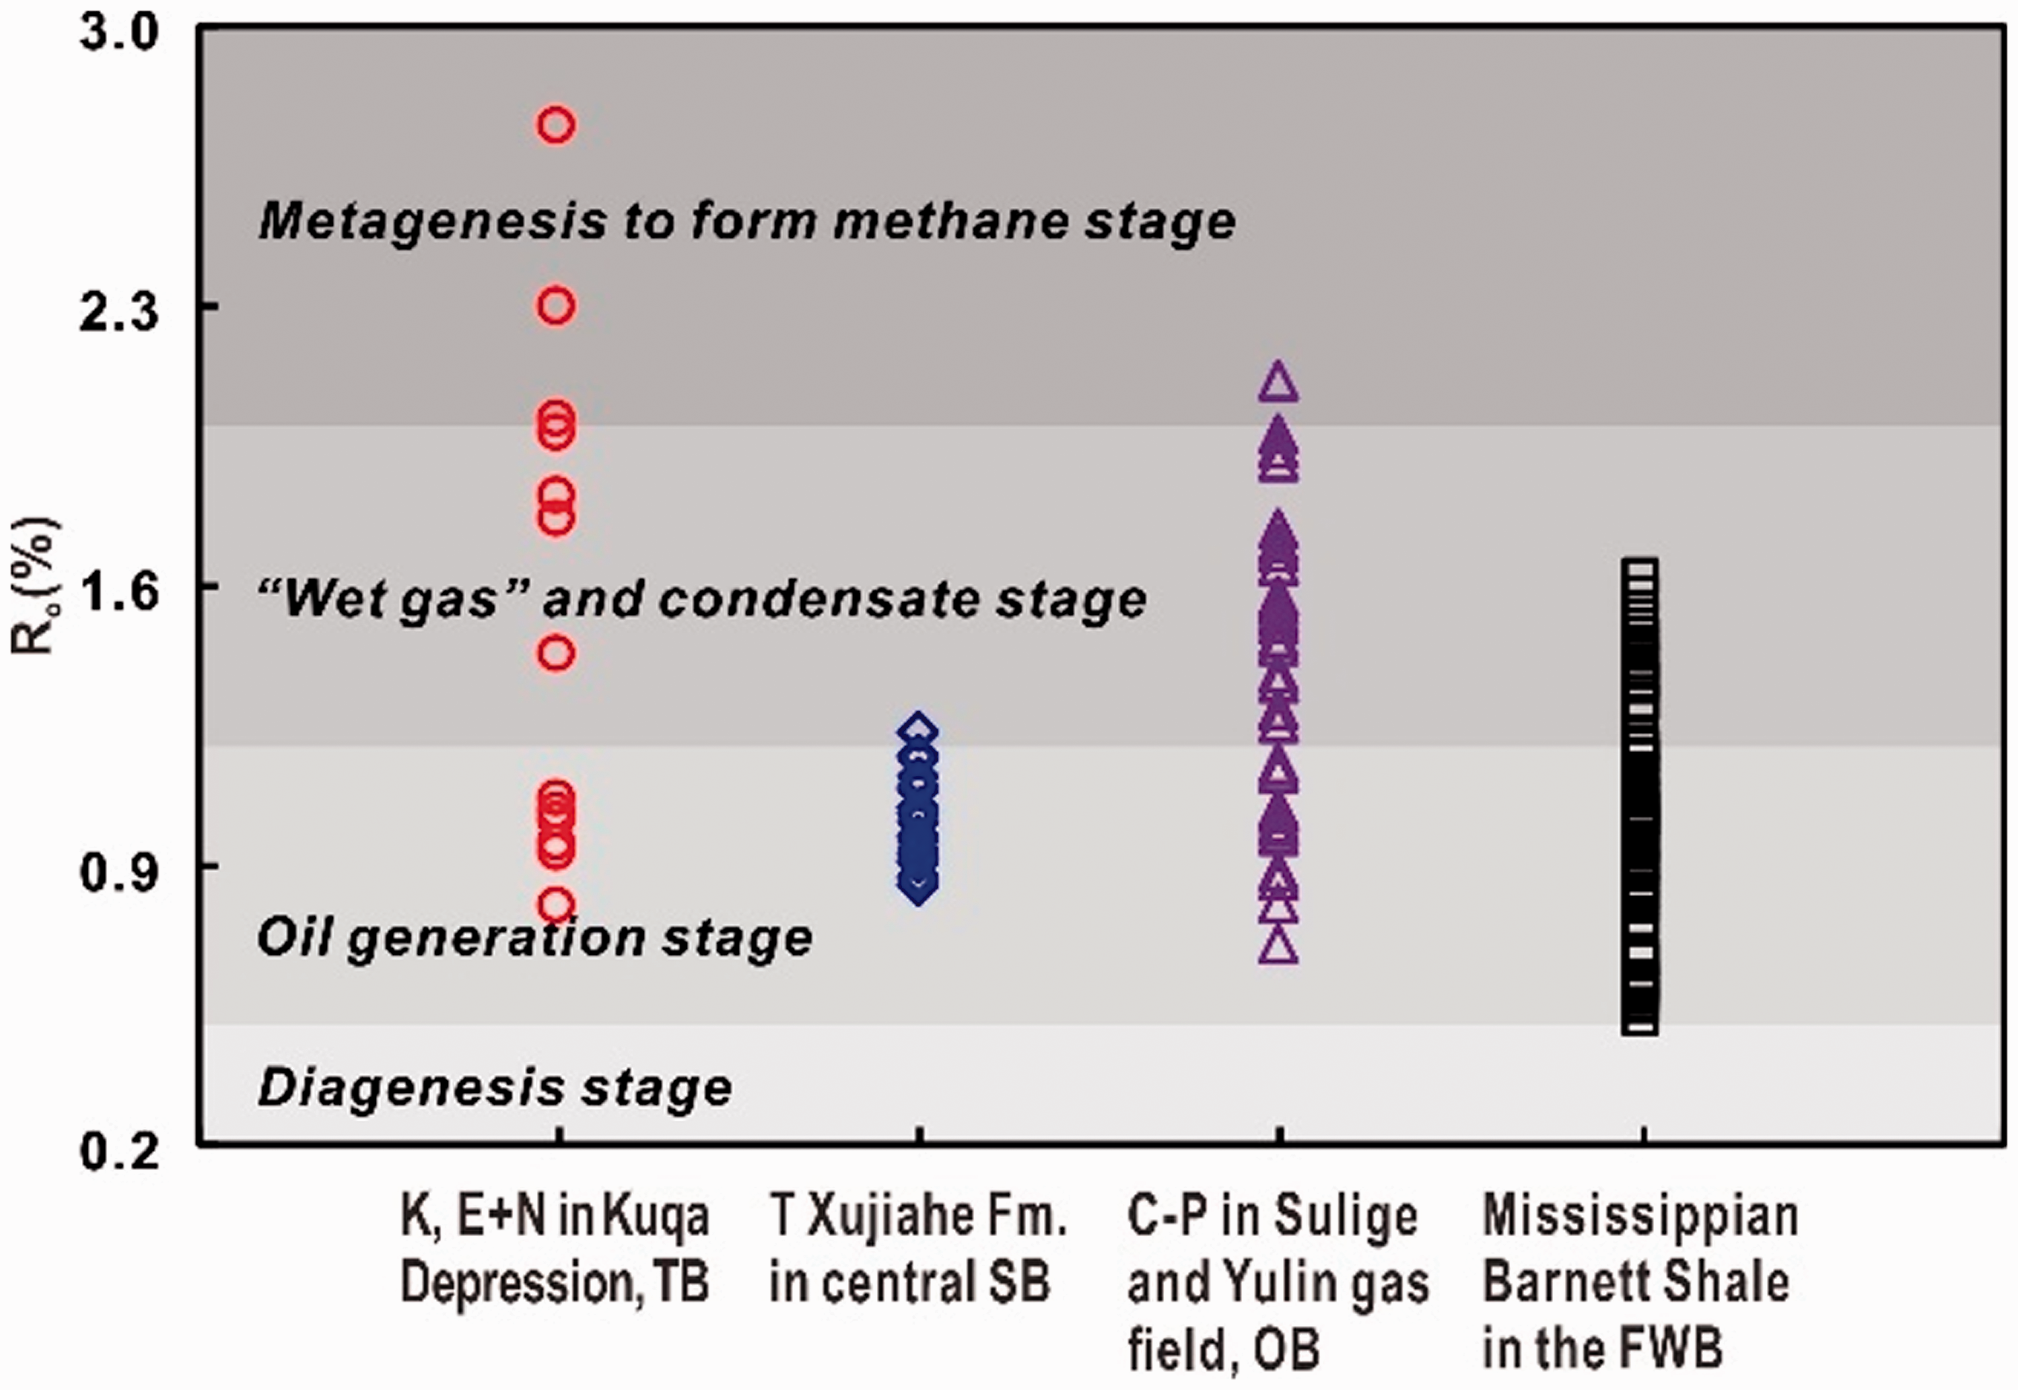
Based on the above calculation formulas, the Ro of source rocks from the four study areas (Cretaceous and Tertiary in Kuqa Depression, Tarim Basin, Triassic Xujiahe Formation in central Sichuan Basin, C–P in Sulige and Yulin gas field, Ordos Basin, China, and Mississippian Barnett Shale in the Fort Worth Basin) is 0.79%–2.47%, 0.86%–1.23%, 0.71%–2.11%, and 0.52%–1.62%, with the average value of 1.53%, 1.02%, 0.52%, and 1.02%, respectively (Table 1, Figure 4), which corresponds to the predicting maturity levels for the gas samples analyzed, based on calculation model proposed by Berner and Faber (1996) (Figure 5).
The Ro of gas source rocks from the four study areas.
Predicting maturity levels for the gas samples analyzed. Numbers on the lines of sapropelic and terrestrial indicate the maturity of the respective source rock. Initial isotope value of types II and III kerogen are taken the average value as –29.8‰ and –24.2‰, respectively.
Generally, the oil generation stage, “wet gas” and condensate stage, and metagenesis to form methane stage may mainly occur at the Ro value from 0.5% to 1.3%, 1.3% to 2.0%, and greater 2.0%, respectively (Tissot and Welte, 1984). The gas source rocks thermal maturity of the Cretaceous and Tertiary in Kuqa Depression, Tarim Basin and C–P in Sulige and Yulin gas field, Ordos Basin have a relatively wide distribution, ranging from oil generation to metagenesis to form methane stage, whereas the thermal evolution of the gas source rocks from Triassic Xujiahe Formation in central Sichuan Basin, C–P in Sulige and Yulin gas field, Ordos Basin, and Mississippian Barnett Shale in the Fort Worth Basin distribute mainly in the oil generation and condensate stages (Figures 4 and 5). Prinzhofer and Huc (1995) suggest that the primary cracking of kerogen is characterized by progressive increases in C1/C2 ratios and relatively constant C2/C3 ratios, whereas secondary cracking of hydrocarbons is characterized by significant increases in C2/C3 ratios and almost constant C1/C2 ratios (inset in Figure 6). As shown in Figure 6, the humic sourced (type III kerogen) gases from Cretaceous and Tertiary in Kuqa Depression, Tarim Basin and C–P in Sulige and Yulin gas field, Ordos Basin are mainly a mixture of primary kerogen cracking and liquid hydrocarbons secondary cracking gases. In addition, the gas samples from Triassic Xujiahe Formation in central Sichuan Basin and Mississippian Barnett Shale in the Fort Worth Basin distribute between the evolution lines types II and III kerogens (Figure 6). The reason may be some gas samples from two areas are mixture of oil-type and coal-derived gases (Figures 2 and 3). However, some difference exist in the gases from the two studies areas. The gases from Triassic Xujiahe Formation in central Sichuan Basin are mainly primary kerogen cracking gases, whereas gases from Mississippian Barnett Shale in the Fort Worth Basin are a mixture of primary kerogen cracking and hydrocarbons secondary cracking gas (Figure 6).
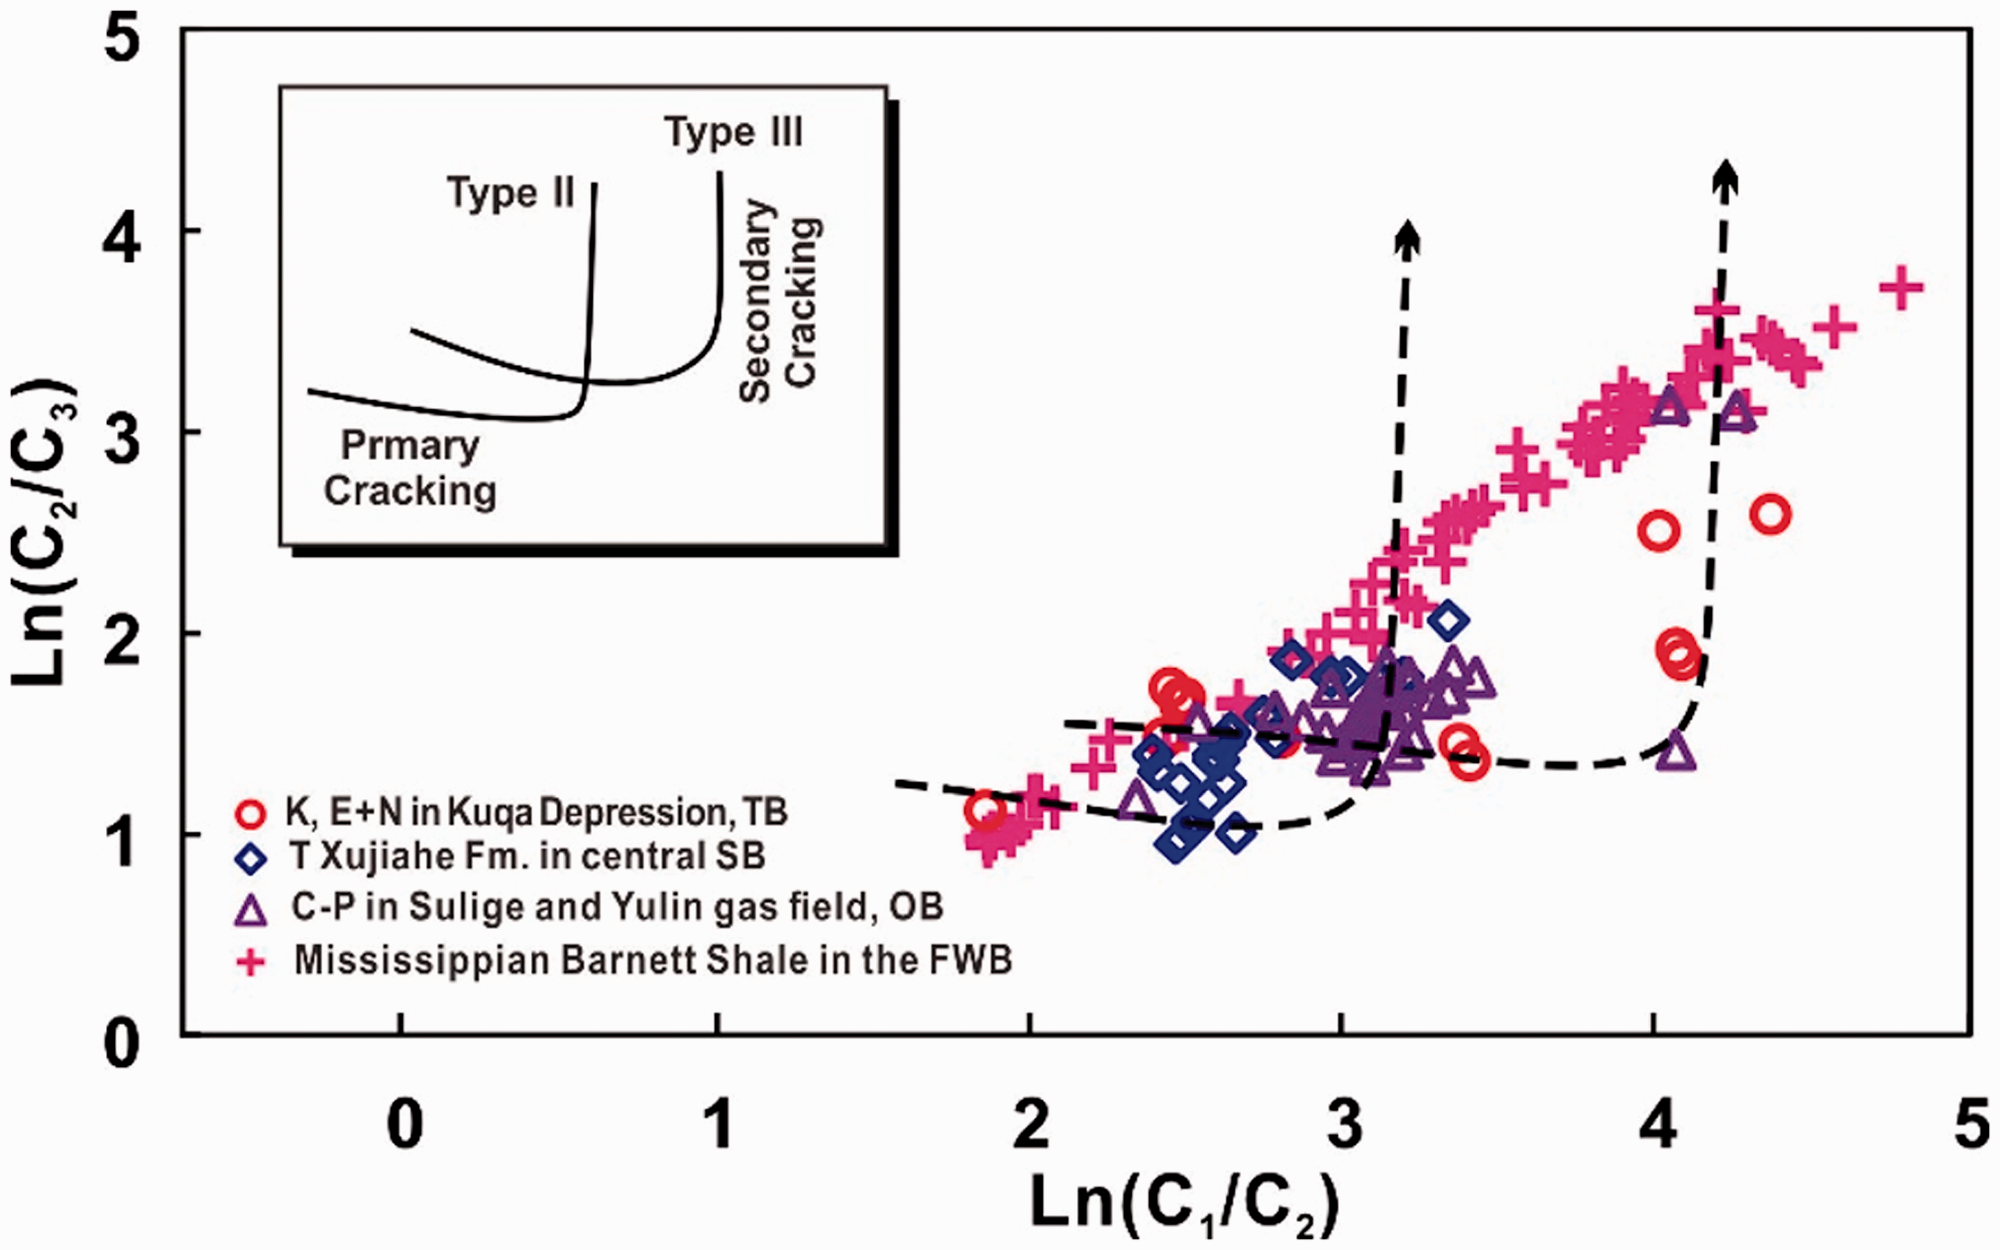
Molecular proportions C2/C3 versus C1/C2, in natural logarithmic scales, for gases from the four study areas.
The iC4/nC4 ratio characteristics of natural gas
The relationship between iC4/nC4 ratio and dryness of natural gas
Generally, for thermogenic natural gas, the dryness values will gradually increase with increasing maturity of their source rocks (Boreham and Edwards, 2008; Dai et al., 2016; Whiticar, 1999). As shown in Figure 7, the iC4/nC4 ratios initially increase relatively slowly with dryness, pass through a maximum around dryness = 0.94, and then decrease relatively quickly as dryness further increases both oil-type and coal-derived gas. At the same time, this phenomenon also implies that the iC4/nC4 ratios initially increase and then decrease with increasing maturity of their source rocks, except for the difference that the iC4/nC4 ratios decrease faster after reaching the maximum value compared with initial increasing stage, which may be caused by the different thermal evolution stages of source rocks experienced (discussed below).
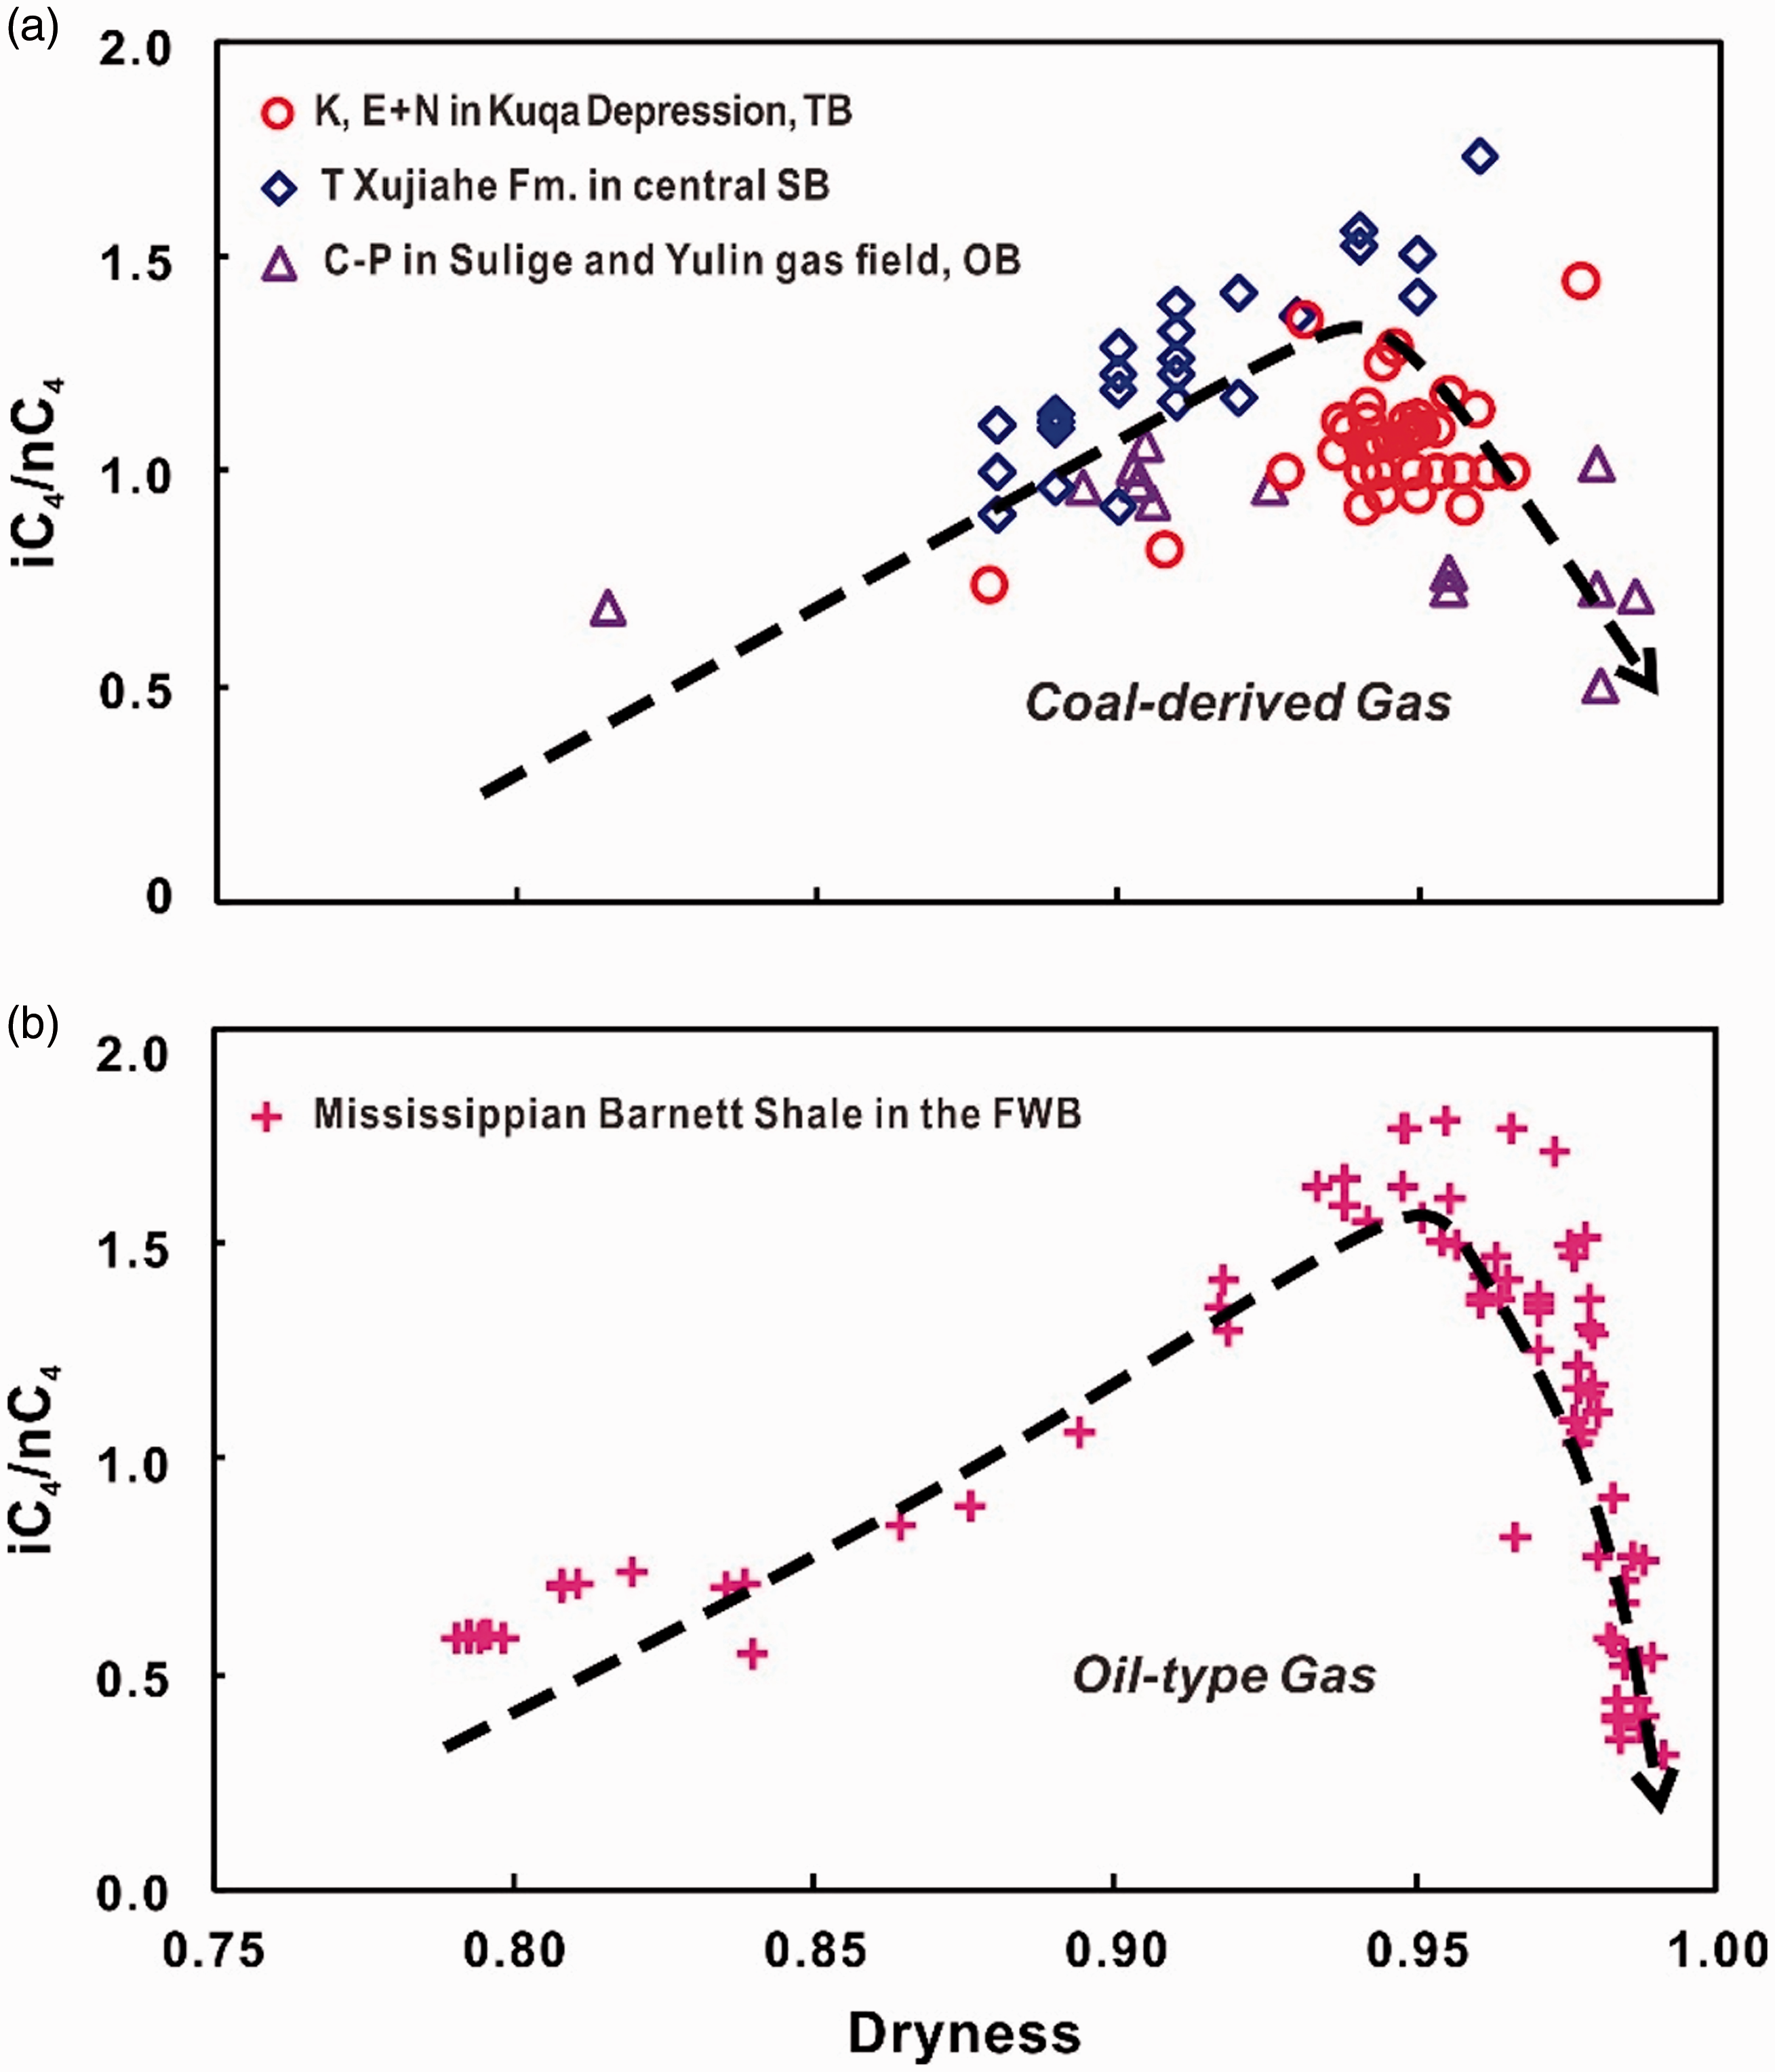
The relationship between iC4/nC4 ratios and dryness of coal-derived gases (a) and oil-type gases (b) from the four study areas.
The relationship between iC4/nC4 ratio and maturity of gas source rock
There is a good relationship between the iC4/nC4 ratios of gases and the maturity values of source rocks, both coal-derived and oil-type gases, by the fitting of the ratios and calculated Ro values. As shown in Figure 8, the iC4/nC4 ratios initially increase with increasing Ro, and then decrease as Ro further increases both oil-type and coal-derived gas. However, the corresponding Ro values are different when the iC4/nC4 ratios of two different types of gases reach their maximum values, which may be related to different types of kerogens (discussed below). As for coal-derived gas, the iC4/nC4 ratio passes through a maximum around Ro = 1.2%, and the mathematical relationship with Ro is as follows


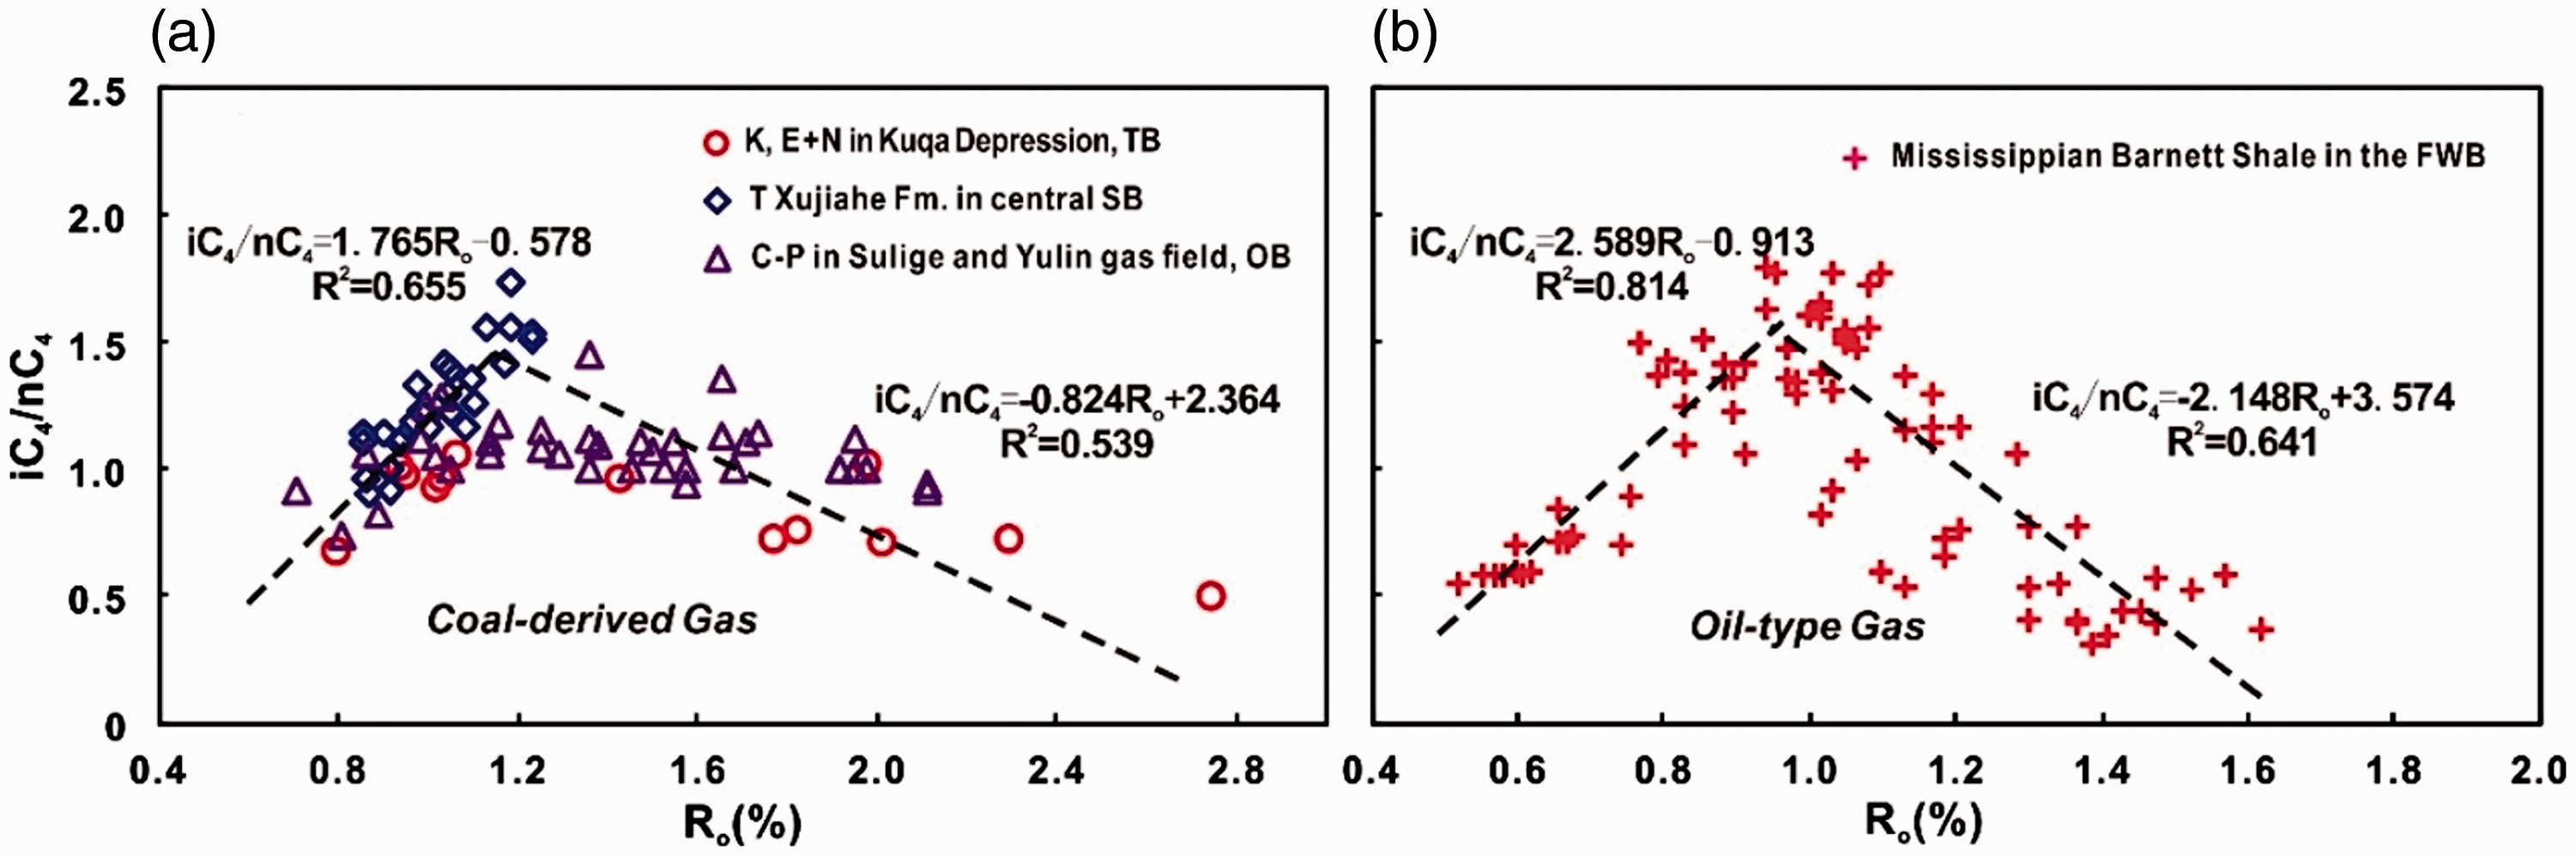
The relationship between iC4/nC4 ratios of coal-derived gases (a) and oil-type gases (b) and Ro of source rocks from the four study areas.
As for oil-type gas, the iC4/nC4 ratio passes through a maximum around Ro = 1.0%, and the mathematical relationship with Ro is as follows


In addition, the relationship between the iC4/nC4 ratios and Ro is more convergent at the iC4/nC4 ratios initially increasing stage. The data points become rather scattered as Ro increases, which may be a reflection of the fact that iC4 and nC4 at high-maturity degree have different precursors (kerogen, the NSO (nitrogen, sulfur, oxygen) compounds, C15+ saturates, C15+ aromatics, the C6∼14 fraction, etc) (Hao and Zou, 2013; Hill et al., 2003).
Discussion
Mechanism of iC4/nC4 ratio changing with the maturity of gas source rocks
The iC4/nC4 ratios initially increase with increasing dryness, pass through a maximum around dryness = 0.94, and then decrease as dryness further increases both oil-type and coal-derived gas. That is to say, the iC4/nC4 ratio gradually increases with increasing Ro when the gas source rocks at relatively lower maturity, and only begins to decrease when the gas pool is close to a dry gas reservoir. Such a high dryness seems to mean that the iC4/nC4 ratios of natural gases begin to decrease only when the gas source rocks reach the metagenesis to form methane stage (Ro > 2.0%), which seems to be inconsistent with the maximum iC4/nC4 ratio around Ro = 1.0% or 1.2% (Figure 8). In fact, for thermally formed natural gas, the dry gas reservoir does not necessarily indicate the gas source rock has reached the metagenesis to form methane stage. Dai et al. (2016) discovered that the wetness of natural gas decreases with the maturity of source rock based on 49 coal-derived gas samples from the Ordos, Sichuan, Bohai Bay, Qiongdongnan, Junggar, and Turpan-Hami Basins in China with integral molecular series. The relationship between wetness and maturity of coal-generated gas in China can be concluded as follows

When the dryness is 94% (that is, the wetness is 6%), the calculated Ro of gas source rock is 1.18% based on the relationship between wetness and maturity of coal-derived gas (equation (7)), indicating the gas source rocks just reach the late oil generation stage or the early “wet gas” and condensate stages. This is consistent with the Ro ≈ 1.2% when iC4/nC4 ratios of coal-derived gas reach the maximum in this paper. Therefore, what can be illustrated is that during the “wet gas” and condensate stage of gas source rocks, the iC4/nC4 ratios of natural gases begin to decrease with the increasing Ro.
The corresponding Ro value is different when the iC4/nC4 ratios of two different types of gases reach their maximum values, which may be on account of different types of kerogens. Primary cracking of kerogen and secondary cracking of oil are dynamic processes (Hao and Zou, 2013; Hill et al., 2003). The hydrocarbon generation model of source rock emphasizes that kerogen form liquid oil and gas by thermal degradation at lower maturity, and then liquid hydrocarbon cracking generates the gas at higher maturity (Tissot and Welte, 1984). Previous studies have summarized the changes of liquid hydrocarbons generated by different kerogen types with increasing maturity by hydrous pyrolysis simulation and comparing the maturity parameters and composition characteristics of different kerogen types (Law, 1999; Mao et al., 2012; Qi et al., 2017). As for types II and III kerogen, the liquid hydrocarbons begin to form wet gases by thermal cracking when the Ro is about 1.0% and 1.2%, respectively (Law, 1999; Mao et al., 2012; Qi et al., 2017; Tissot and Welte, 1984). The iC4/nC4 ratios of gases, mainly produced by type II kerogens from Mississippian Barnett Shale in the Fort Worth Basin, change from increase to decrease gradually when the Ro is about 1.0% (that is, the timing of the liquid hydrocarbon begins to form wet gas for type II kerogen) (Figure 8). In addition, the iC4/nC4 ratios of gases, mainly produced by type III kerogens from Cretaceous and Tertiary in Kuqa Depression, Tarim Basin, Triassic Xujiahe Formation in central Sichuan Basin, and C–P in Sulige and Yulin gas field, Ordos Basin, reach exactly the inflection point when the Ro is about 1.2% (that is, the timing of the liquid hydrocarbon begins to form wet gas for type III kerogen). Therefore, diverse types of kerogen may be responsible for the different corresponding Ro values when the iC4/nC4 ratios of gases reach their maximum values. Moreover, it also indicates that the iC4/nC4 ratios initially increase during the stage of primary cracking of kerogen, and then decrease during the stage of secondary cracking of liquid hydrocarbons.
The C2–5 fraction precursors include C15+ saturates, C15+ aromatics (including alkyl aromatics), the C6–14 fraction and perhaps the NSO compounds based on the accumulation of C2–5 during C15+ cracking and C6–14 cracking (Hill et al., 2003). As far as the formation process of nC4 and iC4 is concerned, nC4 were formed through free radical reactions, whereas the branched iC4 arose from the free radical cracking of branched fragments of kerogen and bitumens, and/or carbonium ion reaction of α-olefins with protons which were enhanced in acidic conditions (Almon and Johns, 1977; Eisma and Jurg, 1969; Kissin, 1987, Pan et al., 2006). That is, iC4/nC4 ratio is controlled by the kerogen nature (relative content of straight chain fragments to branched fragments) and the result of competition between free radical reaction of n-alkenes to form nC4 and the carbonium ion reaction of n-alkenes with protons to form iC4 (Hao and Zou, 2013; Pan et al., 2006). Therefore, as for the same type of natural gas (coal-derived gas or oil-type gas), iC4/nC4 ratio is mainly controlled by the latter. Free radical reactions to form n-alkenes is dominated during the thermal cracking of crude oil (Hao and Zou, 2013), which means that the initial increase in iC4/nC4 ratio with increasing Ro is related to kerogen cracking. In addition, the increases in iC4/nC4 ratio may result from two factors: (1) iC4 is generated at a higher rate than nC4 or (2) iC4 is cracked at a lower rate than nC4 (Hao and Zou, 2013; Hill et al., 2003; Pan et al., 2006). According to their molecular structures and chemical properties, the carbon and hydrogen content of the isomers are the same; however, iC4 has a more active tertiary carbon, whereas nC4 has only primary and secondary carbon with relatively weak chemical properties, so the nC4 is less stable than iC4 (He et al., 2015; Hill et al., 2003). In addition, the carbon–carbon bond breaking is dominated when the nC4 and the iC4 molecule are subjected to thermal cracking. The energy required for the breaking of carbon–carbon bond in the former (383 kJ/mol) is larger than the latter (355 kJ/mol) (Hao et al., 2013), indicating iC4 is more prone to pyrolysis than nC4. Therefore, the initial increase in iC4/nC4 ratios with increasing Ro is the reason that iC4 is generated at a higher rate during kerogen cracking. Similarly, the terminal decreases in iC4/nC4 ratios also may result from two factors: (1) nC4 is generated at a higher rate or (2) iC4 is cracked at a higher rate. Free radical reactions to form nC4, dominated during the thermal cracking of crude oil (Hao and Zou, 2013), may cause a higher nC4 generation rate. Moreover, iC4 is cracked at a higher rate during the wet gas cracking because iC4 is more prone to pyrolysis than nC4. Therefore, the superposition effect of these two aspects may result in the terminal faster decreases in iC4/nC4 ratios with further increasing dryness (Figure 7).
In a word, the evolution of the iC4/nC4 ratios in gases has two stages, that is, iC4/nC4 ratio initially increases and then decreases with increasing Ro both coal-type gas and oil-type gas. The initial increase iC4/nC4 ratios with increasing Ro is the reason that iC4 is generated at a higher rate by carbonium ion reaction of α-olefins with protons during primary cracking of kerogen at lower maturity, whereas free radical reactions to form nC4 during the thermal cracking of crude oil at higher maturity, and iC4 is cracked at a higher rate during the wet gas cracking stage may results in the terminal decreases in iC4/nC4 ratio.
The causes of controversial views about the evolution of the iC4/nC4 ratios
In previous studies, two conflicting conclusions existed, which were: (a) the iC4/nC4 ratio in natural gas increases with increasing maturity (Qin et al., 2019) and (b) decreases with increasing maturity (Gao et al., 1998; He et al., 2015; Héroux et al., 1979;Wang et al., 2017; Xie et al., 2017). In this paper, the correlations between iC4/nC4 ratios and corresponding maturity data of gas source rocks in these studies are reanalyzed (Figure 9). Qin et al. (2019) selected coal-derived gases from Xujiahe Formation in central Sichuan Basin to reveal the relationship between the iC4/nC4 ratios and the maturity values of source rocks. The gases were generated from the source rocks at the thermal evolution stages of oil generation and “wet gas” stage (Ro = 0.86%–1.23%), so it is concluded that the iC4/nC4 ratio is positively correlated with increasing Ro (the solid line in Figure 9(a)). However, it is not difficult to find that the iC4/nC4 ratios have a decreasing tendency around Ro = 1.2%. If there were some gas samples produced by source rocks at higher maturity, the decreasing tendency of the iC4/nC4 ratios may be revealed (the dotted line in Figure 9(a)). On the contrary, He et al. (2015) selected coal-derived gases from Cretaceous and Tertiary in Kuqa Depression, Tarim Basin to analyze the relationship between the iC4/nC4 ratios and Ro of gas source rocks. The gases were generated from the source rock at the thermal evolution stages of “wet gas” and metagenesis to form methane stage (Ro = 1.33%–2.50%) (Figure 9(b)), so it is concluded that the iC4/nC4 ratio is negatively correlated with increasing Ro. In addition, Gao et al. (1998) attempted to reveal the evolution characteristics of gaseous products of mature humic coal (Ro is about 0.9%) by hydrous pyrolysis. The calculated Ro using the simulation temperatures by Easy%Ro model (Burnham and Sweeney, 1989) in the simulation experiment is 1.07%, 1.28%, 1.36%, and 1.66%, respectively. The results show that the iC4/nC4 ratios of gases generated by coal decrease with increasing Ro (the solid line in Figure 9(c)). Selected mature humic coal samples and a few simulation temperature points may be responsible for the lopsided conclusion. If low-maturity samples are selected and different simulation temperature points are added, the whole evolution of the iC4/nC4 ratios—“increase initially and then decrease”—may be revealed (the dotted line in Figure 9(c)). Therefore, the gases at narrow evolution stages of the iC4/nC4 ratios selected by previous scholars may be responsible for the controversial views.
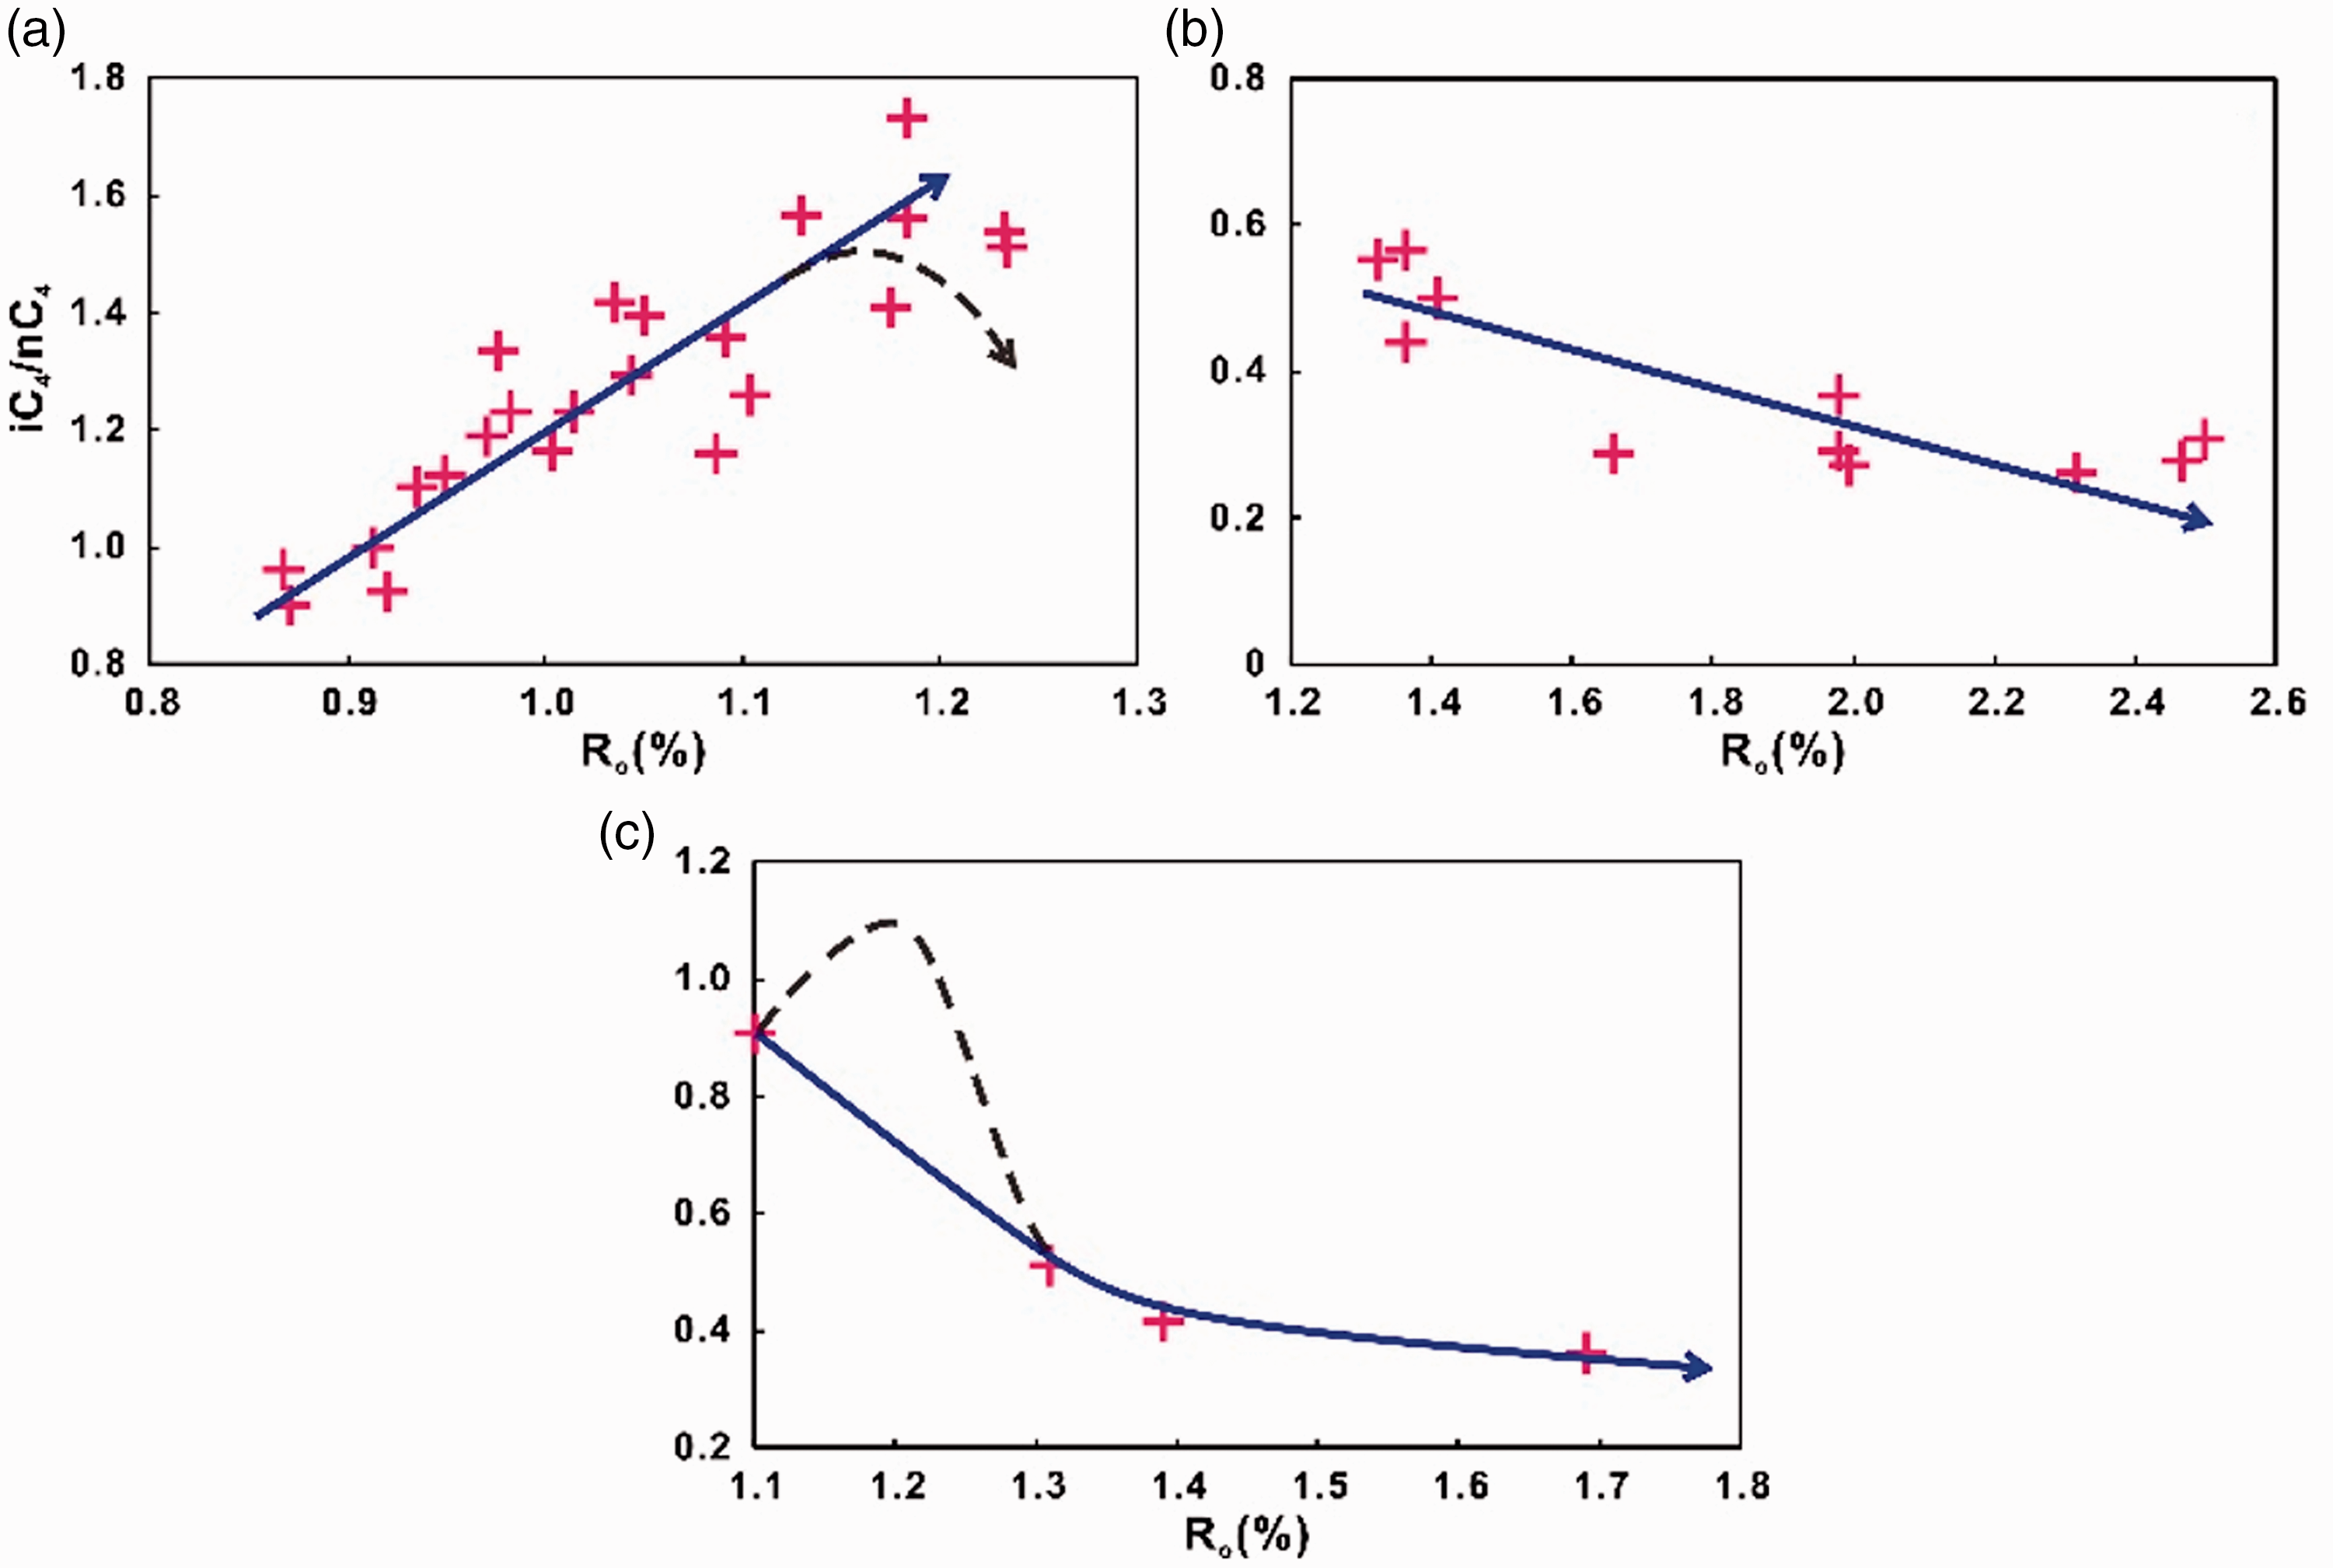
The relationship between iC4/nC4 ratios of gases and Ro of source rocks. The iC4/nC4 ratio increases with the Ro (a) and (b), and decreases with the Ro (c).
Chemical composition analysis of natural gas is usually the primary procedure of natural gas analysis, and is also a basic and important analysis project that can be implemented in the oil and gas field (Dai et al., 2016). The study of the iC4/nC4 ratios may be a potentially significant and effective approach to deepen natural gas research. The maturity of gas source rock can be obtained quickly based on the model using the iC4/nC4 ratios combined with other component information (such as dryness, wetness, etc.), which is of great significance to the characterization of natural gas maturity and gas source rock correlation. Of course, several aspects should be cautious when the method is applied in a gas reservoir/field. Previous studies have shown that the iC4/nC4 ratio in natural gas is also influenced by several factors such as the type of source rock, obvious migration fractionation, biodegradation or oxidation in addition to maturity of source rock (Boreham and Edwards, 2008; He et al., 2015; Katz et al., 2002; Miao et al., 2011; Pan et al., 2006; Qin et al., 2019; Wang et al., 2017; Wood and Sanei, 2016). Therefore, it may get more deviation and even wrong results using this method to estimate the maturity of natural gas when the gas reservoir suffers from one or more of the above secondary processes. So, before estimating natural gas maturity, it is very important to analyze the geological and geochemical background of the study area to avoid the influence of secondary processes. In addition, it should be pointed out that the maturity of the natural gas in this paper is mainly calculated by the empirical model, which is established based on the relationship between the δ13C1 of oil-type, coal-derived gas and Ro of source rock and the geological characteristics of the gas fields (Dai, 1992; Stahl and Carey, 1975). The empirical models, including other established models (Liu and Xu, 1999; Schoell, 1983; Shen et al., 1991), have already been widely applied in natural gas maturity estimation, and they are still the common research methods on natural gas research at present. However, there is no denying that these models have inherent limitations (Prinzhofer et al., 2001; Shuai et al., 2003): (1) only applicable to local basins and (2) not considering the influences of various secondary processes. Therefore, it should be pointed out that the mathematical model for estimating natural gas maturity using the iC4/nC4 ratio in this study is also only applicable to local basins, i.e. not applicable to all gas reservoirs in any basin. If the analyzed gas reservoirs meet the following two conditions: (1) no obvious secondary process and (2) a relatively clear relationship between δ13C1 and Ro of source rocks, then, the relationship between iC4/nC4 ratio and the Ro can be established relatively accurately to estimate natural gas maturity. In any case, this study provides a method for estimating maturity using natural gas components, which may be a potentially significant and effective approach to deepen natural gas research. Clearly, more work is called for in elucidating the relationship of iC4/nC4 ratios and maturity of gas source rocks to provide a quick and effective method to estimate the maturity of natural gas.
Conclusions
The iC4/nC4 ratios initially increase with increasing Ro of gas source rocks, and then decrease as Ro further increases both oil-type and coal-derived gas. Diverse types of kerogen may be responsible for the different corresponding Ro values when the iC4/nC4 ratios of gases reach their maximum values. The initial increase in iC4/nC4 ratios with increasing Ro is the reason that iC4 is mainly generated at a higher rate by carbonium ion reaction of α-olefins with protons during kerogen cracking, whereas free radical reactions to form nC4 relatively quickly during the thermal cracking of crude oil at higher maturity and iC4 is cracked at a higher rate during the wet gas cracking stage may result in the terminal decreases in is iC4/nC4 ratios. The mathematical models of iC4/nC4 ratios of different types of natural gas and maturity are established. The maturity of gas source rock can be obtained quickly based on the model using the iC4/nC4 ratio combined with other component information (such as dryness, wetness, etc.), which is of great significance to the characterization of natural gas maturity and gas source rock correlation.
Supplemental Material
EEA880648 Supplemental Material - Supplemental material for Significance and evolution characteristics of the isobutane/n-butane ratio of natural gas
Supplemental material, EEA880648 Supplemental Material for Significance and evolution characteristics of the isobutane/n-butane ratio of natural gas by Nian Liu, Nansheng Qiu, Zhenming Li, Chuan Cai, Xinjie Shan, Ting Gao and Yuanjie Wang in Energy Exploration & Exploitation
Footnotes
Acknowledgements
We are grateful to collaboration and enthusiastic support from Jianzhang Tian and Jin Ming in the Huabei Research Institute of Petroleum Exploration and Exploitation and Zhili Zhu, Xinjian Zhu, and Shengbao Shi at the China University of Petroleum, Beijing.
Declaration of conflicting interests
The author(s) declared no potential conflicts of interest with respect to the research, authorship, and/or publication of this article.
Funding
The author(s) disclosed receipt of the following financial support for the research, authorship, and/or publication of this article: The authors gratefully acknowledge the supports from the National Major Science and Technology Projects of China (2017ZX05008-006–002-005) and the PetroChina Key Project (HBYT-YJY-2018-JS-177).
Supplemental Material
Supplemental material is available for this article online.
References
Supplementary Material
Please find the following supplemental material available below.
For Open Access articles published under a Creative Commons License, all supplemental material carries the same license as the article it is associated with.
For non-Open Access articles published, all supplemental material carries a non-exclusive license, and permission requests for re-use of supplemental material or any part of supplemental material shall be sent directly to the copyright owner as specified in the copyright notice associated with the article.