
Abstract
The gas adsorption of shale is one of the most important factors influencing shale gas accumulation and production. Different from other shale gas fields, the shale in Northwestern Hunan province with strong structural deformation has especially high portion of adsorbed gas. The adsorption abilities of shale reservoir play a significant role in the success of exploration and production of shale gas in Northwestern Hunan. Therefore, based on many experiments including field emission scanning electron microscopy, N2/CO2 adsorption, excess CH4 adsorption with constant temperature and others, this paper found that: (1) the shale pores were identified with mineral matrix pores, organic-matter pores and fracture pores, and the pores can be further classified according to their shape features and forming mechanism; (2) after analyses of the distribution of the pore size, mesoporous is the largest contributor and widely distributed, and micropores provide more contribution on surface area but limited contribution to pore volume. Meanwhile, depth has little effect on the properties of shale reservoirs; (3) based on the fractal geometry theory, surface roughness is positively correlated to microstructure irregularity, which means the effects between the gas adsorption by Van der Waals force and by multilayer or capillary condensation in single pore system are consistent during the N2 adsorption process. (4) The abilities of gas storage are apparently sensitive to the surface roughness of shale pores and nonsensitive to microstructure irregularity. Total organic carbon has strong positive correlation with the surface roughness, specific surface area, total pore volume, and Langmuir volume, which means TOC can improve the adsorption of shale reservoir in many ways. Pyrite can offer much contribution to the ability of gas adsorption.
Introduction
Shale gas is an unconventional natural gas as an energy resource, mostly appearing with adsorbed, dissociated, and dissolved state in the shale (Curtis, 2002). Compared with tight sandstone, the geometry, distribution, genesis, reservoir properties, and its controlling factors of shale pores are all very complex (David, 2007). The adsorption gas in the shale commonly account for more than 20% and is generally believed to fall between 40% and 60% (Martini et al., 2003). Due to its low porosity, permeability, and large internal surface area, the adsorption of shale is very important (Bowker, 2007), and is one of the key parameters for shale gas accumulation and production (Chalmers and Marc, 2007; Wang et al., 2013).
Considerable advances in the development of shale gas have been made in Sichuan Basin (Figure 1). The cumulative production in the Fuling shale gas field has reached 1 × 10¹¹ m3 in recent years (Wang, 2017). Yiye1HF well and Yangye1HF well also have 1.24 × 10⁵ m3 and 2.89 × 10⁵ m3 unimpeded production per day in the Niutitang formation respectively (Shi, 2018). The northwestern (NW) Hunan region, located along the eastern margin of Sichuan basin, has yet to have a similar breakthrough (Figure 1). This area has good hydrocarbon generation conditions with a large scale and organic-rich of Niutitang black shale and has been approximately 3.23 × 10¹² m3 of potential shale gas resources (Xi et al., 2018). However, NW Hunan region has experienced a long and strong tectonic deformation, and the ancient reservoirs may have been damaged possibly to the point where they no longer exist (Xiao et al., 2015). In this situation, the shale gas reservoirs can be saved partly due to a lower conservation needs (Hu et al., 2014). The adsorbed state of shale gas accounts for 69.7% on average with range 49.8–83.5% based on a shale gas well in NW Hunan (Huang et al., 2019). In comparison, the adsorbed state of shale gas in Fuling field only accounts for an average of 34.3% with a range of 27.1–47.8% (Borjigin et al., 2017). Therefore, the adsorbed gas in shale reservoir is very important for shale gas accumulation especially in NW Hunan. However, the characteristic of the shale reservoir is still unclear and incomplete based on few wells and their samples in the study area. In this paper, field emission scanning electron microscope (FESEM), low temperature N2 adsorption, low-pressure CO2 adsorption, CH4 adsorption experiments, and others are used systematically on the black shale cores from the shale gas wells. Through analysis and comparison from the data, this research examines the features of pore microstructure, the gas adsorption, and influencing factors under intense tectonic deformation in the Niutitang formation, NW Hunan. All the studies are useful for resources assessment and exploration and production of shale gas in NW Hunan. They can also be compared with other areas.
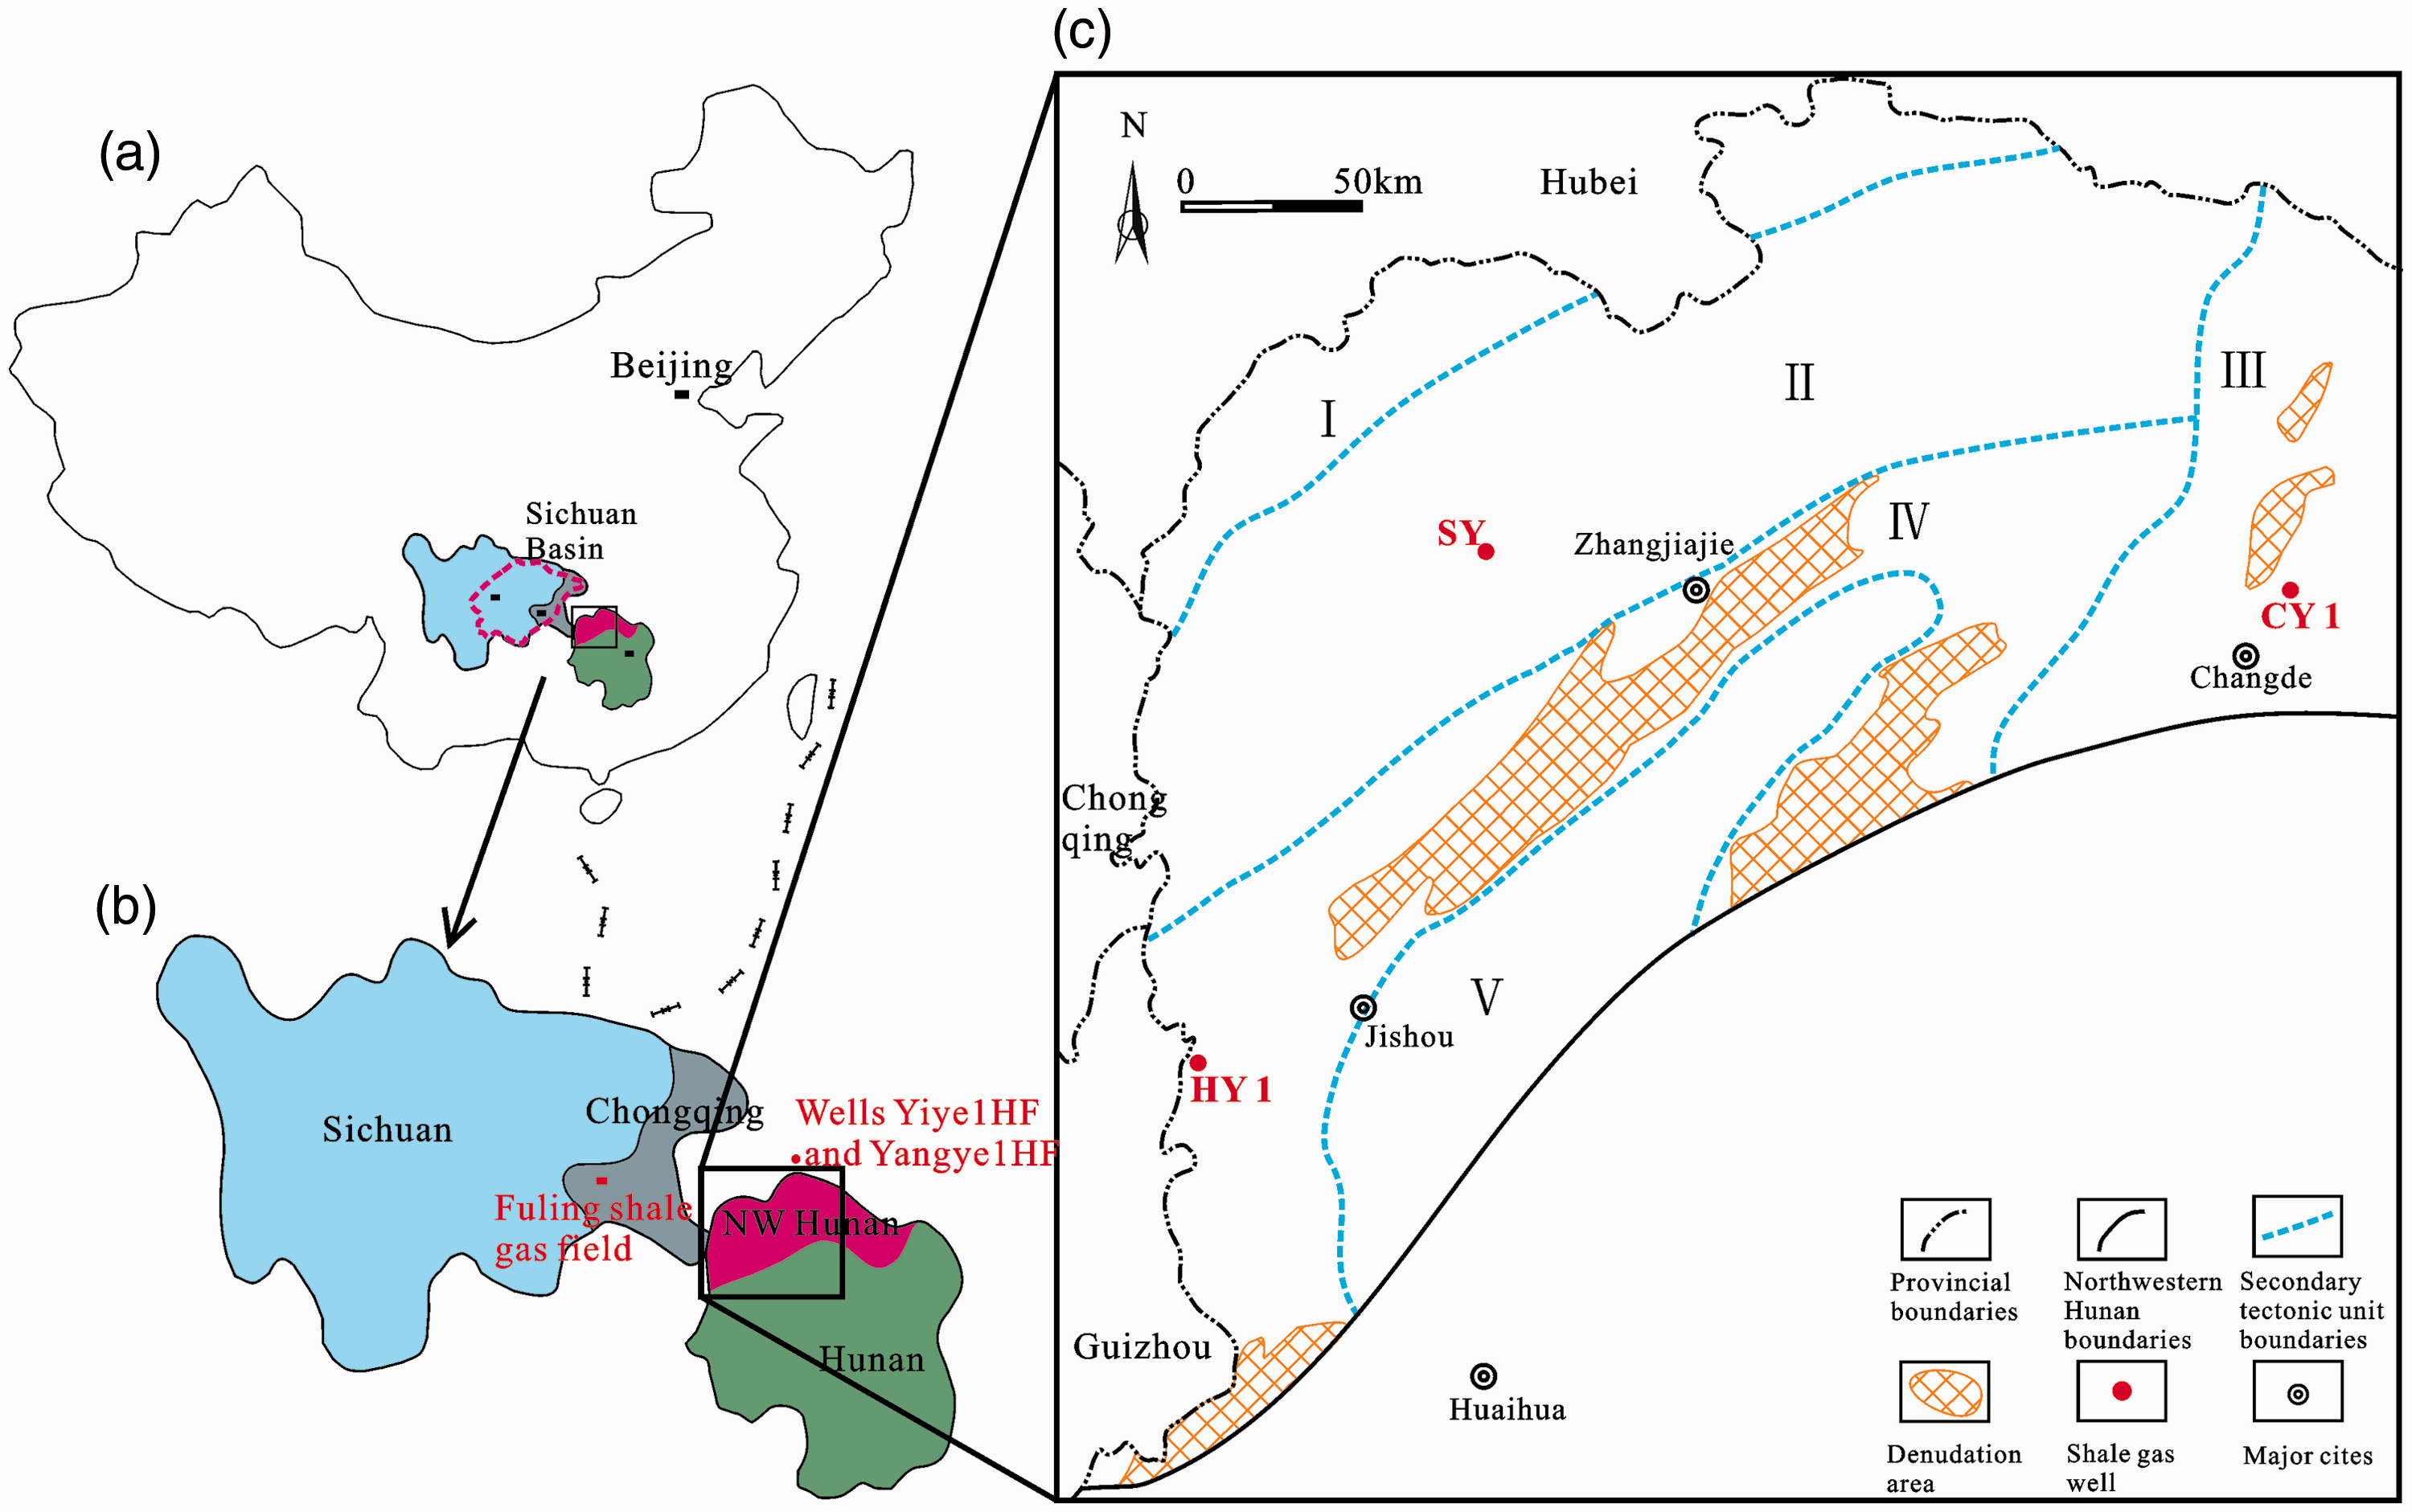
Geographical map of northwestern Hunan and some shale gas wells.
Geological setting
The research area is in the northwest of Hunan province, South China, covering an area of approximately 3.2 × 10⁴ km2. According to the characteristics of stratigraphic lithology and geological structure, the study area can be divided into five subunits: Yidu-Hefeng anticlinorium, Sangzhi-Shimeng synclinorium, Dongting basin, Wuling fault-fold belt, and Yuan-Ma residual basin (Figure 1). The strong tectonic deformation has transformed the stratum extensively, and easily developed many folds and faults in the study area. The lithology of the Niutitang formation in lower Cambrian is generally a series of black shale, which are widely distributed with abundant organic matter (OM) (Wang et al., 2014). The sedimentary environment of the study area is deep or shallow water shelf and from northeast to southwest during the sedimentary period of the Niutitang formation. The thickness of the Niutitang formation is generally in the range of 100–200 m, which was controlled by sedimentary environment. The total organic carbon (TOC) contents are generally more than 2%, with a TOC maximum value of approximately 30%. However, Triassic and the strata above that have been denuded in most areas in the study area, as well as the depth of the Niutitang formation can be more than 4000 m in the subunit II. We also believe that the Niutitang formation has been significantly uplifted in many areas in NW Hunan (Wang et al., 2014; Xi et al., 2018). The interpretation of seismic profiles from Well HY1 and CY1 show respectively that the dip angle of target formation is 20°–25° and 27°–32° (Figure 2).
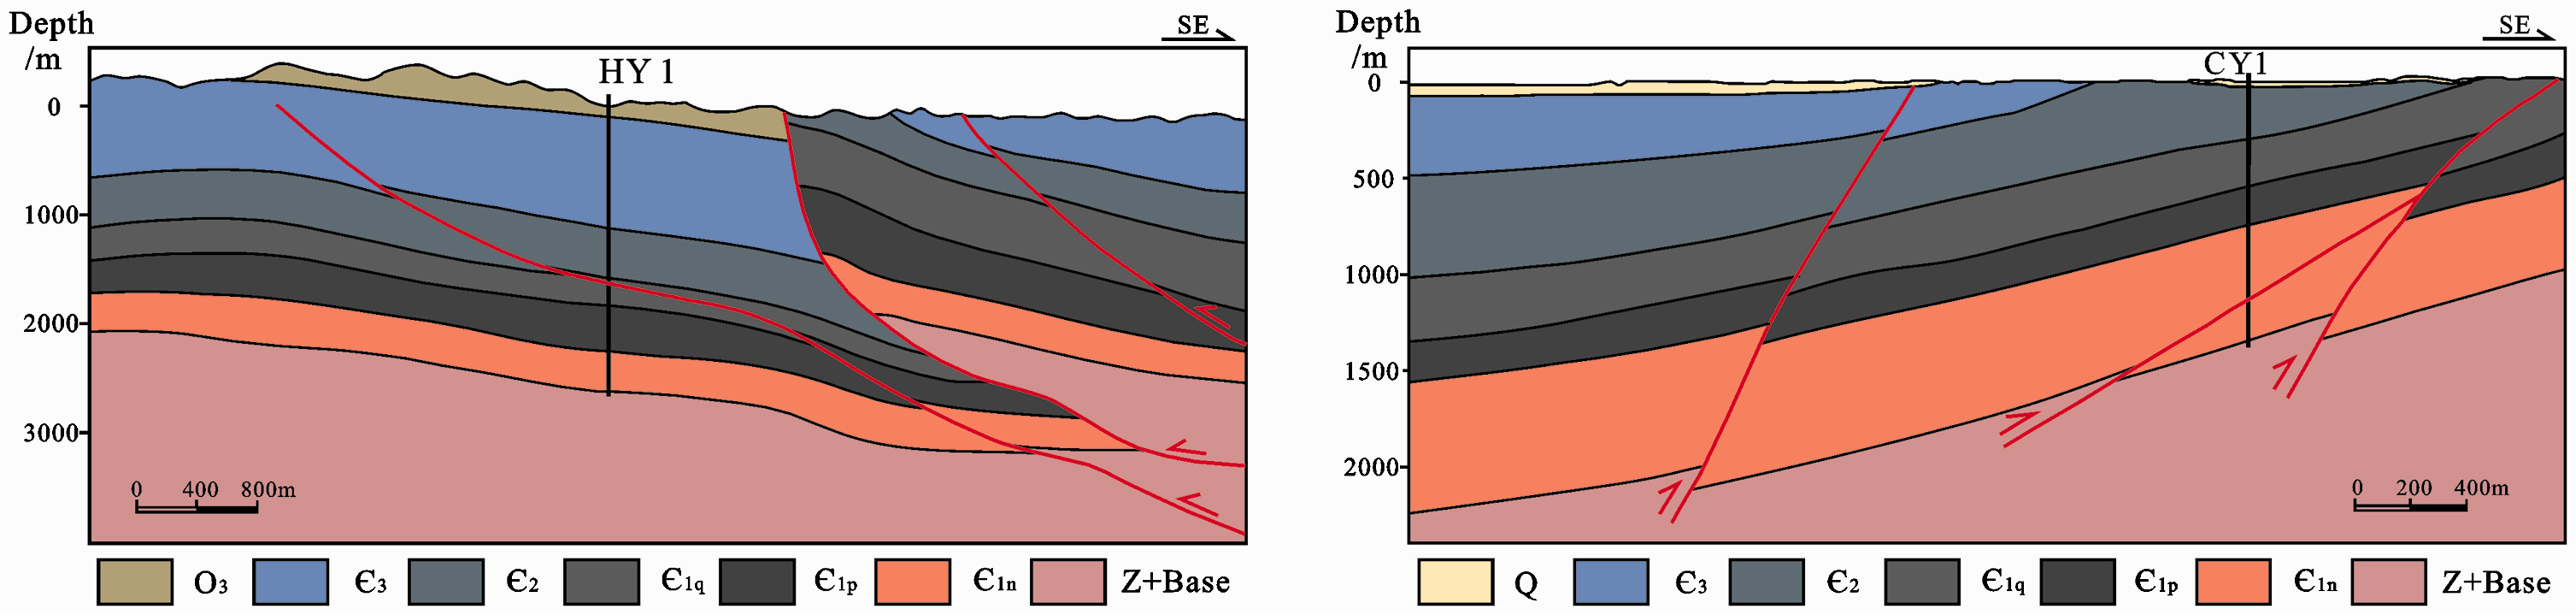
The strata characteristic of well HY1 and CY1 by the explanation of seismic profiles.
Samples and methods
All shale samples are collected from the lower Cambrian in well HY1 and CY1, which have some gas showing in the lower part of the Niutitang formation. Besides, there are significant works from SY well including TOC, mineral composition, low temperature N2 adsorption, and CH4 adsorption experiments (Xi et al., 2018) also can be analyzed and compared in the paper (Figure 3). More details about main analysis on the cores of well HY1 and CY1 are shown as follows.
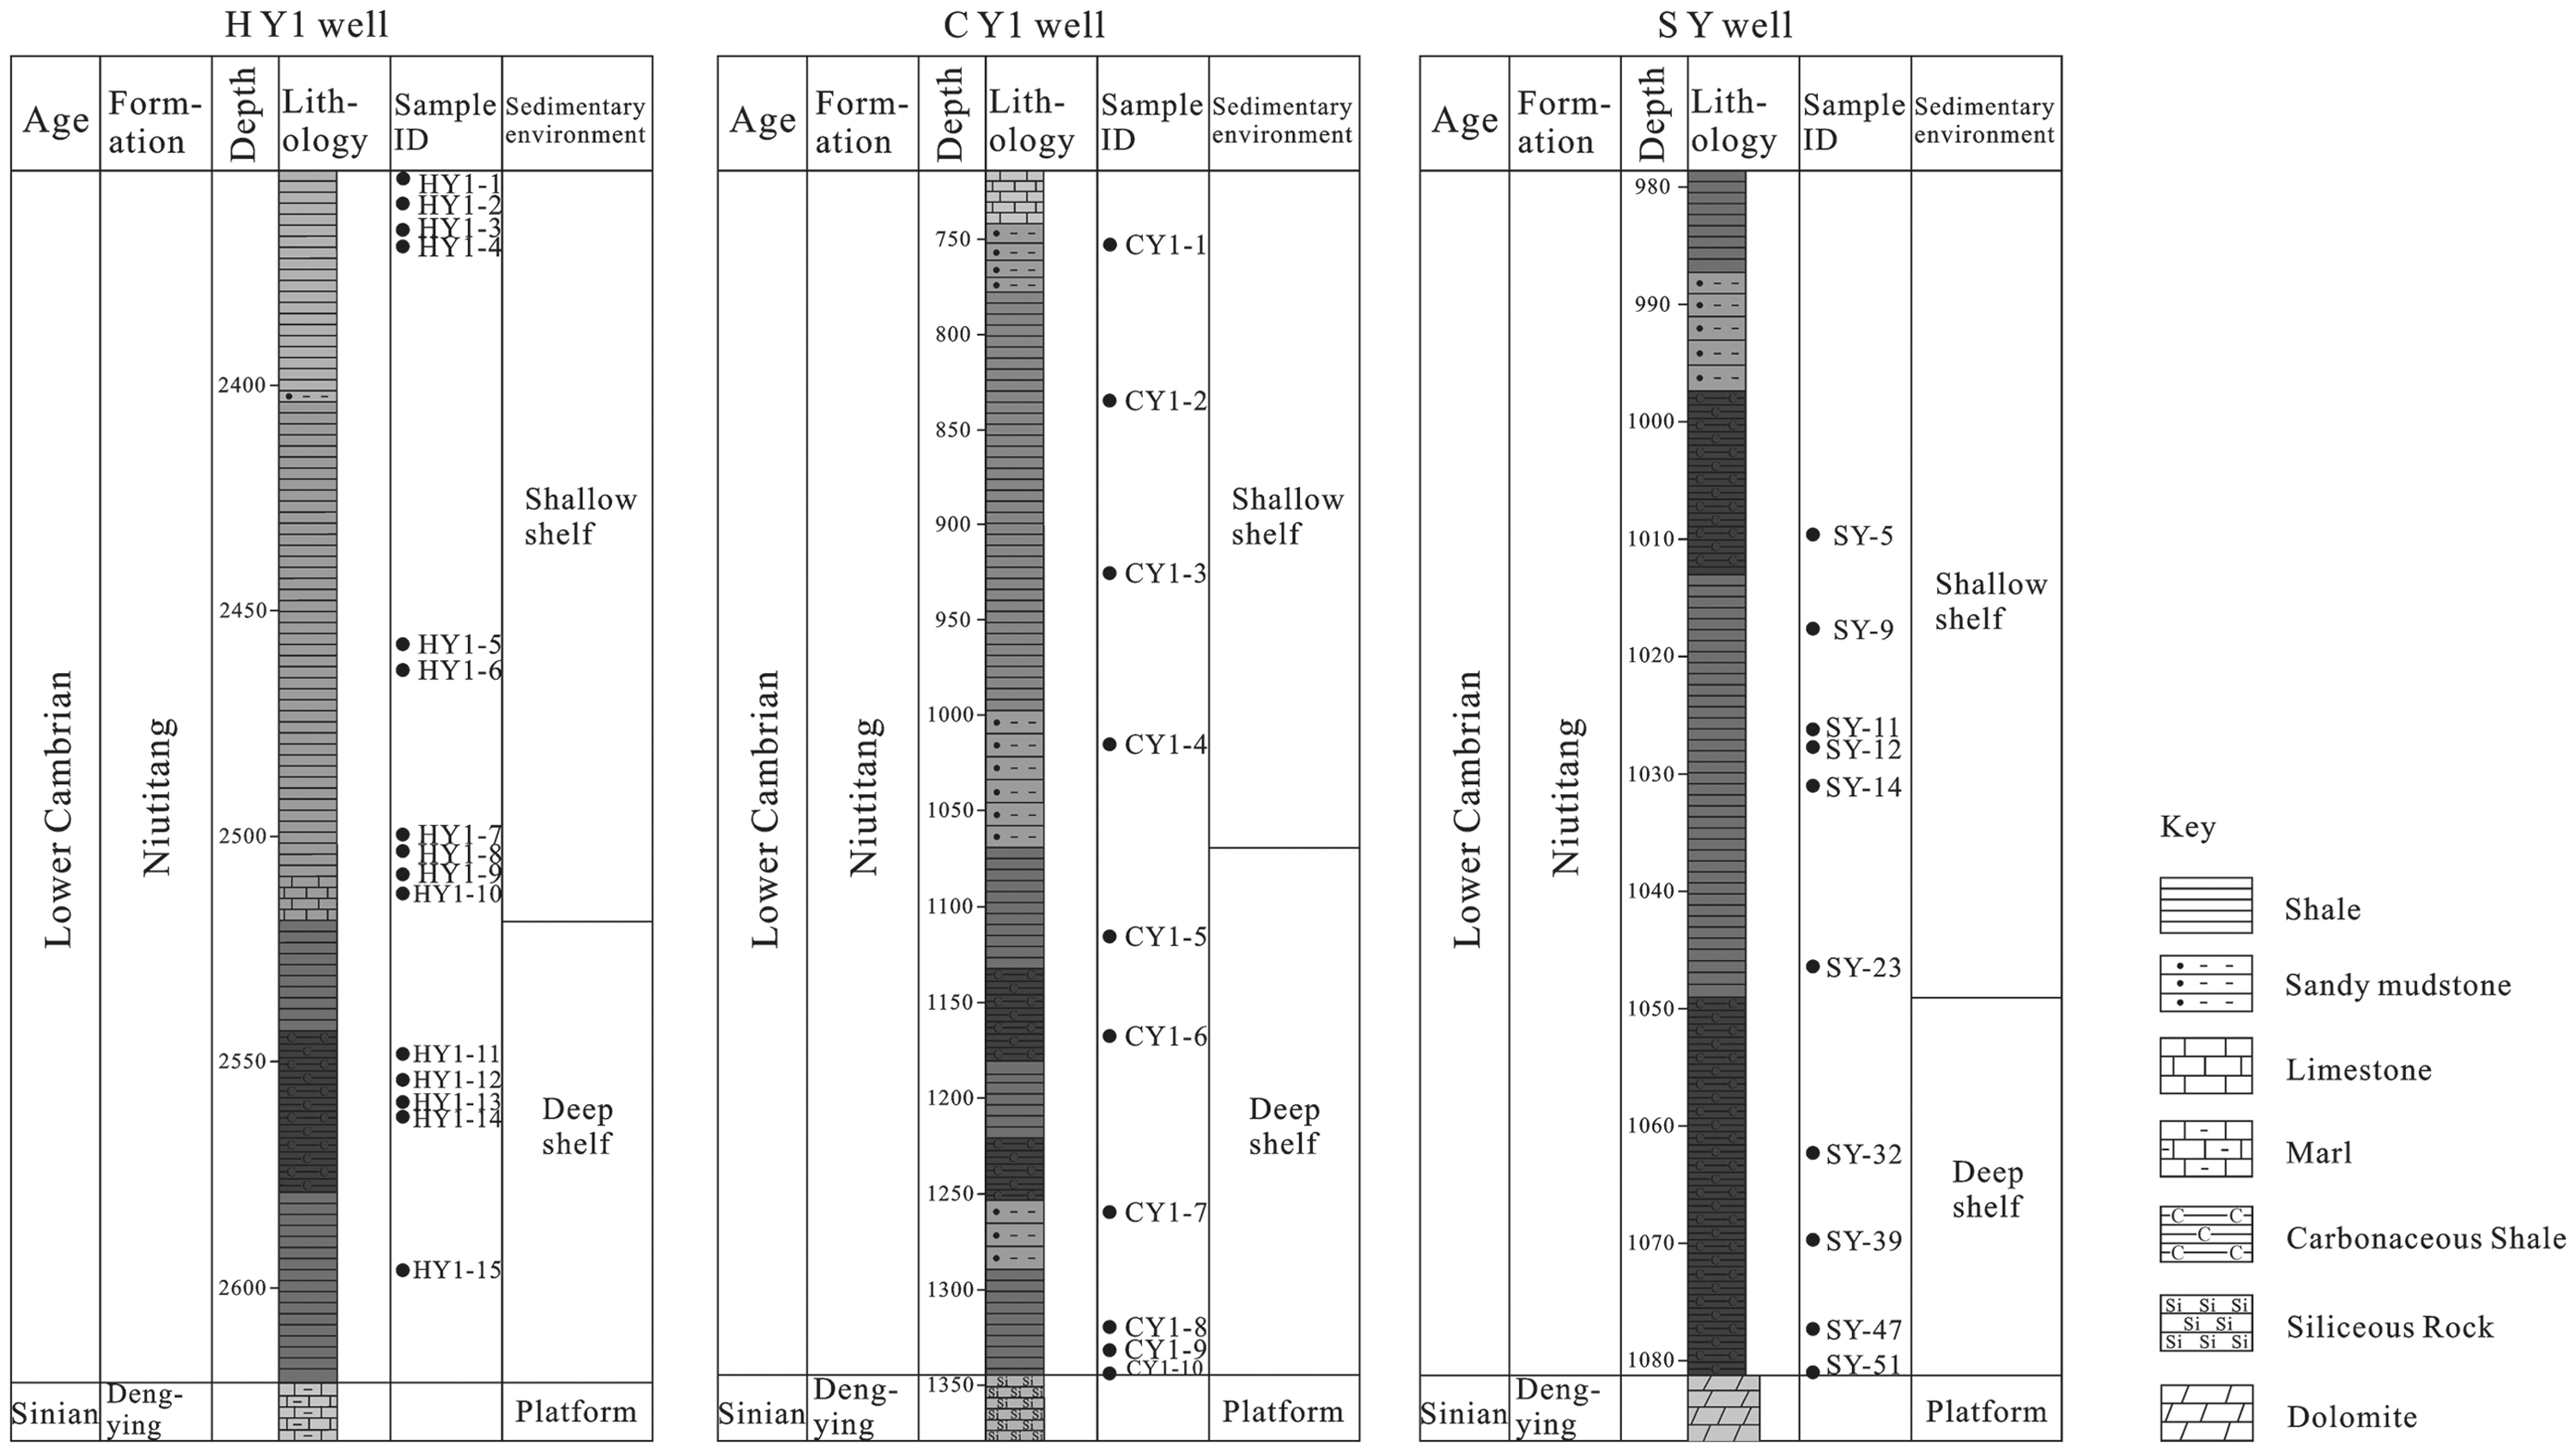
The characteristic of Niutitang formation and the samples from well HY1, CY1, and SY (the data of Well SY from Xi et al., 2018. The latter in this paper is the same).
All samples were first crushed to less than 200 mesh in size, weighed, and then washed with 5% hydrochloric acid to dissolve and remove any inorganic carbon within the carbonate. After elutriation with distilled water and desiccation at 353.75 K, the samples were measured by Leco carbon/sulfur analyzer. All operations must be followed Chinese national standard GB/T 19145–2003. In X-ray diffraction (XRD) analysis, the samples were also grinded into 60–80 mesh in size and mixed with ethanol, then smear mounted on glass slides. The relative mineral percentages can be obtained via basal reflections and mineral structure models.
Due to extremely low permeability in the shales, we used PoroPDP 200 instrument with pressure pulse decay method to measure the permeability in the study area. The samples must be cut into cylinder (1 inch in diameter and length), and then were put into the core gripper, which its confining pressure can reach 70 MPa. All these can improve the sensitivity and accuracy, and the measured range of permeability is 0.1 × 10⁻⁴ mD–10 mD. FESEM is effective for directly recognizing the pore structure of shales with its high resolution. All samples are observed under the Quanta 200 F FESEM. But before putting the samples on the base of the instrument, some samples only need to be coated to provide conductive surfaces, and some others need to be polished mechanically, argon ion beam milled and coated. The difference between them is the latter can offer 2-D images.
The amount of CH4 adsorption is an intuitive parameter to judge the shale adsorption abilities. Following the Chinese national standard GB/T 19560–2008, each sample was crushed to about 80 mesh in size and 100–150 g was weighed before moisture equilibration was conducted in an evacuated desiccator. At different pressures but a constant temperature 30°C, we weighed every sample with saturated CH4 when its weight no longer changed after 24 h with an HPVA 200 high pressure adsorption instrument. Finally, Langmuir volume and pressure were obtained using these testing data.
In addition, the samples were grinded into a 100-mesh sieve. Then they were dried for 5 h and degassed at 383.15 K under vacuum for 24 h to eliminate adsorbed moisture or others. The amount of N2 adsorption and desorption can be measured using NOVA 2000e adsorption instrument at the different N2 partial pressure and the temperature of liquid N2 (77.35 K). The isothermal curves also can be determined. So the important pore parameters and features, specific surface area (SSA) and total pore volume (TPV) of mesopores (2 nm < Φ < 50 nm) and part of macropores (Φ > 50 nm), were obtained based on the Brunauer–Emmett–Teller (BET) theory and the Barrettee–Joyneree–Halenda (BJH) method, respectively (Li et al., 2018). In order to describe the characteristics of micropores (Φ < 2 nm), CO2 isothermal adsorption experiment was also carried out at the ice-water bath temperature (273.15 K) and very low CO2 partial pressure (p/p0 = 0–0.03). The surface area and volume of micropores can be determined accurately based on the density functional theory (DFT) method (Wang et al., 2014).
Besides, the theory of fractal dimension can be used here to recognize the complexity and irregularity of pore microstructure with the Frenkel–Halsey–Hill (FHH) model (Jaroniec, 1995). The theoretical formula is shown as follows
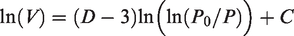
Based on the data obtained from the N2 adsorption experiments, V is the amount of N2 adsorption when its equilibrium pressure is P. P0 is the saturated vapor pressure, D is fractal dimension, and C is a constant. In the formula, D can be confirmed by D = 3+K when the slope K, using ln(V) and ln(ln(P0/P)) for plotting, is determined.
Results
Lithology and minerals
The lithology of the Niutitang formation is mainly argillaceous and carbonaceous, with black or gray colors (Figures 3 and 4). The horizontal and tiny lamellation can be seen with high angle fissures developed and filled with calcite. Pelitic texture and micro directional formation usually can be seen through microscopic identification. We also can find this from the fossils, which are embedded and have been replaced by siliceous mineral (Figure 4). The composition and contents of HY1 and CY1 minerals are similar. Quartz and clay minerals are the main minerals, and the content of feldspar and carbonate is relatively low (Table 1).

The photos from the cores and their thin section in HY1 and CY1 wells in Niutitang formation. (a) HY1-6, horizontal lamellation; (b) its thin section, pelitic texture and micro-directional formation, fossil can be seen and has been replaced by silicious; (c) CY1-7, a high angle fissure and has been filled by calcite; (d) its thin section, pelitic texture, and micro-directional formation; (e) the core landscape of CY1 well from 1002.7 m to 1012.9 m).
The basic information and analysis results of well HY1 and CY1 samples in Niutitang formation, NW Hunan.
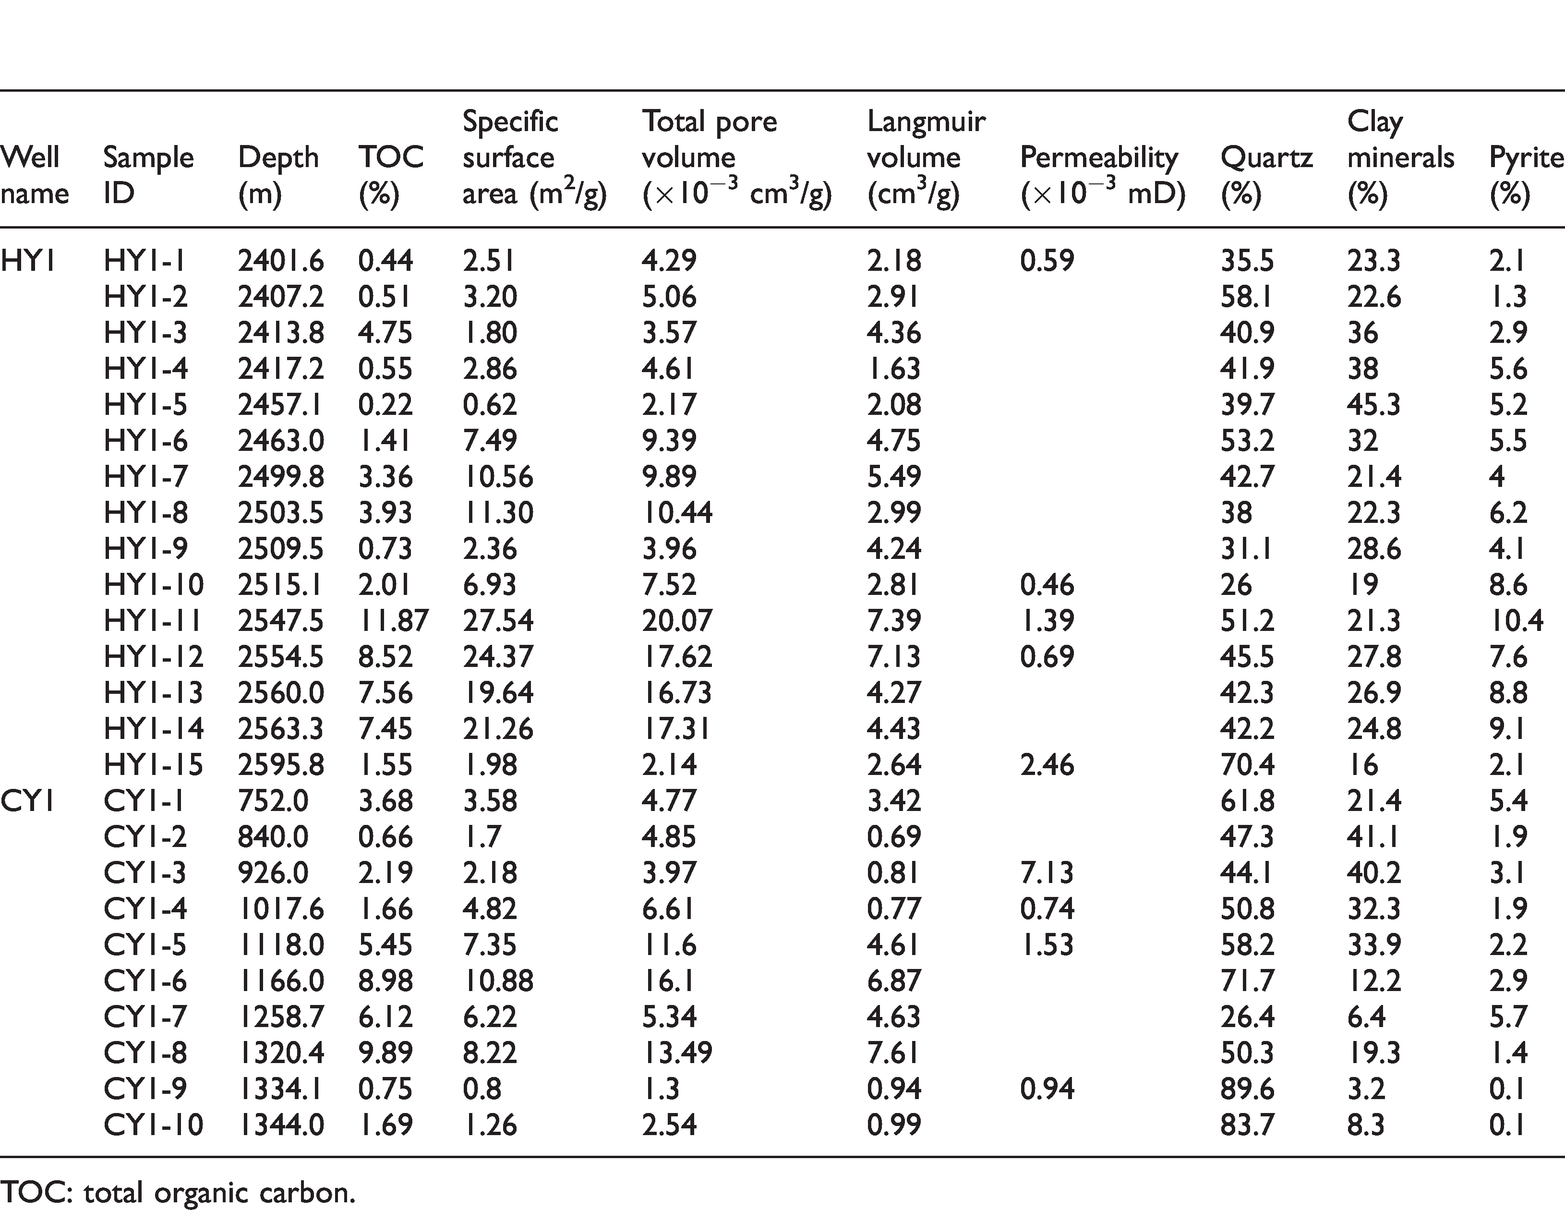
TOC: total organic carbon.
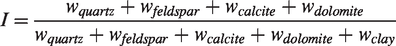
Taken as a whole, we find that siliceous account for 65.4% on average and clay minerals have 23.8% and carbonate only make up 10.8%. Considering with well SY (Xi et al., 2018) and SY-2 (Wang et al., 2018), pyrite is widely developed in the Niutitang shales. There is a relatively strong correlation between pyrite and TOC with 0.56 correlation coefficient, probably due to pyrite is an index of reducing sedimentary for preserving OM and improving TOC value. By contrast, there is no relationship between clay minerals and TOC with only 0.01 correlation coefficient. Based on the three end members of mineral composition, we can classify four mainly shale lithofacies types: siliceous shale lithofacies (S), calcareous shale lithofacies (C), argillaceous shale lithofacies (CM), and mixed shale lithofacies (M). Each type can further classify into four types, and 16 types in all (Wu et al., 2016). We can find that the Niutitang formation shale can be identify as mixed siliceous (S-2) or clay-rich siliceous (S-3) shale lithofacies (Figure 5). Compared with Barnett shale and others (Wu et al., 2016), the content of siliceous is too much and clay minerals are relatively low in the study area. However, the brittle mineral content of shale in the study area is generally high and the brittleness index (I) of HY1 and CY1 well are 0.52 and 0.59 on average respectively, which is favorable conditions for fracturing and increasing shale gas production (Gale et al., 2007). Because of the mineral composition of the shales is complex, the following formula was used for the calculation of I
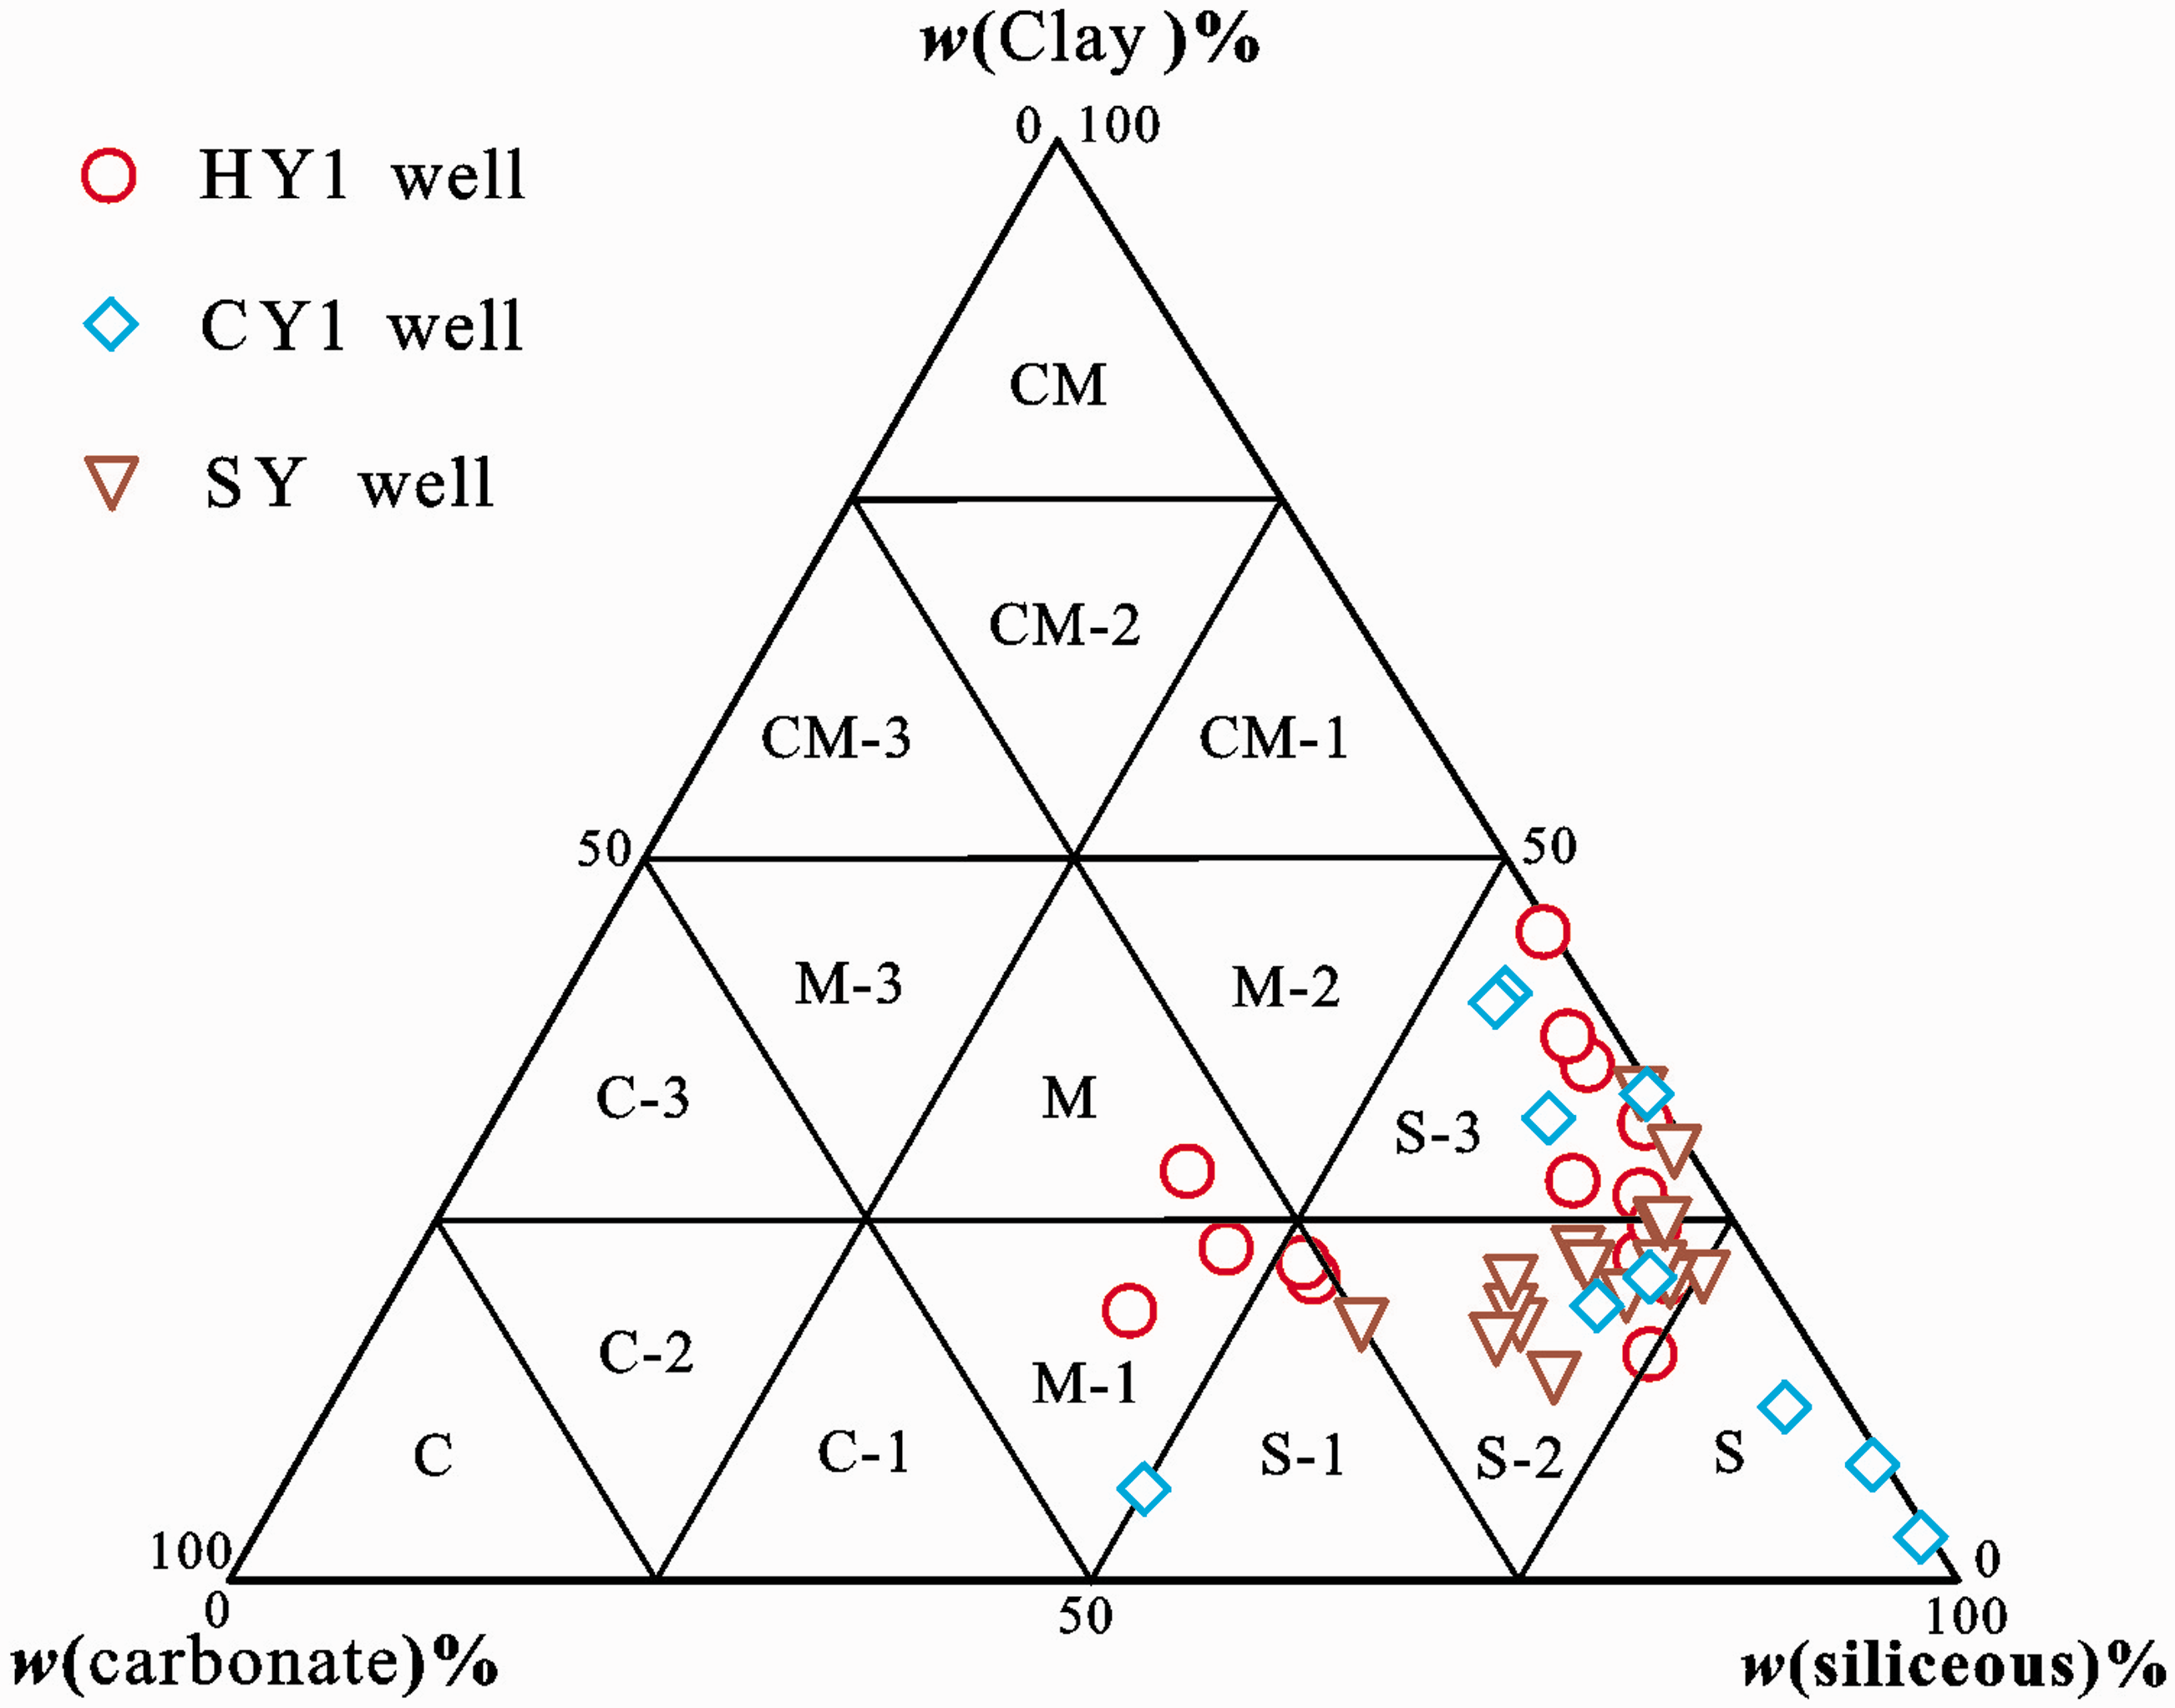
The mineral composition and shale lithofacies classification from triangle chart.
Pore microstructures
Till now, there is no unified scheme for the classification of shale pores. Considering synthetically the manifest features and forming causes of different pores, and the uniformity of classification scheme, we divided the pores into mineral matrix pores, organic-matter pores, and fracture pores (Loucks et al., 2012). In the dense shales of the study area, the mineral matrix pores can easily be identified with interparticle pores (interP) and intraparticle pores (intraP) under FESEM. Specifically, interP can be further classified into pores between grains or crystals, pores between clay platelets and pores at the edge of rigid grains. The pores between grains or crystals are formed the space between mineral grains or crystals in the process of diagenesis, which is widely distributing in the study area (Figure 6(a)). These pores are residual and primary reservoir spaces, with various shapes and micro- and nano-scale. There are also many pores appeared between clay platelets (Figure 6(b)). Due to sheet clay minerals in the shales, the pores between clay platelets are also common and often nanoscale. The pores at the edge of rigid grains are easily distribute at the joint boundary with clay or OM and is often nanoscale (Figure 6(c)). Compering with intraP, interP may have a higher probability of being part of an effective pore network because of intraP are more likely to be interconnected (Loucks et al., 2012). However, intraP has more shapes and types including intracrystalline pores within pyrite framboids, intraplatelet pores within clay aggregates, pores within peloids (micritic grains of uncertain origin) or pellets, dissolution-rim pores, pores within fossil bodies and moldic pores after a crystal or a fossil. Intracrystalline pores within pyrite framboids are shown with nanoscale, microspheric, and tufted shapes in tiny pyrite, which is enrich in the study area (Figure 6(d)). Intraplatelet pores within clay aggregates are hard to be identified because of little difference with the pores between clay platelets by FESEM images. The pores within peloids or pellets may be developed in the inner of mineral particles, which may be a developmental defect in the formation or transformation process of minerals. Many pores within peloids or pellets are nanoscale, and both primary and epigenetic pores can be found on FESEM (Figure 6(e)). Dissolution-rim pores are also hard to confirm, but there is no doubt that they are developing easily at the edge of some minerals such as pyrite, quartz, feldspar, or carbonate. Most fossils in the black shales were destroyed by several kilometers of burial, but the moldic pores after crystals with microscale can be found in the Figure 6(f). Their size and shape are the same with dissolved particles, and relatively well developed in the Niutitang formation.
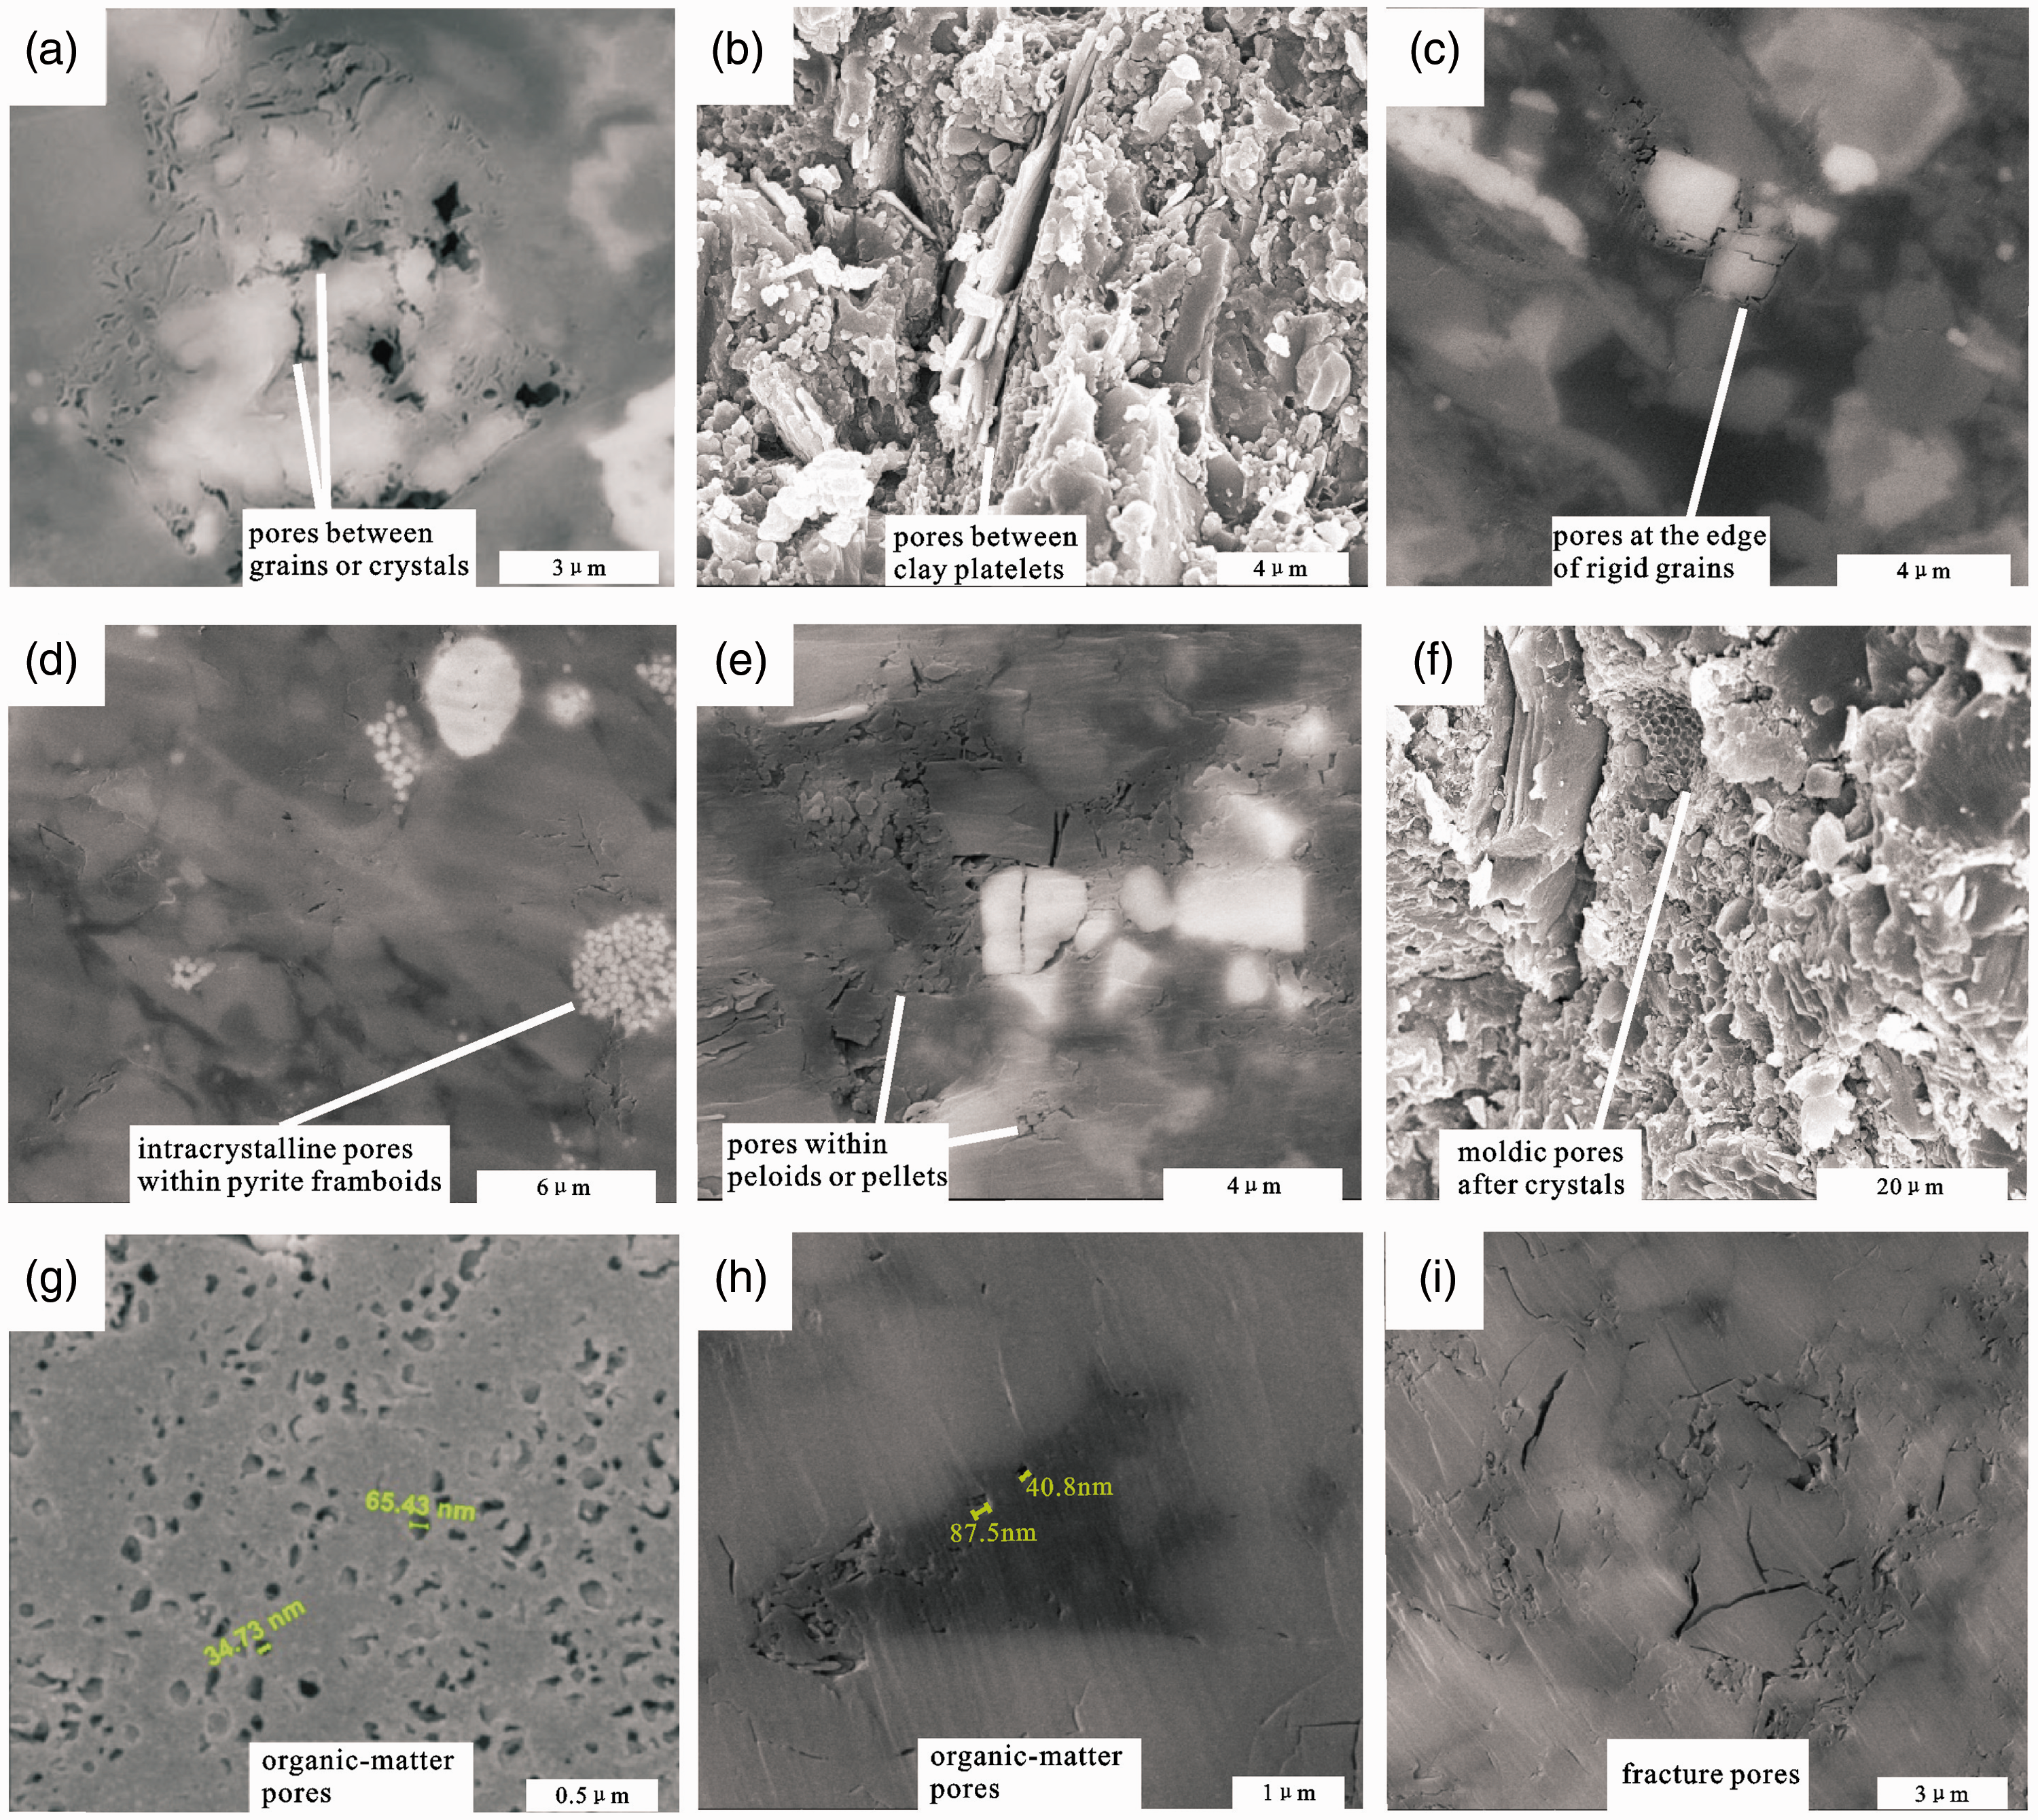
The microstructure features of different pores on FESEM. (a) CY1-8, polished surface observation, the pores between grains or crystals with widely distribution; (b) HY1-14, natural section observation, the pores between sheet clay platelets; (c) HY1-9, polished surface observation, the pores at the edge of rigid grains; (d) HY-9, polished surface observation, the abundant intercrystalline pores distributed in pyrite particle; (e) HY1-12, polished surface observation, the pores within oeloids or pellets; (f) HY1-13, natural section observation, the moldic pores after crystals with dense distribution; (g) CY1-5, polished surface observation, nanoscale organic-matter pores; (h) HY1-7, polished surface observation, the organic-matter pores distributed in filling OM; (i) HY1-8, polished surface observation, the different fracture pores).
Organic-matter pores, formed by kerogen contraction and hydrocarbon generation, often appear with “honeycomb” structures and are densely distributed in OM with nanoscale (Figure 6(g)). OM also appears as the form of adsorption, package, or filling within inorganic mineral (Figure 6(h)). Therefore, the organic-matter pores are well developed in the study area with abundant OM. It is believed that organic pores are more important than inorganic pores for shale gas transfusion and accumulation (Curtis et al., 2012; Mathia et al., 2016). Finally, the fracture pores are easily formed by tectonic stress, which can cut through mineral grains or separate different particles with both micro- and nanoscale (Figure 6(i)). They are not only used for shale gas storage but can also be used to link up many tiny pores and improve permeability. Besides, the formed reasons are not only by tectonic stress but also by slip bedding, diagenesis shrinkage, hydrocarbon generation or others, but they are hard to be confirmed on FESEM.
Low temperature N2 adsorption
The measured curves of typical samples, HY1-11 and CY1-5, are shown in Figure 7(a). The isothermal adsorption curve of all samples tested present the same reversed “S” shape. At the low-pressure stage, the curve rises slowly with a small hump midway; in the middle/late stage, the adsorption capacity gradually increases with increasing pressure, which is the process of multilayer adsorption (Kuila and Prasad, 2013). Finally, due to capillary condensation, the tail of the adsorption curve jumps upwards when the N2 partial pressure is high. According to the curve shapes and brunauer-deming-deming-teller (BDDT) classification (Xi et al., 2018), all isothermal adsorption curves suggest that the adsorption of the shale belongs to type II, which means monolayer adsorption with saturation and multilayer adsorption. The mesopores and macropores are widely dispersed in the shale. The adsorption and desorption curves never be closed, most likely due to abundant OM. The form of adsorption hysteresis can also be classified as a mixture from type H2 and H3, reflecting that the pore structure is not very uniform. The slit-shaped pores with parallel plates, which are formed possibly by sheet particle stacking, and irregular pores with ink bottle appearance are widely developed in the study area. These pores have a very complex morphology and diverse size spectrum (Wang et al., 2018). There are also some cylindrical pores, conical pores, tapered tubes etc., which have been shown on FESEM.
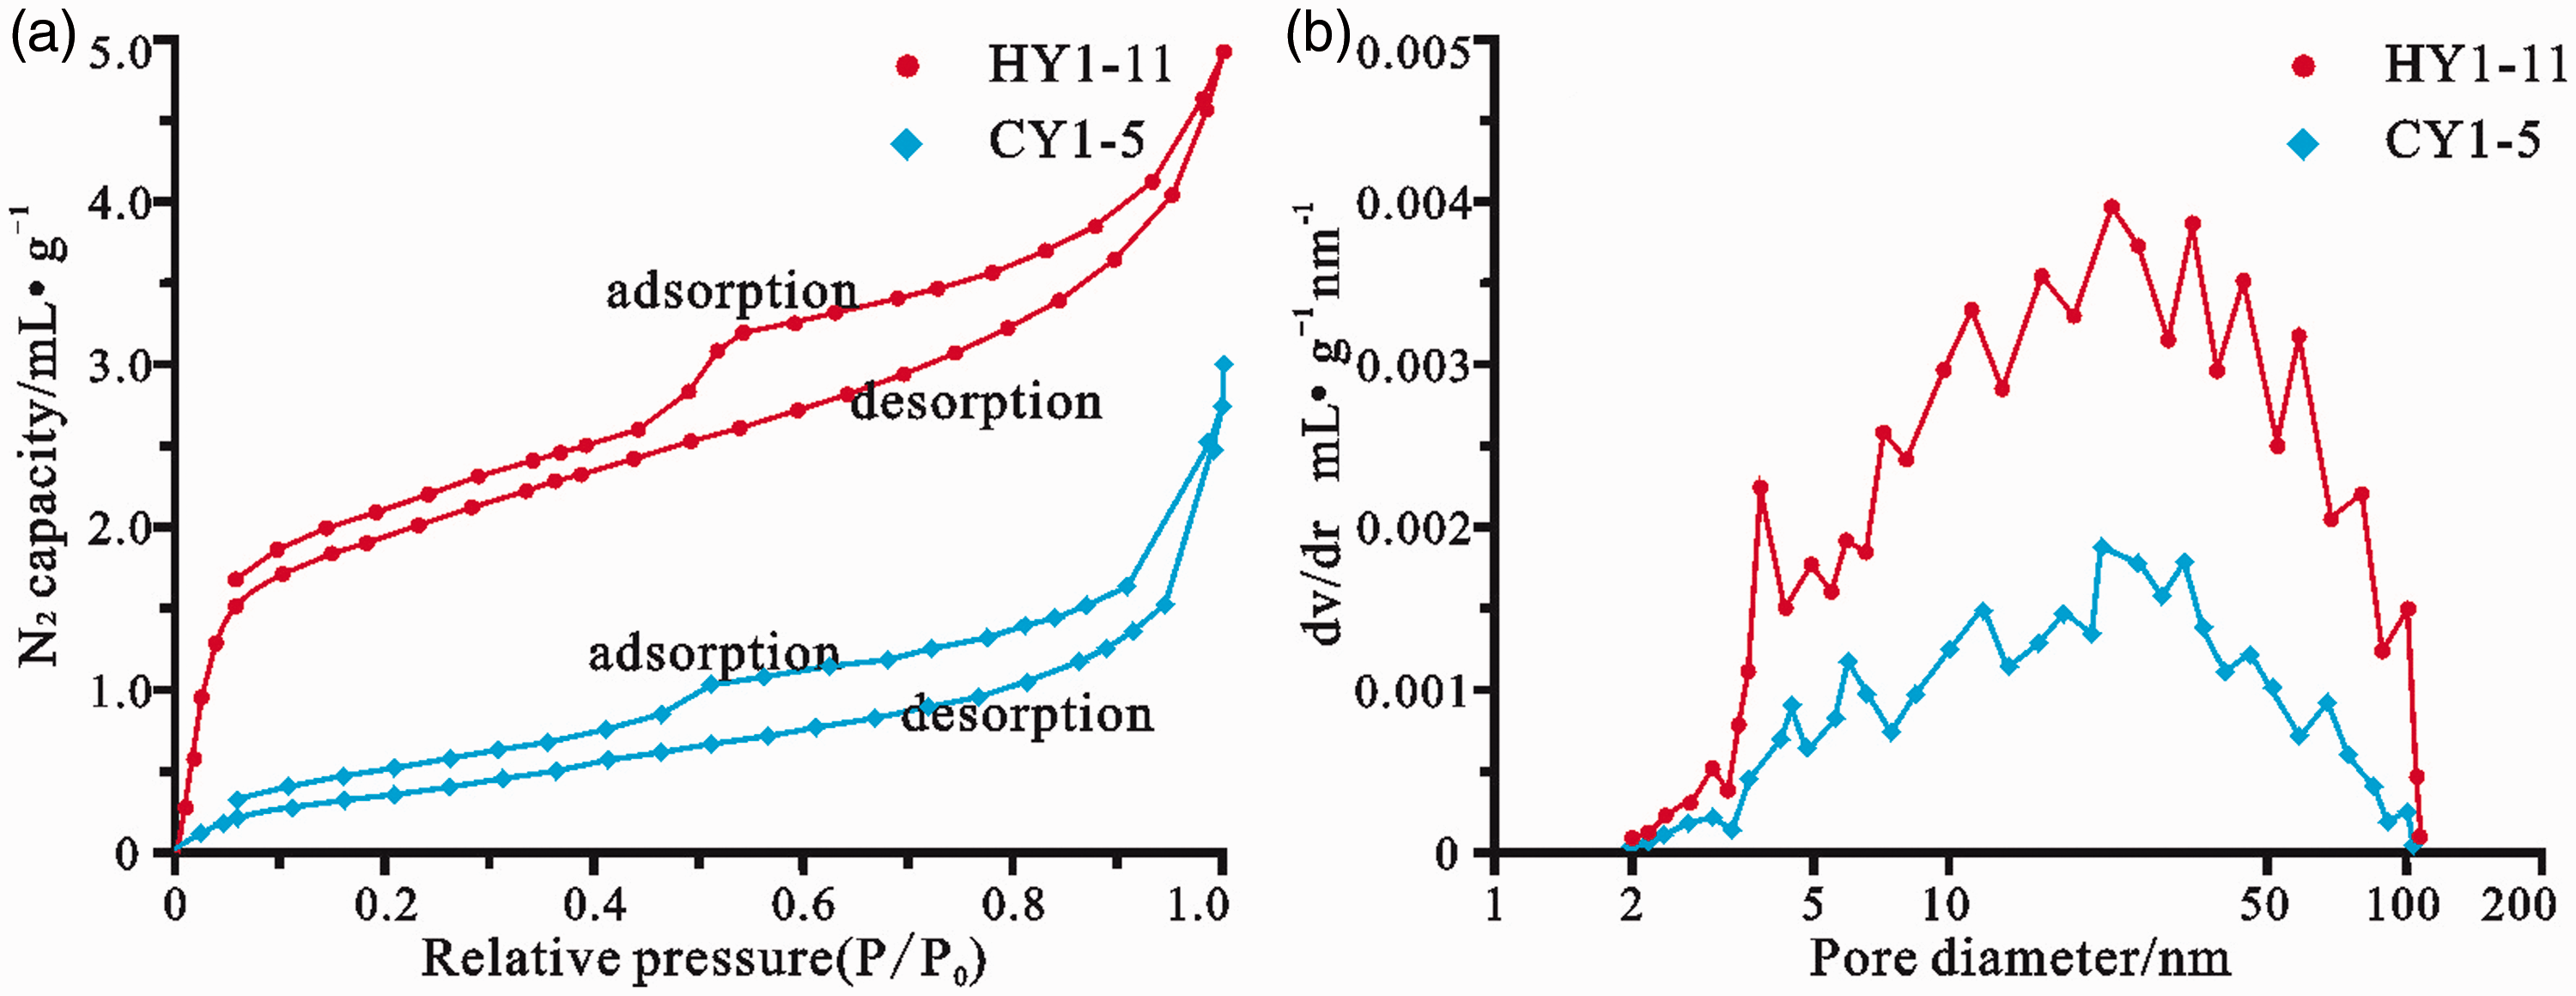
The results of N2 adsorption and desorption experiment. (a) Nitrogen desorption and adsorption isotherms of one classic sample from HY1 and CY1 and (b) The pore size distribution of the same samples).
The pore size distribution can be obtained when using DFT method and adsorption data (Figure 7(b)). But the difference between mesopores, macropores and micropore (Φ < 2nm) is hard to confirm because of computing methods, especially between micropores and others (Fang et al., 2018). There are several peaks in Figure 7(b), but it is obvious to note that the drastic change is between 2 nm and 50 nm, indicating that the mesoporous is the largest contributor and widely distributed. SSA and TPV (important parameters in determining the reservoir potential of the shale), and Langmuir parameters from CH4 adsorption are also shown in Table 1. It is easy to find that HY1 shale perform far better than CY1 on these parameters, although the depth of HY1 is much deeper than that of CY1. At same well, it seems that some deep samples perform more batter than shallow ones. The effect by depth on the adsorption may be small on the tiny shale in the study area.
Besides, based on the N2 adsorption data, fractal dimension is confirmed using the method mentioned above. The results of fractal dimensions from sample HY1-10, CY1-2, and SY-32 is shown in Figure 8. It is easy to find that there are two different phases: 0 < P0/P < 0.5 and 0.5 < P0/P < 1. In each phase, the data show a good fit and two different fractal dimensions, labeled D1 and D2 have been determined.
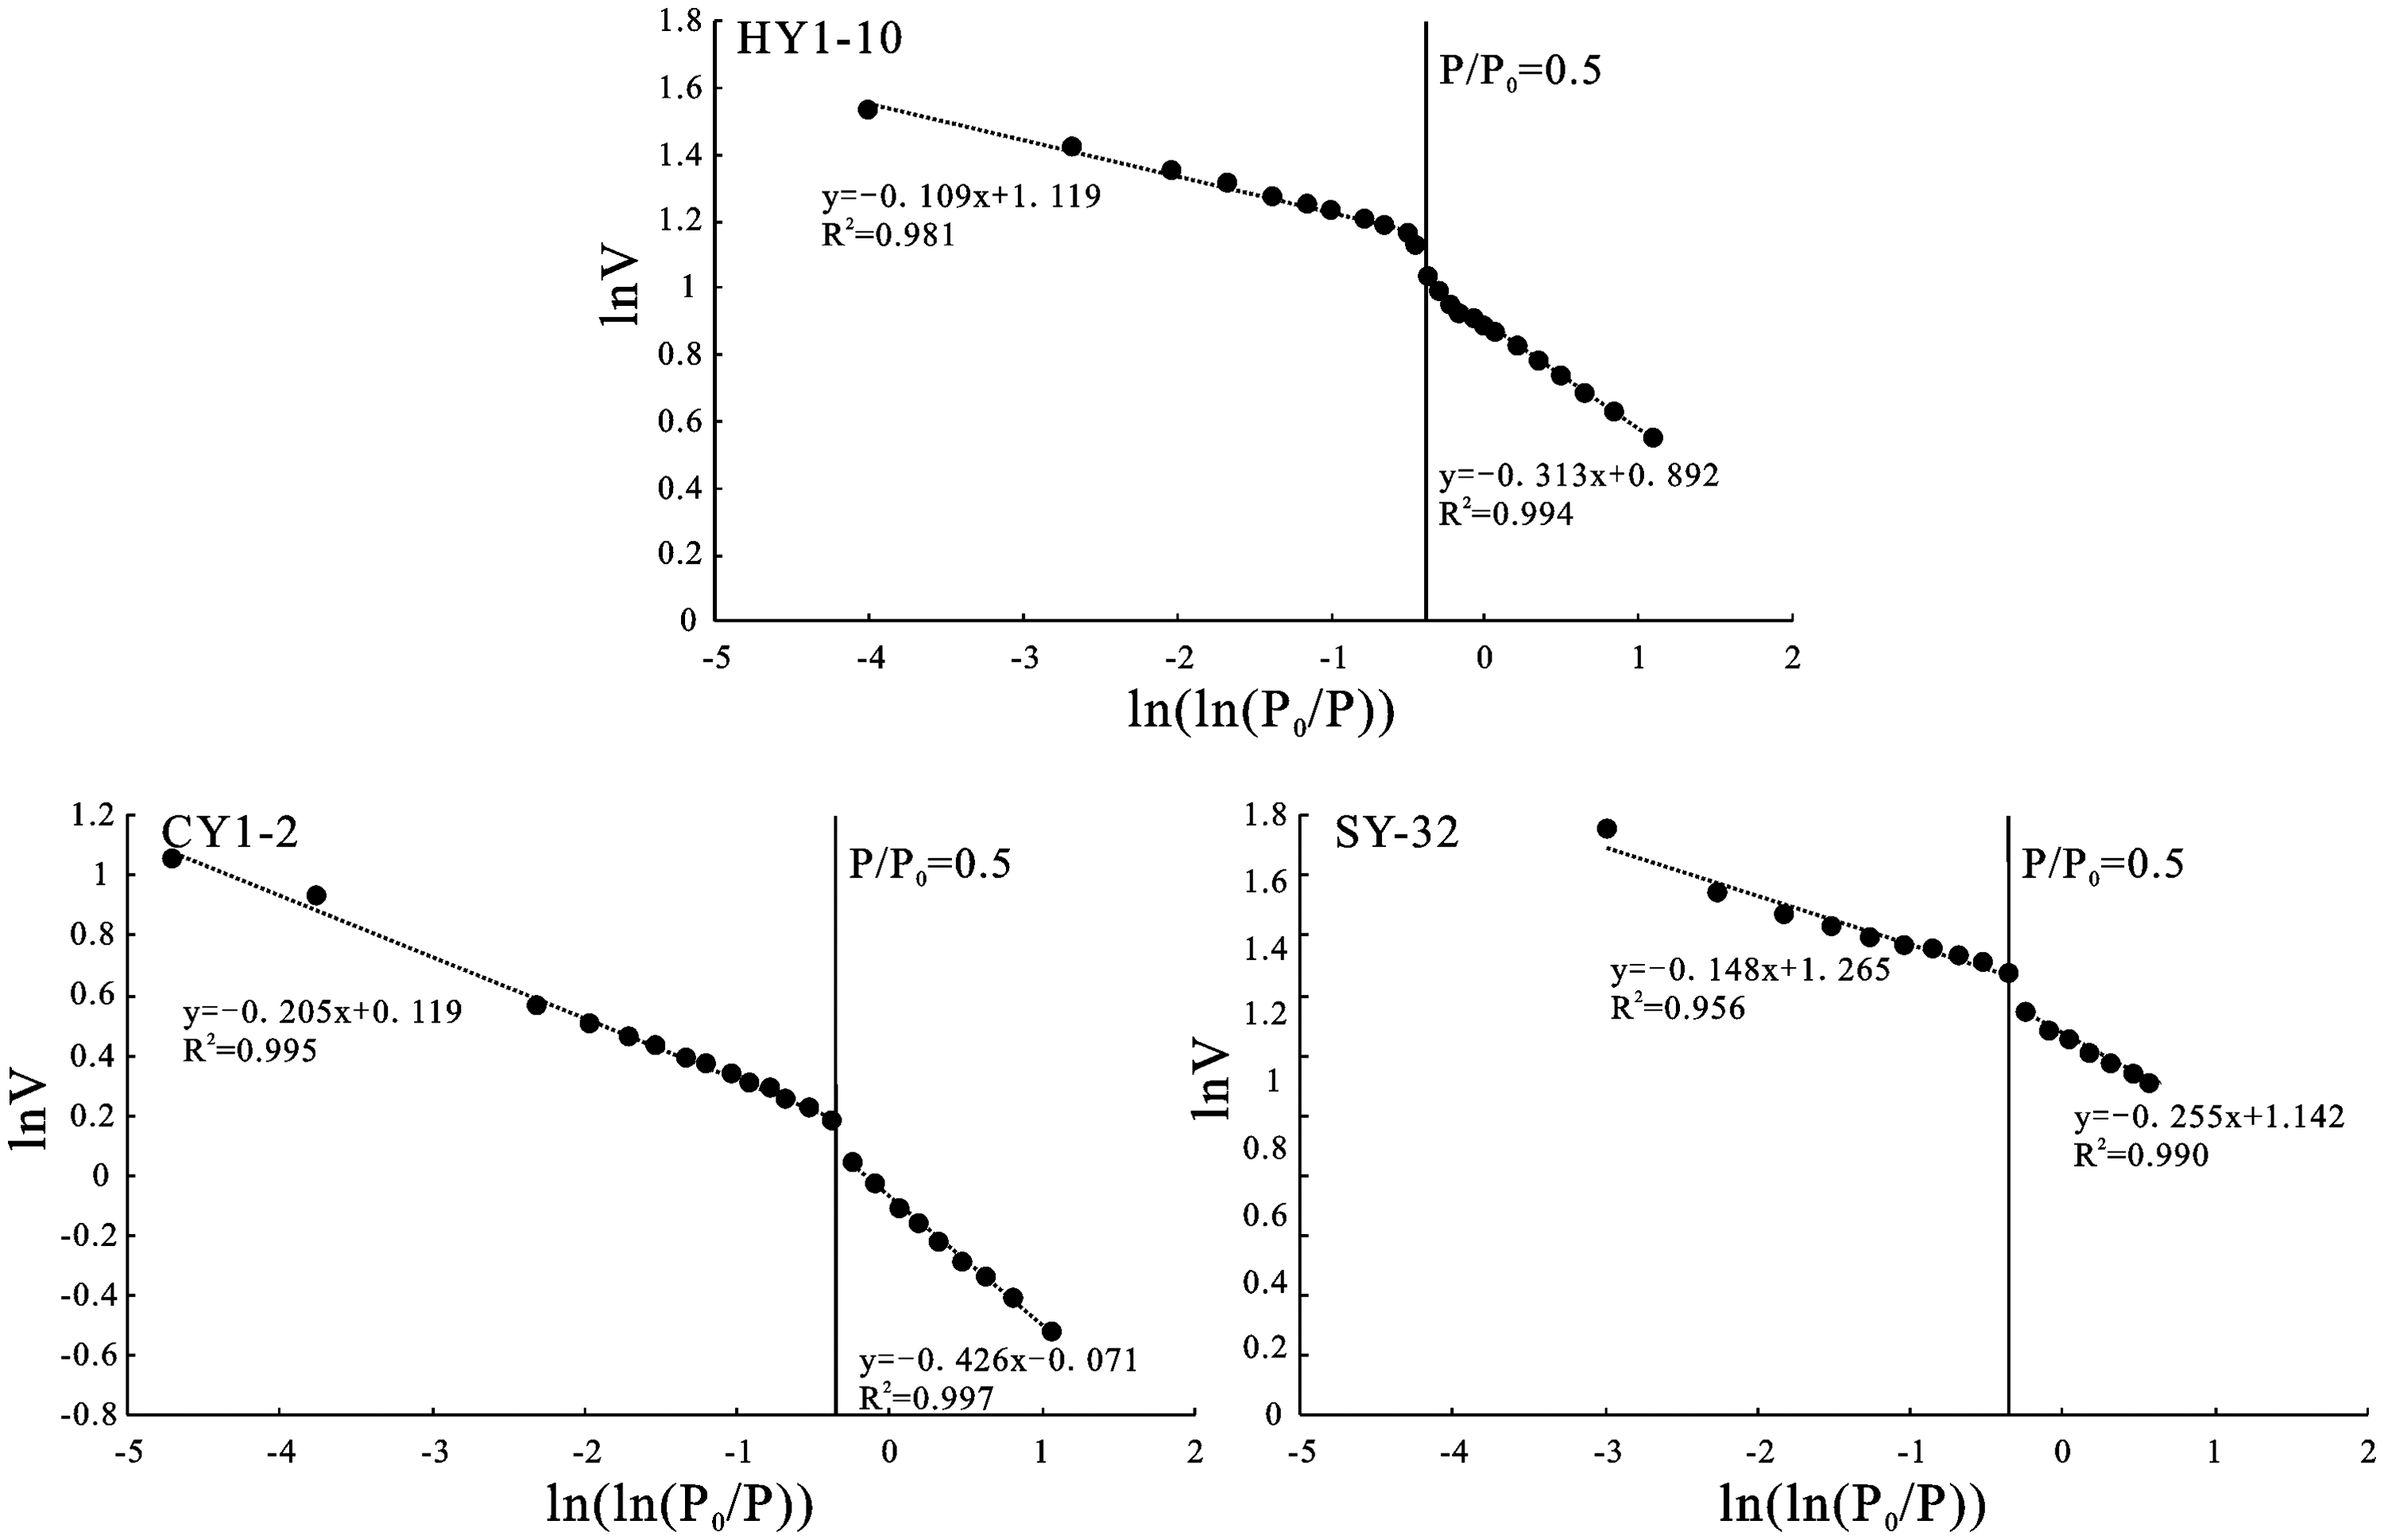
The results of fractal dimensions from sample HY1-10, CY1-2, and SY-32.
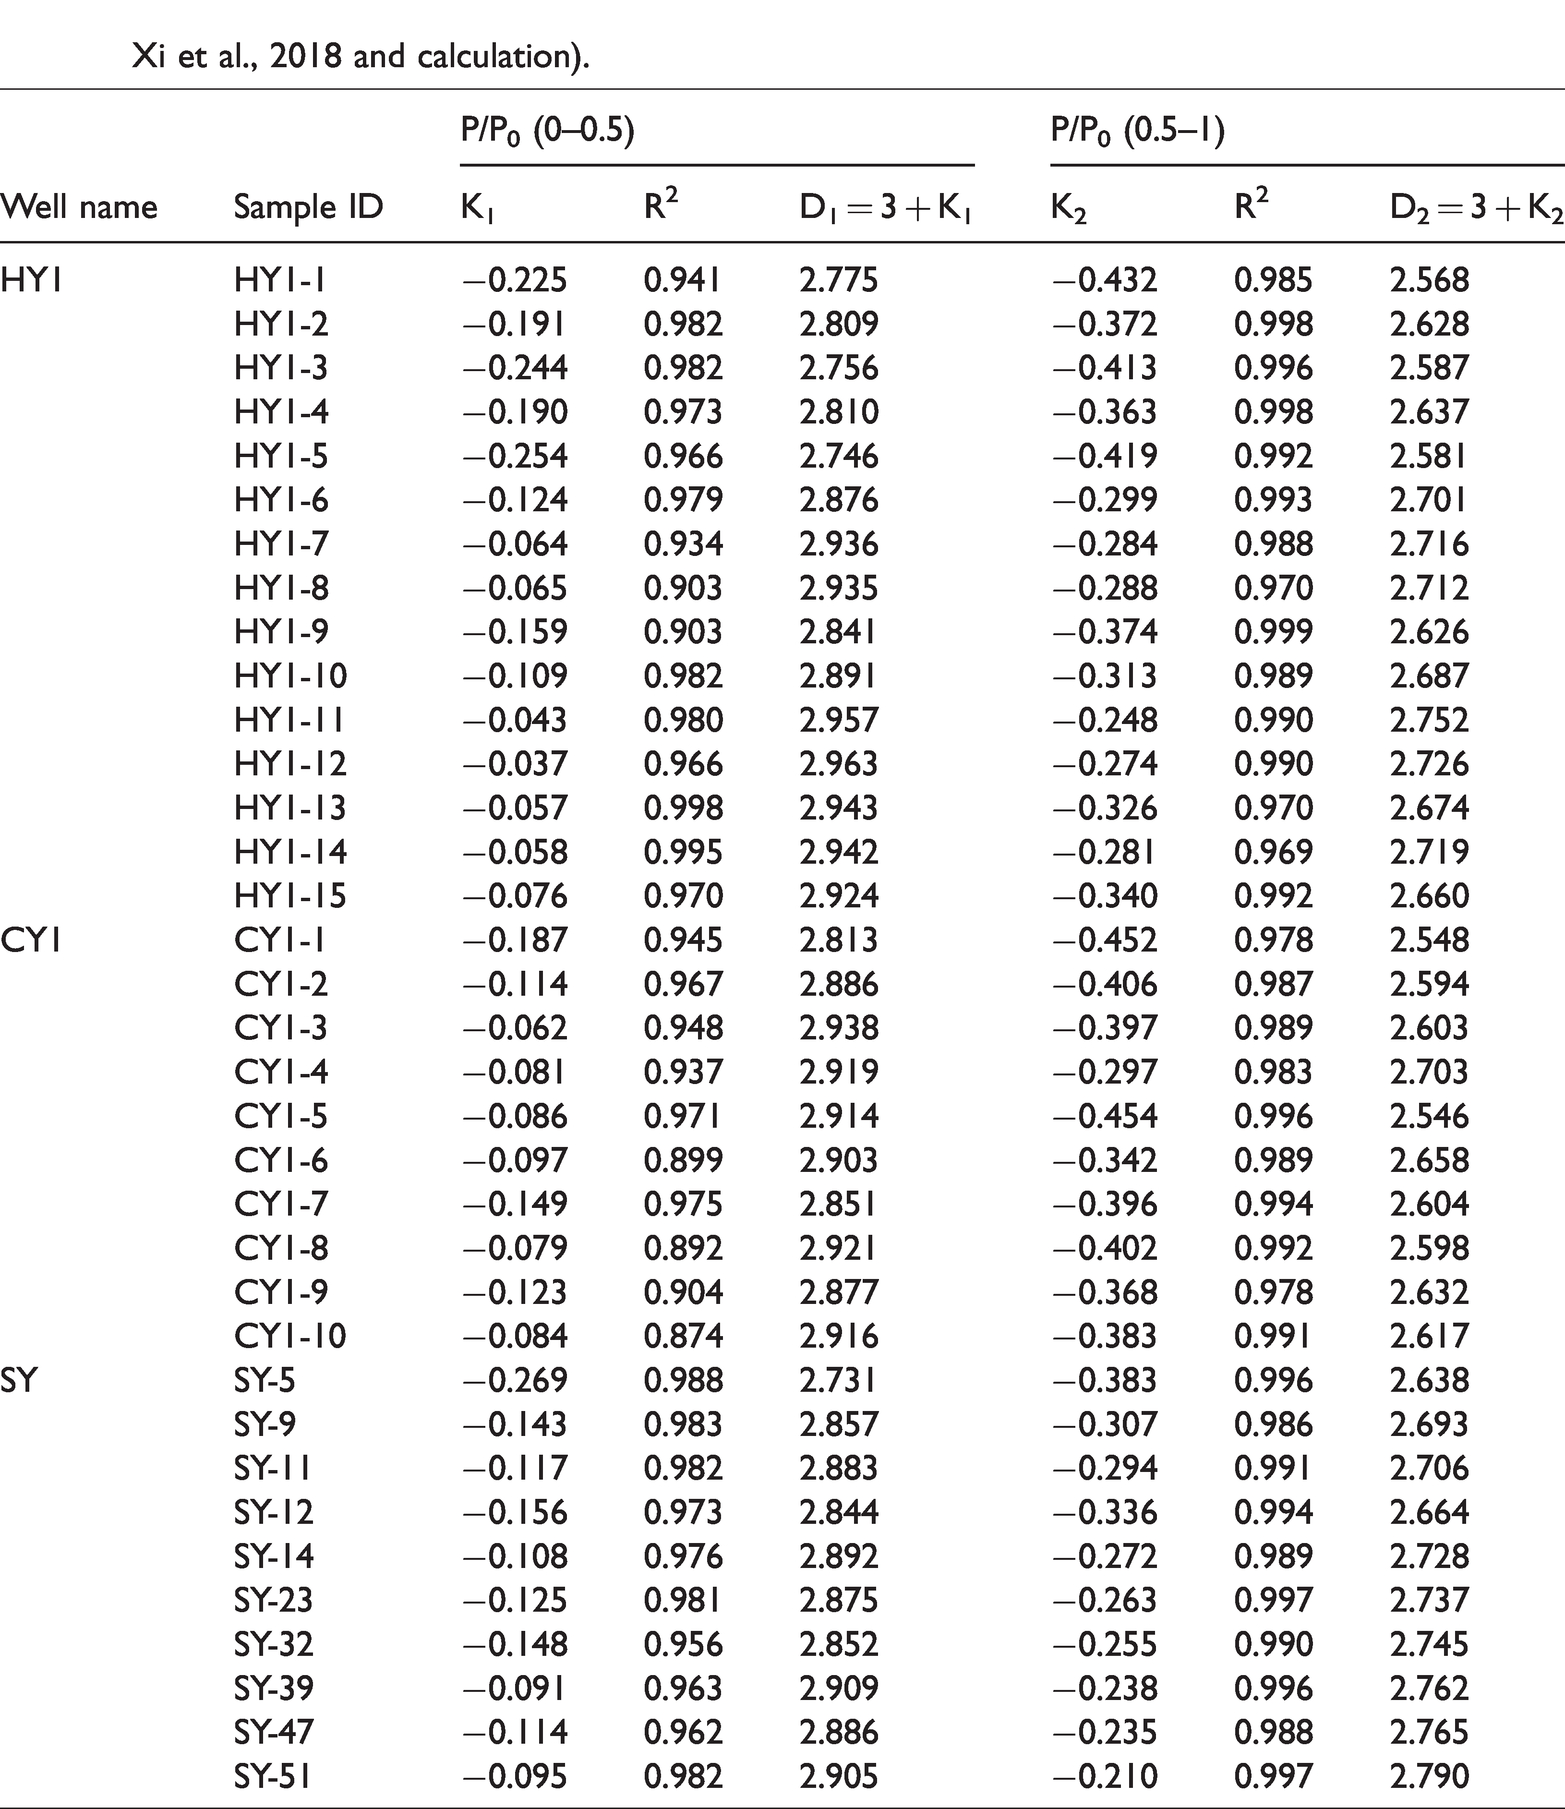
The process of N2 adsorption is governed by Van der Waals force under low pressure (Raymond et al., 2010; Tan et al., 2019), corresponding to fractal dimension D1, which reflects the surface roughness of pore microstructure (Wang et al., 2016). Meanwhile, at higher pressure, adsorption increasingly depends on multilayer adsorption even capillary condensation, and corresponding to fractal dimension D2, which used to define the pore microstructure irregularity (Wang et al., 2016). All core samples can be seen in Table 2.
Fractal dimensions of Niutitang formation shale samples from well HY1, CY1, and SY (The data of SY from Xi et al., 2018 and calculation).
Low-pressure CO2 adsorption
In order to describe the features of micropores, the results of CO2 adsorption experiments from same samples are shown in Figure 9(a). There are abundant micropores in the samples based on Figure 9(a) and the dramatic increase of adsorption capacity from Figure 7(a) at very low pressure. SSA and TPV of micropores from HY1-11 and CY1-5 sample are 10.58 m2/g, 2.05 × 10⁻³ cm3/g and 3.64 m2/g, 0.98 × 10⁻³ cm3/g respectively. Compare with the sample with total 27.54 m2/g, 20.07 × 10⁻³ cm3/g and 7.35 m2/g, 11.60 × 10⁻³ cm3/g, micropores respectively account for 38% and 49.5% on SSA, and 10.2% and 8.4% on TPV. It is easy to find that micropores can provide more contribution on surface area, but its volume is limited. According to DFT model, pore distribution features of micropores can also be shown in Figure 9(b). There are many micropores distributed between about 0.5 nm and 0.9 nm, and the distribution of more than 1 nm micropores is not very clear. Micropores cannot be ignored on shale gas adsorption in consideration of CH4 with 0.38 nm diameter.
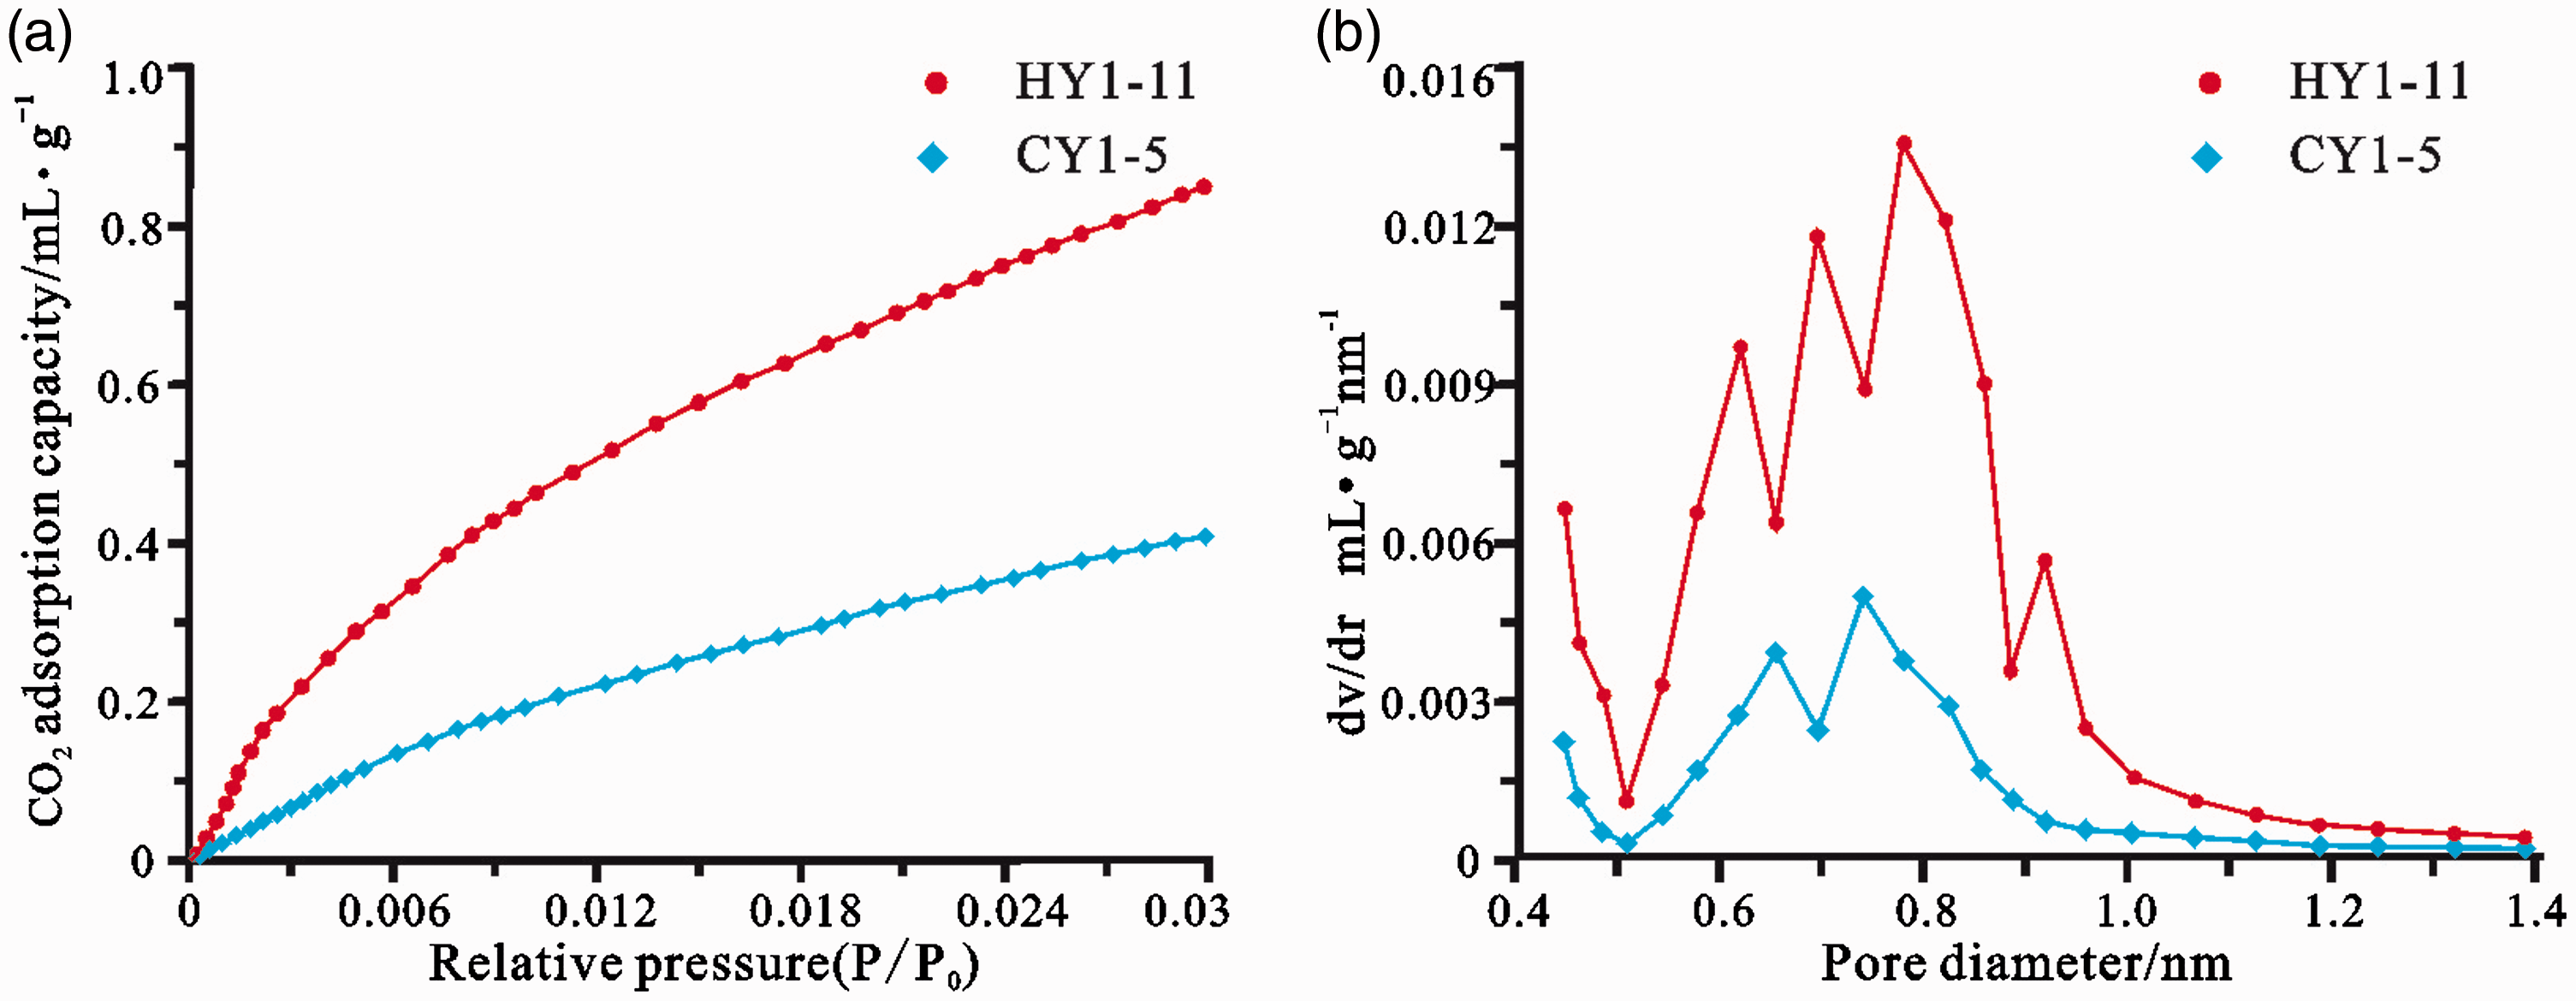
The result of CO2 adsorption experiment. (a) CO2 adsorption isotherms of same shale samples with low pressure from HY1 and CY1 and (b) their pore size distribution.
CH4 adsorption experiments
The features of CH4 adsorption experiments from same samples are shown in Figure 10(a). At a constant temperature of 30°C, the CH4 adsorption curve reveals that under low pressure, the adsorbing capacity rapidly increases. Based on regression analysis of the measured data, it can be shown that Langmuir adsorption is constant and directly reflects the gas storage of shale reservoir. Langmuir adsorption constants of all samples are also shown in Figure 10(b) and (c). The adsorption curves indicate that most CH4 is adsorbed under lower pressure, so higher Langmuir pressure means the gas is easier to extract and is better for shale gas exploration (Clarkson and Bustin, 2000). Langmuir volume is also responding to pore adsorption abilities. All datum has been shown in Table 1, HY1 is generally high than CY1 on Langmuir pressure and volume, and then SY too (Xi et al., 2018). HY1 certainly performs better than CY1 and SY in this regard, indicating the results from N2 experiment is in accordance with CH4 adsorption.
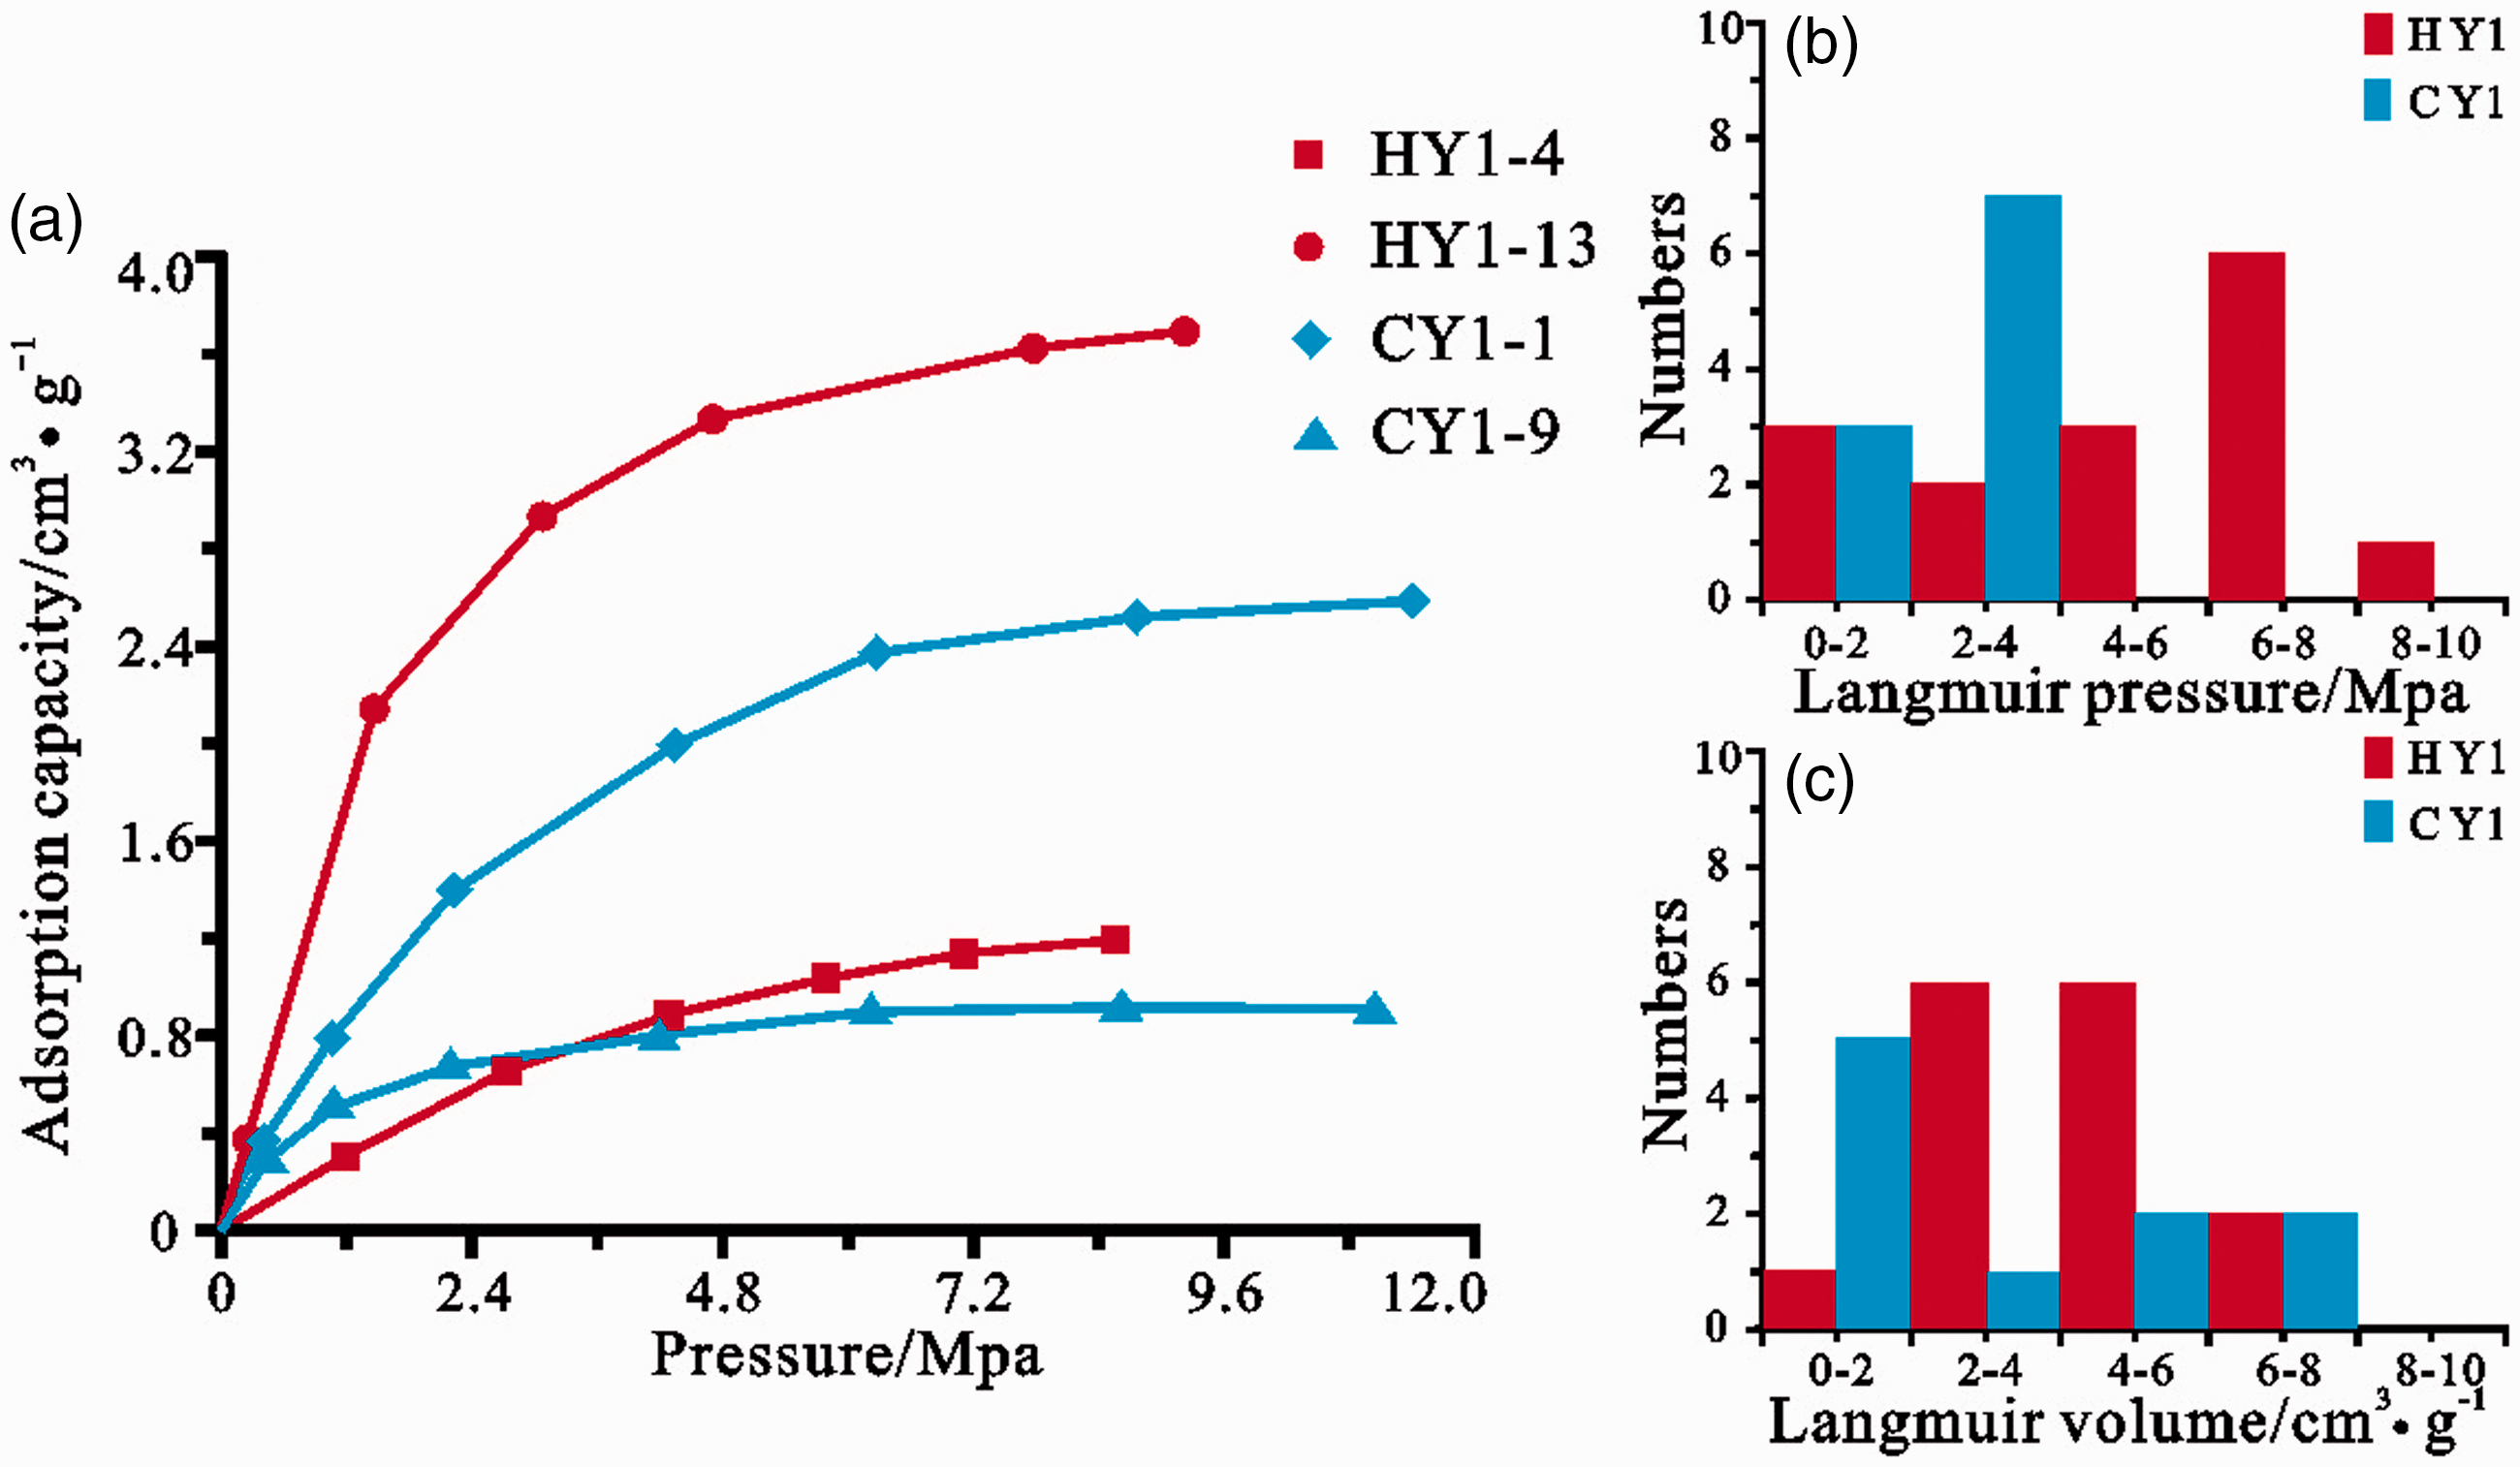
The results of isothermal CH4 adsorption. (a) The isothermal curves of samples from HY1 and CY1; (b and c) The all sample distribution features of Langmuir pressure and volume).
Discussion
Fractal dimension analysis
Fractal dimension is a good tool to describe the pore characteristics. According to Figure 11, there is a significant correlation between D1 and D2 in well HY1 and SY. The function of pore roughness and irregularity is consistent in the two different phase of gas adsorption (0 < P0/P < 0.5 and 0.5 < P0/P < 1), which is affected by Van der Waals force and by multilayer or capillary condensation (Gu et al., 2019). The fractal dimensions of these wells in the study area are similar, and the value of fractal dimensions are generally high, indicating that the degree of pore structure complexity, the pore surface roughness and the diversity degree of pore shape are all high. We also find that D1 has more good relationship with Langmuir volume which respects the adsorption of pores, even if CY1 performs badly with low Langmuir volume (Figure 12(a)). Meanwhile, there is no correlation between D2 and Langmuir volume (Figure 12(b)). It is easily to conclude that the abilities of gas storage are more dependent upon the surface roughness of the pore, but not the irregularity.
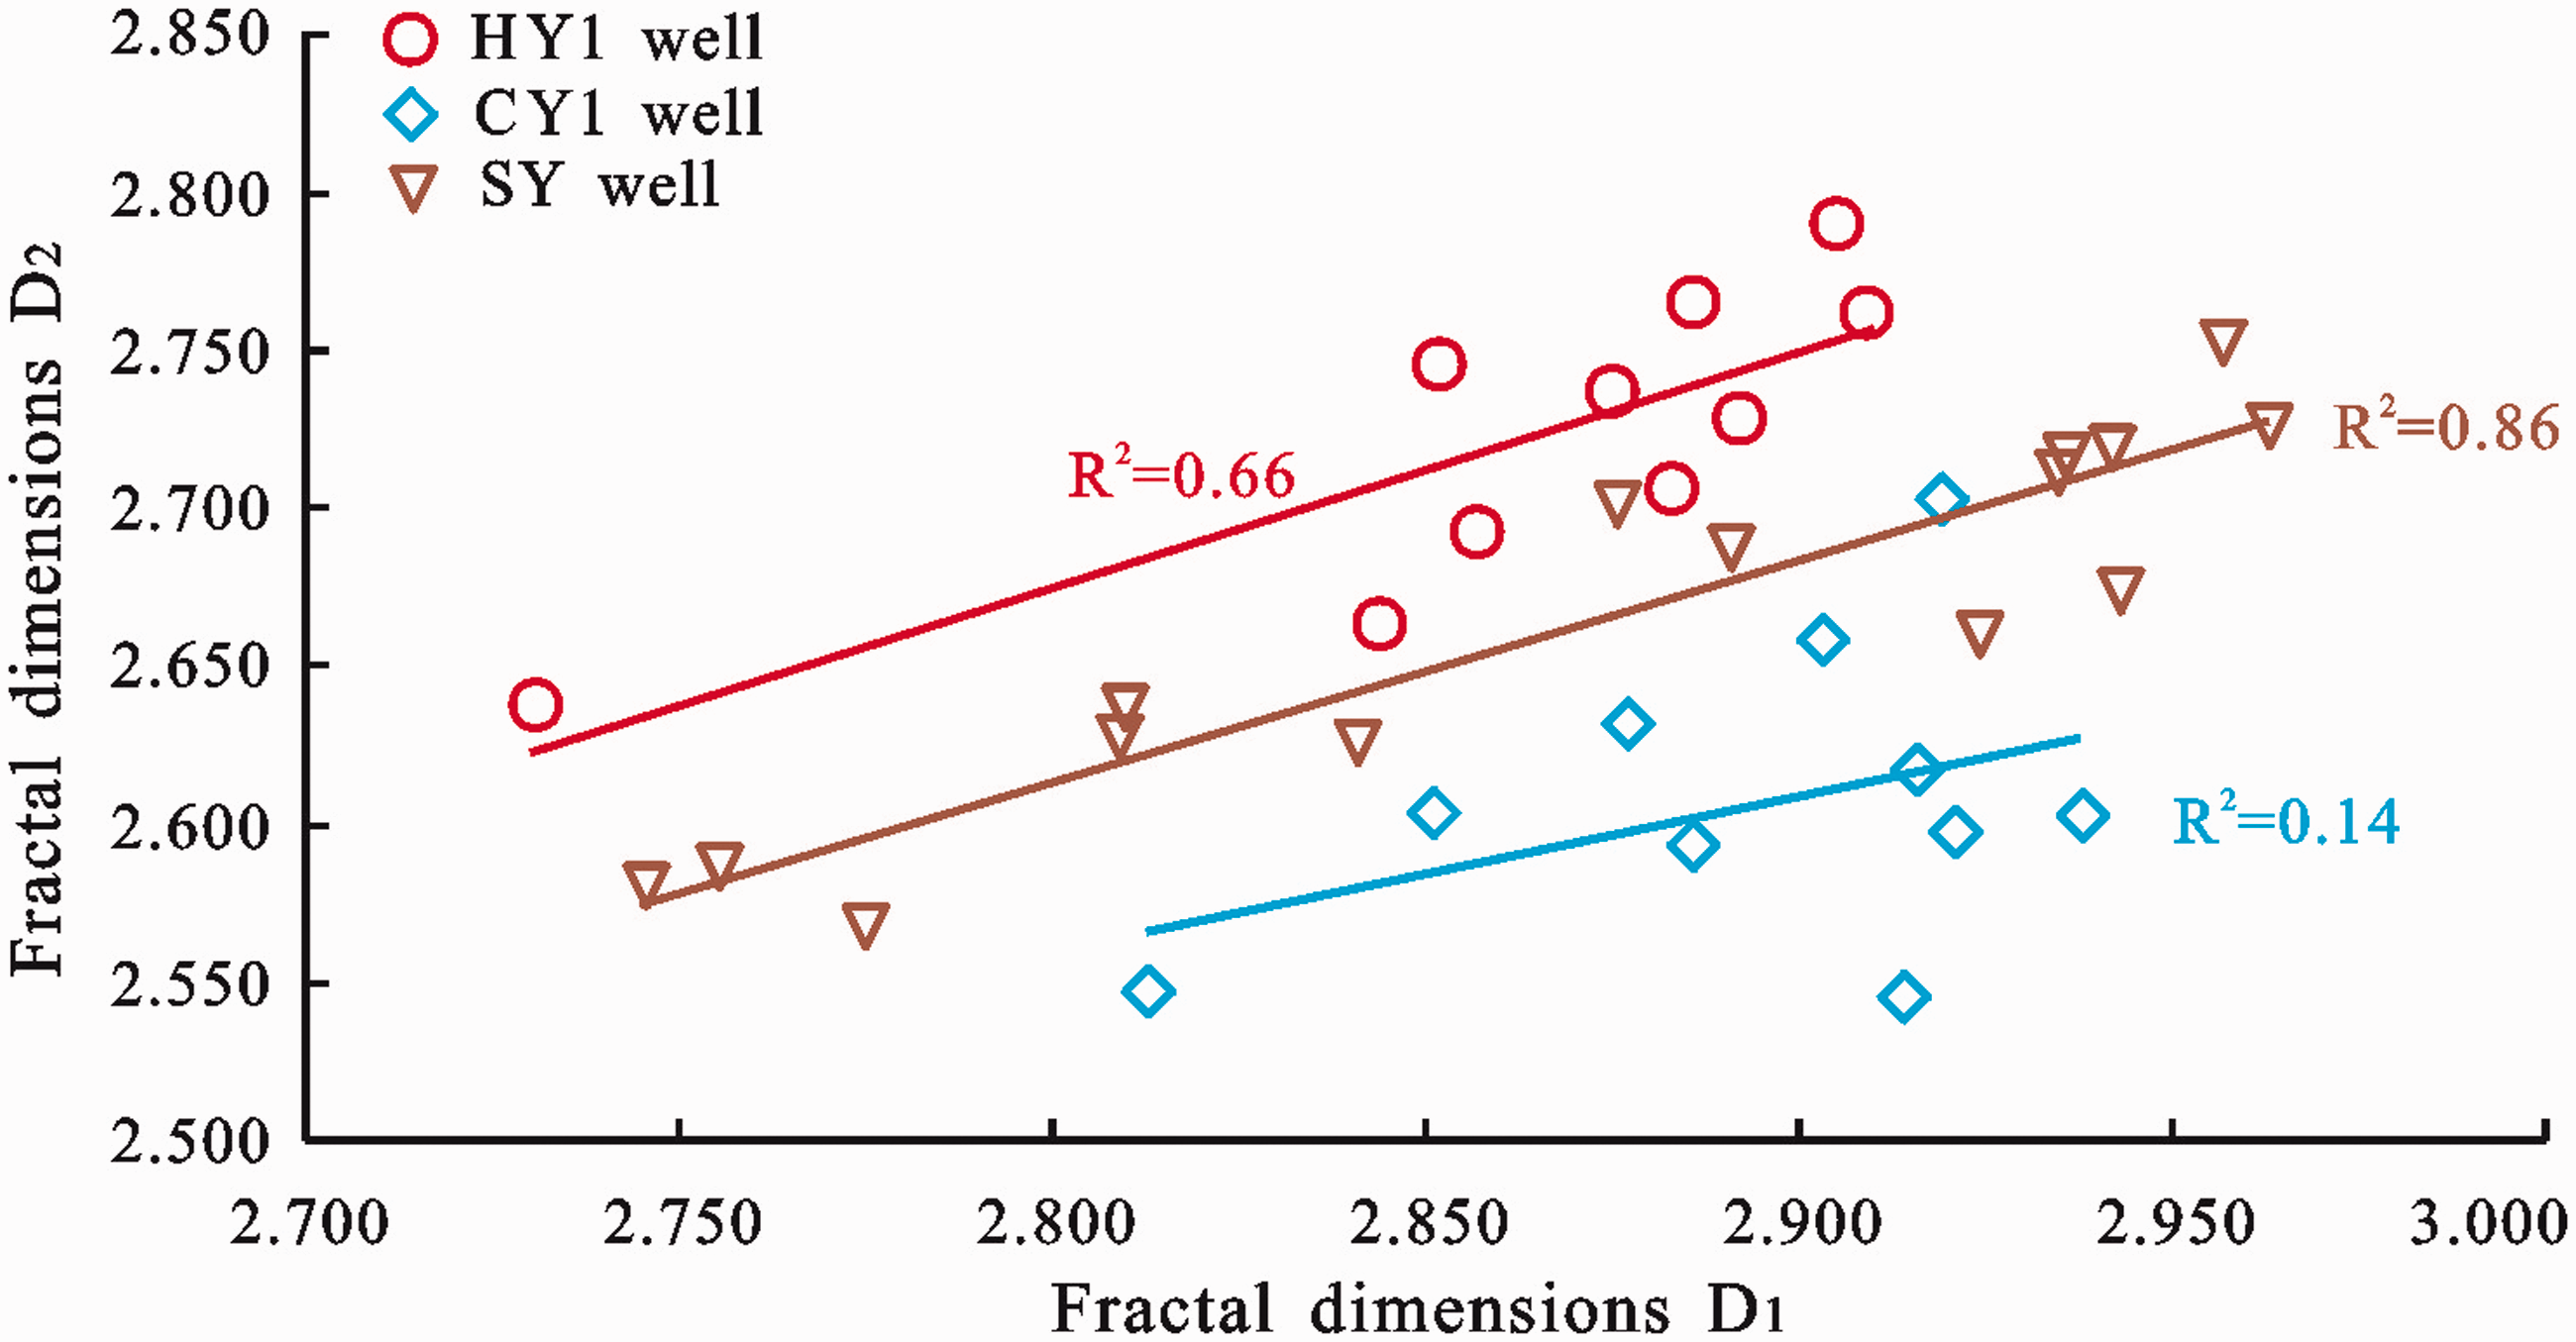
The relationship between fractal dimensions D1 and D2 from well HY1, CY1, and SY.
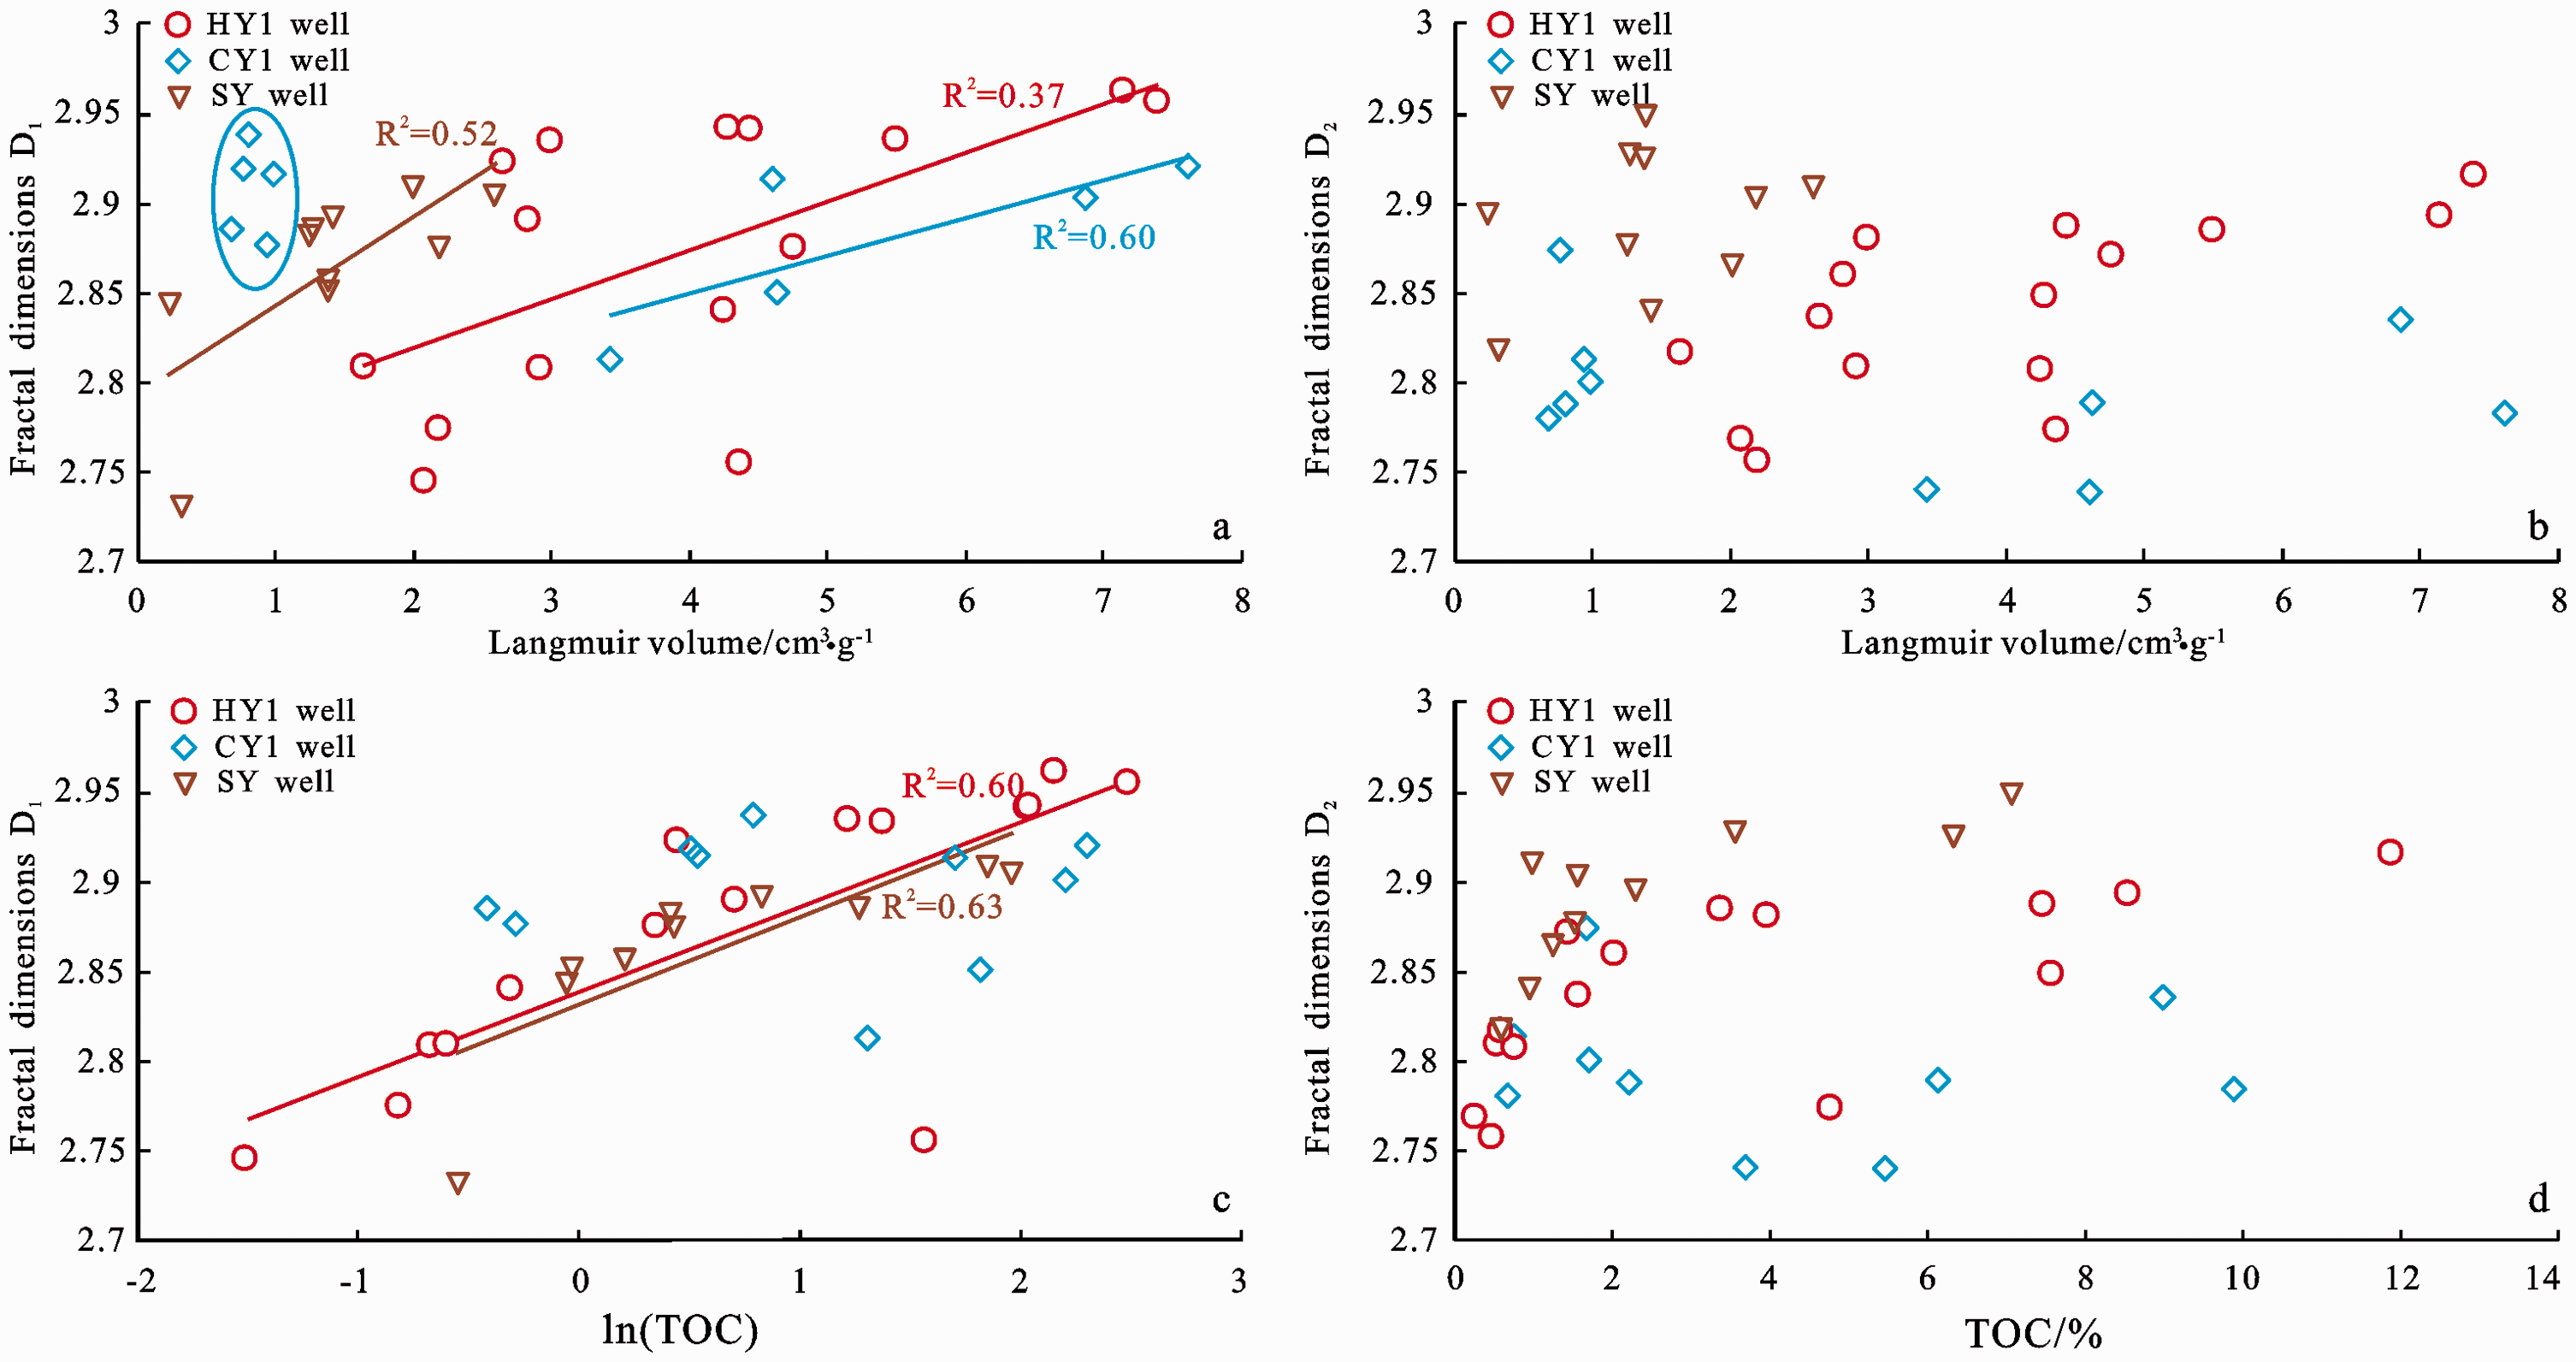
The relationship between fractal dimensions and Langmuir volume, TOC.
Furthermore, excepting for CY1, we also find that the relationship between TOC and fractal dimensions is similar with the relationship between Langmuir volume and fractal dimensions in. D1 has strong correlations with TOC but D2 has not (Figure 12(c) and (d)), indicating that much surface roughness of pores is mainly caused by OM. Actually, there is a strong positive relationship between ln(TOC) and D1, which means that the effect by TOC is more sensitive within a lower range. At the same time, pore irregularity may be impacted by more additional factors. Pore irregularity seems formed complex in the pore system of the shale. It is hard to express influence on its adsorption, but this influence will be the focus of our future study.
Influence of shale composition on pore characteristics and gas adsorption ability
The pore properties of shale have been analyzed in multiple in this paper. The permeability of the shale is extreme low with large variances as shown in Table 1. The permeability has little relationship with other parameters and is hard to help us understanding the pore microstructure and the gas adsorption. Actually, because of nanoscale pores, the behavior of gas flow in the shale does not follow the Darcy law and cannot be confirmed until now (Kazemi and Takbiri-Borujeni, 2015). The abilities of gas adsorption become more important in this situation. Meanwhile, there is a relatively high correlation between the parameters from CH4 and N2 experiments (Figure 13), indicating that these parameters are valid and are consistent reflections of the characteristics of complex pores in HY1, CY1, and SY wells.
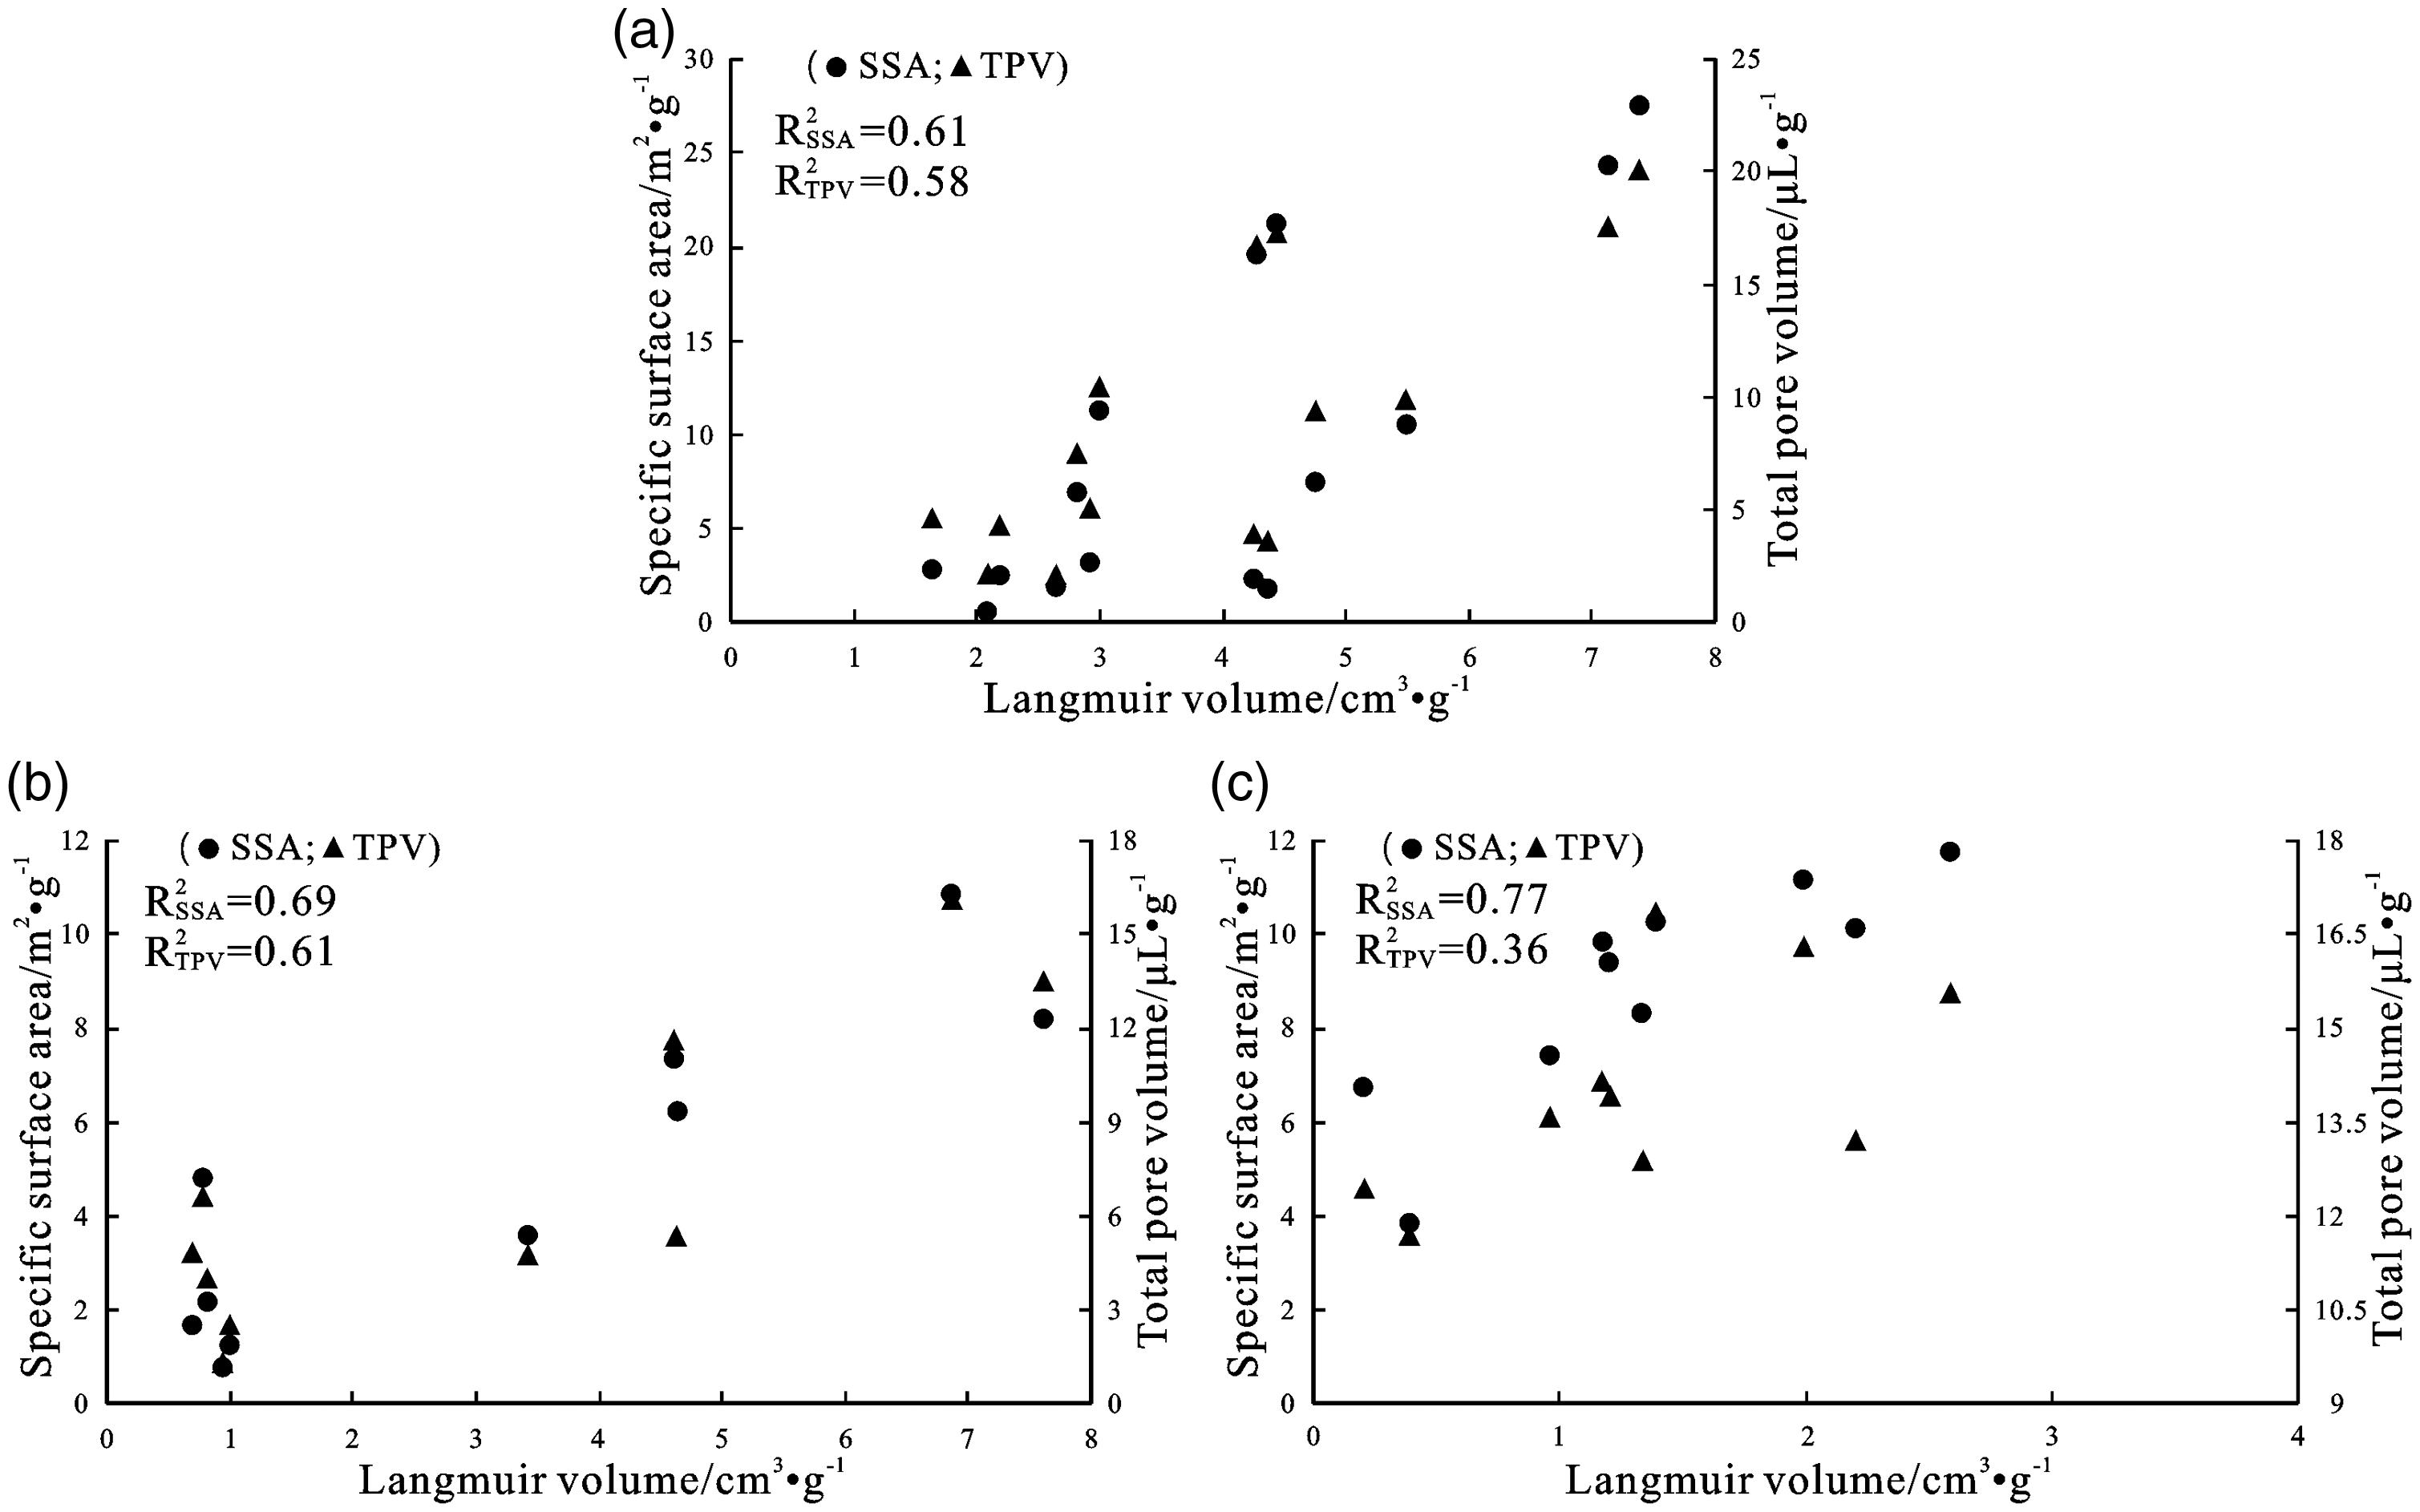
The correlation parameters analysis through N2 and CH4 experiments. (a) HY1 well; (b) CY1 well; and (c) SY well.
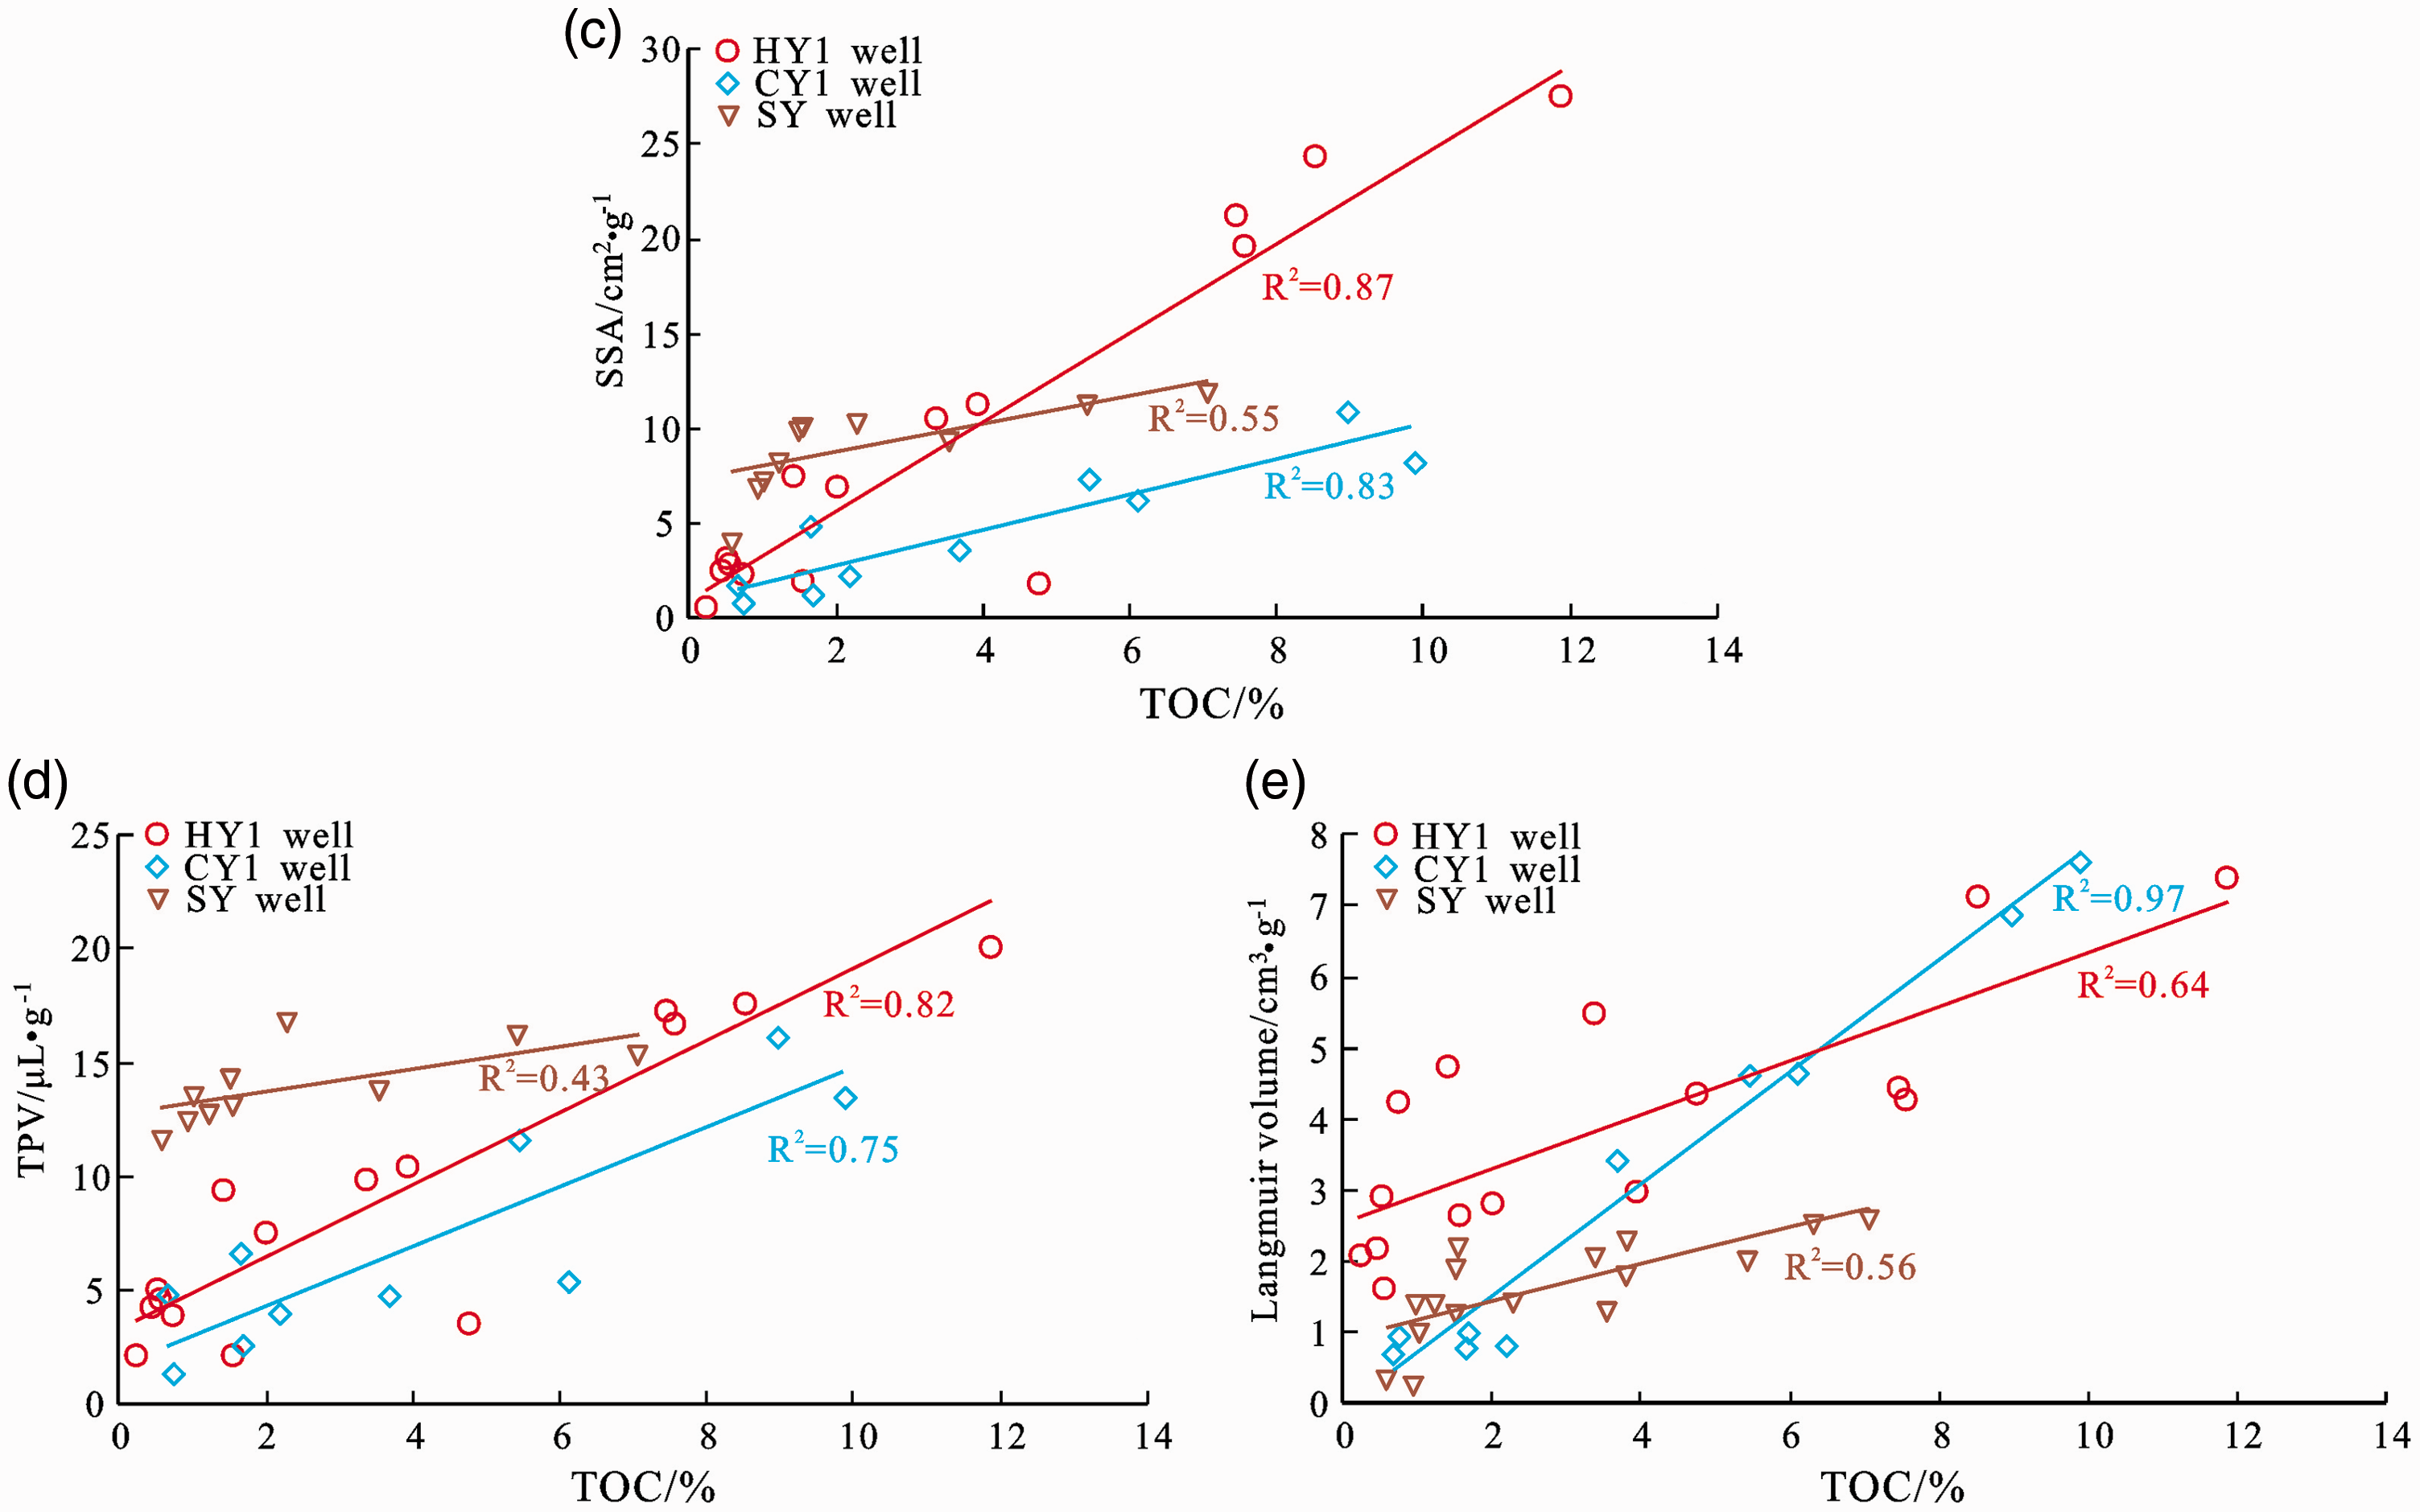
The correlation analysis between TOC and SSA, TPV, Langmuir volume.
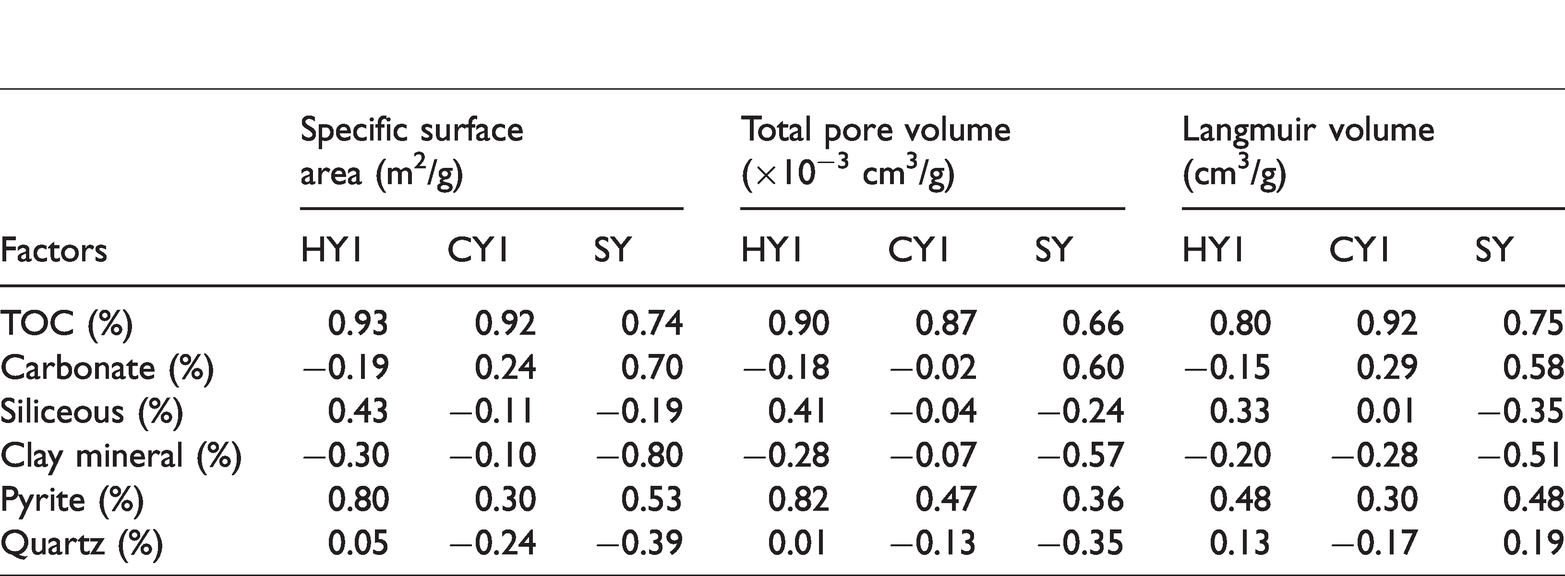
Based on the testing data of the samples, we build the relationship with correlation coefficients in well HY1, CY1, and SY (Table 3). We can find that, except clay mineral and pyrite, the correlation between different mineral and the pore parameters is very weak, and meanwhile TOC has strong correlation with the pore parameters (Figure 14). There is some negative correlation between clay minerals and the pore parameters, even if its correlation coefficient is not high. Pure clay minerals have large SSA (Saidian et al., 2016). However, the Niutitang shales with relatively low clay mineral content do not demonstrate an increase in contribution to SSA, TPV, and Langmuir volume from Table 3. There is a similar situation happened in West Virginia and Pennsylvania (Song et al., 2019). This phenomenon may be attributed to the effectiveness of the pore space, which the most pores from clay minerals are closed and useless.
The correlation analysis between the pore parameters of the gas adsorption and total organic carbon (TOC), mineral content.
Instead, the influence of OM rich shale on microstructure development cannot be negligible (David, 2007; Zhang et al., 2012). Considering TOC is generally high in the study area (Table 1), and the thermal evolution of OM is also at a high maturity stage (Huang et al., 2019), the organic-matter pores with kerogen macromolecular aggregation state are also widely developed (Luo et al., 2016; Zhou et al., 2019), and can contribute a large surface area and pore volume (Figure 14(a) and (b)). Meanwhile, OM is the material basis for gas adsorption, and has a strong adsorption ability and ample space for gas storage because of abundant organic-matter pores (Curtis et al., 2012). There is also a strong positive correlation between TOC and Langmuir volume (Figure 14(c)). Therefore, the abundant OM in the shales is very important to improve the gas adsorption of shale reservoir in many ways. The Niutitang shales may be an OM-hosted pore system (Milliken et al., 2013).
There is high enrichment of pyrite in the three wells of the Niutitang shales (Table 1). We also find that pyrite content has a positive correction with different pore parameters from Table 3. Some scholars (Chalmers and Marc, 2007; Loucks et al., 2012; Zeng et al., 2016) concluded that pores associated with pyrite can be classified into: (i) pores along the boundaries between pyrite and OM or other grains, (ii) pores in OM-filled pyrite framboids, and (iii) interparticle pores interspersed among pyrite crystals, which we have seen in Figure 6(d). In fact, all pores associated with pyrite can be found under FESEM, due to enrichment of pyrite. Framboidal pyrite, many nanometer pyrite microcrystals with same size and shape coming together (Wilken et al., 1996), cannot be affected by burying and have large SSA and TPV (Cao et al., 2018). Considering with pyrite is easy to dissolve and is closely related to OM, we believe that pyrite offers much contribution to the ability of gas adsorption. Such as the main types of shale pores in Barnett shale are intergranular pores among pyrite and organic-matter pores (Loucks et al., 2009).
Conclusion
The black shale in the lower Cambrian Niutitang formation, NW Hunan region, mainly includes siliceous and clay-rich siliceous components with high brittle mineral. TOC content of the shales is generally high, with an average of 3.84%. The permeability is extremely low ranging from 0.46 × 10⁻³ mD to 7.13 × 10⁻³ mD. The pores can be identified into mineral matrix pores, organic-matter pores, and fracture pores. The pores can be further classified according to their shape features and forming mechanism. Macropores, mesopores, and micropores all exists in the shale samples. Mesopores are the largest contributor to pore volume and widely distributed. Meanwhile, micropores provide more contribution on surface area, but their volume is limited. Depth has little effect on the adsorption of the shale in the study area. SSA, TPV, and Langmuir volume are strongly related and valid among the three wells in the study area. According to fractal dimensions, surface roughness of the pore is accordance with their irregularity in two different gas–solid interactions: Van der Waals force, and multilayer or capillary condensation. Surface roughness of the pore can lead to more gas storage and is mainly affected by TOC. Abundance of OM is a key factor to improve the gas adsorption in many ways. In comparison to TOC, the influence by the minerals is weak, but pyrite can offer much contribution to the ability of gas adsorption.
Footnotes
Acknowledgements
The authors would like to thank to the reviewers and editors for their suggestions. The author Yanran Huang also acknowledges the support of the program of China Scholarships Council (No. 201809480006).
Declaration of conflicting interests
The author(s) declared no potential conflicts of interest with respect to the research, authorship, and/or publication of this article.
Funding
The author(s) disclosed receipt of the following financial support for the research, authorship, and/or publication of this article: This work is supported by the National Natural Science Foundation of China (No. 41603046) and the Natural Science Foundation of Hunan province (No. 2019JJ50178).