
Abstract
Gas from the gasification of pellets made from renewable sources of energy or from lower-quality fuels often contains a number of pollutants. This may cause technical difficulties during the gas use in internal combustion gas engines used for energy and heat cogeneration. Therefore, an adequate system of gas cleaning must be selected. In line with such requirements, this paper focuses on the characterization and comparison of gases produced from different types of biomass during gasification. The biomass tested was wood, straw, and hay pellets. The paper gives a detailed description and evaluation of the measurements from a fix-bed gasifier for the properties of the produced gases, raw fuels, tar composition, and its particle content before and after the cleaning process. The results of elemental composition, net calorific value, moisture, and ash content show that the cleaned gases are suitable for internal combustion engine-based cogeneration systems, but unsuitable for gas turbines, where a different cleaning technology would be needed.
Highlights
Gas composition from three types of biomass fuels are subjected to quality assessment Composition and content of tars before and after the cleaning process were measured Gas cleaning process was evaluated considering its use in internal combustion engine-based cogeneration systems
Introduction
World energy consumption is rising, and surely, it will not be limited by more efficient activities and technologies. This is a reason for huge interests in new and cheaper sources of energy, alternative fuels, energy recovery, and finally renewable energy sources, including biomass (Demirbas, 2004; Honus et al., 2016a, 2016b; Knoef, 2012; Saidur et al., 2011; Sikarwar et al., 2017). This leads to an increase in new installations using local fuel sources as well as various types of process waste. Wastes are increasingly being used to produce electricity and heat (Bhoi et al., 2018; Oboirien and North, 2017; Zheng et al., 2018). A promising alternative to direct combustion is gasification as it has a high energy efficiency and improved environmental impact (Kirkels and Verbong, 2011; Pereira et al., 2012; Xue et al., 2014). In the gasification process, solid fuels are converted into gas under high temperatures (around 750–1000°C) through partial oxidation (Karl and Pröll, 2018; Susastriawan et al., 2017; Widjaya et al., 2018). The gas mainly consists of CO, H2, CH4, N2, and CO2 mixture (Kuo et al., 2014). In dependence on the type of biomass fuel, the gas contains different amounts of impurities such as tars, particulates, nitrogen, and sulfur compounds (Abdoulmoumine et al., 2015; Filippis et al., 2015; Sharma et al., 2008; Shen et al., 2016; Woolcock and Brown, 2013).
From all impurities contained in raw gas, tars are the most problematic secondary products. Tars can be described as complex mixtures of organic molecules, hydrocarbons containing single to five-ring aromatic compounds, and other oxygen-containing organic molecules (Filippis et al., 2015). These compounds condensate or polymerize into more complex molecules resulting in significant problems such as corrosion, clogging, and fouling in downstream equipment (pipes, filters and heat exchangers or engines, and turbines) (Richardson et al., 2012; Shen et al., 2016). In addition, tar presence can lead to deactivation of catalyst in refining process (Shen et al., 2016; Woolcock and Brown, 2013). Amount and composition of tars depend mostly on fuel composition, processing conditions, especially temperature, pressure, type and amount of oxidant, and fuel retention time (Devi et al., 2003; Torres et al., 2007; Woolcock and Brown, 2013). Tar tolerance limit varies depending on syngas applications; the limit is ∼500, ∼100, and 5 mg mN−3 for compressors, internal combustion systems, and direct-fired industrial gas turbines, respectively (Filippis et al., 2015). Hence removal of impurities is of great importance in gas production, especially when the produced gas is later used in gas engines and turbines (Balas et al., 2014; Iluk et al., 2015).
Tar removal processes can be divided into primary and secondary methods. The primary methods consist of all measures occurring at gasification step to prevent tar formation or cause its conversion (Devi et al., 2003). The secondary group includes mechanical methods (cyclone, ceramic filter, fabric filter, rotating particle separator, electrostatic filter, and wet scrubber) or tar cracking thermally and catalytically (Devi et al., 2003).
The objectives of this paper are to evaluate syngas cleaning process and establish if application in an engine with internal combustion or in gas turbine is suitable. To be able to propose adequate solutions for the gas cleaning, this paper examines the composition of produced gas from gasification of three different types of biomass fuels. Spruce wood pellets were chosen as standard gasification material for comparison with other two fuels. Spruce wood is a common gasification material in the form of pellets or chips. The two remaining biomass fuels, straw and hay, were chosen as renewable energy sources of one-year renewability. The use of these fuel types has increased recently and can significantly reduce the global carbon emission and environmental pollution (Chen et al., 2019).
In addition to the research on gas composition, the paper focuses on the amount and composition of tar as well as solid particle content. Biomass fuels were characterized by elemental composition, net calorific value, moisture, and ash content for comparison with available literature.
Materials and methods
Gasification unit description
The gasification unit (Figure 1) consists of a fuel tank (0.7 m3), fuel delivery system (screw conveyer), gasification generator, high temperature filter, gas cooling device, scrubber, fan, and afterburning chamber for burning of produced gas. The unit is equipped with measuring sensors (temperature and pressure) connected to the control unit. This allows monitoring and recording all data from conducted tests in the control room. Gasification unit uses a generator with a fixed bed reactor, which operates under pressure. Gasification medium was air, and temperature in generator was 800°C. Fuel feeding speed was 21.8 kg/h, and amount of gasification medium (air) was calculated to be 33.2 mN3/h.
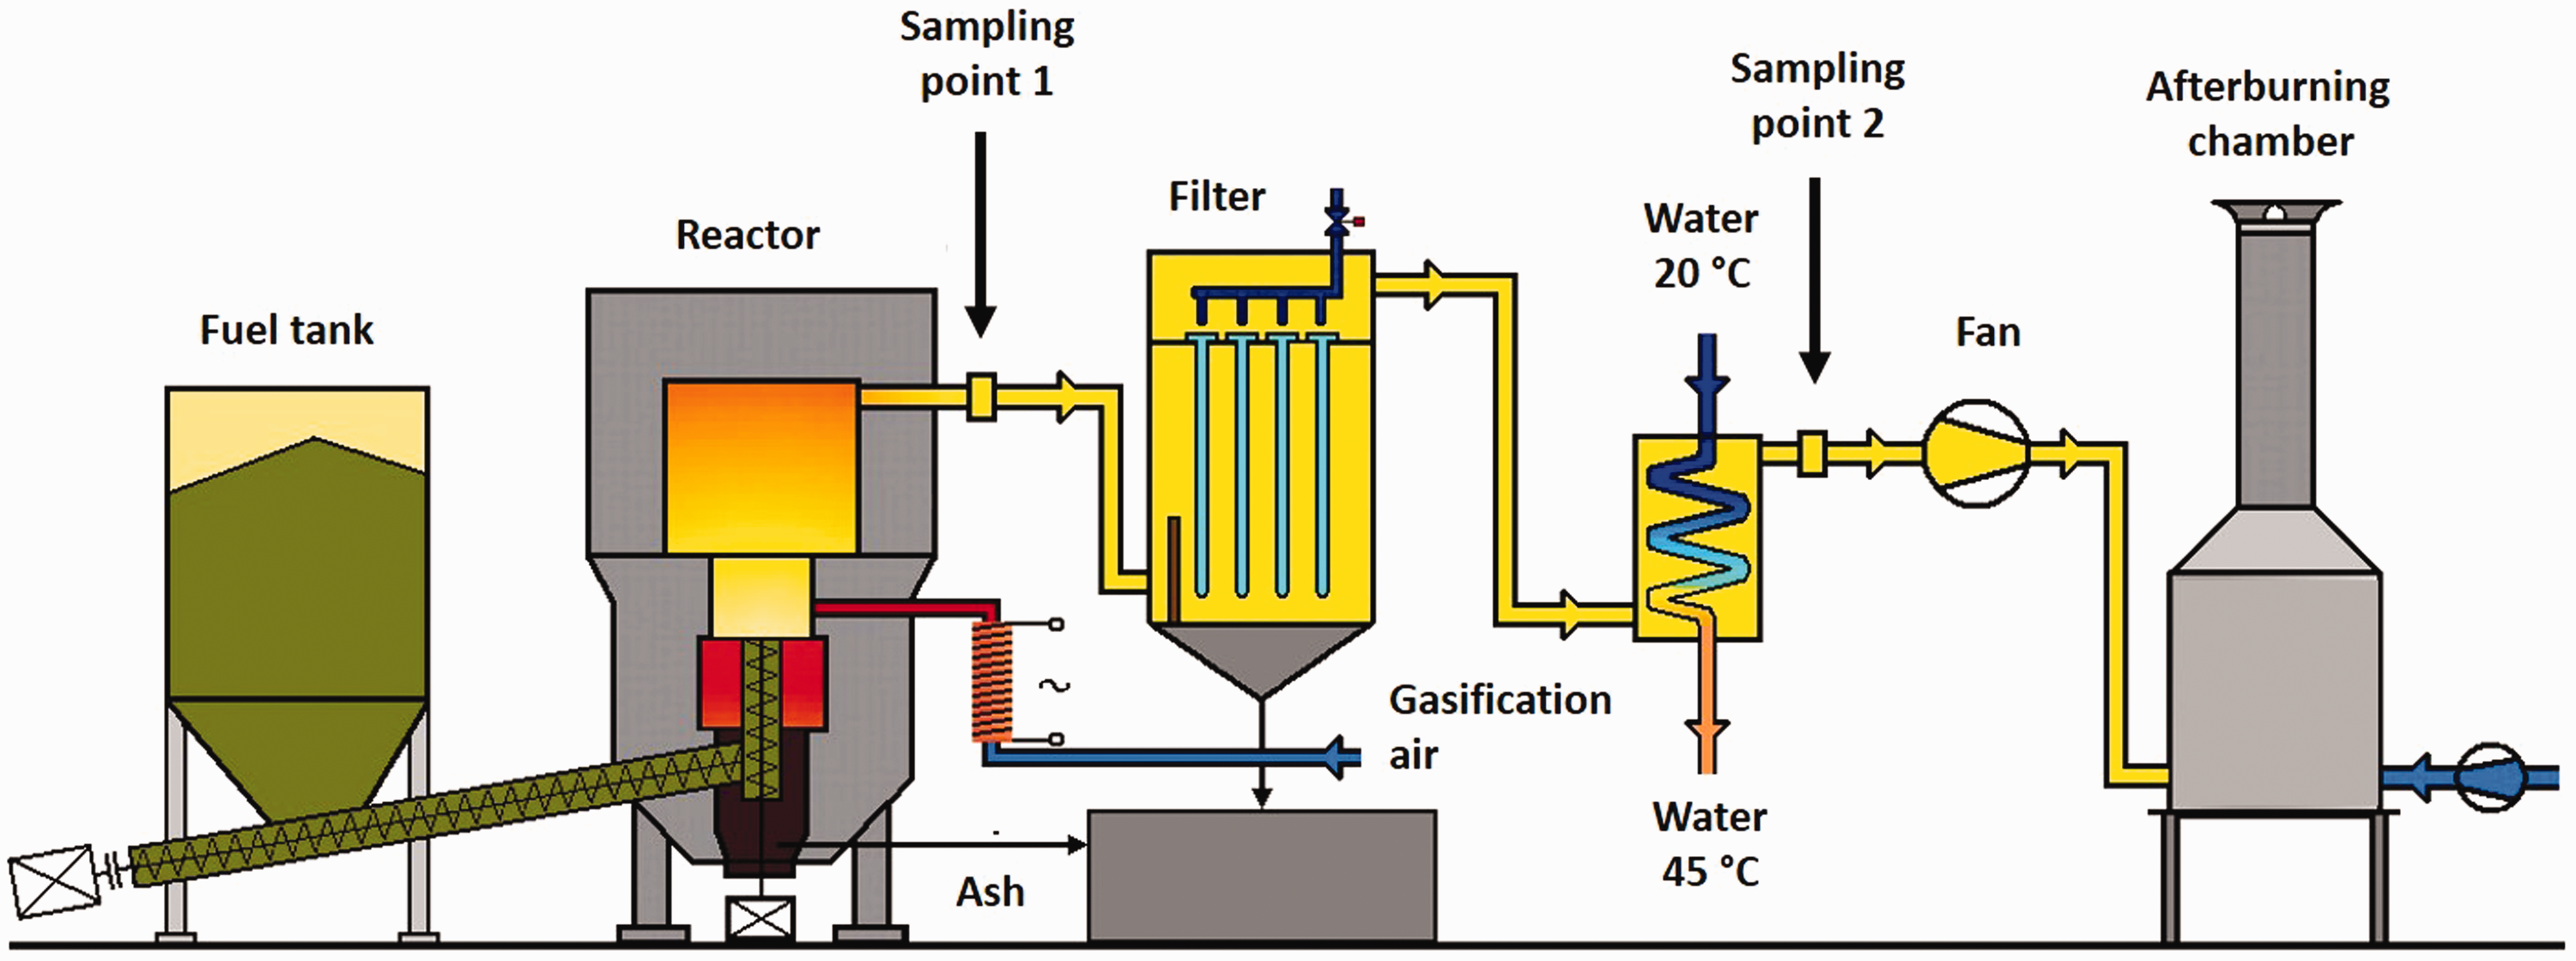
The gasification unit scheme.
The gasification process takes place in a fuel bed about 40 cm high. For uniform supply of gasification medium (air), there are four nozzles placed at bottom edges of the reactor. Edge-mounted nozzles allow good temperature distribution and high gasification stability.
Produced gas (750°C) leaves the reactor at the upper part, and it leads to a high temperature filter where solid particles are removed. For that purpose, filtration candles from ceramic fibers (PYROTEX KE85/60x) were used. This material is able to operate in temperatures up to 850°C, and it is chemically inert. In the next step, the gas is cooled in a water cooler and water scrubber to temperature 80°C, which causes a partial removal of tars and moisture.
Biomass fuels characterization
Pellets from spruce wood, hay, and wheat straw of 8-mm diameter were used as fuel. To determine the sample composition (elemental analysis), we used a LECO CHN628 analyzer. LECO TGA701 Thermogravimetric Analyzer was used to determine the ash and moisture (proximate analysis). LECO AC600 Semi-Automatic Isoperibol Calorimeter measured the fuel’s low heating value (LHV).
Gas composition characterization
A continuous multicomponent GAS 3100 gas analyzer was used to measure the concentration of gaseous components. The analyzer is equipped with three different types of detectors to assess the gaseous components. Gaseous product composition was measured in sampling point 2.
The first of the detectors is a two-beam infrared non-dispersive detector NDIR, operating on the principle of infrared absorption by selected gaseous components. The rate of absorption is directly proportional to the amount of gas in the sample. It is suitable for the determination of carbon monoxide (CO), carbon dioxide (CO2), and methane (CH4).
Thermal-conductivity detector TCD works based on comparing the thermal conductivity of the sample and the reference gas (air). The heated thermistor or platinum fiber is located in the stream of the sample. If the sample has a higher thermal conductivity than the reference gas, the temperature of the measuring element decreases, while in the case of lower thermal conductivity, it grows. These changes cause variations in the electrical resistance measured by means of “bridge connection.” In the analyzer, it is used to determine the hydrogen content.
For the determination of oxygen O2, an electrochemical ECD sensor is used in the analyzer. It is composed of a cathode, an anode, and an electrolyte. Through the permeable membrane, which keeps the electrolyte in the measuring cell, the oxygen diffuses into the electrolyte. It reacts with electrolyte and produces the electricity current which is directly proportional to the concentration of oxygen in the gaseous mixture.
The analyzer is able to measure the composition of dry gas, free from undesirable substances (especially tars and dust). A sample of gas was passed through four washing vessels filled with isopropanol, in which the rest of condensation products were captured. Behind them follows three washing vessels, placed in a freezing box, which serves to precipitate all the remaining organic substances and moisture. The sampling-track continued with a silicone hose through a laboratory drum gas meter 2 and through T-shaped pipe, which protects the analyzer from the inadmissible overpressure of the gas being analyzed. Analyzer pump ensures a permanent sample flow rate of 1 l/min.
The nitrogen content in gas was calculated as the rest to 100% vol.
Tar and solid particles determination
The measurement and laboratory determination of gravimetric tar were carried out by the modified procedure cited in ČSN P CEN/TS 15439 Biomass gasification—tar and particulates in gaseous products—sampling and analysis. For tars and solid particles content determination, samples were taken at sampling point 1 and 2 to determine the efficiency of tar and solid particles’ removal.
A sample of gas was taken by a ball valve probe, equipped with a heated glass fiber filter trap—which has been placed behind it—and on which solid particles and part of tar substances were captured. The gas temperature at the sampling point was measured with the thermocouple before and after the measurement. A sample of gas was passed through four washing vessels filled with isopropanol, where the tars were captured. At the freezing column, there has been condensing water steam and the rest of tars during the test. The sampling line continued further through with a silicone hose into the gas-pump and to the diaphragm gas meter, between which the flow controller was included. From the measuring line, the gas is brought out into the air.
After completing the sampling, the filter with captured dust particles and tar was moved to the sampler, and it formed the sample for the determination of the dust content and it also served as determination of first part of the tar content.
Before further laboratory processing, the exposed filters were dried and weighed (determination of solids particles with tar). The tar compounds adsorbed on the solid particles (the first part of the sample) were extracted from the filter with isopropanol in a Soxhlet extractor. Subsequently, the sample (isopropanol with dissolved tars) was filtered, concentrated in a rotary vacuum evaporator (RVE), and transferred within the help of acetone to the laboratory weight, in which the sample was dried (at the temperature of 50°C) and weighed using an analytical weight.
The second part of the tar sample (the tar in the liquid fraction) was filtered, i.e. rid of possible salts and insoluble impurities, concentrated in a RVE, and transferred within the help of acetone to the laboratory weight, in which the sample was dried (at the temperature of 50°C) and weighed using an analytical weight.
The total gravimetric tar concentration was calculated as a proportion of the total amount of tar entrapped on the solid particles and the tar that passed through the filter, to the volume of dry gas that was taken within the measurements, calculated referring to normal conditions (0°C, 101,325 Pa).
For tar composition analysis, we used a gas chromatograph GC/MS Agilent GC system 7890 A with MS detector 5975 C. Column DB-XLB 30 m × 0.25 mm × 0.25 μm. Injector CTC CombiPal and injection split/splitless. For volatile organic compounds, the headspace method was used.
The filter with captured particles was dried at 105°C to constant weight and weighed using an analytical weight. The dust concentration was determined as a proportion of the amount of captured dust to the volume of the aspirated wet gas converted to normal conditions (temperature 0°C; pressure 101,325 Pa).
Results and discussion
Biomass fuels characterization
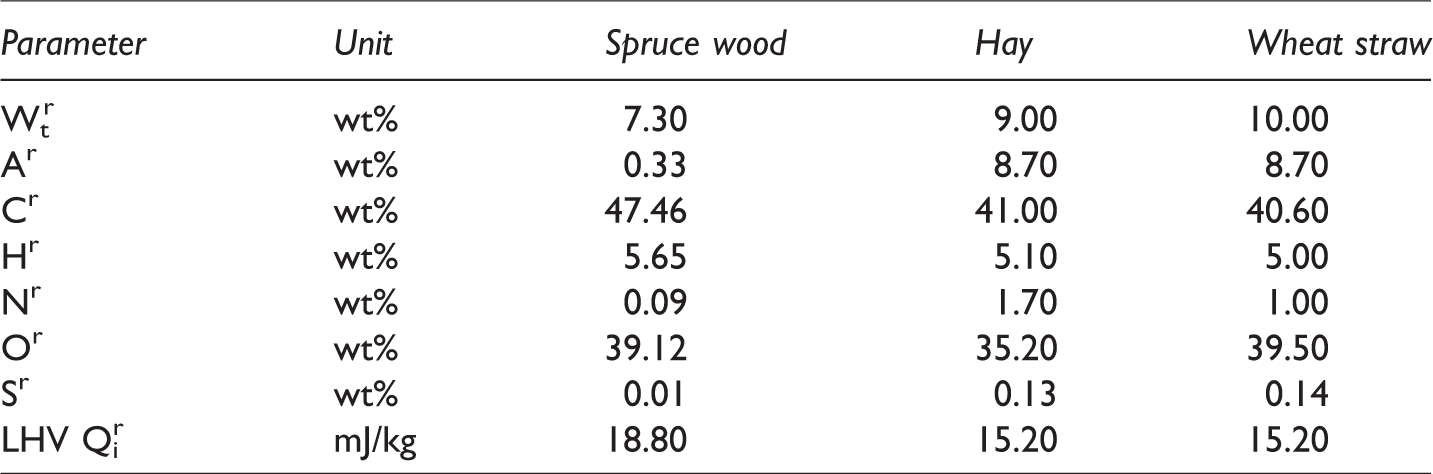
Comparison of elemental and proximate analysis of used biomass fuels is shown in Table 1. Higher low heating value of spruce wood pellets is caused by higher carbon content, which represents the energy content. It is also caused by low moisture content in spruce wood pellets in comparison with hay and wheat straw. On the other hand, the moisture content, which represents H2O, will lead to an increased content of oxygen and hydrogen in gasification process. Those compounds will probably react and increase the production of methane and CO in produced gas. The amount of ash content is also significantly higher in non-woody biomass. This trend was confirmed by other authors (Azeez et al., 2010; Butler et al., 2013). High ash content may cause difficulties with its removal from the reactor, and it can lead to a higher solid particle content in produced gas, which puts greater demands on the gas cleaning system. The resulting low heating values of used biomass fuels are consistent with the other research (Alzate et al., 2009; Judex et al., 2012; Kirubakaran et al., 2009; Leijenhorst et al., 2015).
Biomass pellets elemental and proximate characterization (raw basis).
Characterization of produced gas
The results of produced gas from three types of biomass pellets are compared in Table 2. The main index used at gas evaluation is low heating value of gas. This parameter is crucial for cogeneration unit performance. The low heating value mainly depends on methane, hydrogen, and carbon monoxide content in produced gas. Regarding the CH4 content, decreased levels in non-woody biomass were found. On the other hand, significant differences between CO and CO2 contents were detected. This was probably caused by secondary oxidation of CO to CO2. This trend may occur at the local hot spots, which are created at ash deposits and can reach higher temperatures. In higher temperature spots, CO may undergo oxidation to CO2 but it also depends on O2 levels which were higher in hay and wheat straw gasification. This may be explained by the fact that during gasification of hay and wheat straw, inhomogeneous layers were probably created, thus causing a faster flow of gasification medium through the fuel bed. For proper gasification, the residence time has to be sufficient for gasification reactions to occur. In case of gasification of hay and wheat straw, this condition was not probably met. This could cause higher levels of O2 in the produced gas.
Characterization of gas produced from different types of biomass pellets.
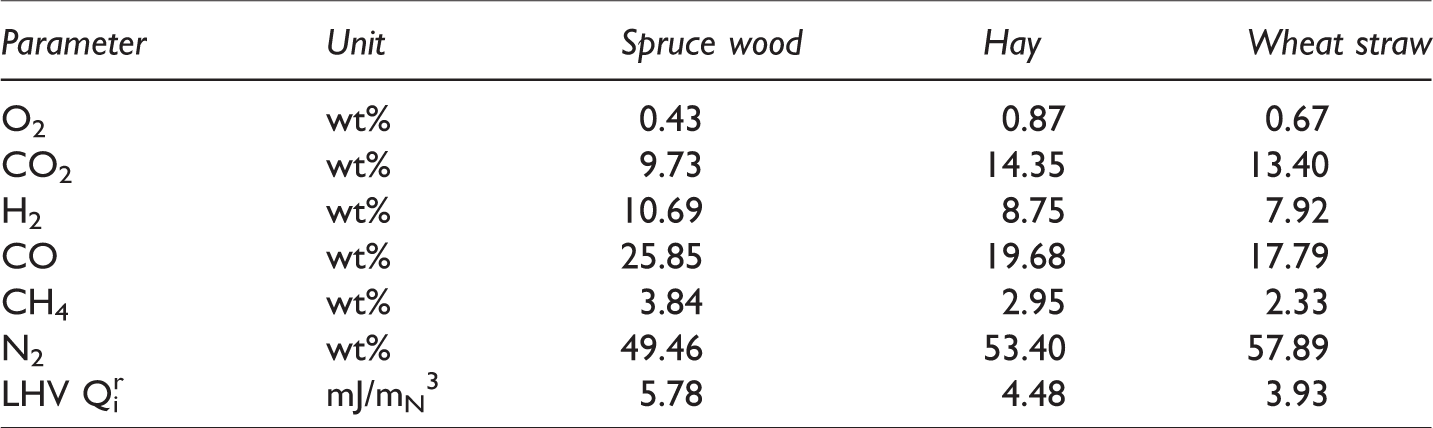
The resulting low heating values of produced gas from wood pellets are similar to those reported by other authors, even when a different type of reactor was used. However, in the case of hay and wheat straw, slightly lower results were recorded, probably caused by low gasification stability (Ergudenler and Ghaly, 1992; Erlich and Fransson, 2011; Judex et al., 2012).
Determination of tars and solid particles
Results from the composition of tars are summarized in Table 3. Toluene and other light hydrocarbons are not included in the sum of tars because their condensation should not occur. This is the reason why they are included in BTEX group. Composition of tars in all three produced gases is very similar. Since the used fuels were all from biomass and gasification temperature and reactor type were the same, the composition of tars is usually, and in this case was, similar. These results correspond with the conclusions of other researchers, i.e. that the composition and amount of tars mainly depend on the gasification temperature, type of reactor, gasification medium, fuel, and other factors (Hernández et al., 2013).
Characterization of tars from three types of biomass fuels.
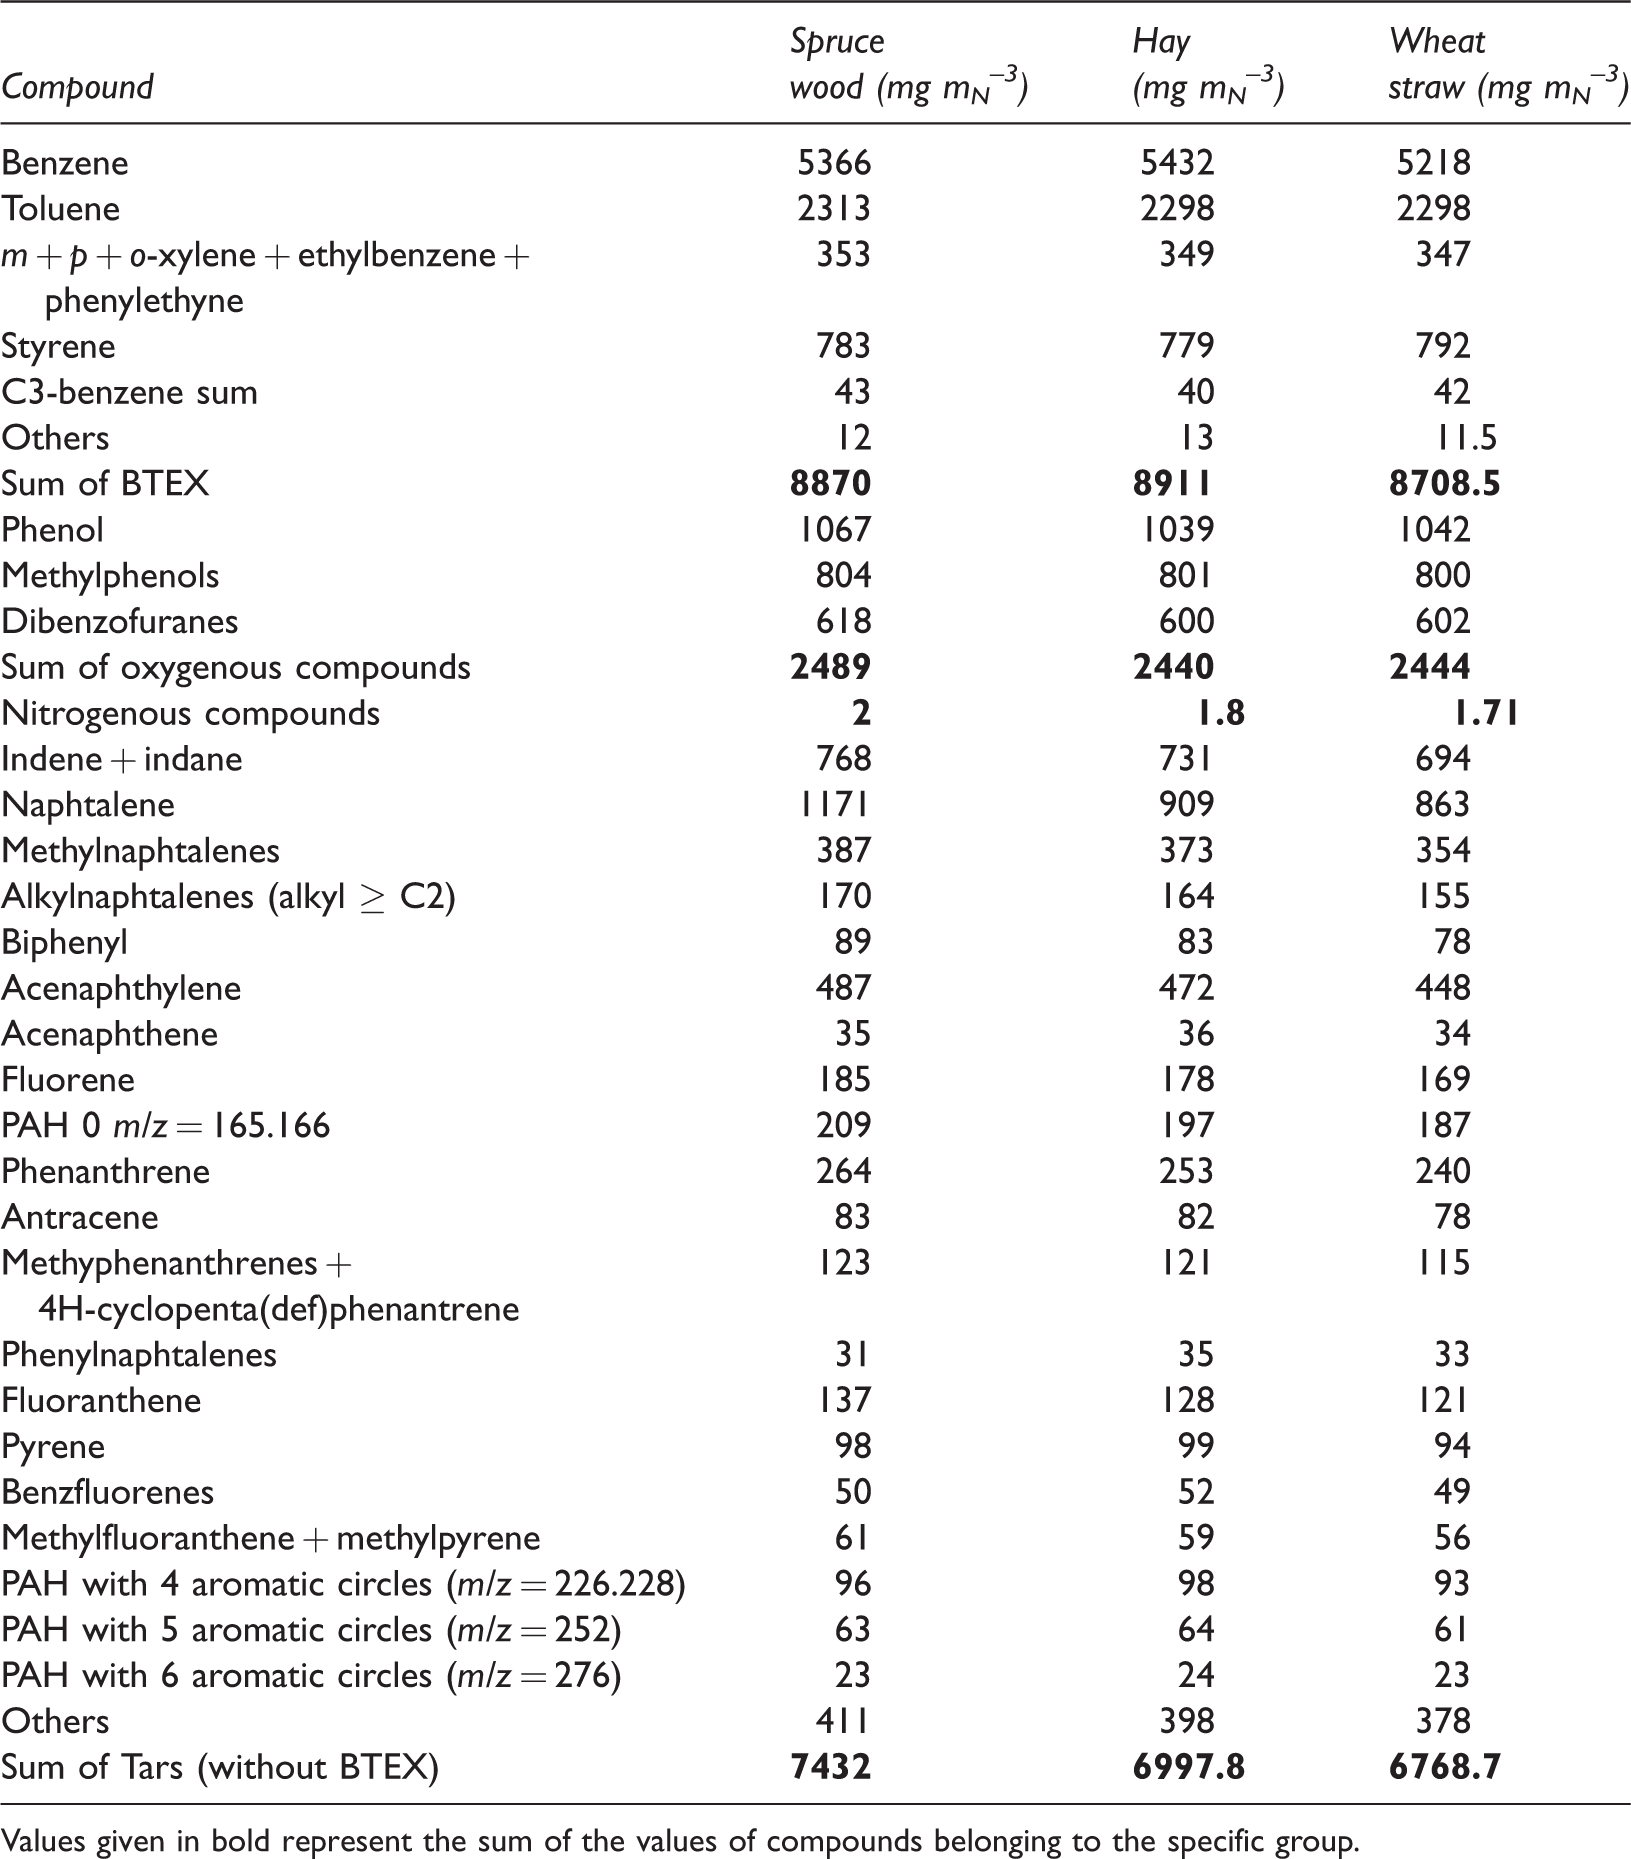
Values given in bold represent the sum of the values of compounds belonging to the specific group.
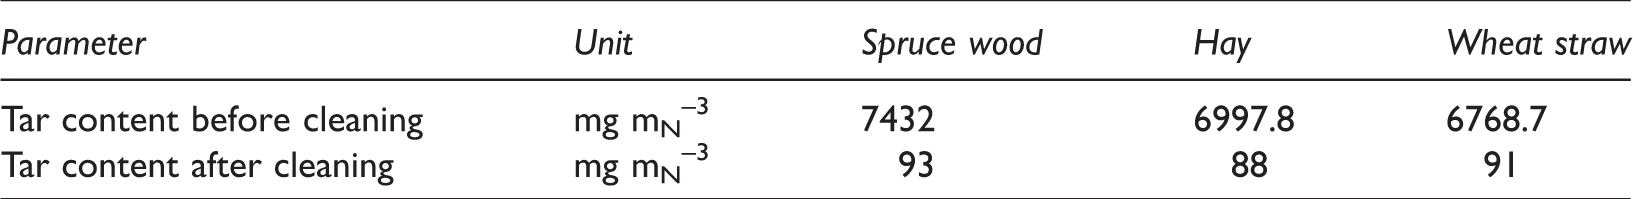
Tar amount was determined with regard to its use in a cogeneration engine with internal combustion. Different applications have different limits for tar contents. The maximum tar content in the produced gas for internal combustion engine application is 100 mg mN−3 (Kirubakaran et al., 2009; Rios et al., 2018). The tar amount was determined in sampling points 1 and 2 to evaluate the gas cleaning process. In gas produced from all three biomass pellets, there was a very similar content of tars before and after the cleaning process (see Table 4). High levels of tar content could be caused by gasification temperature (800°C) where some authors reported highest yields of tars (Horvat et al., 2016). Tars were effectively removed from gas in the water scrubber, and a small amount could be captured onto solid particles in filter. The water scrubber was filled with glass Raschig rings (10 mm diameter), and the temperature of used water was 3–5°C. From results in Table 3, it is clear that after the cleaning process, the gas can be used in the cogeneration engine with internal combustion. If the produced gas should be used for example in a gas turbine (tar limits <5 mg/mN−3 (Rios et al., 2018)), different cleaning technology would be required to achieve better results.
Tar content in gases from different types of biomass before and after the cleaning process.
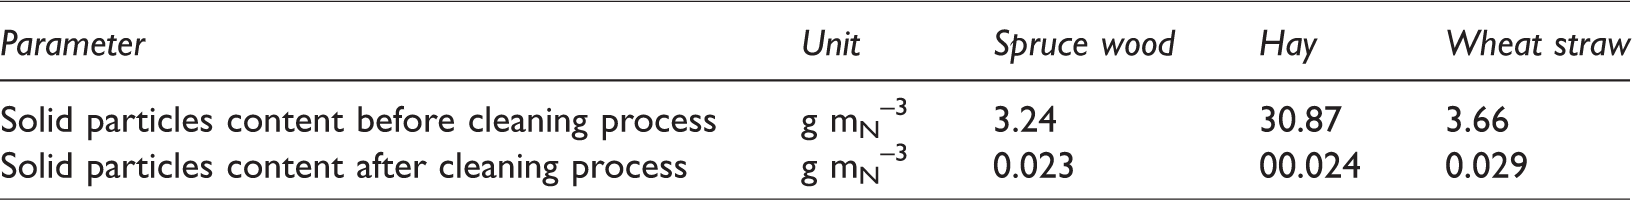
Solid particle content was also investigated before and after the cleaning process. Results in Table 5 show that the high temperature filter efficiency is over 98%. Some solid particles were probably removed in the water scrubber as well. The solid particle content in cleaned gases would not cause any difficulties in an engine with internal combustion, but if used in gas turbines, another cleaning technology would be required.
Solid particles content in gases from different types of biomass before and after the cleaning process.
Conclusions
The characterization of produced gases from three types of biomass fuels was compared. The gas produced from wood pellets with the highest low heating value had the most desirable properties for cogeneration unit performance. In gasification of hay and wheat straw, the lower levels of combustible compounds were detected due to low gasification stability, creation of local hot spots, and inhomogeneous layers in fuel bed. Amount and composition of tars before and after the cleaning process were conducted. The results of composition and content of tars were very similar in all three produced gases. This suggests that the most decisive factors are gasification temperature, type of reactor, gasification medium, and fuel properties. It was proven that the used cleaning technology is sufficient for gas cleaning in terms of its use in an engine with internal combustion. High levels of tars content and solid particles were removed with great efficiency. However, for use in a gas turbine or other application with higher demands on gas quality, it would be necessary to use another cleaning technology.
Footnotes
Acknowledgements
The authors wish to thank Dr. Alena Kašpárková for her kind English language check.
Declaration of conflicting interests
The author(s) declared no potential conflicts of interest with respect to the research, authorship, and/or publication of this article.
Funding
The author(s) disclosed receipt of the following financial support for the research, authorship, and/or publication of this article: This article was created with the support of the VSB – Technical University of Ostrava, ENET Centre, specific research SP 2018/54 – Measuring stand for water-ring vacuum pump and project LO1404: Sustainable Development of Centre ENET.