
Abstract
Gravity displacement often occurs when drilling a vertical fractured formation, causing a downhole complexity with risk of blowout and reservoir damage, well control difficulty, drilling cycle prolongation, and increased costs. Based on an experimental device created for simulating the gravity displacement, various factors affecting the displacement quantity were quantitatively evaluated by simulating the fracture width, asphalt viscosity, drilling fluid density, and viscosity under different working conditions, and a liquid–liquid displacement law was obtained. Using the theories of rock mechanics, fluid mechanics, and seepage mechanics, based on conformal mapping, as well as a fracture-pore double substrate fluid flow model, we established a steady-state mathematical model of fractured formation liquid–liquid gravity displacement by optimizing the shape factors and using a combination of gravity displacement experiments to verify the feasibility of the mathematical model. We analyzed the influence of drilling fluid density, fracture height and length, and asphalt viscosity on displacement rate, and obtained the corresponding laws. The results show that when the oil–fluid interface is stable, the fracture width is the most important factor affecting the gravity displacement, and plugging is the most effective means of managing gravity displacement.
Introduction
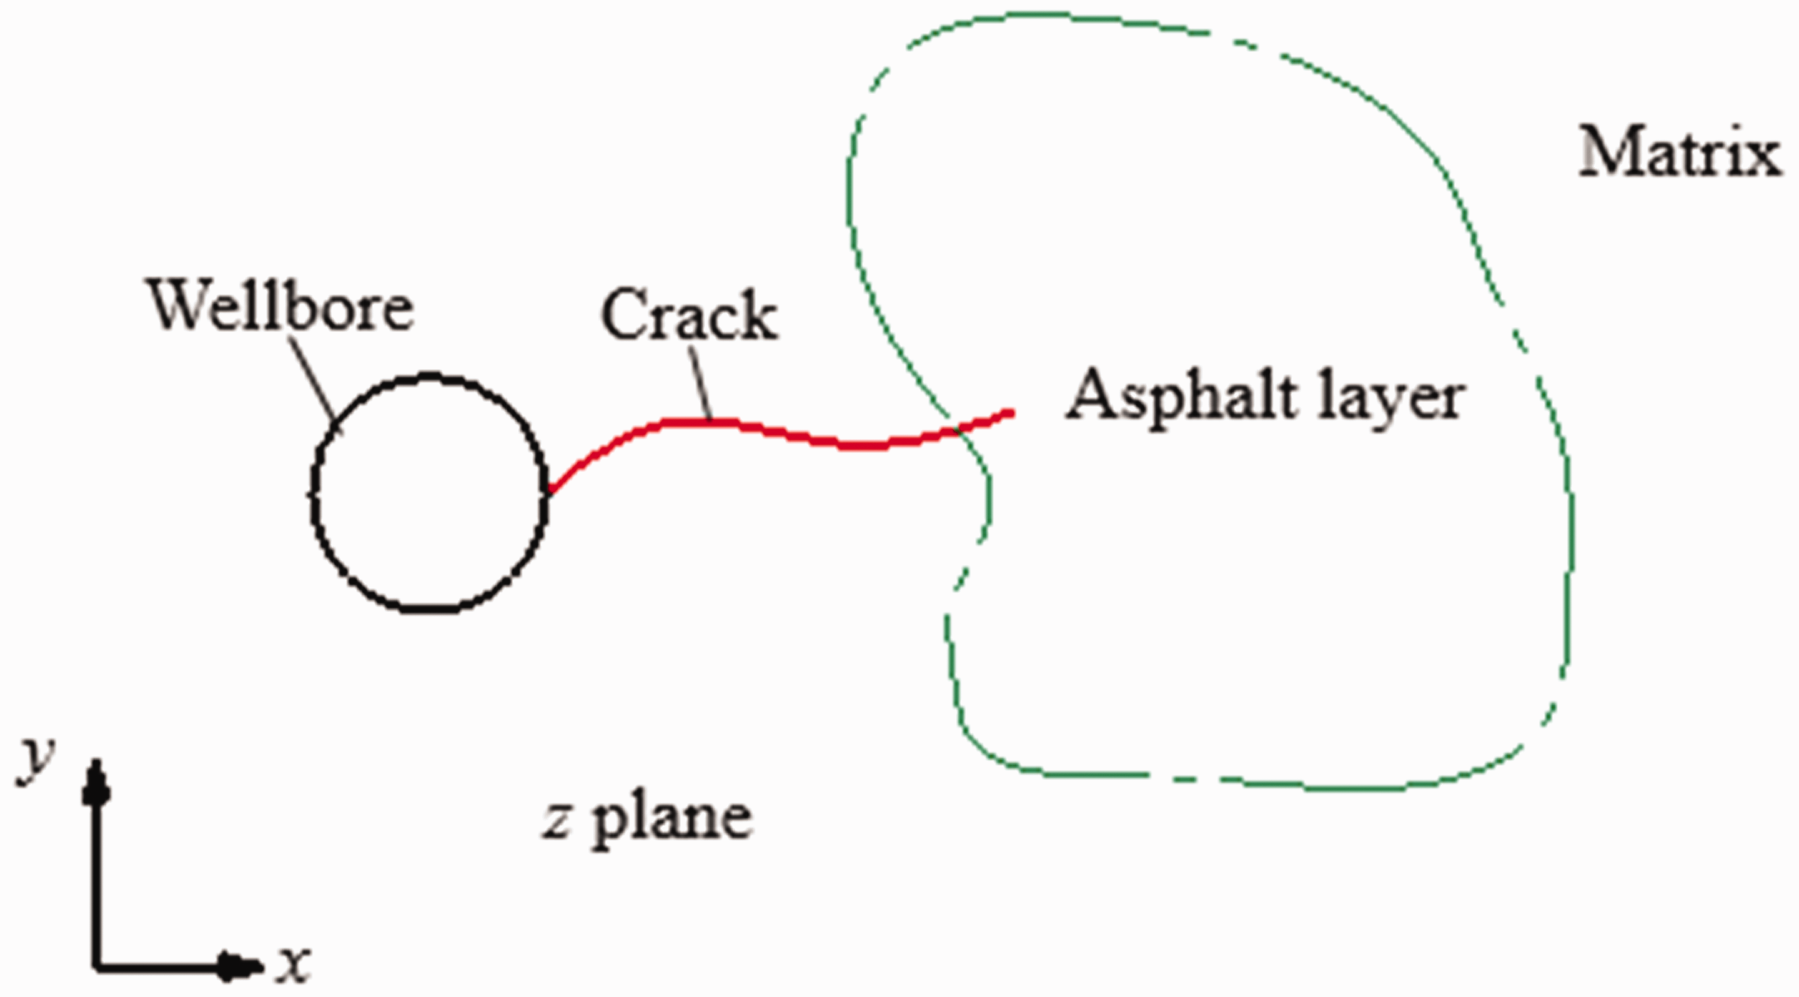
The Kazhdumi Formation in the Yadavaran Oilfield of Iran is mainly composed of dark asphalt shale and gray limestone, in which asphalt heavy oil is extensively developed (Du et al., 2016; Rafieepour and Jalalifar, 2014). During the drilling process, the pore pressure of the formation fluctuates greatly, and asphalt spillage increases instead of decreasing when the density of drilling fluid goes up (Lu et al., 2017). The co-existence of kick and lost circulation owing to gravity displacement is the cause of this anomaly, which is shown in Figure 1 as a schematic diagram. Generally, a higher volume of lost circulation may be caused by killing fluid with a higher density, which leads to pure low drilling aging in the reservoir section, long drilling cycles, and a greater risk of well-control problems (Meng et al., 2015). Up to now, 27 wells have been drilled in the initial and first phases of the project, 11 of which encountered significant asphalt intrusion. Among them, the F13, APP2, and F21 wells were forced to completion because of asphalt intrusion (Zhao et al., 2016).
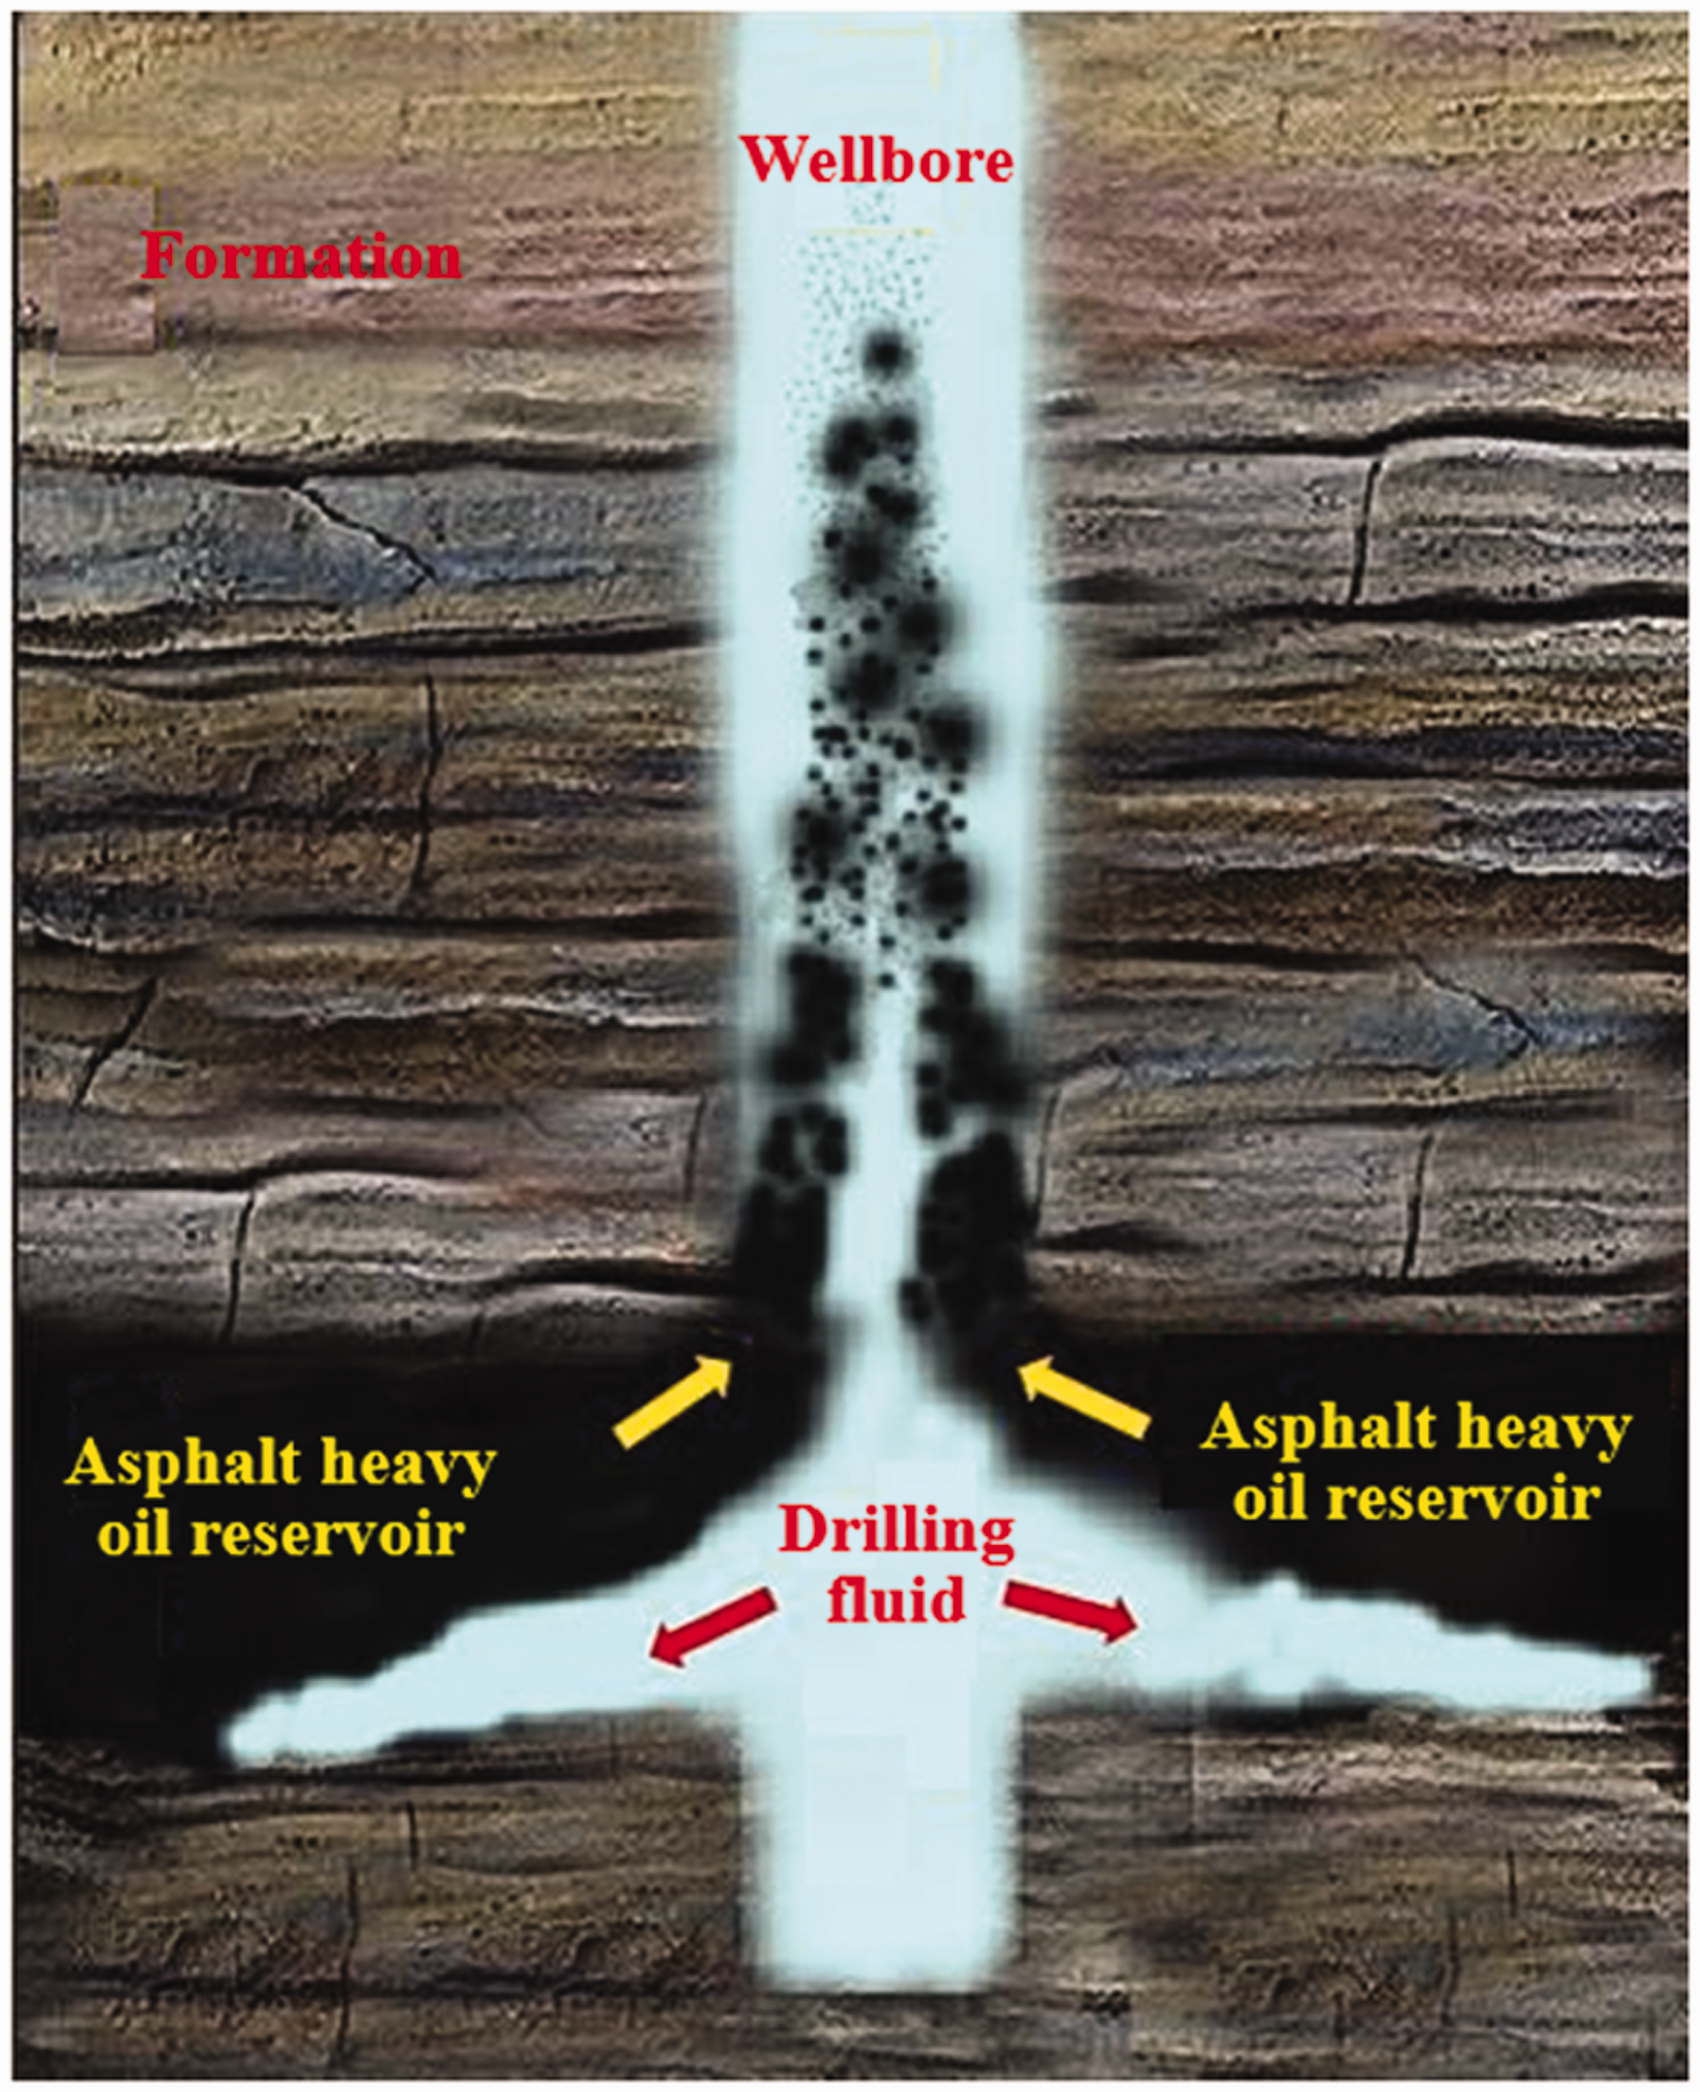
Schematic diagram of gravity displacement.
The Kazhdumi Formation is a fractured-vuggy carbonate formation (Vincent et al., 2015; Zeinalzadeh et al., 2018). As a result of the existence of the fractures and vuggy, the leakage pressure is close to the formation pressure, and material and pressure balance between the wellbore fluid and the formation fluid is difficult to maintain. Pressure fluctuations easily lead to mutual displacement of the fluid, thereby causing leakage of the drilling fluid and invasion of the formation liquid (Han et al., 2010).
Therefore, to device a comprehensive treatment technology for displacement of heterogeneous active asphalt layers, achieve efficient and safe drilling of the Yadavaran asphalt layer, reduce non-production time, and reduce cost and increase efficiency, it is necessary to adopt a source control, increase knowledge regarding mechanism awareness and process prevention, and strengthen management. It is important to conduct research on the gravity displacement law of asphalt and the drilling fluid. Understanding the occurrence conditions, flow law, and influencing factors of the gravitational displacement of carbonate fractures are the key to preventing and controlling the simultaneous occurrence of overflow and leakage.
Regarding the problem of two-phase flow in fractures, Hou et al. (2016) studied the flow law of oil–water phases in fractures. Cipolla et al. (2010) established the network-based discrete fracture flow model, and previous studies have reported two-phase flow in micro-fractures, all of which belong to the field of petroleum development (Guo and Li, 2003; Salim et al., 2008). In the field of oil–gas well engineering, there have been additional publications describing flow models of drilling fluids in fractures and simple leakage models.
Dyke et al. (1995) conducted a qualitative analysis of the leakage response during the drilling of fractured formations and suggested the treatment of leakage. Sanfillippo et al. (1997) proposed a semi-empirical formula for the radial leakage of a single fracture, also considered the equivalent well diameter for incorporation into the model, and then proposed a method. Lietard et al. (1996) discussed the drilling mud loss in natural fractured reservoirs with fracture permeability of >50 mD and provided a curve describing the loss of volume and time of drilling fluid. Alexandre and Johan (2004) proposed a theoretical framework for the apparent borehole expansion phenomenon in natural fractured formations caused by the loss of power-law drilling fluid to a finite size of isolated non-propagating deformed circular fractures. Majidi et al. (2008) studied a non-Newtonian fluid loss model and constructed a mathematical model for the loss of Herschel–Bulkley (YPL) drilling fluid in natural fracture formations.
Shu et al. (2011), Xiao et al. (2018), and Lu et al. (2019) discussed mechanism behind the gravity displacement in the vertical fracture. In terms of the law of gravity displacement, Zhao et al. (2016) utilized a flat seam test device and computational fluid dynamics technology to analyze the factors affecting the gravity displacement of heavy oil and drilling fluid, and measures to control the replacement of heavy oil and drilling fluid were proposed. Lu et al. (2017) analyzed an alternative mechanism for the asphalt layer in Yadavaran Oilfield of Iran. Pressure fluctuations as well as changes in formation pressure occur in constant-pressure reservoirs, and Xiao et al. (2018) derived a mathematical model of gas–liquid displacement and carried out experimental verification on this subject. At present, most studies on gravity displacement are in the qualitative and empirical stages.
In the following section, the main obtained results are described. First, a set of visualization formation coupling wellbore flow test device was built based on real space by scanning the practical field outcrop and building real crack space, respectively, carried out the visualization liquid displacement experiment with different crack width, drilling fluid density, viscosity, and asphalt viscosity, which obtained the influence law of various parameters on displacement rate, conditions of displacement, the development regularity and controlling factors. Second, the steady-state mathematical model of fractured formation liquid–liquid gravity displacement was established by using the theory of rock mechanics, fluid mechanics, and seepage mechanics, based on the conformal mapping and fracture-pore double substrate fluid flow model, optimizing the shape factors by the combination of gravity displacement experiment, verified the feasibility of mathematical model. Finally, sensitivity factors for gravity displacement were analyzed. The research results provide a theoretical foundation for seeking a solution method, explaining its phenomenon, and implementing practical treatment.
Experimental study of liquid–liquid gravity displacement
Experimental device and its working principle
The entire device consists of three parts: the wellbore–fracture–formation system, the circulation system, and the data acquisition system. The wellbore–fracture–formation system includes the wellbore module, fracture module, and formation module.
The wellbore module and the formation module use a transparent plexiglass tube to simulate the fluid flow path in the wellbore and the formation, while the wellbore module is also equipped with a polyvinyl chloride pipe to simulate the drill pipe. The wellbore module and the formation module are connected through the fracture module. The wellbore module, fracture module, joint of the fracture module, and ground layer module are installed with a valve, and fluid can pass through the fracture module to flow into the ground layer by controlling the valve. The circulation system is responsible for pumping drilling fluid and formation fluid into the wellbore module and the formation module according to the set pressure and flow, and for separating the mixed fluid flowing back to realize the recycling of the experimental fluid. The data acquisition device includes various pressure gauges, flowmeters, and signal transmission cables on the pipeline to record the flow state of the fluid in real time. In addition, a high-definition (HD) camera was installed outside the fracture module to record the fluid distribution inside the fracture in real time.
The flow path in the artificial fracture is the same as the flowing space of the actual formation fracture, and the opening degree of the fracture is adjusted by providing the transparent resin gasket with different thicknesses in the mold cavity. Therefore, the fracture module can truly reflect the flow of drilling fluid and formation fluid in formation fractures with different opening degrees. After the valves at both ends of the crack module are opened, the wellbore module communicates with the formation module, and the drilling fluid and formation fluid undergo gravity displacement in the fracture module. During this time, the pressure sensor at the four corners of the fracture module and the external HD camera will record the fluid flow in the fracture in real time. The whole device can work under the fluid pressure of 0.5 MPa. A schematic diagram of the experimental device is shown in Figure 2, and a photograph is shown in Figure 3.
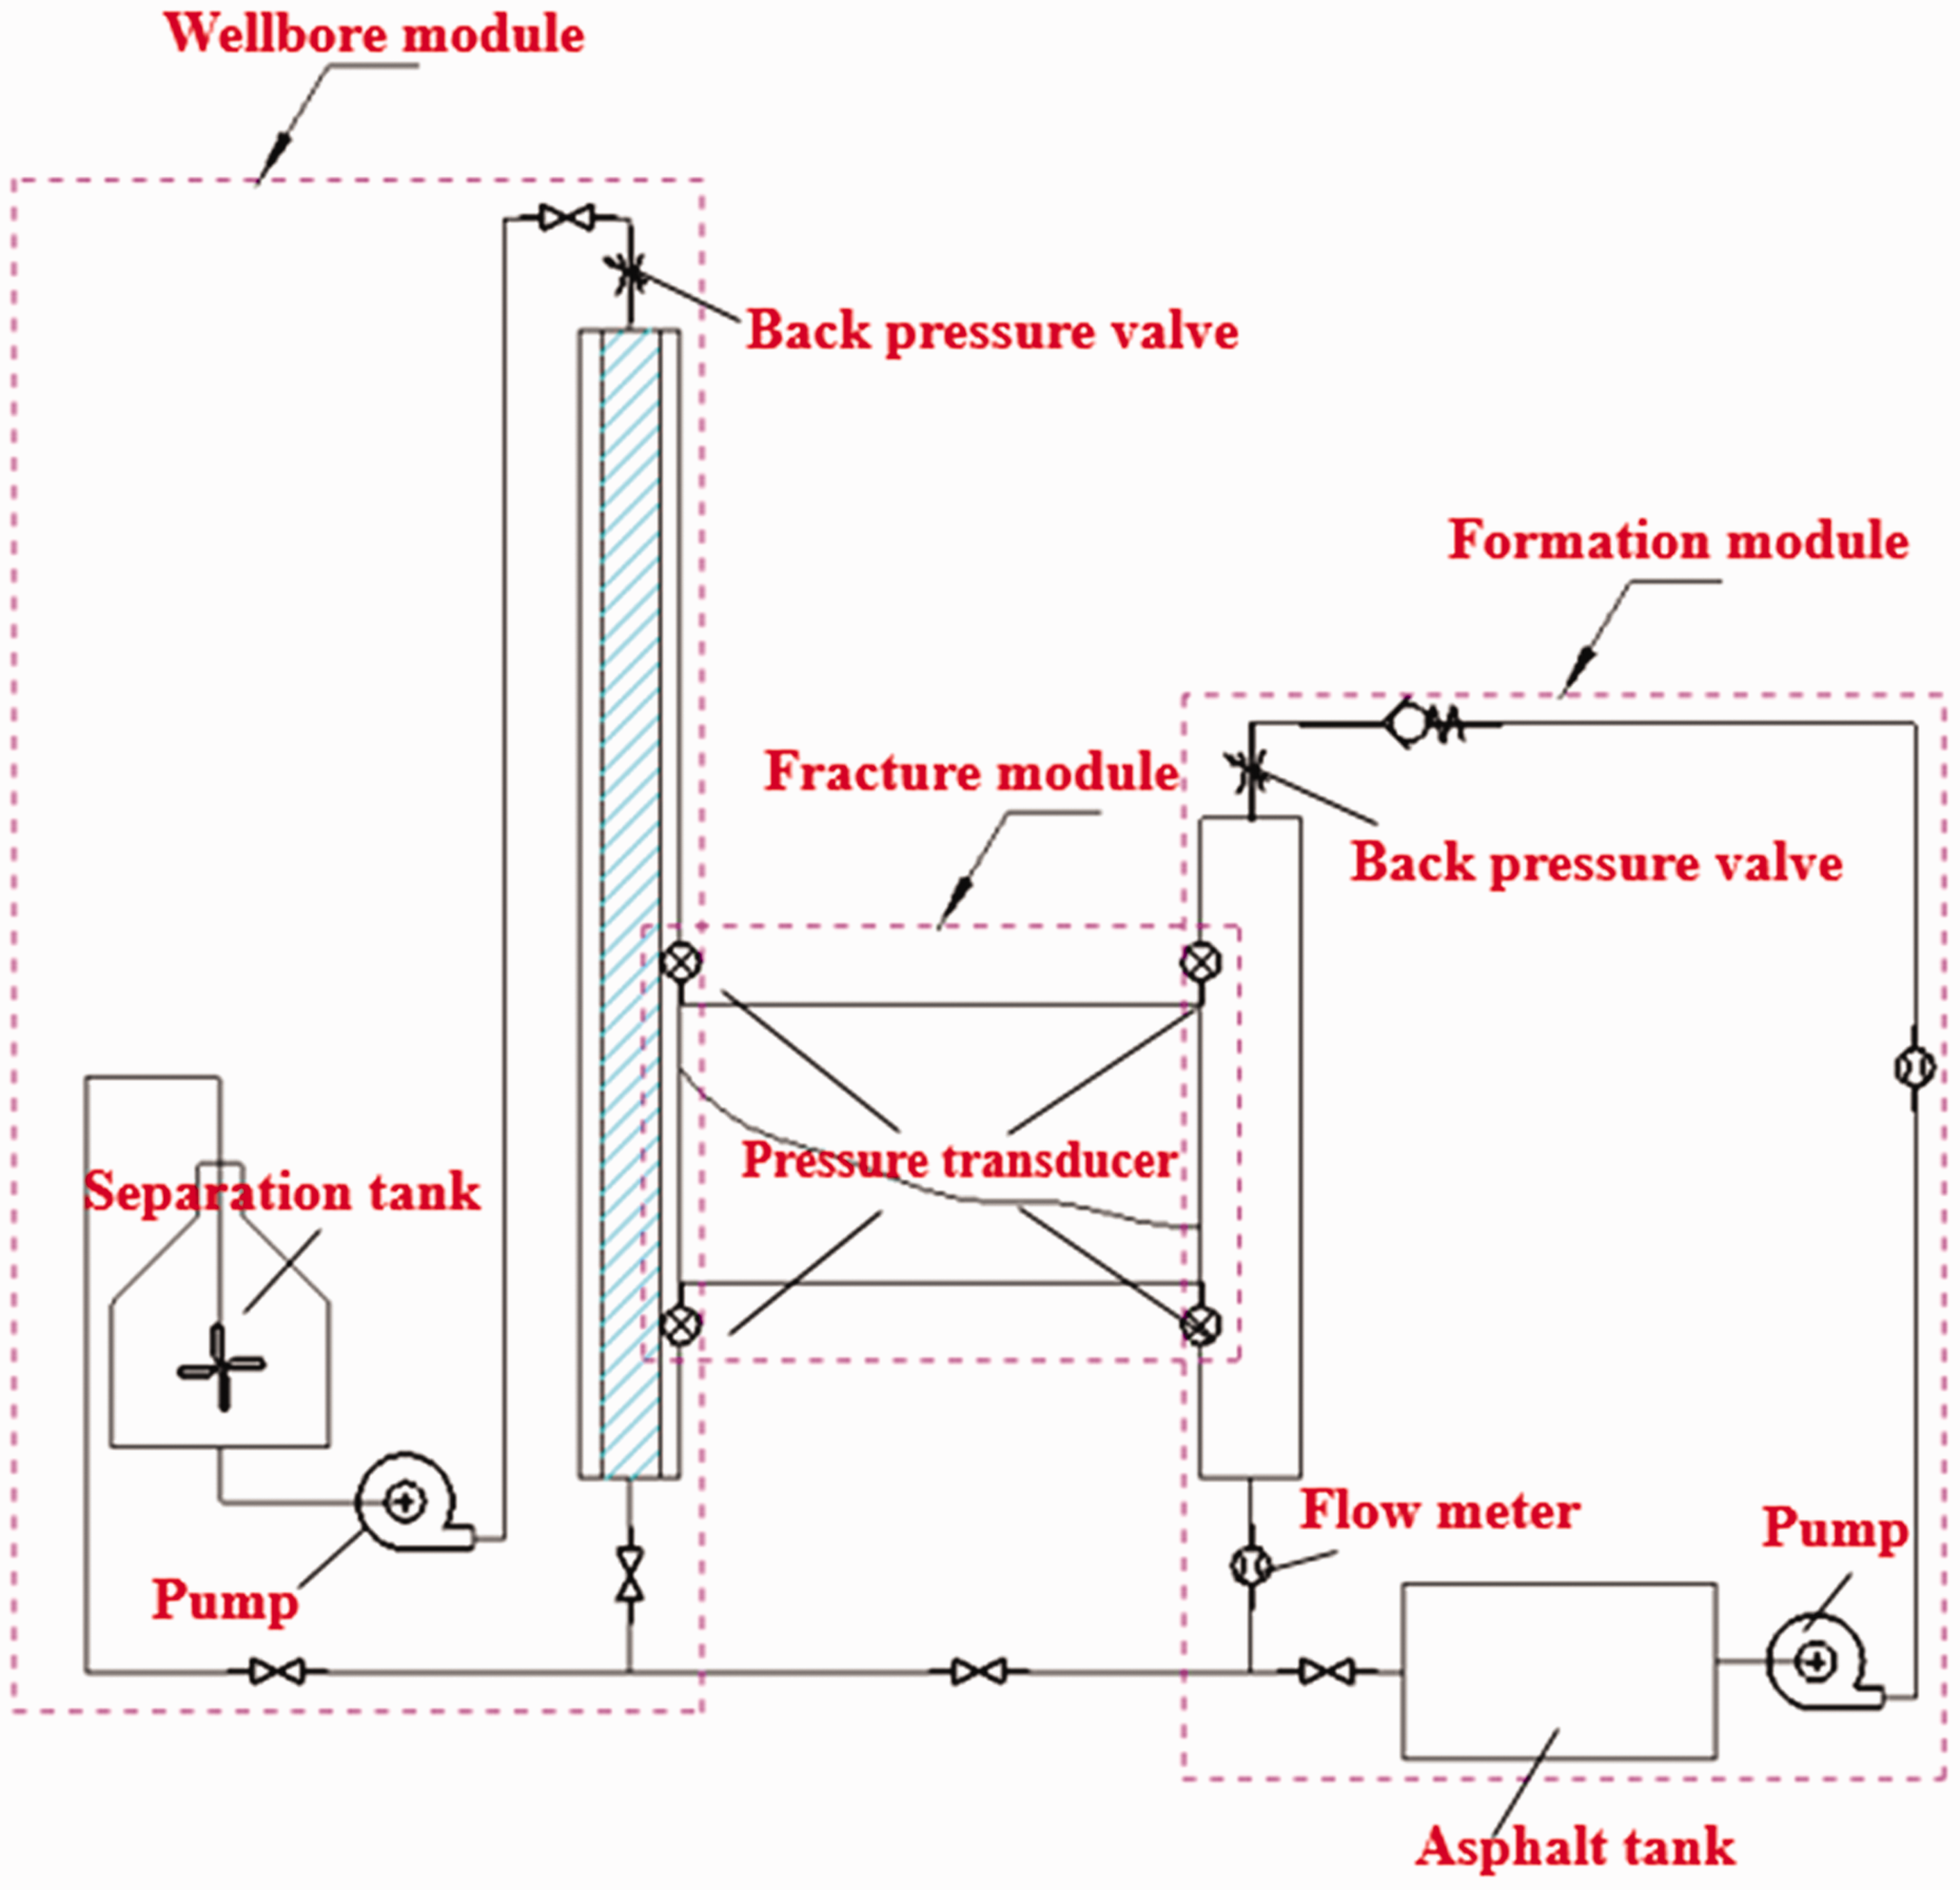
Schematic diagram of the experimental device.
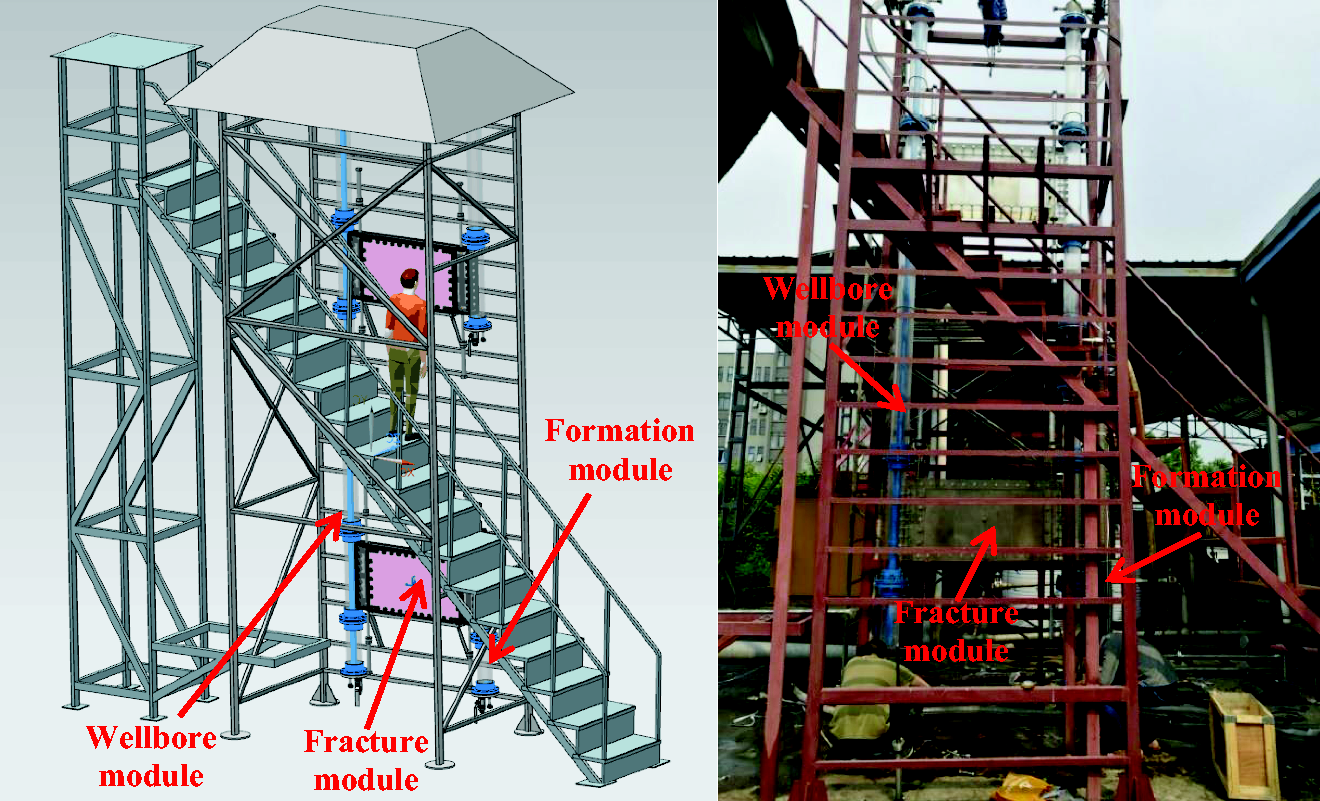
Renderings and photograph of the experimental device.
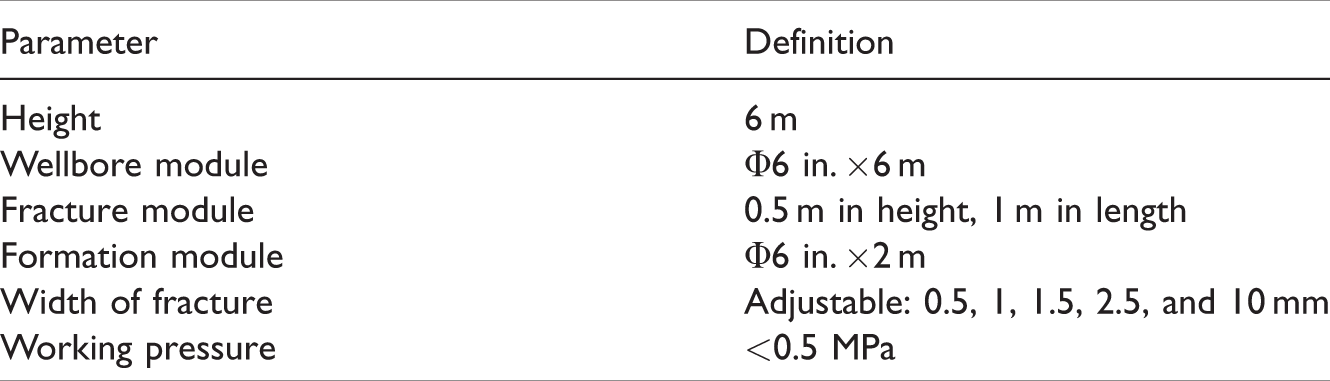
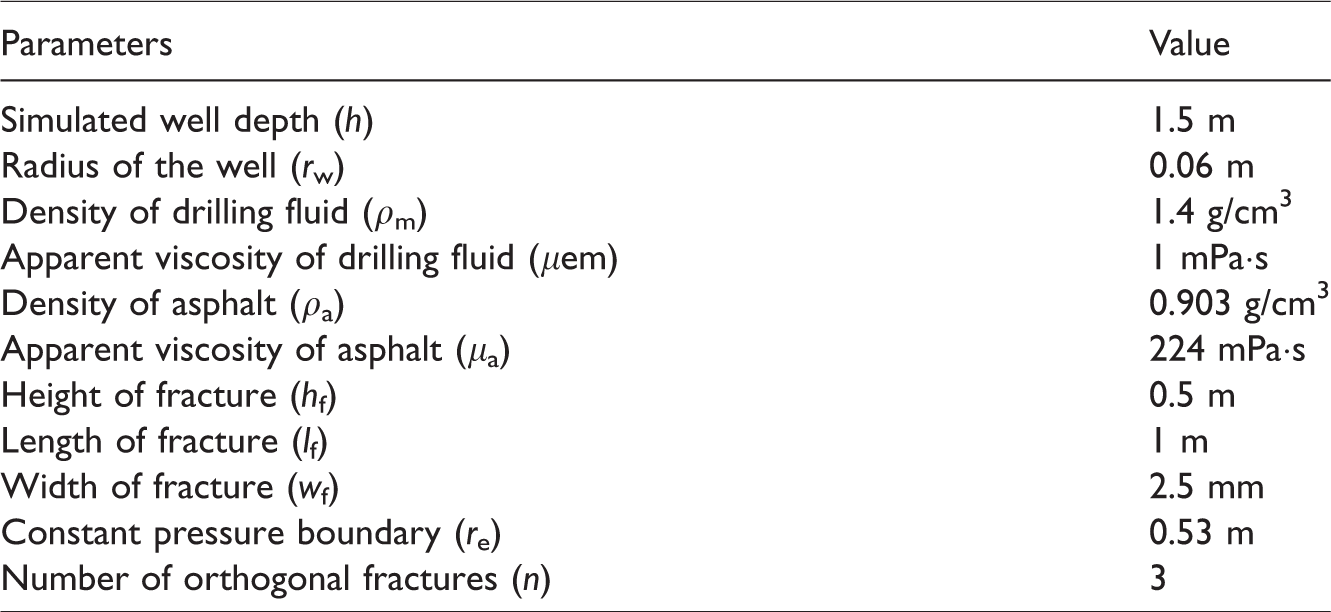
In contrast to the device described in the published literature (Xiao et al., 2018), this device replaces the air compressor with an asphalt heavy oil circulation system and can be used for oil drilling fluid gravity displacement. Table 1 lists the parameters of the experimental device.
Parameters of the experimental device.
Experimental scheme and empirical procedure
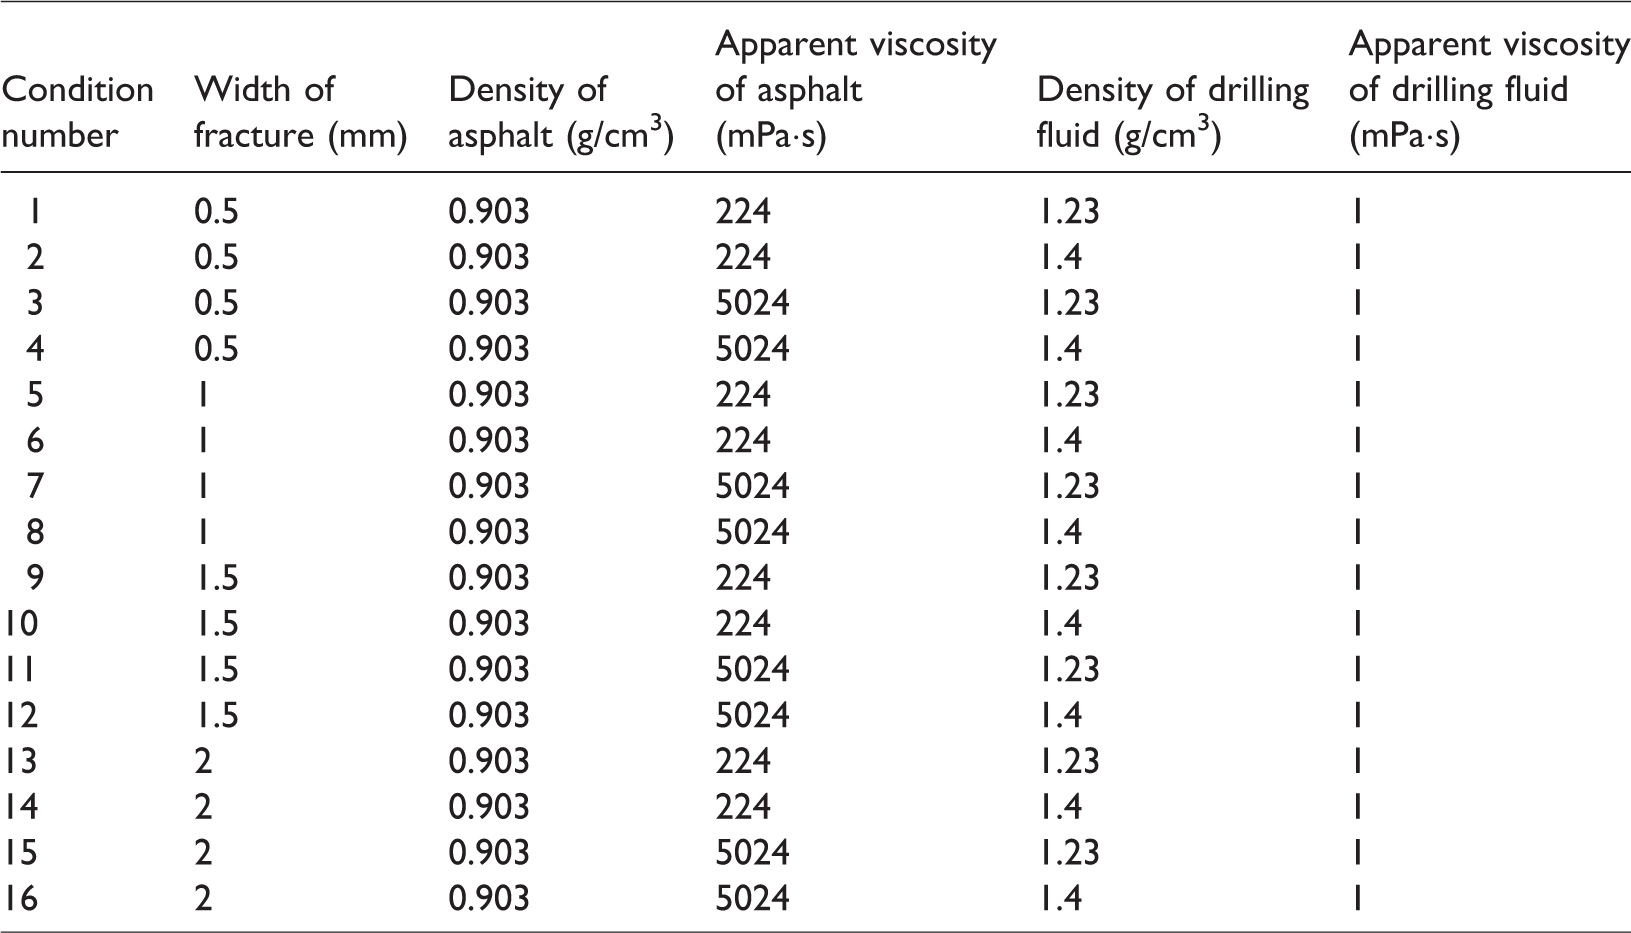
Under the influence of changing parameters such as the width of the fracture, density of the drilling fluid, and viscosity of the asphalt, a total of 16 experimental schemes based on the field data of Yadavaran Oilfield is designed as shown in Table 2.
Experimental scheme.
The empirical procedures under a certain fracture width and experimental fluid are as follows:
① Open the asphalt pump, pump the appropriate amount of simulated asphalt into the formation module, open the valve on the right side of the crack module, and fill the asphalt with cracks. ② Turn on the drilling pump, pump the drilling fluid to fill the wellbore module, and circulate for a period of time until the flow is stable. ③ Adjust the formation pressure to make it almost equal to the wellbore pressure, open the valve on the left side of the crack module, and adjust the back pressure valve of the wellbore module so that the relationship between formation pressure and wellbore pressure is in the replacement interval. ④ After the displacement is stabilized, record the time and the volume of the drilling fluid leaking into the formation module, thereby calculating the displacement amount. At the same time, record the pressure at each position by the sensors. ⑤ Adjust the back pressure of the wellbore and repeat the above test process to obtain the replacement data under the remaining pressure difference.
Experimental phenomena
In the experiments, it is observed that there is a two-phase interface in the fracture, which is an important feature of gravity displacement. There is a typical video of the experiment in the supplementary materials, and figures 4 to 6 reflect the distribution of the gas–liquid interface under condition 1, condition 2, and condition 5. Under different conditions, the oil–fluid interface differs significantly, and the pressure difference and monitored displacement flow are also significantly different. From the experimental phenomenon, the greater the density of the drilling fluid, the larger the displacement flow, and the wider the fracture, the larger the displacement flow. Quantitative data under different conditions have been presented in Figure 12.
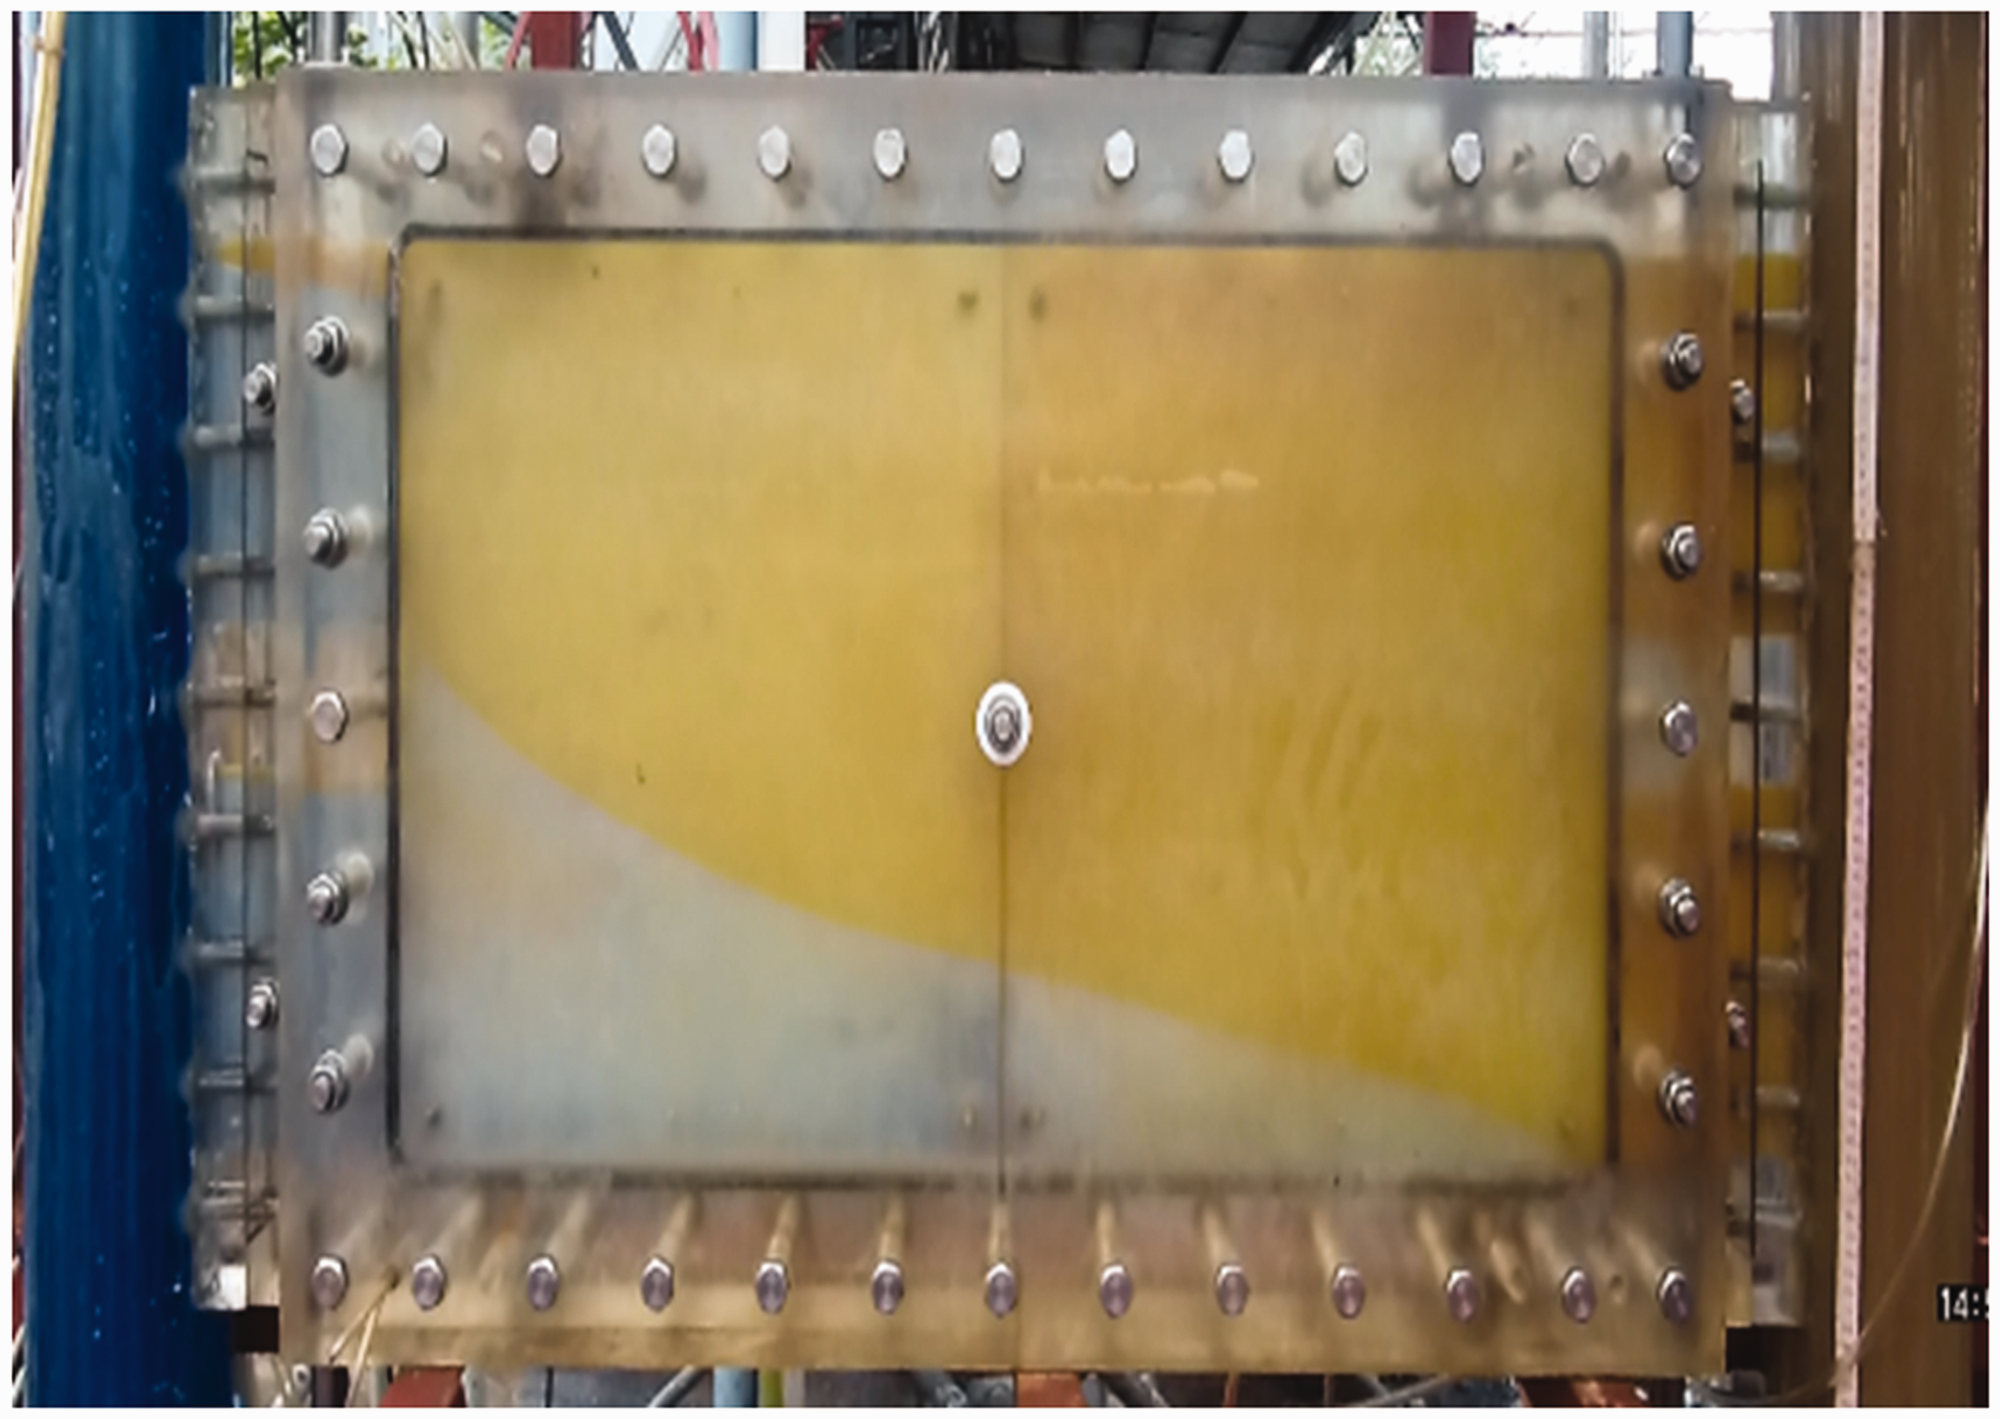
Oil–fluid interface under condition 1.
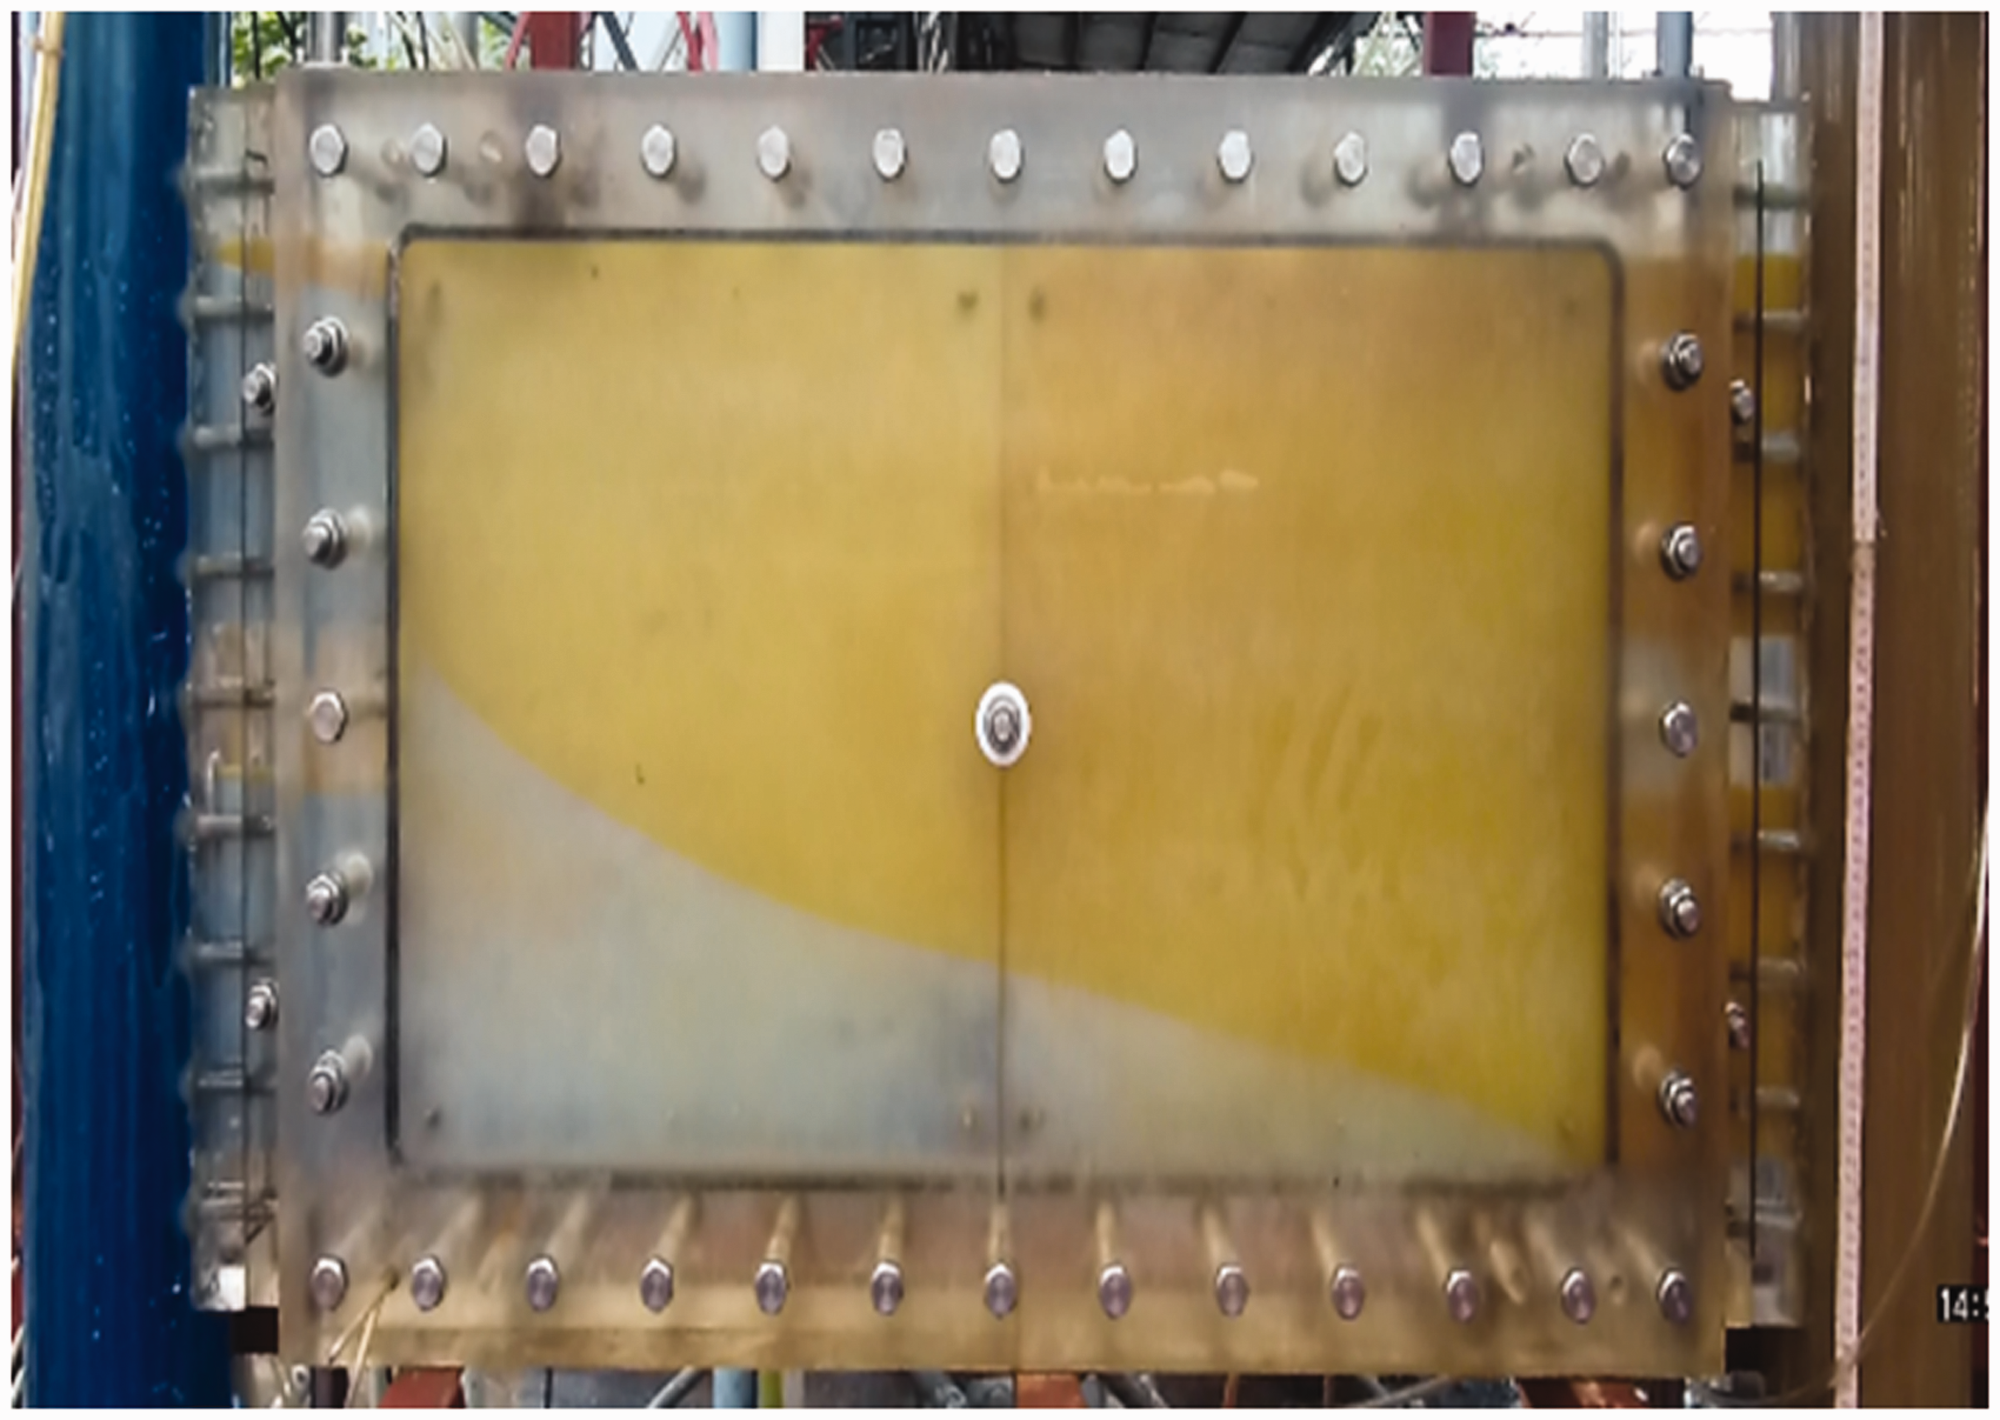
Oil–fluid interface under condition 2.
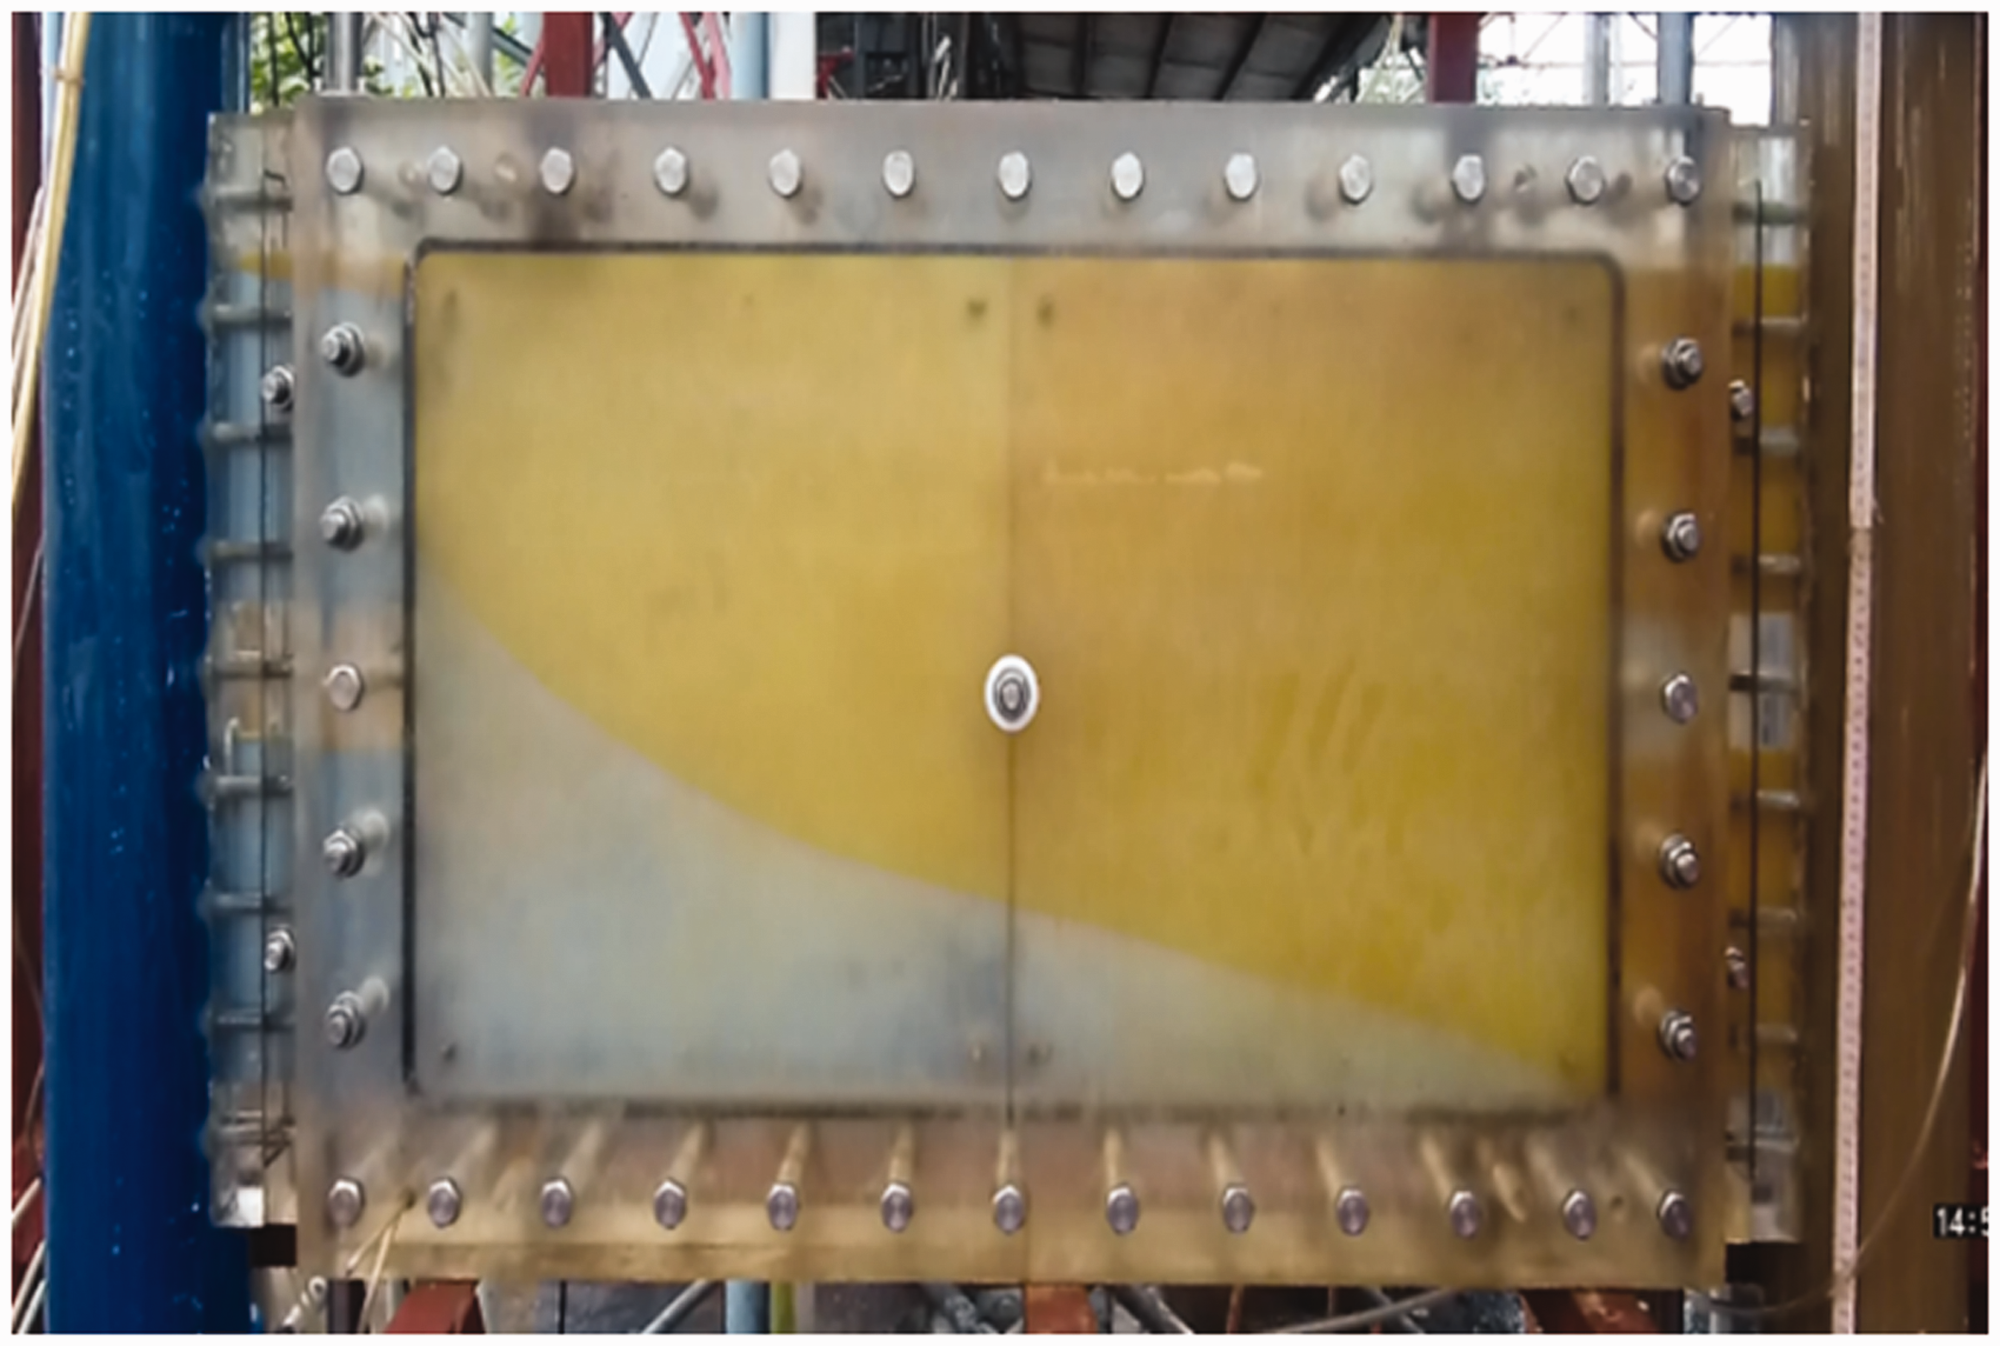
Oil–fluid interface under condition 5.
Analytical model of liquid–liquid gravity displacement in fractured formations
Displacement model of the co-existence of overflow and leakage
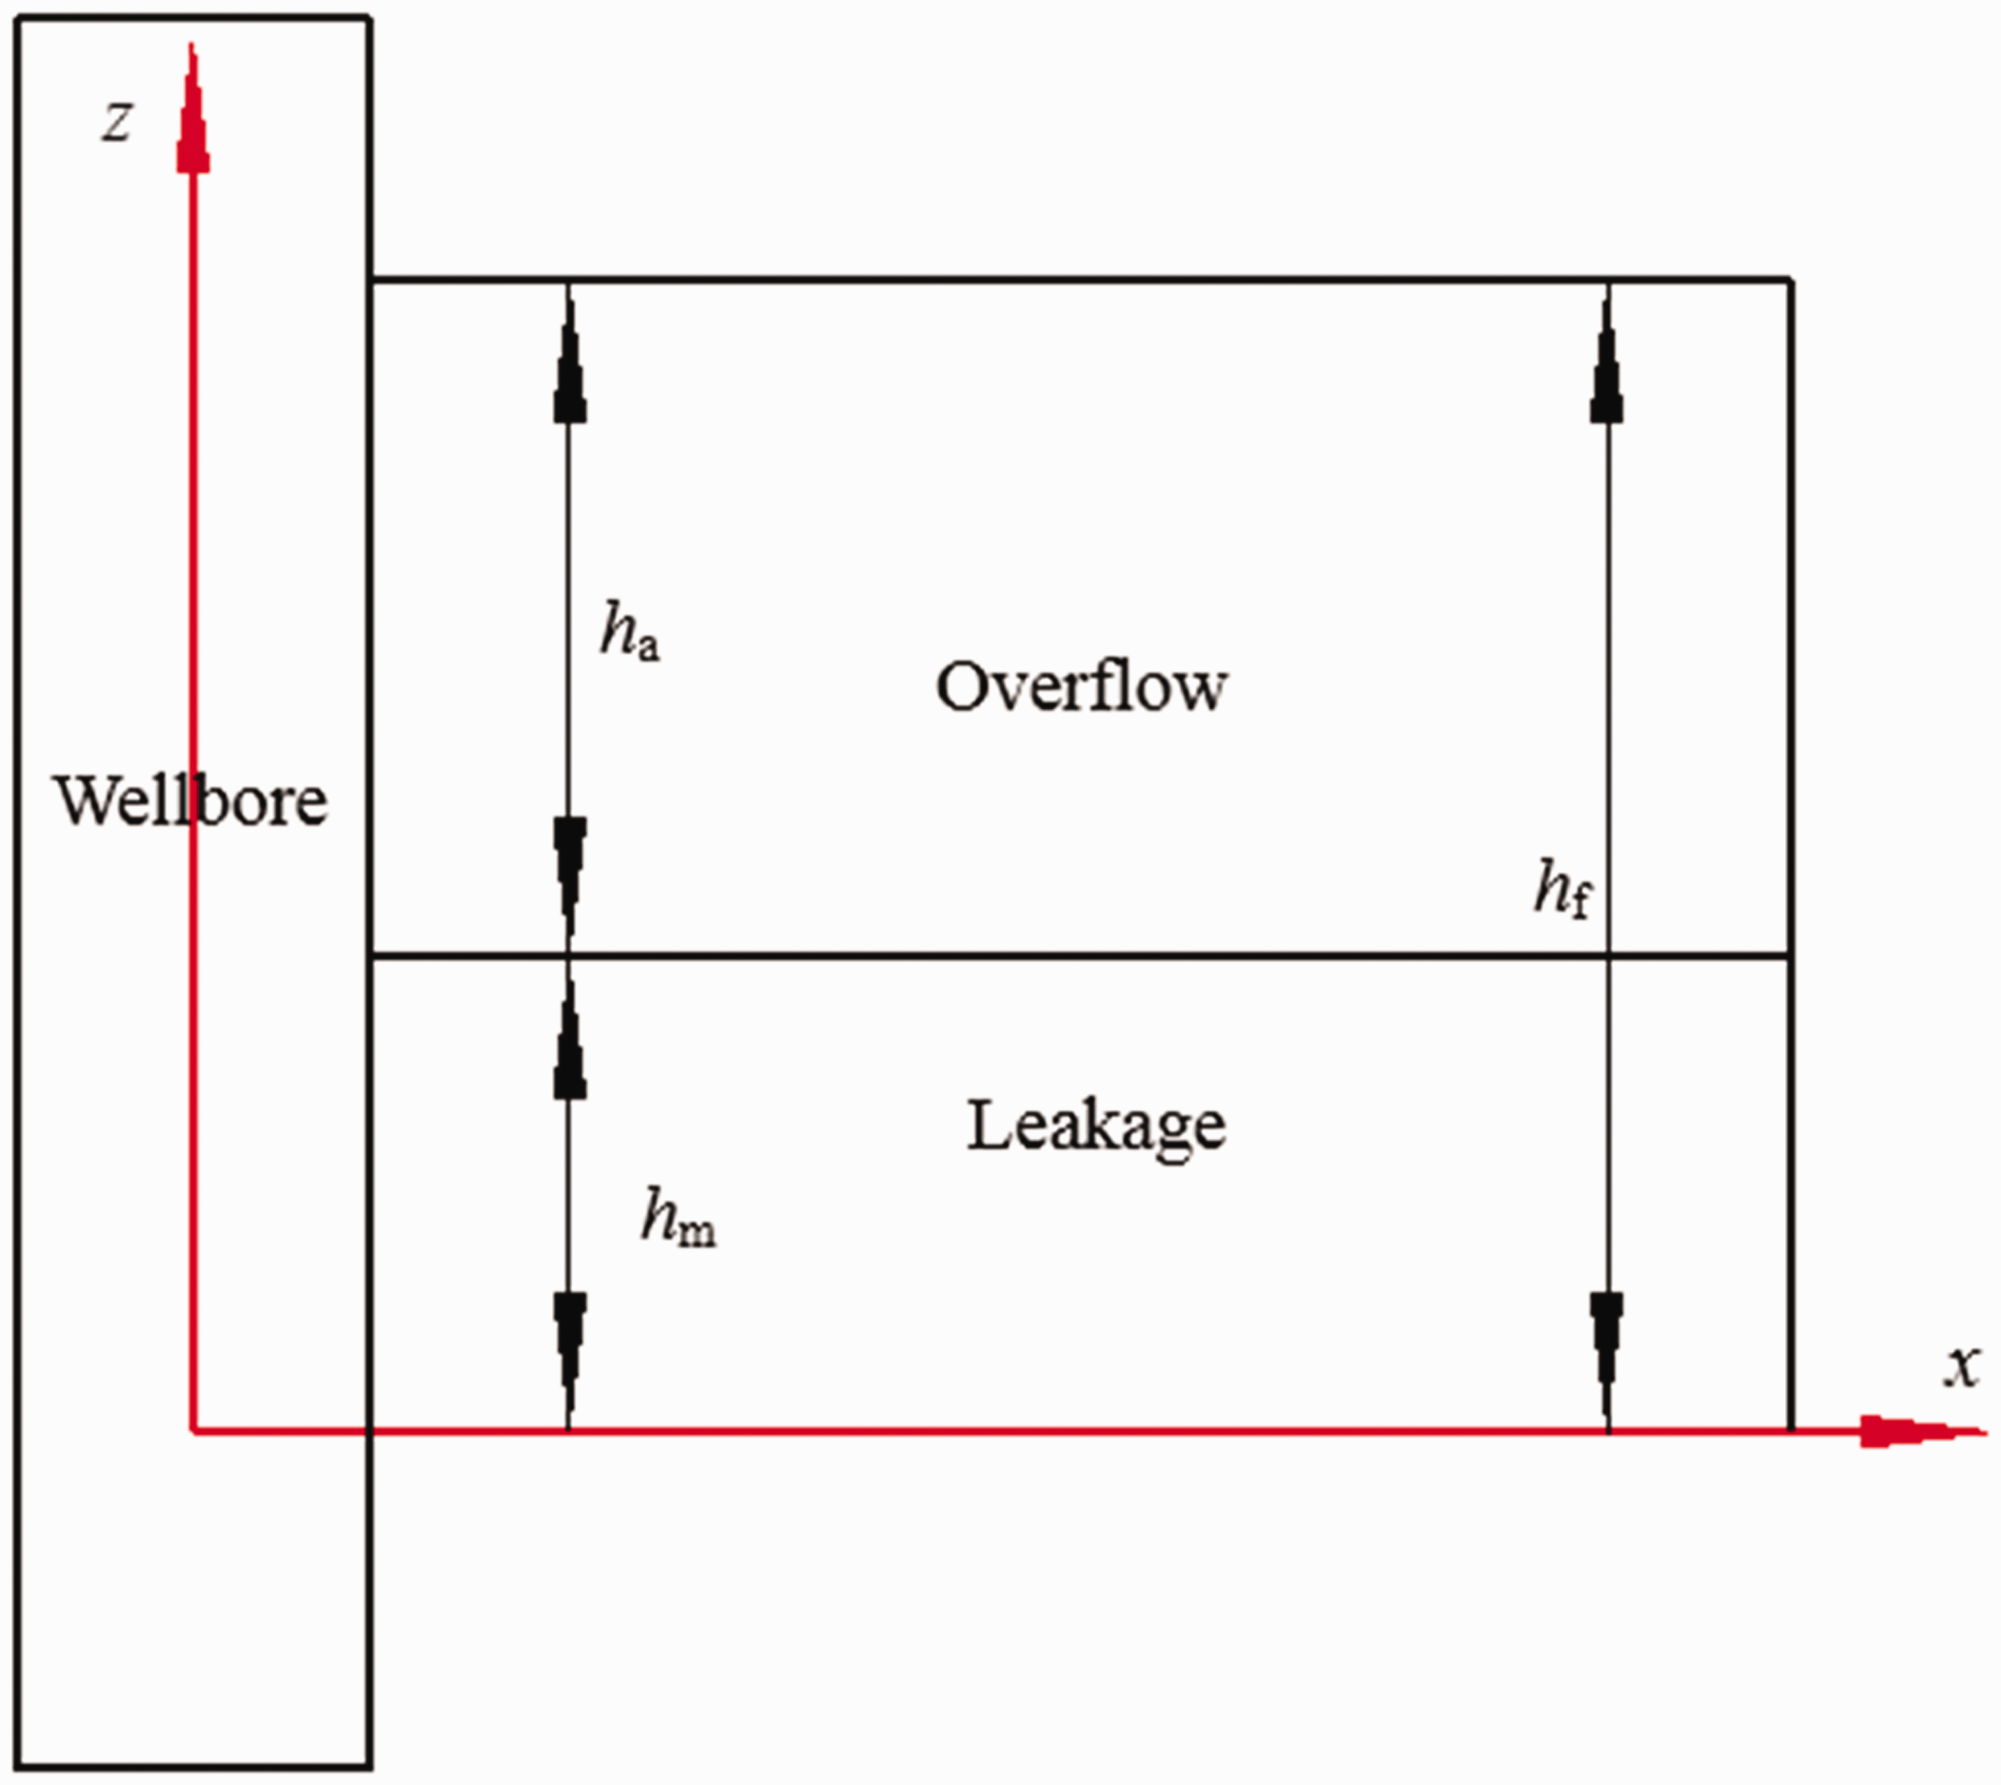
The formation has a fracture path that allows drilling fluid to flow from the wellbore into the formation, which is one of the conditions for gravity displacement (Shu et al., 2011). Let us assume that a middle-large and high-steep fracture (as shown in Figure 7) is encountered in vertical drilling. Need to mention that for middle-large and high-steep fracture, the displacement is mainly caused by gravity, and the influence of interfacial tension is negligible. One end of the fracture is connected to the wellbore, and the other end unites the wellbore and the formation (such as karst caves, fractured networks, etc.). During drilling, when the fracture is encountered, the drilling fluid in the wellbore leaks into the formation through the fracture, and the asphalt in the formation also overflows into the wellbore through the fracture, that is the drilling fluid and the formation fluid co-exist in a state of overflow and leakage. High-steep fractures are the main channels for spills and leaks, and compared to fractures, the formation matrix contributes less to the phenomenon of co-existence of overflow and leakage.
Schematic diagram of the co-existence of overflow and leakage in the asphalt layer.
When the parameters such as dip, inclination, length, and height of the middle-large and high-steep fracture are known, they can be projected onto the vertical plane of the axis of the wellbore, and then, a vertical fracture through the axis is obtained, as shown in Figure 7. The vertical fracture obtained after projection is assumed to be a parallel plate fracture, so that the equivalent hydraulic size of the vertical fracture can be obtained: height hf, length lf, width wf, and permeability kf. Because fractures are assumed to be the main channels of the spill, the fluid displacement along the fracture can be regarded as a semi-circular area displacement along the direction particularized to the length of the fracture, and the area beyond the radius re is simply not affected by the fluid displacement. The original pressure of the formation is always maintained. As shown in Figure 8, the drilling fluid leaks into the formation (including the wall of the fracture) through the fracture on the one hand, and enters the formation through the wall of the well on the other hand, which is similar to the overflow of the formation fluid. The shaded area in Figure 8 is the equivalent of the matrix formation near the wellbore and the fracture and the complex formation that contains asphalt.
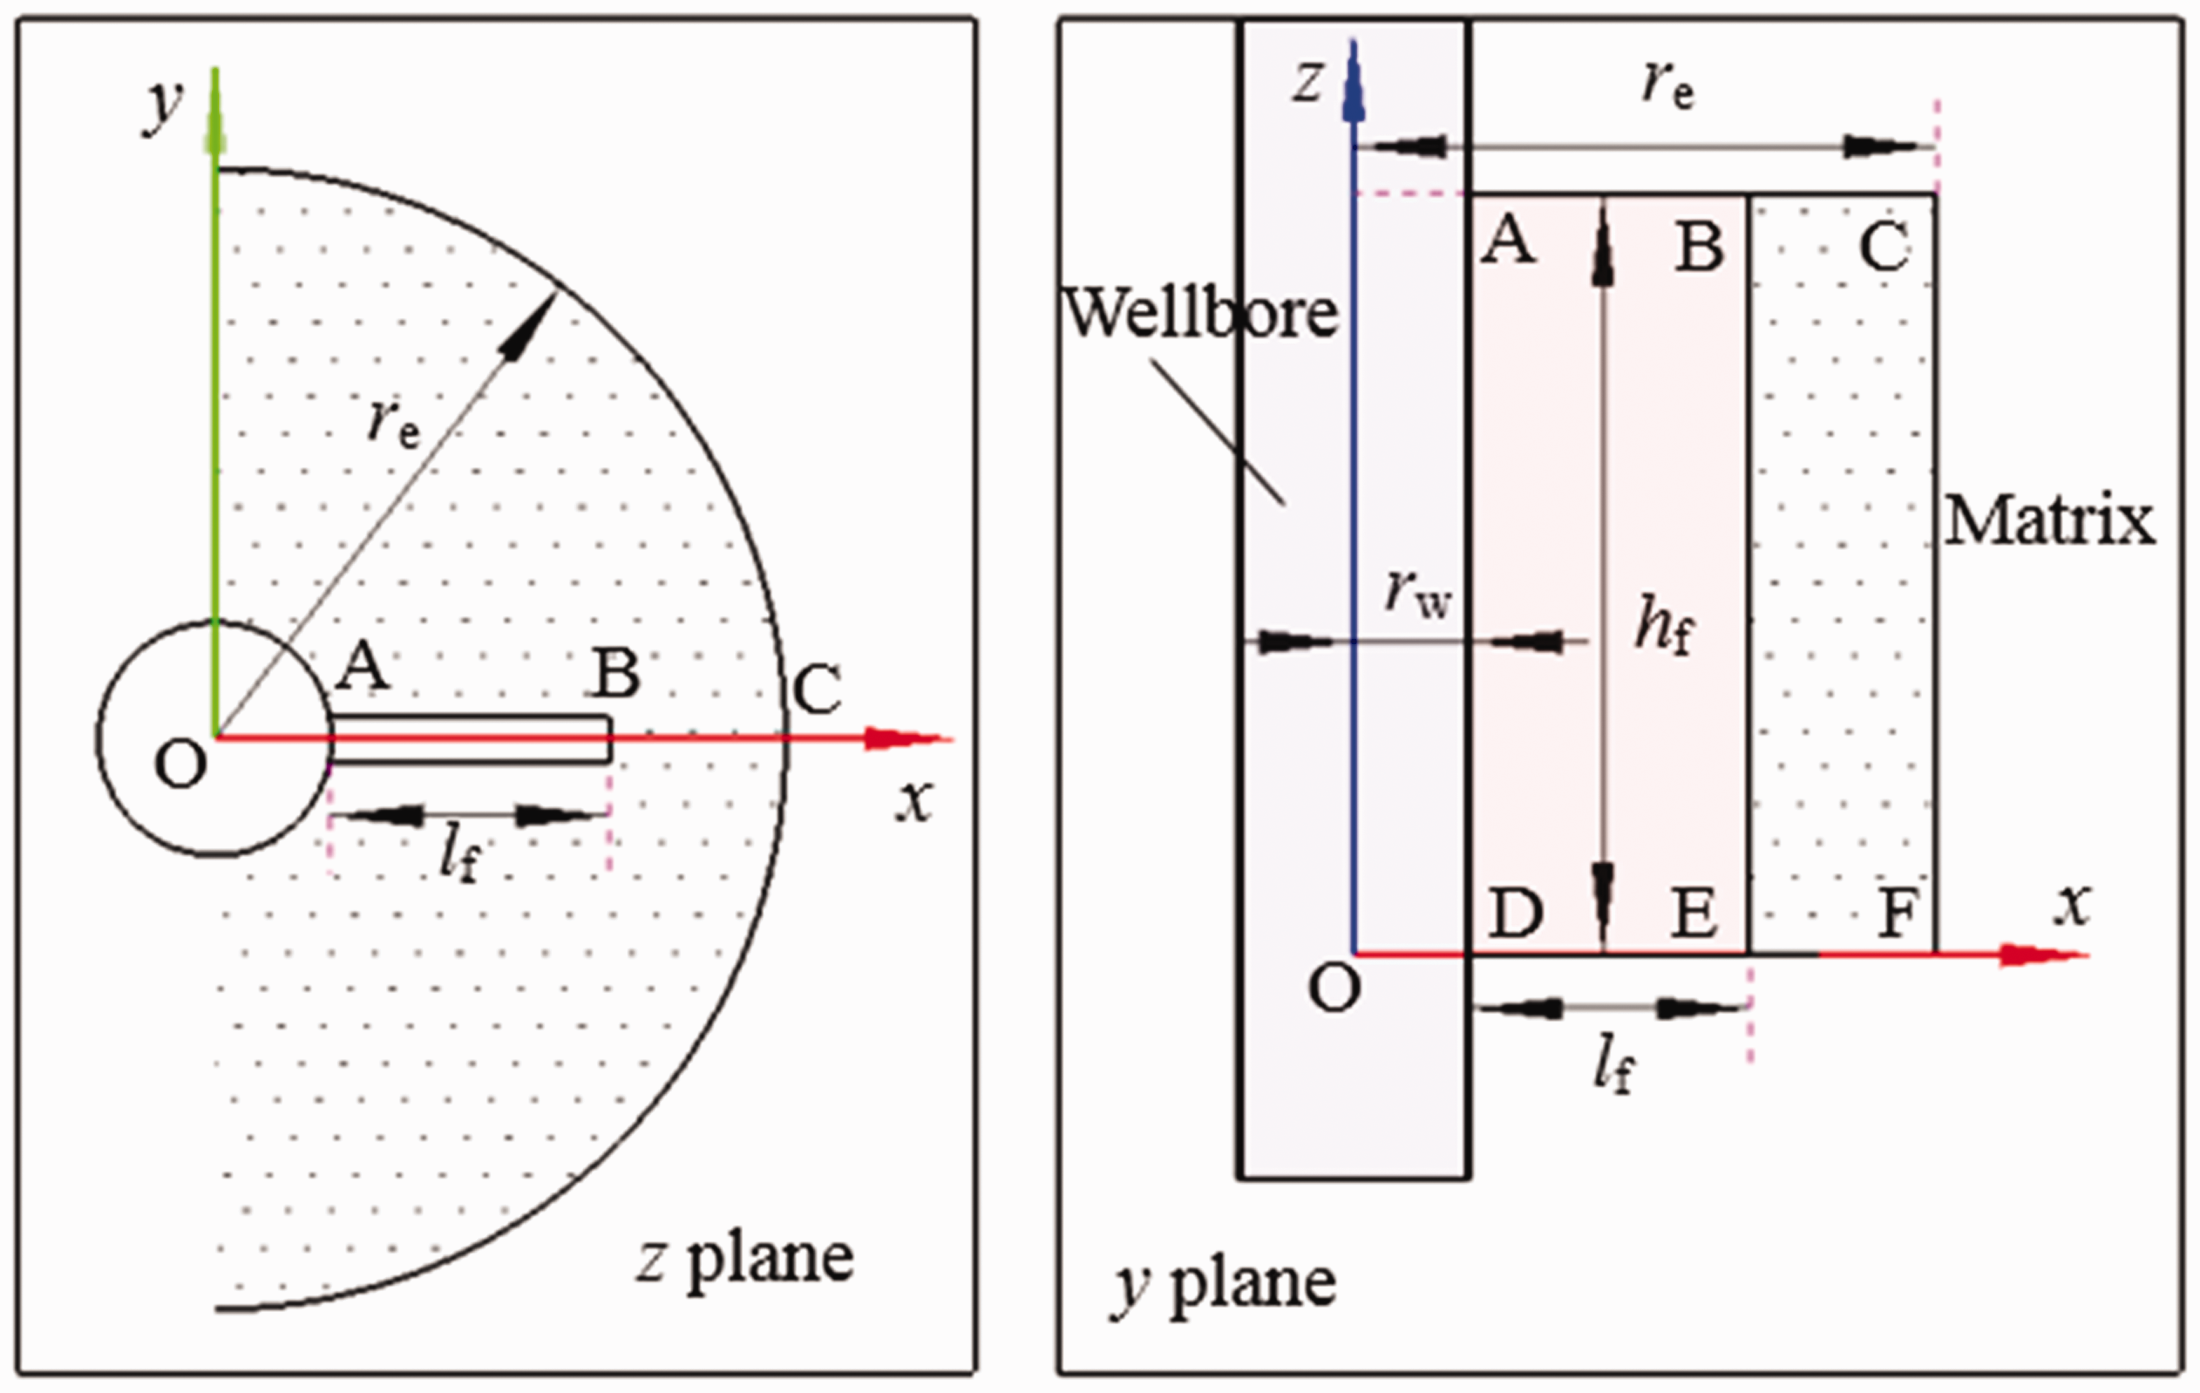
Simplified schematic diagram of a semicircle.
If we assume that the flow of the fluid in this area is subject to Darcy’s law, then there is a permeability ke in this area to ensure that the amount of leakage (or overflow) calculated by the permeability is equal to the leakage (or overflow) obtained before the problem is simplified.
Eventually, the problem of the co-existence of overflow and leakage is simplified to the problem of quasi-radial flow of overflow and leakage in the semi-circular area. The question now is how to determine the form of fluid exchange in the fracture, the form of fluid exchange in the semi-circular area, and the boundary of constant pressure in re.
To solve the quasi-radial flow problem in the simplified semi-circular shape, first, the form of fluid exchange in the wall of the well, fracture, wall of the fracture, and semi-circular area in this area is determined, and then, the equivalent method of calculation of the amount of fluid exchange is used. Here, a conformal transformation is used to derive the displacement of the steady-state co-existence of overflow and leakage. The conformal transformation’s characteristics are as follows: It only changes the type and size of the streamline, and does not change the potential on the equipotential line and the overflow (loss of leakage); it can well describe the comparatively complicated flow patterns near the wellbore, including the flow in the fracture and the quasi-radial flow in the non-fractured area; at the same time, this method can uniformly transform the different complex patterns of streamlines caused by different flow conductivity values, which has extensive adaptability.
To solve this problem, the following assumptions were initially made to transform the model accordingly:
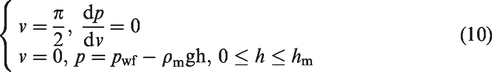
① Based on the semi-circular physical simplification model, it is considered that the drilling fluid in the wellbore only invades the formation on the right side of the y axis (the positive direction of the x axis) in Figure 8 and replaces the fluid in the corresponding formation. The maximum range of fluid displacement is a semicircle with point O as the center and re as the radius. The formation beyond this area does not participate in the fluid displacement, whose pressure is always maintained at the original formation. ② Based on hypothesis ①, the leakage of drilling fluid in the wellbore includes leakage along the fracture and leakage along the wall of the well, with loss along the fracture being the most important. After the drilling fluid in the wellbore flows into the fracture, it directly enters the formation along the fracture, and then enters the matrix formation near the wall of the fracture through the wall. ③ Correspondingly, overflows of formation fluids also meet similar assumptions, as described above. ④ The loss of drilling fluid and the overflow of formation fluids become the quasi-radial flow.
A middle-large vertical fracture can be encountered in vertical drilling, assuming that the fracture is symmetrically distributed on both sides of the well. When the fracture is encountered in drilling, the drilling fluid in the wellbore leaks into the formation through the fracture, and the asphalt in the formation overflows into the wellbore through the fracture at the same time. High-steep fractures are the main channels for spills and leaks, and compared to fractures, the formation matrix contributes less to the phenomenon of co-existence of overflow and leakage. The amount of overflow is equal to the amount of leakage in steady-state conditions, as shown in Figure 9.
Schematic diagram of the physical model of steady-state co-existence of overflow and leakage.
Here, the loss of leakage is solved by the conformal transformation, as shown in Figure 10.
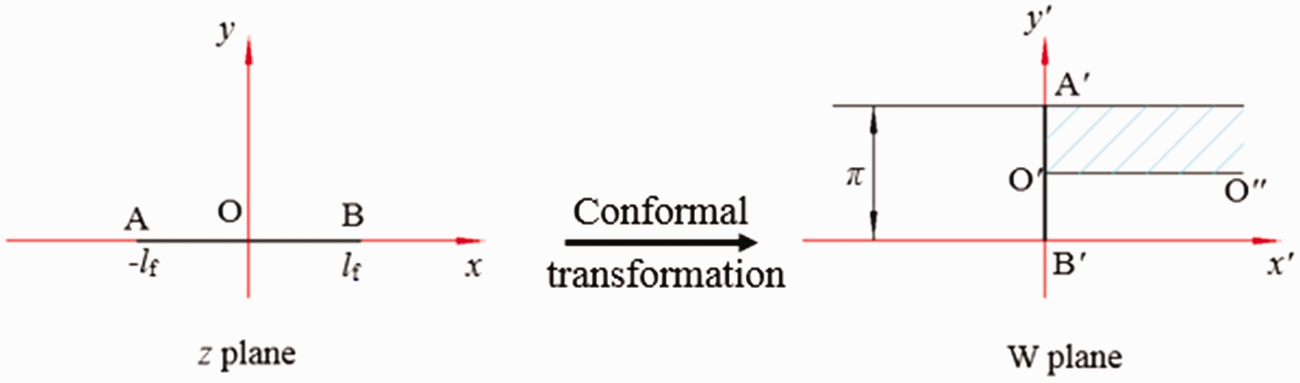
Schematic diagram of the conformal transformation.
The conformal transformation is described as follows (Emikh, 2014; Kacimov et al., 2009)

The overflow is unchanged, the potential on the boundary is unchanged, and only the length of the line and the pattern of flow are changed after the conformal transformation. Because the width of the fracture is much smaller than the distance from the wellbore to the boundary of matrix constant pressure, wf is considered to be zero during the transformation. When the flow in fractures and formation fluids is considered after transformation, wf is not zero.
If we assume that z = x+iy, and w=x′+iy′, then


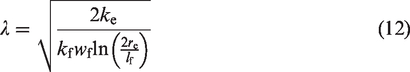
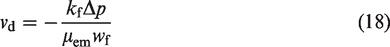
The z-plane is projected onto the w-plane after a conformal transformation (width = 0.5π and length = ln(2re/lf)). When the drilling fluid is lost, the loss is in the x′ direction, and the area above 1/2 of the right side of the y′ axis is analyzed, as shown in Figure 11. When leakage occurs, the drilling fluid in the wellbore enters the fracture through its end face, and then enters the strip formation along the wall of the fracture, and the pressure drop is Δp. For the process of drilling fluid in the wellbore entering into the fracture through the section of the fracture, the velocity of flow in the fracture can be obtained by the mass flowing out of the cell equal to the mass flowing into the unit body (Cheng et al., 1995)

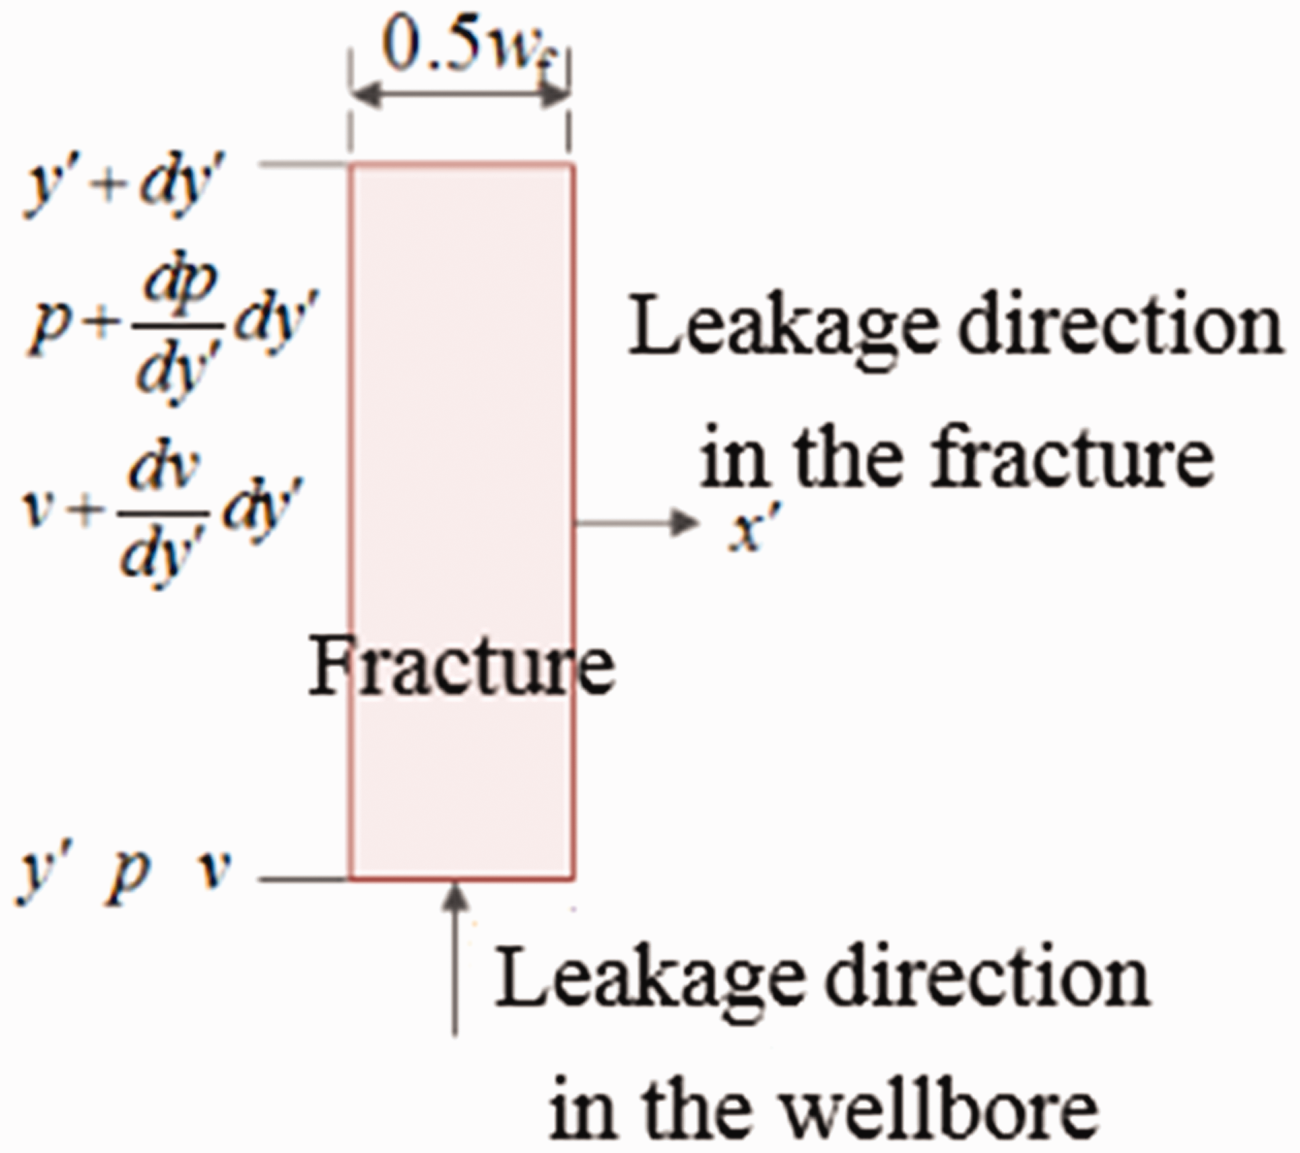
Schematic diagram of leakage in a fracture.
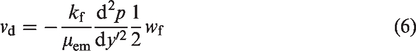
The seepage velocity in the strip formation can be described as follows

Under steady-state conditions, vd=v′d, and thus, the pressure distribution in the fracture can be obtained as
For the flow in the fracture, the wellbore is treated as a pressure boundary condition where gravity is considered, and the wall of the fracture is a continuous boundary condition of pressure
In turn, the pressure distribution in the fracture is obtained as

After the conformal transformation, these two fractures are symmetrically distributed, and therefore, the total leakage is
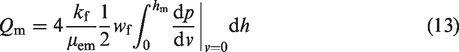
Thus, Qm is obtained as follows

Similarly, for the upper overflow layer, the boundary conditions are as follows
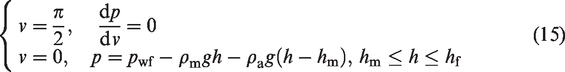
Therefore, the overflow is obtained as follows
When steady-state co-existence of overflow and leakage occurs, the overflow is equal to the amount of leakage (in the opposite direction), and thus

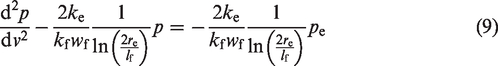
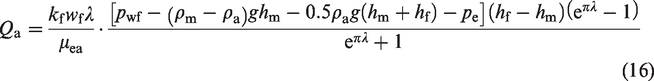
Therefore, the equivalent leakage height and the equivalent overflow height can be obtained, and then the amount of steady-state overflow and leakage can be obtained, which is the amount of fluid displacement under the steady-state condition. It can be seen from formula (16) that it is necessary to obtain ke, the converted equivalent permeability of strip formation, to simultaneously solve for the amount of overflow and leakage.
When the drilling fluid is lost, the leakage is in the x′ direction, and the area above 1/2 of the right side of the y′ axis is analyzed. When leakage occurs, the drilling fluid in the wellbore enters the fracture through its end face and then enters the strip formation along the wall of the fracture, and the pressure drop is Δp. For the process of drilling fluid in the wellbore entering into the fracture through the fracture section
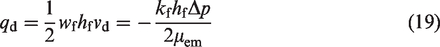
Therefore, the amount of leakage per unit time is obtained as
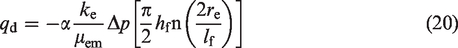
The drilling fluid entering the strip formation along the wall of the fracture is regarded as the process of fluid flowing from fractures into the matrix in the double-porosity system (Hoberock et al., 1982; Warren and Root, 1963). The amount of leakage during the process is
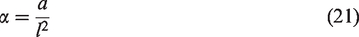
Warren and Root (1963), Lim and Aziz (1995), Kazemi et al. (1969), and Coats (1989) have proposed various expressions for shape factors, which can be written as the following unified expression
The shape factor proposed by Warren and Root (1963) is

The shape factor proposed by Kazemi et al. (1969) is

The shape factor proposed by Coats (1989) is

In actual use, the shape factor should be selected according to specific conditions, as listed in Table 3.
Value of shape factor parameters.
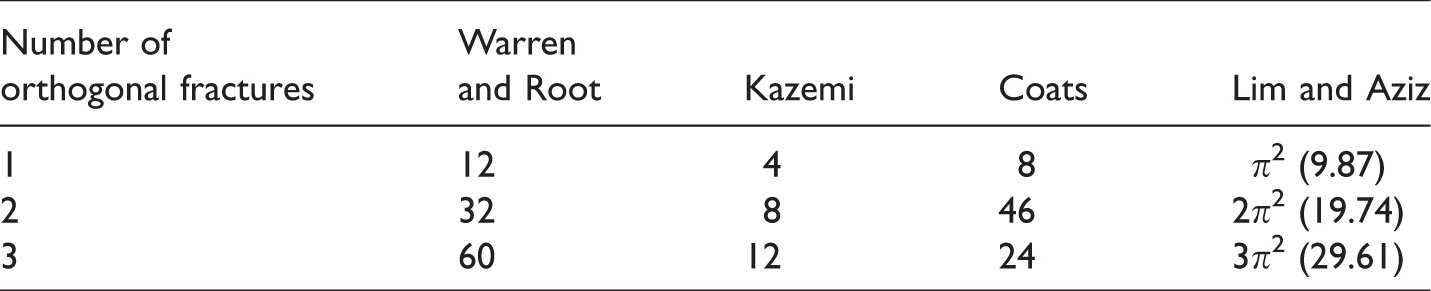
The n mentioned in the above three formulas represents the number of orthogonal fractures, and therefore
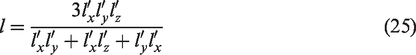
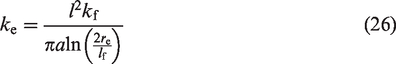
Therefore, the equivalent permeability of the strip formation is obtained according to formulas (24) and (25) as
Analysis of calculations
Comparison and analysis of the experimental data
First, four widely used models of shape factor and established theoretical models are combined to calculate the theoretical displacements, and then the results are compared with the experimental result to verify the reliability of the models. Unless otherwise stated, the parameters used in the calculation are based on experimental parameters, as given in Table 4.
Calculation parameters used in the model.
The theoretical steady-state displacement calculated using the four shape factors is shown in Figure 12. After removing some obviously incorrect experimental points, it can be seen from the figure that the theoretical results calculated by using the four shape factor models are of the same order of magnitude as the experimental results, and some of the results are well fitted, indicating that the model has high reliability and can reflect the theoretical solution of the displacement to a certain extent. When the width of the fracture is small, the effect of the Warren and Root model (a = 60) is the most optimal, that of the Lim and Aziz model (a = 3π2) is good, and the Coats model (a = 24) takes the third place. When the width of the fracture increases, the Lim and Aziz model (a = 3π2) fits better. Overall, the width of the fracture and the amount of leakage are related by a power function. The Lim and Aziz model (a = 3π2) is the most optimal among the four models, and therefore, it was adopted in the latter analysis, and it is no longer separately explained.
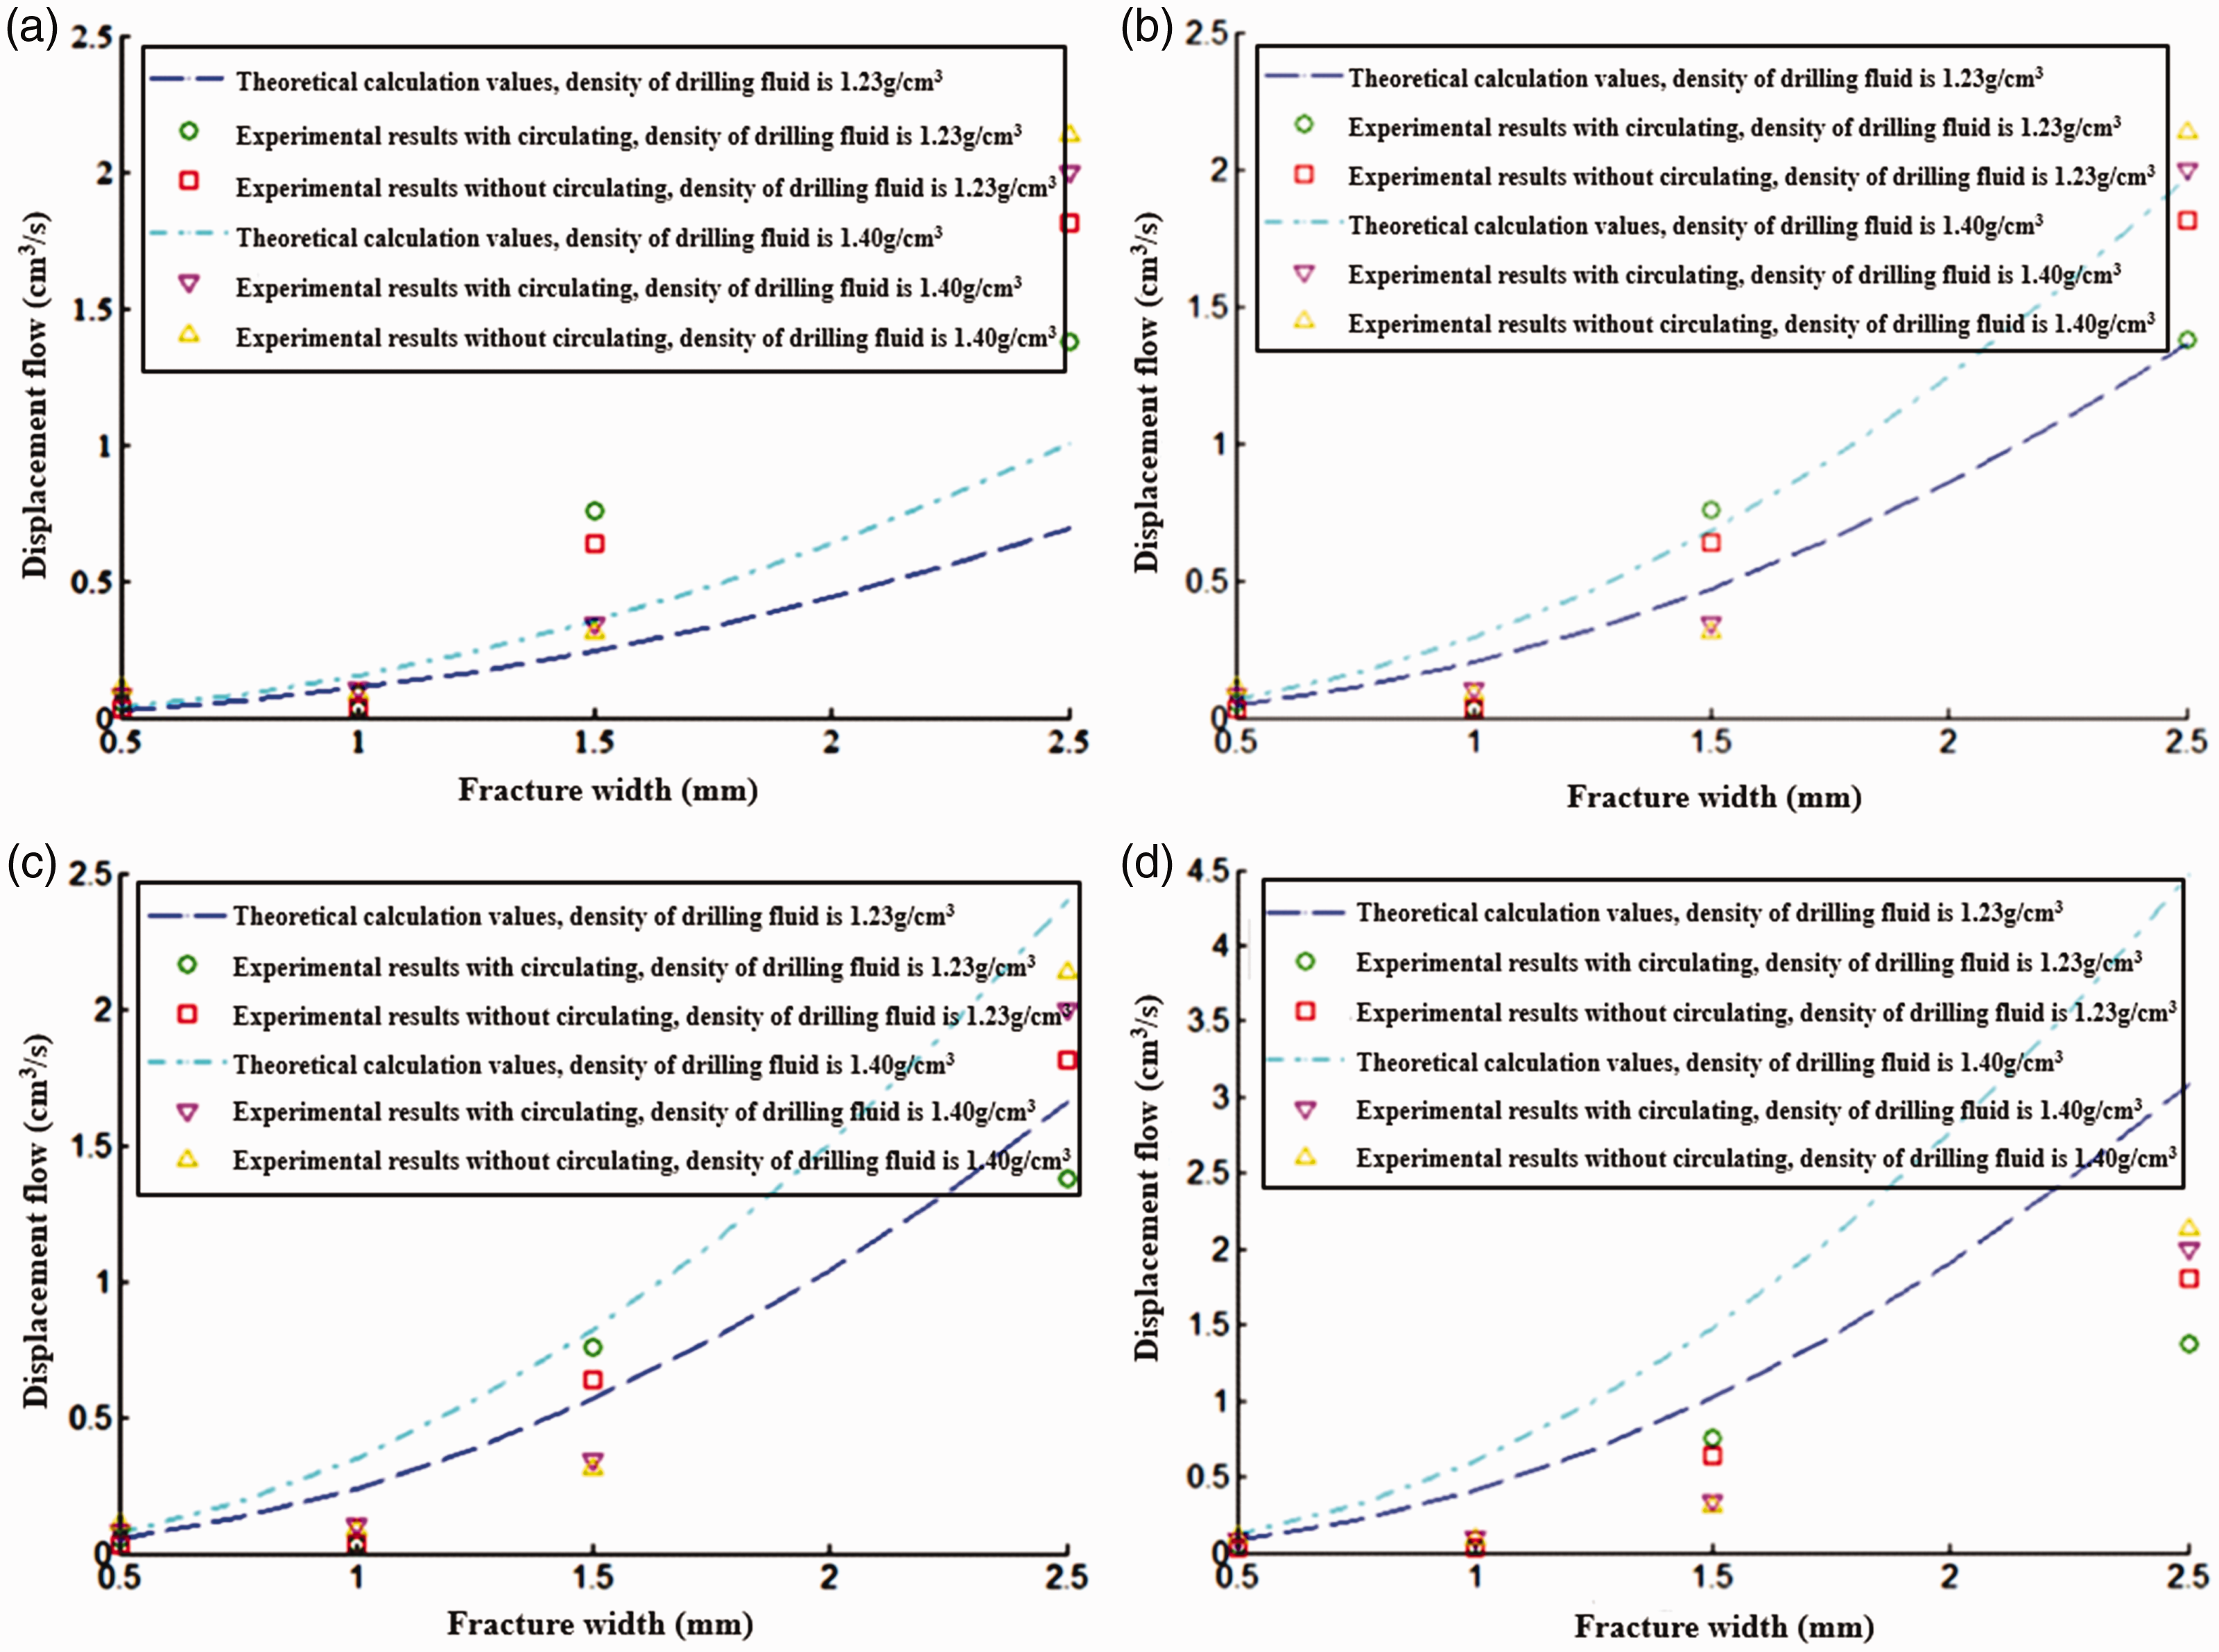
Relationship between the amount of displacement and width of fracture. (a) Warren and Root model (a = 60), (b) Lim and Aziz model (a = 3π2), (c) Coats model (a = 24), and (d) Kazemi model (a = 12).
Figure 13 shows the relationship between leakage loss and density of drilling fluid under different conditions of asphalt viscosity. It can be seen that the leakage loss and density of drilling fluid are nearly linearly related, and, when the viscosity of the asphalt is small, the calculated value is well fitted to the experimental value. When the viscosity of the asphalt is high, the fluid’s deviation from the Darcy flow is much more obvious. At the same time, the displacement obtained experimentally is much smaller, and the precision of the experiment is reduced. Therefore, the fitting effect is poor in terms of both aspects.
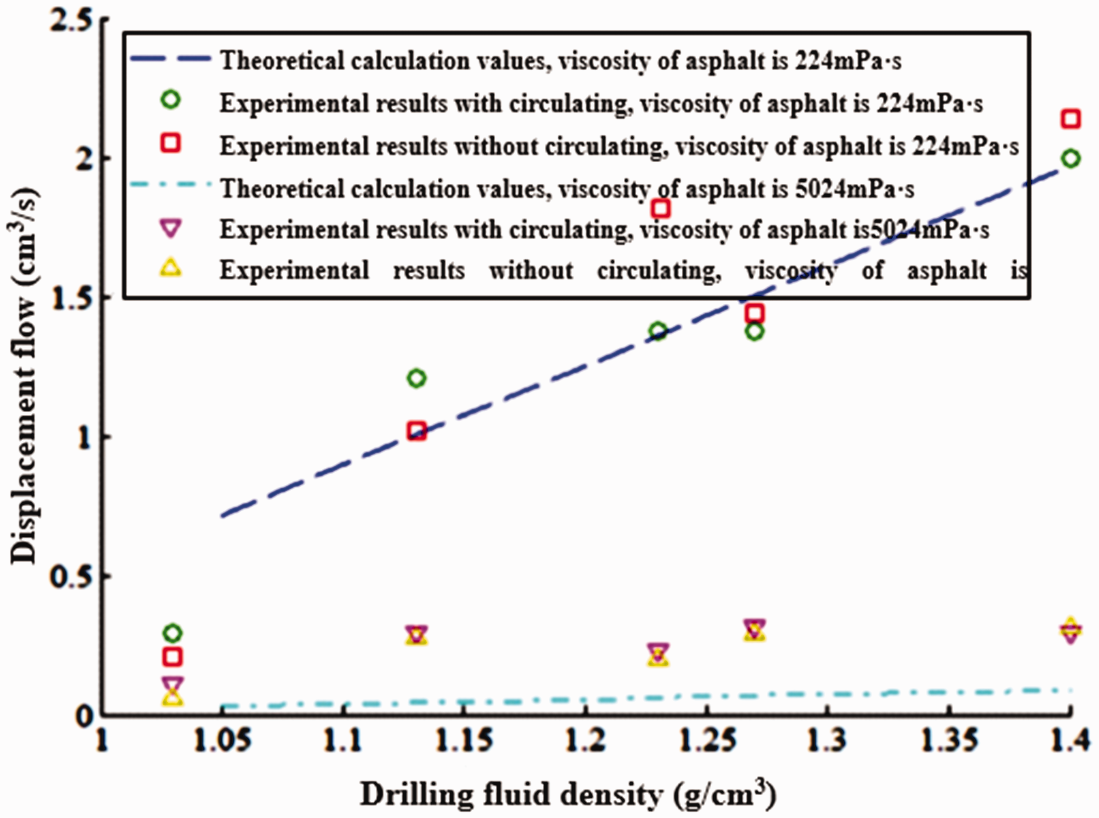
Relationship between leakage loss and density of drilling fluid (for a fracture width of 2.5 mm).
Analysis of sensitivity factors
Figure 14 shows the relationship between displacement and width of the fracture under different densities of drilling fluid. The density affects the distribution of pressure in the wellbore. As the density of the drilling fluid increases, the displacement increases. So, when a gravity displacement overflow occurs, killing the well will increase the overflow instead.
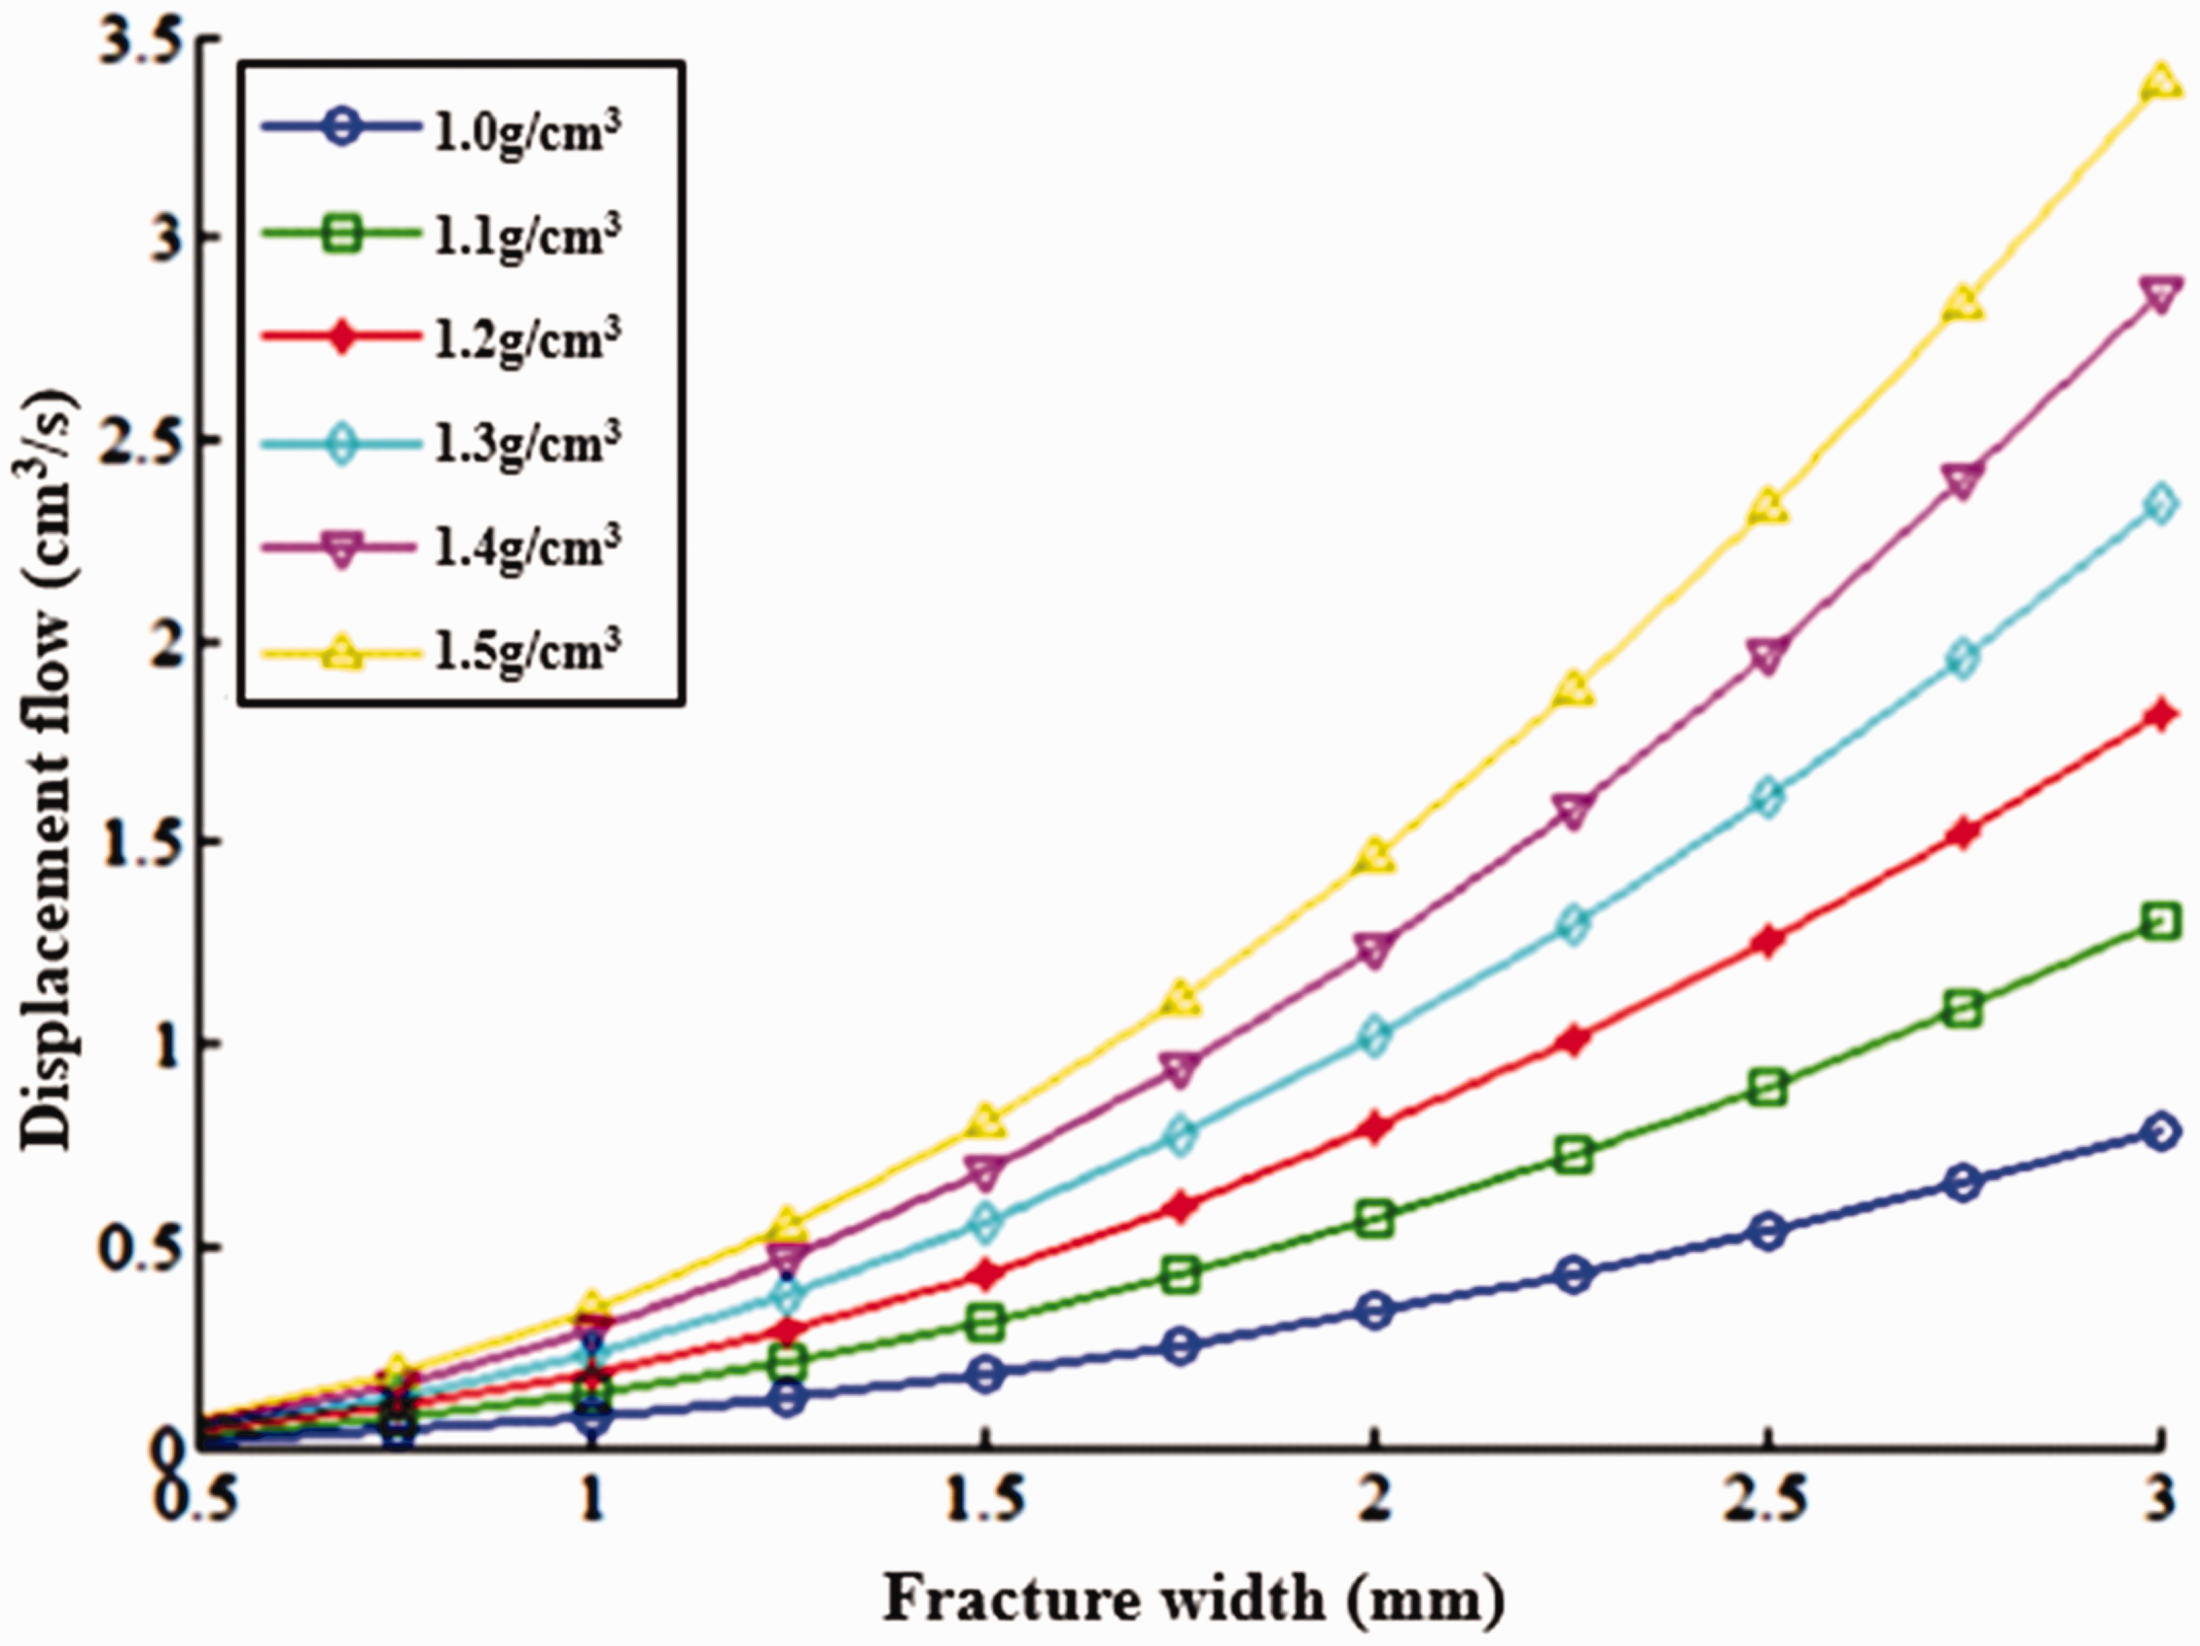
Effect of density of drilling fluid on displacement.
Figure 15 shows the relationship between the displacement and height of the fracture. It is assumed that the length of the wellbore remains at 1.5 m, but the height of the fracture has increased. Because the fracture is the main channel of fluid replacement, the larger the fracture height, the larger the replacement space, and therefore, the greater the amount of displacement.
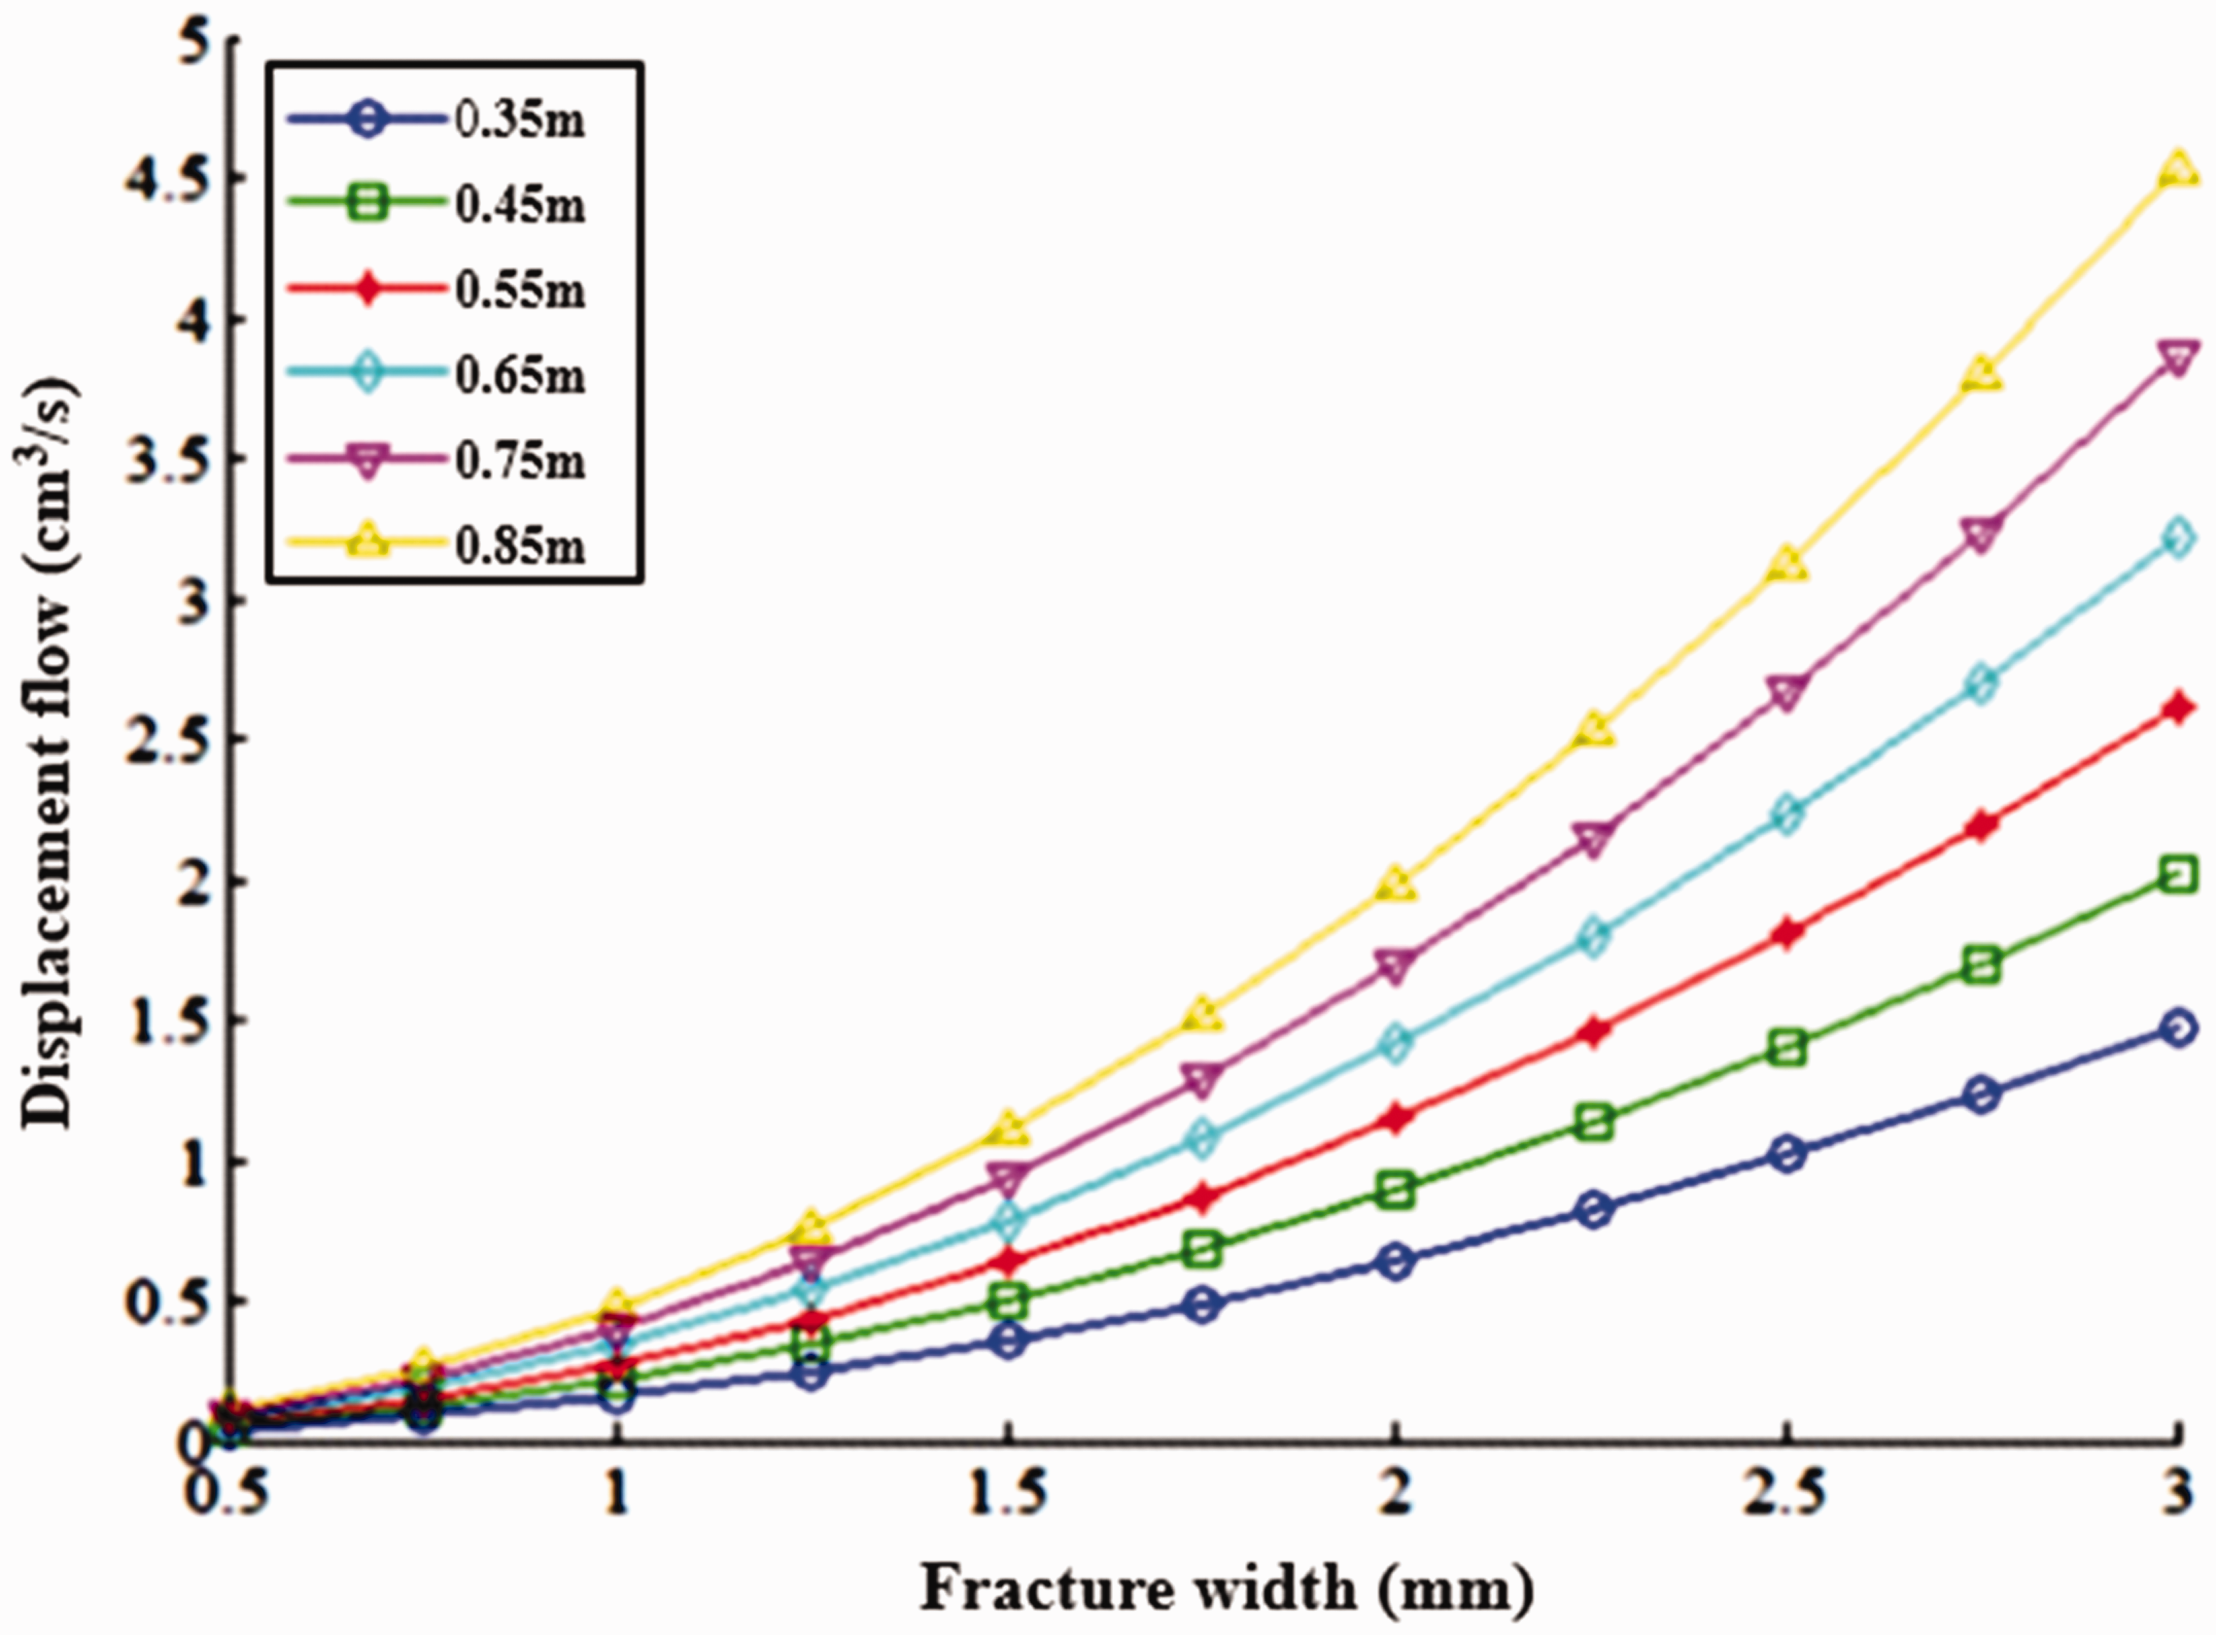
Effect of the height of fracture on the displacement.
Figure 16 shows the effect of the length of fracture on the displacement. It can be seen that as the length of the fracture increases, the amount of displacement increases, but the magnitude of the increase gradually decreases. The effect of length of the fracture on the displacement is slightly less than that of fracture height on the displacement.
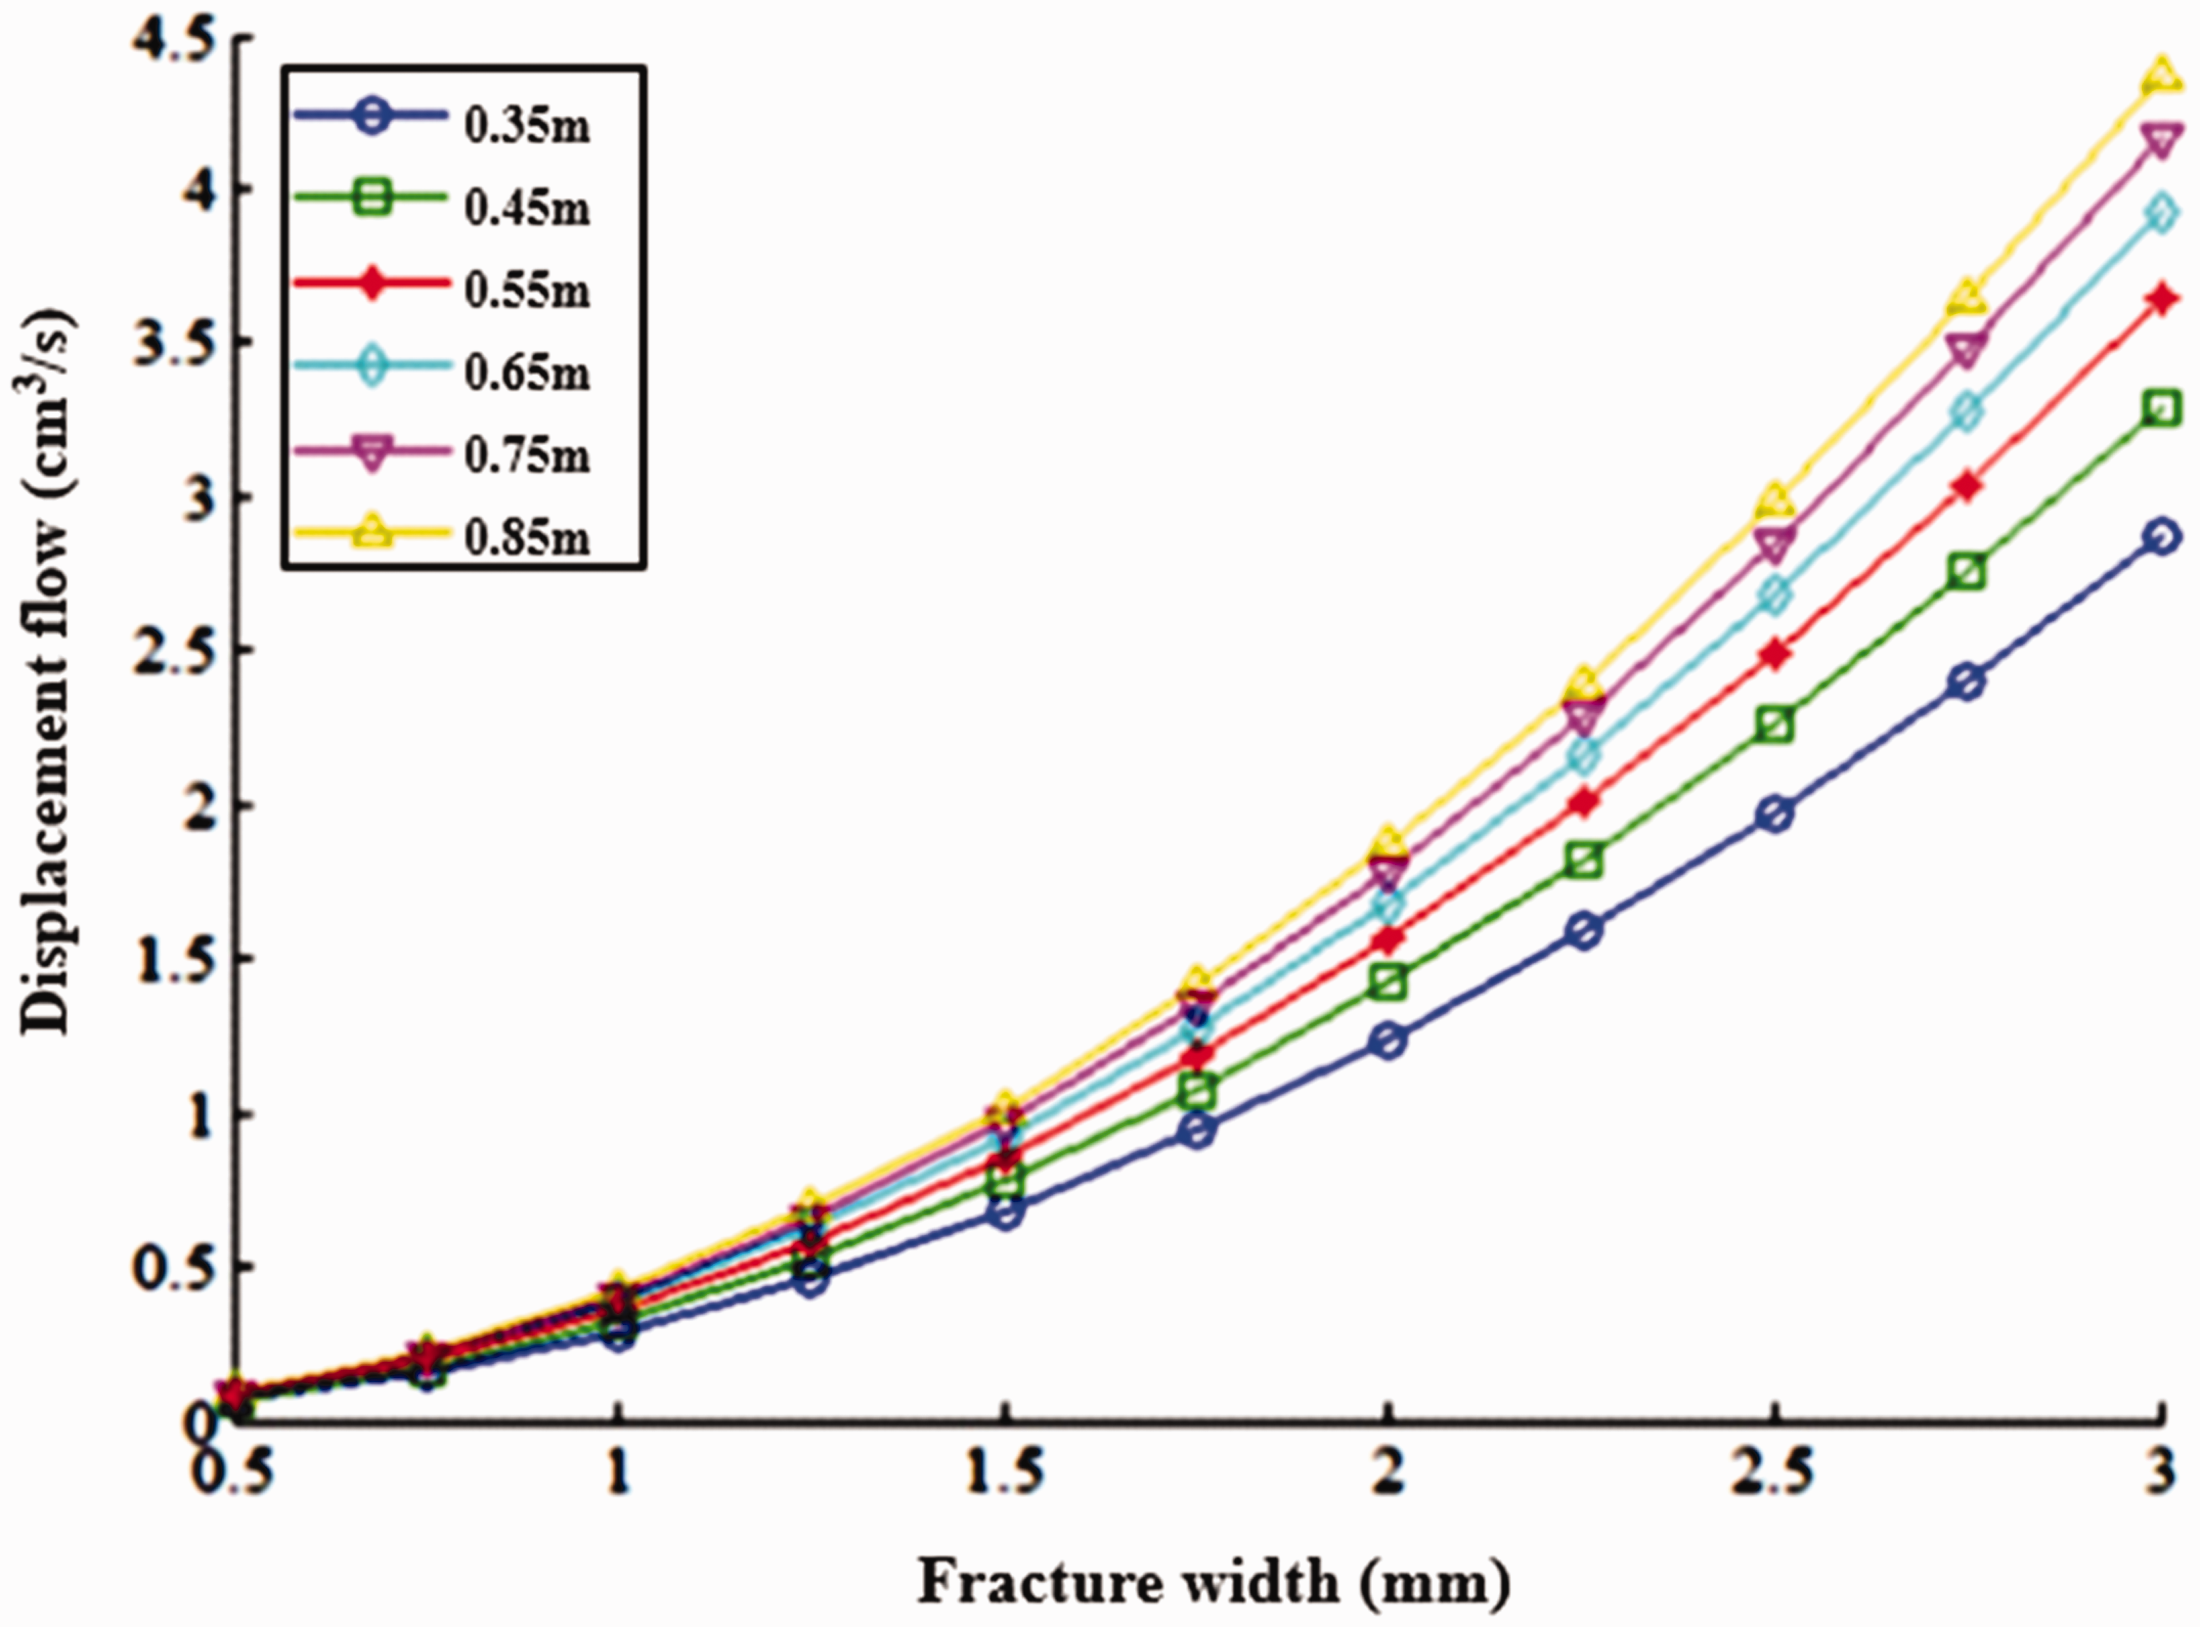
Effect of the length of fracture on the displacement.
Figure 17 shows the effect of the viscosity of asphalt on the displacement. It can be seen that the lower the viscosity of the asphalt, the greater the amount of displacement. Additionally, the decrease of the displacement is more obvious with the increase in asphalt viscosity.
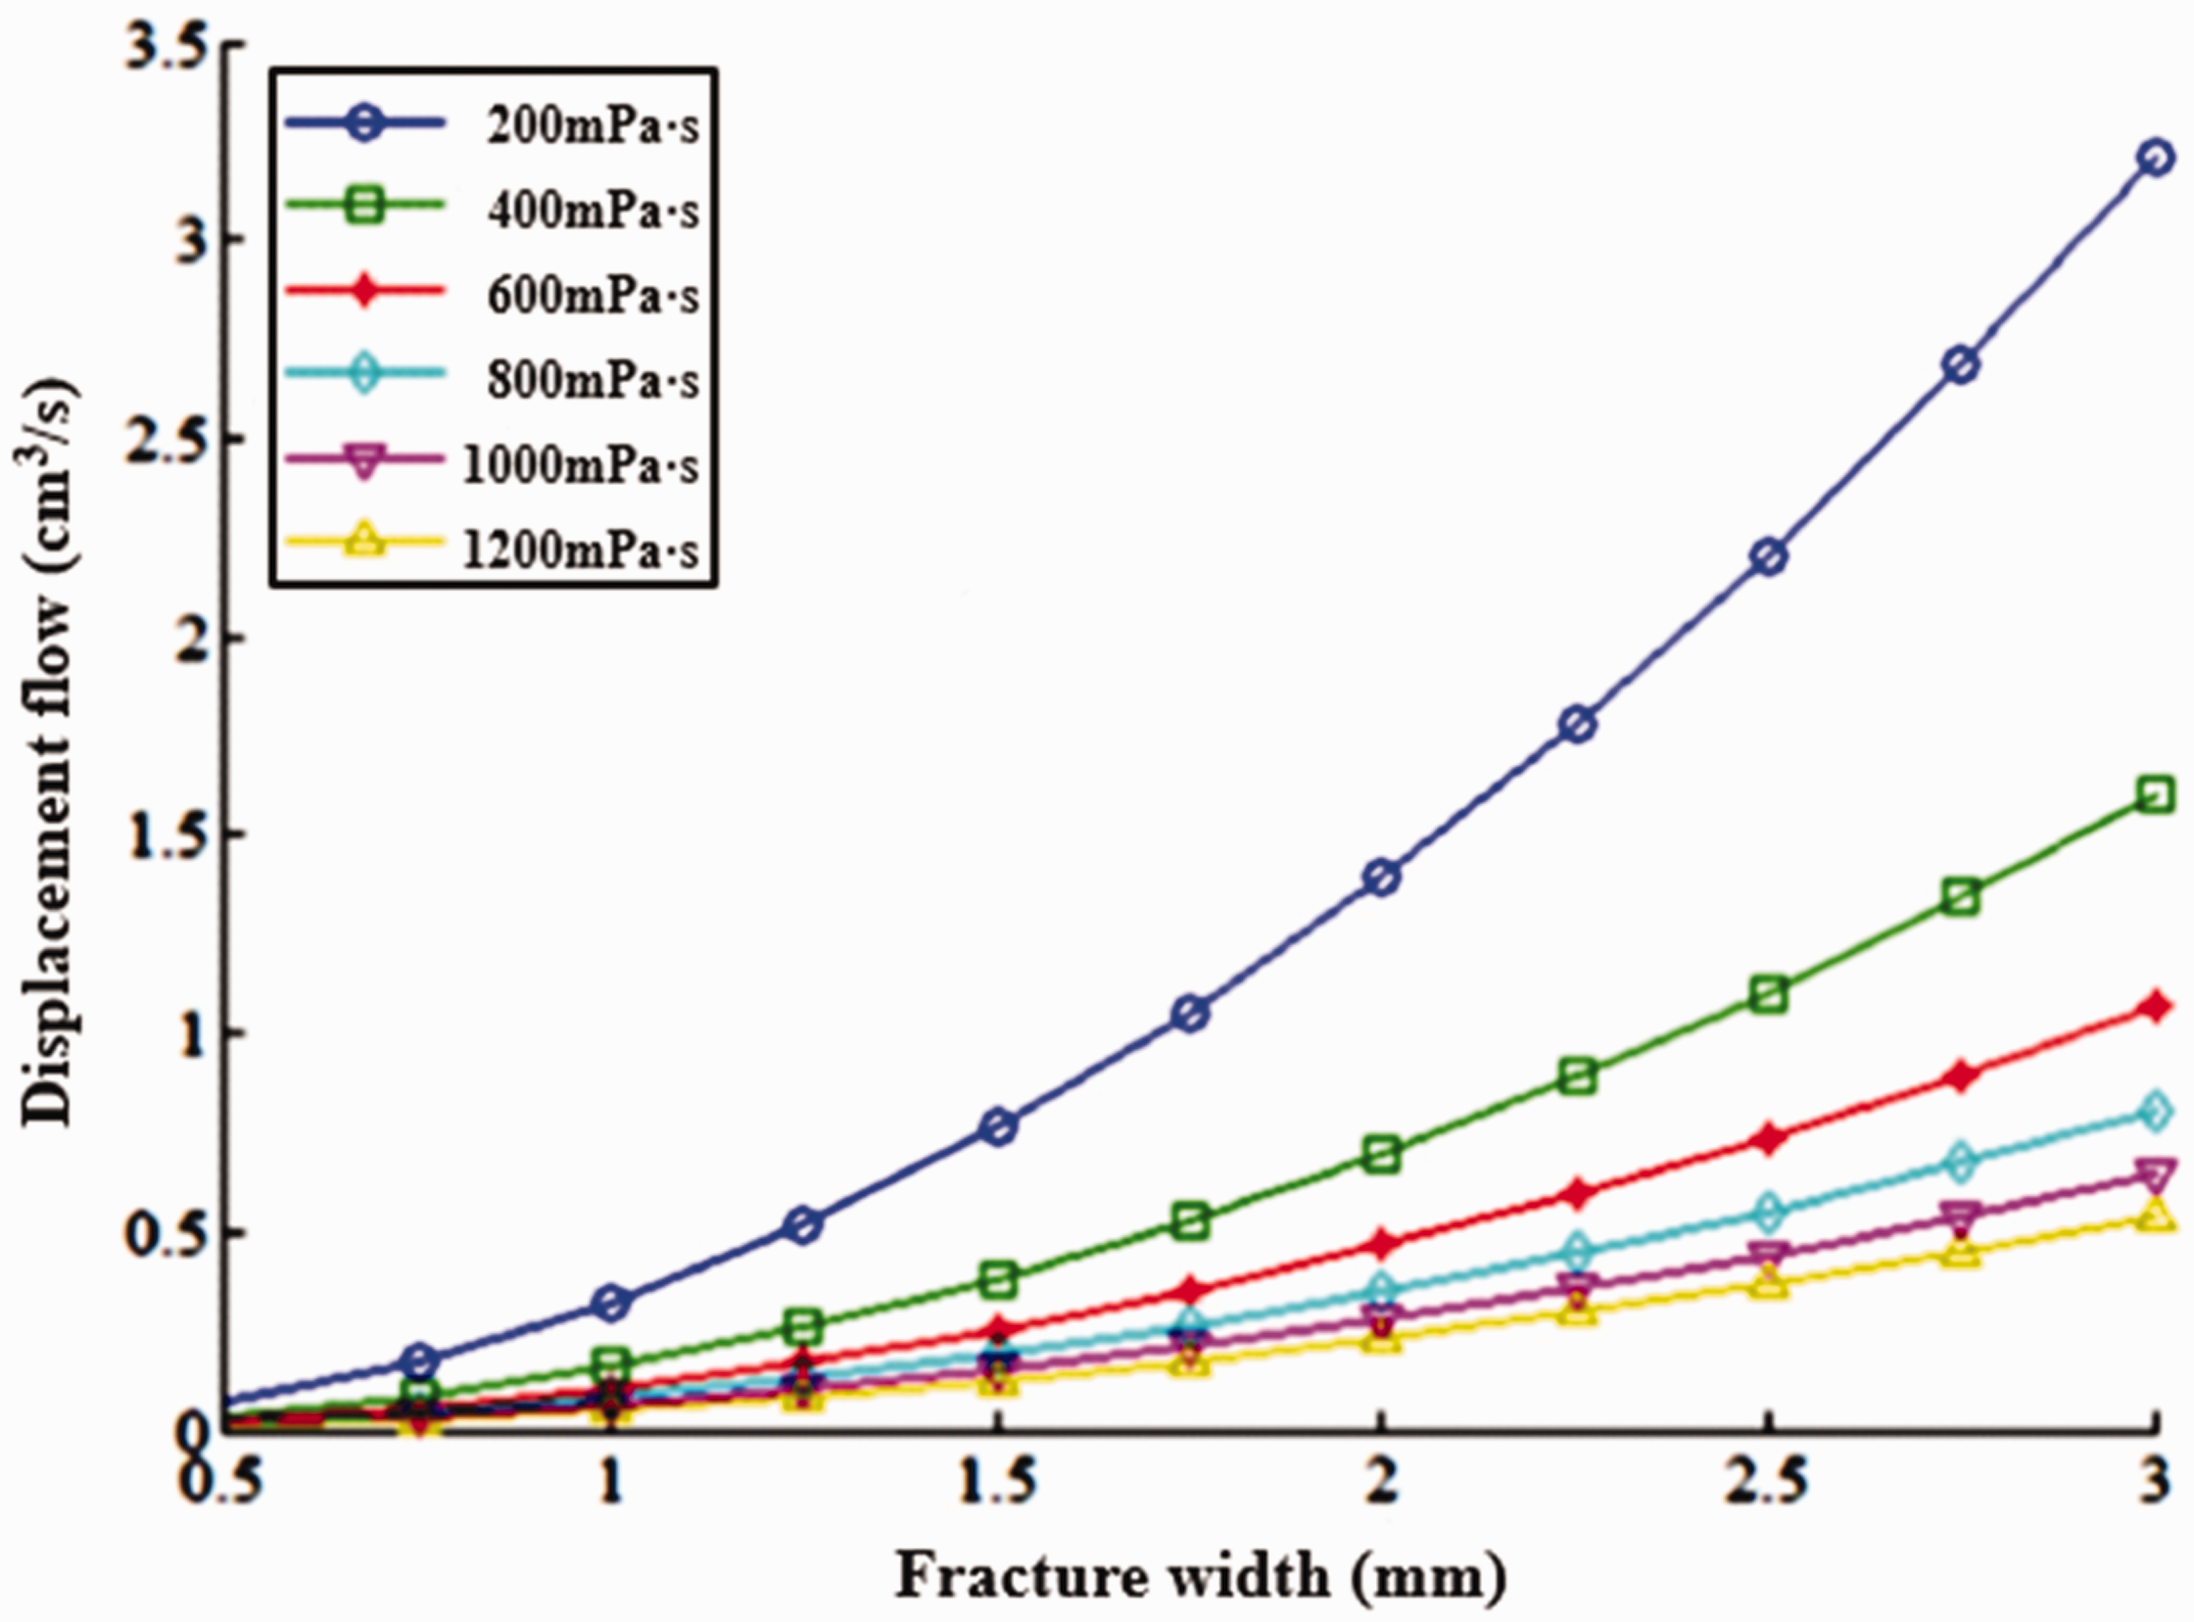
Effect of the apparent viscosity of asphalt on the displacement.
In addition to the above analysis, it can be observed in Figures 15 to 17 that the effect of fracture width on displacement is very large. As the width of the fracture increases, the displacement flow increases. In the case of simultaneous overflow and leakage due to gravity displacement, it is not appropriate to perform precise managed pressure drilling (PMPD). Instead, by plugging the leak, the plugging agent stays in the fracture, resulting in the decrease of the effective width of the fracture, which can also greatly reduce the displacement flow.
Conclusion
Based on the basic theories of rock mechanics, fluid mechanics, and seepage mechanics, and by considering the conformal transformation and turbulence model of dual-medium fracture-porosity, a steady-state mathematical model of liquid–liquid gravity displacement in fractured formations was established in this study. The shape factor was optimized, and the feasibility of the mathematical model was verified in combination with the gravity displacement experiments. The experimental results are basically consistent with the calculation results of the mathematical model. Analysis of the effects of the density of drilling fluid, height and length of fracture, and viscosity of asphalt on the displacement yielded corresponding rules. In the case of simultaneous overflow and leakage due to gravity displacement, plugging is a better treatment than perform PMPD.
Footnotes
Declaration of conflicting interests
The author(s) declared no potential conflicts of interest with respect to the research, authorship, and/or publication of this article.
Funding
The author(s) disclosed receipt of the following financial support for the research, authorship, and/or publication of this article: The authors gratefully acknowledge funding by the Natural Scientific Foundation of China (51674217 and 51874252) and Sichuan Youth Science and Technology Innovation Research Team (2019JDTD0026).
Supplemental material
Supplemental material for this article is available online.
References
Supplementary Material
Please find the following supplemental material available below.
For Open Access articles published under a Creative Commons License, all supplemental material carries the same license as the article it is associated with.
For non-Open Access articles published, all supplemental material carries a non-exclusive license, and permission requests for re-use of supplemental material or any part of supplemental material shall be sent directly to the copyright owner as specified in the copyright notice associated with the article.