
Abstract
Mining and using depletable fossil fuel usually result in severe environmental problem such as climate change in the global scale and acid rain in the regional level. To improve sustainable development, it is important to substitute fossil fuel with renewable and clean energy sources. In this study we employ a partial equilibrium, price endogenous mathematical programming model to analyze how bioenergy development in Taiwan can (1) enhance domestic energy production, (2) reduce the carbon dioxide (CO2) and sulfur dioxide (SO2) emissions, and (3) protect the environment. The results show that the ethanol expands with an increase in gasoline price, but SO2 emission reduction would shrink because of a reduction in renewable electricity generation. Conversely, up to 10.4% of Taiwan’s annual SO2 emission can be reduced in the face of higher coal and emission prices. A tradeoff between CO2 and SO2 emission reductions is perceived during the switch of production of liquid and nonliquid bioenergy. Policy implications such as technology selection, market operation, and government subsidy are also discussed.
Introduction
The use of fossil fuels such as coal and petroleum has been growing at an unprecedented rate in recent decades. Although their use is considered to be a major force of modern economic growth, it is not a sustainable path since fossil fuels will eventually be depleted. In addition to resource depletion, the detriment effect from emissions causes environmental concern to the world. For example, carbon dioxide (CO2) emission from the use of fossil fuels would intensify greenhouse effect and some irreversible consequences such as melting of glacier would occur (Thompson, 2010). The report released by the Intergovernmental Panel on Climate Change (IPCC, 2007) shows that the average temperature has increased by approximately 0.5°C in the 20th century and that increase in temperature can further rise by 1.4–5.8°C by the end of the 21st century (McCarl, 2006). With such a huge climate shift many uncomfortable outcomes such as sea level rise, desertification, diminished land productivity, and increased possibility of extreme events will inevitably occur, thereby hampering the economic growth and environmental protection. Despite the global climate shift and greenhouse gas (GHG) effects, the use of fossil fuels also emits considerable amounts of sulfur dioxide (SO2) that can deteriorate the regional environment via the more occurrences of acid rain and acid mine drainage (Kalkreuth et al., 2014; Tripathi et al., 1991; Weber et al., 2004), all of which make regional economic and environmental development unsustainable. For instance, Kuo and Tsuang (2005) point out that Taiwan’s annual SO2 emission is approximately 71,000 t and many health problems and reduction of social welfare have been observed.
The development of renewable energy reduces the reliance on unsustainable fossil fuels and improve environmental sustainability, and has been intensively investigated in recent decades (Berktay et al., 2004; Fargione et al., 2008; Kung and Zhang, 2015; Rusu et al., 2018; Salam and Khan, 2018; Searchinger et al., 2008; Taylan et al., 2018; Wang, 2007). Several renewable energy technologies such as wind power, solar energy, hydroelectricity, and bioenergy are currently available, and almost all of them (depending on the regional characteristics and production process) are considered to result in positive environmental and economic consequences. They are of particular interest to Taiwan where more than 99% of its energy is imported. Additionally, soil salinization induced by sea level rise can be harmful to territory and agriculture (Chang et al., 2012), and thus in order to avoid such climate-induced impacts Taiwanese government is interested in the development of renewable energy.
Among available renewable energy techniques, bioenergy attracts extraordinary attention because a substantial amount of land has been released and can be utilized in energy crop program. To decrease the demand of gasoline and coal, ethanol and renewable electricity are the major types of bioenergy discussed in Taiwan. Although ethanol and electricity are not mutually exclusive technologies, simultaneous development of these technologies is more suitable for large countries such as China and the United States because they have much more resources that can be utilized in the bioenergy production. However, it is not the case for small countries or regions such as Singapore and Taiwan where agricultural resources are relatively scarce. Thus, in such areas it is more important to determine the primary bioenergy technology so that the feedstock supply can be insured. One renewable electricity technology called pyrolysis that potentially reduces the competition of feedstock is an attractive option to Taiwanese government. Pyrolysis is to heat the biomass (or other organic matters) in the absence of oxygen, and the feedstocks will be decomposed into energy-full materials such as biooil, biogas, and biochar (Bridgwater, 2005). Studies have shown that with proper utilization of these products, pyrolysis technology can reduce the use of coal, increase the domestic energy supply, decrease the GHG emissions, reduce the possibility of having acid rain and other air pollutions, and improve the welfare of the society as a whole (Glaser et al., 2009; Lehmann, 2007a).
To examine the aggregate economic benefits, environmental consequences, and pollution control strategies from large-scale development of bioenergy, this study integrates multiple bioenergy technologies by employing a price endogenous, mathematical programming model. Specifically, we aim to explore that, to what extent bioenergy development could reduce the use of fossil fuel, increase social welfare, and decrease CO2 and SO2 emissions. Since biochar, an important output from pyrolysis technology, can be utilized in various ways, we also examine these possibilities to explore its contribution to energy supply and emission mitigation under various applications. This study contributes in several ways. First, an aggregate emission reduction from bioenergy production has been examined. That is, we incorporate both CO2 and SO2 emission reduction so that more information regarding regional environmental protection and health risks may be explored. Second, the social welfare improvement in terms of environmental quality may be perceived through the investigation of international trade records. Although Taiwan does not produce coal, and the costs associated with coal mining such as the treatments of the toxic and waste materials do not exist, these issues may be important to exporting countries. Third, the sectoral modeling framework is able to predict the spatial distribution of the SO2 emission so that the local government can understand how bioenergy industry can alleviate the air pollution induced by coal-mining industry. We have provided an insightful extension to the existing modeling structure so that future bioenergy studies may benefit.
Literature review
To combat climate change and improve energy sustainability, it is important to explore new energy sources (McCarl et al., 2000; Wang, 2007). Bioenergy is such a choice that increases domestic renewable energy and mitigates global climate shift. However, whether it is an effective technology, in terms of climate change mitigation, depends on several crucial factors such as feedstock selection (Fargione et al., 2008; Searchinger et al., 2008), land-use switch (Kung et al., 2014), and international leakage (McCarl, 2006). Additionally, bioenergy technologies such as conventional ethanol, biodiesel, co-firing, and pyrolysis are currently available, but their capability of offsetting emission can differ from tens to hundreds times (Kung et al., 2013; Lehmann et al., 2006; McCarl et al., 2009). Competition between food supply and energy production is another major concern facing scientists. That is, can we sacrifice the welfare or even lives of poorer people just to insure that there would be sufficient energy supply to rich ones? Such concerns are under debate until the second-generation bioenergy technologies such as cellulosic ethanol and improved pyrolysis system have been developed (Kung et al., 2015).
As introduced by Fargione et al. (2008) and Field and Campbell (2008), bioenergy production may even speed up the climate change if important factors such as land shift and technology employed are not fully reflected in a study. This concern is more important to liquid bioenergy such as ethanol and biodiesel, but not to nonliquid bioenergy such as pyrolysis, which is considered as a carbon negative technology when appropriately utilized (Glaser et al., 2009; Kung et al., 2013; Lehmann, 2007a; Lehmann et al., 2006; McCarl et al., 2009).
The biochar, if used as a soil amendment, can result in positive benefits to agriculture (Kung et al., 2015; Lehmann, 2007a, 2007b). Specifically, the biochar is a more stable form of carbon that can last in soil for more than several thousands of years, which improve the nutrition and water retention ratio in the soil, enhance the crop yields and seed efficiency, and absorb carbon from the atmosphere (Chan et al., 2007; Glaser et al., 2009; Lehmann et al., 2006). However, it is notable that although various organic materials such as crop residuals, municipal solid wastes, animal manures, and sewage sludge can be used in pyrolysis, their output yields and costs may differ substantially (Kern et al., 2012; Tewfik et al., 2011). For example, municipal solid wastes usually contain a variety of heavy metals that may cause severe health problems. The removal of such toxic contents requires additional processing costs and may eventually inflate total costs, making the utilization of such wastes economically infeasible. The application of charcoal materials in cropland can be traced back to 1980s (Iswaran et al., 1980; Kishimoto and Sugiura, 1985) and studies find that such applications can increase benefits. Biochar is simply another form of charcoal application with similar benefits (Chan et al., 2007; Oguntunde et al., 2004; Steiner et al., 2007).
Collectively, various pyrolysis and biochar applications can be integrated to improve the bioenergy production and environmental quality (Aalbers et al., 2013), but the long-run dynamic effect from biochar application should be investigated. Major et al. (2009) indicate that up to 50% of biochar may be lost annually due to the heavy precipitation and runoffs. Although this estimate is largely dependent on the regional landscape and weather, we must take this factor into account to not inflate the total benefit.
Methodology and data
To evaluate how Taiwan’s bioenergy development can increase domestic renewable energy production, reduce GHG and other emissions, and improve the waste recycling, this study employs the mathematical programming approach by formulating a partial equilibrium, price endogenous model. The theoretical foundation of this modeling structure is initiated by Samuelson (1952) who demonstrates that the equilibrium in the perfect competition market can be achieved by maximizing the sum of the consumer surplus and producer surplus. Following this concept Takayama and Judge (1971) develop a spatial equilibrium model while McCarl and Spreen (1980) show that incorporation of price endogeneity within a model can become very useful in policy analysis. Chen and Chang (2005) extend the work of McCarl and Spreen (1980) and establish a Taiwanese Agricultural Sector Model (TASM) to examine the agricultural practice of Taiwan. The current version of TASM includes more than 115 commodities in 15 subregions which are later aggregated into four major production regions. Since Taiwan’s agricultural share is relatively small to the world and due to the regulation of World Trade Organization, the TASM simulates market operations under assumptions of perfect competition with individual producers and consumers as price-taker. It also incorporates price-dependent product demand and input supply curves. Because all bioenergy inputs are produced from agricultural activities, and the stability of the feedstock supply is keyed to the successful bioenergy development, we will retain this property.
Data
The data used in this study come from various sources and literatures. The production data of agricultural activities are collected from the (1) Taiwan Agricultural Yearbook (TCOA, 2016), (2) Commodity Prices Statistics Monthly (TMOEA, 2016), and (3) Taiwan Agricultural Prices and Costs Monthly (TCOA, 2016). The emission coefficients are collected from previous studies such as Chen et al. (2011), Kung et al. (2013), and McCarl et al. (2009). Most of the commodity data are updated as of 2013. The quantity of international trades, price elasticities of commodities, and quantity demand and quantity supply for each primary and secondary commodity are also modified and updated based on the original study of Chang et al. (2012).
Model specification and extensions
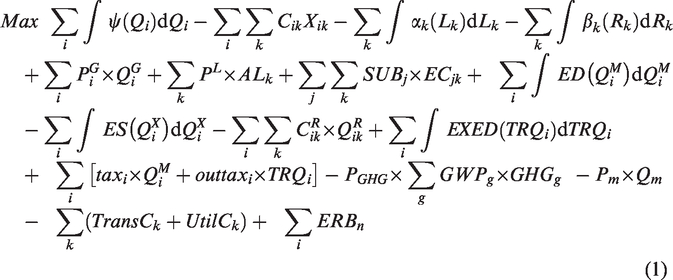
In order to investigate how bioenergy development can contribute to (1) emission reduction in CO2 and SO2, (2) efficient waste utilization, (3) energy security improvement, and (4) changes in social welfare, we integrate all agricultural activities and related policies in to a sector-wide analytical model. Therefore, by following the general structure of TASM (Chen and Chang, 2005) and making some extensions, we are able to depict the various emission components and the cost of transportation, production, and application effort of by-products. Specifically, the objective function and constraints of the model are expressed as below
Subject to
Domestic demand of ith product Government purchases quantity for price supported Import quantity of Export quantity of Quantity of Inverse demand function of Government purchase price on Purchased input cost in Collected and transported costs of Land supply in Land inverse supply in Labor supply in Labor inverse supply in Set-aside subsidy Set-aside acreage in Subsidy on planting Planted acreage of Inverse excess import demand curve for Inverse excess export supply curve for Import quantity exceeding the quota for Inverse excess demand curve of Import tariff for Out-of-quota tariff for Per hectare yield of Price of GHG gas Global warming potential of Net GHG emissions of Labor required per hectare of commodity i in region k Transportation cost of biochar from processing site to region k Biochar application cost in region k Benefits of emission reduction from various source n Price of Quantity of
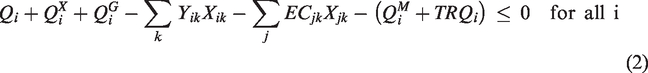


Equation (1) is the modified objective function that presents the maximization of net social welfare. Renewable energy promotion policies such as aside-land program and energy crop subsidy, as well as the general commodity support program such as rice repurchase program are specified. International trade policies are also included. The last part of the objective function reflects the benefits and the costs associated with the non-GHG emission reductions and the application costs with pyrolysis by-products so that most of the related activities and influences can be incorporated. Equations (2) to (5) are the balance constraints to ensure that the commodities (resources) we sell (use) cannot exceed the quantity of commodity (resources) we produce (possess).
This formulation of this model merits more discussion because of several notable advantages. First, the model scale is expandable with a few additional efforts. By extending dataset the model can be used to analyze local, regional, or even national issues. That is, researchers can use other datasets to study bioenergy development for other countries or regions without too much modification of the model. However, it is important to keep in mind that such framework is only suitable for small countries and regions whose influence on international trade markets is small; otherwise the assumption of price-takers would fail. Second, the model accommodates the crop mixes to ensure a realistic combination so that the results indicating only one or a few crops in certain regions are prohibited. The past distribution exerts the lower bound of the simulation activities and thus the situation of zero production of crops will not occur.
Results
Selection of energy crop is important because it would influence the net social benefits. Based on our previous examinations (Kung et al., 2013, 2014; Kung and Zhang, 2015), sweet potato can be planted in almost everywhere in Taiwan and thus, using it as a potential energy crop can ensure a stable supply and lower transportation cost. In addition to sweet potato, the rice straw which was previously ignored in many studies is also incorporated because rice has been densely planted in Taiwan, and therefore, rice straw is an immediately available resource for electricity generation. Poplar is another possible alternative discussed by the government officers (the undersecretary of Agriculture of Taiwan Dr Chi-Chung Chen, 2017, personal communication), and it is simultaneously considered in this study. Table 1 provides the general pyrolysis parameters used in this study.
Electricity generation per dry ton of feedstock.
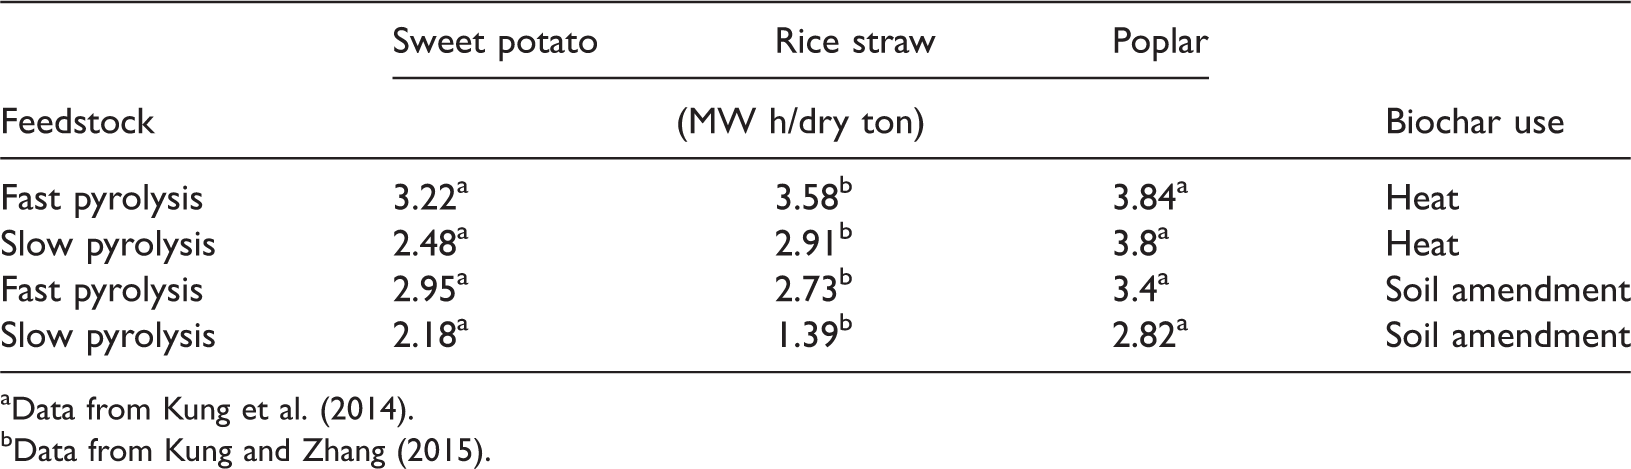
aData from Kung et al. (2014).
bData from Kung and Zhang (2015).
The simulation results show that domestically produced renewable energy is generally more than 200 million liters of ethanol when ethanol price increases, or more than 2.79 billion kW h when emission prices are high. The renewable energy production could improve the Taiwan’s energy security; however, it is possible that the competition between different forms of bioenergy could occur. Therefore, the net improvement on regional energy security needs additional investigation. Generally the dominant factor influencing the production of ethanol or electricity is market power. In Table 2 we summarize the ethanol production and electricity generation, as well as the CO2 and SO2 emission reduction from each input source under different energy and GHG prices. When multiple bioenergy technologies are available, it is not very obvious whether the net production will increase or decrease under various energy prices. This is because the competition among technologies hinders the transparency of this information. However, by looking into the price change of gasoline and coal, we find that market power does play an important role. Production of liquid bioenergy (i.e. ethanol) expands when gasoline price increases and that of nonliquid bioenergy (i.e. electricity) increases at higher coal prices. Both bioenergy productions are influenced by the GHG price, and when GHG price increases, more electricity and less ethanol will be produced.
Bioenergy supply and emission contribution.
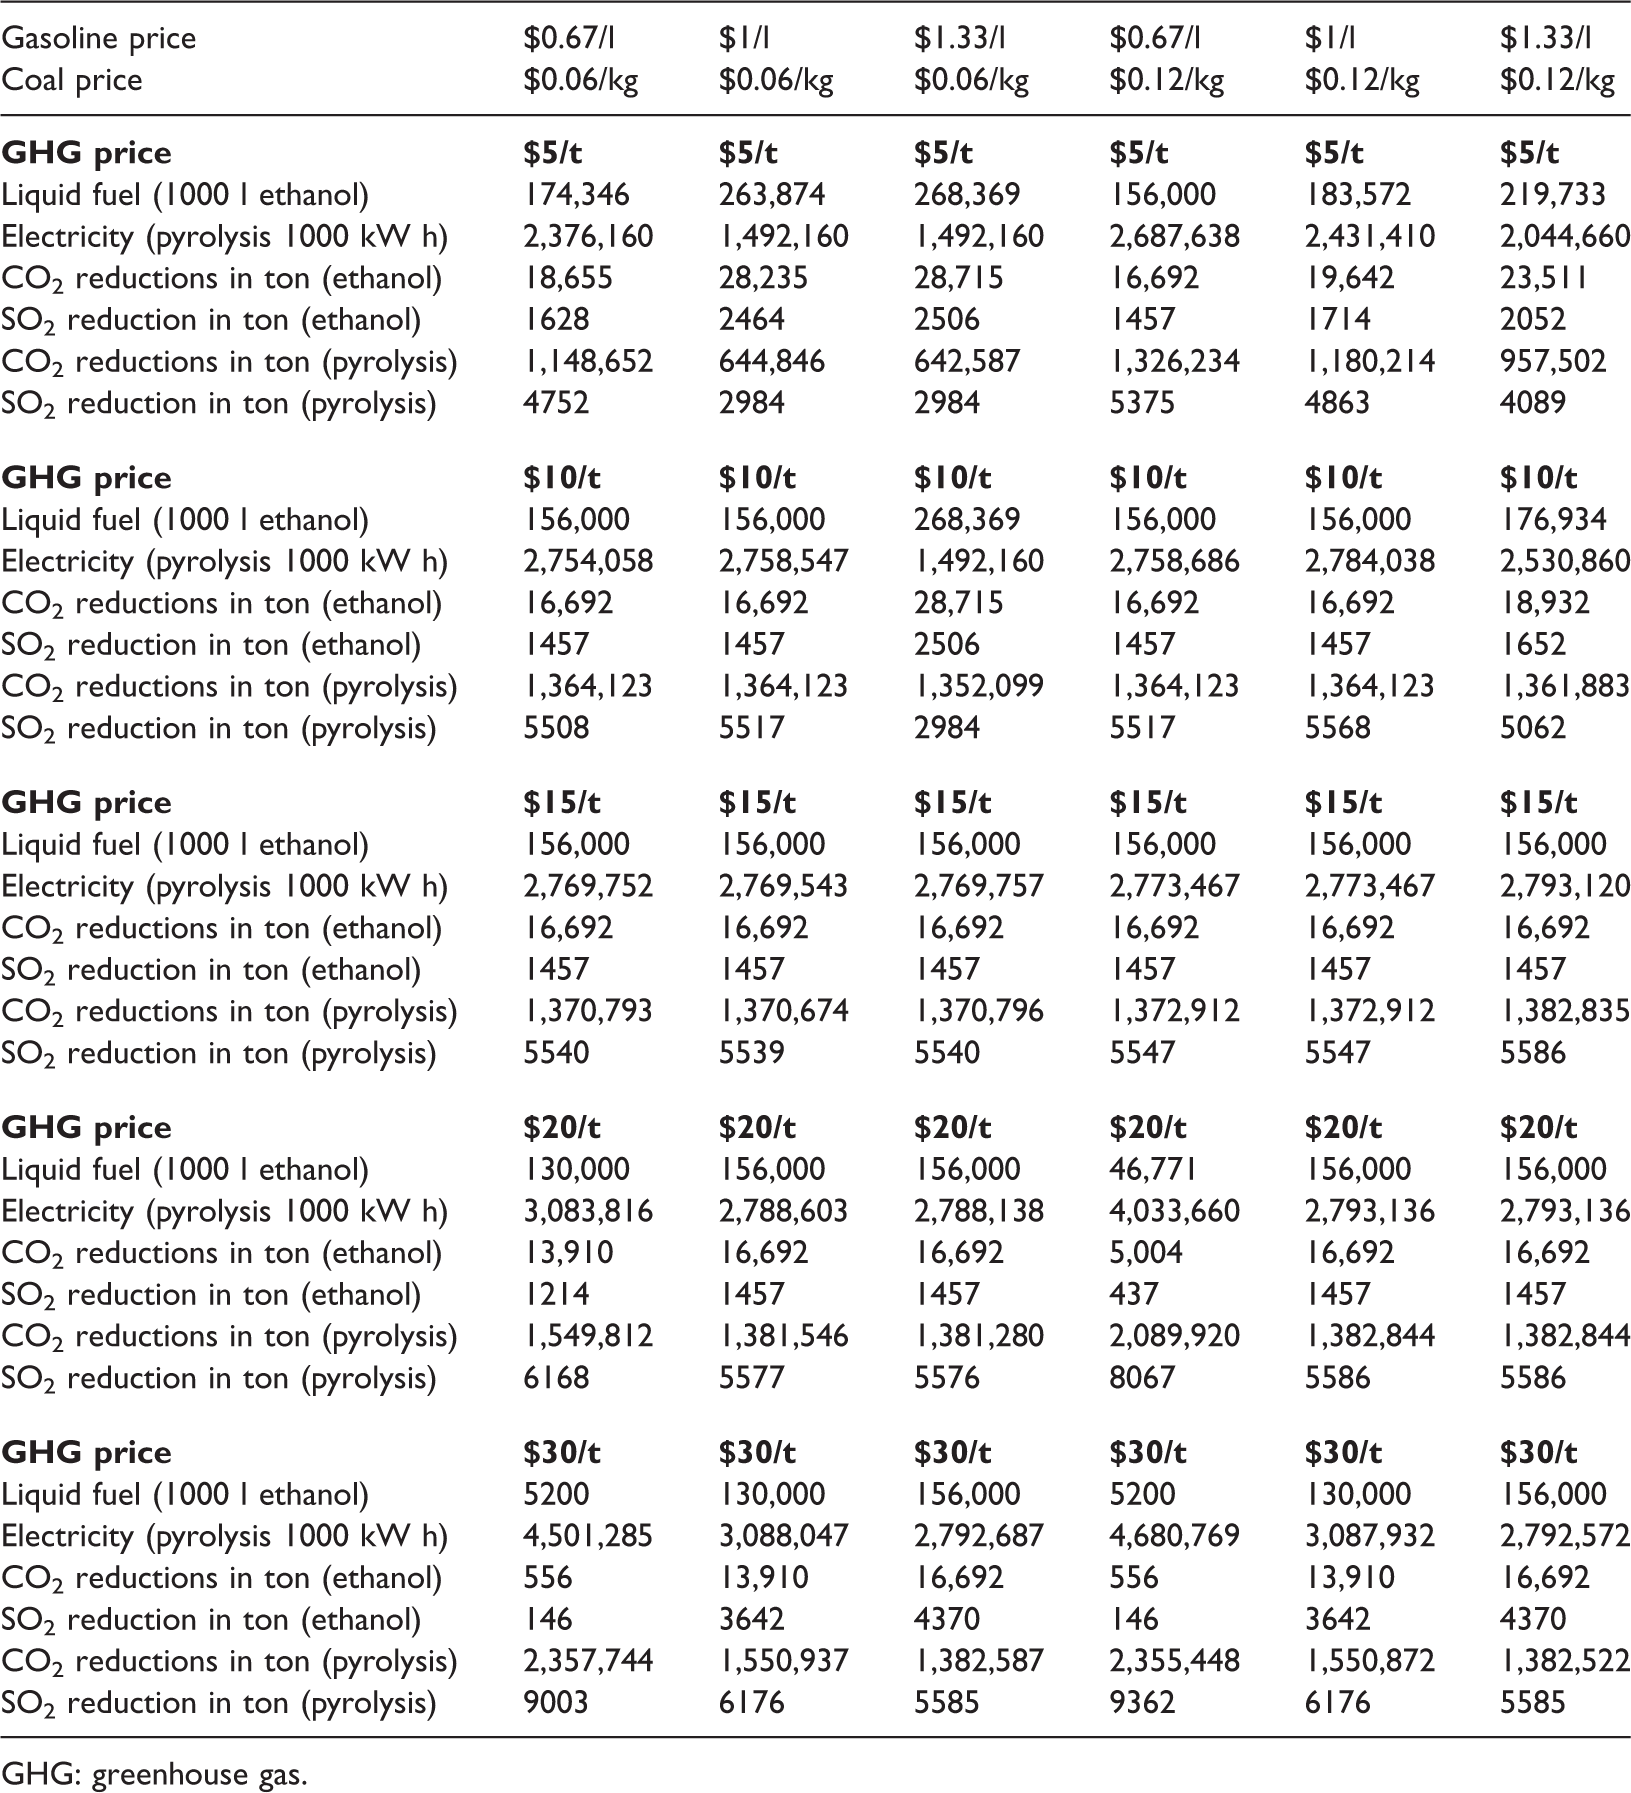
GHG: greenhouse gas.
The effects from GHG price can also be detected by looking into emission reduction. Since the nonliquid bioenergy usually has more capability of reducing emission, more feedstocks will be used in electricity generation, driving up the net emission reduction. In addition to CO2 emission reduction, SO2 can also be reduced significantly. While more than 1 million tons of CO2 is offset from electricity generation, the reduction of CO2 emission in terms of percentage is small (i.e. less than 1.5% of total emission). Our results show that bioenergy development can effectively reduce the total SO2 emission. Up to 7.68–10.40% of annual SO2 can be reduced if more renewable electricity is developed, significantly reducing both the environmental damage and health risk exposure.
Figure 1 shows that the net CO2 emission varies under different energy prices, GHG prices, and biochar applications. The first set of indexes ij (i = B or H) represents the use of biochar. B stands for that biochar is burned for electricity while H stands for that the biochar is applied in cropland to receive agronomic benefits. The second set of indexes ij (j = L, M, H) represents that whether the level of GHG price is low, moderate, or high. It is obvious that when biochar is applied in cropland, more carbon will be stored and thus a higher amount of CO2 emission reduction can be achieved. The electricity generation in hauling biochar scenarios is relatively lower than that in burning biochar cases. However, at low GHG price scenarios, hauling biochar would sustain more electricity generation because the collective benefits from electricity generation, emission reduction, and agricultural improvement would remain high, thereby encouraging feedstocks to be used in pyrolysis.
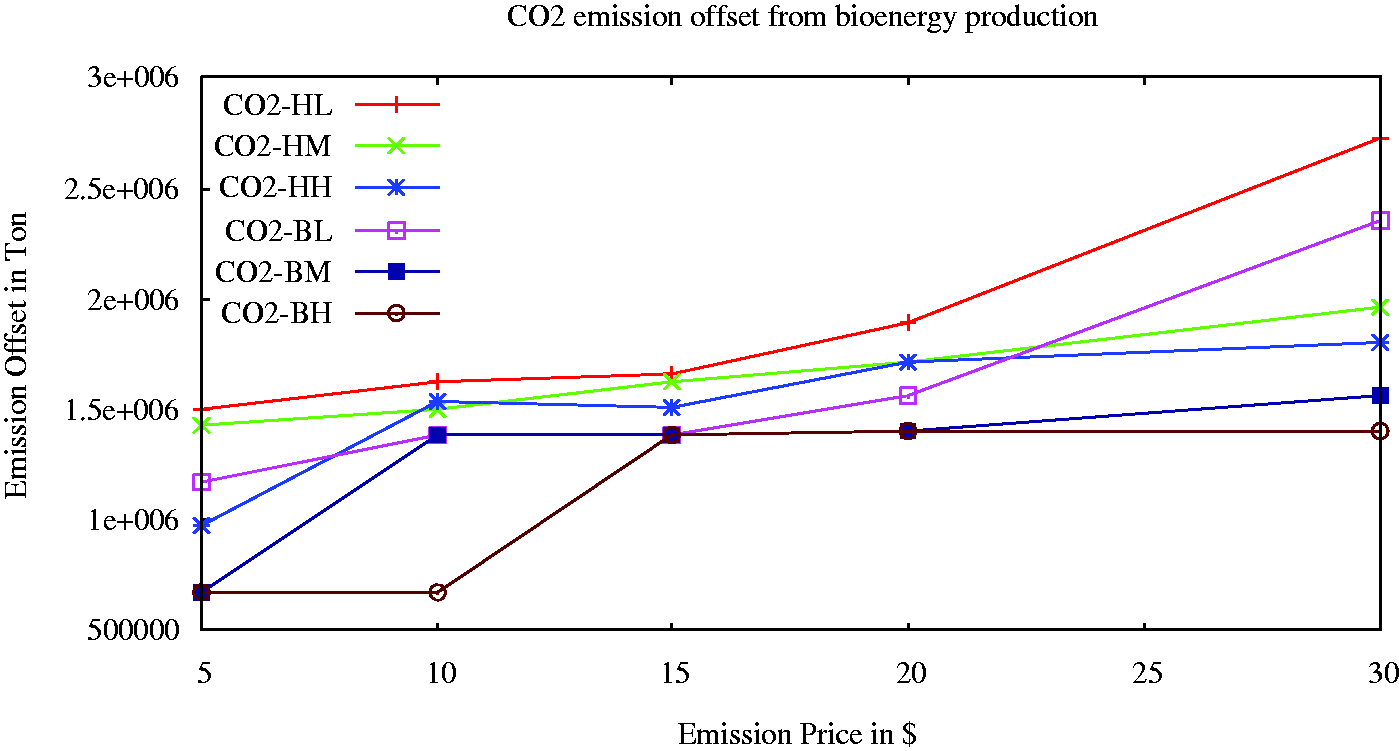
CO2 emission under different pyrolysis applications. BL: biochar burned when GHG price is low; BM: biochar burned when GHG price is moderate; BH: biochar burned when GHG price is high; HL: biochar is hauled when GHG price is low; HM: biochar is hauled when GHG price is moderate; HH: biochar is hauled when GHG price is high.
Figures 2 and 3, respectively, indicate the SO2 emission reductions from ethanol production and electricity generation. The SO2 emission reduction is high when pyrolysis technology dominates ethanol because the high sulfur-contained coal is replaced by renewable electricity. As long as the renewable electricity is considered as an alternative, the environmental benefits in terms of SO2 reduction can be achieved. Another interesting result is also observed. Unlike the higher CO2 emission reduction in hauling biochar scenarios, higher SO2 reduction is achieved in burning biochar scenarios. This is explained by the fact that more renewable electricity generation reduces the reliance of coal, and thus the more renewable electricity is generated, the less coal would be purchased and used. For this reason, the burning biochar cases that yield higher renewable electricity will result in a higher SO2 reduction.
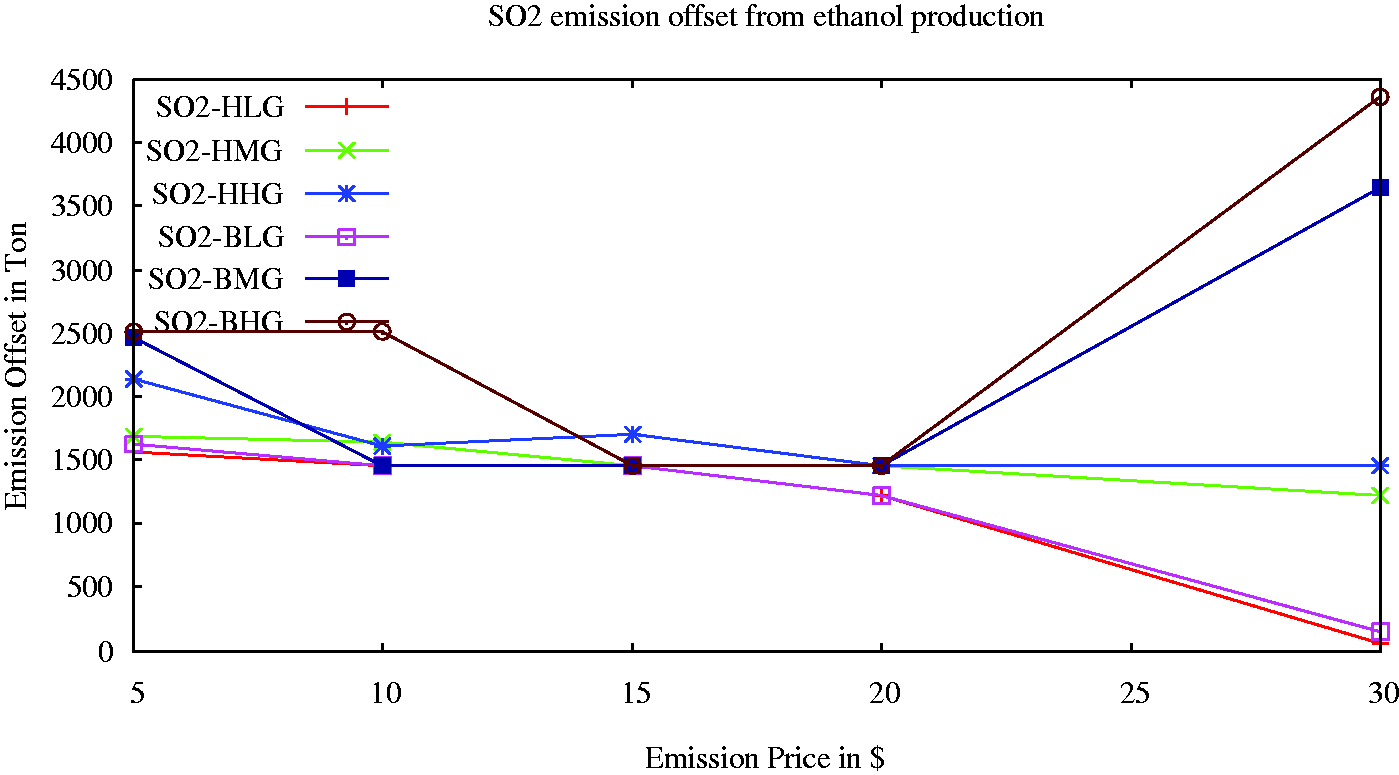
SO2 emission reductions from ethanol production. BLG: biochar burned when GHG price is lowand ethanol is primary technology; BMG: biochar burned when GHG price is moderate and ethanol is primary technology; BHG: biochar burned when GHG price is high and ethanol is primary; HLG: biochar is hauled when GHG price is low and ethanol is primary technology; HMG: biochar is hauled when GHG price is moderate and ethanol is primary technology; HHG: biochar is hauled when GHG price is high and ethanol is primary technology.
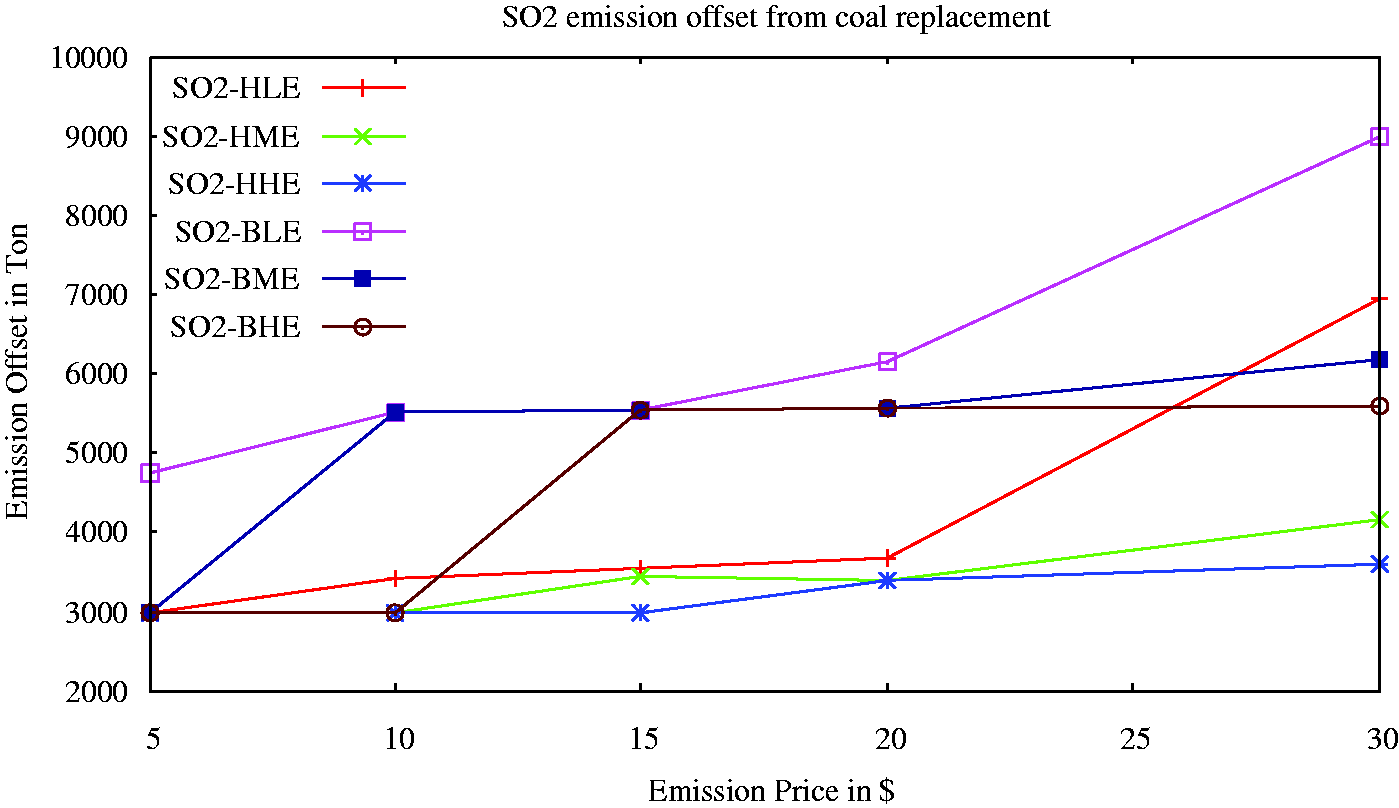
SO2 emission reductions from coal replacement. BLE: biochar burned when GHG price is low and electricity is primary technology; BME: biochar burned when GHG price is moderate and electricity is primary technology; BHE: biochar burned when GHG price is high and electricity is primary; HLE: biochar is hauled when GHG price is low and electricity is primary technology; HME: biochar is hauled when GHG price is moderate and electricity is primary technology; HHE: biochar is hauled when GHG price is high and electricity is primary technology.
The renewable electricity generated comes from the pyrolysis technology because the conventional co-firing is not economically compatible and pyrolysis is more efficient in energy conversion rate and emission offset rate. At higher GHG and coal price, ethanol also becomes less competitive to pyrolysis. Under such a circumstance, benefits from utilizing pyrolysis outweigh those from ethanol production, thereby switching all feedstocks to electricity generation.
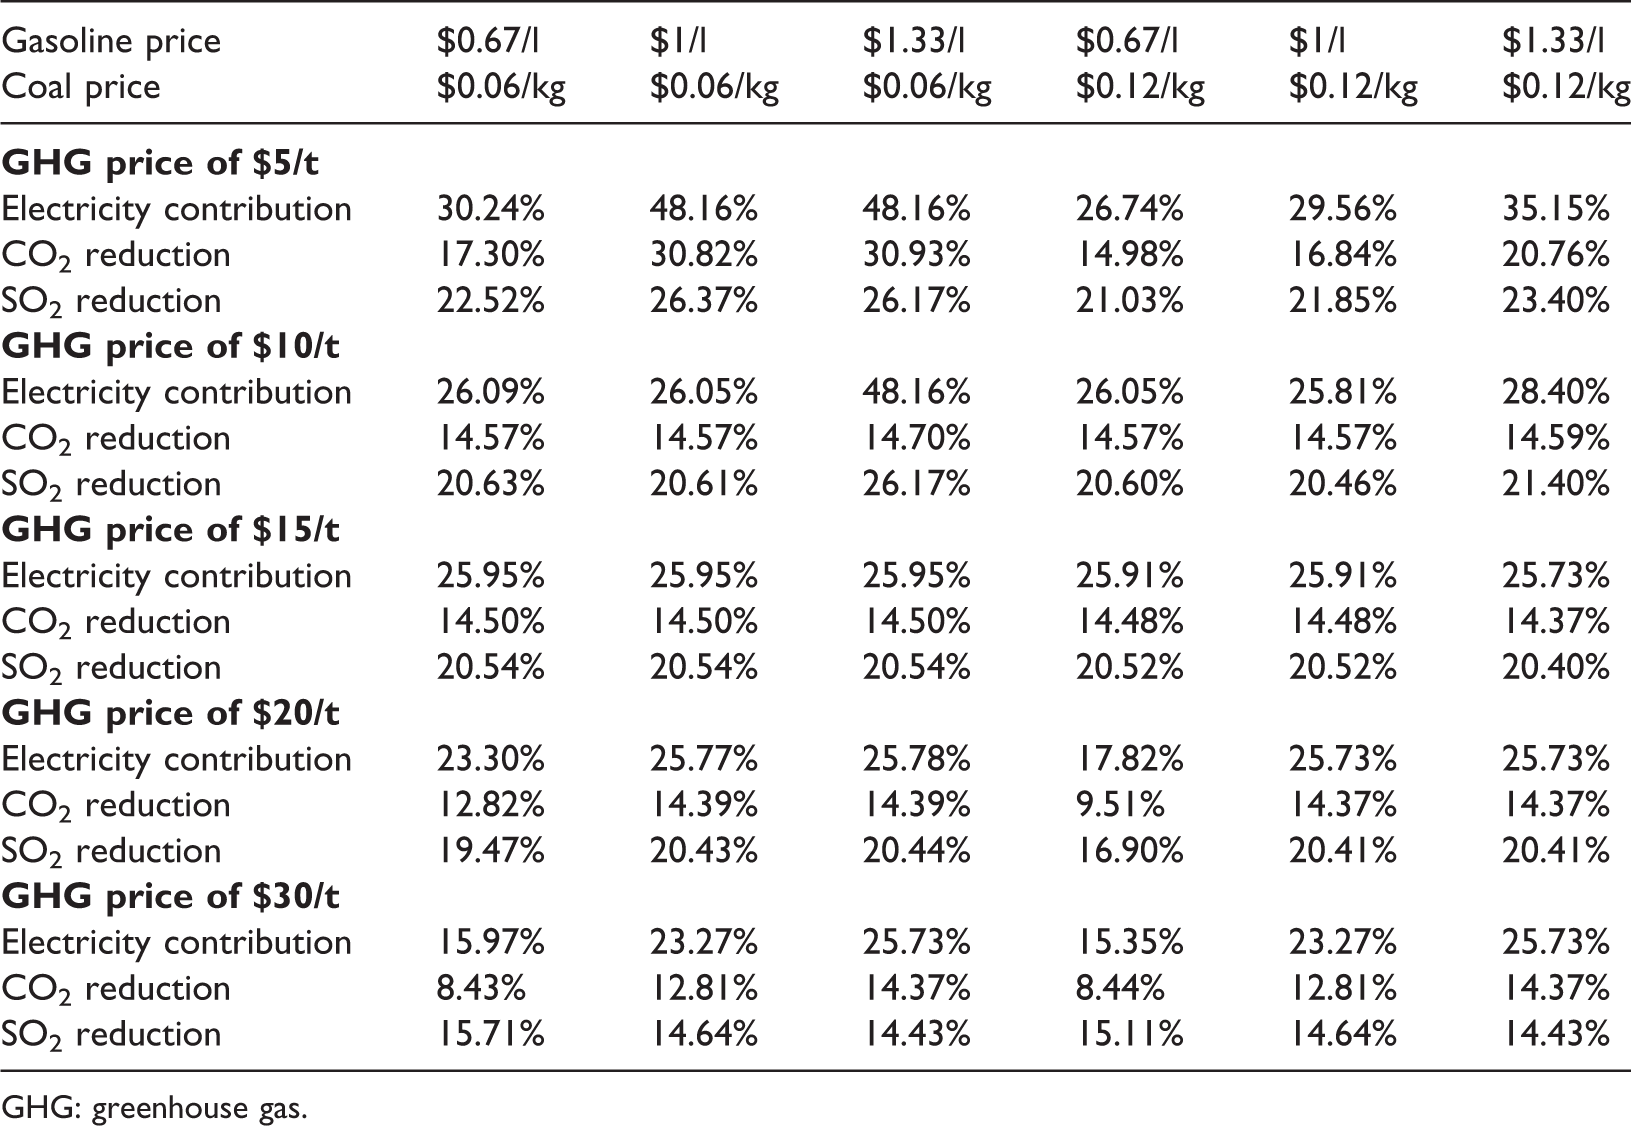
In this study multiple bioenergy feedstocks are used. In Table 3 we display the energy and emission contributions from crop residuals (i.e. rice straw). The results show that rice straw has a significant influence on bioenergy production and emission reduction, especially for low coal but high gasoline price scenarios. When ethanol is more valuable (i.e. high gasoline prices), more feedstock is transferred to ethanol plants and fewer feedstocks are available for electricity. Under this circumstance, rice straw becomes an important source to generate electricity. In low coal but high gasoline price cases, up to 48.2% of electricity comes from the use of rice straw. Since electricity becomes more valuable when coal price increases, more sweet potatoes are shifting back to pyrolysis technology and thus, decreasing the energy share from rice straw application.
Contributions from crop residuals.
GHG: greenhouse gas.
Social welfare from clean energy development.
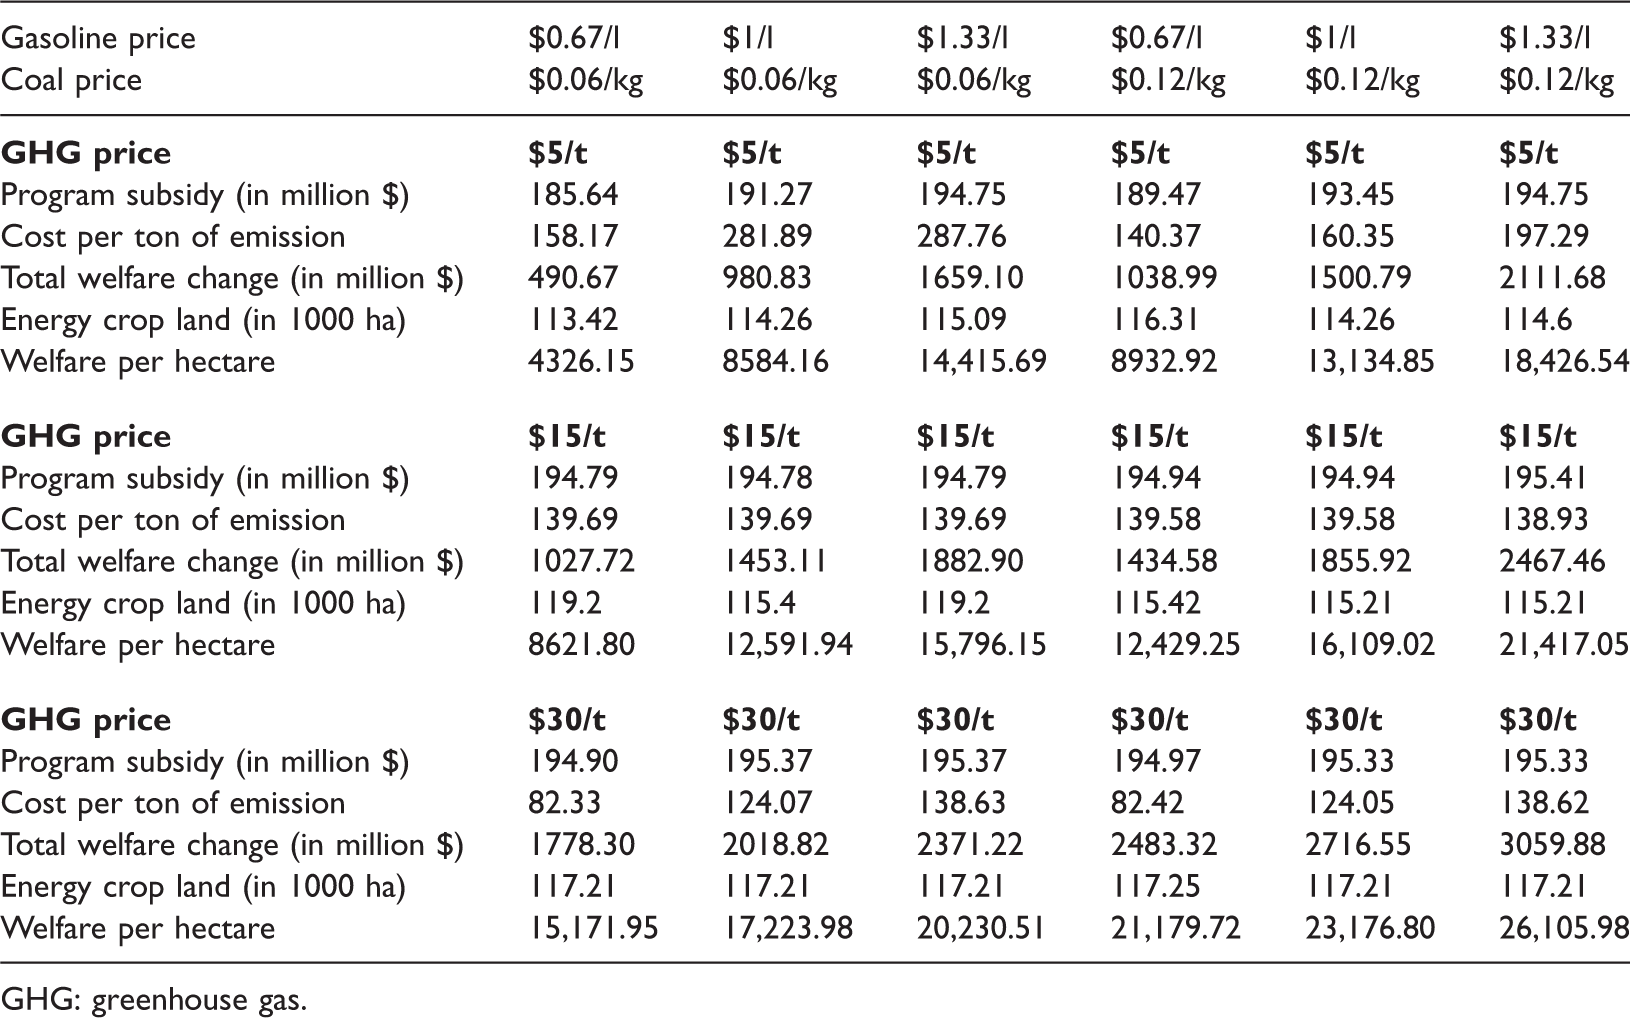
GHG: greenhouse gas.
In addition to bioenergy production and emission reduction, potential cost requirement associated with bioenergy development is also analyzed. To encourage farmers’ participation in energy crop plantation, subsidy of more than 185 million dollars must be paid; otherwise a shortage of feedstock supply may occur. In addition, compared to the simulated GHG price of $5–$30, the per ton cost of emission reduction falls into a range of $82–$287, depending on the price scenarios. With such a high subsidy, more than 115,000 ha of cropland will be converted for energy crop purpose. These expenses are not thrown into the air; instead, they are received by farmers, implying another form of wealth redistribution. That is, although total welfare would increase under bioenergy development, as presented in Table 4, it is obvious that the whole society bears all costs.
Discussions
This study employs a price endogenous, mathematical programming model to analyze Taiwan’s bioenergy production, fossil fuel replacement, and emission reductions under various market operating scenarios. Market operation is expressed by various prices in a highly competitive market, and thus, the sector-wide analysis could provide insightful information. By looking into the price measures such as energy prices and GHG prices, we are able to explore the efficient development paths and effective policies. Based on our results, we have arrived several important findings that merit further discussion.
Competition between CO2 and SO2 emission reduction
GHG emissions intensify the greenhouse effect and speed up the global climate change, causing many uncomfortable consequences to the economy and environment. Unlike the benefits induced by climate change mitigation that generally involves long-run framework, advantages from SO2 emission reduction such as better air quality, lower chance of having air pollution and health risk, and less medical expenditures are usually experienced in the short run. For example, a reduction of SO2 emission lowers the possibility of having acid rain and reduces the possibility of getting tracheitis, bronchitis, and certain skin disease. Therefore, to achieve emission reduction via bioenergy development, it is necessary to understand how market operations would get involved.
As have been seen, the CO2 and SO2 reductions cannot simultaneously reach their maximum because the influencing factors conflict. That is, when CO2 emission reduction is valuable, more biochar that has been produced will be hauled and applied in cropland to enjoy agronomic benefit, thereby reducing the total electricity generation. However, since the SO2 reduction primarily comes from the generation of electricity and fossil fuel replacement, an increase in gasoline price, and in some cases GHG prices, will reduce the total SO2 reduction.
2. Competition between liquid and nonliquid bioenergy
This study analyzes two general forms of bioenergy production in Taiwan. Ethanol may not be competitive if this technology is fed with totally different feedstocks. Since sweet potato is used for ethanol and pyrolysis plants, an increase in one’s production will inevitably reduce that of the other one. Additionally, many factors such as bioenergy production, emission reduction, and price stabilization generally interact simultaneously, and thus it is important to rank the importance of each factor and set up the primary goal before the bioenergy industry can be developed efficiently and effectively.
Climate change may be another concern that potentially alters the regional temperature and precipitation, and subsequent crop yields, all of which may change the patterns of resource allocation and agricultural practices, leading to a different production path of bioenergy development. For this reason, although this study does not incorporate the potential influence of climate change on crop yields, decision makers should keep the influences of climate change in mind when they are designing, formulating, and modifying policies.
3. Utilization of organic wastes
In this study we incorporate multiple feedstocks in bioenergy production and find that the utilization of sweet potato and crop residuals would maximize the bioenergy production and social welfare. We demonstrate that the agricultural waste such as rice straw can make considerable contribution in bioenergy production and emission reduction. Since pyrolysis can process almost all organic matters, it is also possible to utilize manures, municipal solid wastes, other agricultural wastes, and sewer sludge to provide substantial amount of renewable energy.
Economic return is another important factor influencing the selection of bioenergy feedstock, which is generally determined by the factors such as energy conversion rate and the processing cost. For example, agricultural wastes usually take fewer costs in preprocessing and storage stages, but other materials such as municipal solid wastes and sewer sludge are likely to incur higher expenses. If there is no significant difference in energy conversion or emission offset rates, such materials may be less attractive and competitive.
4. Wealth distribution among parties
Bioenergy development usually not only involves substantial investments to producers, but also requires the various support policies from the local and/or central governments. For example, subsidies to the final products and tax refund are two common forms of government support to encourage the large-scale development of bioenergy. In addition to policies facing bioenergy producers, Taiwan also provides support policies on idle land and energy crops to ensure that a desired portion of the agricultural activities could be shifted to energy crop plantation. Although total social welfare under bioenergy development generally increases, most of the benefits are received by producers rather than consumers. Since the society bears total cost (i.e. the government expenditures) and only a small share of people enjoys the benefits, it may be necessary to analyze the redistribution of such benefits. In this study we show that the effect of the promotion policy is expensive, and if other forms of subsidies are simultaneously incorporated, the aggregate expense would be even greater.
This issue may be conjunctively considered with the feedstock selection because energy crop plantation generally involves stages that require certain types of subsidy from the government (i.e. land acquisition, fallow land utilization, energy crop plantation, plant processing, etc.). Although using cellulosic and pyrolysis technology may be a better choice, this is depending on the technology availability and technological progress.
5. Competition in land use
We analyzed the bioenergy production on the fallow land that is immediately available for energy crops. However, according to the Taiwan’s latest energy policy, several renewable energy programs such as bioenergy, wind power, and solar energy will be conjunctively launched. The net bioenergy production is likely to shrink if fallow land is covered by the solar panels or occupied by the wind turbines. Synergy or erosion effects of this joint application may require additional investigations to provide more information.
The results do not indicate that the decrease of bioenergy production is not a desirable situation to the society. We simply point out that the effectiveness of bioenergy development would need a more comprehensive analysis when land resource is competed with other renewable energy technologies. Under such a circumstance, it will be important to aggregate the net energy produced from all renewable technologies, competition among these technologies, and total government investment and subsidies into a single framework to obtain a more robust result; otherwise the over- or underestimate of the benefits of a stand-alone technology might be obtained.
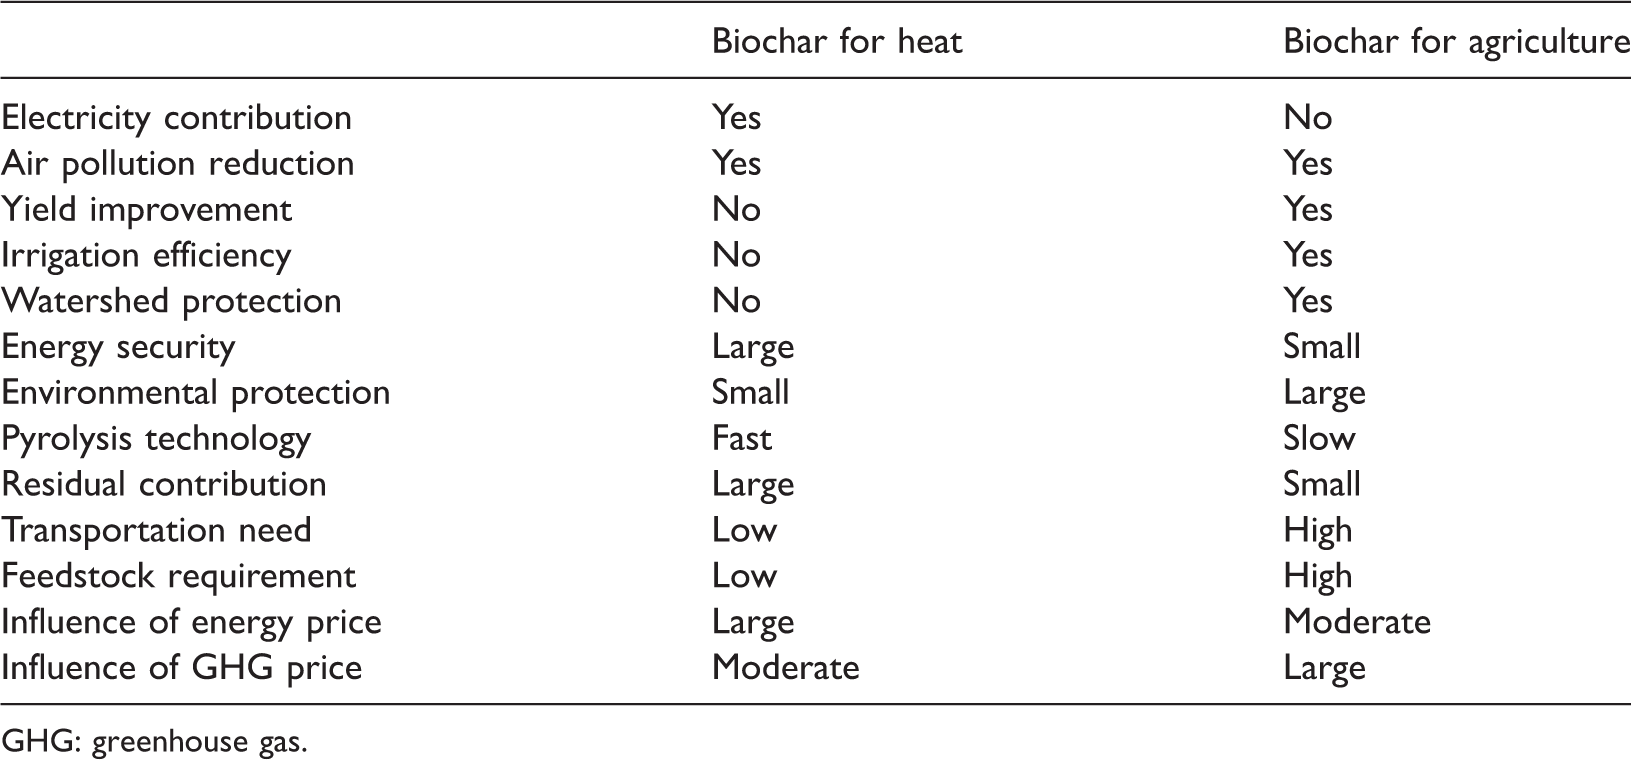
6. Effectively designed promotion policies
Development of renewable energy involves many aspects, of which the most important one is probably the economic incentive to producers. A proper designed policy is crucial to the success of renewable energy development because it will directly affect the behavior of all producers, and because it will inevitably influence the efficiency and effectiveness of any renewable energy program. Table 5 presents the potential impacts of pyrolysis technology and biochar application on agriculture, economy, and environment that government officers may use in future policy analysis.
Policy implications among pyrolysis and byproduct utilization.
GHG: greenhouse gas.
Conclusions
In this study we analyzed the bioenergy production in Taiwan and explore how energy security can be improved by domestic renewable energy production, how emissions such as CO2 and SO2 can be reduced, how the government may get involved in bioenergy development, and what the economic and environmental consequences may be arrived. The results show that the bioenergy production may switch among different technologies when energy and GHG prices fluctuate. Emission reductions can vary significantly. SO2 reduction is more sensitive to coal and GHG prices because electricity is the primary source that reduces SO2 emissions.
Agricultural wastes are the potential sources that can be used to enhance the effectiveness of bioenergy development because their acquisition costs are relatively lower than conventional crops and other organic matters such as municipal solid wastes. Cellulosic technologies that utilize rice straw, corn stover, and animal manures may also attract attention under this situation.
Footnotes
Acknowledgements
We also appreciate the comments and guidance from Distinguished Professor, Dr Bruce A. McCarl at Texas A&M University, and Distinguished Professor, Dr Chi-Chung Chen at National Chung-Hsing University.
Declaration of conflicting interests
The author(s) declared no potential conflicts of interest with respect to the research, authorship, and/or publication of this article.
Funding
The author(s) disclosed receipt of the following financial support for the research, authorship, and/or publication of this article: The authors thank for the financial support from the National Natural Science Foundation of China (41861042; 71663025), the Distinguished Young Scholar Program of Jiangxi Province (20171BCB23047), the University Social Science Foundation of Jiangxi (JC17205), and Scientific Program of Jiangxi’s Department of Education (GJJ160437).