
Abstract
This paper presents an analytical solution of Buckley-Leverett equation for gas flooding with constant-pressure boundary including the effect of miscibility on the viscosity and relative permeability. First, a relative permeability model and a viscosity model with consideration of miscibility are used to describe the variations of relative permeability and viscosity of oil and gas. Then, based on the fractional-flow theory, the Buckley-Leverett equation for gas flooding with constant-pressure boundary including the effect of miscibility is constructed and solved analytically. From the analytical solution, the saturation and pressure profiles, the total volumetric flux and the breakthrough time are determined. To verify the theory, the analytical solution is compared with the numerical solution. The comparison shows that the analytical solution is in reasonable agreement with numerical solution. Through the study on the influential factors, it can be concluded that total volumetric flux is increasing with the increases of permeability and pressure and decrease of gas viscosity. The increase of total volumetric flux accelerates breakthrough of the injected gas. Furthermore, with the pressure increase, there are remarkable reduction in residual oil saturation and improvement of relative permeability, resulting in higher gas saturation and oil displacement efficiency. The analytical solution presented in this paper provides guidance on analyzing the distribution of saturation and pressure profiles, predicting the gas production and oil recovery efficiency of oil well.
Keywords
Introduction
For its remarkable achievement in oil recovery and storage capacity for the greenhouse gases, the gas flooding technology has been attracting more and more concern and discussion among the EOR methods (Kamali and Cinar, 2014; Zhao et al., 2016). The gas injection is divided into two categories, consisting of hydrocarbon gas injection, such as natural gas and produced gas, and non-hydrocarbon gas injection, such as CO2, N2 and flue gas. The injected gas not only dissolves into oil leading oil viscosity reduction, volumetric expansion, and interfacial tension (IFT) reduction but also plays a role in dissolved gas drive (Green and Willhite, 1998; Holm, 1986). The contribution of these mechanisms is different for oil recovery under different reservoir and fluid condition (Klins, 1984). The primary mechanism of gas injection is through mass transfer to reduce IFT and increase the miscibility of oil and gas, especially under high pressure (Sheng, 2013), which allows for the residual oil in water flooding to be displaced and recovered.
The theory of fractional flow reveals the basic law of non-piston displacement for two-phase flow, based on some indispensable and reasonable assumptions. The theory is generalized, starting with the Buckley-Leverett theory for water flooding and has been applied to various EOR methods, such as gas flooding and polymer flooding (Buckley and Leverett, 1942; Ehlig-Economides and Economides, 2010; Ghanbarnezhad and Lake, 2012; Hirasaki, 1981; Johansen et al., 2016; Pope, 1980). The theory involves one-dimensional flow of two incompressible fluids in porous media. To easily obtain the analytical solution, necessary and reasonable assumptions are made. Typically, the major assumptions are following: (1) the porous media is homogeneous, isotropic, and isothermal, (2) dispersion of fluids is negligible, (3) gravity and capillarity are negligible, (4) Darcy’s law is applied, (5) and a continuous injection of constant composition is injected starting at time zero (Pope, 1980; Rui et al., 2018). The fractional flow for the displacing fluid is the ratio of the volume flux of the displacing fluid to the total volume flux; by substituting the Darcy’s Law into the volume flux, the function of the fractional flow is determined. By substituting the function of the fractional flow into the conservation equation, the new equation is known as Buckley–Leverett equation. Afterwards, the front advance velocity, the breakthrough time and the pressure and saturation profiles, indicators of sweep efficiency and oil recovery are deduced with boundary conditions. Yortsos et al. presented a mathematical model of Buckley-Leverett equation for water injection and obtained its analytical and numerical solution (Yortsos et al., 1999). The log-log plot of water/oil ratio and time was used to predict the well pattern and the relative permeability characteristics. Despite the simplification of the mathematical model, the theory retains the key feature of the two-phase flow and provides a highly valuable fundamental understanding of the displacement mechanisms. The theory has the best reservoir engineering principles and practices and is efficient in precisely investigating the two-phase flow problems.
Many researchers have noticed the advantage of the theory of fractional flow in gas flooding. Welge proposed a method to predict oil recovery for displacement of oil by enriched gas in a three-component, two-phase system (Welge et al., 1961). The method considered the mechanisms of wet gas displacing oil, including volumetric expansion, viscosity reduction and condensation of intermediate components in the gas. Wu et al. constructed a one-dimensional non-Darcy model of immiscible fluids, in which non-Darcy flow was described with the Barree and Conway model (Wu et al., 2011). They derived its analytical solution and compared the Barree and Conway model with the Forchheimer model. The results showed that the non-Darcy flow was dominated by the non-Darcy relations and the parameters of the injection and production. Laforce and Johns (2005) established and solved a three-phase four-component flow model in a one-dimensional porous medium by the method of characteristics. It concluded that the presence of the three-phase region added the complexity of the types of composition routes and profoundly affected on oil recovery, which decreased with displacing-fluid enrichment. Johansen et al. (2005) presented a comprehensive analysis of mathematical model of four-component gas/oil displacement systems in which components partition between two phases is governed by the geometry of a set of equilibrium tie lines. The paper pointed out that when a system contained global triangular structure, the wave analysis indicated that the shock and rarefaction surfaces coincided. LaForce extended the parameterization and presented an analytical solution for flow of four components in three phases with a realistic phase behavior model. The study of displacements at pressures both below and above the minimum miscibility pressure (MMP) revealed that solution structure for these displacements is qualitatively similar to that of the constant K-value system (LaForce and Orr, 2009; Rezaei et al., 2013). Yang (2014) constructed a mathematical model for carbonated water injection under constant pressure boundaries and developed its numerical solution using the IMPES method. Through the model, they predicted the oil recovery, the saturation distribution and the pressure distribution from injector to producer.
Unfortunately, most of these studies have focused on the problems involved component and phase, from two phases to three phases and from three components to four components. However, the changed physical properties of fluids during the gas injection have been overlooked in the development of analytical solution of Buckley-Leverett equation. Actually, as the recovery mechanism stated previously, since the gas is injected into the porous media, the complex interaction of oil and gas will lead to changes of physical properties such as viscosity and relative permeability, the key characteristics of multiphase seepage. In addition, most previous studies were based on the assumption of constant viscosity and relative permeability. Meanwhile, it is noticed that the classical fractional-flow theory is based on the assumption of constant volumetric flux. However, it is also common that the injection pressure and the production pressure are both kept constant over time (Cui et al., 2018b; Johansen et al., 2016). Under the constant-pressure boundary conditions, the volumetric flux is not constant and the volumetric flux at different time is unknown. Although the one-dimensional two-phase flow model with constant-pressure boundary and dynamic properties can be solved by the numerical method, the numerical simulation is time-consuming, and there are numerical errors in the numerical discretization which may result in physically unreal oscillation and wrong evaluation of oil reservoirs (Aziz, 1979; He et al., 2017, 2018). Thus, in order to ensure the accuracy and improve the computational efficiency, an analytical solution is indispensable (He et al., 2018).
The purpose of this paper is to develop an analytical solution of the Buckley-Leverett equation for gas flooding with constant-pressure boundary conditions considering the changed viscosity and the changed relative permeability. To describe the variation of relative permeability, we improve the analytical model proposed by Coats based on the mechanism of the gas flooding. The relative permeability under different miscible condition is determined by the interpolation method. Moreover, we introduce the Todd-Longstaff model to calculate the effective viscosities of the oil and gas. The analytical solution presented in this paper provides the saturation and pressure profile, the total volumetric flux and the breakthrough time. Furthermore, the influence of permeability, gas viscosity and pressure on process of gas flooding is fully discussed through the analytical results.
Mathematical model
Before the construction of the mathematical model of Buckley-Leverett equation, firstly we study the varying physical properties of fluids. It has been pointed out that the relative permeability and viscosity will change in the process of gas injection. Thus, it is necessary to describe this variation with a proper model. There are increasingly sophisticated or efficient methods to model the relative permeability and viscosity of fluids in the gas flooding. To obtain the analytical solution of Buckley-Leverett equation, simple and practical models with proper parameters are needed.
Relative permeability of gas/oil system
Relative permeability is one of the fundamental parameters and key characteristics of multiphase seepage. In the process of CO2 flooding, the physical and chemical properties of the fluids change drastically, especially at the interface (Cui et al., 2018a; Orr, 2007). Under such condition, the influence of the thermodynamic condition on the relative permeability is by no means negligible. IFT, generally through the capillary force, plays an important role in determining the flow behavior of hydrocarbon fluids in porous rocks.
Some scholars have carried out researches from a mathematical point of view to predict relative permeability at different pressure. All of these models adopt an interpolation function to interpolate between base curves (at low pressure where the injected gas and the crude oil are immiscible) and straight lines representing the miscible condition at high pressure (generally higher than MMP). Coats first proposed the model of this type for individual-phase relative permeability with the interpolation which is the function of IFT (Coats, 1980). The model employs linear interpolation to modify the relative permeability curve at different values of IFT, which is shown as follows


Fk is the relative permeability interpolation parameter, given by the following formula
The model further revised by many researchers and widely used in commercial simulators, such as Eclipse and CMG (Al-Nuaimi et al., 2018; Coats, 1980; GeoQuest, 2014; Hustad and Browning, 2010). This is a simple and practical approach to evaluate the effect of miscibility on the relative permeability. Whitson et al., Pope et al. and Blom et al. proposed mathematical models in which the relative permeability varied with capillary number rather than IFT (Blom and Hagoort, 1998; Pope et al., 2000; Whitson and Fevang, 1997). Laroche developed a 1D, horizontal, immiscible two-phase flow model taking the capillary end effect into consideration. Through the model, the exponent of the relative permeability near its residual value was determined from a segment of the curve of the outlet fraction flow (Laroche et al., 2001). Abbas (2016) improved JBN method for calculating relative permeability using the cubic spline numerical modeling technique. Compared with the traditional way, the technique showed good results and the overall numerical error was reduced. The interpolation parameter is the function of IFT in these models (Al-Nuaimi et al., 2018; Alzayer et al., 2018; Hustad and Browning, 2010; Mott et al., 2000). Mott et al. and Al-Nuaimi et al. established empirical formulas to determine the interpolation parameter by fitting the experimental data (Al-Nuaimi et al., 2018; Mott et al., 2000). The limitation of the method is that it needs to perform experiments which are time-consuming and costly. Alzayer et al. (2018) adopted the Gibbs free energy to determine the interpolation parameter, which required a complex calculation process. Coats pointed out that the treatment given here was not based on any theory or experimental evidence. In conclusion, on one hand, it is necessary to prove the correctness of the interpolation method; on the other hand, an effective and simple method to determine the interpolation parameter is needed.
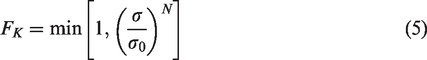
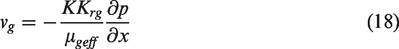
Many previous studies have addressed issues of gas/oil relative permeability as a function of IFT through laboratory experiments. Bardon and Longeron measured gas and oil curves of methane/heptane system under different IFT using unsteady method (Longeron, 1980). IFT was controlled by varying the equilibrium pressure of the mixture. The experimental results showed that the shape of the curves varied considerably depending on the physical properties of the phases and a linear relation between the relative permeability and IFT, seen in Figure 1(a). Further analysis revealed that the major change in relative permeability seemed to occur in the vicinity of σ = 0.04 mN/m and the relative permeability curves tended towards straight lines as IFT approached 0.001 mN/m. Asar and Handy (1988) did a similar study using a highly volatile methane/propane system to measure steady-state relative permeability as the function of IFT. Similar effect was observed with a critical IFT greater than 0.18 mN/m for a gas-condensate system. Munkerud and Torsaeter used a six-component system and several reference systems to examine the effect of IFT on the relative permeability. A typical figure of relative permeability for different IFT is shown in Figure 1(b), which indicates that the relative permeabilities are almost straight lines when σ = 0.03 and curve more with the increase of IFT. Residual oil saturation and relative permeability determined from the displacement tests are affected strongly by IFT (Blom et al., 2000; Cinar and Orr, 2005; Jahanbakhsh et al., 2016). These experimental studies demonstrate that oil/gas relative permeabilities are affected significantly by IFT, and a linear relationship between the relative permeability and IFT is observed. Especially, when IFT is less than a threshold, the impact of IFT on the relative permeability is more pronounced.
(a) Relation between IFT and liquid relative permeability for different vapor saturation (Longeron, 1980); and (b) relative permeability for different IFT in a six-component gas condensate system, Berea core (Munkerud and Torsaeter, 1995).
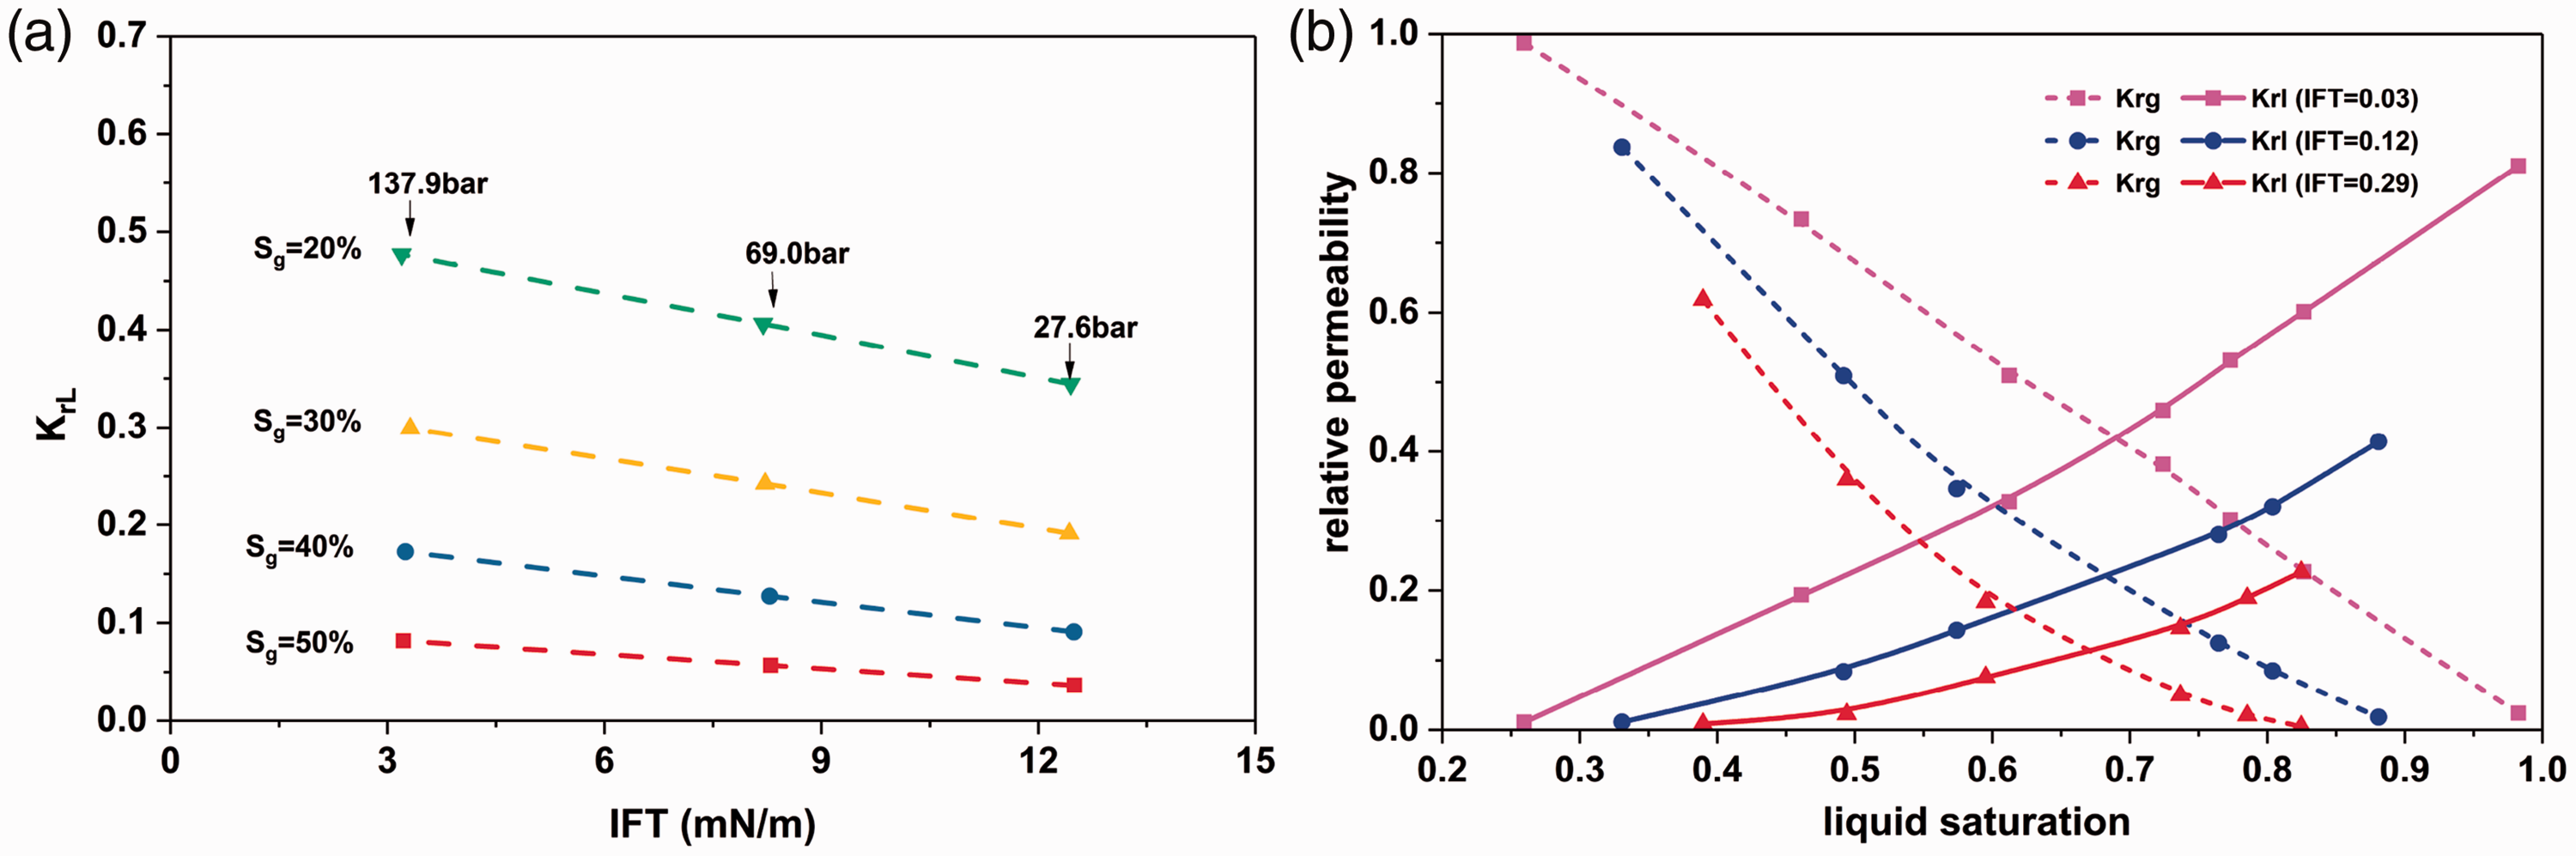
Gas injection is a widely practiced mean for improving oil recovery because of its high displacement efficiency and relatively low cost. More favorable miscibility can be developed by higher pressure, lower temperature, lighter oil and richer gas. CO2 injection process is generally operated at pressure above the MMP, which is the lowest pressure where the injected gas becomes miscible with crude oil. There are two methods to determine MMP from the viewpoint of miscibility mechanisms: based on the high oil recovery, more specifically, small increment of oil recovery per pressure, such as slim tube test (SL) (Yellig and Metcalfe, 1980), or based on the zeros IFT, such as vanishing-IFT technique (VIT) (Ayirala and Rao, 2011; Rao, 1997) and rising bubble apparatus (Christiansen and Haines, 1987).
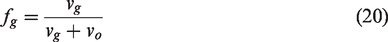
However, an inconsistency may exist between them. Figure 2(a) and (b) shows the MMP from SL and VIT separately. It can be seen that the MMP from VIT is higher than that from SL, and data from literatures also reveal similar results, as shown in Figure 3 (Al Riyami and Rao, 2015; Jaubert et al., 2002; Rao and Lee, 2000; Tathed et al., 2010). The important thing to conclude from this analysis is the miscibility criteria from VIT are more stringent. It is generally believed that miscibility may repeatedly develop and break down in a reservoir due to dispersion arising from viscous fingering and reservoir heterogeneity. Thus, many “miscible” processes are in fact a mixture of miscible and low LFT, near-miscible processes (Shyeh-Yung, 1991). The effluent from the SL test consisted of dark in-place oil followed by a red fluid, then an orange fluid, then a yellow fluid, which also demonstrate that the displacement process in the sand packed coil is dynamic. When the reservoir pressure is higher than MMP from VIT test, by contrast, the IFT during miscible displacement process equals to zeros. Consequently, MMP from SL and its corresponding IFT represent the turning point of immiscible and miscible.
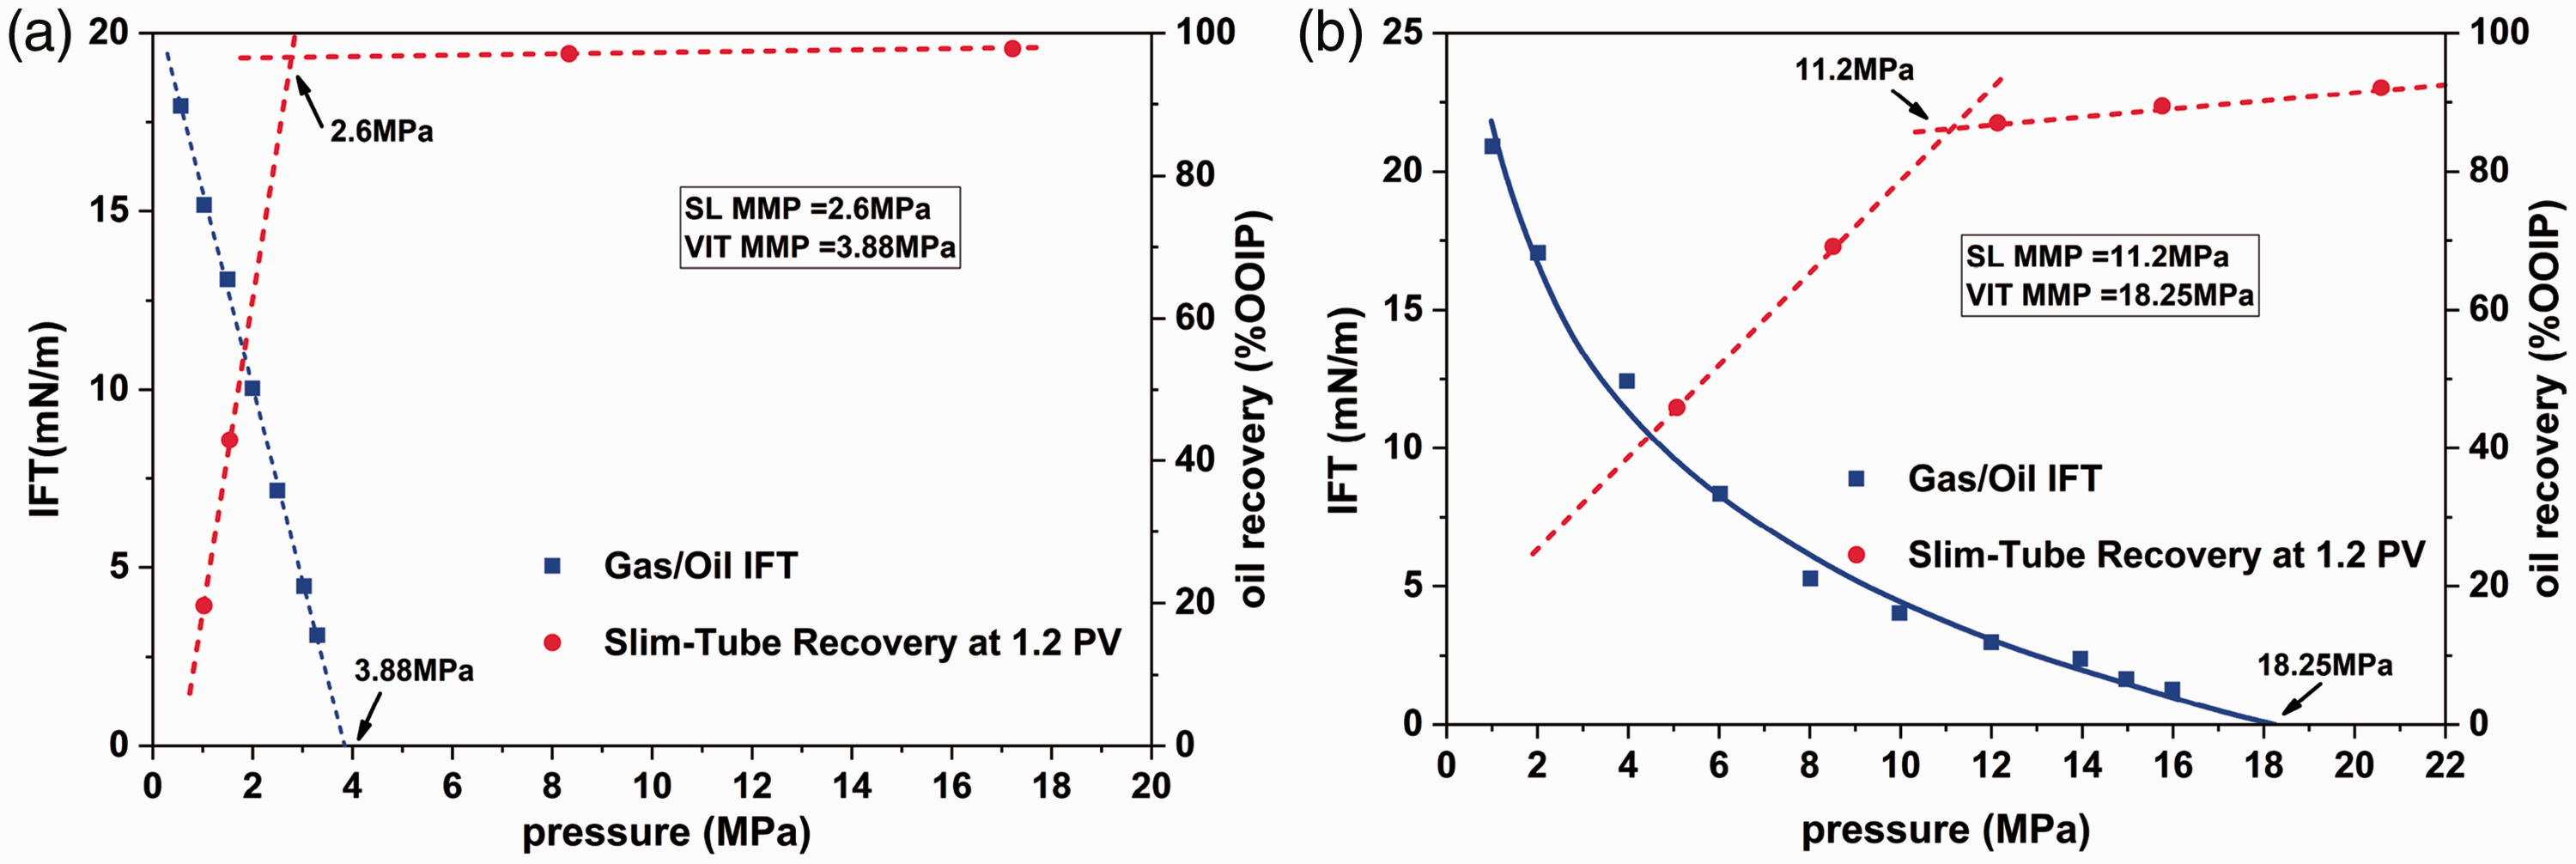
MMP from VIT vs. MMP from SL.
According to the above analyses, a methodology to determine the relative permeability interpolation under different miscibility is proposed, considering the complicated interaction between oil and gas. The IFT at the pressure of MMP is defined as critical IFT, σ0, below which relative permeability change dramatically. As a result, interpolation parameter, Fk, as a function of IFT, is determined to obtain the relative permeability. The Ramey correlation is recommended in the absence of IFT data (Ramey, 1973), seen below. The parameters in the correlation are shown in Appendix 1. The form of Ramey correlation is
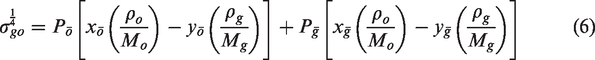
The relative permeability of under immiscible condition where


Most of the previous studies have revealed that the relative permeability curves tended towards straight lines when miscible condition is developed. That is to say


However, the derivative of relative permeability with respect to gas saturation under such condition is not equal to zero. Without lack of generality, we can assume


Generally, it is recommended that nm = 1.1.
Viscosity of oil and gas
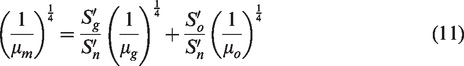
CO2 solubility results in oil viscosity reduction due to gas injection. Zhou and Rui pointed out that with the mix of the heavy oil and CO2, the viscosity of the heavy oil can be reduced remarkably (up to 98%) (Zhou et al., 2019). Longeron concluded from the displacement experiments that the ratio of the viscosities varied much less, though the capillary number showed very large variation essentially due to the variation in IFT (Longeron, 1980). In this paper, the effective oil and gas viscosities follow the Todd-Longstaff model (Todd and Longstaff, 1972). They are given by


The mixture viscosity is given by a 1/4-power fluid mixing rule, shown as follows
Buckley-Leverett equation
The fundamental principle that underlies the description of flow in a porous medium is conservation of mass. For one-dimensional seepage of two phase in homogeneous isotropic horizontal porous medium, the following assumptions are made to obtain the analytical solution.
The two-phase flow is linear and horizontal. The two fluids, crude oil and injected gas, are both incompressible. The porous media is incompressible. The effect of capillary and gravity is negligible. The gas is injected at the inlet, x = 0. The injection pressure and production pressure are constant.
Subject to the assumptions stated, the conservations of mass for the oil (o) and gas (g) phase become
Considering
The classical fractional fractional-flow theory is based on the assumption of constant volumetric flux,
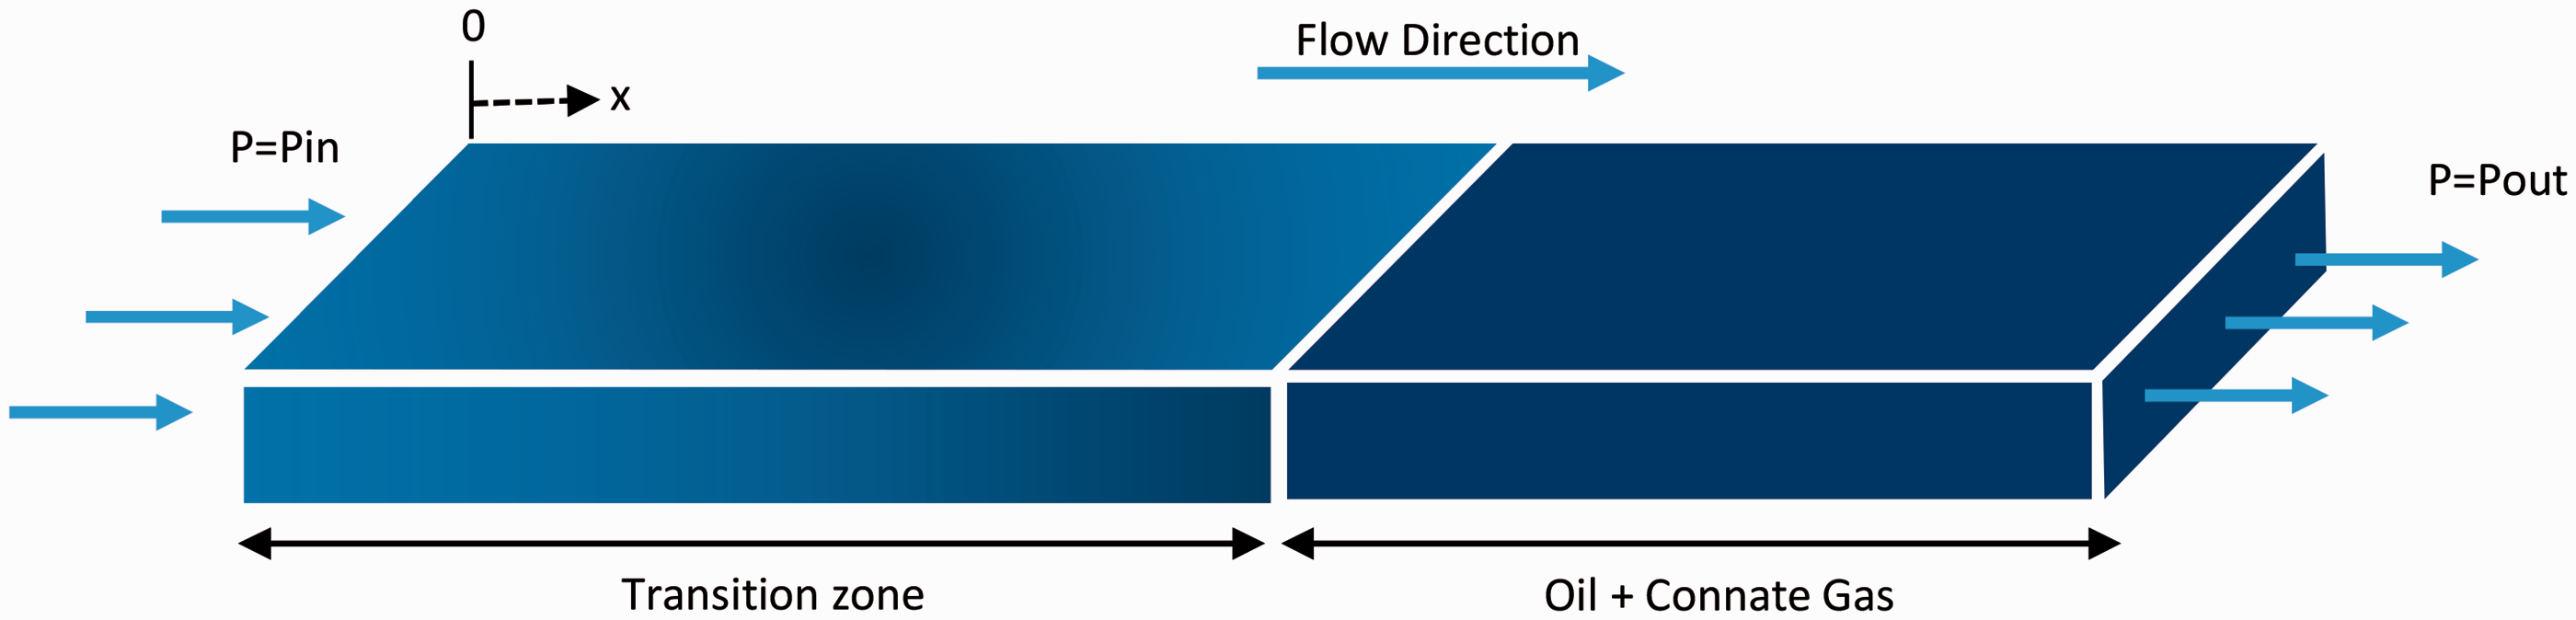
Linear displacement in a porous media.
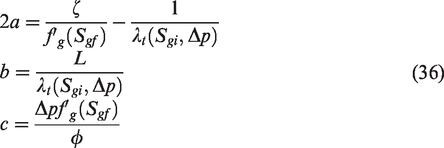
Initial and boundary conditions of pressure
Initial and boundary conditions of saturation
When co-seepaging in the porous media, the two phases are subject to Darcy’s Law. For the oil and gas phase, the volume fluxes are given separately as follows
Adding the two equations above, the total volumetric flux can be expressed as

The fractional-flow function for the gas phase is defined as follows
By substituting the Darcy equation into the definition formula, the fractional-flow function can be written as a function of gas saturation and pressure
This equation can be used to determine the fractional-flow function of gas at any position of the reservoir after the gas saturation and pressure are given. In order to obtain analytical solution, the average pressure is used to determine the fractional-flow function. For the displacement process stated above where the pressure at both ends are given, the fractional-flow function is a function of saturation, as follows

By substituting the definition of fractional-flow function into equation (12), it can be rewritten as follows
For the gas saturation is the function of time and distance, according to derivative method for compound function, equation (23) can be written as
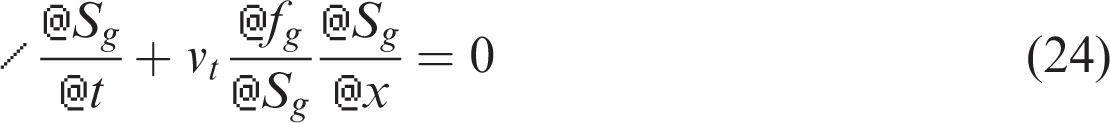
The equation is referred to as the Buckley-Leverett equation, which constitutes the mathematical model in this paper coupled with the initial and boundary conditions of pressure and saturation.
Analytical solution
Frontal advance equation for gas flooding
The gas saturation on the section is constant, that is

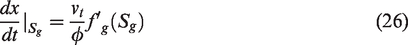
Combining the above equation with equation (24), the front advance velocity of a certain saturation is given as
Integrating equation (19) between inlet and outlet ends, the following relation can be obtained
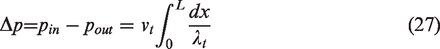
The location of the front at a given time is xf corresponding the frontal saturation Sgf. Dividing the integral into two parts, behind the gas front and ahead of the front, equation (27) can be rewritten as
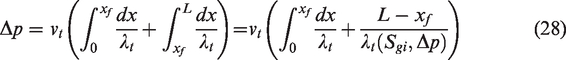
Applying integration by parts twice and rearranging it give
The integral on the right side of the above equation is a constant. Let it be
Therefore, the total volumetric flux is shown as
Integrating the front advance velocity, equation (26), the location of a given gas saturation at time t can be obtained
For the saturation of the shock front, Sgf, determined by the Welege’s (1952) method seen in Figure 5, the corresponding location of the shock front is
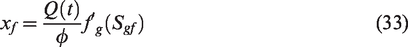
Graphical determination of front saturation with Welge’s method.
Thus, the total volumetric flux can be rewritten as
Substituting the above equation into the front advance velocity, the following can be obtained
Let
Therefore, the front advance velocity can be rewritten as
Integrating the above equation from the inlet to the front, the location of the front is
Meanwhile, the total volumetric flux is determined as
When the front breaks through at the outlet, xf in equation (38) equals the length of the porous media, which means xf = L. Thus, the breakthrough time can be obtained
The profiles of saturation and pressure
By integrating the front advance velocity of the corresponding saturation, the location of a certain saturation can be determined

The pressure profile can be determined by integrating equation (19). The front is the dividing point of fluid distribution and the properties of fluid in the two parts are different leading to different pressure profile behind and ahead of the front.
Behind the gas front, the gas has swept the zone where the oil and gas coexist. Therefore, the pressure profile of this part can be determined by integrating from the inlet to the gas front. We can get
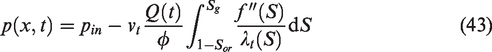
Since the properties of the fluid vary along the path, the pressure profile is nonlinear which can be observed from equation (43).
Ahead of the gas front, for the single phase of the oil phase flowing in the porous media, the pressure profile which is linear, can be determined by integrating from the gas front to the outlet.

Model verification
In this section, the verification is performed by comparing the analytical solution with the numerical solution. First, based on the gas flood model, the relative permeabilities of gas and oil under different condition are determined. Then, the saturation and pressure profiles of gas flooding are calculated from the analytical model stated above and numerical solution with finite difference method (FDM). In the numerical solution, the same models of viscosity and relative permeability are adopted to determine the varying properties of the two fluids.
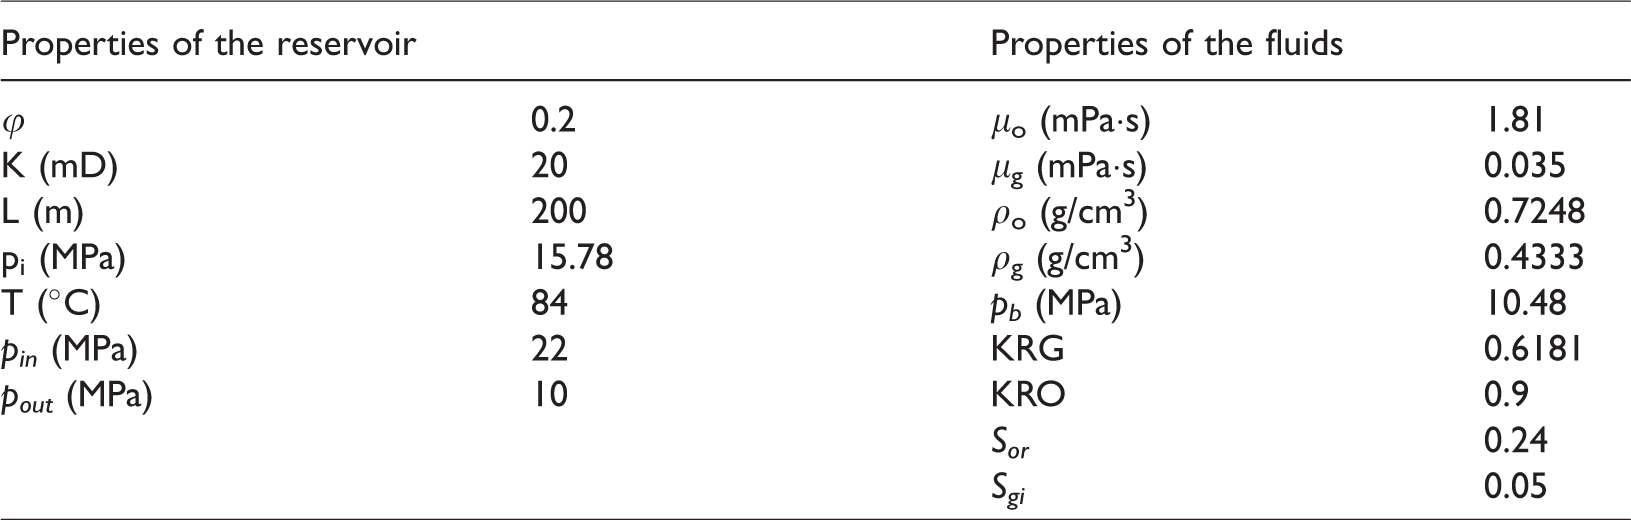
The physical flow model is a one-dimensional linear porous medium, which is at first saturated uniformly with oil (Soi = 0.95) and gas (Sgi = 0.05). A constant inlet and outlet pressure is imposed, starting from t = 0. The properties of porous media and fluids are shown in Table 1. The immiscible relative permeability curve is measured experimentally and the analytical expression is obtained by fitting the relative permeability index in the Corey-Brook model, which is convenient for the determination of first and the second derivative of fractional-flow fraction. The relative permeabilities under different miscible condition are determined through the model in the first part of the mathematical model and the fractional-flow is obtained by equation (21). Thus, the saturation and pressure profiles are calculated from equations (41), (43) and (44) separately.
The parameters used in the calculation.
Relative permeability is an exponential function of saturation in the Corey-Brooks model. The relative permeability index can be obtained by fitting the double logarithmic curve of the relative permeability experimental data, the result of which is ng = 2.1079 and no = 2.9852, shown in Figure 6(a) and (b). The relative permeability calculated by the Corey-Brooks model is in good agreement with the experimental data, as shown in Figure 7.
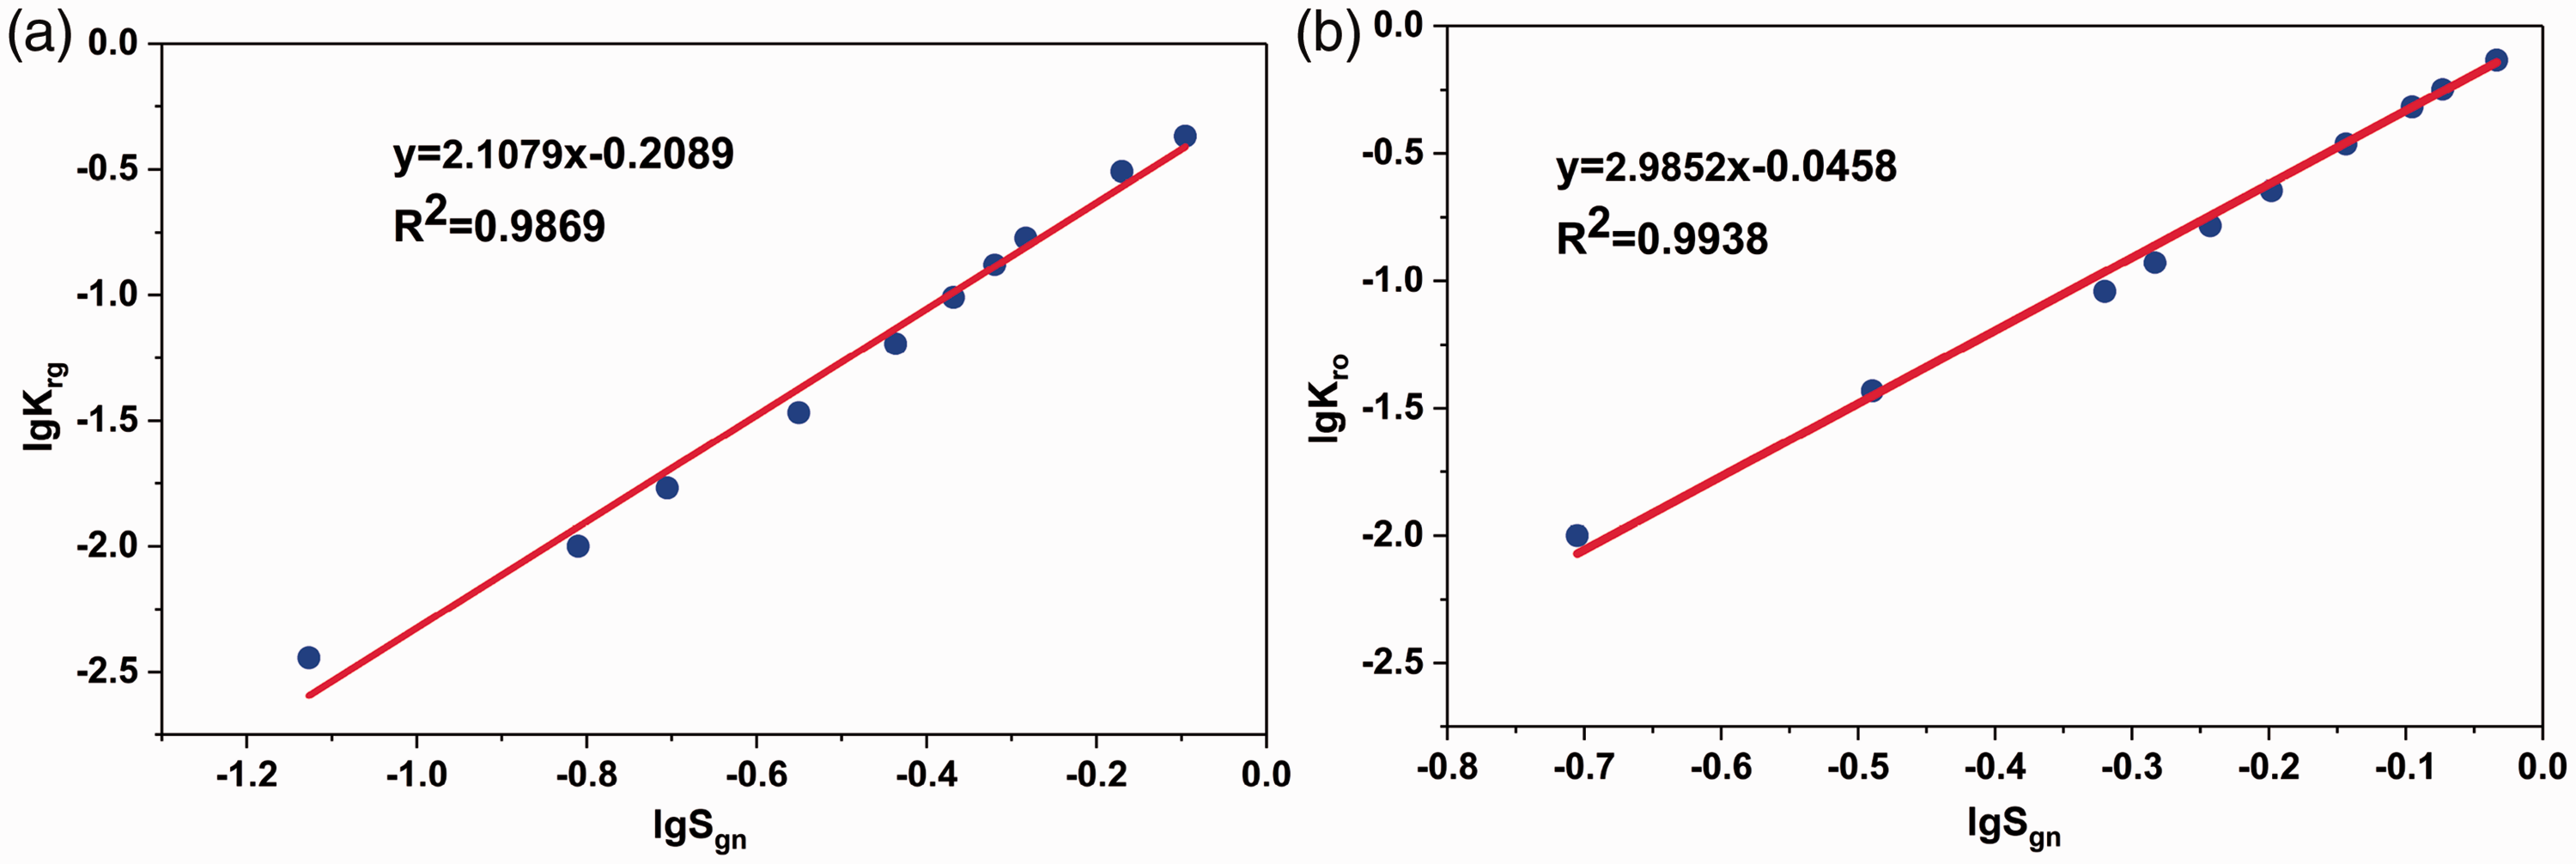
(a) and (b) Log-log plot of gas saturation and relative permeability for gas and oil separately.
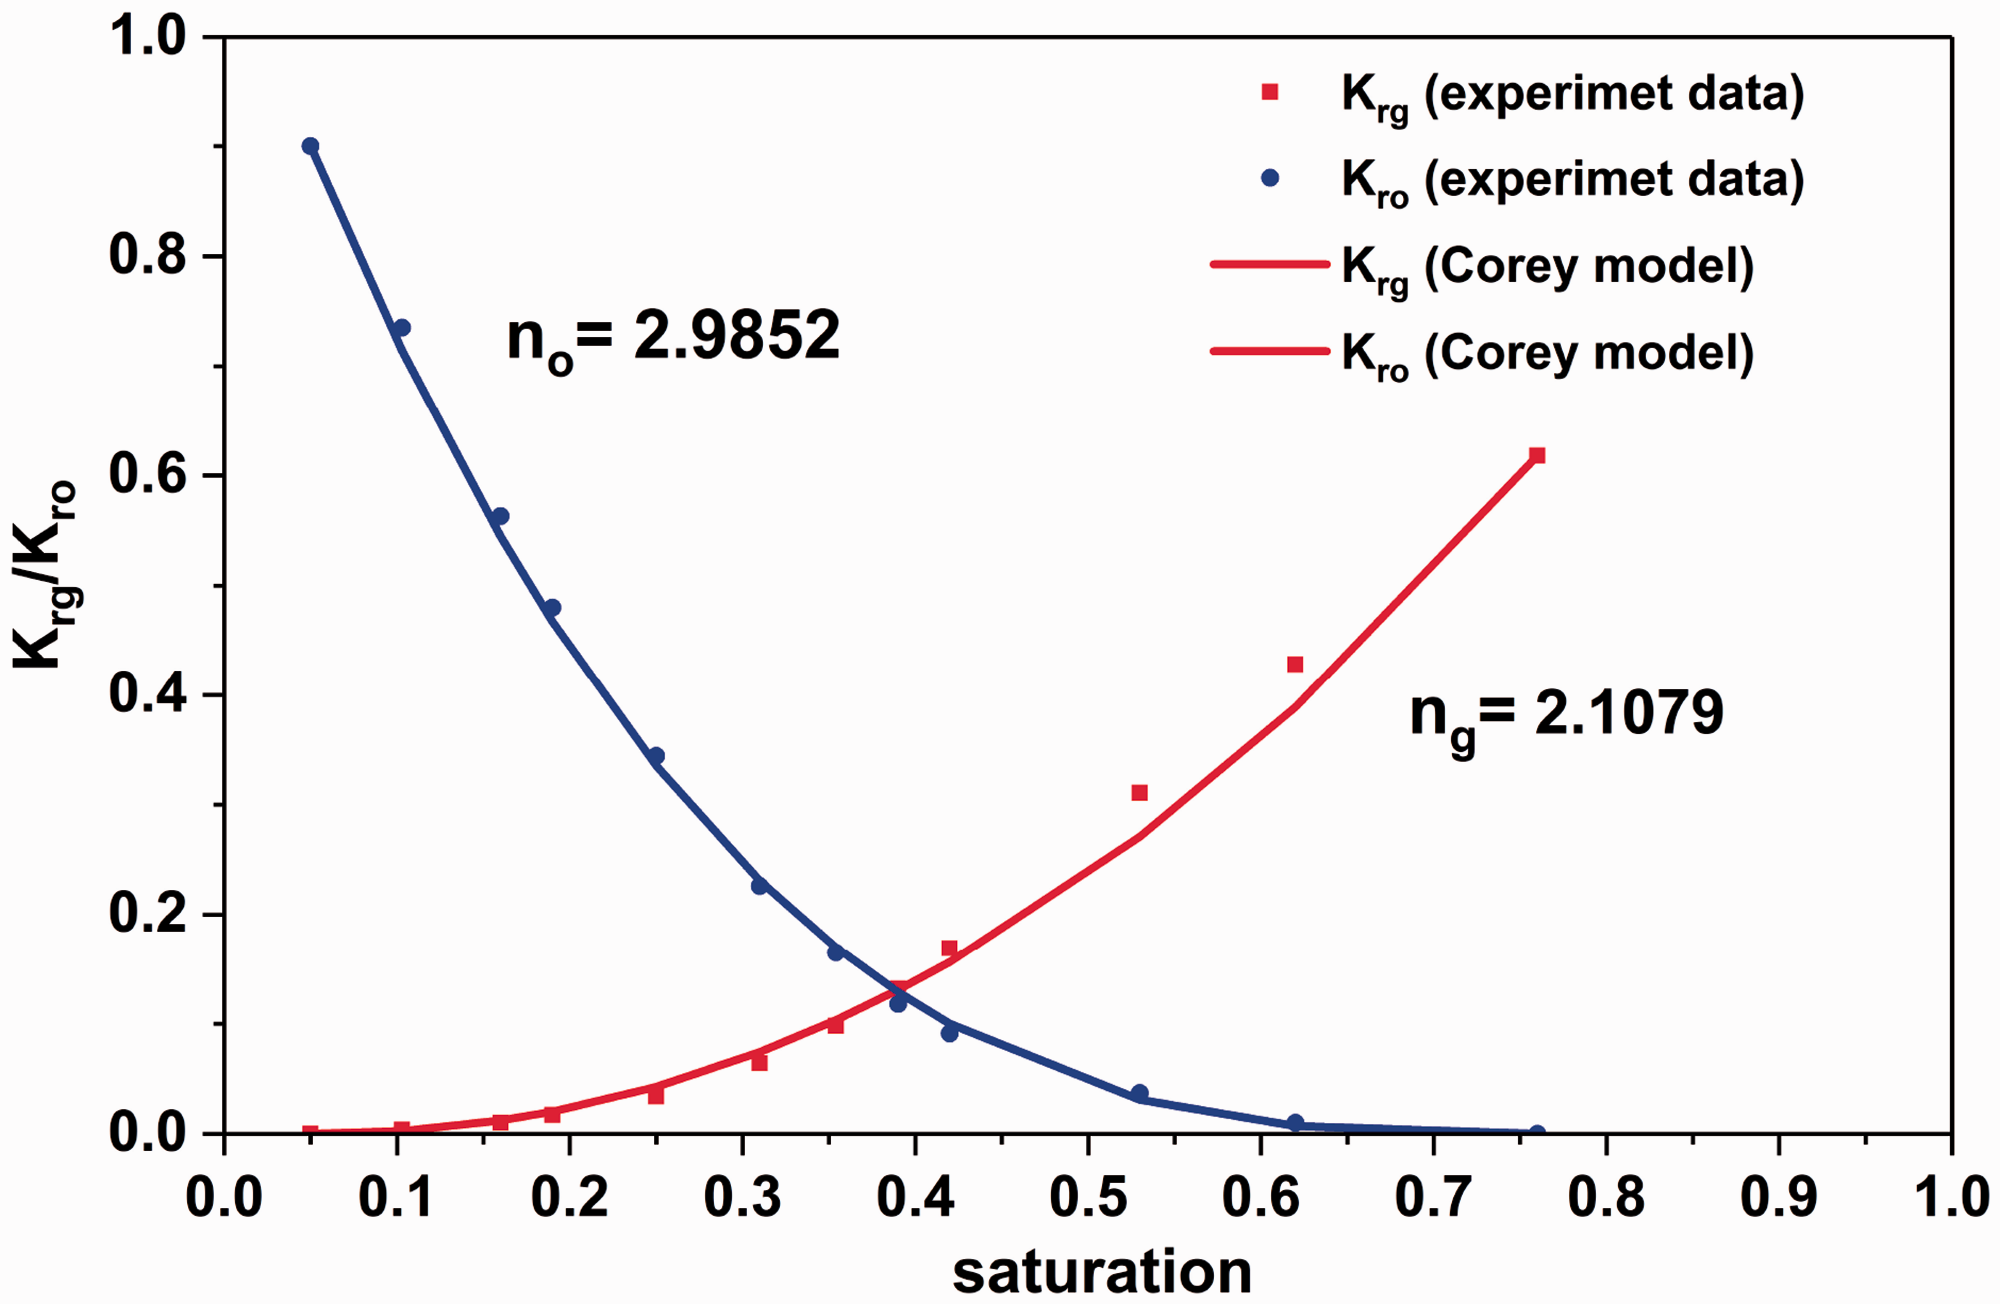
The relative permeability in experiment and Corey model.
The oil recovery varying with pressure reaches its inflection at the pressure of 16.5 MPa, corresponding to the IFT of 1.97 cP, as shown in Figure 8. Therefore, the critical IFT is 1.97 cP. Effective miscible displacement could not be formed between oil and gas where the IFT is higher than critical IFT. The diffusivity of the gas was found to increase with temperature and pressure (Jamialahmadi et al., 2006). Shu et al. (2017) concluded that the pressure is the most important factor affecting the mass transfer during the gas injection. They pointed that the interface concentration of CO2 in the oil phase increased with the pressure. The more intense the mass transfer between the fluids, the lower the IFT. When the IFT is lowered than 1.97 cP, the miscible condition of oil and gas will have a drastic change and the relative permeability will vary with pressure. Based on the relative permeability model of gas flooding established above, the relative permeability under different miscible condition is determined. Then, the fractional-flow curve is obtained from equation (21). Thus, the saturation and pressure profiles are calculated from equations (41), (43) and (44) separately.
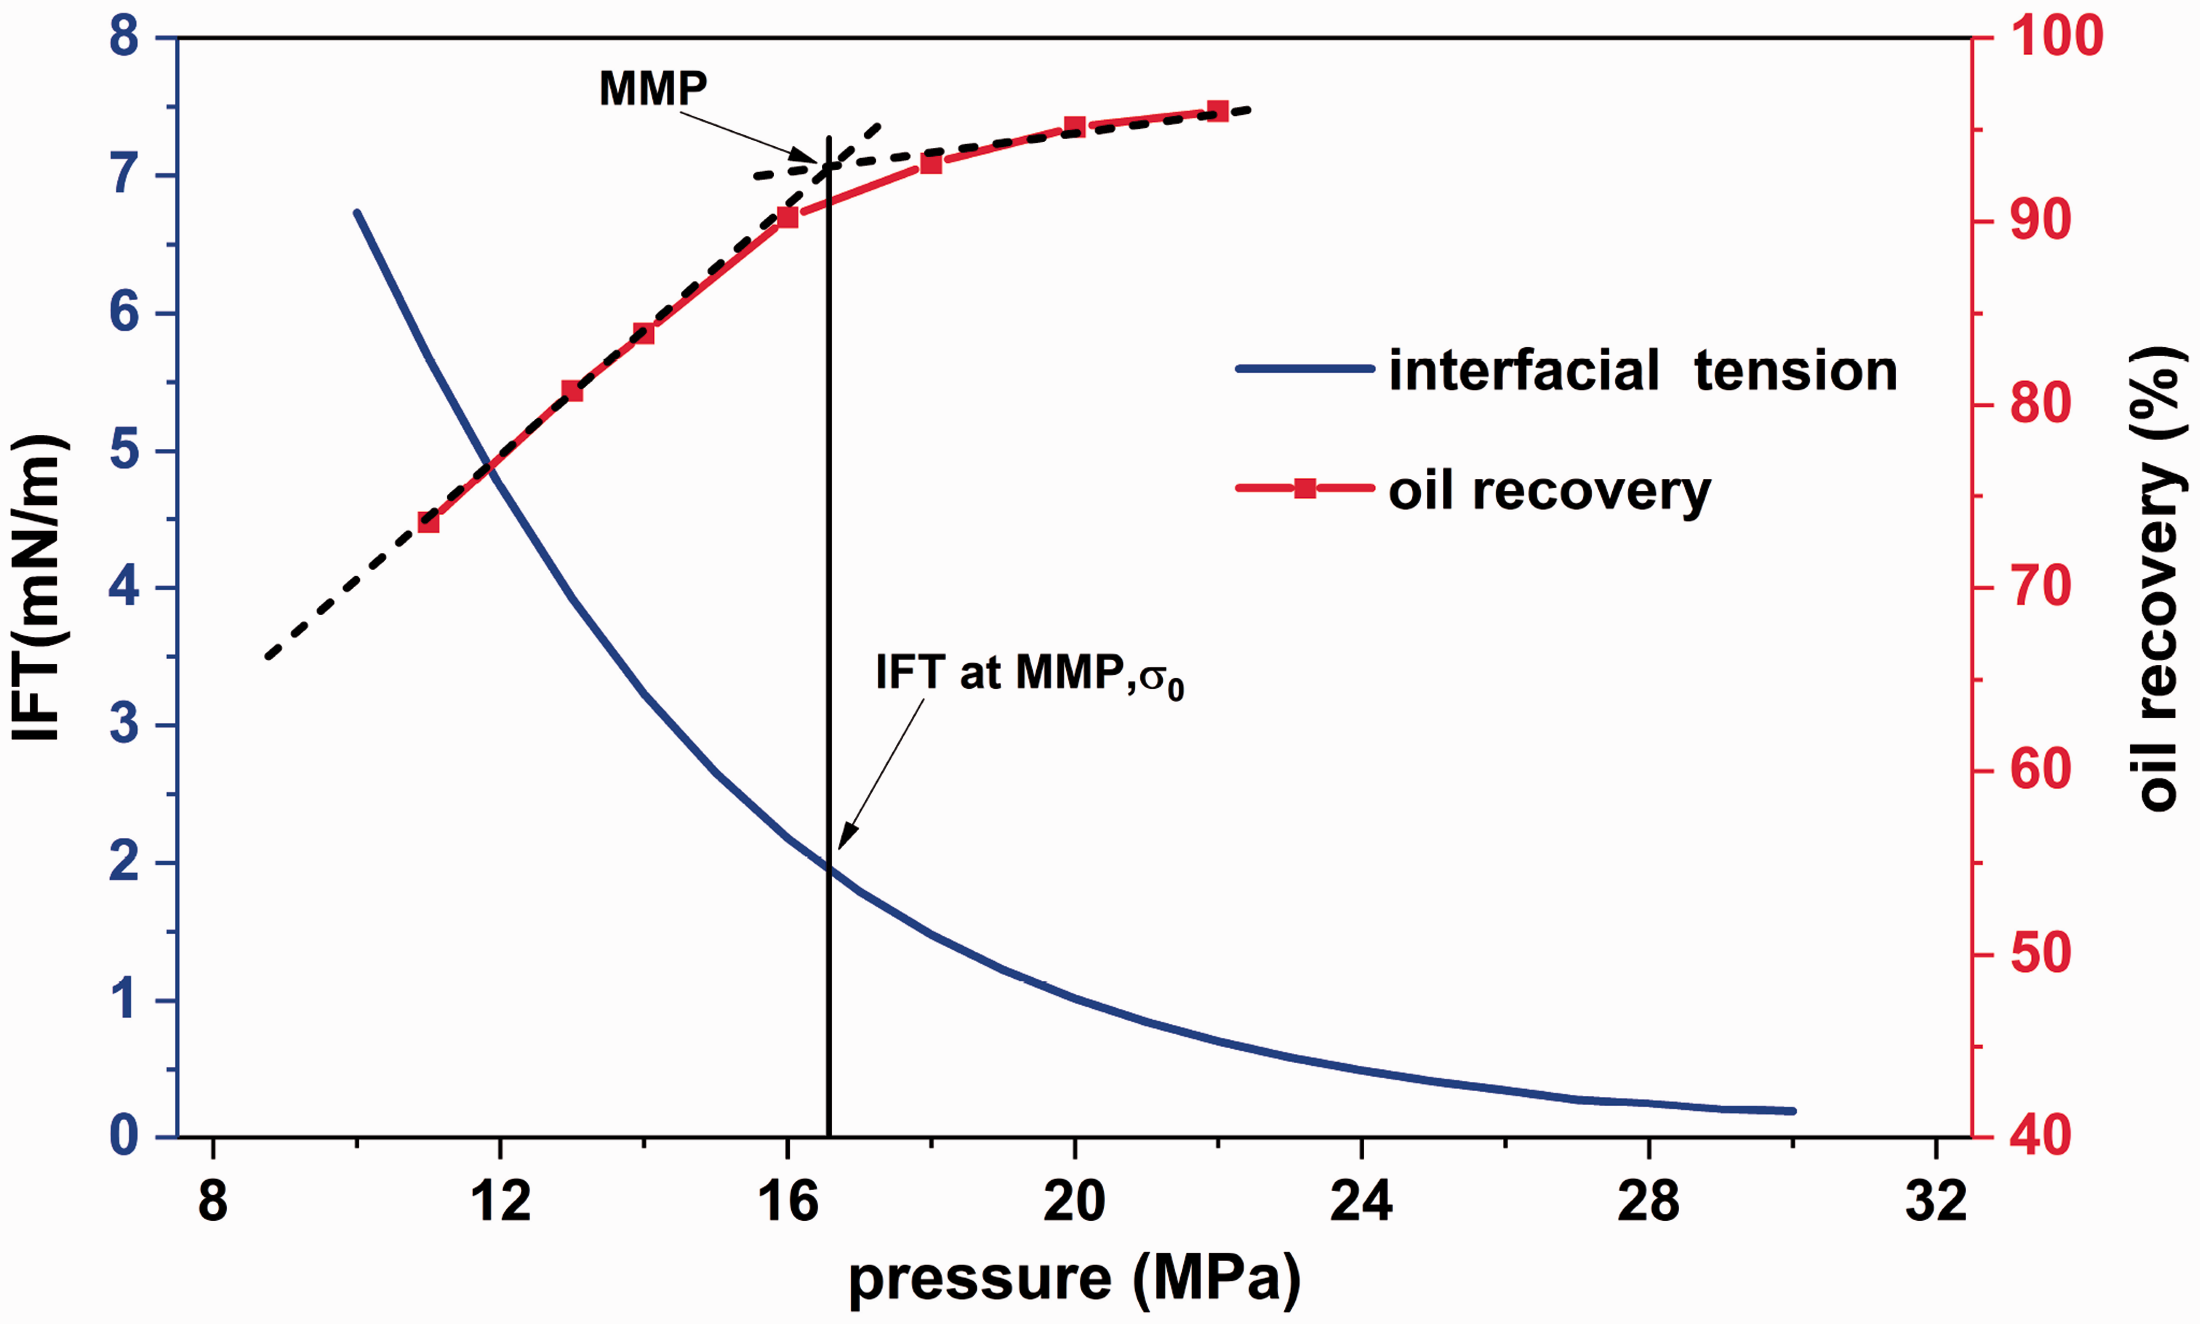
IFT between oil and gas and oil recovery in the experiment of slim tube versus different pressure.
In order to verify the analytical solution, the numerical solution is obtained with FDM using the same reservoir condition and physical properties. The geological model is turned into a discrete system by subdividing the x-axis into N grid blocks, as illustrated in Figure 9. The pressure is solved implicitly and the saturation is solved explicitly, and the calculated results are shown in Figures 10 and 11. To avoid the physically unreal oscillation caused by the central difference algorithm, the upwind style with first-order precision is used in the numerical solution, which unfortunately results in significant numerical dispersion and a smear front (Aziz, 1979; Wu, 2001), shown in Figure 12. It can be observed that the numerical solution deviates only slightly at the shock front. This deviation can be improved by refining the grid spacing. To reduce the effect of discretization on numerical simulation results, very fine, uniform mesh spacing is chosen. As can be seen from the figure, the impact of the discretization is very small when Δx = 0.5 m.
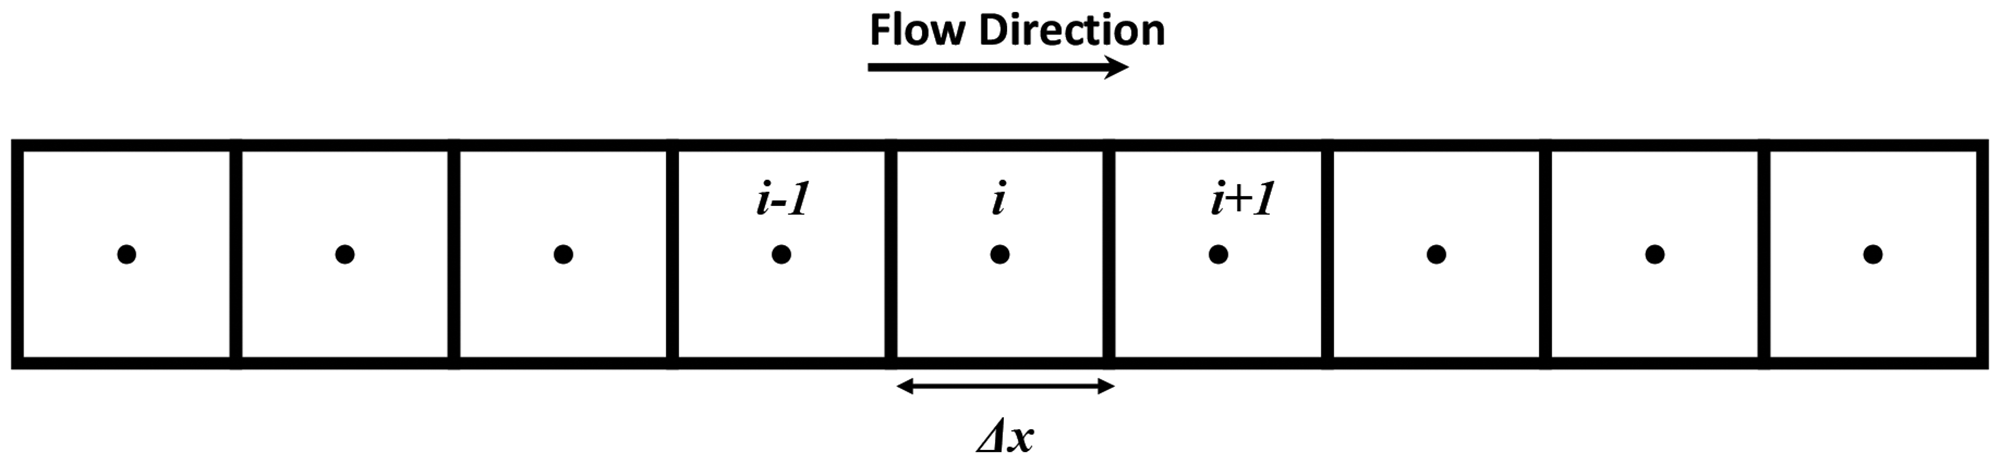
Schematic of numerical simulation with FDM.
Numerical simulation result for saturation profile.
Numerical simulation result for pressure profile.
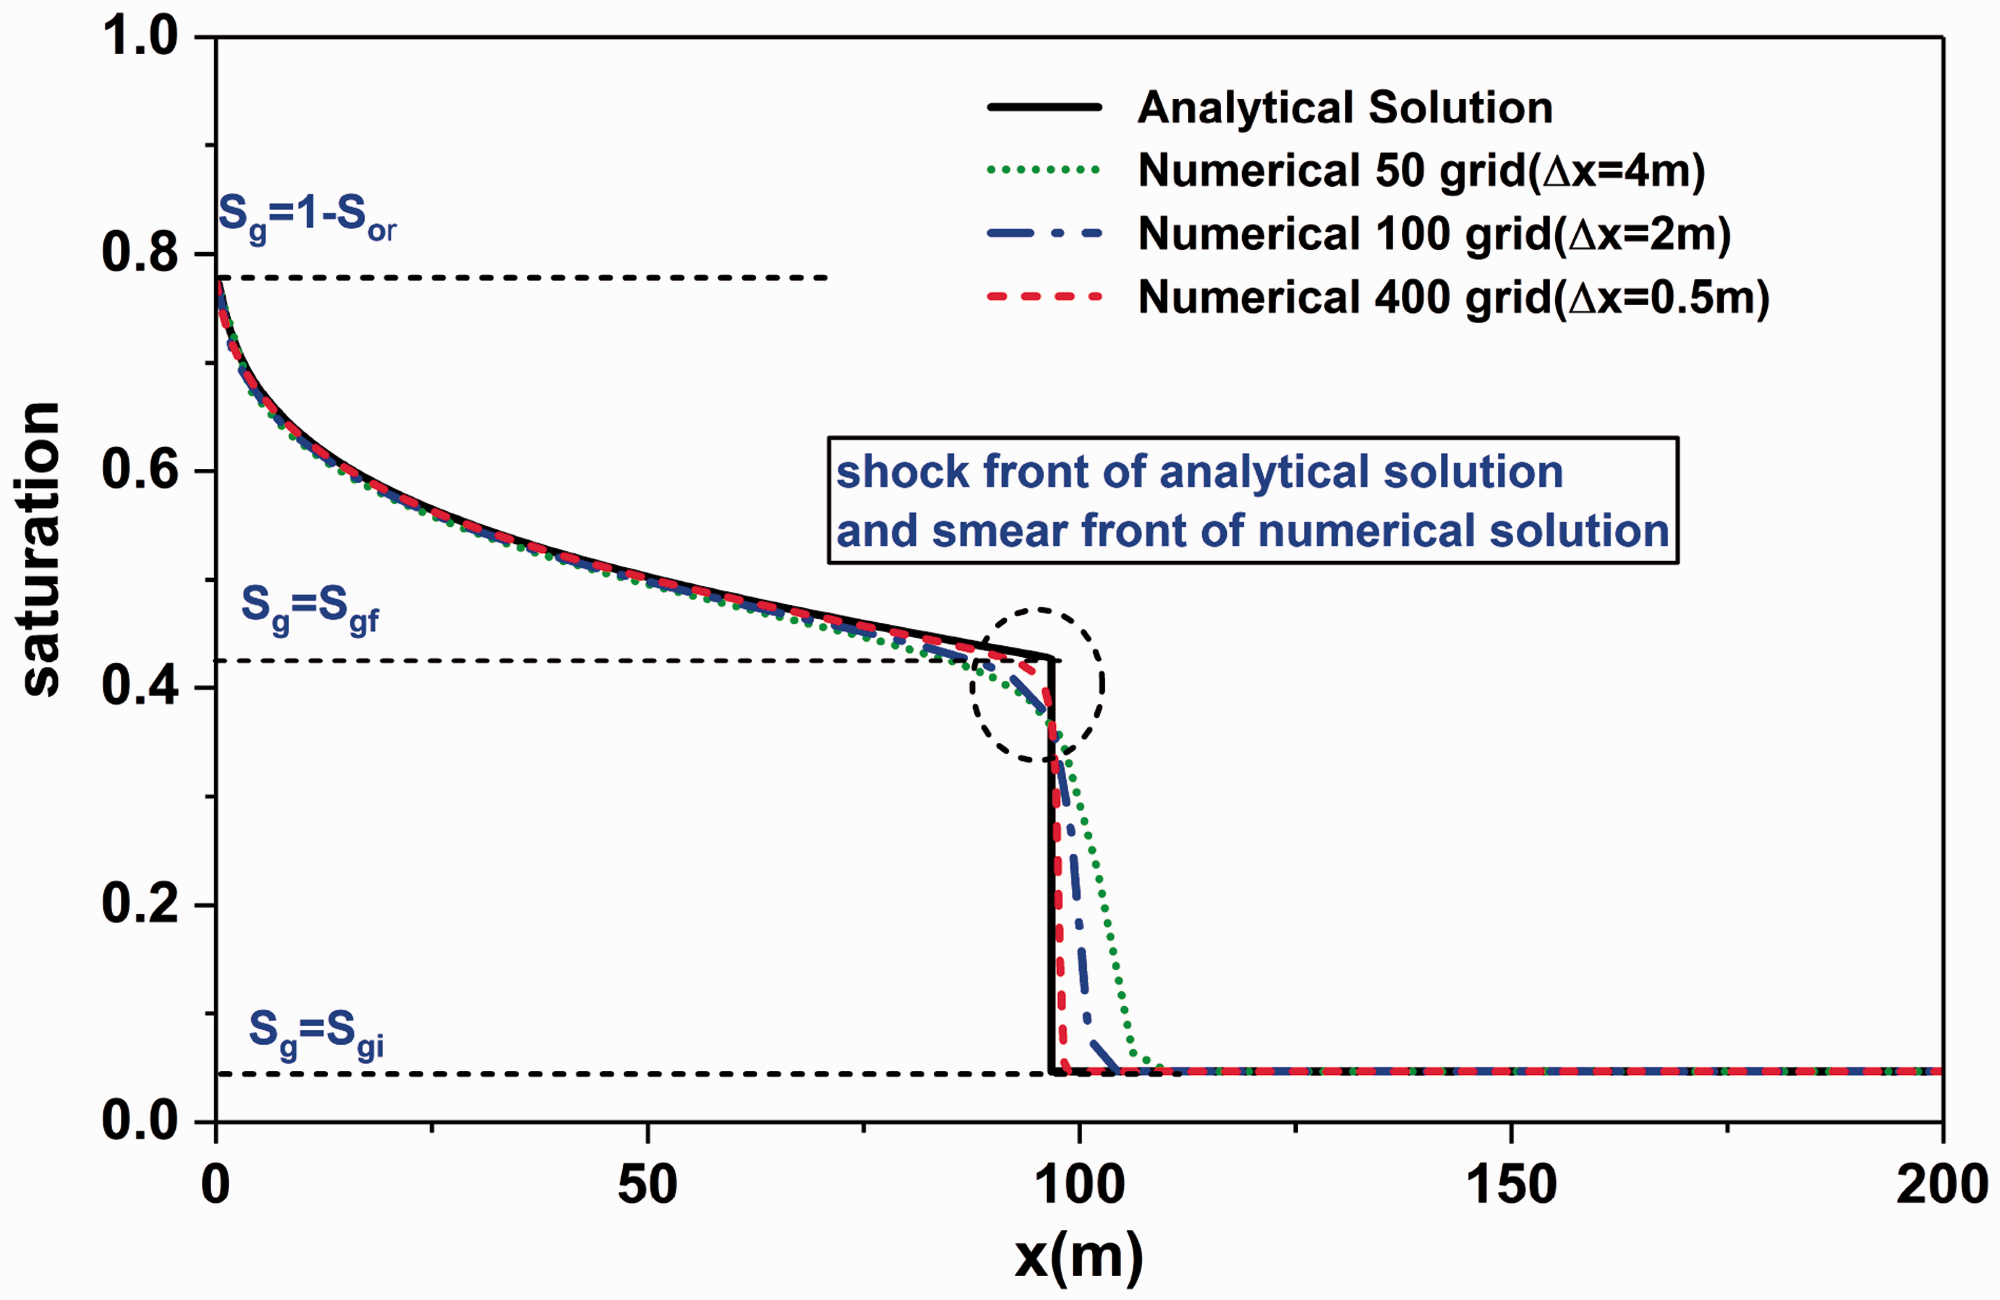
Numerical solution of the Buckley-Leverett equation with different grid spacing.
The comparison between the analytical and numerical results is shown in Figures 13 and 14. The solid lines are the analytical results and the dashed lines are the numerical results. The results show that the analytical solution is in reasonable agreement with numerical solution. The shock front of saturation advances toward the outlet at a constant speed, which is consistent with the case of constant volumetric flux (Arabzai and Honma, 2013). The pressure profile is nonlinear behind the front and linear ahead of the front.
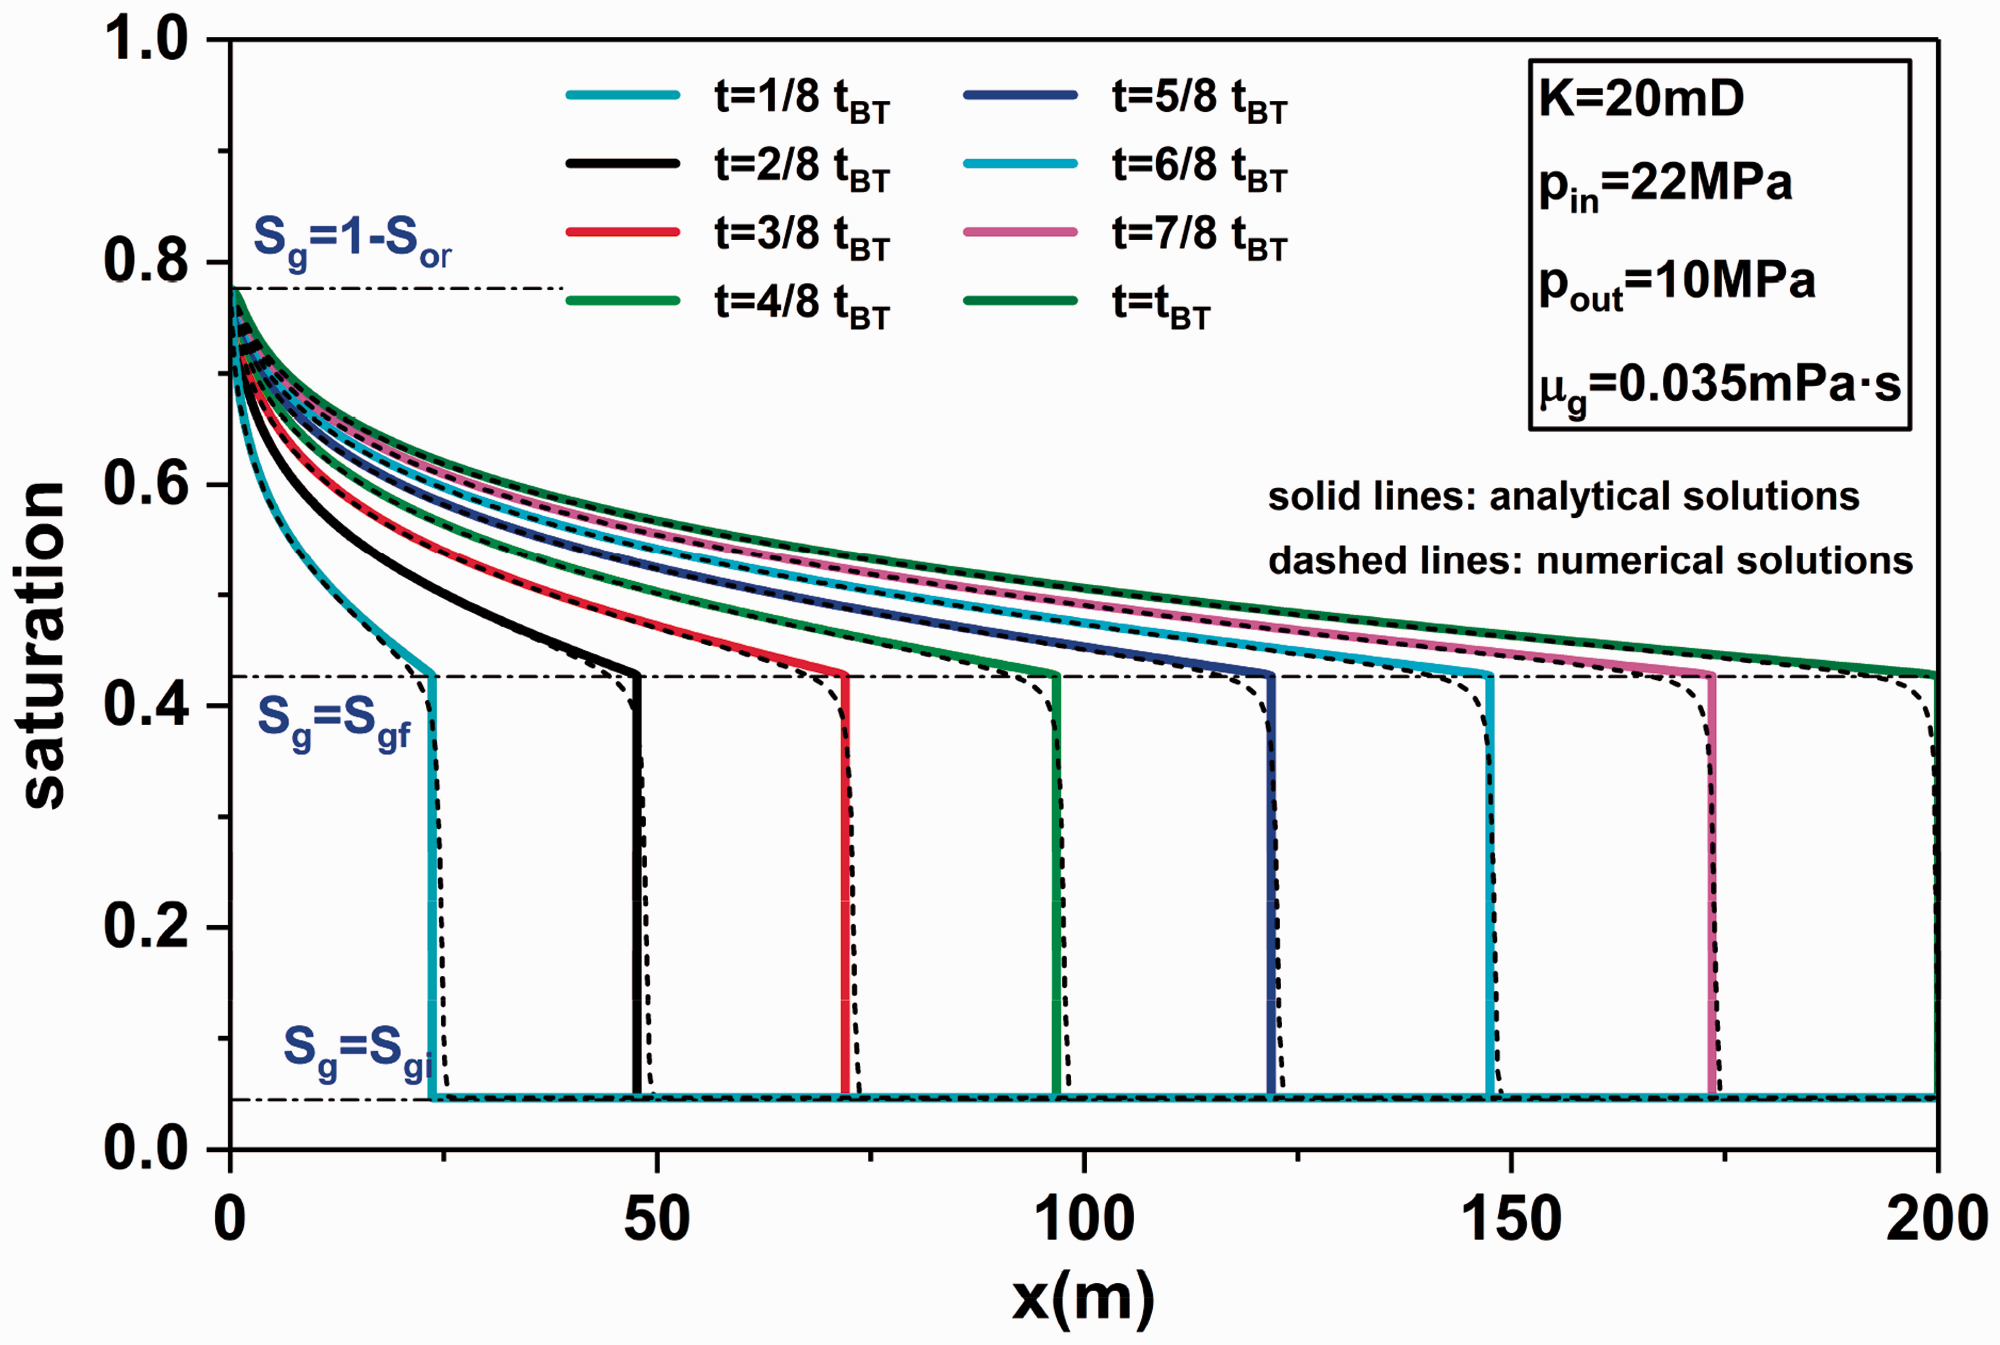
Comparison between numerical and analytical results for saturation profile at different time.
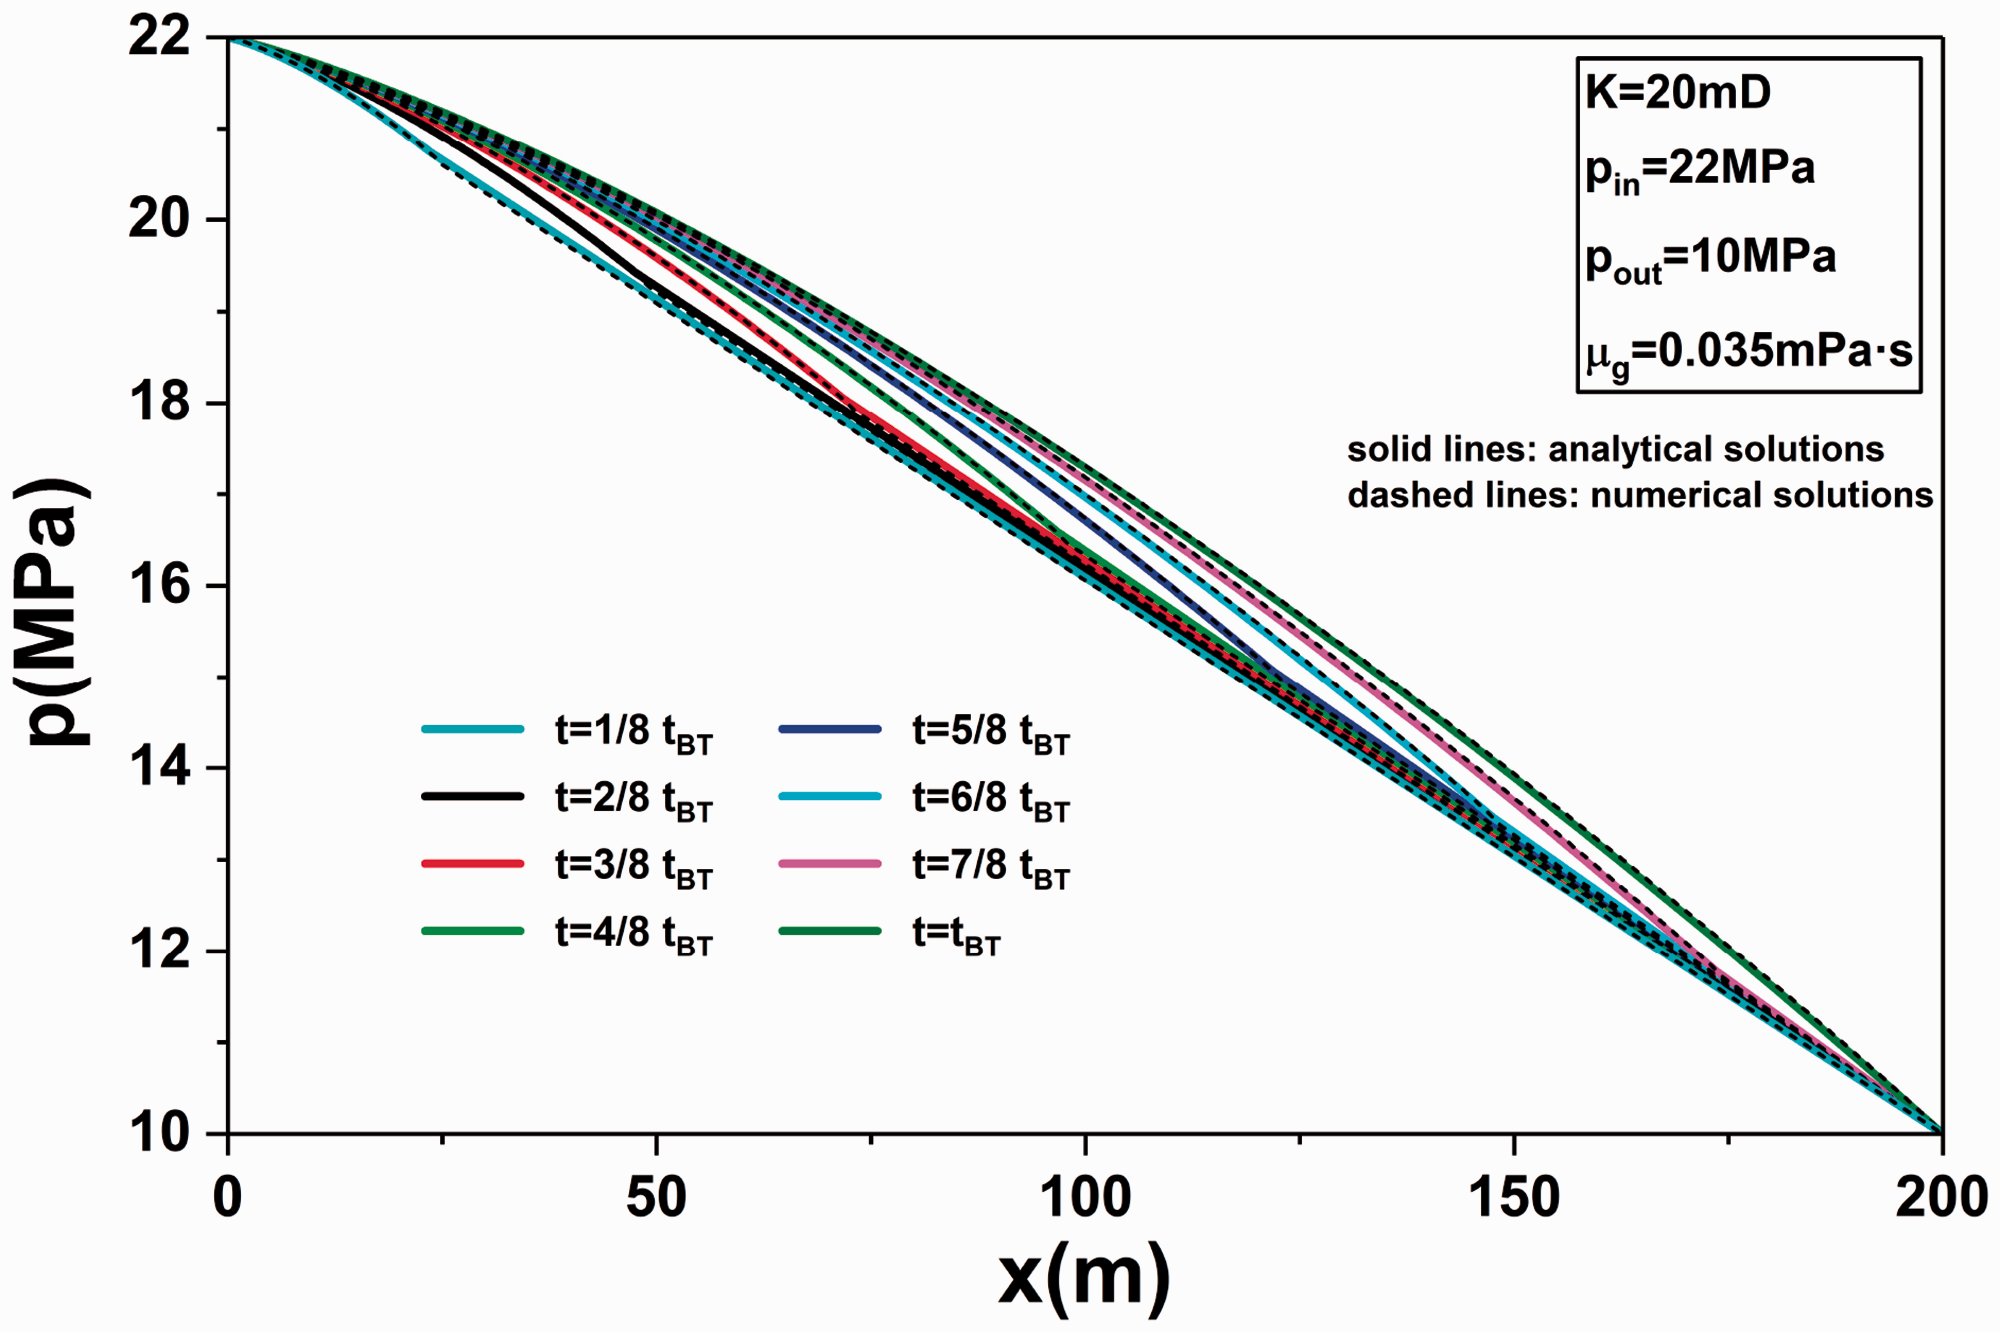
Comparison between numerical and analytical results for pressure profile at different time.
Results and discussion
For the gas flooding in porous media, the properties of porous media and fluids and the injection and production parameters dramatically impact the flow of the fluids, which determines the efficiency of gas displacement. Sensitivity analyses are conducted to investigate the effect of these parameters, including the permeability of the porous media, the viscosity and the injected pressure.
In the Buckley-Leverett equation, these parameters directly determine the fractional flow. As shown in equation (21), the fractional flow is a function of saturation, pressure, and viscosity. In order to study the effect on the fractional flow, the injection pressure is set to 14, 22 and 30 and the viscosity of the gas is set to 0.035, 0.105 and 0.175. Then, based on the relative permeability model of gas flooding established above, the relative permeability curve and fractional flow curve of different pressure and gas viscosity are determined, seen in Figures 15 and 16. With the increase of pressure, remarkable reduction in residual oil saturation and improvement of relative permeability are observed. Experimental data reveal the same variation rule, which is discussed thoroughly above. The essence of fractional-flow function is the mobility ratio between the displacement fluid and the displaced fluid. The results by Rui et al. indicated that the mobility ratio is a key element for determining the displacement efficiency (Rui et al., 2017). The typical fractional flow curve has a characteristic S-shape. With the increase of gas viscosity, the mobility of the displacing fluid increases and the mobility ratio is improved. Thus, the increase of fractional flow varying with gas saturation becomes slower and the front saturation decreases, similar to the result by Luo et al. (2017). For less viscous gas, once the gas breaks through, the well will produce a large amount of gas and the gas/oil ratio will rise sharply. The effect of pressure on fractional flow is complicated. Under the condition of low gas saturation, the fraction flow increases with the increase of pressure, contrary to the condition that the gas saturation is high.
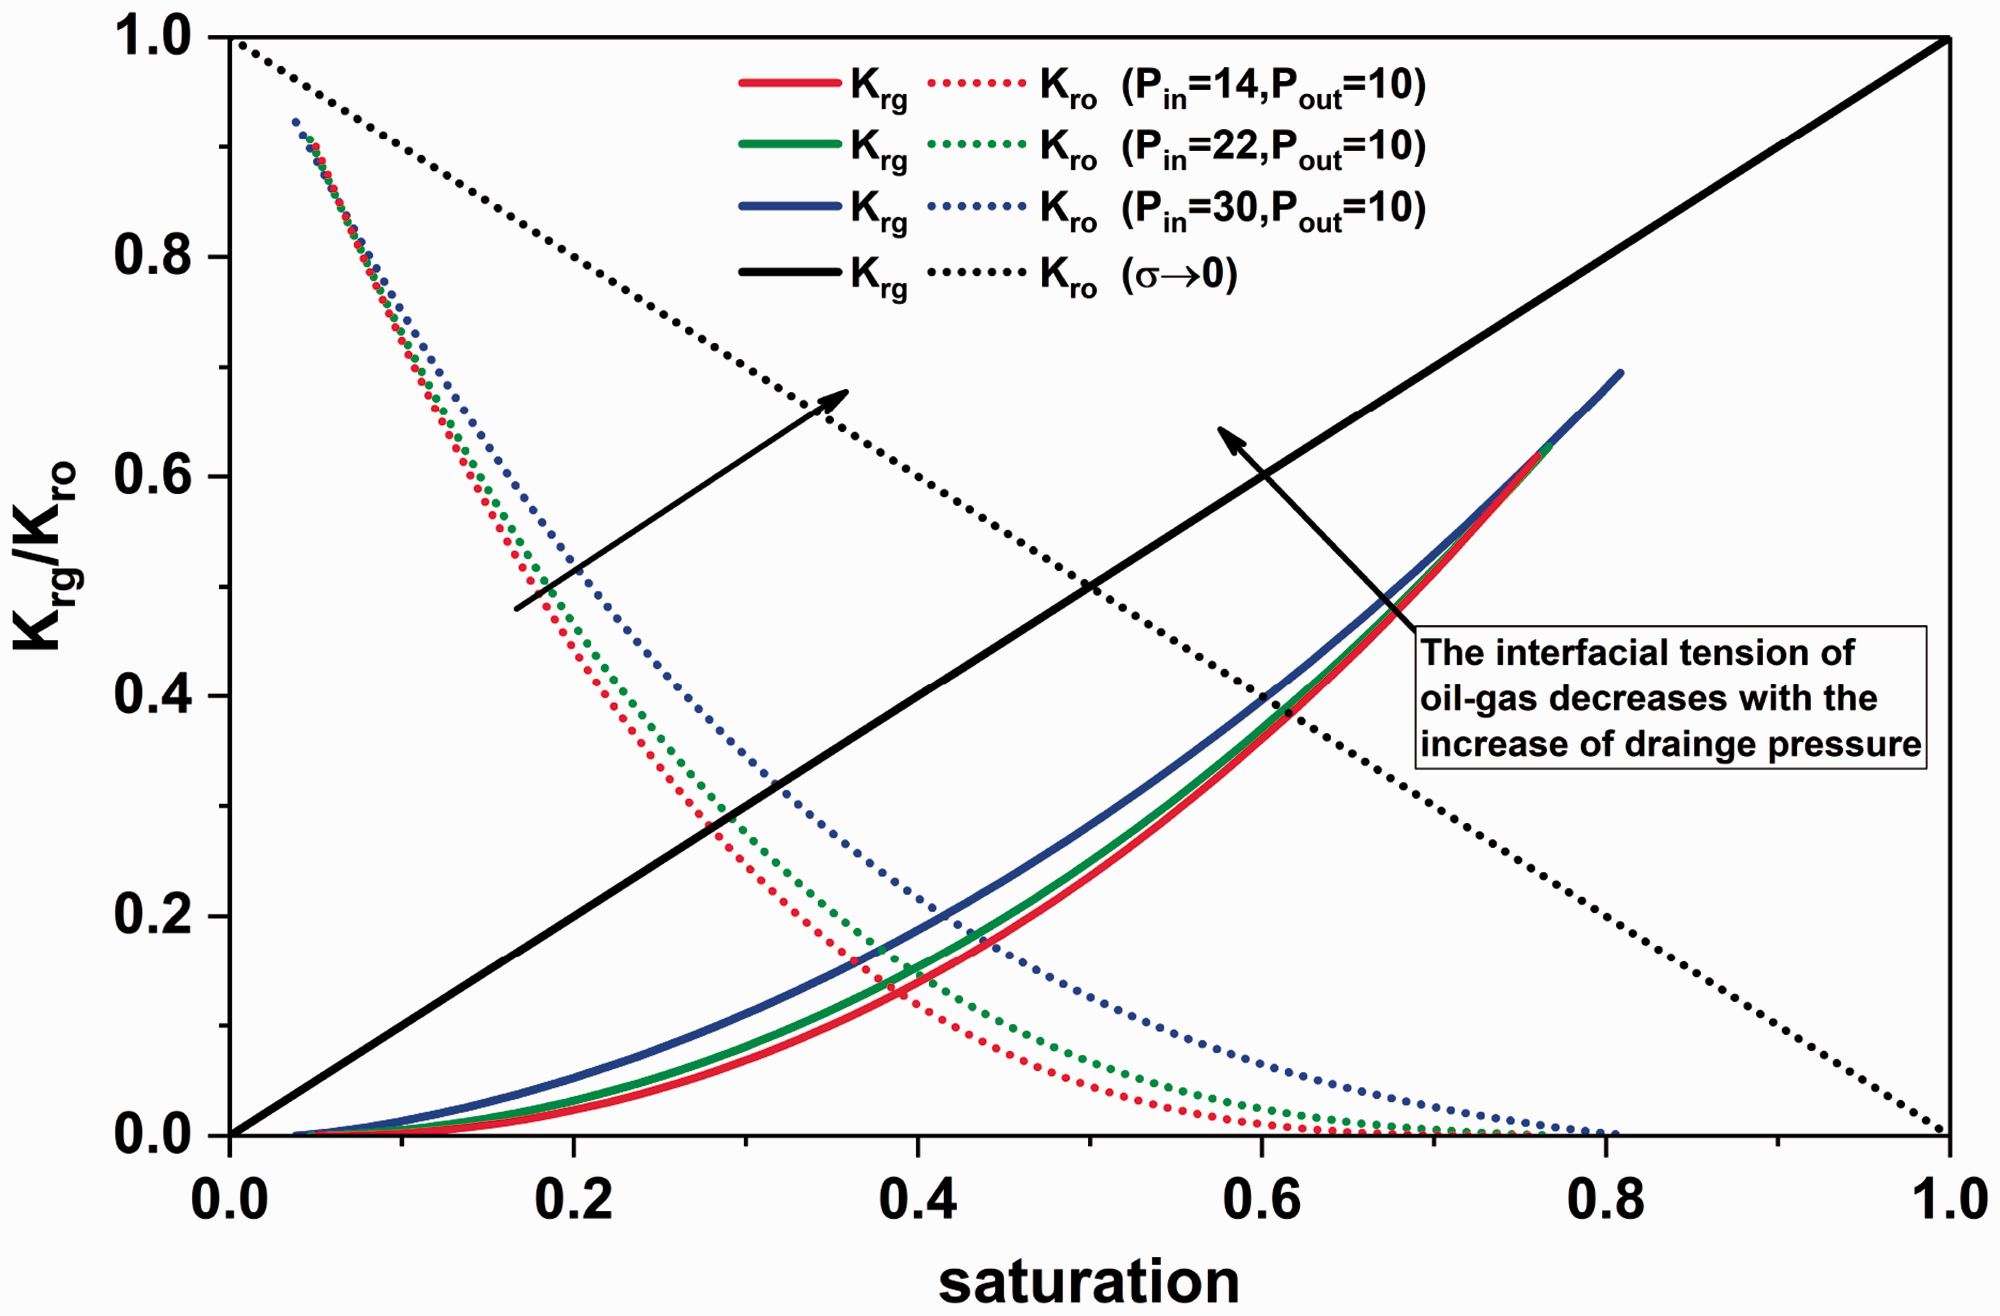
The relative permeability curve of oil and gas with different injection pressure.
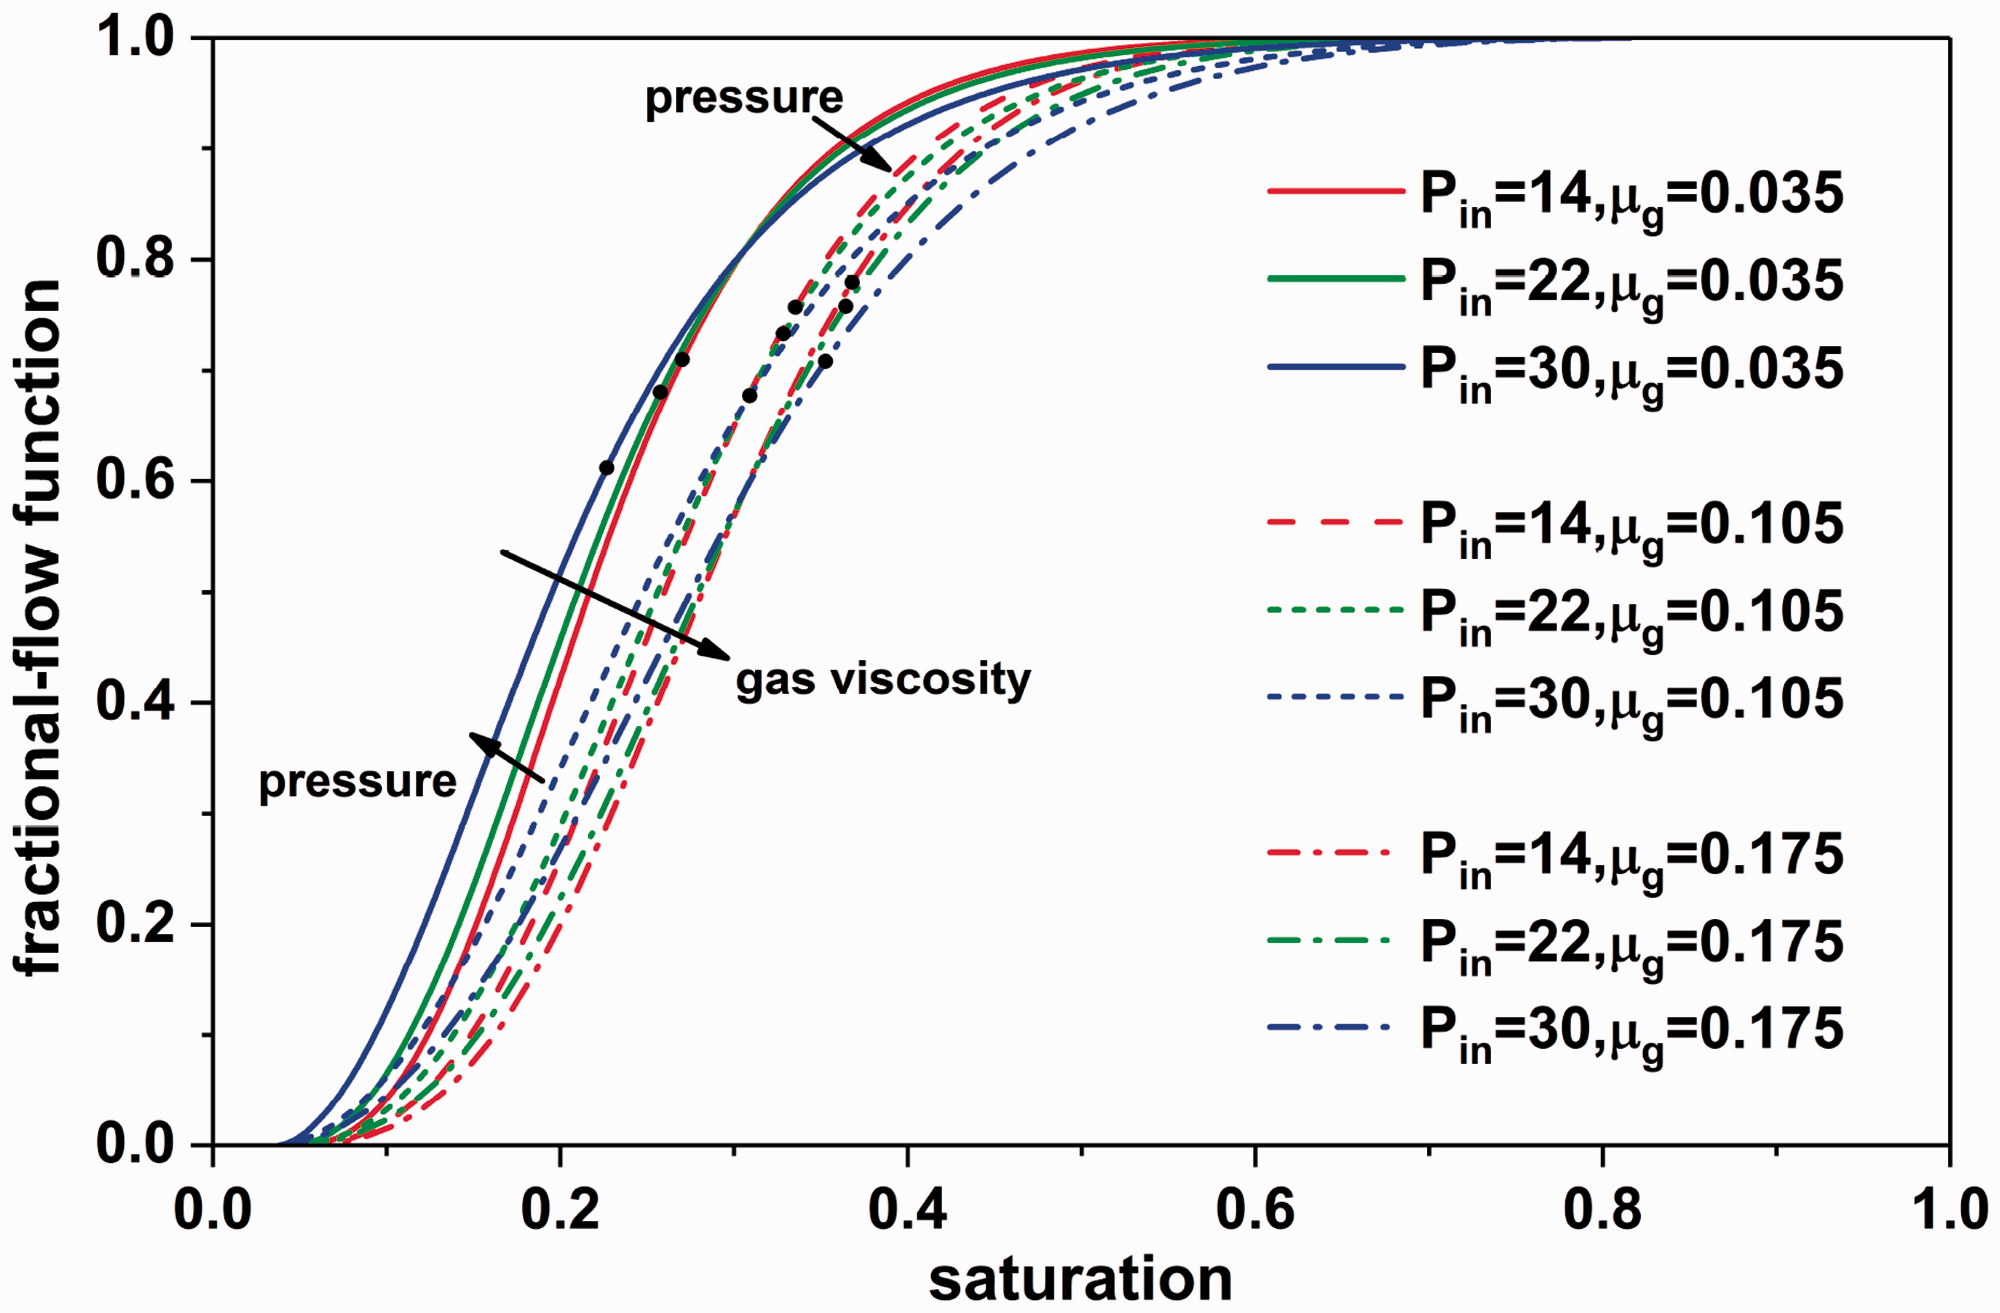
The fractional flow curve with different injection pressure and oil viscosity.
The mobility ratio of oil and gas is not affected by permeability, but the mobility does. Thus, the effect of viscosity, pressure, and permeability on the process of gas flooding from the aspects of saturation and pressure profiles and the breakthrough time will be discussed in detail.
Effect of permeability
Since the derivation of the classical Buckley-Leverett theory is based on the assumption of constant volumetric flux, the permeability has no effect on the front advance velocity. However, the situation is quite different in the case of constant pressure displacement at both ends. To study the effect of the permeability, the permeability is set from 20 to 120, while other parameters keep constant.
The total volume flux for different permeabilities is shown in Figure 17. With the increase of the permeability, the total flux increases correspondingly and this increase is more obvious over time. The increase of the permeability results in the improvement of the mobility, which makes the fluids flow more easily. Figure 18 is the saturation profile at 500 h for different permeabilities. As shown in the figure, the advance distance of the displacement front is longer as the permeability increases. The front advance velocity is proportional to the total flux. Therefore, the front advance velocity increases and the advance distance of the front becomes longer varying with permeability. In addition, it can be seen that the front saturation and residual oil saturation are not affected by permeability. Because the average pressure is constant, the miscible state does not change, neither does residual oil saturation. Since the mobility ratio is independent of permeability, the front saturation dominated by the mobility ratio is not affected by permeability. Consequently, the displacement efficiency is same, but the oil production rate is larger for higher permeability. The breakthrough time varying with permeability is shown in Figure 19. With the increase of permeability, the breakthrough time is shortened and the decrease of the breakthrough time becomes slower. Permeability has little effect on the breakthrough time when the permeability increases to a certain extent. In other words, the breakthrough time is more sensitive to the permeability for low or ultra-low permeability reservoirs. From equation (40), it can be observed that the breakthrough time is inversely proportional to permeability. The effect of the permeability has its two sides: in a reservoir with higher permeability, the fluids are easier to flow and the oil production is higher; the other side is that the breakthrough time will be shortened. Once the gas channeling is formed, the oil production rate will decline sharply and the gas–oil ratio will experience a rapid rise.
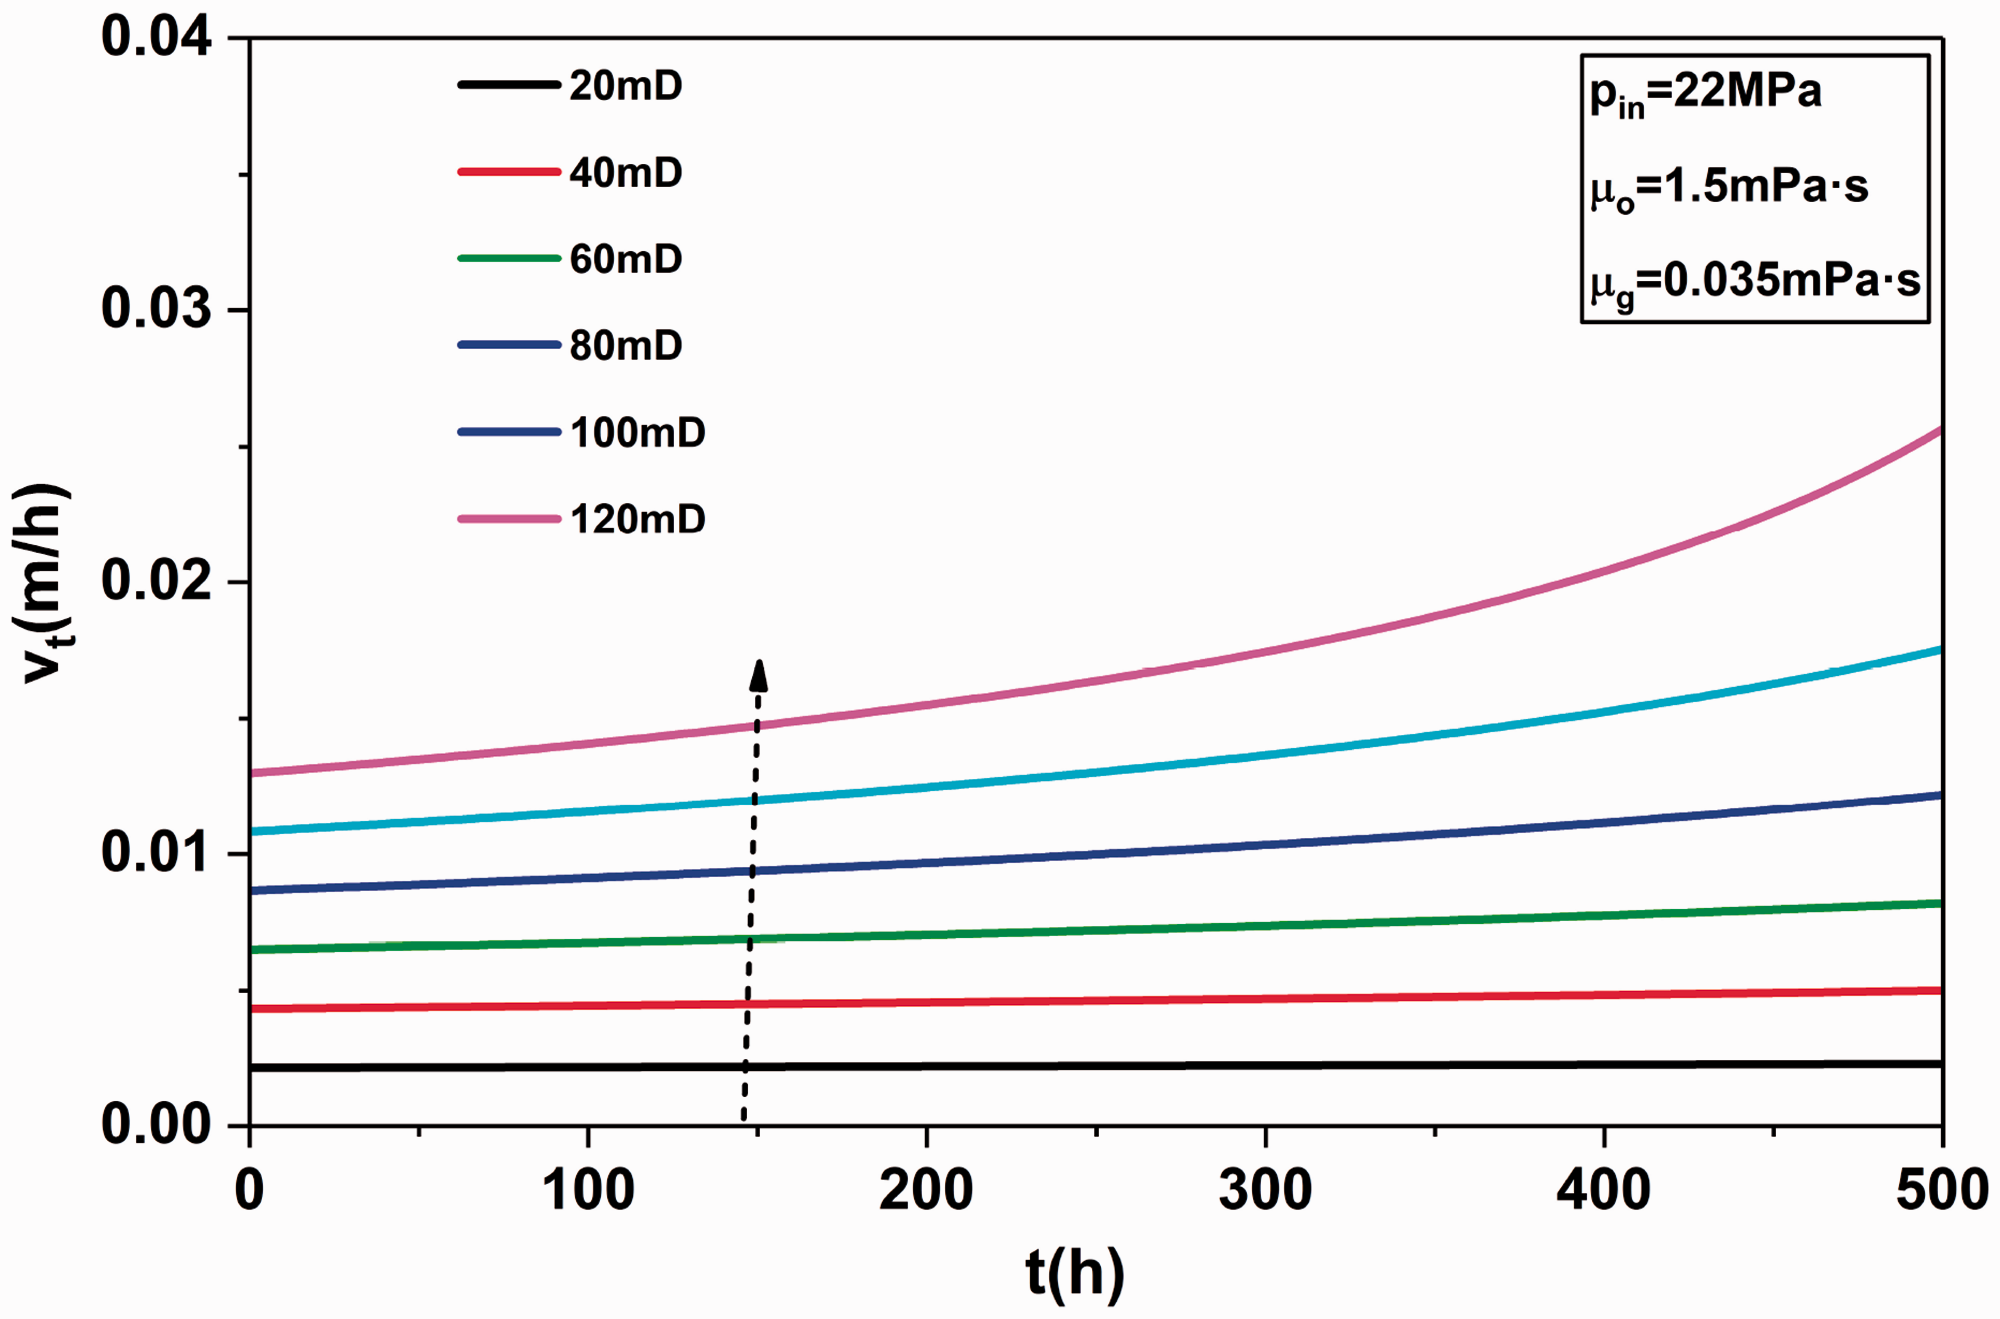
Total volumetric flux varying with time for different permeability.
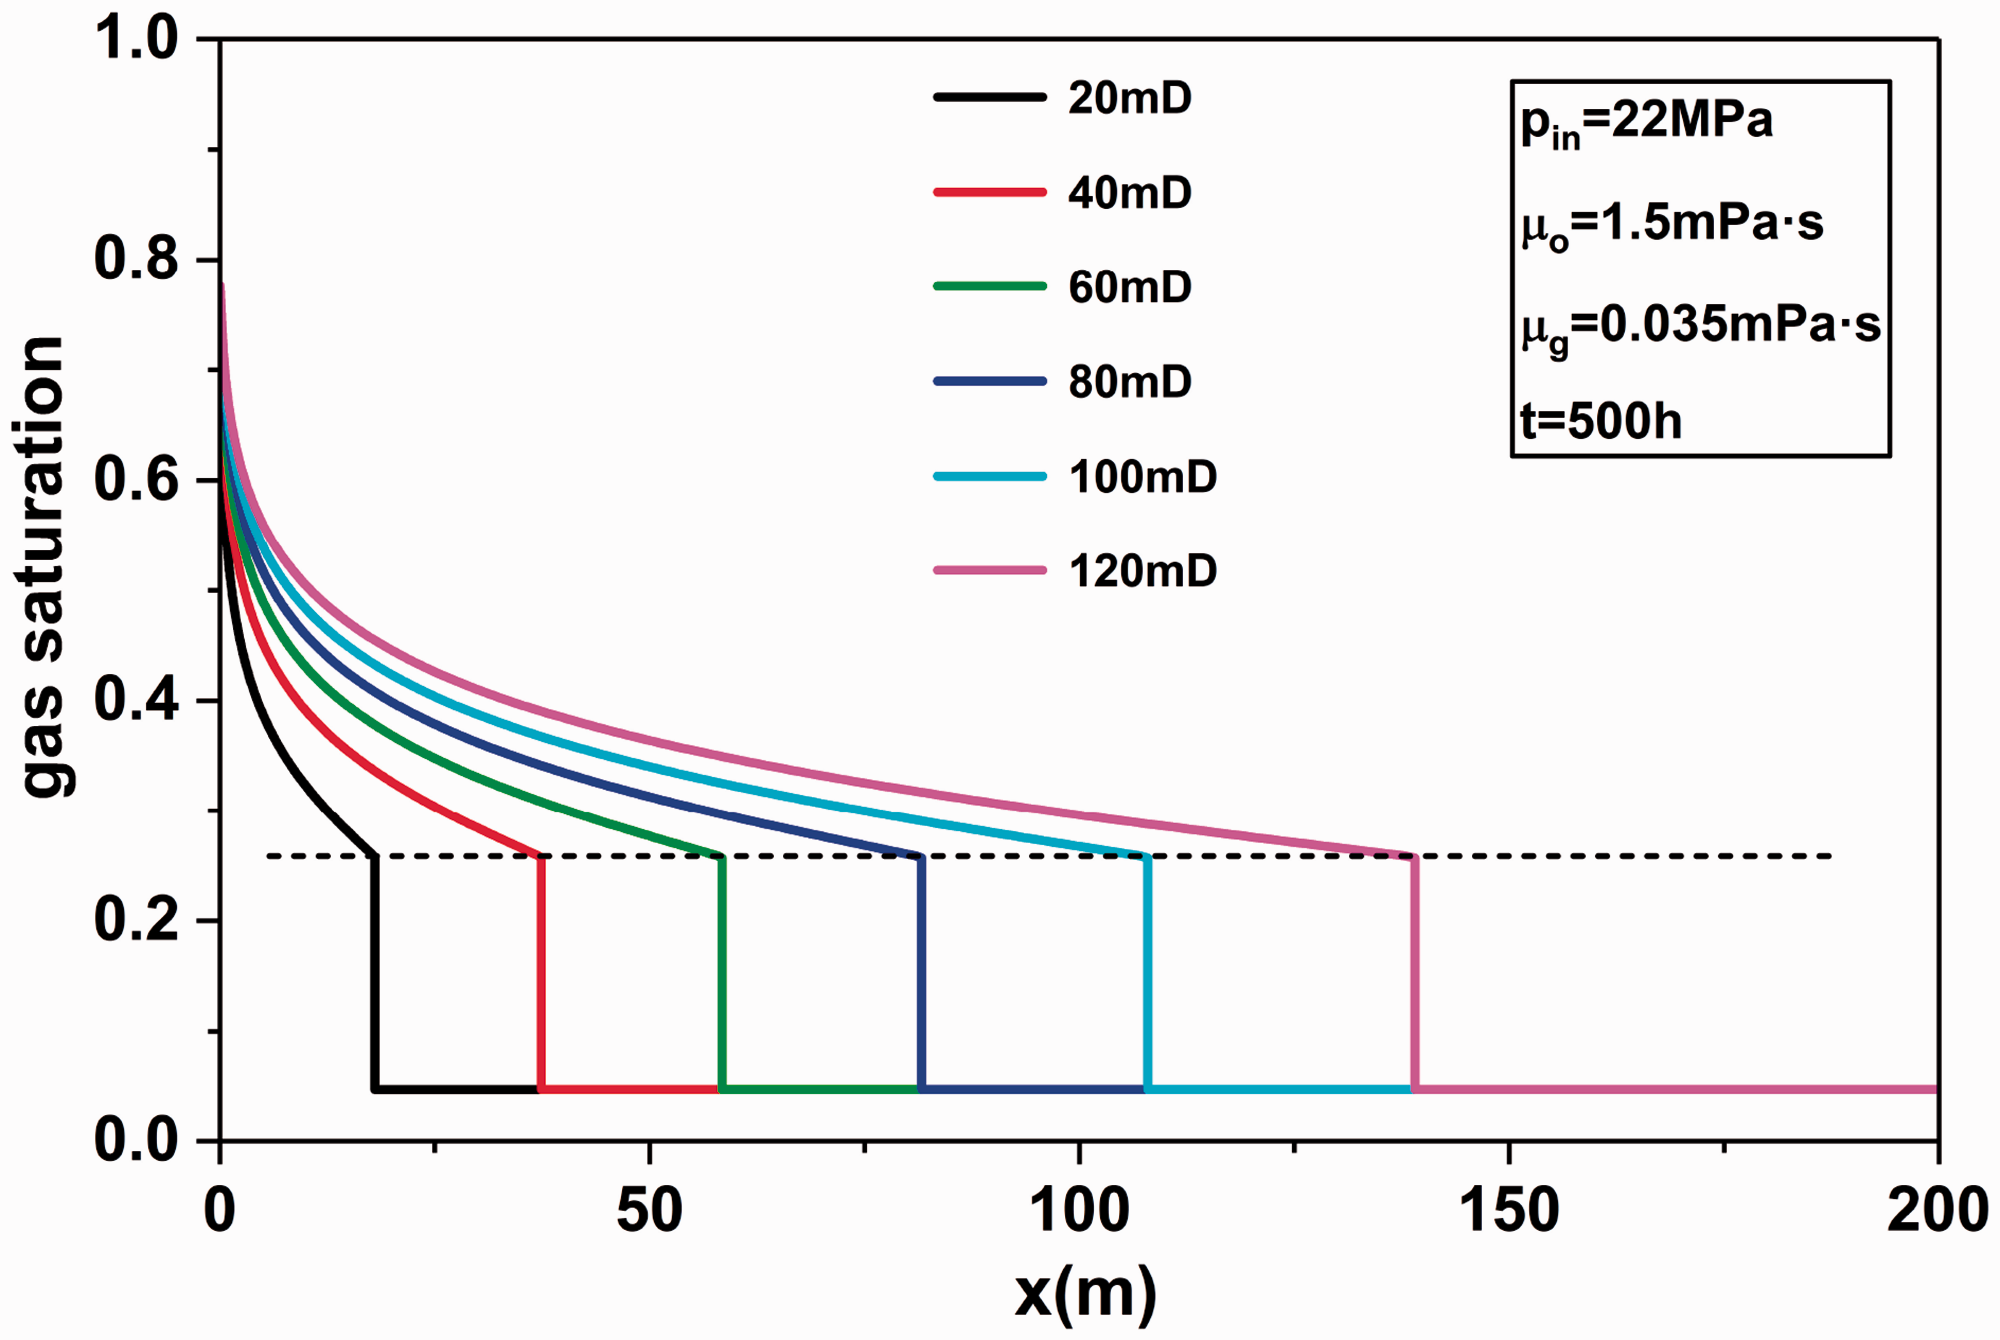
Saturation profile at 500 h for different permeability.
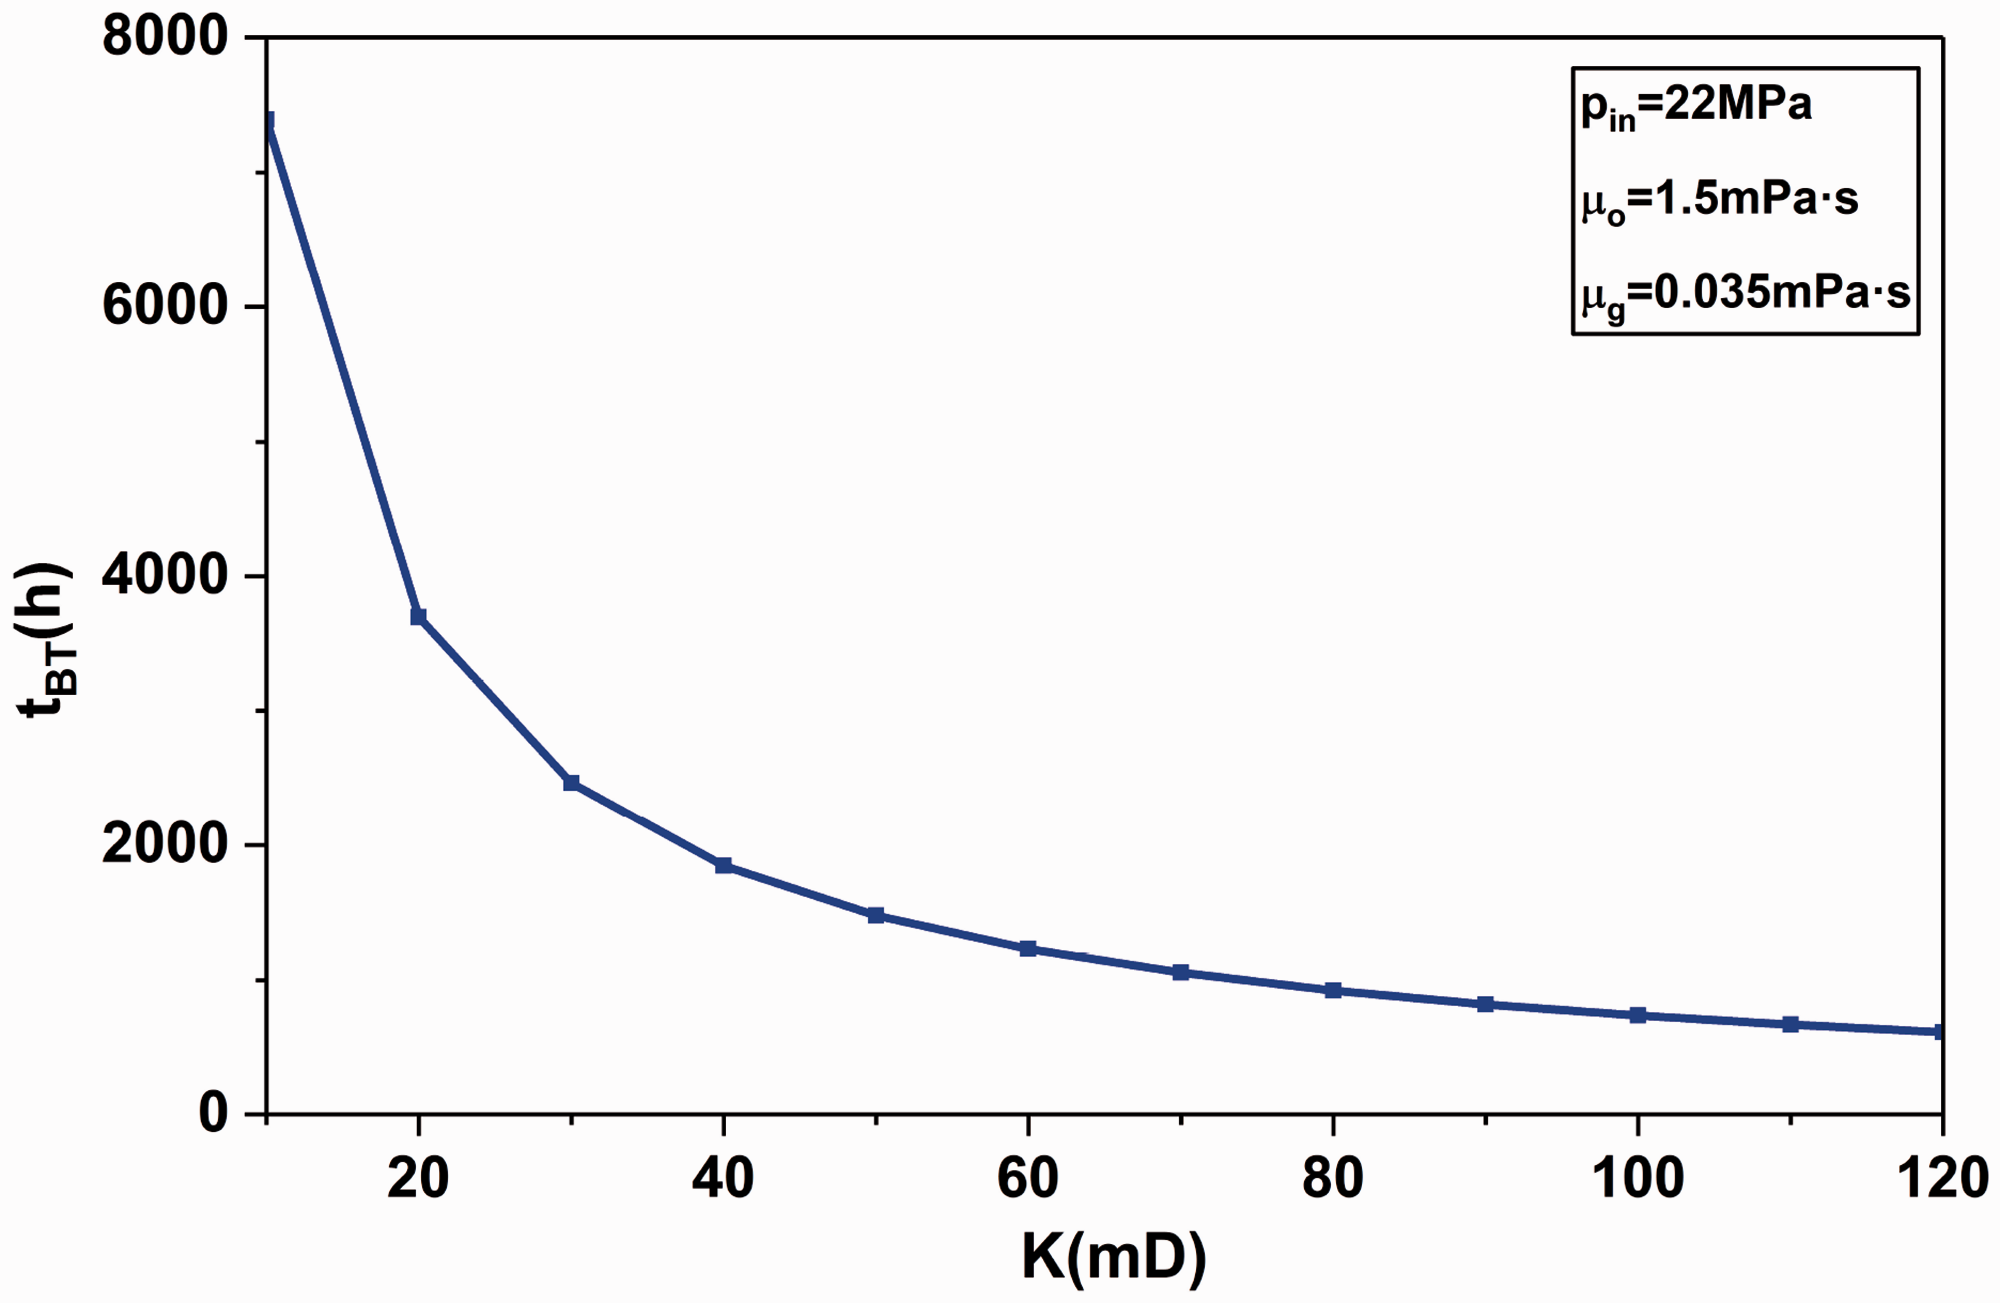
Breakthrough time for different permeability.
Effect of viscosity
The major challenges of the gas injection are the early breakthrough and the low sweep efficiency. Unfavorable mobility ratio resulted from the low viscosity of the injected gas in the reservoir condition is one of the core reasons. The gas viscosity is set from 0.035 to 0.21 to study its influence on the gas injection process.
The total volumetric flux varying with time for different viscosities is shown in Figure 20. With the increase of the gas viscosity, the total flux decreases. The less viscous gas has a greater mobility. At the early stage of gas injection, the flow of oil is dominated in the porous media. As a result, the variation of gas viscosity has little impact on the total flux. As the gas is continuously injected into the porous media, the gas begins to flow. With gas viscosity increases, the total volumetric flux decreases gradually. The longer the time, the more pronounced the effect. Figure 21 is the saturation profile at 3500 h for different gas viscosities. The effect of the gas viscosity on the saturation profile is reflected in two aspects. With the increase of the gas viscosity, on the one hand, the advance distance becomes shorter; on the other hand, the front saturation increases. As mentioned above, the decrease of mobility ratio leads to the change of the shape of fractional flow curve and the increase of the front saturation. The increase of the front saturation and the decrease of the advance distance lead to lower microscopic displacement efficiency of gas flooding. Nevertheless, the effect on the breakthrough time is quite different. The breakthrough time is longer with the increase of gas viscosity, as shown in Figure 22. The more viscous gas reduces the severity of the viscous fingering, prolongs the breakthrough time and improves the macroscopic displacement efficiency. Compared with the effect on the microscopic displacement efficiency, the improvement on the sweep efficiency is paid more attention. Hence, some researchers are engaging in increasing the viscosity of the injected gas by chemical additives.
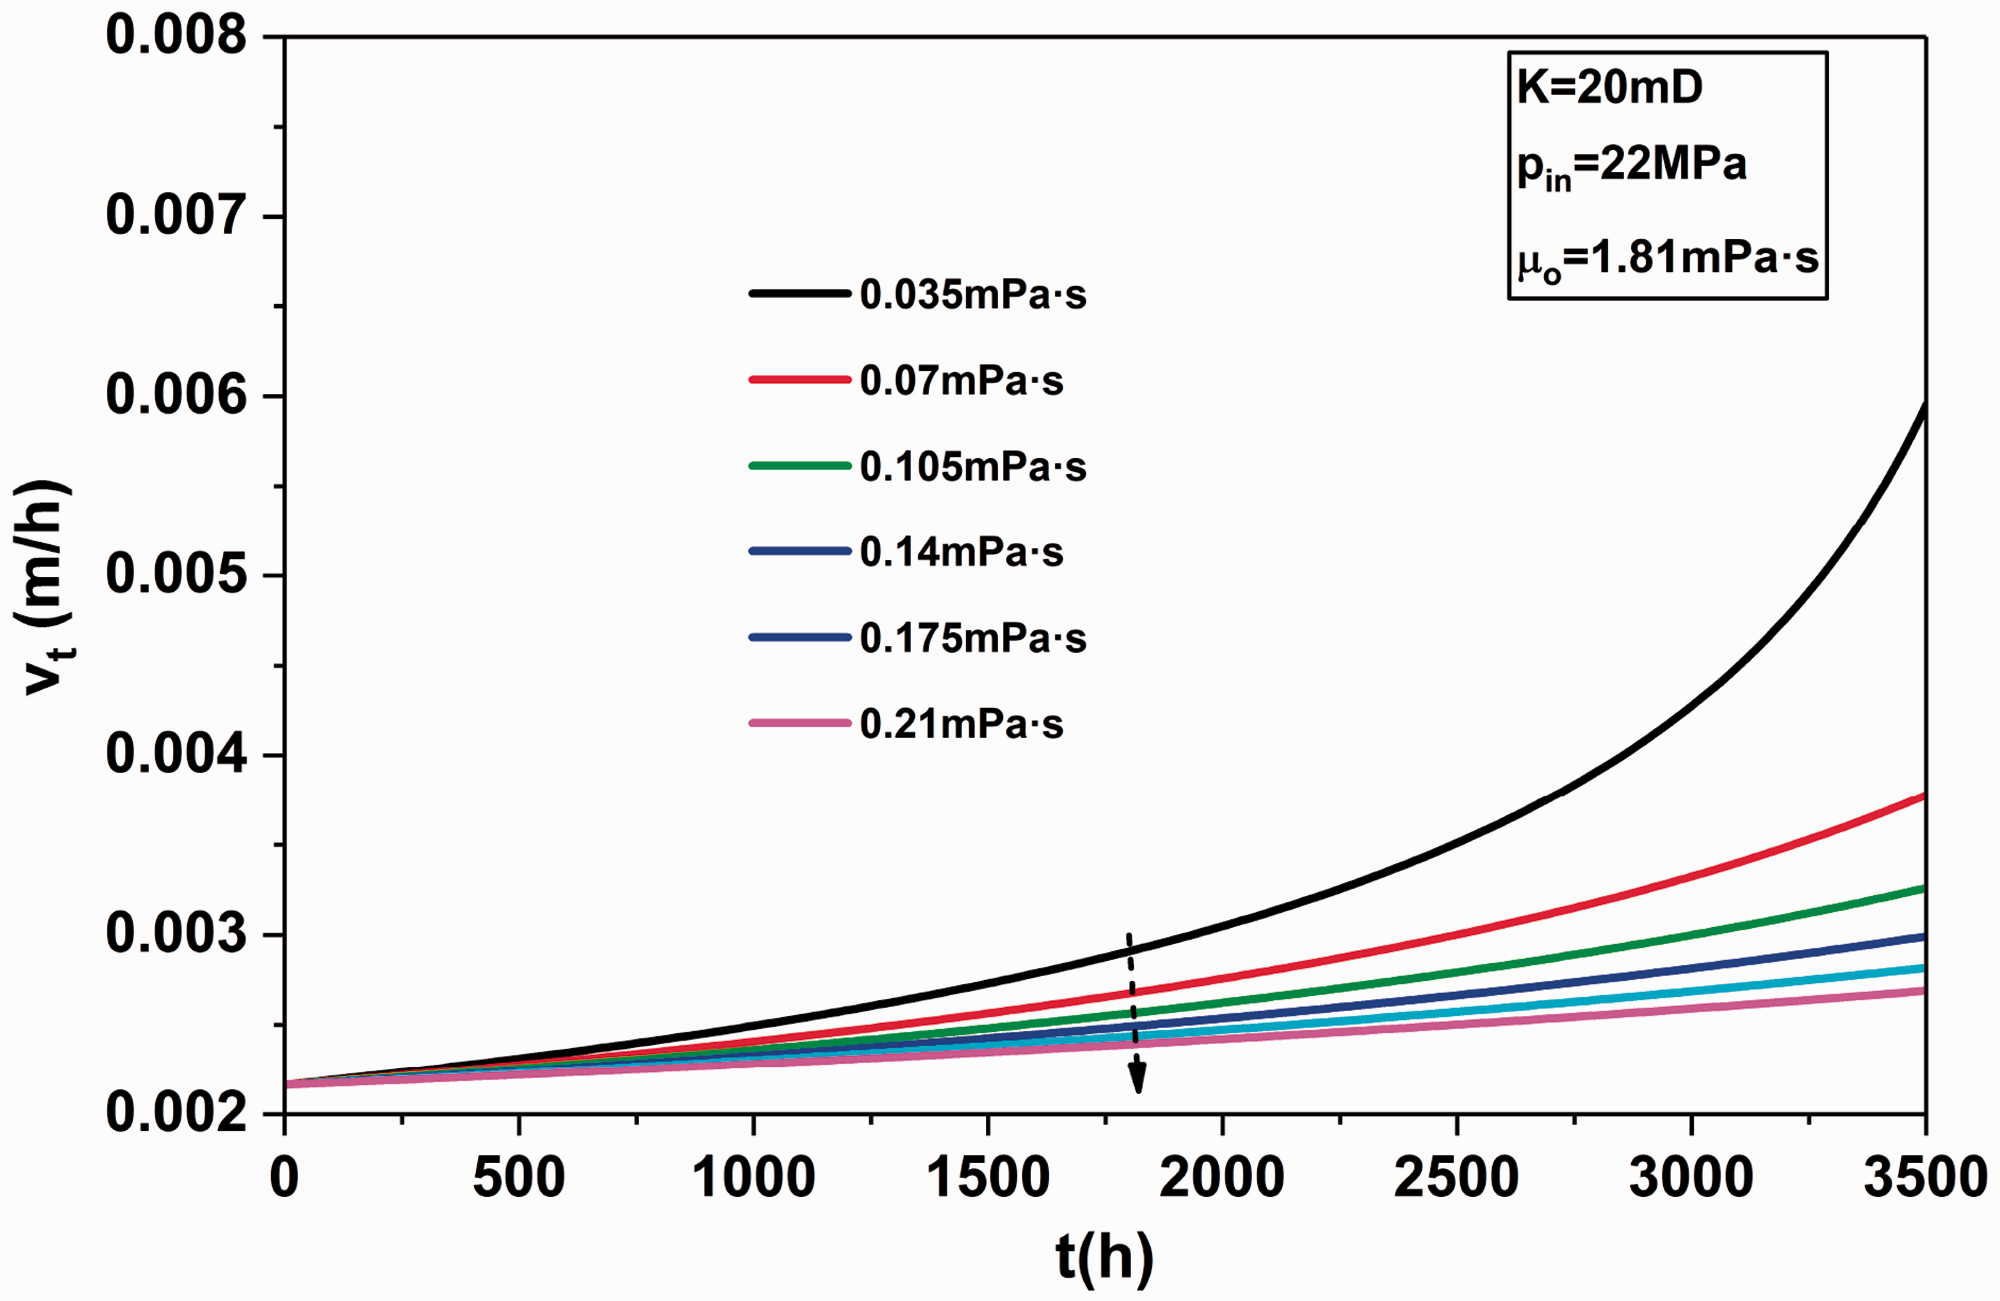
Total volumetric flux varying with time for different viscosity.
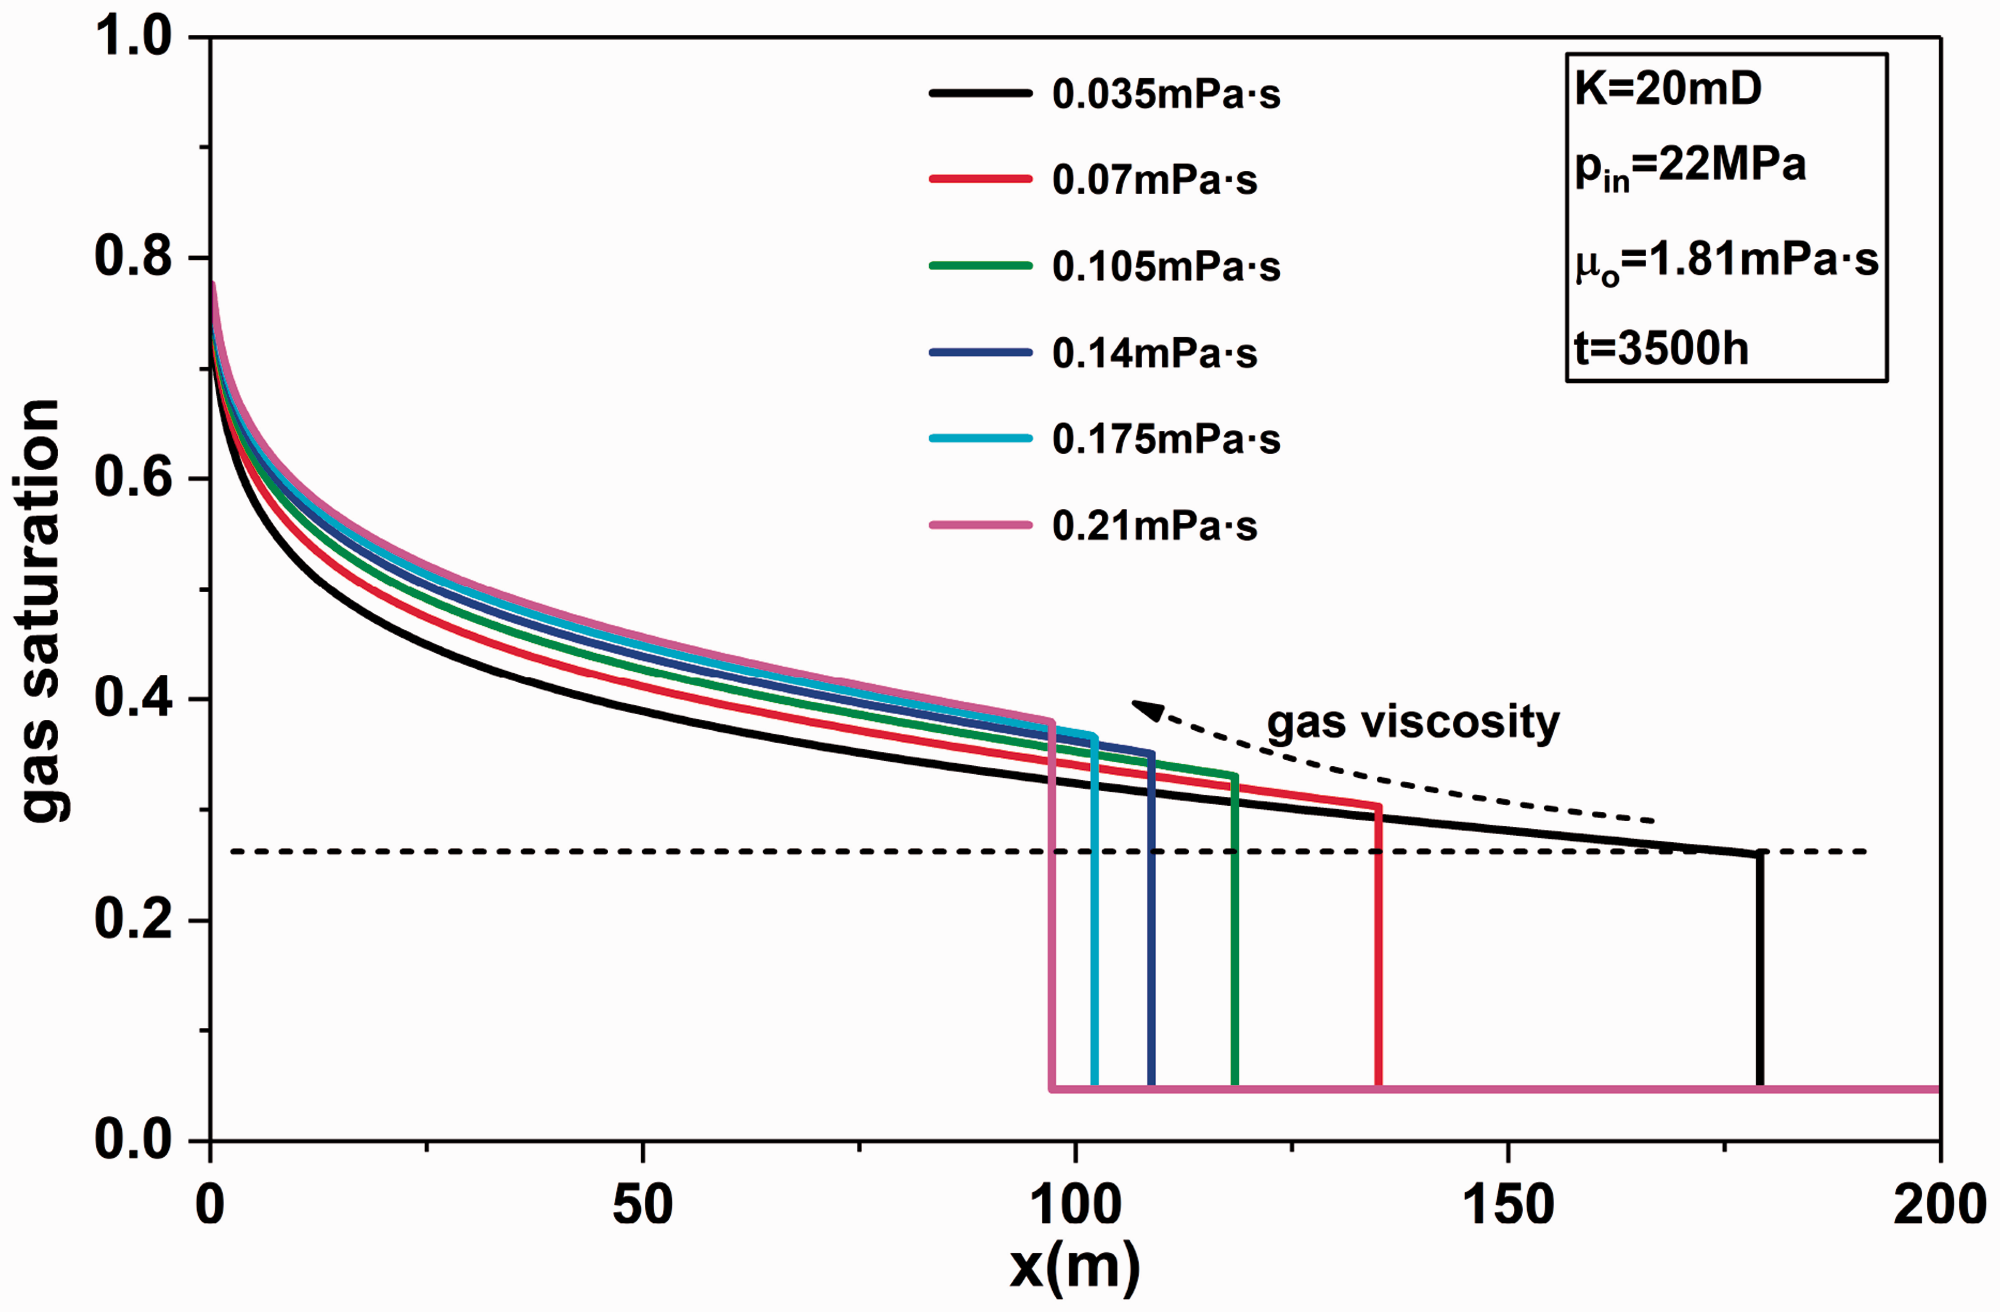
Saturation profile at 3500 h for different viscosity.
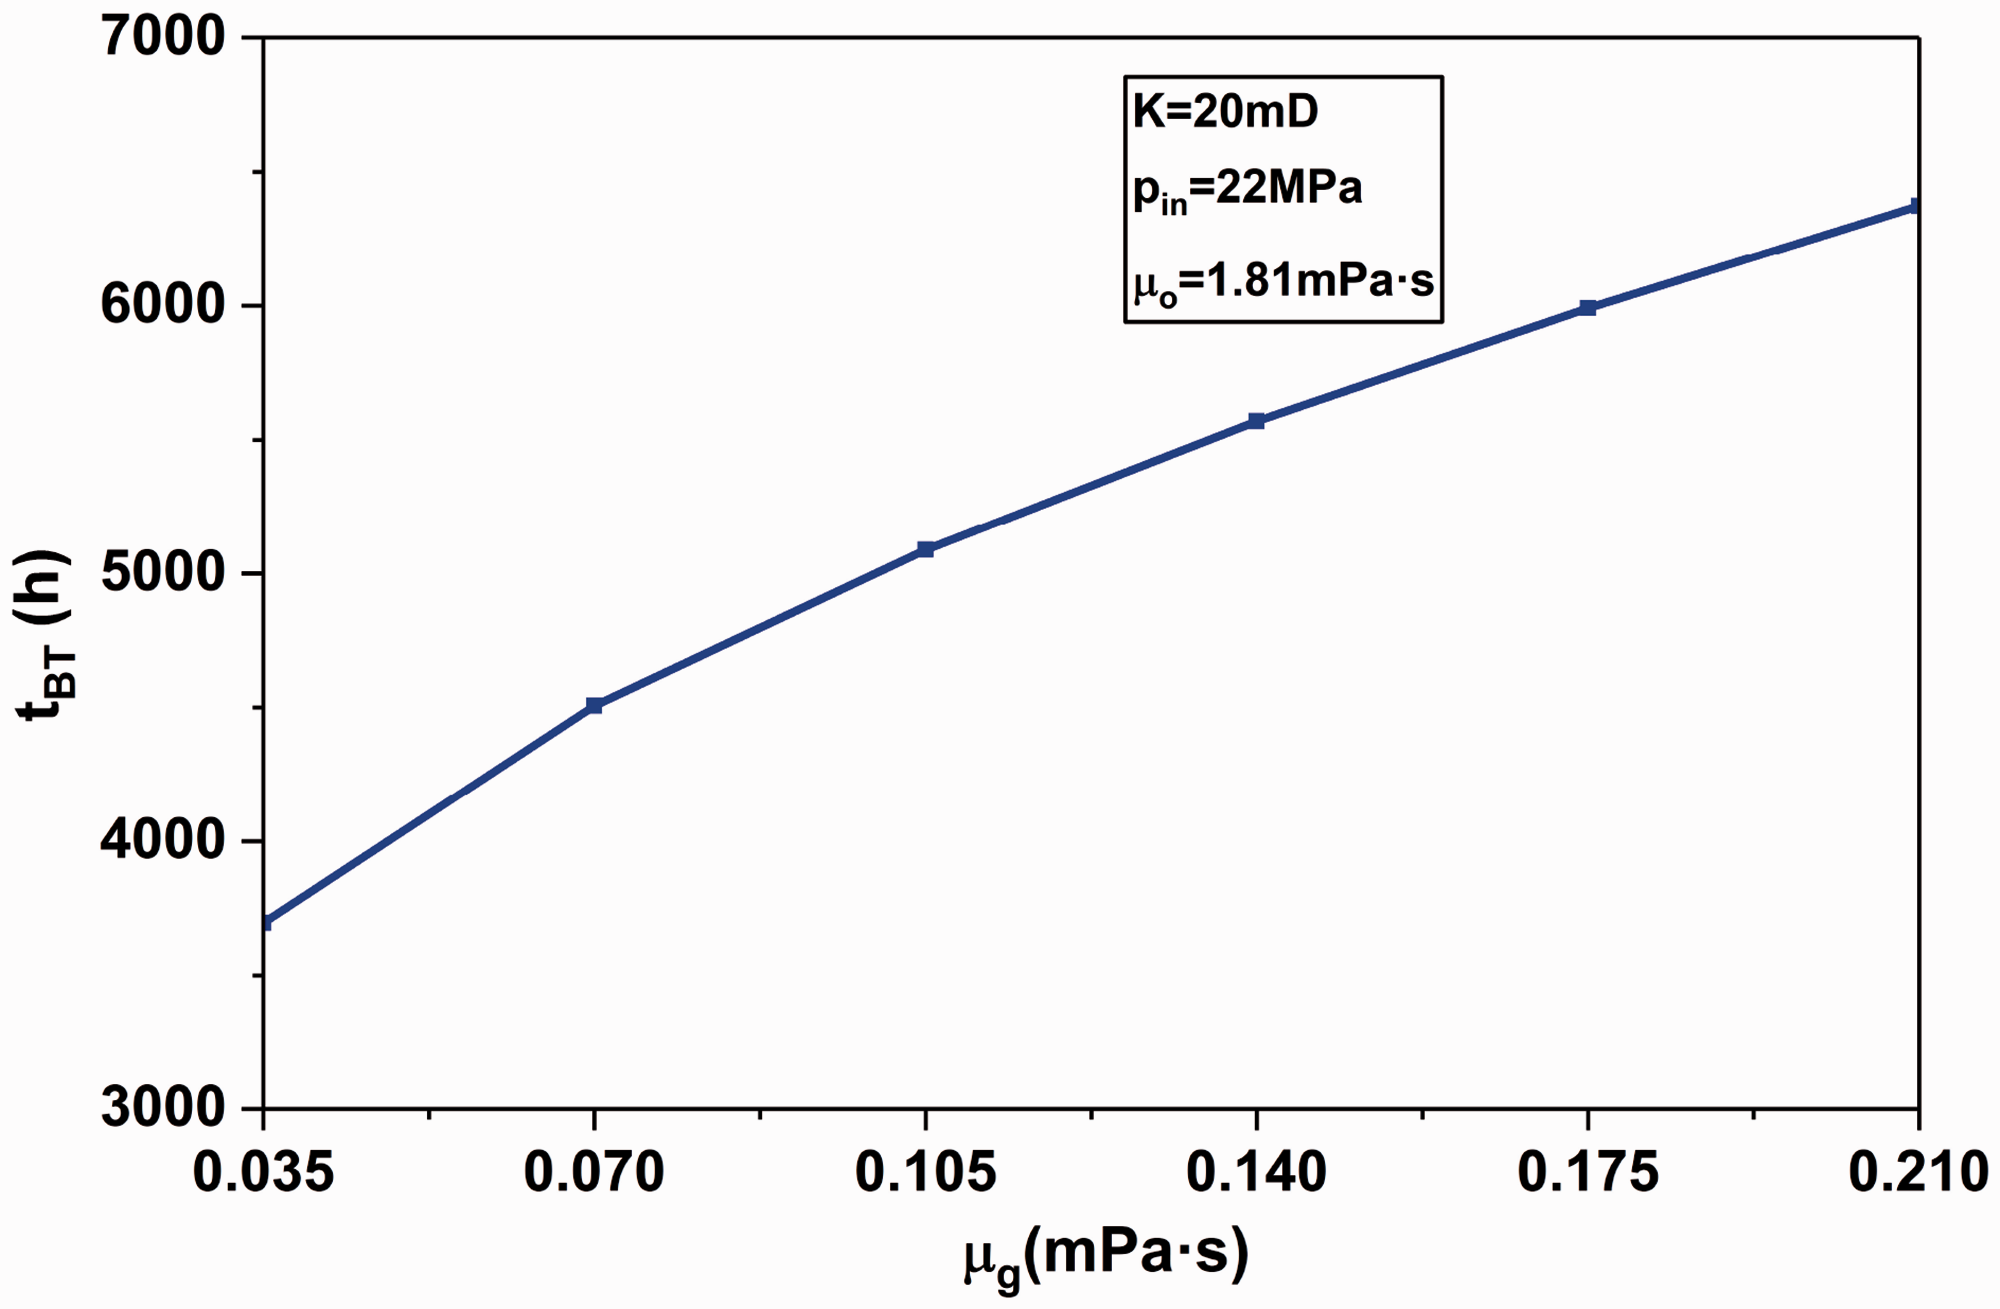
Breakthrough time for different viscosity.
Effect of pressure
During gas injection, the injection pressure is a very important parameter affecting the production performance. A higher pressure maintenance can change the miscibility of oil and gas, and improve the oil displacement efficiency substantially. The injection pressure is set from 14 to 30 to study its effect.
The total flux for different injection pressure is shown in Figure 23. With the increase of the pressure, the flux increases correspondingly. Other conditions being equal, higher injection pressure means greater pressure difference and higher injection rate, which result in the increase of the total flux. Figure 24 is the saturation profile at 2000 h for different pressure. The effect of the pressure on the saturation profile is profound. On the one hand, the residual oil saturation decreases with the increase of pressure, resulting in higher microscopic displacement efficiency. On the other, the front saturation decreases varying with the pressure. Moreover, the advance distance of the front is longer with higher injection pressure. When the pressure is increased to or near the MMP, miscible or near-miscible status is achieved, where the microscopic displacement efficiency is very high. The breakthrough time varying with pressure is shown in Figure 25. With the increase of the injection pressure, the breakthrough time is shortened and the decrease of the breakthrough time becomes slower. Considering the remarkable oil recovery, a higher pressure is preferable. The upper limit of the injection pressure is the maximum pressure that the equipment can provide or the fractured pressure of the formation.
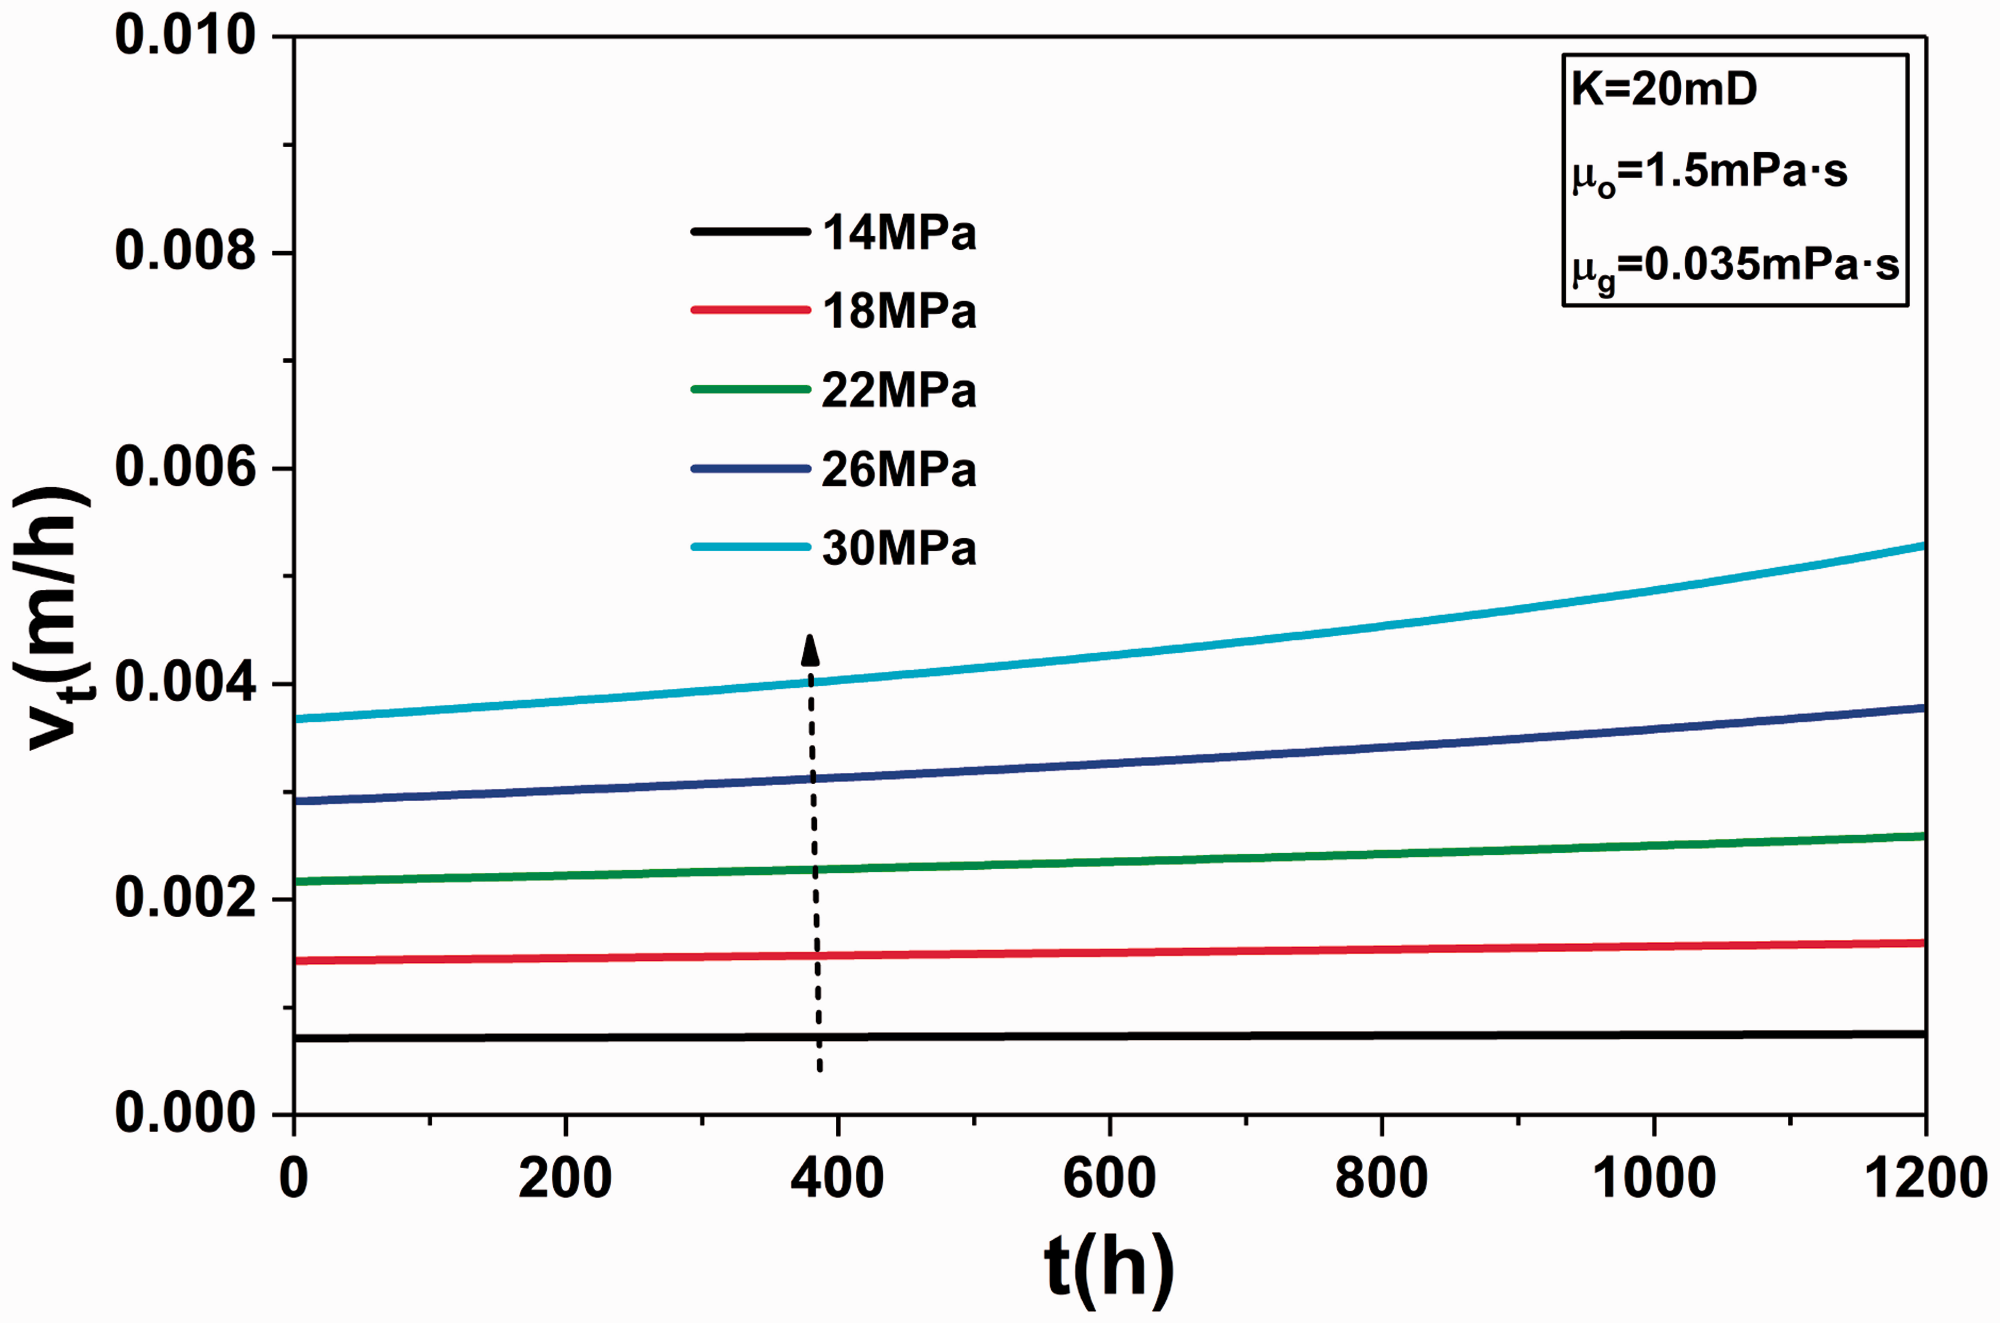
Total volumetric flux varying with time for different pressure.
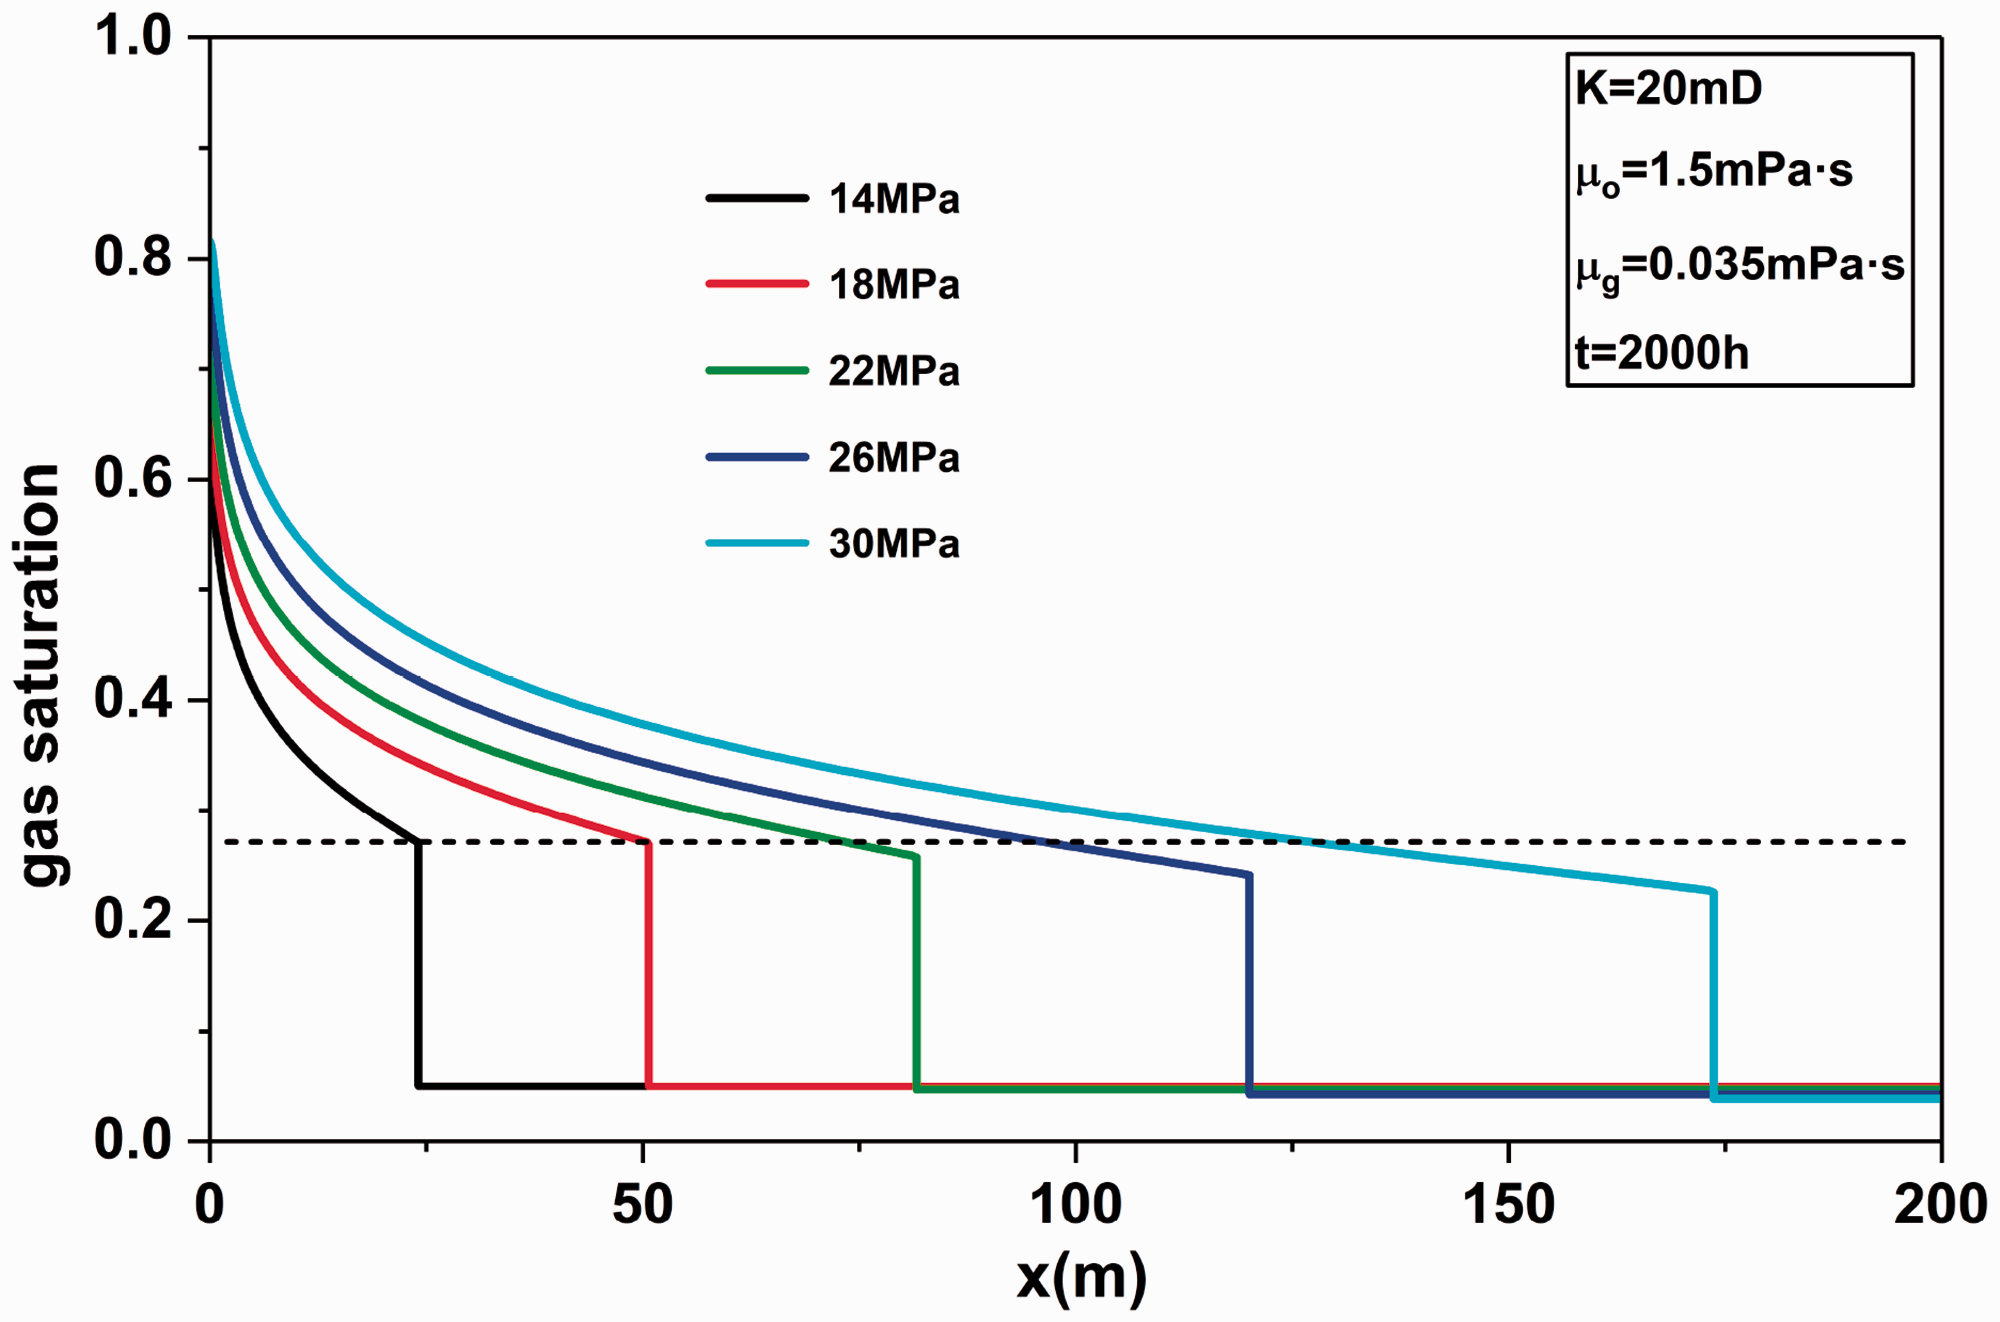
Saturation profile at 2000 h for different pressure.
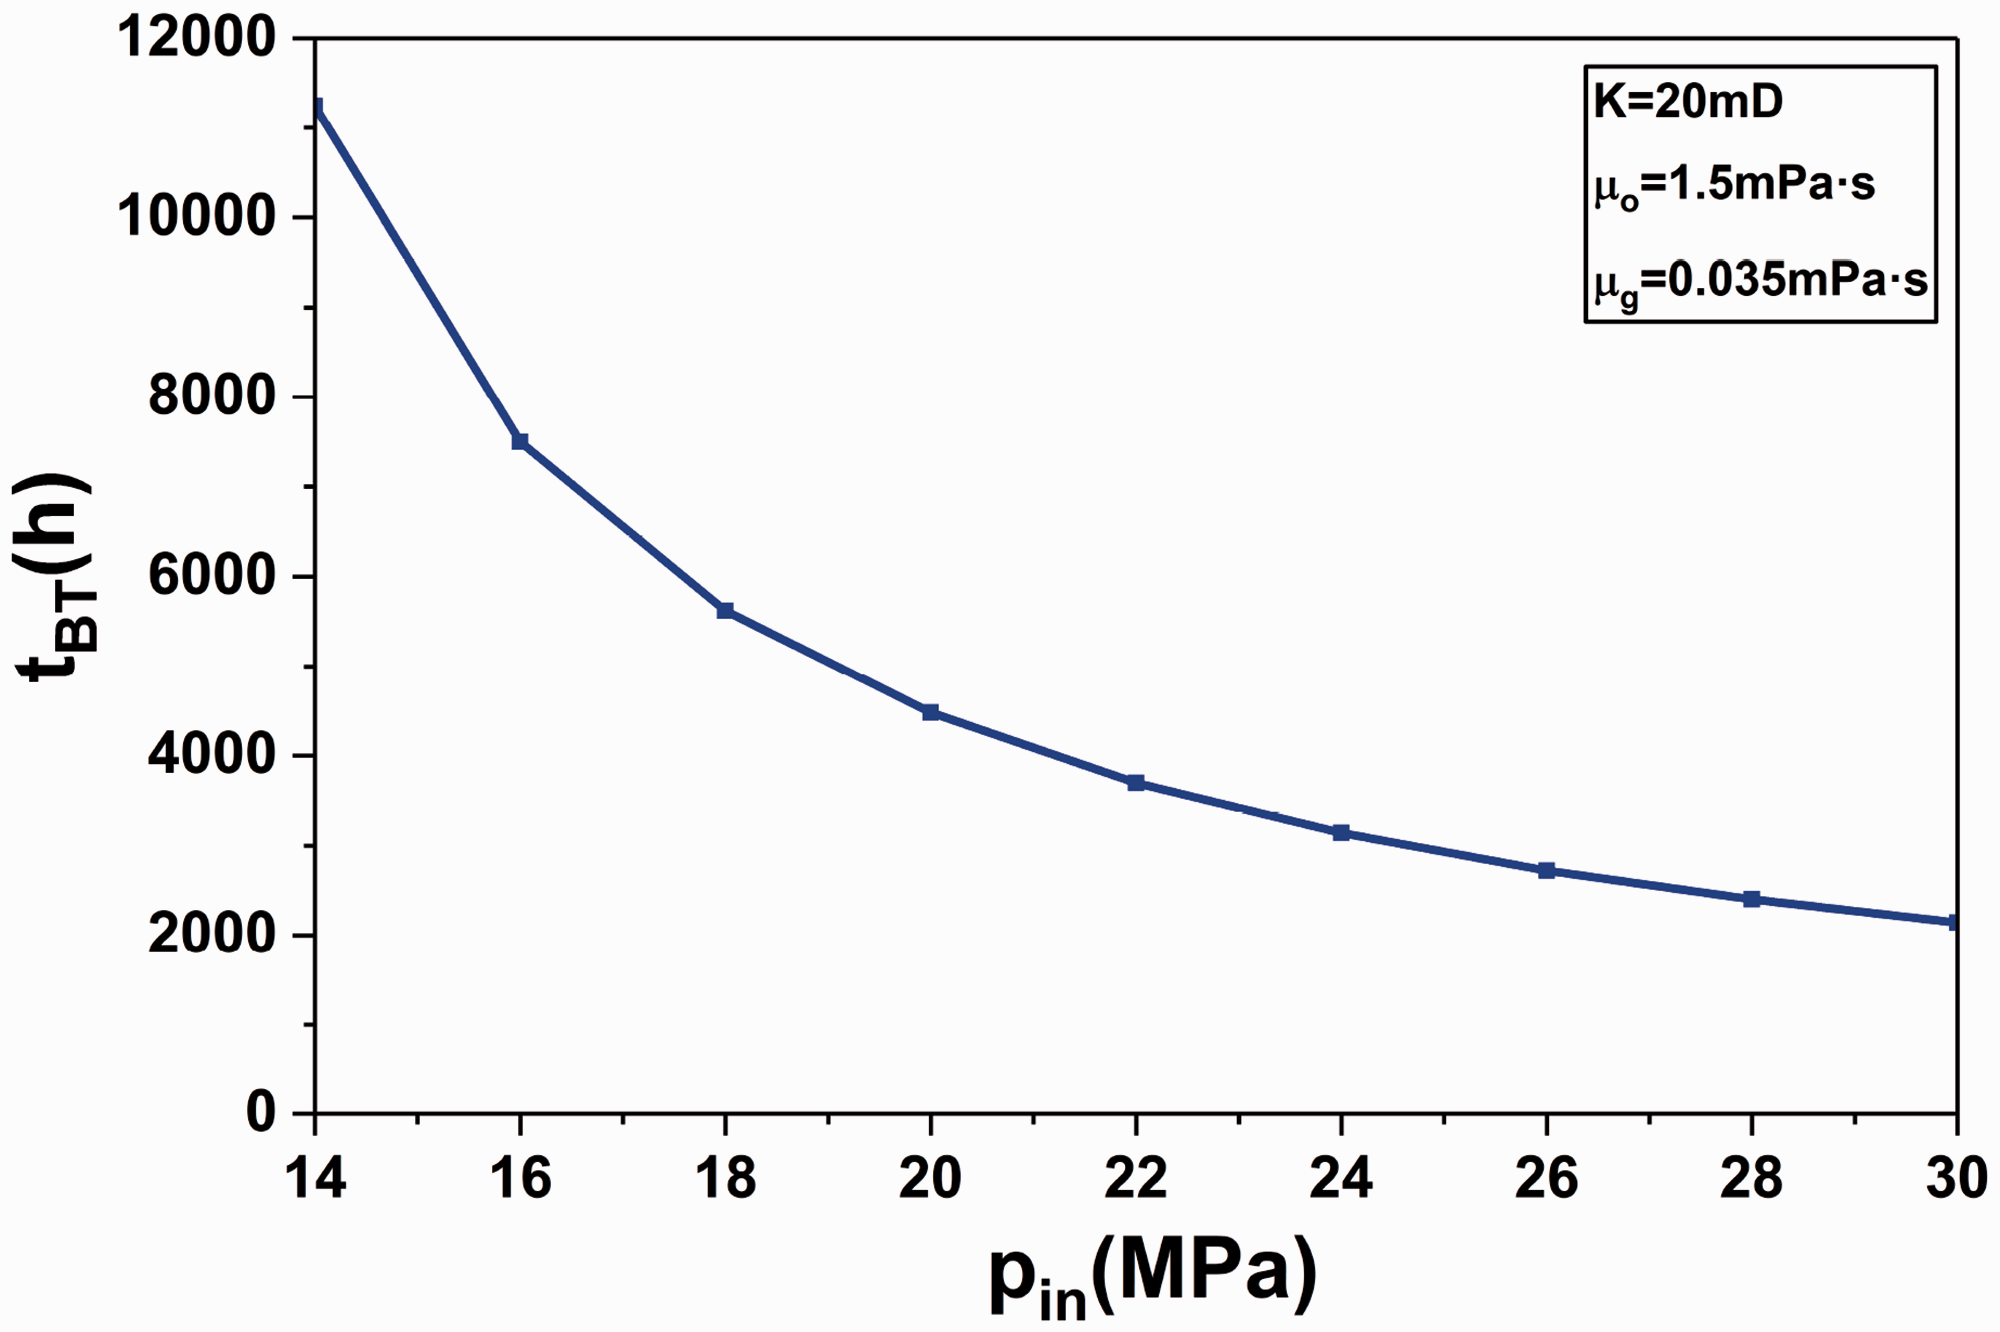
Breakthrough time for different pressure.
Summary and conclusions
This paper presents an analytical solution for gas flooding with constant-pressure boundary including the effect of miscibility by the relative permeability model and the viscosity model. From the analytical solution, saturation and pressure profiles, the total volumetric flux and the breakthrough time are determined. In order to verify the theory, the analytical solution is compared with numerical solution. Through the analytical solution, the effect of the properties of porous media and fluids on the performance of gas flooding is analyzed. Some insights can be obtained:
It is revealed that the analytic solution is in reasonable agreement with numerical solution, apart from the slightly deviation of numerical result at the shock front, which can be improved by refining the grid spacing. The analytical solution is used to obtain some insight into the effect of the properties of porous media and fluids on the performance of gas flooding. The main effect of permeability is the front advance velocity since the total flux is increasing with the increase of permeability. In addition, the breakthrough time is shortened with the increase of permeability. Gas viscosity has an effect on the front saturation and front advance velocity because of variations of gas mobility and mobility ratio with gas viscosity. Moreover, breakthrough time is longer with the increase of gas viscosity. The effect of pressure is complicated. Permeability and gas viscosity have no effect on miscibility, but pressure does. With the pressure increase, there are remarkable reduction in residual oil saturation and improvement of relative permeability, resulting in higher gas saturation and oil displacement efficiency. Furthermore, higher injection pressure accelerates breakthrough of the injected gas.
Through the analyses of the results, the influence of these factors on gas flooding is clarified. This paper introduces the varying properties into the Buckley-Leverett equation and considers the constant-pressure boundaries, which expand the applied scope of the Buckley-Leverett theory. The analytical solution presented in this paper provides guidance on analyzing the distribution of saturation and pressure profiles and predicting the gas production and oil recovery efficiency of oil well. The model is based on the assumption that the fluids is incompressible However, this is not the case in the condition that the average pressure of the reservoir is low. Therefore, the model is suitable for the high pressure condition. Furthermore, it is assumed that the flow is one-dimensional and the vertical flow is neglected. Thus, the effect of gravity override on the breakthrough time is not taken into consideration. Future work will focus on (1) case study to predict the production performance of a real oil reservoir and (2) extension of the work to complex situations like capillary force, gravity, two-dimensional flow, etc.
Footnotes
Acknowledgements
We would like to thank the Science Foundation of China University of Petroleum Beijing for the help. We are grateful to the editor and anonymous reviewers for their insightful and constructive comments for improving the article.
Declaration of conflicting interests
The author(s) declared no potential conflicts of interest with respect to the research, authorship, and/or publication of this article.
Funding
The author(s) disclosed receipt of the following financial support for the research, authorship, and/or publication of this article: This work is supported by National Science and Technology Major Projects (2017ZX05009004-005), and National Natural Science Foundation (U1762210).