
Abstract
Seven steady-state temperature profiles are logged in the Harbin Area, Northeast China. The temperature data illustrate high conductive thermal gradients with a mean value of 4.78°C/100 m. Temperature maps at depths of 1000, 1500, and 1800 m are represented. The present temperature field is cooling southeastward, with the highest thermal gradients being observed at the junction zone between the Central Depression and the Southeast Uplift of the Songliao Basin. The recoverable heat is calculated using a volumetric method and Monte Carlo simulation. The mean value for recoverable heat from the detailed exploration area around the Harbin Area is 1.052 × 10¹⁹ J (3.59 × 10¹¹ t standard coal). Geological controls on the present temperature fields are discussed.
Keywords
Introduction
Harbin, possessing a population of 10.6 million, is the largest city and capital of the Heilongjiang Province, China. As the city is located at a high latitude (N45°), the climate is frigid in Harbin with a long duration of wintertime from November to March and with air temperature averaging −18 to −7°C. Thus, energy consumption is high, especially for house warming purposes during winter. Geothermal energy, being a clean, renewable energy source, has been regarded as one of the candidates for the solution to this severe energy demand, as well as a remedy for air pollution problems due to high coal consumption. The exploitation of geothermal energy in Harbin began in 2011. To the present, 11 geothermal wells have been drilled with typical depths of 1400–2000 m. Harbin and its surrounding area show considerable potential for both conventional hydrothermal and enhanced geothermal system development. Jiang (2017) studied the heat flow pattern and lithospheric thermal structure of Northeast China, including the Songliao Basin. Zhu (2011) analyzed the thermal state of the Songliao Basin and identified the major reservoirs for geothermal resource. Guo and Yang (2011) and Zhang and Liu (2016) recognized the characteristics of the geothermal system in Harbin as the results of exploration for geothermal resources. Nevertheless, the direct measurement of temperature in boreholes together with the study of temperature field in depth is essential for the assessment of geothermal resource and is also reference for selecting drilling sites in the future. Furthermore, the study of temperature field is the prerequisite for the analysis of thermal regime of crust and is useful in prospecting and production of oil and gas.
Geological setting
The study area is within the Songliao Basin (Figure 1(a)), the largest basin in eastern China. The Daqing Oil Field of the Songliao Basin is one of the few large nonmarine oilfields in the world (Xue and Galloway, 1993; Yang, 1985; Yang et al., 1985). The basin is bordered by the Great Xing’an Range in the west, the Lesser Xing’an Range to the north, and the Zhangguangcai Range in the east. The subduction of the Pacific Ocean Plate, usually considered as the leading cause of the tectonic evolution experienced in NE China, led to the formation of the Late Jurassic Halar Basin and the Early Cretaceous Songliao Basin, the extensive emplacement of volcanic rocks, and numerous granitic plutons (Wu et al., 2001), accompanied by mantle upwelling and crustal thinning. The thickness of the crust ranges from 29 to 35 km, and the lithospheric thickness ranges between 60 and 80 km (Ma, 1987; Yang et al., 1997); this is much thinner than that of surrounding areas. All these features suggest that the basin was developed in an extensional tectonic regime. As a result of crustal thinning and mantle upwelling, the Songliao Basin has a relatively high heat flow among sedimentary basins in China, ranging from 44.4 to 95 mW/m2 with an average value of 70.9 ± 14.1 mW/m2 (Jiang, 2017), higher than the global mean continental heat flow (including arcs and continental margins) of 64.7 mW/m2 (Davies, 2013). According to lithospheric thermal structural studies, the anomalous high heat flow in Songliao Basin is primarily mantle sourced (Zhu, 2011).
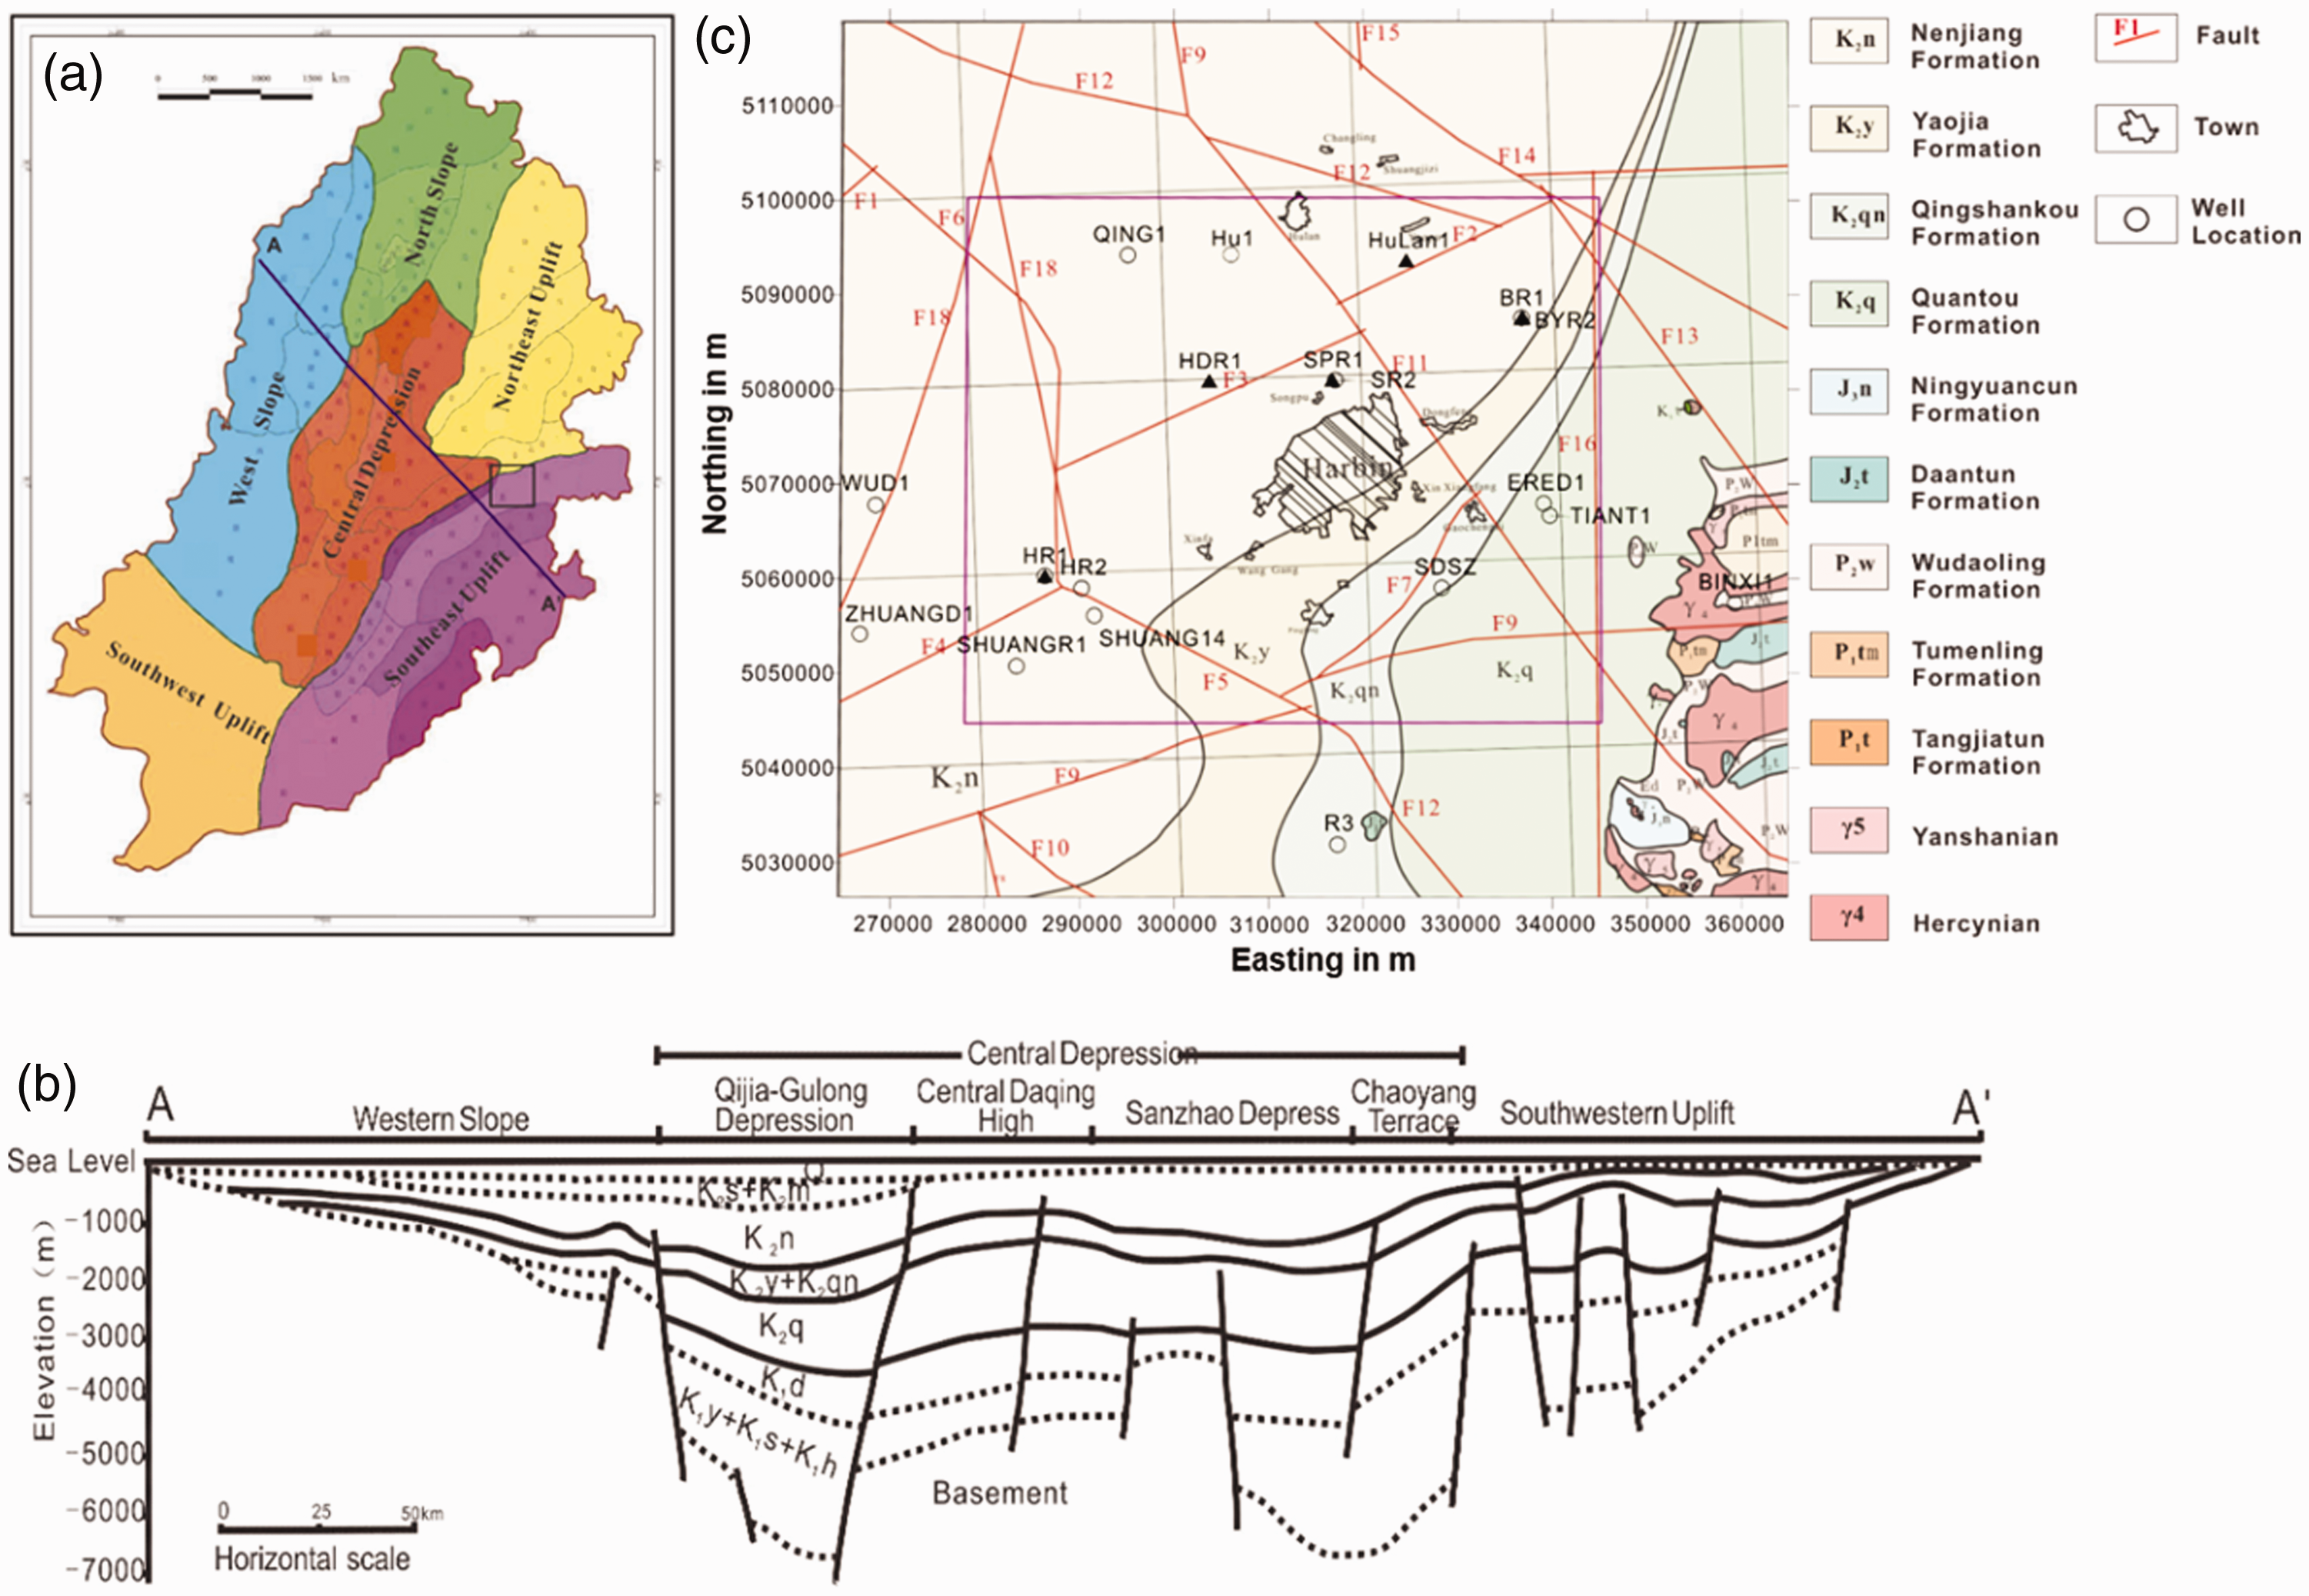
(a) First-order structural units of Songliao Basin and the location of the study area and (b) stratigraphic cross section of AA′, its location is shown in (a). Source: Reproduced with permission from Ryder et al. (2003) and Wang et al. (2016). (c) Regional geological map and well locations; the wells with new steady-state temperature logging are represented by solid triangles, the wells with collected temperature data used in this study are represented by rings. The pink box represents the detailed exploration area for temperature field characterization and geothermal resource assessment in this study. The map is under Beijing 1954 (EPSG:4214) Geodetic Coordinate System.
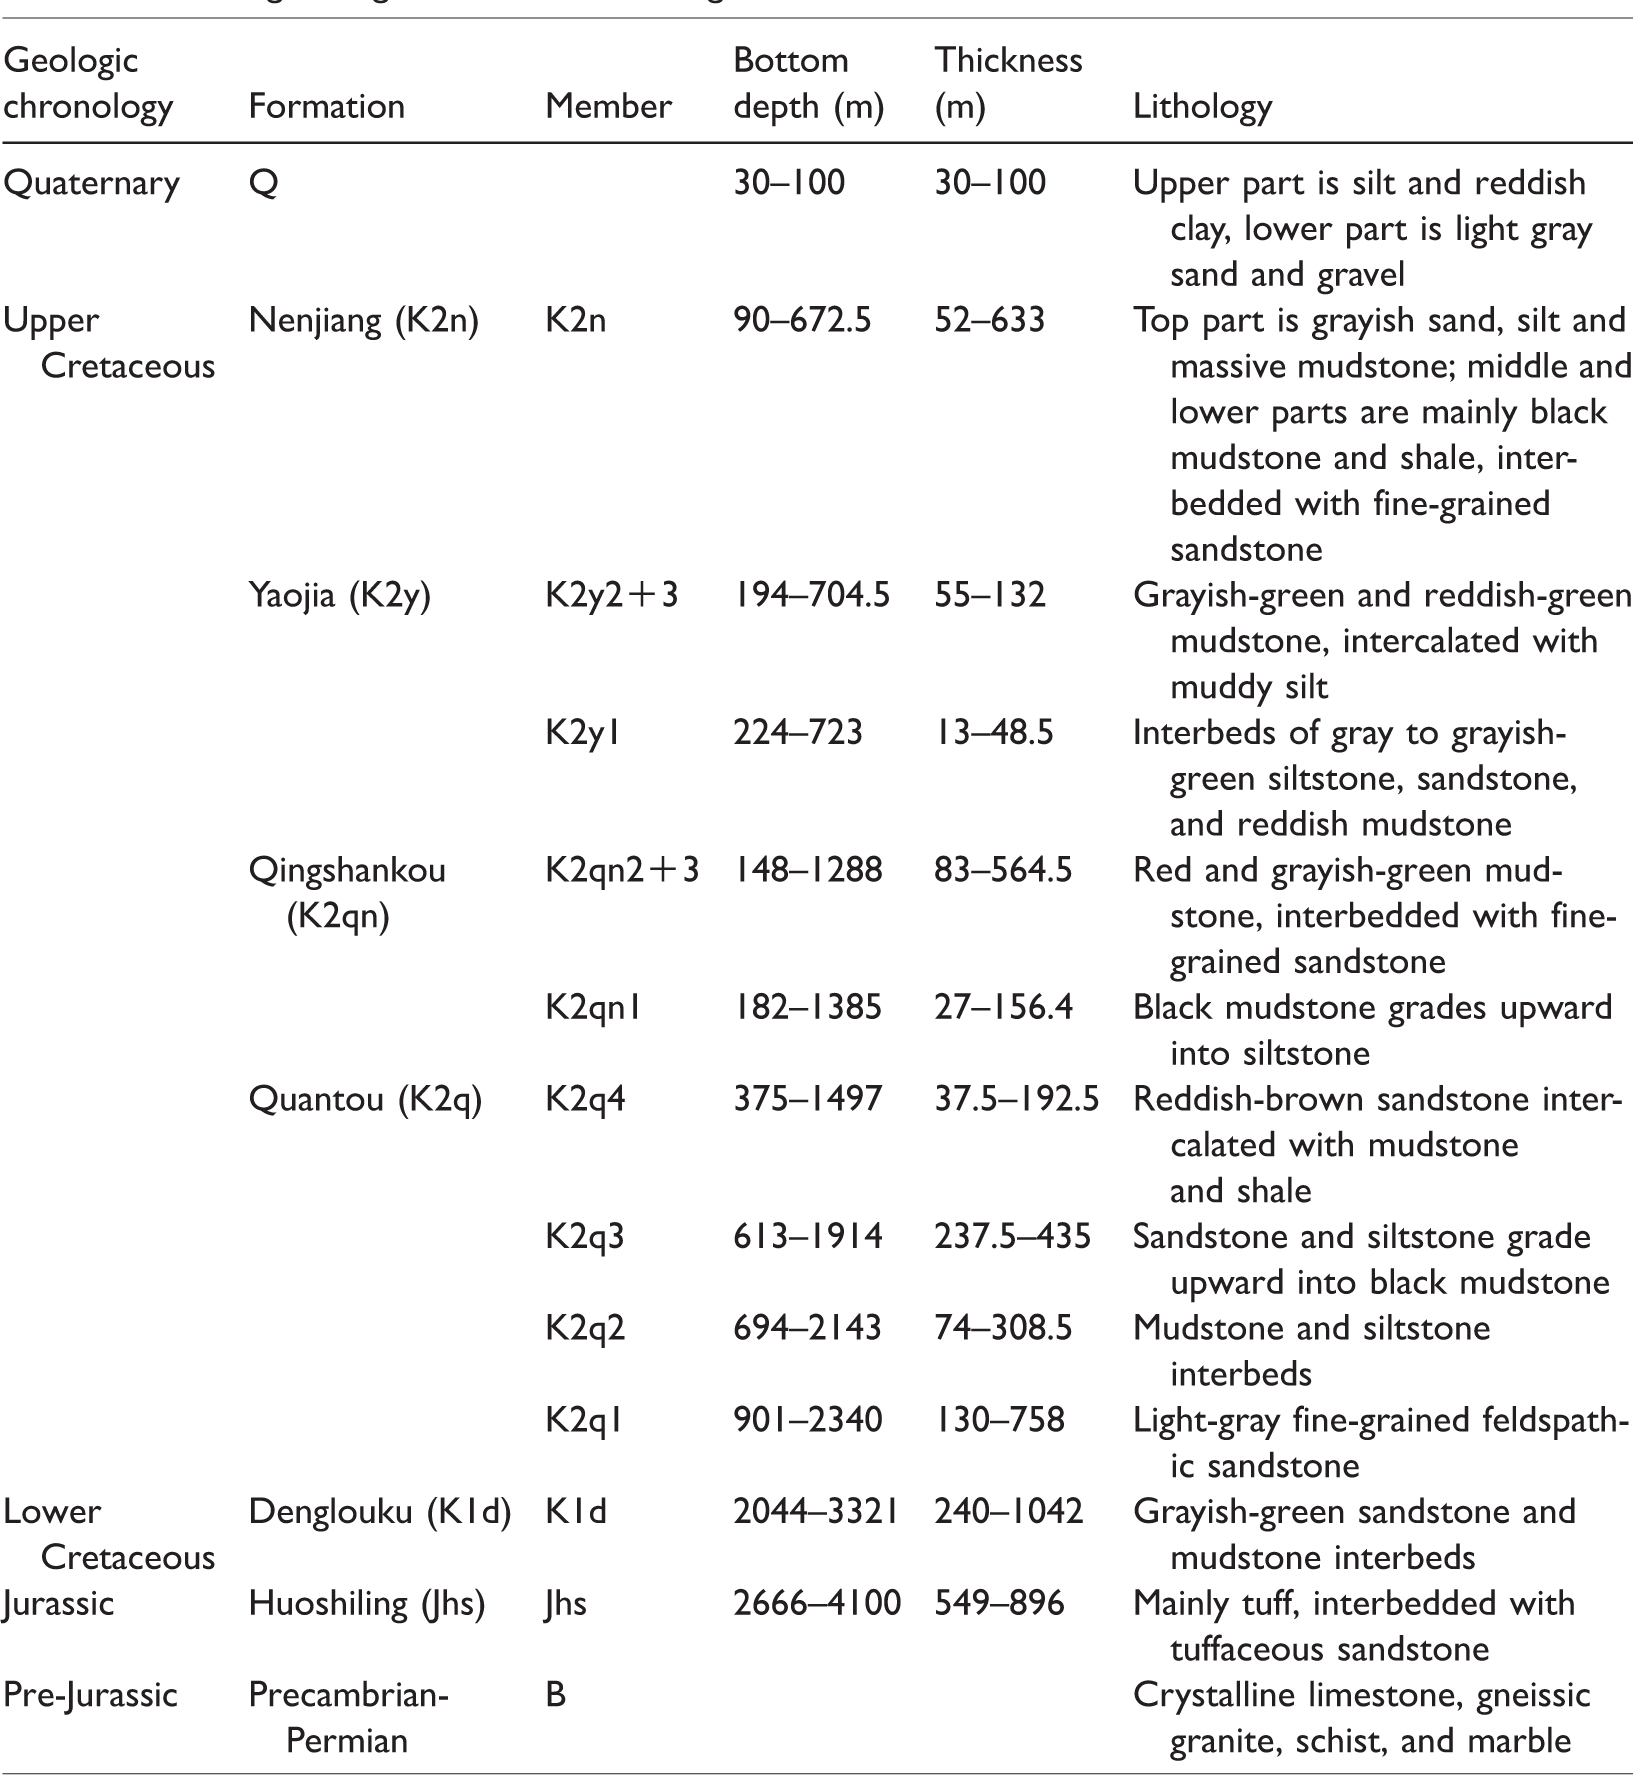
Three stages of basin evolution during the Cretaceous are identified according to regional geological investigations and drilling data analysis: early rifting, middle subsidence, and late inversion. More than 4300 m thickness of sedimentary rocks were deposited during the subsidence stage in the center of the basin (Liu et al., 1996; Xue and Galloway, 1993). The NE- and NNE-directed folds developed in the upper sedimentary rocks are seen as traces of a compressive tectonic regime at the final stage of basin evolution. The sedimentary cover of the Songliao Basin consists of late Jurassic to Neogene fluvial and lacustrine detrital sedimentary rocks. Triassic and Early Jurassic strata are missing throughout the basin, though the Cretaceous strata are widespread. The Lower Cretaceous strata, represented by the Denlouku Formation, unconformably overlie the Upper Jurassic volcanic series, as well as the basement, which is represented by the Denlouku Formation. However, the Denlouku lacustrine sediments cover only a small area. The Middle Cretaceous strata, which consist of the Quantou, Qingshankou, Yaojia, and Nenjiang Formations, were conformably deposited on the top of the Lower Cretaceous (Table 1). These units contain the most prolific source and reservoir rocks for oil and gas production (Lee, 1986). According to a previous study (Zhang and Liu, 2016), among the Middle Cretaceous strata, the third and fourth members of the Quantou Formation are the main targets for geothermal exploration.
Lithological log in Harbin Area, Songliao Basin.
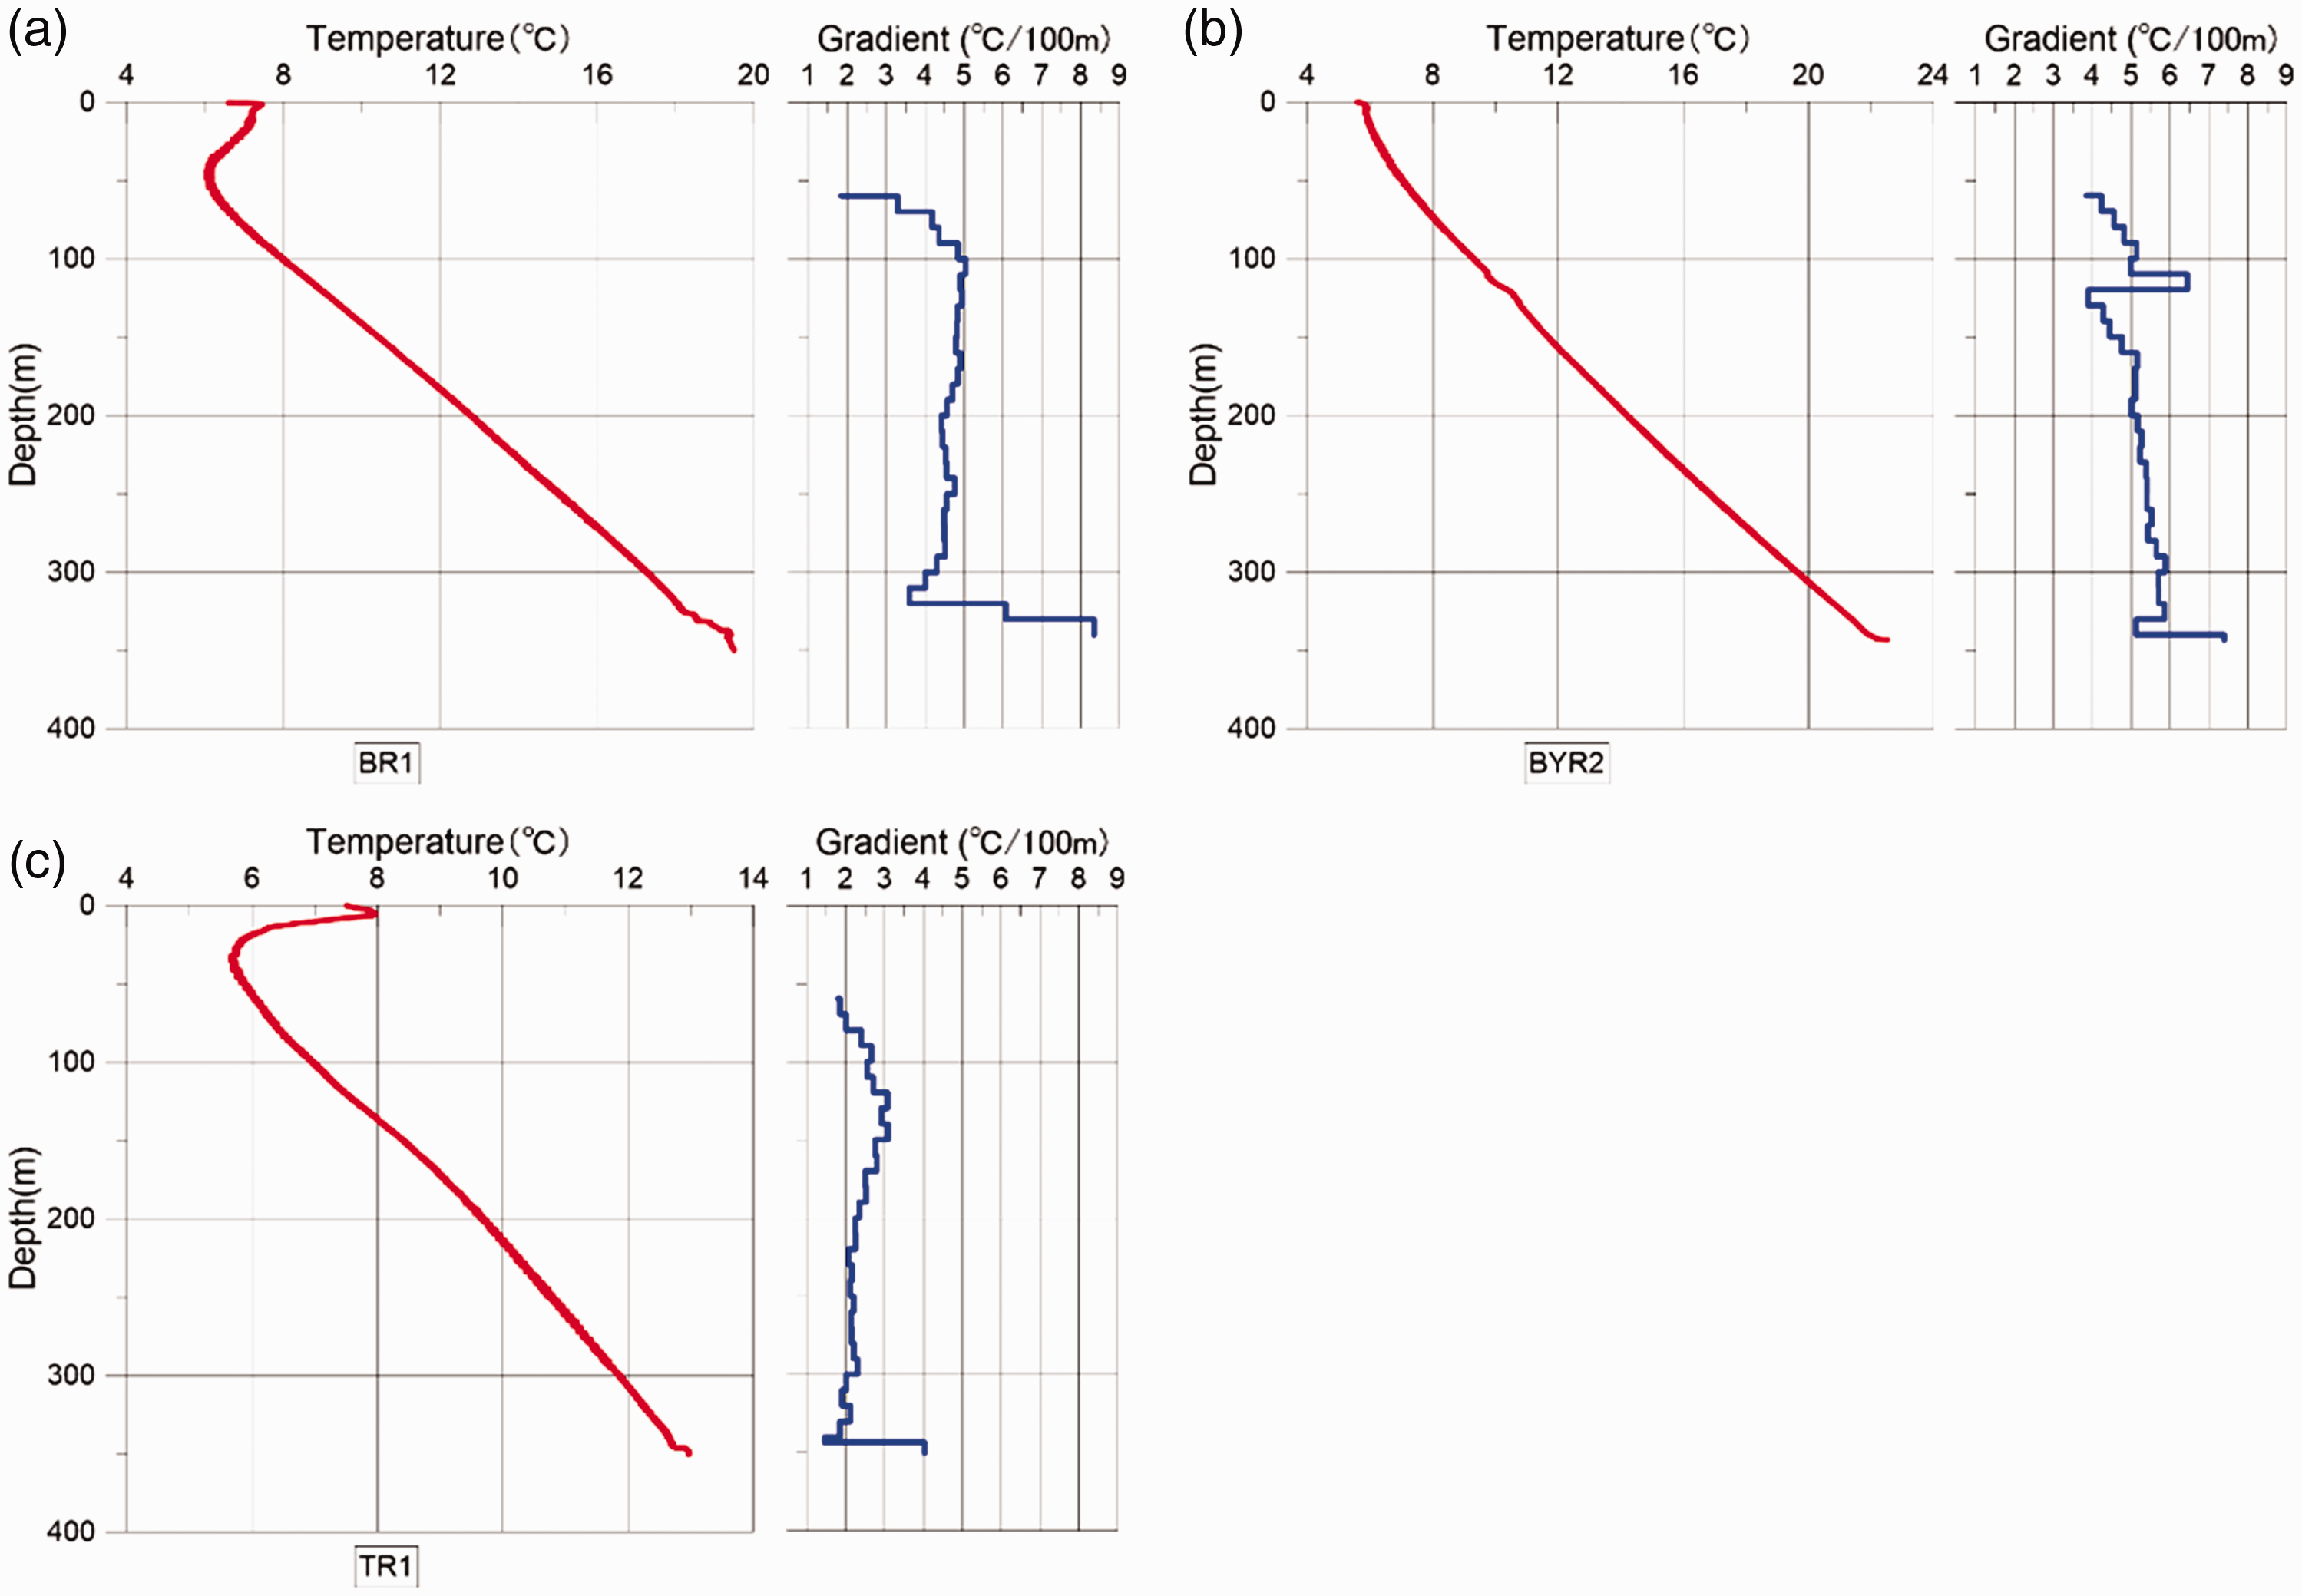
Temperature profiles and gradients of (a) Well BR1, (b) Well BYR2, and (c) Well TR1.
Six first-order structural units were developed in the basin; these are the West Slope, North Slope, Central Depression, Northeast Uplift, Southwest Uplift, and Southeast Uplift. The majority of the fault systems in the area are buried basement faults with strikes of the faults in two major directions: NE and NW (Figure 1(c)).
Data source
The temperature data were acquired using a system consisting of a 42.9 mm diameter gauge and a 4000 m long cable. The temperature gauge uses a platinic sensor, where the resistance of the thermistor depends on the temperature. The accuracy of the system is 0.1°C. The real time temperature profile is recorded when the tool enters the borehole at a speed of 7.0 m/min. The temperature profiles of seven wells were acquired; due to the different borehole configurations after well completion, three of these (BYR2, BR1, and TR1) only reached a depth of less than 350 m, while the other four wells (HR1, HDR1, SPR1, and Hulan1) reached the bottom of the cased borehole at approximately 2000 m. The recovery time is two months to two years; thus, all seven boreholes are considered to be at thermal equilibrium. The survey was carried out in November when the surface temperature was −2 to 10°C. The temperature gradients were calculated using the linear least squares regression method (Haenel et al., 1988; Powell et al., 1988) at depth intervals of 20 m for shallow wells, and 50 m for deep wells, respectively. To have a better constraint on the temperature field, 10 sets of drilling stem test data and the continuous temperature log of Well SK-2 from Jiang et al. (2016b) were used, with the location of these sites being on the west and northwest of our study area, though not shown on the map. The temperature log of Well Yingjie (Jiang et al., 2016a) was also used, to obtain a better constraint on the southeast corner of our study area.
Temperature data from the run of electric logging in 13 wells were collected; in Figures 1 and 4, these wells are shown as rings. Since records of the shut-in times of these wells are imprecise, we took 48 h as a common value and attempted to correct these BHT data with the equations given by Tang et al. (2016) and Harrison et al. (1983). The comparison of the corrected results with the continuous steady-state temperature log in their vicinity indicates that the Harrison equation gives better results, especially at the bottom of the borehole, although the equation was initially proposed for thermal reconstruction of the Anadarko Basin in Oklahoma, United States. However, the accuracy of these data is still not affirmed; thus, they are not used for interpolation but simply as a reference.
Since drill core is not available in this study area, core samples from the adjacent area, the Central Depression of Songliao Basin, were used as an analogy and approximation for thermal conductivity analysis.
Data analysis and results
Temperature field
The temperature logging of Well BR1, Well BYR2, and Well TR1 only reached a depth of 350 m due to the borehole configurations. The three temperature profiles all show a near linear shape, except the upper 50 m, which are under the disturbance of surface temperature and the lower 10–20 m, which are under the effect of friction between the gauge and casing. Excluding those data that cannot reveal the true subsurface thermal regime, the geothermal gradient of Well BR1 ranges from 3.6 to 5.0°C/100 m, with an average value of 4.57°C/100 m, and the geothermal gradient of Well BYR2 ranges from 3.8 to 6.4°C/100 m with an average value of 5.1°C/100 m. The two wells are only 1 km apart, but Well BYR2 shows significantly higher gradients, as well as a higher artesian flow rate. This indicates that convection exists at greater depth and results in the heterogeneity of the geothermal gradients in the vicinity. Well BYR2 is under the effect of stronger convection in its deeper part and has a better prospect of production. Well TR1, whose location is not shown in Figure 1, is approximately 142 km to the east of Well BR1, closer to the basin margin. Well TR1 shows a significantly colder thermal regime than Wells BR1 and BYR2, although the site was targeted and is adjacent to the Yilan-Yitong Fault Zone, a northern section of the Tan-Lu Fault Zone. The temperature profile of the uppermost 350 m is still in a conductive setting, with the geothermal gradients ranging from 1.8 to 3.0°C/100 m. However, the temperature in the three shallow boreholes might be affected by paleoclimate signatures or shallow groundwater movements, as suggested by the fluctuation of temperature gradients in Well BYR2.
Figure 3 shows the temperature profiles of the measurements to the bottom of the boreholes, excluding the uppermost 50–60 m which are under the disturbance of air temperature and surface water movement. Temperature profiles of Well HR1 and Well HDR1 indicate a conductive setting with various geothermal gradients at different depths. The geothermal gradients in Well HR1 range from 3.6 to 7.2°C/100 m, with an overall average geothermal gradient of 4.82°C/100 m. The highest gradient is shown around the depth of 900 m, which is the top of the fourth member of the Quantou Formation. The geothermal gradients in Well HDR1 range from 3.2 to 6.9°C/100 m with an overall average geothermal gradient of 4.79°C/100 m.
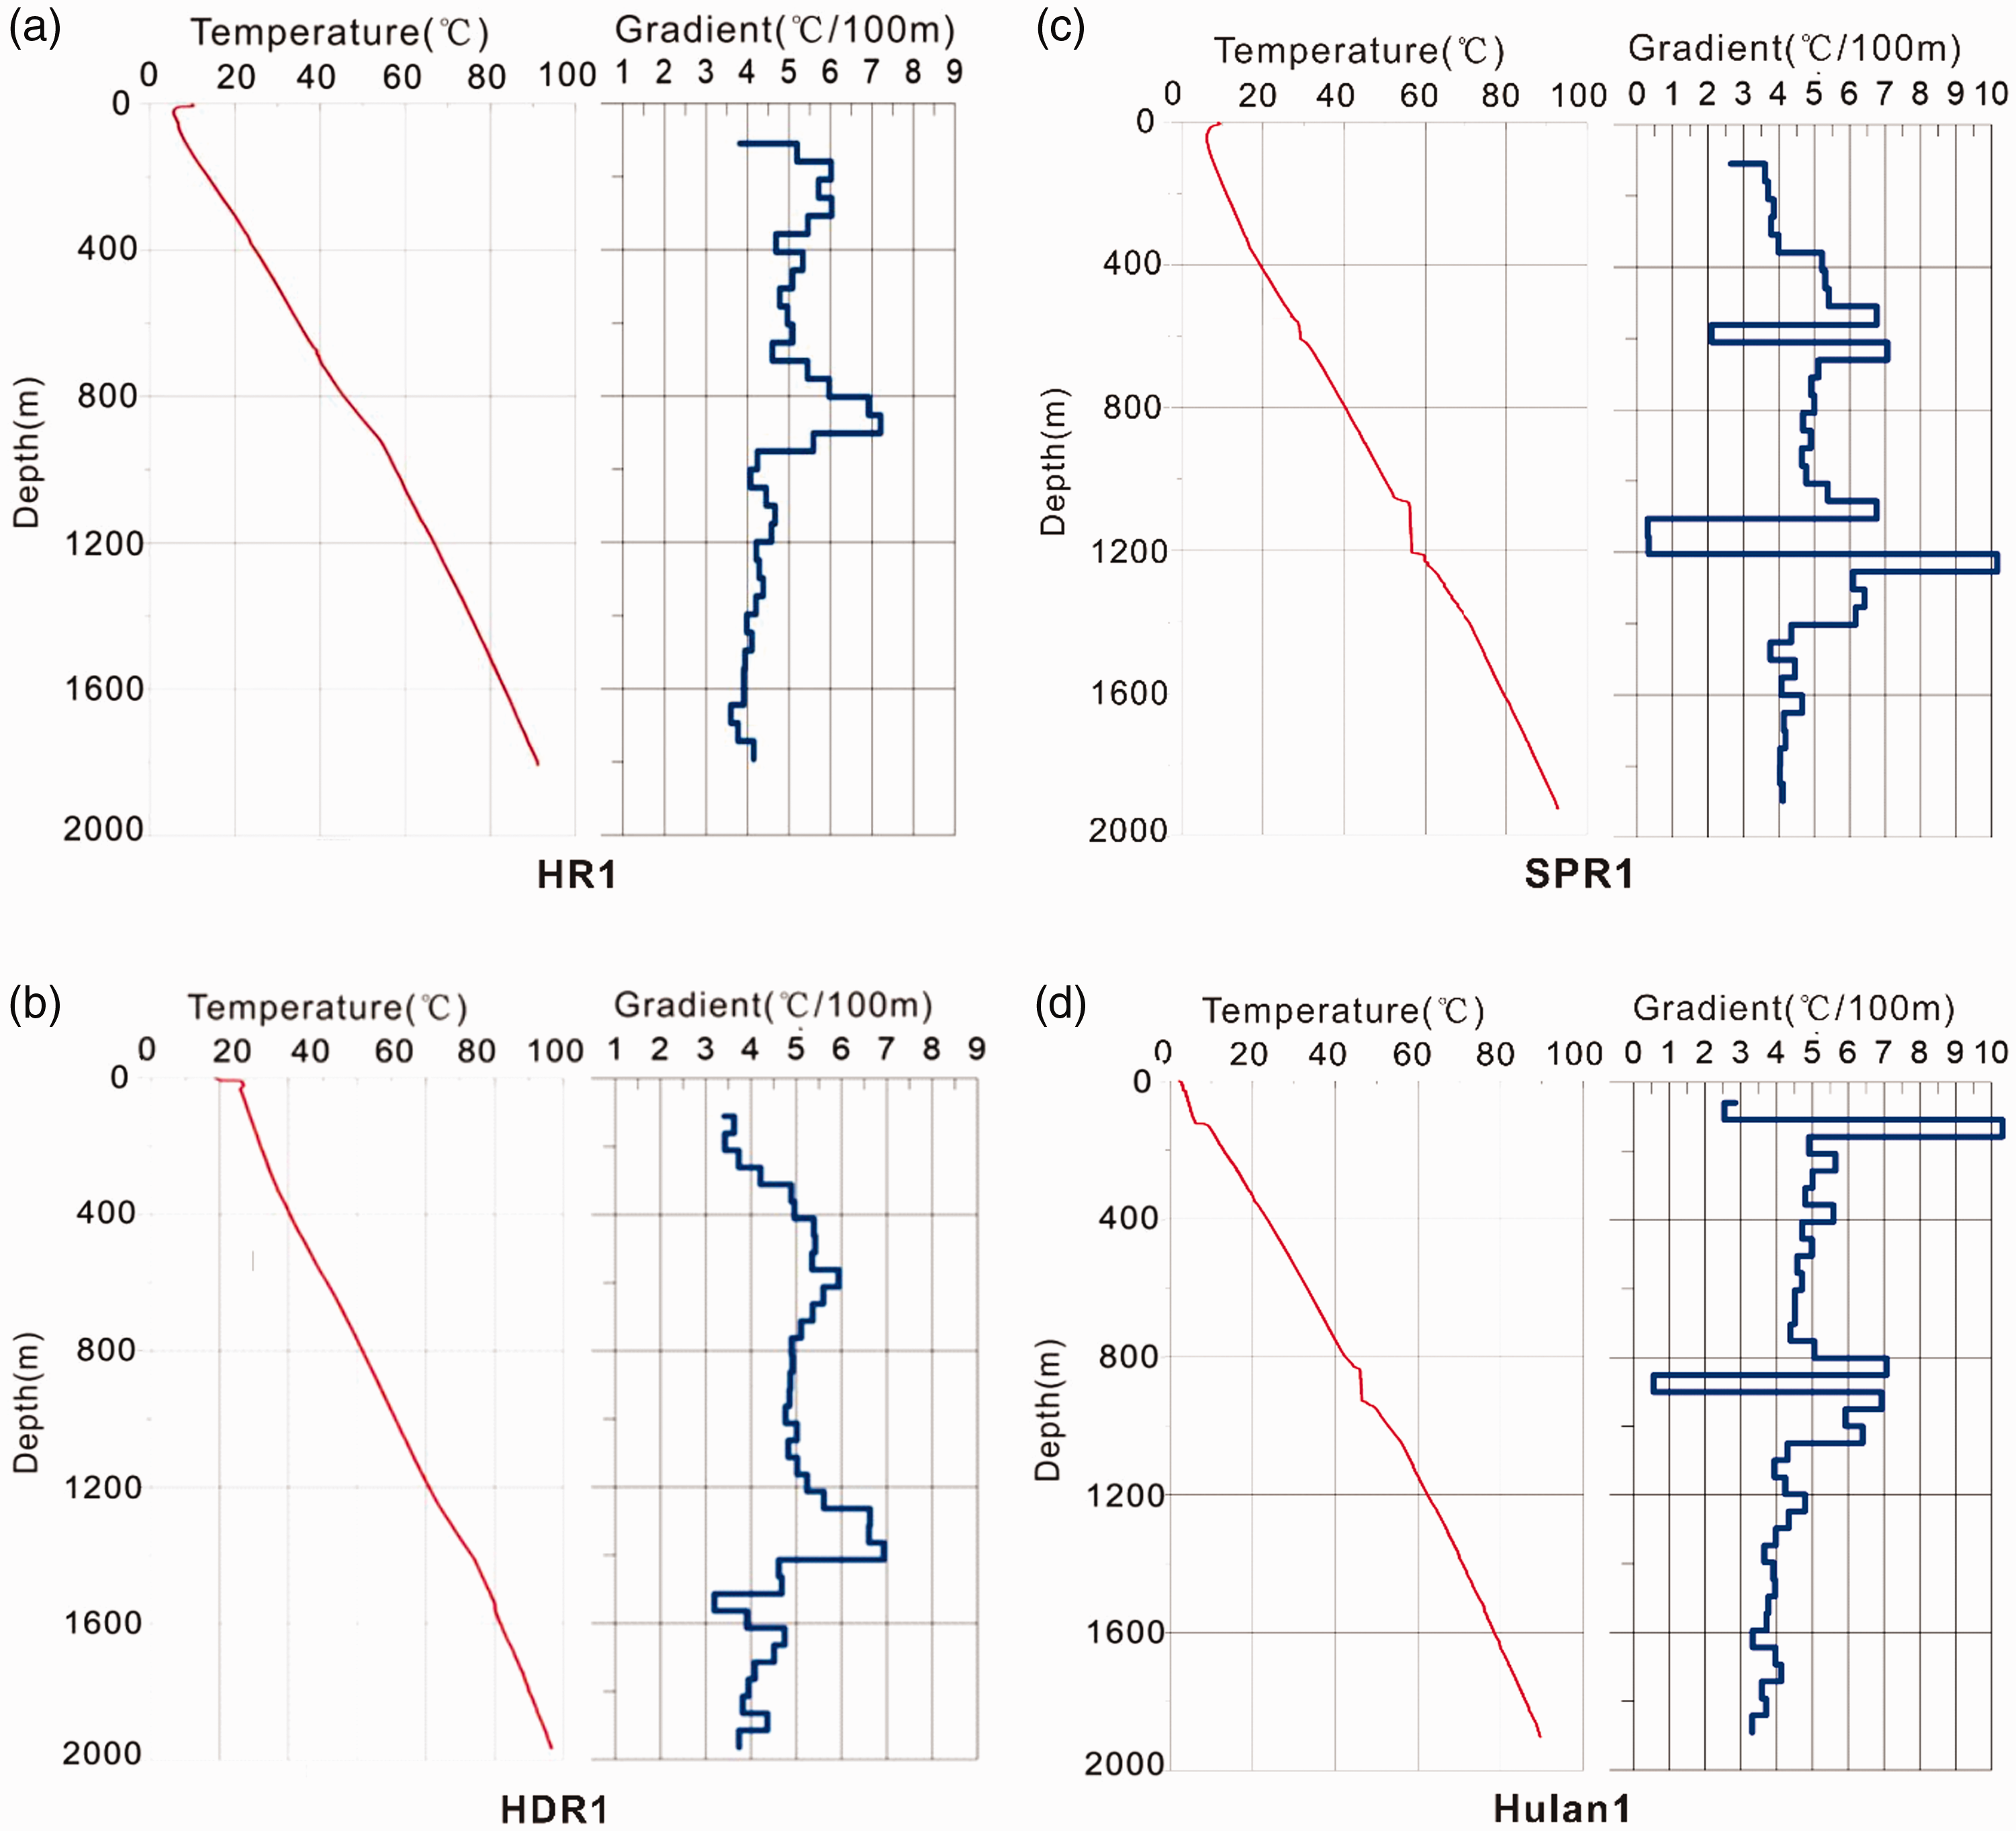
Temperature profiles and gradients of (a) Well HR1, (b) Well HDR2, (c) Well SPR1, and (d) Well Hulan1.
The temperature profile of Well SPR1 indicates that minor convection occurs between depths of 1105 and 1200 m, at which the geothermal gradient decreases sharply. The other minor convection occurs between depths of 600 and 660 m. Excluding the convective sections, the conductive geothermal gradients in Well SPR1 range from 3.6 to 6.7°C/100 m, with an average geothermal gradient of 4.78°C/100 m. In Well Hulan1 a minor convection zone is at the depth range between 838 and 928 m. Moreover, the downflow of cold water affects the uppermost 100 m of the profile; thus, an anomalously high gradient is shown at 150 m. The conductive geothermal gradients in Well Hulan1 range from 3.3 to 6.4°C/100 m, with an average value of 4.48°C/100 m.
Using the temperature profile we measured for this study, combined with the data we collected, three temperature maps of the detailed exploration area (within the pink square in Figure 1) at depths of 1000, 1500, and 1800 m were constructed using the Kriging interpolation method to illustrate the spatial variation of the temperature field (Figure 4).
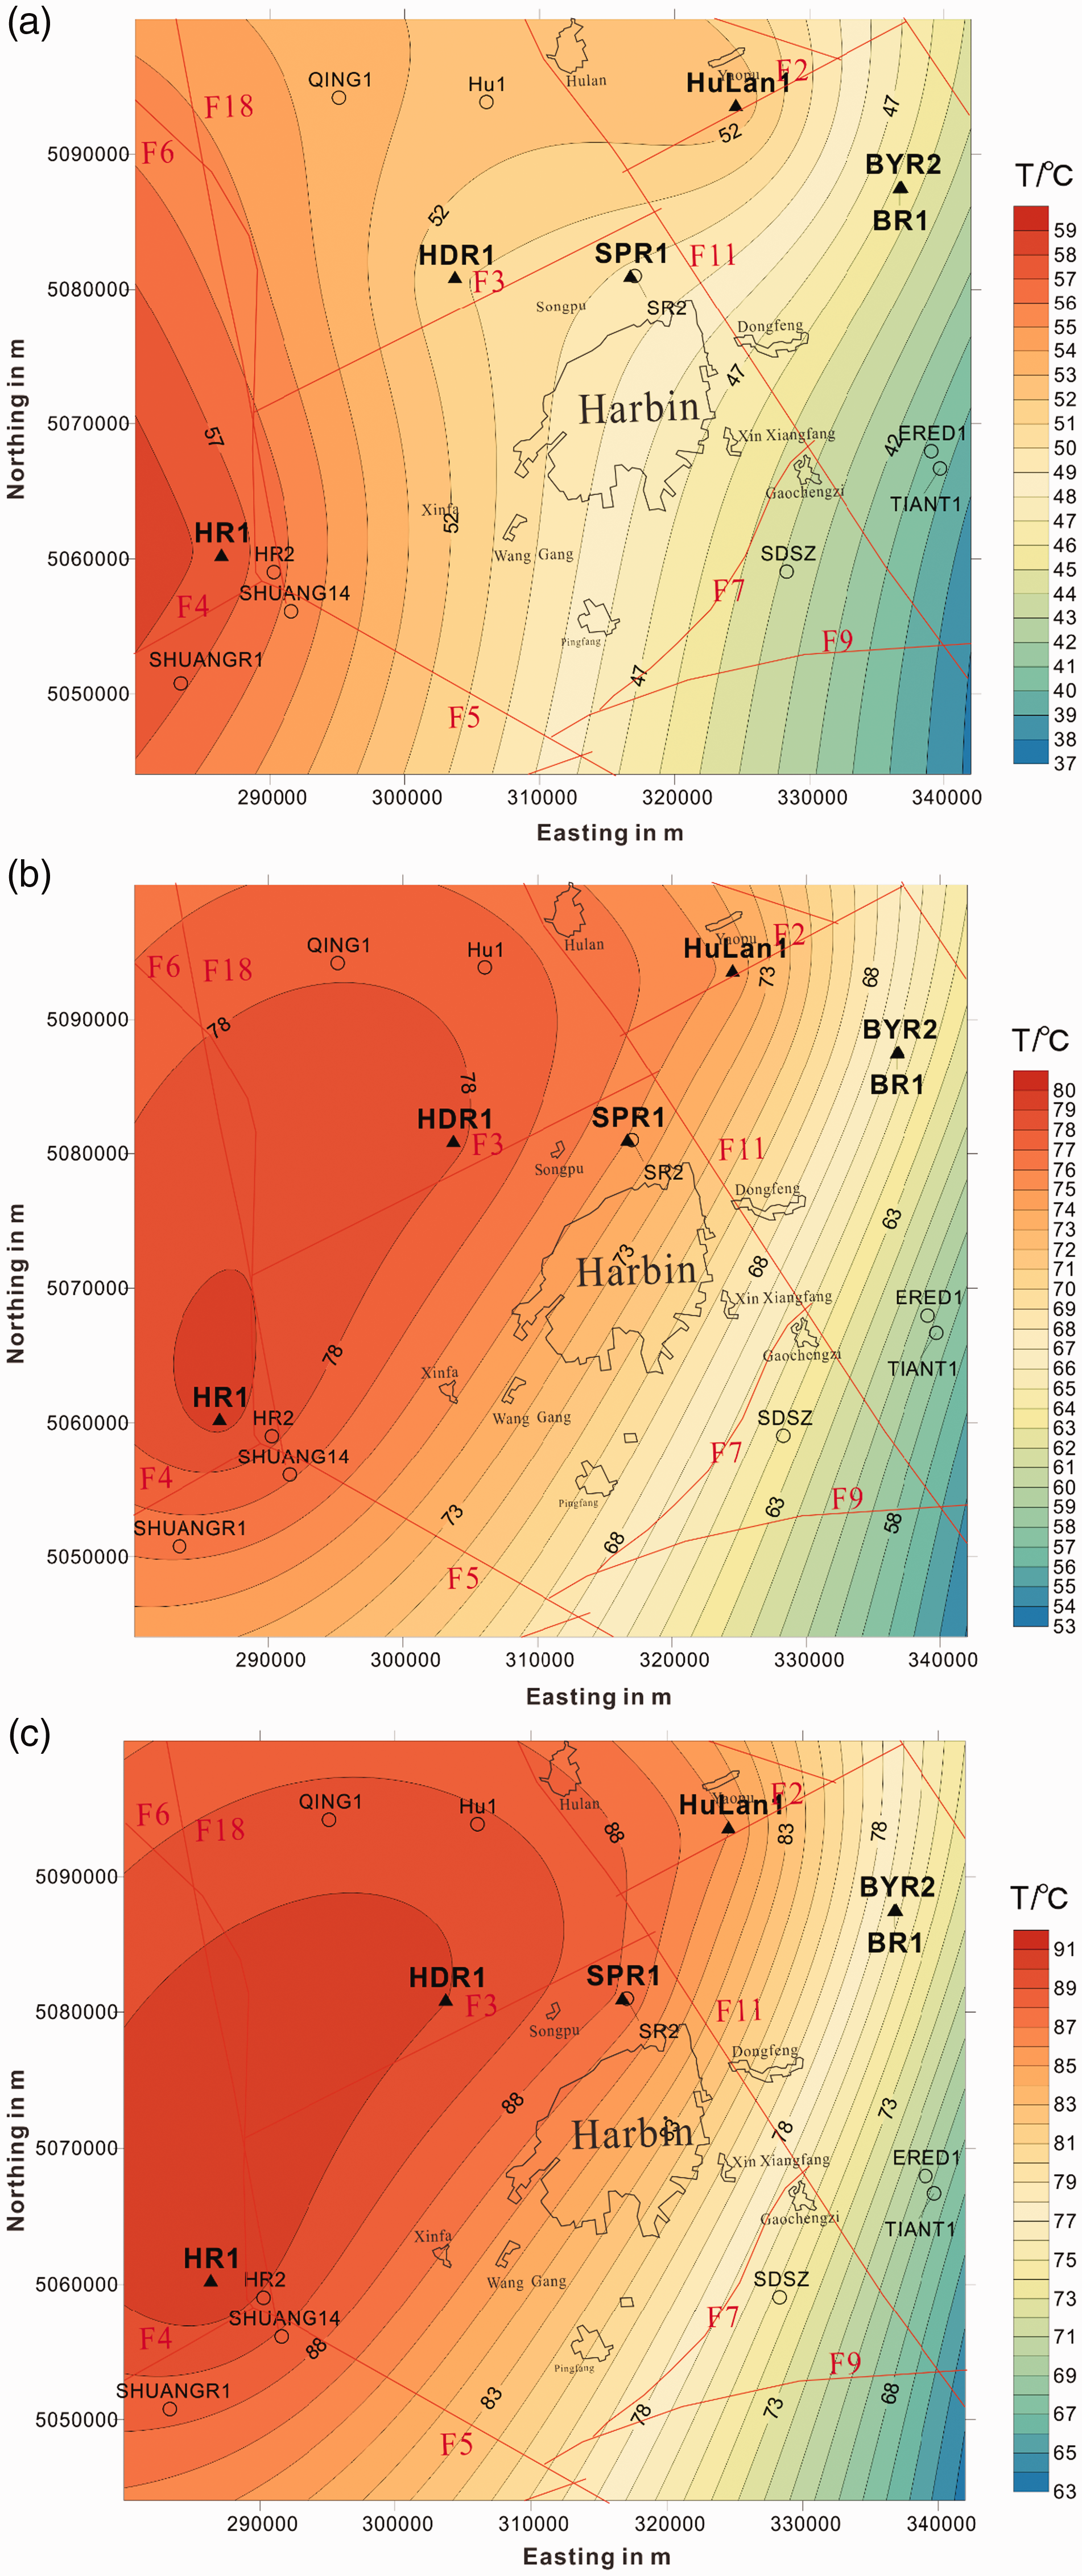
Temperature maps within the detailed exploration area at different depths: (a) 1000 m, (b) 1500 m, and (c) 1800 m; the maps are under Beijing 1954 (EPSG:4214) Geodetic Coordinate System.
At 1000 m depth, the highest temperature is at the west boundary of the area, which is close to the Central Depression of Songliao Basin. The highest temperature is > 50°C. A low temperature zone occurs near the southeast corner of the area. The overall trend as shown in the map is a temperature increase basinward (northwest).
The temperature maps at 1500 and 1800 m show similar patterns with an overall trend of higher temperature basinward. In the southwestern portion of the area, the bottom of the main target zone (third and fourth members of the Quantou Formation) is around the depth of 1500 m; at this depth the temperature is near 75°C. The 1500 m deep temperature field within the urban area of Harbin ranges from 69 to 75°C, which fulfills the threshold temperature for space heating (>55°C). At 1800 m depth, the highest temperature is >90°C at the northwestern corner of the area. More than half of the detailed exploration area shows temperature higher than 80°C at this depth; the high temperature zone trends NE–SW.
Resource assessment
The third and fourth members of the Quantou Formation are the main targets as hydrothermal reservoirs (Zhang and Liu, 2016). The third and fourth members of the Quantou Formation underlie muddy to silty cap rocks with high temperature gradients. At borehole SPR1, the average temperature gradients for the overlying Nenjiang Formation (K2n), Yaojia Formation (K2y), and Qingshankou Formation (K2qn) are 4.71, 5.01, and 5.04°C/100 m, respectively. At borehole HR1, the average temperature gradients for Nenjiang Formation (K2n), Yaojia Formation (K2y), and Qingshankou Formation (K2qn) are 4.71, 5.01, and 5.04°C/100 m, respectively. The average gradients for the third and fourth member of the Quantou Formation are 4.20–4.53°C/100 m, as the content of fine sandstone increases. The ratio of sandstone thickness to total thickness of the third and fourth members of the Quantou Formation is 22.1 and 33.2%, respectively (Guo and Yang, 2011).
The recoverable heat from the third and fourth members of the Quantou Formation were calculated using the volume method (Muffler and Cataldi, 1978); the equations are


In our study, reservoir volume is defined as

To account for uncertainty in the input parameters, Monte Carlo simulations were run using @Risk 5.0 by Palisade Corporation© within Microsoft Office Excel© (Walsh and Grasby, 2013). The input variables and their probability distributions are summarized in Table 2. Most uncertain variables are assumed to be in a triangular distribution; the input values represent a “minimum limit,” a “most likely,” and a “maximum limit,” respectively. While the range of the values for thickness (D) and reservoir temperature (T0) are given according to log data, ratio of sandstone/total thickness (μ) and porosity (φ) are from Guo and Yang (2011). Rock density (ρr) and rock heat capacity (Cr) are proposed based on the main lithology of the target reservoir, which is sandstone. The end-state temperature is 25°C (T0). The recovery factor (R) is set to be 0.1–0.25 as for systems in which porous matrix permeability controlled the flow regime (Williams et al., 2008).
Input variables and their distributions for Monte Carlo simulation.
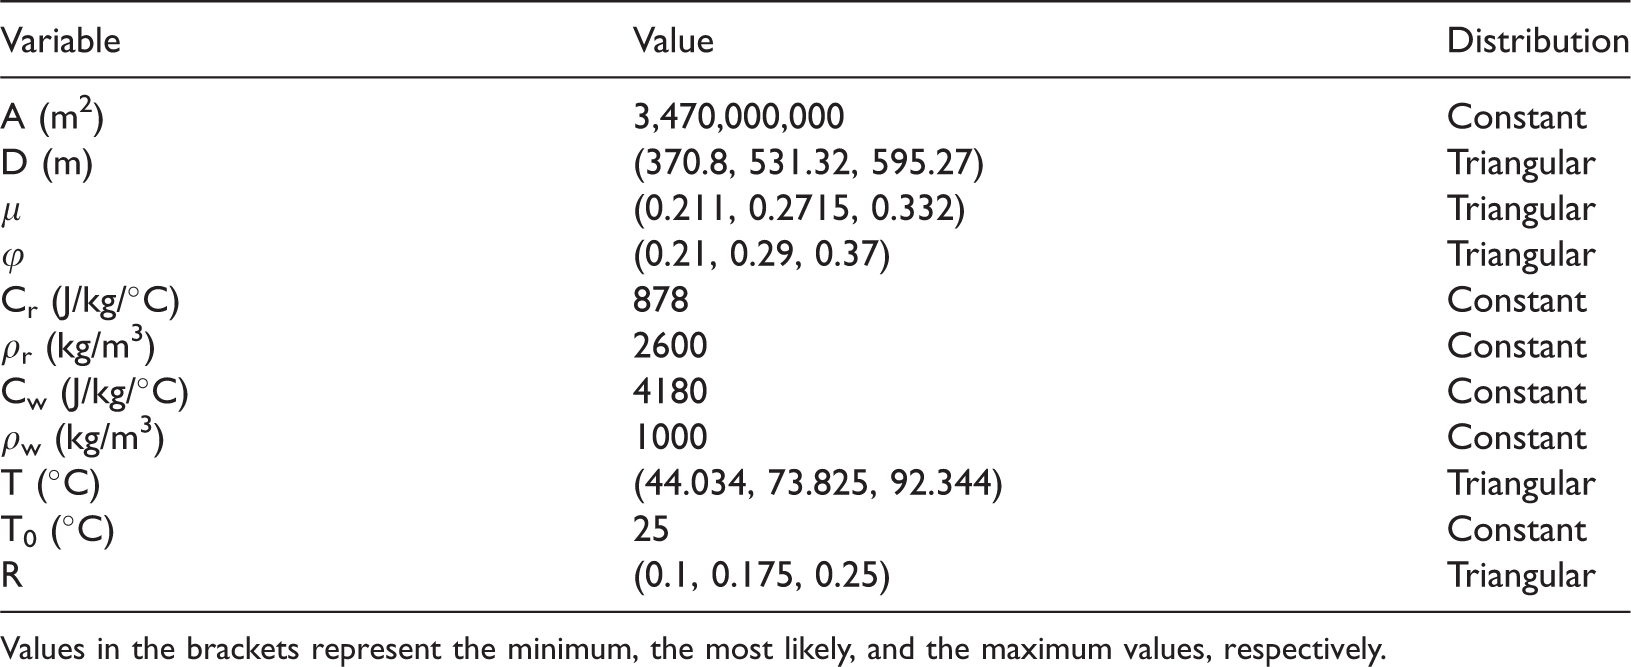
Values in the brackets represent the minimum, the most likely, and the maximum values, respectively.
The results of the Monte Carlo simulations are shown in Figure 5 and are presented as the recoverable heat potential in Joules (J). According to the probabilistic results, the mean value for recoverable heat is 1.052 × 10¹⁹ J (3.59 × 10¹¹ t standard coal); the mode is 0.781 × 10¹⁹ J (2.66 × 10¹¹ t standard coal); and the minimum and maximum values for recoverable heat are 0.383 × 10¹⁹ J (1.31 × 10¹¹ t standard coal) and 2.206 × 10¹⁹ J (7.53 × 10¹¹ t standard coal), respectively.
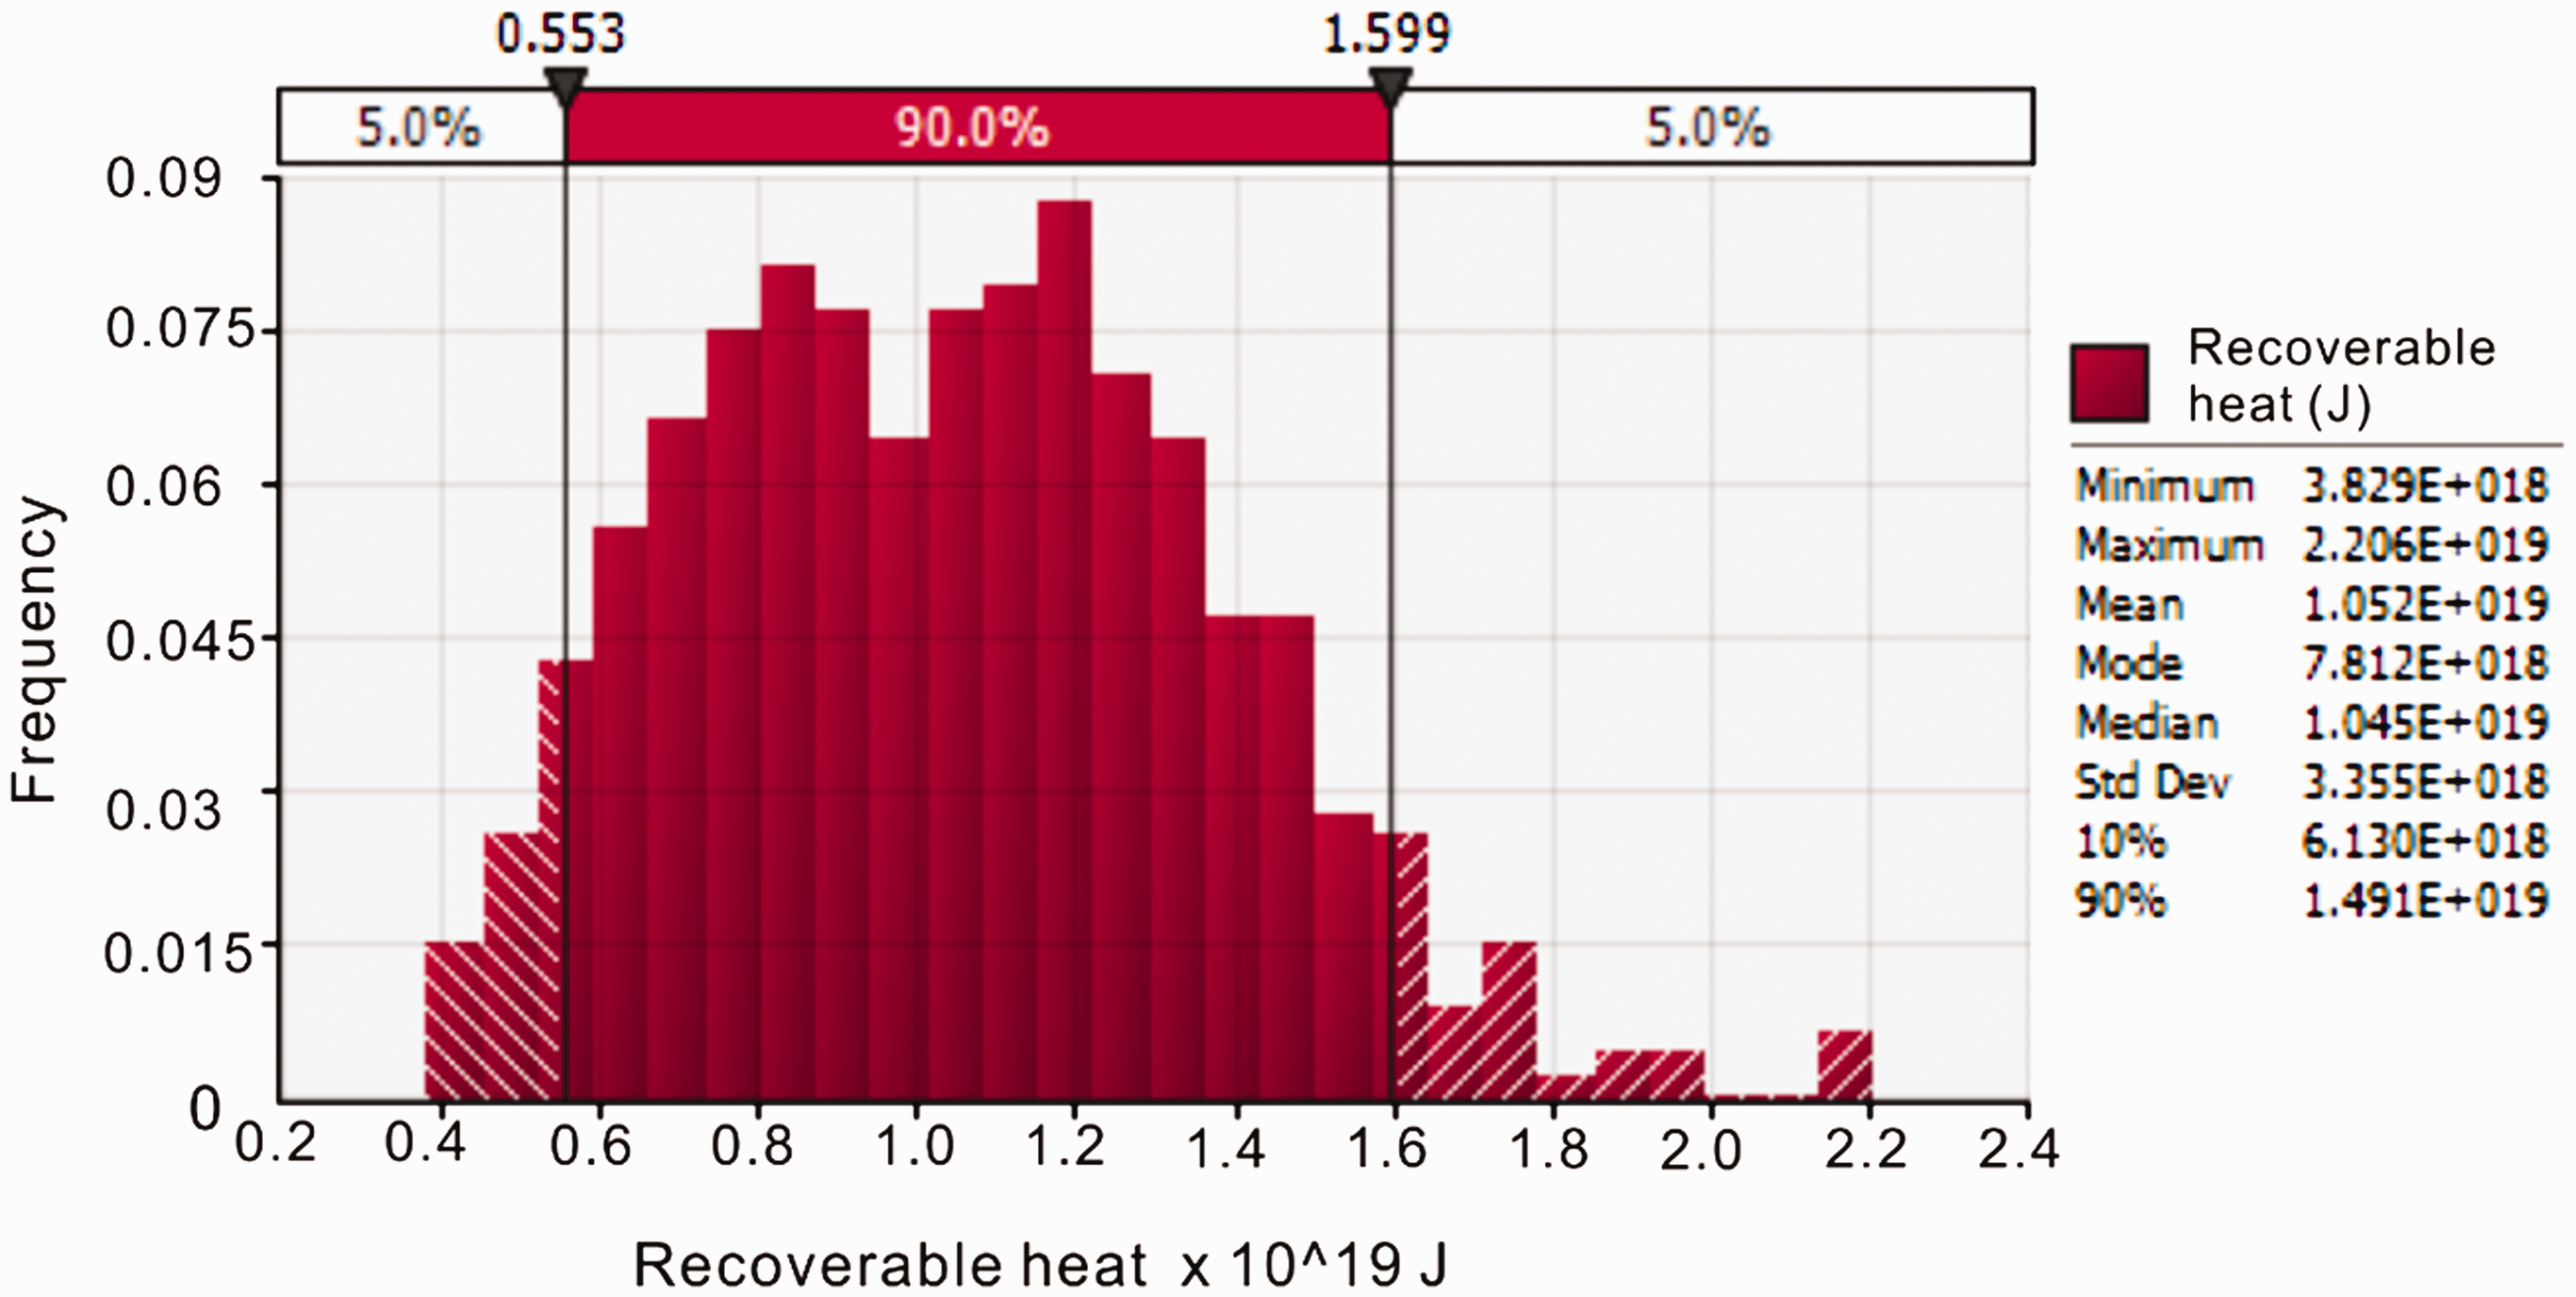
Probability distribution for the results (recoverable heat) of the volumetric assessment of the detailed exploration area calculated by the Monte Carlo method.
Discussion
As shown in Figure 6, the variations of the average temperature gradients for each formation are coincident with lithological changes. As the sandy content increases in the Quantou Formation (K2q), the average temperature gradients decrease. The muddy Nenjiang (K2n) and Yaojia (K2y) Formations show temperature gradients greater than 5°C/100 m. The area is a high temperature anomaly system with muddy cap rocks and porous reservoir media.
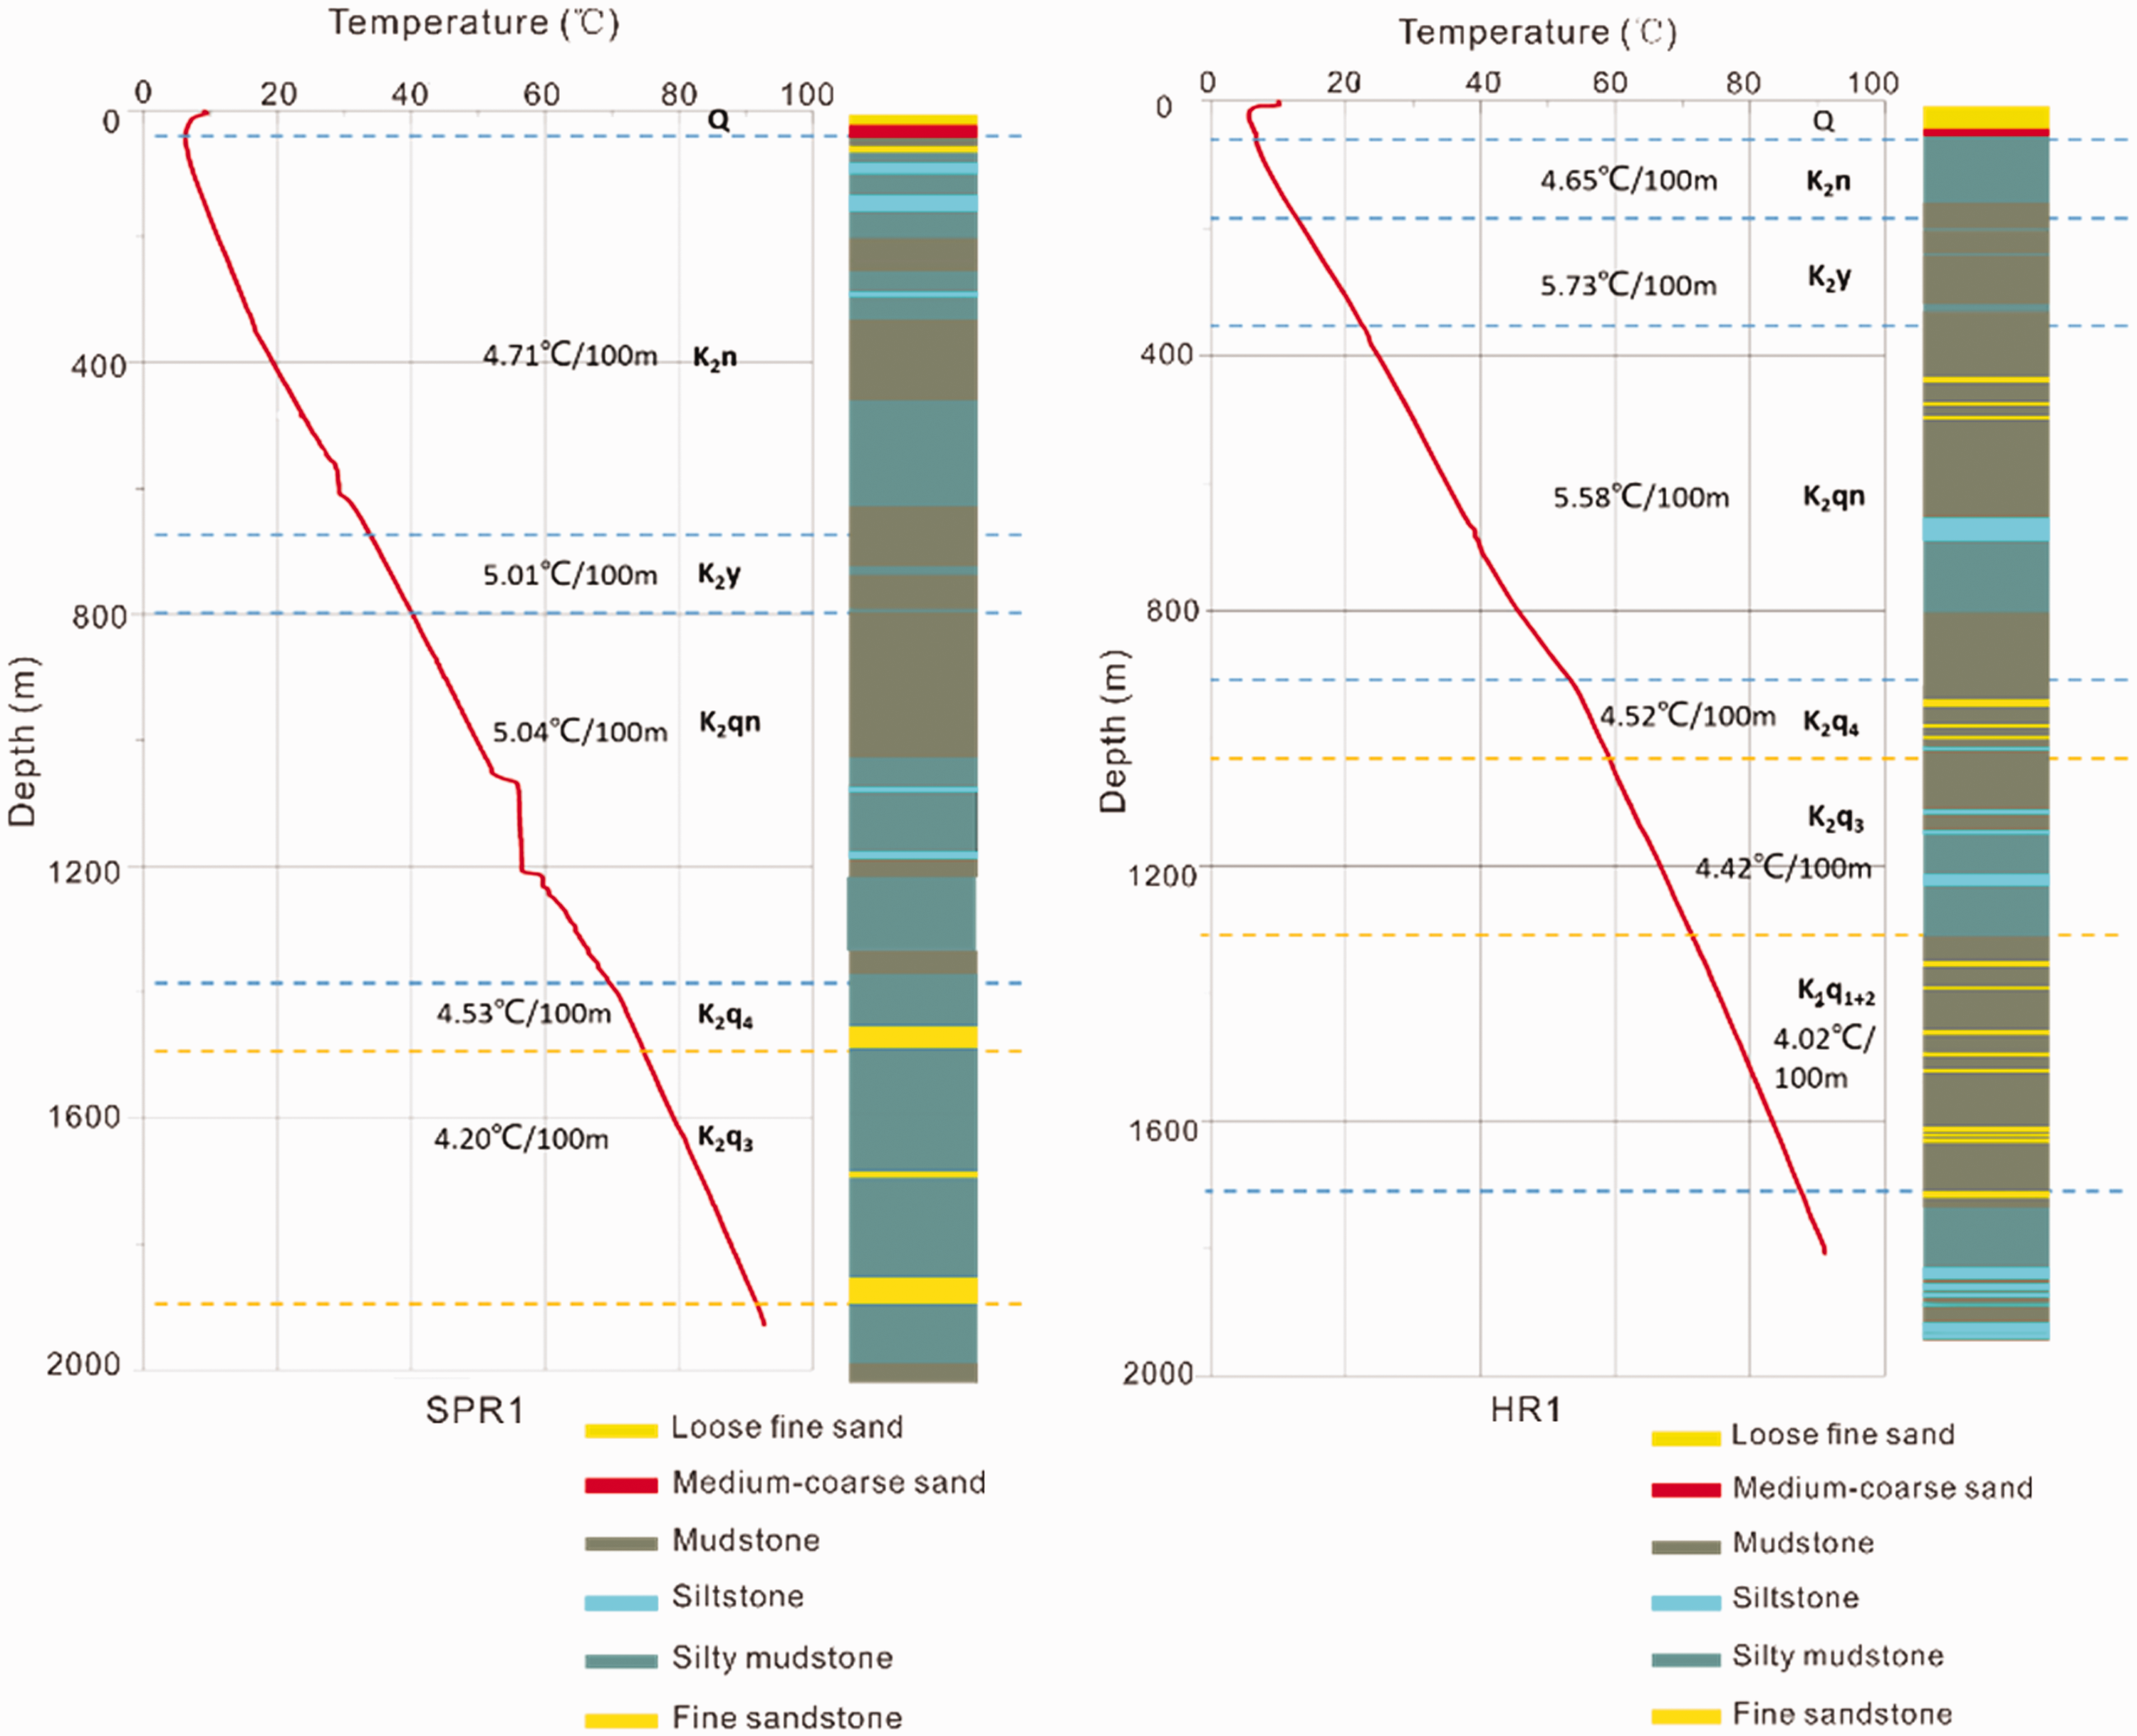
Temperature profiles and lithologic columns of SPR1 (left) and HR1 (right).
As indicated by the temperature profiles, heat transfer in the study area is predominately by heat conduction. The variations in vertical temperature gradients are mainly caused by a contrast in thermal conductivities of formations. Generally, for sedimentary rocks, shale and mudstone have relatively low thermal conductivities, while the thermal conductivity of sandstone and conglomerate shows large variability (Kappelmeyer and Haenel, 1974; Wang, 2015). Since drill cores are not available in our study area, according to the analysis of the samples from Central Depression of Songliao Basin, the fine sandstone and siltstone from Qingshankou Formation (K2qn) have conductivities of 1.694 and 1.3 W/(m°C), respectively (Wu, 2014). In Wu and Xie (1985), 15 samples of sandstone and 13 samples of mudstone from Songliao Basin have average thermal conductivities of 2.35 ± 0.14 and 1.35 ± 0.21 W/(m°C), respectively; nevertheless, the formation from which these samples were taken was not clarified. Generally, as sandy content increases, the thermal conductivity of a formation decreases. In the temperature profile of a given well, the heterogeneity of the vertical temperature gradients is mainly related to lithology and corresponding thermal conductivity change of each formation. The high temperature gradients can be associated with low thermal conductivities.
Heat flow is an important parameter indicating the thermal state of a basin. It is the product of the vertical temperature gradient and corresponding formation’s thermal conductivity. According to Wu and Xie (1985), the heat flow of the Songliao Basin ranges from 44.38 to 95.04 mW/m2, with a mean value of 68.55 mW/m2. Among the 10 heat flow points, the average value of the five sites within the Central Depression is 80.98 mW/m2, demonstrating that the Central Depression is an area with anomalously high heat flow. However, radioactive heat generation of sedimentary layers in the basin is relatively low, the radioactive heat generation from the crust accounts for ∼32 mW/m2 of heat flow (Wu, 2014). Thus, the high surface heat flow is mainly caused by the upwelling of upper mantle, which leads to crustal thinning to a thickness of approximately 29 km under the Central Depression (Wu and Xie, 1985). For the Southeast Uplift, two heat flow values have been reported: 80.39 mW/m2 near the site of Well Qing1 (Wu and Xie, 1985) and 62.88 mW/m2 near the site of Well Binxi1 (Jiang et al., 2016a).
Overall, in the Songliao Basin heat flow decreases toward basin margins (Wu and Xie, 1985). SK-II and Xushen1 are two boreholes in the Central Depression of Songliao Basin; the temperature data of SK-II were logged using the same system as we applied for this study, whereas the temperature data of Xushen1 were from Drill Stem Temperature Data (Jiang et al., 2016b). When comparing the temperature data from these two boreholes in the Central Depression and the data sets from the northwestern portion of Songliao Basin in this study (Table 3), it is clearly demonstrated that at similar depths, the two boreholes (HR1 and SPR1) in the northwestern portion of our study area show higher temperature. Moreover, the average temperature gradients in Well HR1 and Well SPR1 are significantly higher than those in Wells SK-II and Xushen1.
Temperature data from wells in the Southeast Uplift and the Central Depression of Songliao Basin.
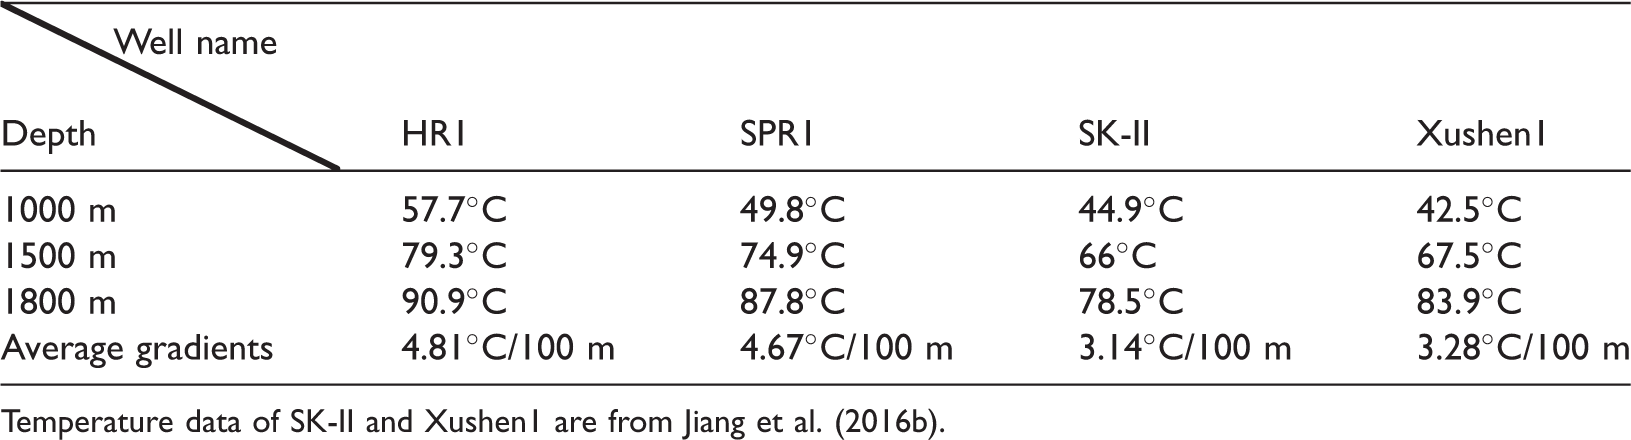
Temperature data of SK-II and Xushen1 are from Jiang et al. (2016b).
Heat refraction is the main cause of the higher temperature gradients. The northwestern portion of our study area is within a conjunction zone of four second-order structural units of the Songliao Basin: the Chaoyanggou Terrace, the Hulan Uplift Zone, the Changchunling Anticline, and the Binxian-Wangfu Sag. These regional structural units extend in an NE direction (Figure 1(a)), coincident with the extension of isotherms (Figure 4). The Chaoyanggou Terrace and the Changchunling Anticline are two units with relatively uplifted basement located in the junction zone between the Central Depression and the Southeast Uplift (Figure 1(b)). The basement is at a shallower depth than that under the Sanzhao Sag on the northwest of the Chaoyanggou Terrace and the Binxian-Wangfu Sag on the southeast of the Changchunling Anticline. According to drill hole results, the basement of the Songliao Basin mainly consists of unmetamorphosed or slightly metamorphosed Paleozoic granites and gneiss. Petrographical studies indicate that what was identified as “gneiss” is actually deformed granitic intrusions. Therefore, granites represent the major rock type for the basement in the Songliao Basin (Pei et al., 2007; Wu et al., 2001). Typically, the thermal conductivities of granite rocks are in a range of 2.1–4.2 W/(m°C) (Kappelmeyer and Haenel, 1974; Wang, 2015). In Geothermal Resources Exploration Specifications for China, granites are given a representative value of 2.721 W/(m°C), which is greater than that of most siliciclastic rocks. The uplifted basement, as a better heat conductor, causes lateral heat transfer between structural units, resulting in the regional high temperature gradients in the northwestern portion of our study area. A similar mechanism is also found at the north end of Daqing Placanticline in the Central Depression of the Songliao Basin. However, to the southeast margin of the basin, temperature gradients decrease dramatically, as the average temperature gradients for Well TianT1 and SDSZ are only 2.44 and 2.46°C/100 m, respectively.
In resource assessment, the Monte Carlo method is used to characterize the overall uncertainties of the results. Among the variables, a great uncertainty is associated with recovery factor. In our study, the range of value for recovery factor is given based on the type of the reservoir. However, the amount of recoverable resource is also limited by economic factors and the thermal effect of injection and production in reservoirs. Thus, a greater accuracy can be achieved through dynamic modeling incorporating monitoring data.
Conclusions
According to the seven steady-state temperature profiles, heat conduction is the primary heat transfer mechanism in our study area; some minor low temperature gradient might be caused by groundwater movements. The conductive vertical temperature gradients range from 2.1 to 7.2°C/100 m, with a mean value of 4.78°C/100 m. The pattern of the isotherms extends in an NE direction, coincident with the structural trend of the second-order units of the Songliao Basin. The northwestern portion of our study area shows higher temperature and vertical gradients; at 1500 m depth, the highest temperature reaches 79°C, and at 1800 m depth, the temperature exceeds 90°C. The study area shows cooling southeastward, toward the margin of the basin. According to the volumetric method, through the application of Monte Carlo simulation, the mean value for recoverable heat from the detailed exploration area around the Harbin area is 1.052 × 10¹⁹ J (3.59 × 10¹¹ t standard coal); the mode is 0.781 × 10¹⁹ J (2.66 × 10¹¹ t standard coal); and the minimum and maximum values for recoverable heat are 0.383 × 10¹⁹ J (1.31 × 10¹¹ t standard coal) and 2.206 × 10¹⁹ J (7.53 × 10¹¹ t standard coal), respectively. The vertical temperature gradient variations observed on the temperature profiles can be explained by lithofacies changes. On the other hand, the contrast of thermal conductivities between basement and clastic sedimentary covers generates the lateral heat transfer between structural units. Consequently, the northwestern portion of the study area as a relatively uplifted zone demonstrates higher temperature gradients than those in the surrounding sags.
Footnotes
Declaration of conflicting interests
The author(s) declared no potential conflicts of interest with respect to the research, authorship, and/or publication of this article.
Funding
The author(s) disclosed receipt of the following financial support for the research, authorship, and/or publication of this article: The research is financially supported by the China Postdoctoral Science Foundation and the Chinese Academy of Sciences. Grant number: 2017LH015.