
Abstract
Indentifying reservoir characteristics of coals and their associated shales is very important in understanding the co-exploration and co-production potential of unconventional gases in Guizhou, China. Accordingly, comprehensive experimental results of 12 core samples from well LC-1# in the northern Guizhou were used and analyzed in this paper to better understand their vertical reservoir study. Coal and coal measured shale, in Longtan Formation, are rich in organic matter, with postmature stage of approximately 3.5% and shales of type III kerogen with dry gas generation. All-scale pore size analysis indicates that the pore size distribution of coal and shale pores is mainly less than 20 nm and 100 nm, respectively. Pore volume and area of coal samples influenced total gas content as well as desorbed gas and lost gas content. Obvious relationships were observed between residual gas and BET specific surface area and BJH total pore volume (determined by nitrogen adsorption). For shale, it is especially clear that the desorbed gas content is negatively correlated with BET specific surface area, BJH total pore volume and clay minerals. However, the relationships between desorbed gas and TOC (total organic carbon) as well as siderite are all well positive. The coals and shales were shown to have similar anoxic conditions with terrestrial organic input, which is beneficial to development of potential source rocks for gas. However, it may be better to use a low gas potential assessment for shales in coal-bearing formation because of their low S1+S2 values and high thermal evolution. Nevertheless, the coalbed methane content is at least 10 times greater than the shale gas content with low desorbed gases, indicating that the main development unconventional natural gas should be coalbed methane, or mainly coalbed methane with supplemented shale gas.
Introduction
The remarkable success in the exploration and development of coalbed methane (CBM) and shale gas in the United States has stimulated CBM and shale gas exploration boom worldwide (Kenomore et al., 2018; Moore, 2012; Prpich et al., 2016; Soeder, 2018). China has also been encouraged to dedicate great effort to develop shale gas (Dang et al., 2016; Li et al., 2018a). The sedimentary environment of coal-bearing strata is mainly the marine–continental transitional facies and continental facies, and the coal-bearing gas is mainly stored with free and sorbed phase in the reservoir, usually shown as continuous accumulations (Schmoker, 2002). In many cases, coals are associated with shales or mudstones (Baioumy et al., 2011). Generally, the shale is not only the source rock of natural gas generation but also the reservoir and cap of the accumulation and preservation of natural gas. The gases can also extend across lithological boundaries with low permeability, abnormal pressure (high or low) and close associations with source rocks and generally have a large areal extent (Clarkson et al., 2011). In recent years, the coal-bearing shale gas and CBM have been paid much attention in China (Luo et al., 2018; Yang et al., 2017) because of the coal measure gas (CBM, shale gas and sand gas) in superposed reservoirs existing a possibility of co-exploration and co-production. Significant production of continuous (unconventional) petroleum and gas resources has been explored and developed, such as Bowen and Surat basins in Australia (Towler et al., 2016), Alberta Basin in Canada (Bustin and Bustin, 2016), Fort Worth Basin and Piceance Basin in USA (Hawkins et al., 2016; Pollastro, 2007). In fact, transitional co-existing of coals and shales are distributed widely in China, such as the Carboniferous–Permian in the Qinshui Basin (Li et al., 2018b), Carboniferous Benxi Formation and the Lower Permian Shanxi Formation-Taiyuan Formation in the Ordos Basin (Tang et al., 2014) and the Permian Longtan Formation in southern China (Luo et al., 2018; Zhang et al., 2017). The coal seams and shales in these areas have a relative large cumulative thickness, which can be considered to have tremendous coalbed gas and shale gas potential. However, studies on the continuous accumulation of coal-bearing gas is relatively scarce and concentrated in the Ordos Basin and Qinshui Basin (Li et al., 2018b, 2016).
Many sets of coal and CBM formation have been developed in Guizhou (Gao et al., 2009; Xu et al., 2016; Yang et al., 2018). For the characteristics of multi-thin coal seams in Longtan formation, some technologies about small layer perforation, staged fracturing technique, ball sealer diversion and graded proppant injection have been applied for CBM development recently (Jia et al., 2016). However, the research on shale gas was more concentrated in the marine black shale of the Lower Silurian Longmaxi formation and Lower Cambrian Niutitang formation, and the coal-bearing shale is less studied (Luo et al., 2018). In Guizhou Province, the Longtan formation is composed of superposed reservoirs with multiple thin coal-seam zones as well as interbeded with finergrained mudstone, siltstone or sandstone (Xu et al., 2016). The YMC-1 well, a CBM drilling, is located in the southwest of Guizhou. The content of CBM is 6.9–23.8 m3/t with an average of 15.9 m3/t (dry ash-free basis), and the total gas content of sand and shale varies from 0.4 m3/t to 3.78 m3/t (obtained by canister desorption). The production of the well is up to 5000 m3/d. The Xiye-1 well is located in the central region of northwestern Guizhou. During the process of drilling, the gas content ranges from 1.40 m3/t to 19.60 m3/t, which indicates that marine–continental transitional Longtan shale has great potential for shale gas and may be as important as marine shale (Wang et al., 2015b). Collectively, the success of CBM and shale gas exploration and development in the Longtan transitional shale can expand greatly the development scope of traditional “CBM” and reveals the great resource potential of continuous accumulation of coal-bearing gas.
This study aims to provide valuable insight for the development of continuous accumulation of coal-bearing gas in the future by integrating a laboratory test data with analytical results of core samples from well LC-1# in Linhua mining field. We utilize the analysis of canister desorption, isothermal adsorption, mercury injection, low-pressure N2 and CO2 adsorption, total organic carbon (TOC), Rock-Eval pyrolysis, X-ray diffraction (XRD), scanning electron microscopy (SEM), elemental analysis and so on to determine reservoir characteristics, depositional environment and gas potential of coals and shales. These results provide an important basis and valuable insight for comprehensive evaluation and further study of the potential of CBM and shale gas potential in the transitional Longtan formation.
Samples and experiments
Geological setting
The Linhua mining field is the place where the well LC-1# is located, covering an area of 24 km2 in the northern Guizou Province (Figure 1). The strata of Linhua mining field comprise of Maokou Formation, Longtan Formation and Changxing Formation, and bottom to top. The coal-bearing strata in Longtan Formation in Upper Permian is the main target for CBM and shale gas development. The Longtan Formation is a marine and continental alternative deposition with a thickness of 116 m, which mainly consists of siltstone, mudstone, limestone, sandstone and coal seams. The geological structure of the mining field is in the northwest wing of Jinsha-Qianxi syncline, trending NE along the formation strike with an inclination of 7–34° in the northwest wing. The formation strike is NW trending with an inclination of 7–12° in the southeast wing. The faults in the mining field are scarce and generally distributed on the edge of the mining field with fault throw of about 30 m. The amount of coal seams is approximately 9–21 layers with a thickness of 8.68–15.60 m (12.11 m on average), and the recoverable coal seams (2–6 layers, 3.01–12.13 m with an average of 6.39 m in thickness) are primarily distributed in the lower and middle parts of the coal-bearing formation, providing a material basis for the formation of CBM resources. Moreover, the northern Guizhou Province undergoes multiperiod tectonic deformation, including Indosinian movement, Yanshan movement and Himalaya movement. Dongwu movement (about age of 260.4 Ma) caused the uplift and uplift of the whole Guizhou province with a large-scale seawater retreat, and a fault depression-foreland sedimentary basin was formed in the early late Permian. During this process, Longtan Formation coal and shales were widely deposited in this region. At the same time, the Kangdian oldland had a very basaltic magma eruption, forming hundreds or even thousands of basalt platforms in the center of Guizhou and its adjacent regions. The basalt platform provided superior paleogeographic conditions for the later Permian coal seams.
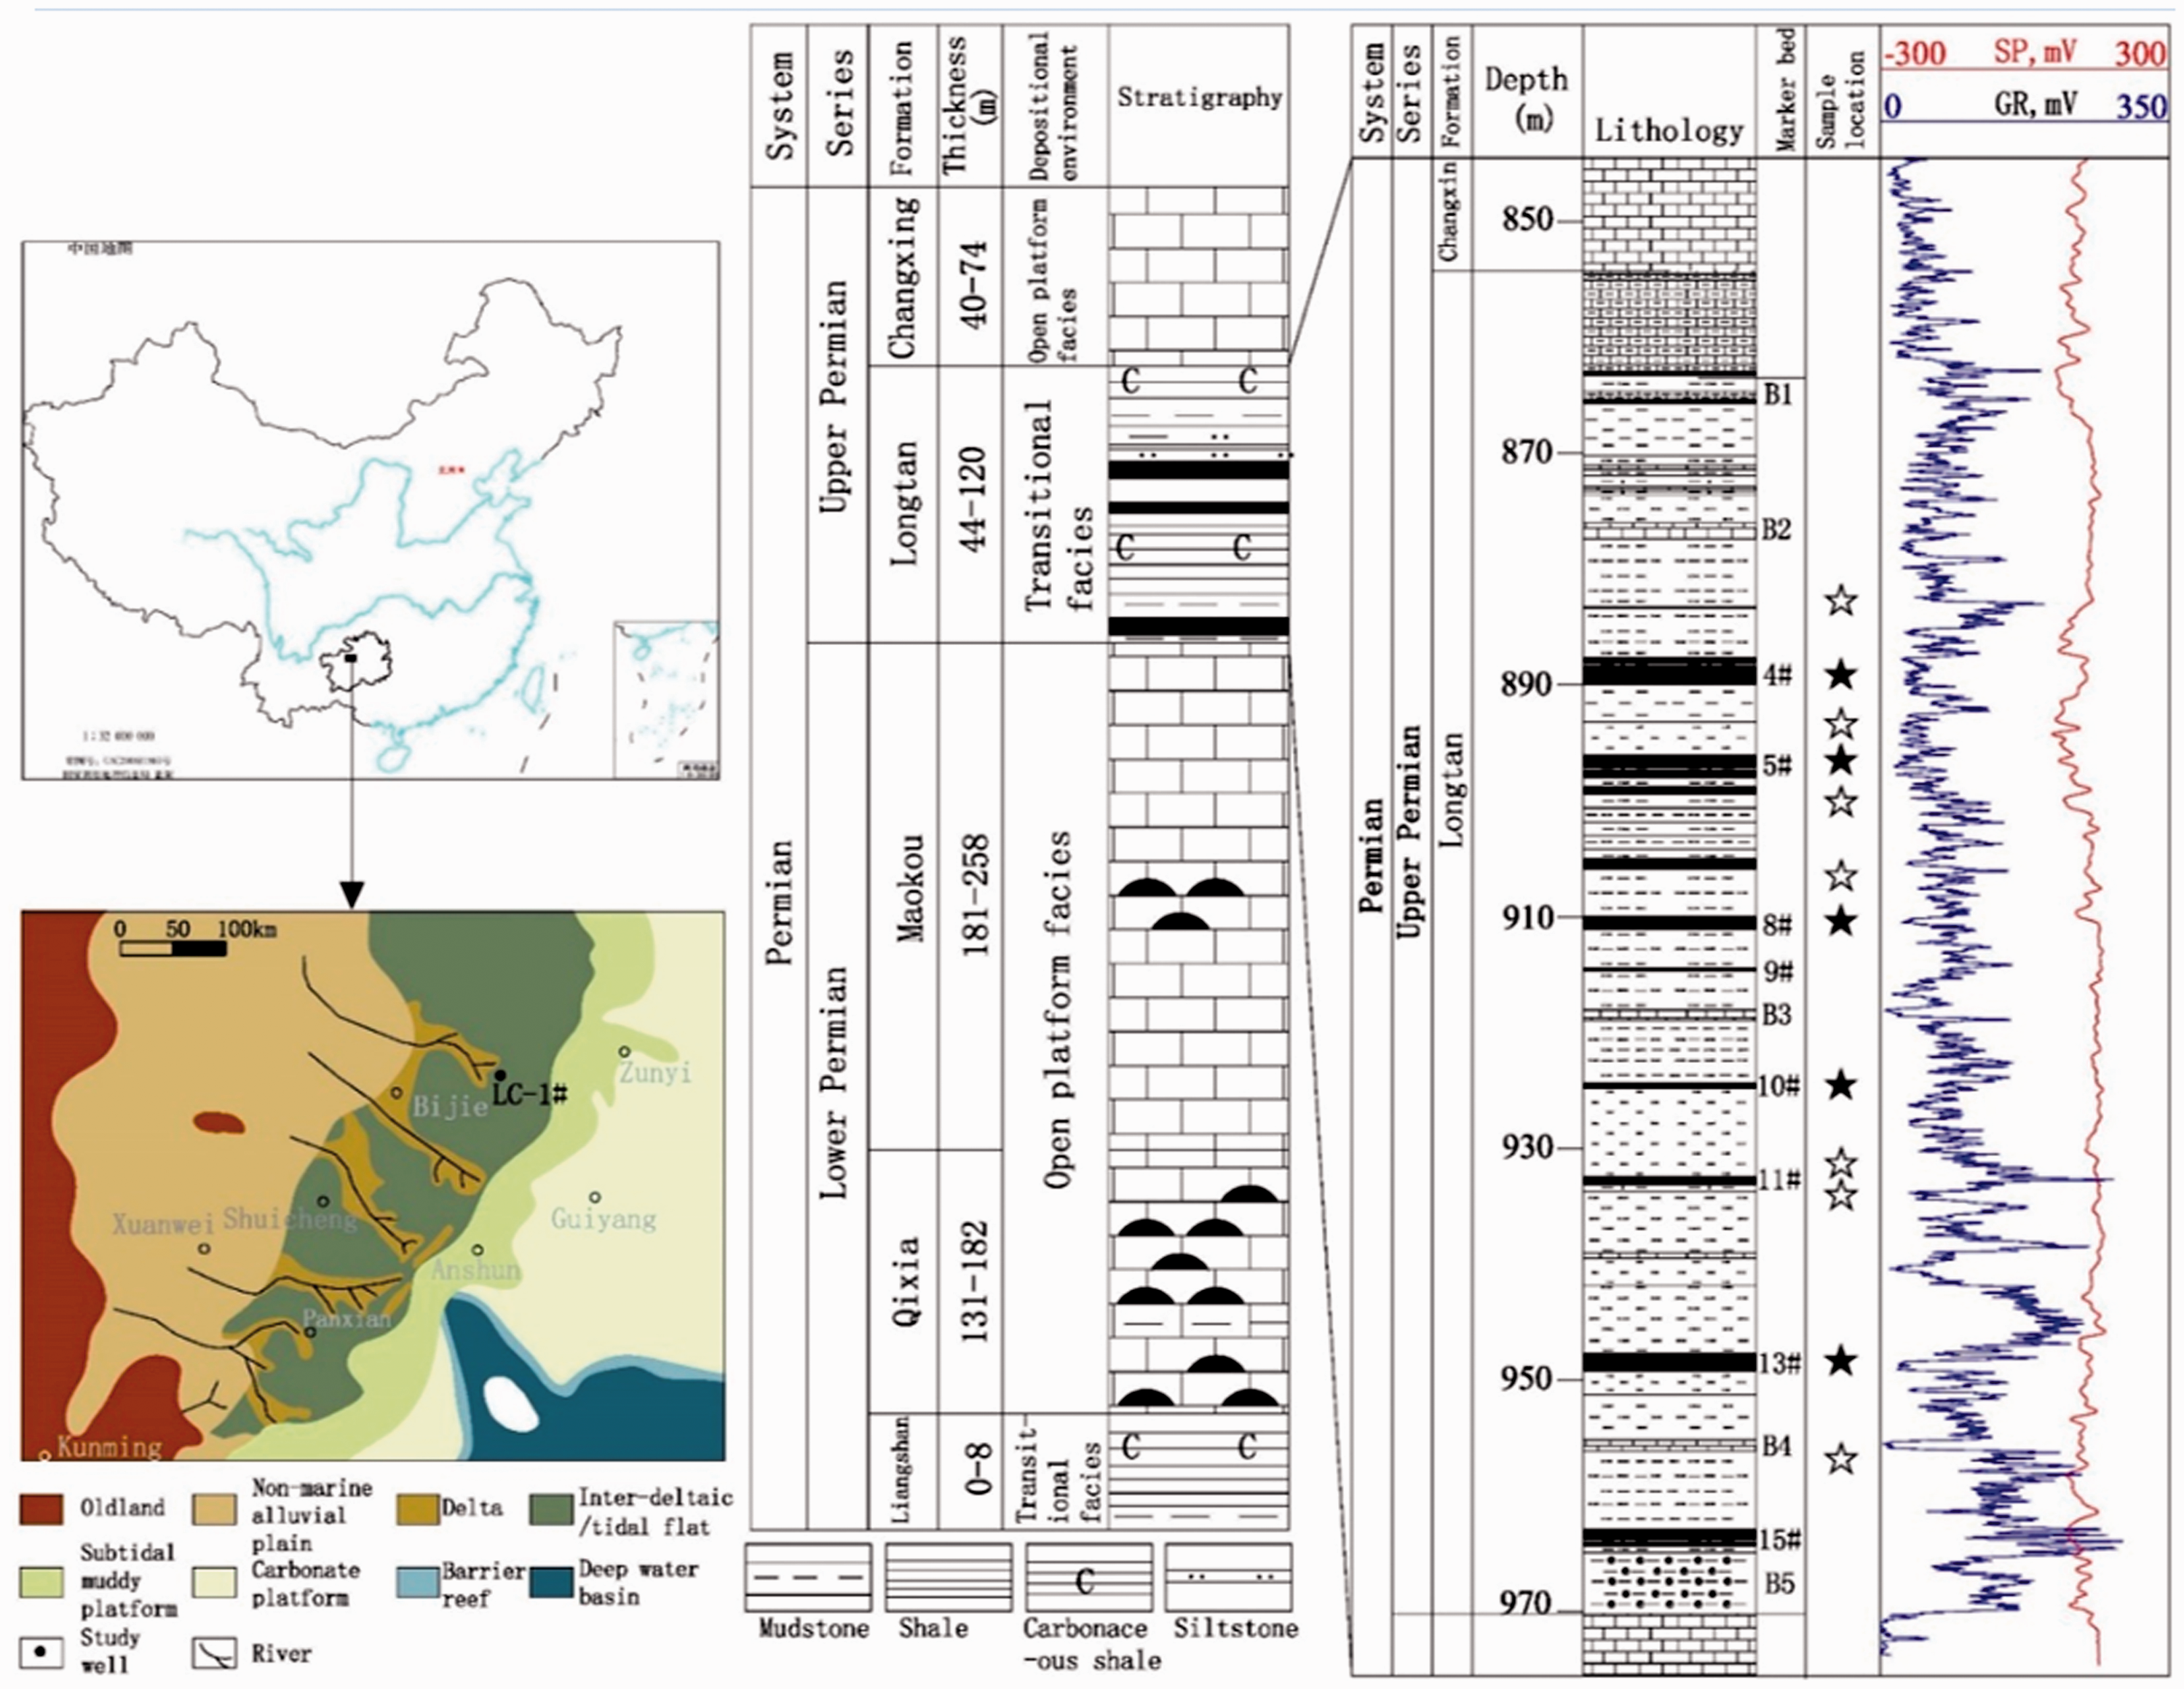
Stratigraphic positions of coal and mudstone members in the Permian strata and the studied site locations with a paleogeography map of Late Permian sediment in the study area (modified from Shao et al., 1999).
Samples
The coal-bearing strata of the Linhua mining field are mainly developed in marine–continental transitional sedimentary system. Some wells had been drilled to discover coal seams, but not with the specific aim of characterizing this unconventional coal-bearing shale gas reservoir. Because the samples were collected from the drilling core, and the coal and shale samples were limited, it is difficult to collect all coal and shale cores to define the coal and shale gas reservoirs through experiments. Thus, only a total of five core coal samples and seven shale core samples of the Permain Longtan Formation were collected from well LC-1#. These fresh samples are representative of a great extent in the vertical coal-bearing strata in the range of this area. These collected coal and shale samples from coal-bearing strata have a depth from 880 m to 960 m (Figure 1). Sampling provides an opportunity to observe potential coal and shale reservoirs in their original condition. These fresh samples were prepared according to analysis requirements for different tests.
In addition, the data used in this paper, such as the coal minerals, vitrinite, petrographic composition of coal, were collected form 31 exploration wells. These wells were drilled and data were collected and analyzed by the Coal Mine Exploration of Guizhou Province. Based on these data, the distribution and characteristics of the CBM geology conditions in the Linhua mining field were analyzed.
Experimental methods
To characterize coal and shale reservoirs, all experimental tests were performed on core samples in this study (Table 1), and these tests were conducted in accordance with national standards and related specifications, and no abnormal conditions were examined during the measurements, which were all performed at qualified laboratories.
Investigated samples and applied measurements.
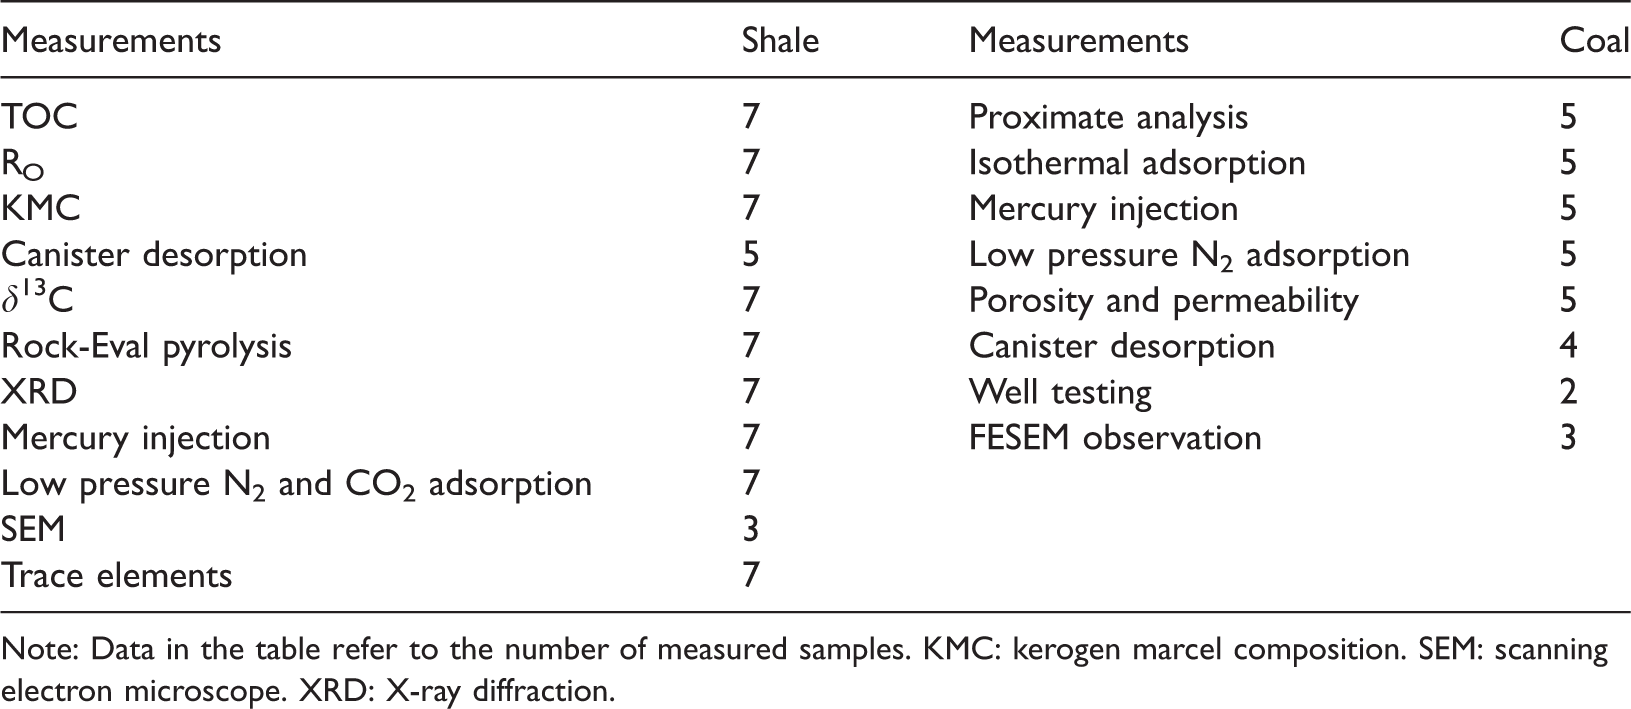
Note: Data in the table refer to the number of measured samples. KMC: kerogen marcel composition. SEM: scanning electron microscope. XRD: X-ray diffraction.
Isothermal adsorption experiments were carried at 30°C for the moisture-equilibrium and pulverized samples (60–80 mesh) using a volumetric apparatus (ISO-300). The sorption results were then modeled using the Langmuir method (Langmuir, 1918). Desorption canister testing is performed in this study to determine the total adsorbed gas content of the coal and shale samples. The core sample was placed quickly as possible inside a hermetically sealed canister immersed in a water bath at the reservoir temperature (35–40°C), and the volume of gas released were periodically measured using a graduated cylinder at atmospheric pressure. Lost gas is usually estimated by projecting the early time desorption data at reservoir temperature back to the time at which desorption began. Time zero is the time when the core was halfway out of the well. The residual gas content was tested and sealed at the reservoir temperature with crushed sample (2–3 cm) as well as in an interval of 24 h. Simultaneously, these representative samples were used for coal composition analyses. However, the measured gas contents of shale samples were generally lower than 1.0 m3/t, indicating the residual and lost gas were almost negligible compared to the measured gas content. Thus, only the measured gas was used to estimate the gas content for the shale samples.
The mercury injection experiments were conducted using an Auto-Pore IV 9500 instrument with a maximum mercury injection pressure of 60,000 psi. The samples had been dried at 70–80°C for 12 h before each experiment. The pore diameter was calculated by the Washburn equation (Washburn, 1921). Specific surface area, mesopore volume and mesopore size distribution were determined using a TriStar II 3020 porosimeter, with low-pressure (b10.13 kPa) nitrogen as the adsorptive at the boiling point temperature of liquid nitrogen (77.35 K at 101.3 kPa). Micropore volume, micropore specific surface area and micropore size distribution were determined using low-pressure CO2 at a temperature of 273 K. Sample weight varied between 1 and 2 g.
For shale samples, the total organic carbon content (TOC, wt%) was determined by a ROCK-EVAL6 analyzer at a temperatures of 300°C for 3 min, then finally at 850°C, with a heating rate of 20°C/min for a range of 300–850°C. Kerogen type and maceral were conducted with an Axiophot biological microscope. The δ13C were performed using a Finngan MAT-252 through dual inlet analysis and reported in “δ” notation in per mil (‰) that relative to the Pee Dee Belemnite (Vienna PDB). Trace elements were determined by inductively coupled plasma-mass spectrometry (ICP-MS, Thermo Scientific, Element XR) with a temperature of 23.5°C and humidity of 36.2%. XRD was performed with a D/max-TTR at 25°C and 50% humidity. The specimens for SEM observation was firstly exposed by Ar-ion milling, and then observed using a ZEISS SIGMA system associated with the energy disperse spectroscopy (EDS) microprobe.
As a reference test, core plugs with a diameter of 2.54 cm and length of 2.5–5 cm were used for porosity and permeability analysis based on Boyle’s Law and unsteady flow Darcy’s Law. A pulse decay permeameter (PDP-200) at a pressure of 1000 psi (6.89 MPa) with nitrogen was used. The pressure sensor has an accuracy of ±0.1% of the full scale.
Results
CBM reservoir characterization
Coal characteristics
Basic coal-quality characteristics and petrographic composition are presented in Table 2. The moisture content ranges from 1.10% to 2.30% with an average of 1.46% and there is a range of ash, volatile and sulfur contents. Especially, all the ash yields of all these coal samples are over 10%, and No. 10 coal seam has a high sulfur content of 3.28%.
Proximate analysis and petrographic composition of the coal samples studied in well LC-1#.
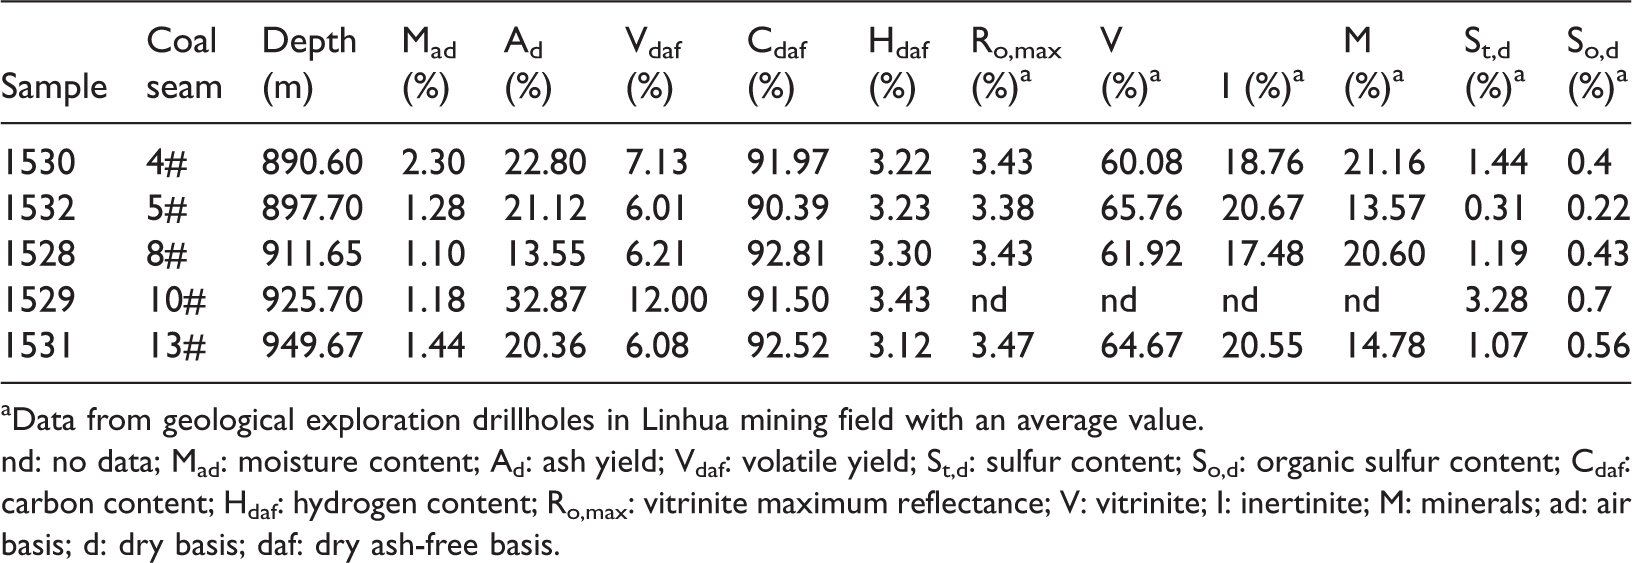
aData from geological exploration drillholes in Linhua mining field with an average value.
nd: no data; Mad: moisture content; Ad: ash yield; Vdaf: volatile yield; St,d: sulfur content; So,d: organic sulfur content; Cdaf: carbon content; Hdaf: hydrogen content; Ro,max: vitrinite maximum reflectance; V: vitrinite; I: inertinite; M: minerals; ad: air basis; d: dry basis; daf: dry ash-free basis.
Vitrinite reflectance values of 3.38%–3.47% and heating values of 22.53–30.27 MJ/kg indicate basically iso-rank high-anthracite coal. The average maceral composition of the coal is also similar in samples from all coal seams (vitrinite content 60.08%–65.76%), although there are variations in maceral composition among individual samples in each sample (Table 2).
Pore characteristics
Mercury injection combined with N2 adsorption/desorption are the common method to characterize the pore structures of coal. Normally, mercury porosimetry is used to study macropores (>100 nm) because of the compressibility of coal at high pressures (greater than 10 MPa) (Gane et al., 2004), and low temperature N2 gas adsorption/desorption analysis is used to study micropores (<10 nm) and mesopores (10–100 nm) (Zhang et al., 2010). The mercury porosimetry results that the total intrusion volume of coal samples varies between 0.017 cm3/g and 0.023 cm3/g with an average of 0.019 cm3/g, the total pore area between 4.50 m2/g and 6.16 m2/g with an average of 5.38 cm3/g (Table 3). In addition, the pore diameter versus incremental Hg volume (Figure 2(a)) shows that much mercury was injected after 12 MPa, which corresponds to a pore diameter of 100 nm with a peak of 7 nm. These show that the coal samples are mainly micropores and a few mesopores, and all coal samples have similar pore distribution. N2 gas adsorption analyses show that pores have total micropores and mesopores volume from 0.015 cm3/g to 0.030 cm3/g, and the surface area between 15.27 m2/g and 23.42 m2/g, 0.021 cm3/g and 18.78 m2/g on average, respectively (Figure 2(b)).
Hg intrusion and nitrogen adsorption derived parameters, and permeability tested by gas pulse decay and well testing method.
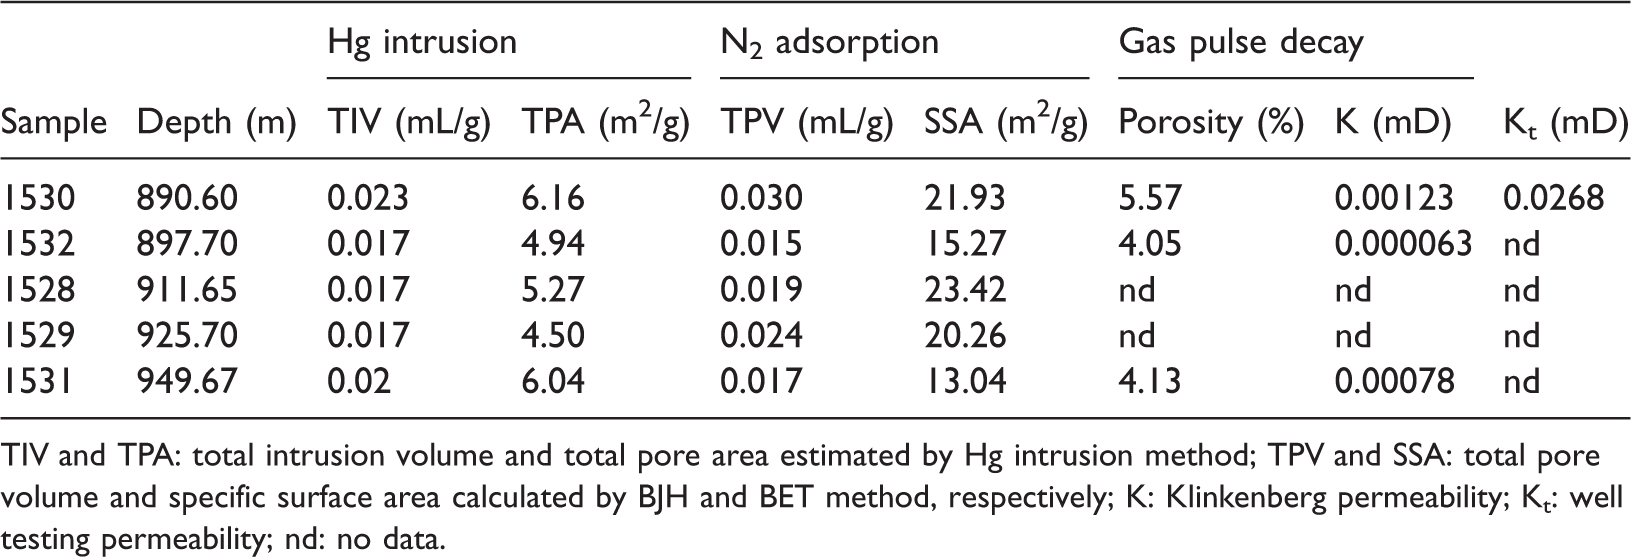
TIV and TPA: total intrusion volume and total pore area estimated by Hg intrusion method; TPV and SSA: total pore volume and specific surface area calculated by BJH and BET method, respectively; K: Klinkenberg permeability; Kt: well testing permeability; nd: no data.
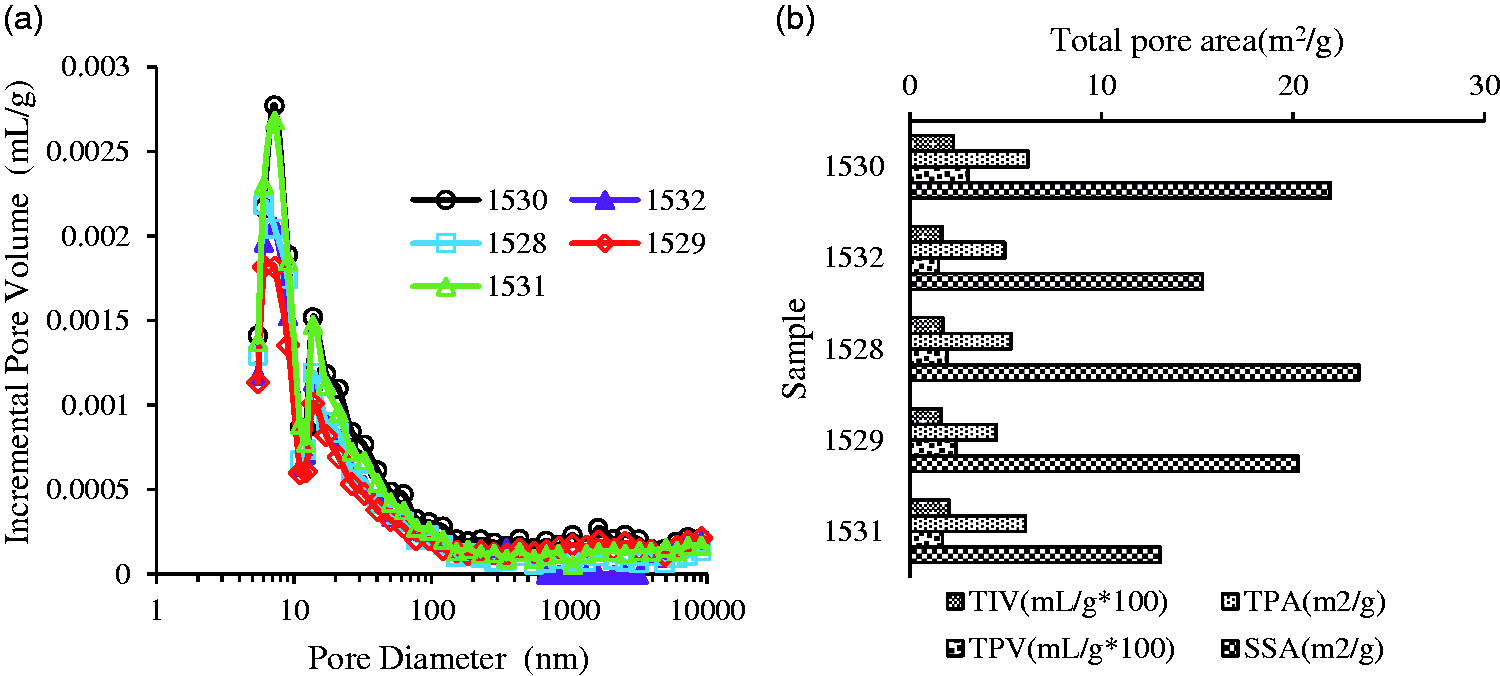
Incremental pore volume versus pore diameter (a), pore volume and surface area distribution according to Hg intrusion and low pressure N2 adsorption method (b).
Permeability, consisting of both matrix permeability and fracture permeability, defines the level of transportability of gas in coal. Permeability of a coal seam can be measured in the field (in situ) or in the laboratory. The in situ permeability can be measured in the bore hole using field-based techniques, and the matrix permeability can be measured in the laboratory using cylindrical coal sample without cleats. According to the gas pulse decay method, the permeability of three coal samples ranges largely from 0.000063 mD to 0.00123 mD (Table 3). The well testing permeability for only a coal seam (889.10–890.60 m) is 0.0268 mD that is more than 20 times the pulse permeability. Generally, the permeability decreases exponentially with the confining pressure (Somerton et al., 1975). These coal seams are of low permeability, and the effective reservoir stimulation is required for CBM development.
Gas content
Total average gas contents of all coal samples vary from 4.52 cm3/g (896.90–897.70 m) to 14.13 cm3/g (889.10–890.60 m) (Table 4). There are large differences between individual canisters of coal samples. Looking qualitatively at the data, samples with higher surface area and pore volume generally have higher gas contents. Figure 3 shows the relationships between gas content (desorbed, lost and total gas content) and total volume (Figure 3(a)), total pore area (Figure 3(b)), BJH total volume (Figure 3(c)) and BET surface area (Figure 3(d)) for four samples. The best correlations are observed between gas content and total volume (Figure 3(a)), and gas content and BJH total volume (Figure 3(c)); the correlations are especially strong between desorbed gas content (R2=0.96), total gas content and BJH total volume (R2=0.79). Relationships among total gas content and total volume (Figure 3(a)), gas content and total pore area (Figure 3(b)), desorbed gas, lost gas and BJH total volume (Figure 3(c)) are also positive, but weaker. Relationships between gas content and BET surface area, residual gas content and pore volume with surface area are not observed (Figure 3(d) and (e)). However, there is a good correlation between residual gas content and BET surface area, and a weaker relationship between residual gas content and BJH total volume (Figure 3(f)), possibly because of more residual gas derived from the adsorbed gas of micropores and mesopores of the coal matrix surface. There is no obvious relationship between gas content and ash content in coal seam (Figure 4(d)), which may be related to the lack of test samples.
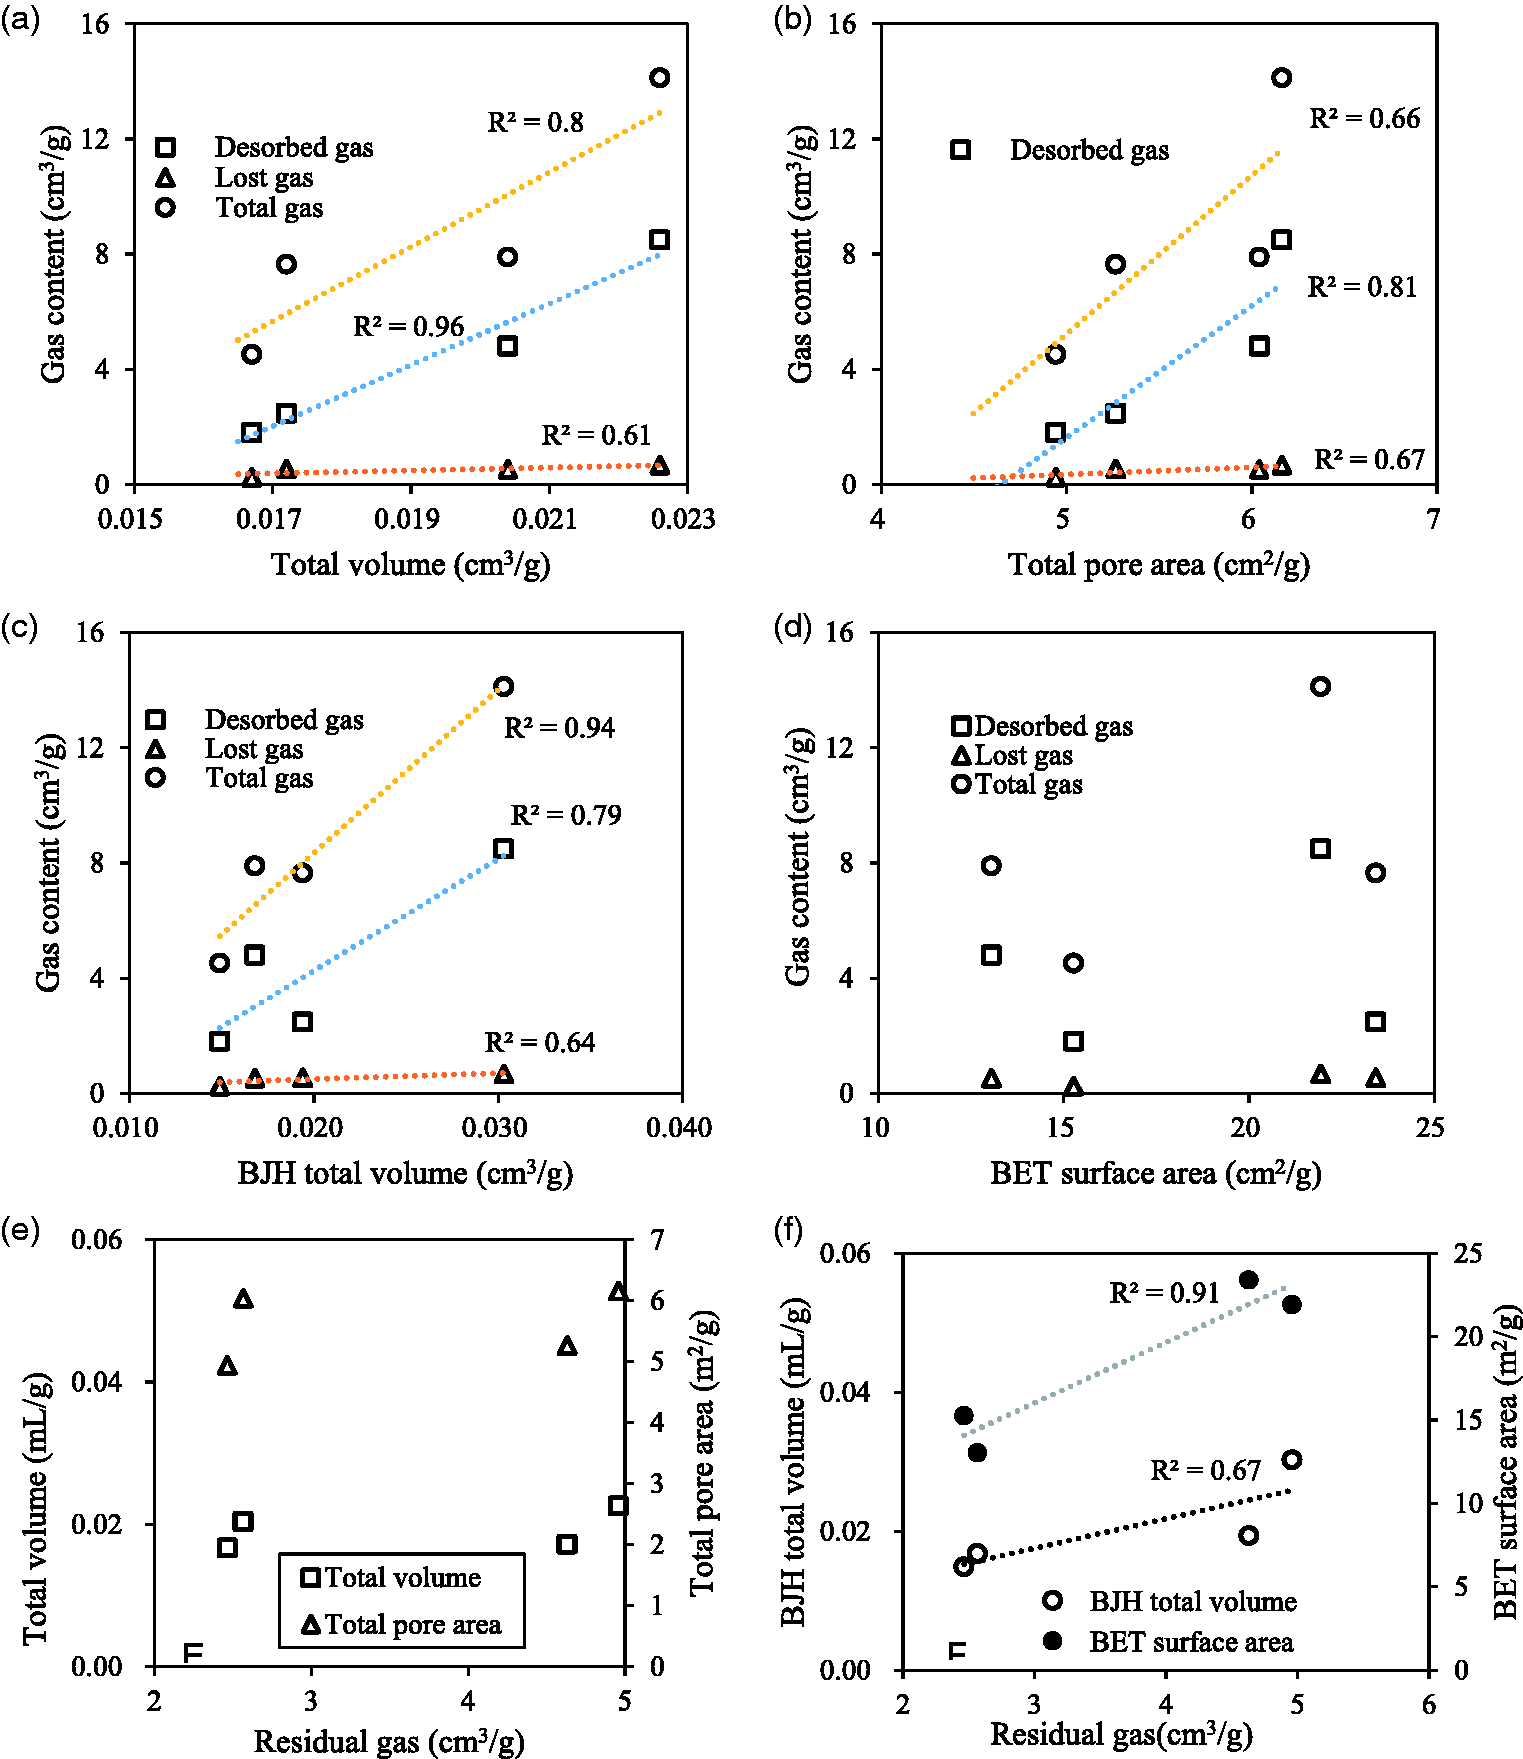
Relationship of gas content and total volume (a), total pore area by Hg intrusion method (b), and BJH total volume (c), BET surface area by low pressure N2 adsorption for all samples, weak correlation between residual gas and BET surface area and BJH total pore volume (f), and the lack of correlation of gas content and BET surface area (d), residual gas content and pore volume with surface area (e).
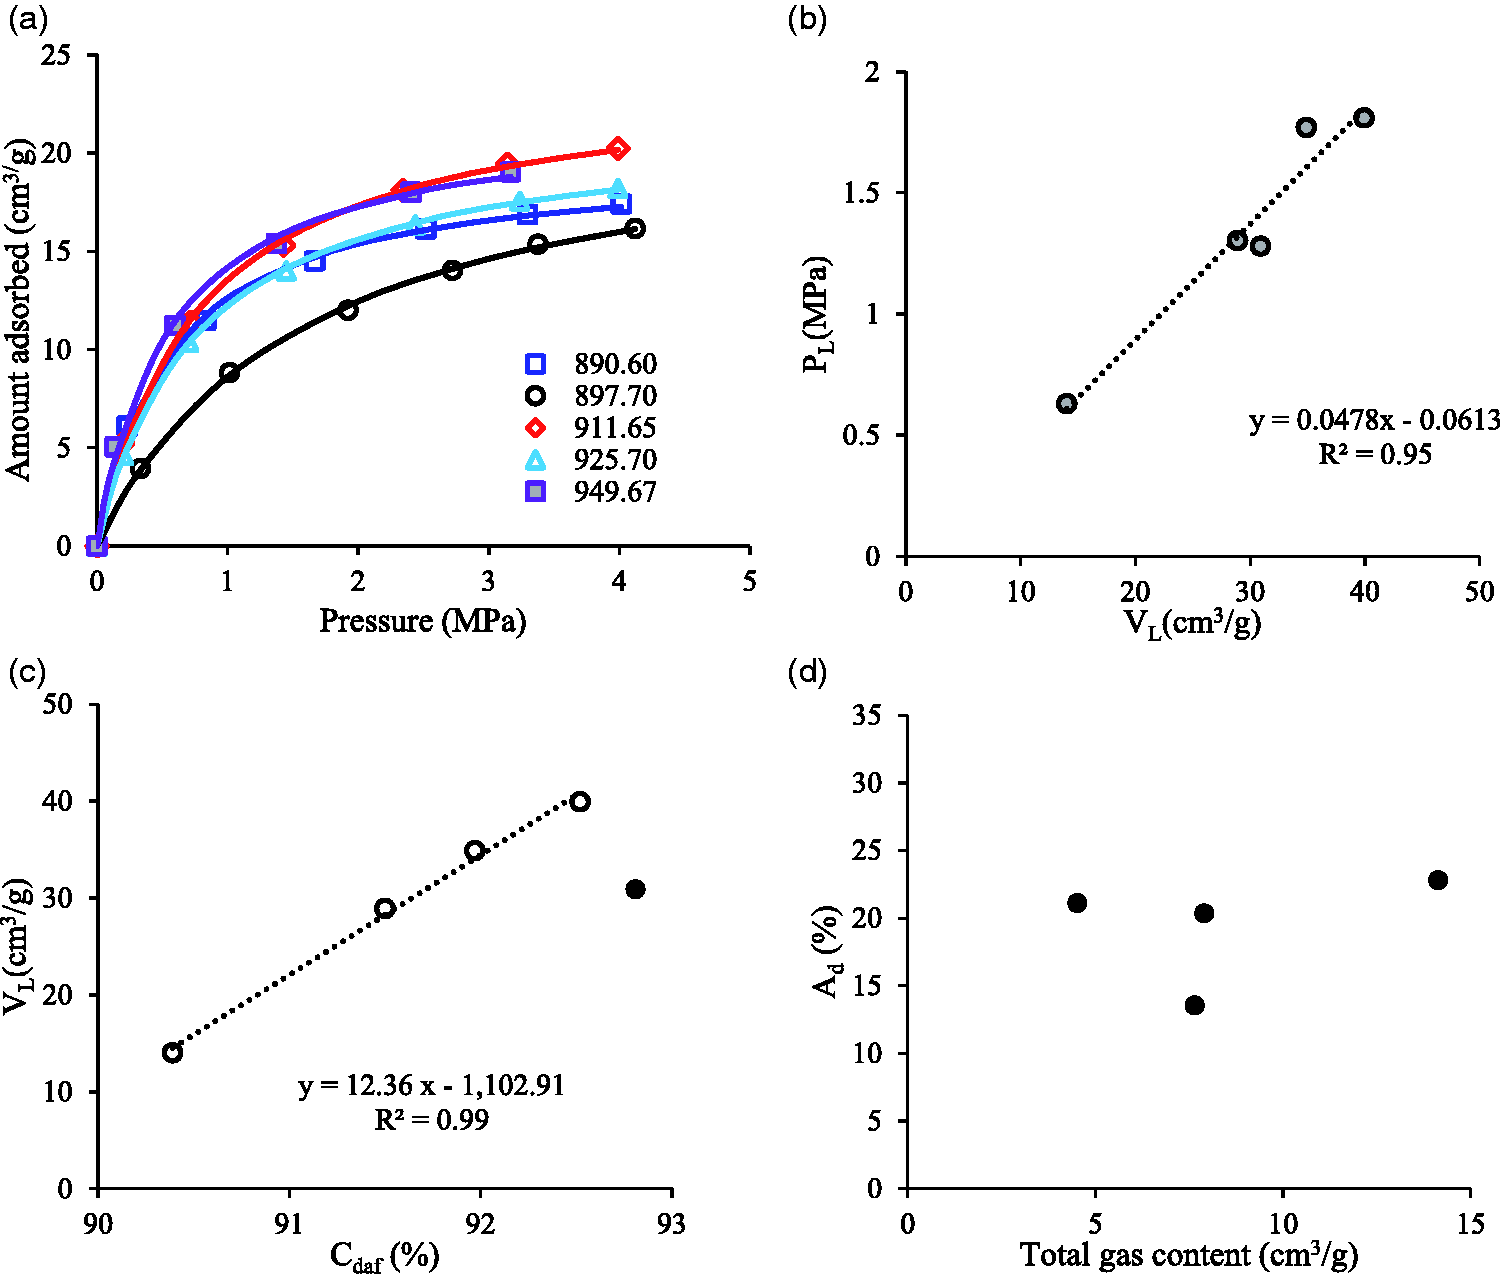
Adsorption isotherms for methane and relationship between VL and PL, Cdaf. (a) Adsorption isotherms for methane of the samples at 30°C. (b) Langmuir pressure (PL) versus Langmuir volume (VL). (c) Carbon (Cdaf) versus Langmuir volume (VL). (d) Total gas content versus ash content (Ad).
Gas content (obtained by canister desorption) of the coal samples.
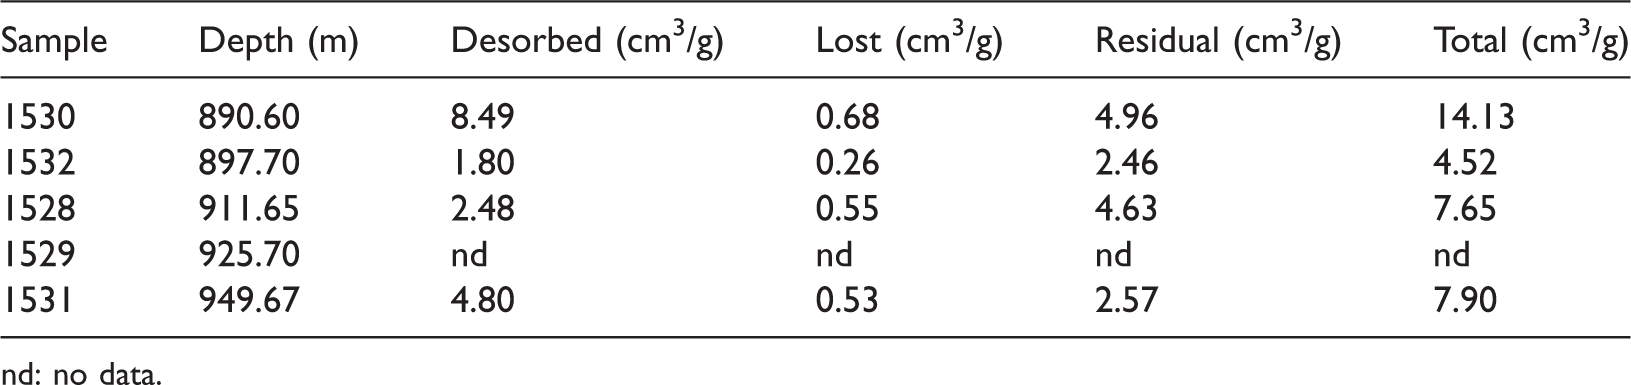
nd: no data.
Both the Langmuir volume (VL) and the Langmuir pressure (PL) of the five coal samples were measured. The VL values are in the range from 14.02 cm3/g to 39.93 cm3/g with an average of 29.73 cm3/g. Figure 4(a) shows that the methane adsorption isotherms of samples cross at different depths in all samples, yet they are superimposed on each other in some samples. Obvious trend exists between the VL and PL (Figure 4(b)), and a positive correlation has previously been recorded in low-rank coals (Jian et al., 2015). Furthermore, there is a significant positive correlation between the VL and Cdaf in the samples with a high linear fitting coefficient (R2) of 0.99 if the 1528 sample (depth of 911.65 m) was rejected (Figure 4(c)), because high content of Cdaf is the main element of coal. The 1528 sample has a relative low VL, possibly because of lower vitrinite content of this coal seam than others.
Shale gas reservoir characterization
Mineralogical composition
The mineralogical results of the shale samples are given in Table 5, which demonstrates that the primary minerals are siderite, mixed illite and smectite, and quartz, while the minor ones are dolomite, anatase, albite, pyrite and other clay minerals. The clay content ranges from 19.0% up to 58.8% among the sampled cores, with an average of 35.0%, while the quartz content ranges from 7.6% to 21.5% with an average of 15.7%. Looking qualitatively at the data, three observations could be made with regard to mineral composition: (1) the dolomite content of sample GL-1 with a depth of 883.60 m is up to 33.0%; (2) samples GL-3–GL-6 have high siderite that ranges from 22.1% to 64.6% with an average of 44.2%, and two samples (GL-4, GL-7) may be of industrial value with the siderite over 50% and (3) the anatase has been found with a range of 5.1%–9.7% except for the samples GL-4 and GL-7.
Mineral composition of Permain coal-bearing shale samples (wt%).
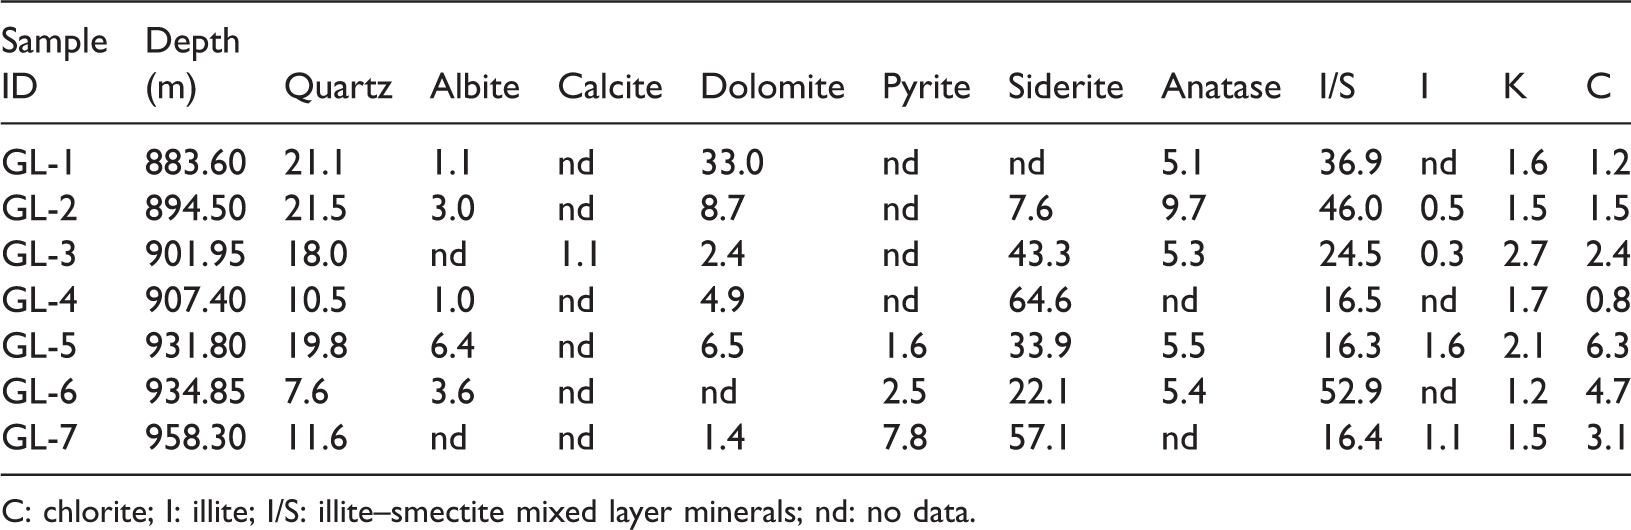
C: chlorite; I: illite; I/S: illite–smectite mixed layer minerals; nd: no data.
Organic geochemistry
Shale geochemistry analysis is key for recognizing organic matter, maturity, depositional environmental and gas potential. The shales deposited in transitional to continental environment is different from the marine shales commonly deposited in deep shelves, such as Barnett and Marcellus shales in the USA and Longmaxi shales in south China. The experimental results show gas generation potential of the coal-bearing shales in the study area has the following characteristics: (1) the average TOC of all samples ranges from 0.90% to 2.71% (Table 6) with an average of 1.55%; (2) the Tmax values range from 601°C to 605°C, which indicates that the shales are in the postmature zone, according to Peters and Cassa (1994) and (3) the RO values are all high, and range between 3.66% and 3.73% with an average of 3.69%. RockEval™ data show that the organic matter is generally type III kerogens according to the parameters of TOC, hydrogen index (HI) and S2 values (Peters and Cassa, 1994).
Geochemical data from well LC-1#.
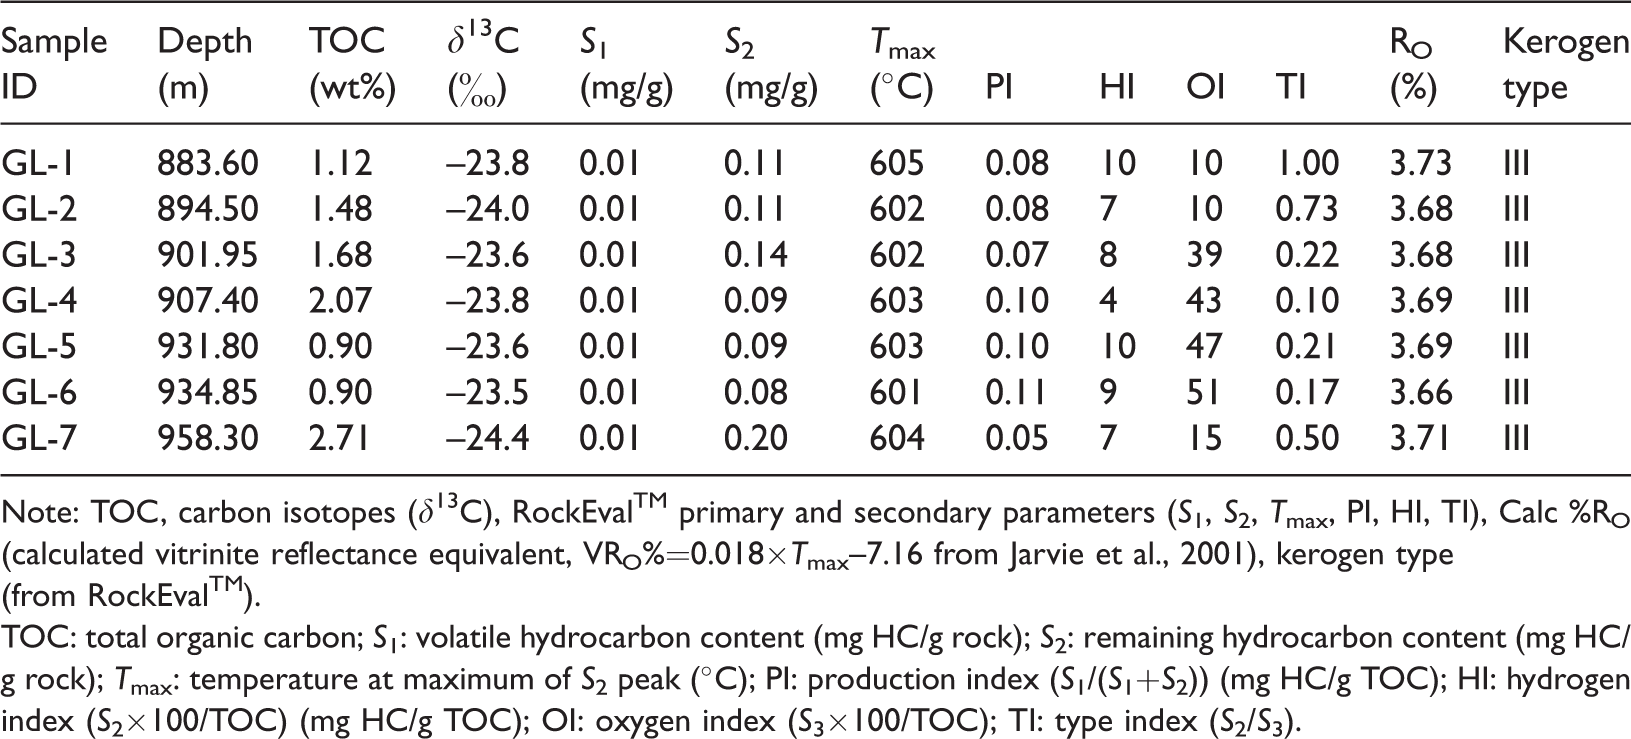
Note: TOC, carbon isotopes (δ13C), RockEval™ primary and secondary parameters (S1, S2, Tmax, PI, HI, TI), Calc %RO (calculated vitrinite reflectance equivalent, VRO%=0.018×Tmax–7.16 from Jarvie et al., 2001), kerogen type (from RockEval™).
TOC: total organic carbon; S1: volatile hydrocarbon content (mg HC/g rock); S2: remaining hydrocarbon content (mg HC/g rock); Tmax: temperature at maximum of S2 peak (°C); PI: production index (S1/(S1+S2)) (mg HC/g TOC); HI: hydrogen index (S2×100/TOC) (mg HC/g TOC); OI: oxygen index (S3×100/TOC); TI: type index (S2/S3).
The stable carbon isotope (δ13CPDB) is an effective parameter for determining the origin of organic matter because of its good thermal stability. The organic matter with an origin of higher terrestrial plants rather than lower aquatic organisms has heavier stable carbon isotopes. The δ13C value for shale samples ranges from –23.5‰ to –24.4‰, which can be a further support for the predominance of type III organic matter and the origin of terrestrial plants.
Pore characteristics
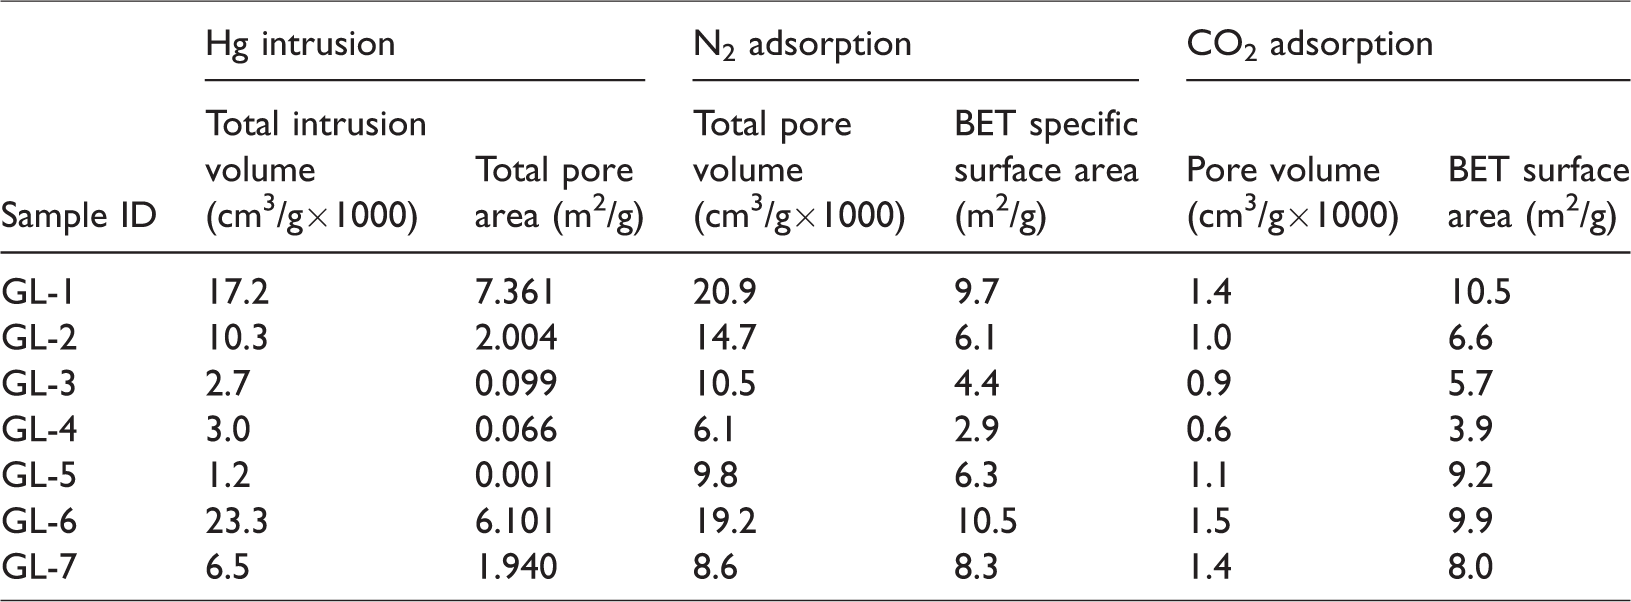
We calculated the distributions of the pore size (PSD), total pore volume and specific surface area. Table 7 summarizes the results of the Hg intrusion, low pressure N2 and CO2 adsorption analysis.
Pore parameters using Hg intrusion and N2-CO2 adsorption for the Permain coal-bearing shale samples.
The Hg intrusion results are shown in Figure 5(a). It is obvious that the incremental pore volume is lower than 0.0005 mL/g when the pore diameter is greater than 10–20 nm. As shown in Figure 5(a), incremental pore volume decreases when the pore diameter increases, especially when the pore diameter is below 10–20 nm. This phenomenon may be caused by conformance error, as suggest by Richard (2009). The conformance error for pore radius below 10 nm is corrected by subtracting the cumulative pore volume at the lowest pressure from the intrusion at the pore radius of 50,000 nm. Due to blank effects (Richard, 2009), compression of mercury and the pores’ close- and -open limitation of the Hg intrusion test, obtaining the macropore is more reliable. The micropores and mesopores can be more accurately measured by low pressure N2 and CO2 tests (Bustin et al., 2008; Kuila and Prasad, 2013).
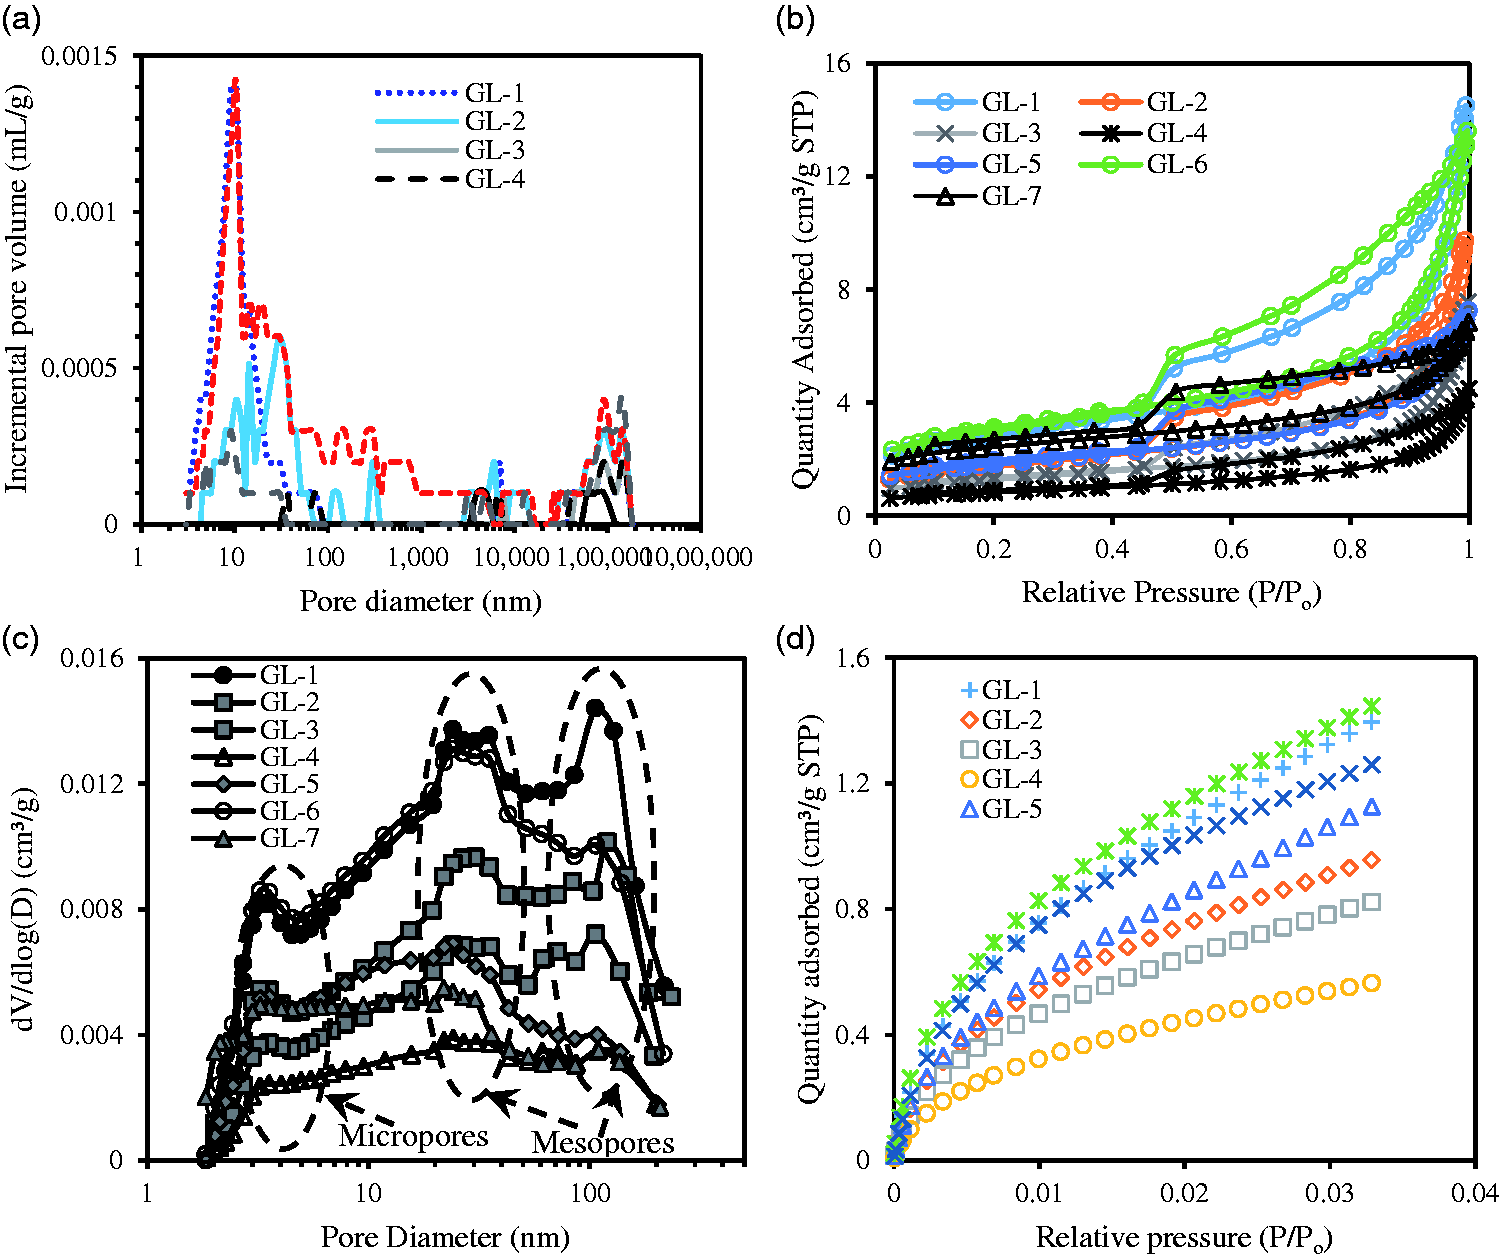
(a) Incremental pore volume versus pore diameter by Hg intrusion, (b) nitrogen gas adsorption and desorption isotherms, (c) pore size distribution from N2 adsorption with BJH model and (d) CO2 adsorption isotherms for all samples.
Figure 5(b) shows the adsorption and desorption branches of the low-pressure liquid nitrogen adsorption experiment, which are anti “S” type as a whole. A close examination of the hysteresis loops for the seven samples reveals that all of them are type H3 and type H4, which are usually associated with aggregates of plate-like particles giving rise to slit-shaped pores surrounded by clay platelets (Figure 6(a) and (c)) (Bu et al., 2015; Kuila et al., 2014; Sing, 1985; Wang et al., 2015a). The type H3 loop also indicates that the coal-bearing shale samples contain well developed mesopores (2–50 nm). The PSD calculated from N2 adsorption branch is presented in Figure 5(c). The samples show a multi-modal with major peaks centered at 3 nm and 20–100 nm. The pore volumes of these Longtan shales are mostly attributed to mesopores and macropores with little contribution from pores with diameters larger than 100 nm.
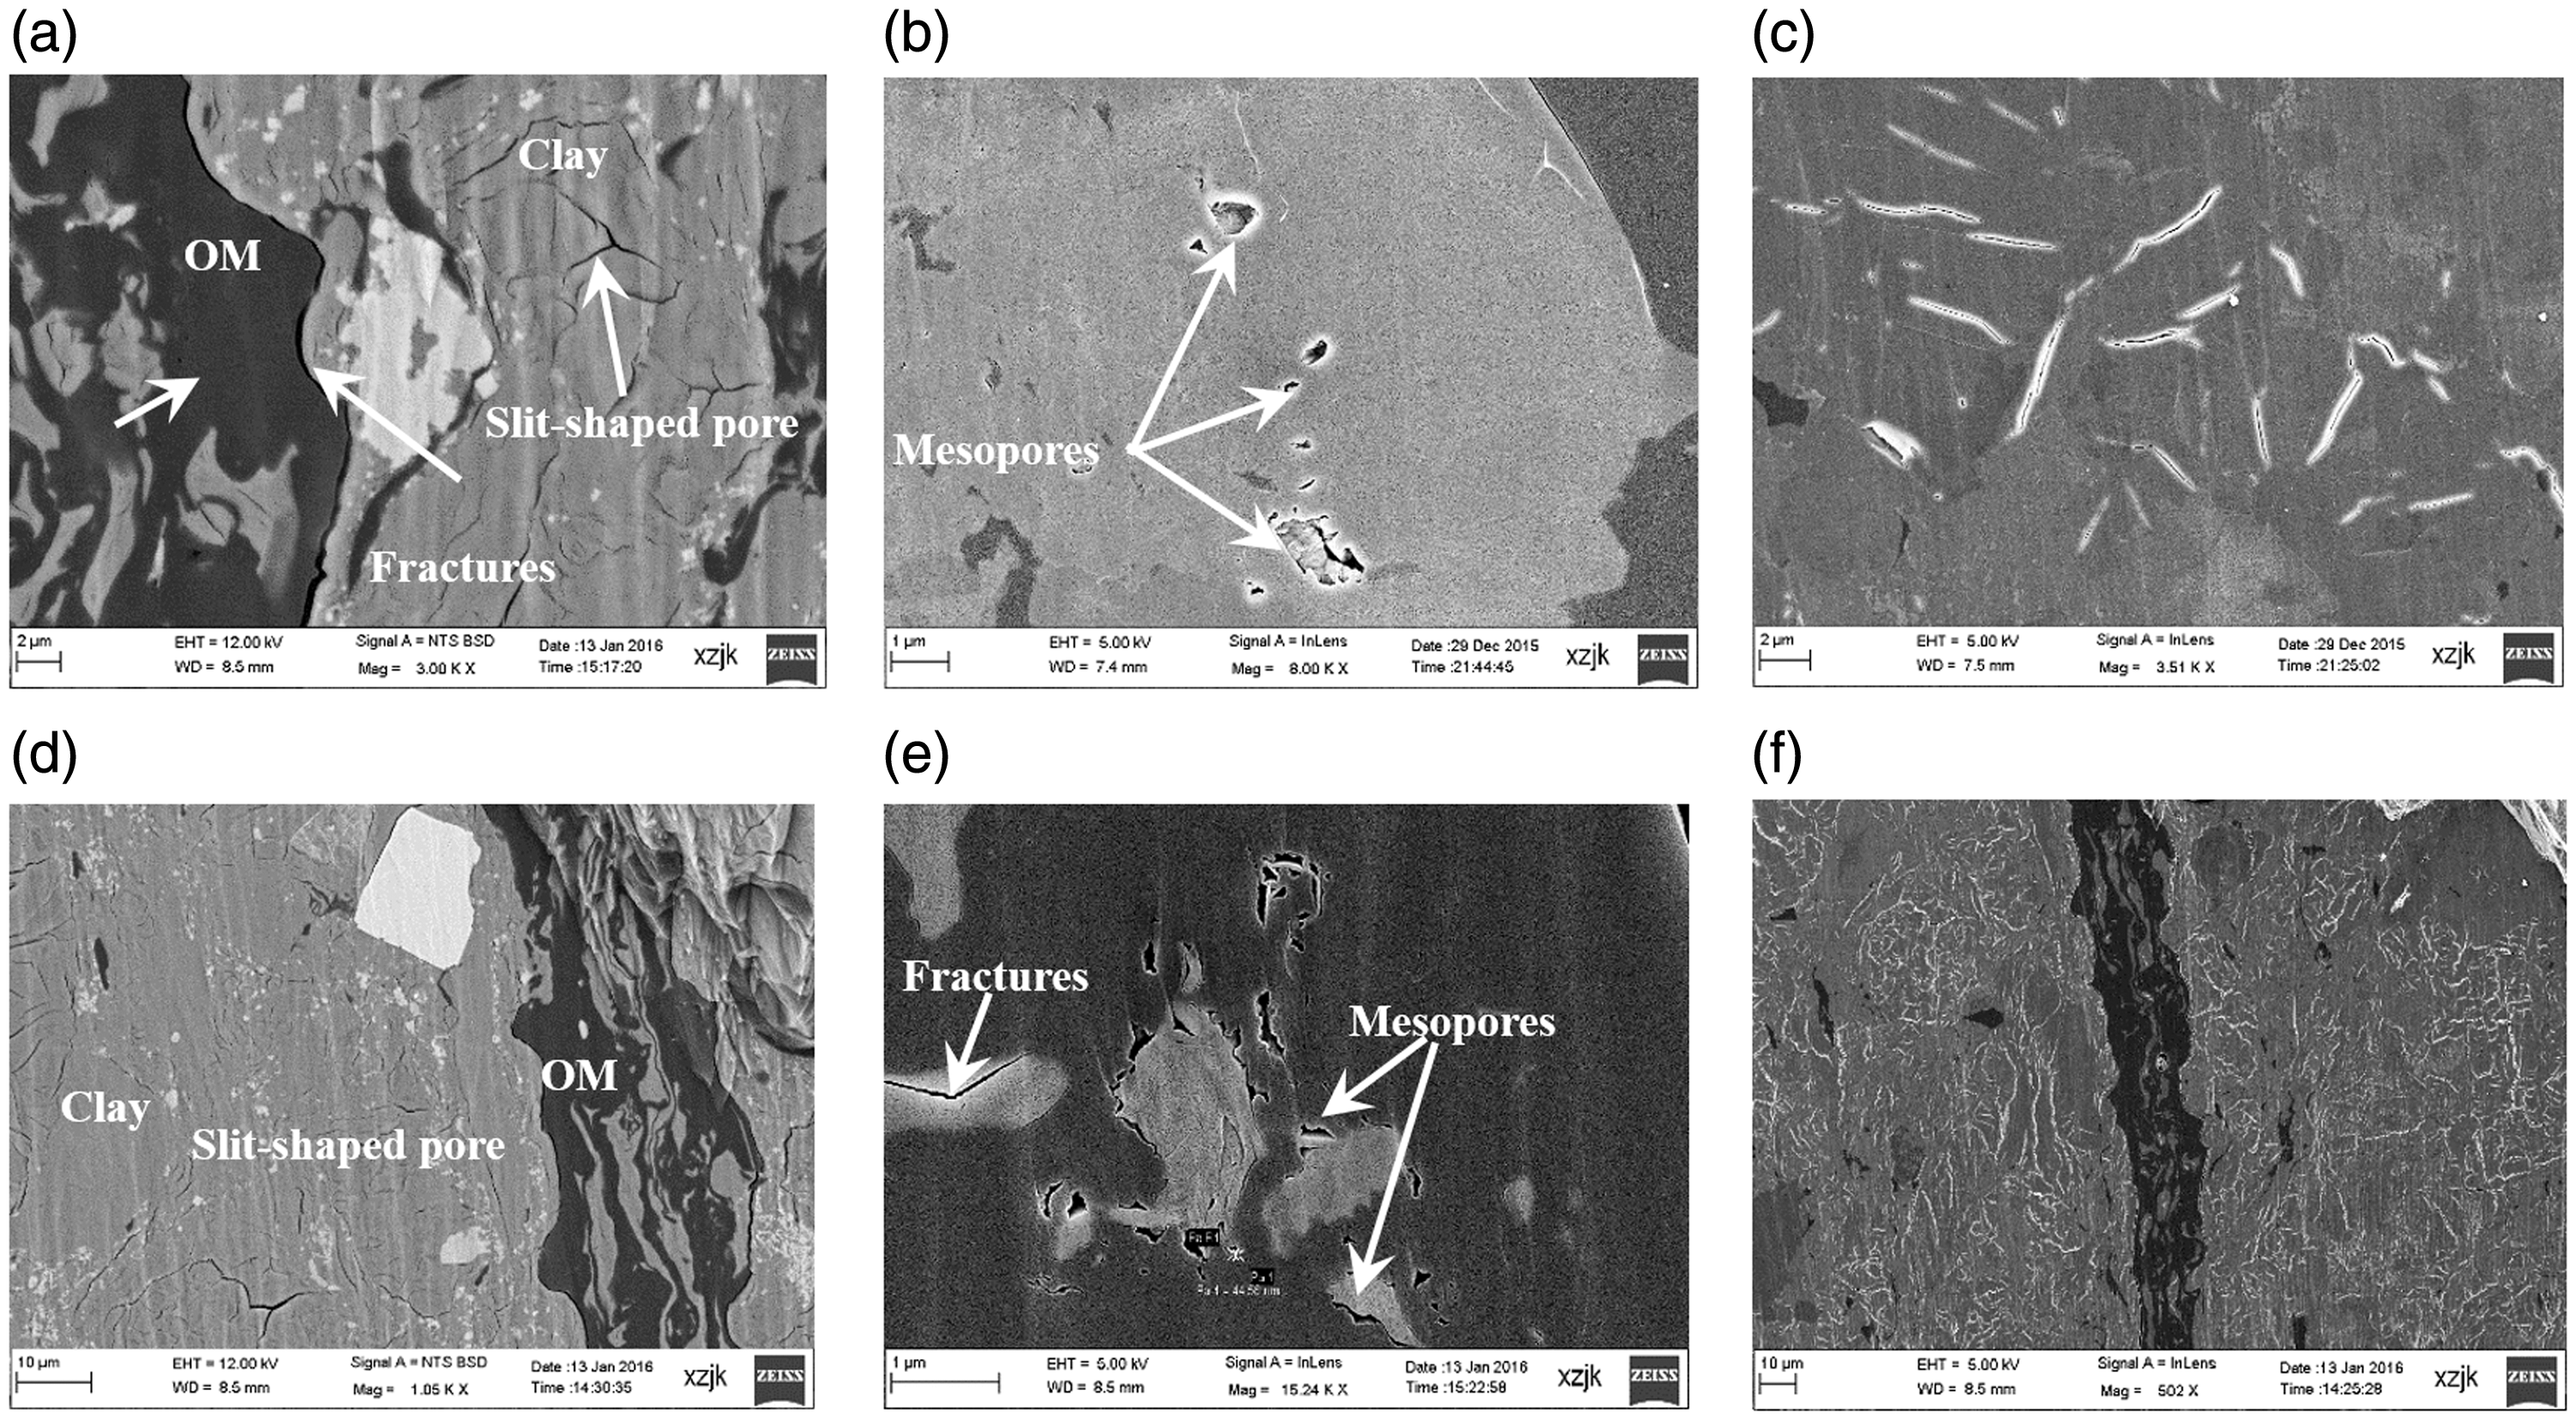
FESEM images of coal-bearing shale samples form the Linhua mining field, China. (a) Slit-shaped pores in clay minerals and natural fractures related to OM-clay aggregate; (b) mesopores related to quartz with filled partly; (c) slit-shaped pores in clay minerals and banded OM; (d) natural fractures related to quartz grains and grain edge; (e) natural fractures related to quartz grains and (f) abundant natural fractures at low resolution.
The isotherms found from the low-pressure CO2 analysis were presented in Figure 5(d), indicating microporosity. Among all the shale samples, GL-6 and GL-1 display the highest amount of adsorption, compared to other samples, and the GL-4 sample exhibits the least adsorption (0.6 × 10⁻³ cm3/g) with the smallest surface area, suggesting little microporosity. GL-6 and GL-1 (9.9 m2/g and 10.5 m2/g, respectively) have the highest micropore surface area (Table 7). There is also a substantial variation in micropore volume as determined from CO2 adsorption analysis. The GL-6 (1.5 × 10⁻³ cm3/g) shows the highest micropore volume, and GL-4 shows the smallest among all the samples.
The trends in Figure 7(a) demonstrate that TOC is negatively correlated with specific surface area (except for the GL-7 sample). This observtion suggests that organic matter is not the most important factor that influences the specific surface area of the Longtan shales. FESEM images of the coal-bearing shale samples show that organic matter is distributed with banded and lumpy shape, but a few organic matter pores were found (Figure 6(a)). That may be related to excessive maturity of these shales with little generated liquid hydrocarbons (e.g. clay minerals) (Luo et al., 2018). Figure 7(b) reveals a certain degree of positive correlative trend between clay minerals and specific surface area, which means the clay minerals play an important role in contributing to pore surface area and volume (Figure 6(a) and (c)). This relationship has also been found in other coal-bearing shales of marine–continental transitional environment (Pan et al., 2017; Wang et al., 2015a). In summary, the interparticle pores of clay minerals constitute major contributors to mesapores in the Longtan shales in this study. Abundant natural fractures are observed under the electron microscope at low resolution, and their form is varied (Figure 6(a), (d) to (f)), although the sizes are generally on the micron scale. These fractures related to organic matter-clay aggregates or quartz grains are usually provided storage space for free gas with macropores.
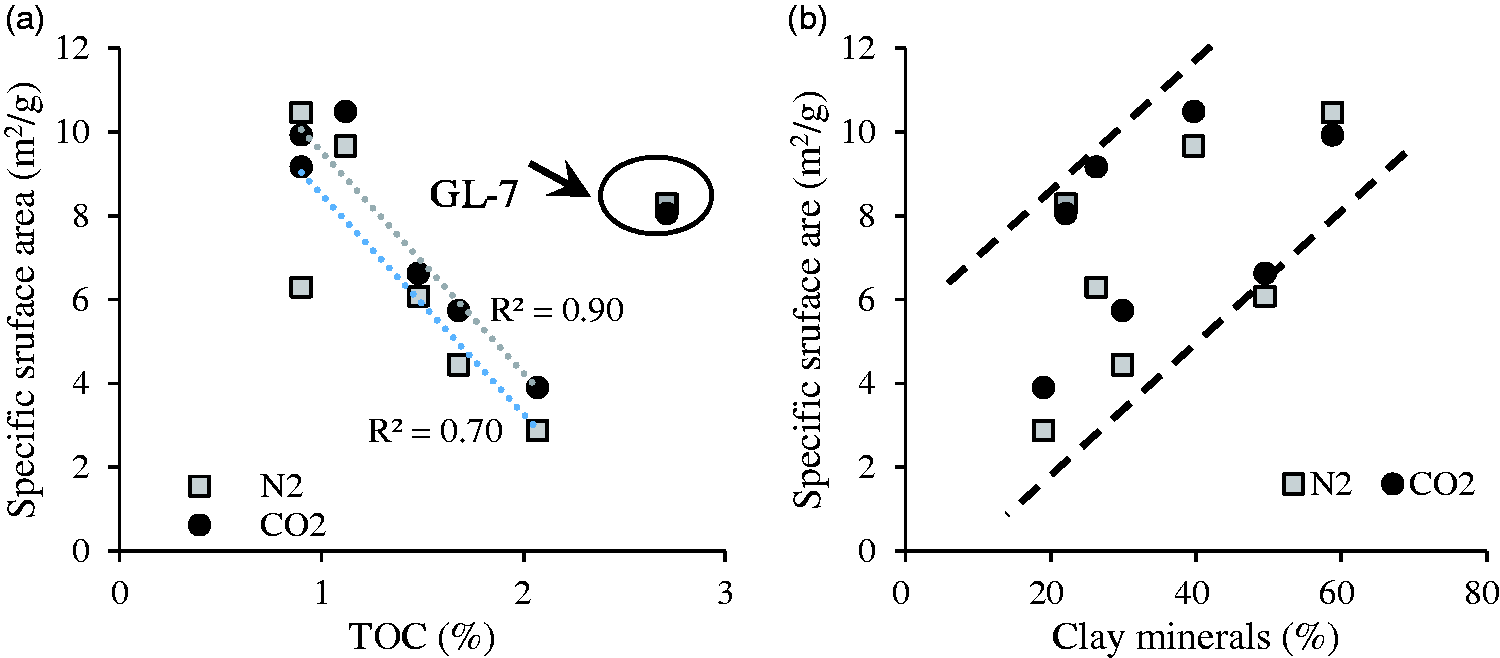
Correlation between specific surface area and (a) TOC and (b) clay minerals.
Gas content
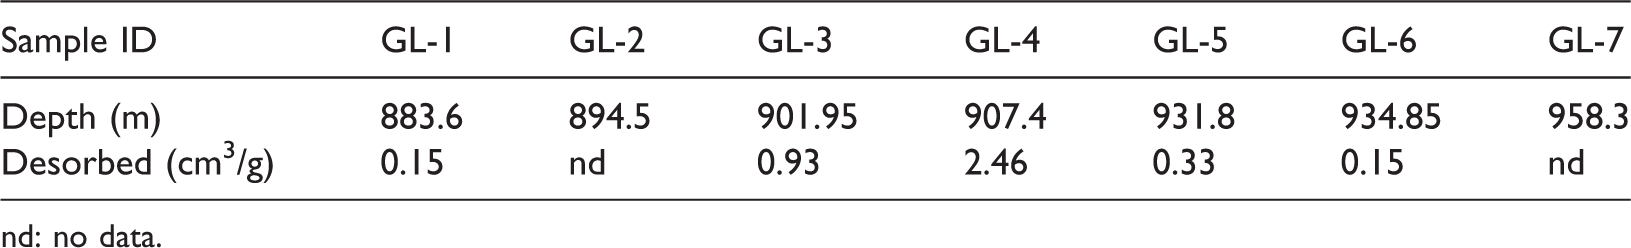
Total average gas contents (desorbed gas) of the Longtan shales vary from 0.15 cm3/g to 2.46 cm3/g with an average of 0.80 cm3/g (Table 8). For the GL-4 sample with high TOC (Table 6), very low specific surface area and pore volume (Table 7), but it has the largest amounts of gas (Table 8). Samples that have high surface area and pore volume do not necessarily have high gas contents. For example, the GL-6 sample (934.85 m) has high surface area and volume (Table 7) but has very low desorbed gas content (Table 8), possibility because of gas migration into fractures, or overlying, more permeable clastic sediments or other unknown reasons.
Desorbed gas content (obtained by canister desorption) of the shale samples.
nd: no data.
Figure 8 shows the relationships between desorbed gas content and pore parameters (Figure 8(a) and (b)), TOC (Figure 8(d)) and minerals (Figure 8(c) and (e)), and the relationships are all negative except for the correlation between desorbed gas content and TOC. The reasons for these inter-canister variations are not well understood. We speculate that these relationships between desorbed gas content and pore, mineral composition may indicate a significant contribution of free (not adsorbed) gas to the desorbed gas content. The gas generated by organic matter is generally less than 1.0 cm3/g and may migrate from the surface of coal matrix with an adsorbed state to the fractures with a free state. It has been suggested that for shales, the free gas makes up 40%–60% of the total reservoir gas capacity (Bowker, 2007; Brittenham, 2010). At the deeper location, the contribution of free gas may be larger, because of the increasing pressure. Perhaps, the desorbed gas (mainly free gas) occupies the cleat and fractures not quantified by nitrogen or CO2 adsorption tests. The abundant natural fractures have been found in Figure 6(a), (c), (e) and (f). Moreover, the relationship between desorbed gas and TOC is well positive with a correlation coefficient of 0.86 (R2) (Figure 8(d)), indicating that the gas is generated from the organic matter. Furthermore, the siderite shale blocks the escape of free gas as an impermeable gas barrier with low porosity and permeability. This may be the reason for the positive relationship in (Figure 8(e)).
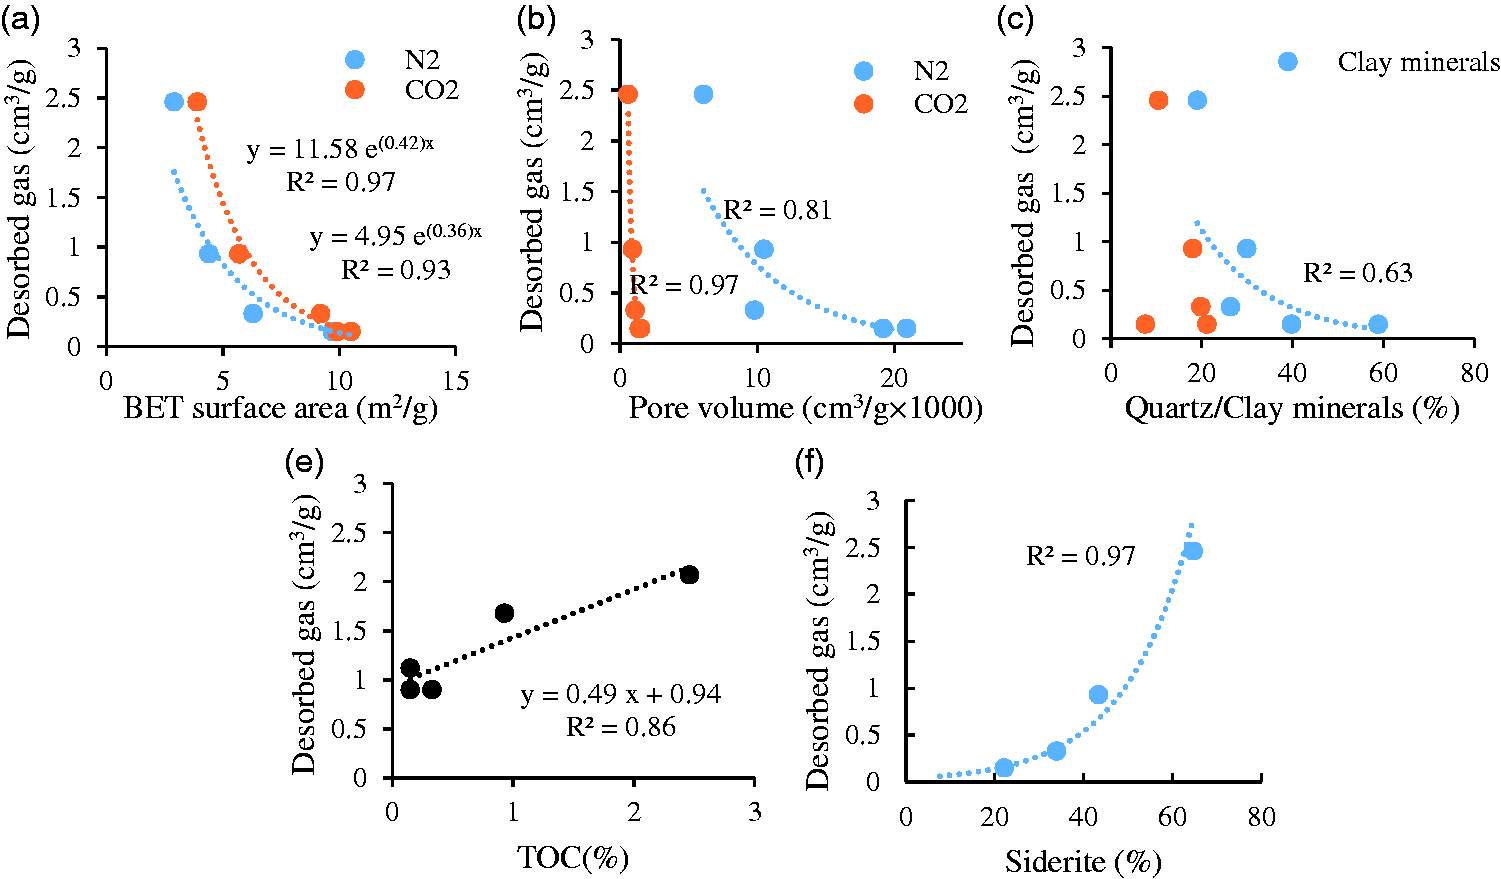
Relationship of desorbed gas content and specific surface area, pore volume, quartz/clay/siderite minerals.
Paleo-redox proxies of trace elements
Several trace elements and rare earth elements, such as V, Sr, Ba, Eu, Ce, V/(V+Ni), V/Cr, Sr/Ba (Crusius et al., 1996; Jones and Manning, 1994), have been considered as indicators of redox conditions for restoring the depositional environment. The Longtan shales have V/(V+Ni) ratios ranging from 0.63 to 0.86, with an average of 0.77; V/Cr ratio between 0.86 and 2.55, with an average of 1.91; Sr/Ba ratio between 1.21 and 2.27, with an average of 1.61; δEu between 0.95 and 1.56, with an average of 1.33; δCe between 0.82 and 0.88, with an average of 0.86; Ceanom between –0.08 and –0.05, with an average of –0.06 (Table 9).
Results of trace elements from ICP-MS, all reported as ppm (parts per million).
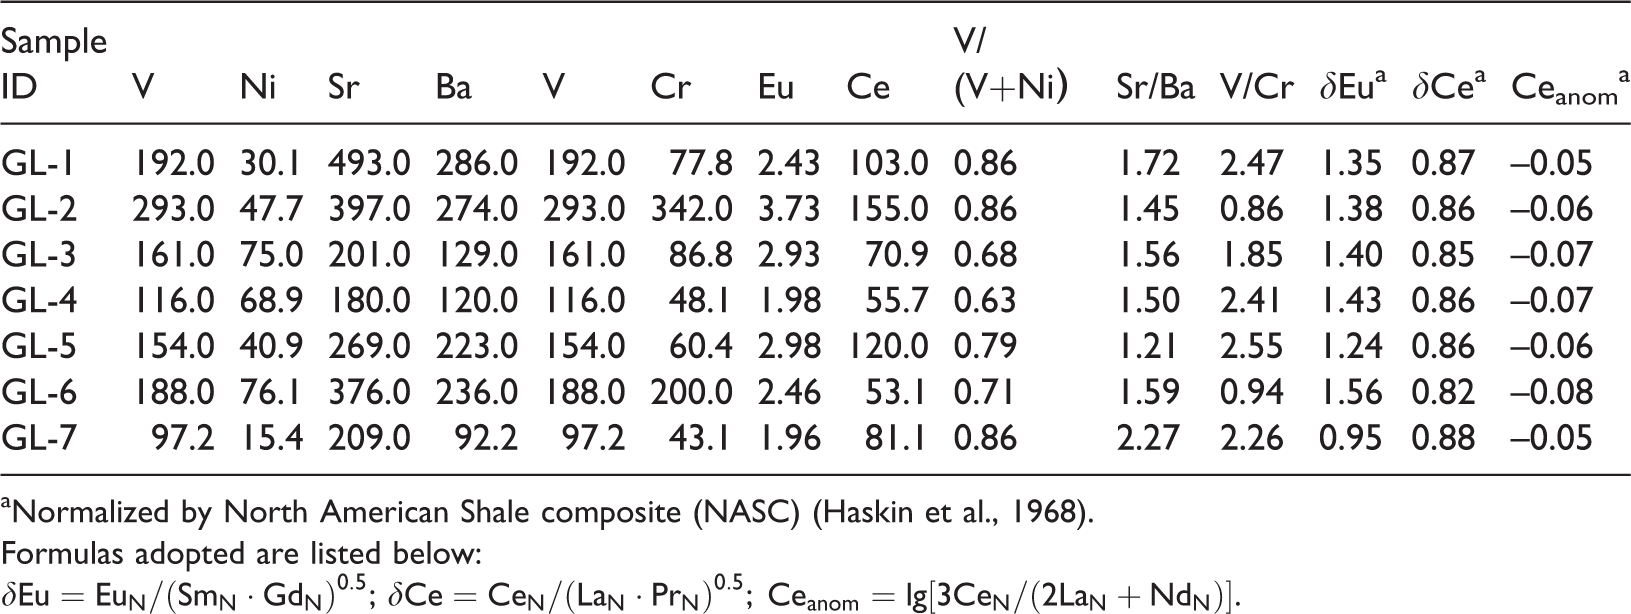
aNormalized by North American Shale composite (NASC) (Haskin et al., 1968).
Formulas adopted are listed below:
Discussion
Depositional environment of the coals and shales
The studied well LC-1#, located in the northern Guizhou, mainly experienced a process of transgression–regression–transgression from early Permian to late Permian. The complex and wide coastal zone affected by continuous changes of marine transgression and seawater retreat, provided favorable conditions for the coal accumulating in the Longtan Formation (Shao et al., 1998). The lack of early Longtan Formation may be indicated that the deposited strata were relatively far away from the coast without coal or due to the uplift and denudation. The seawater activity gradually strengthened after the No. 15 coal seam formed, and the limestone B4 represented a fast transgression event (Figure 1), which corresponded to the largest transgression in late Permian in western Guizhou (Wang et al., 2008). Then, the regressive period of seawater started with fluviation. Slowly transgression after No. 10 coal seam deposited is corresponded with transgressive process of the late Longtan and Changxing stage in western Guizhou, which indicated developed limestone in sedimentary sequence. In this stage, coal depositional environment was dominated by lagoon and tidal flat system (Chen et al., 2013). However, element geochemistry of these coals was not implemented to understand the depositional setting of theses coals. In this study, only sulfur content and some inorganic mineral proxies of coals will be discussed.
The variation of sulfur content of different coal seams in the vertical direction reflects the impact of coal seam affected by seawater activity. There is a strong linear correlation between pyrite sulfur content and total sulfur content except for No. 15 coal seam, but there is no correlation between organic sulfur and total sulfur content (Figure 9), indicating that the inorganic sulfur is the important cause of the sulfur content of coal seam with terrestrial sources.
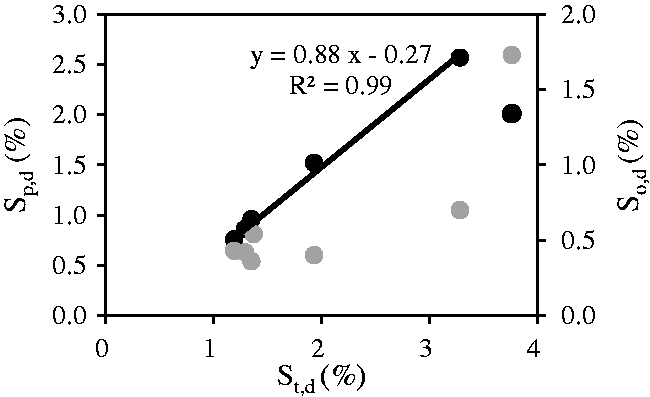
Relationship of total sulfur content and mineral and organic sulfur content (dried basis, each data point is the average of all tested samples).
Coal ash mainly comes from foreign substances (coal-forming period and/or late metamorphism) and a small amount from coal plants. Thus, the variation of ash content in coal is related to the paleogeographical environment of sedimentary period, which can be one of the auxiliary factors for depositional environment. The gray component index (Fe2O3+CaO+MgO)/(SiO2+Al2O3) was used as the discriminant parameter of the coal accumulating environment (Yi et al., 2007; Dai et al., 2005). The Linhua coal mining field was indicated to be anoxia and weak reducing environment according to gray component index changed from 0.12 to 0.38. The percentage content of three components such as Al2O3+SiO2, CaO+MgO, Fe2O3+SO3 in the coal ash composition was used as the three terminal elements for the triangular diagram (Figure 10). The data points displayed are close to the terminal element of “Al2O3+SiO2”, which reflects the terrigenous sediment source with high clay mineral content and weak deoxidized environment of coal accumulating near the terrigenous facies (Yi et al., 2007).
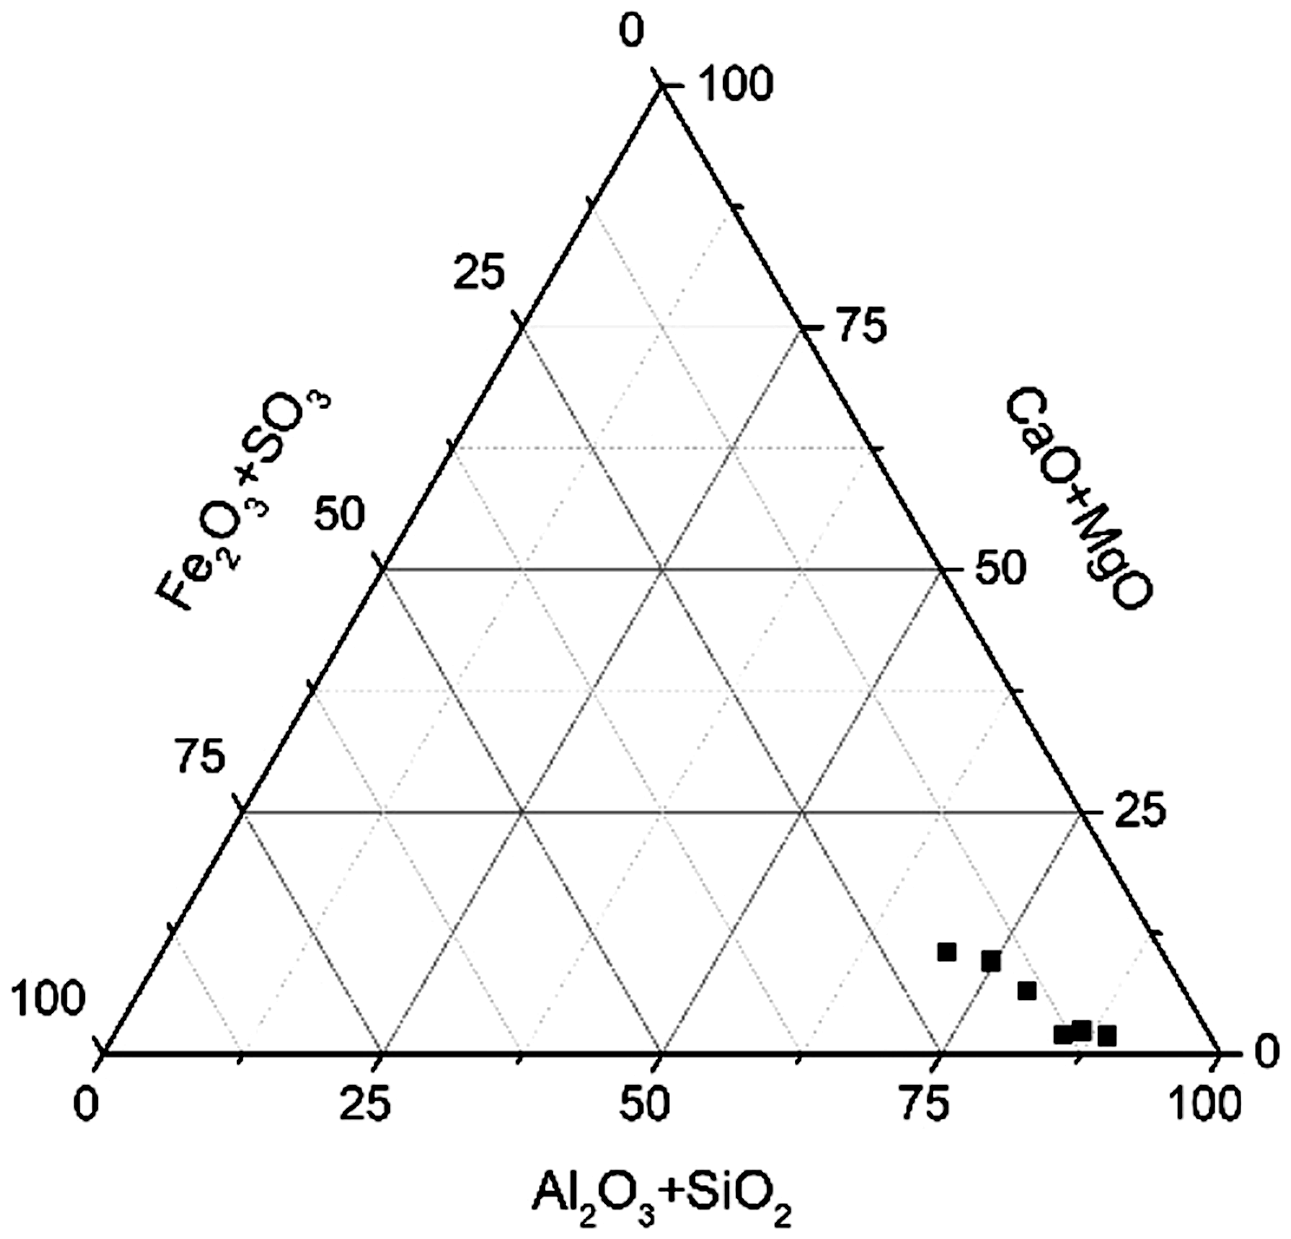
Triangular diagram of ash compositions for Longtan coals from well LC-1#, Guizhou (dried basis, each data point is the average of all tested samples).
Generally, throughout the whole period of Longtan shale deposition, terrestrial and marine organic matter was supplied to a range of transitional environment. The trace elements have certain referential significance to the recovery analysis of sedimentary environment (Jones and Manning, 1994). However, only the mudstone samples were carried out on element analysis. Pi et al. (2014) used the V/(V+Ni) ratios of more than 0.8 and 0.6, respectively, to indicate strong reducing conditions. Longtan mudstone from well LC-1# displays V/(V+Ni) ratios between 0.63 and 0.86 with an average of 0.77 (Table 9), which is indicative of less reducing conditions with anoxic bottom water. According to Galarraga et al. (2008), a V/Ni ratio higher than 3 indicates the deposition of organic matter under reducing conditions, while V/Ni ratios ranging between 1.9 and 3 indicate deposition under suboxic conditions. The V/Ni ratios in the Longtan mudstones from well LC-1# range between 1.68 and 6.38, indicating that these mudstones were deposited under alternate suboxic and reducing conditions. High Sr/Ba ratios (>1) and V/Cr ratios (>2) indicate anoxic salt water conditions. For the Longtan shales in this study, the ranges of the Sr/Ba and V/Cr (averages of 1.61 and 1.91) suggest that these shales are of the Longtan Formation under suboxic or anoxic conditions (Kimura and Watanabe, 2001). Especially, the V/Cr ratios in the vertical changes may possibly reflect the periodic variation of sea levels. GL-1 samples and GL-7 samples have the larger Sr/Ba ratios (1.72 and 2.27, respectively) and V/Cr ratios (2.47 and 2.26, respectively), corresponding to the rapid marine transgression represented by B4 limestone and the peak of marine transgressive process of the late Longtan and Changxing stage.
In addition, δEu values <1 (positive anomaly), δCe values <1 (negative anomaly) and Ceanom >–0.1 suggest anoxic conditions (Murray et al., 1990). All δEu, δCe and Ceanom values of studied shale samples in well LC-1# (1.33, 0.86 and –0.06 on average, respectively) are agreed with closed anoxic conditions. Collectively, these proxies reveal that the shales were deposited under paleo-redox conditions that were mainly anoxic. The analysis result of the V/(V+Ni) study is not perfectly in agreement with that of V/Cr, Sr/Ba, etc., which may be influenced by the content and maturity of TOC (Abanda and Hannigan, 2006; Tribovillard et al., 2006). Morever, high siderite content of these shales (Table 5) represented weak oxidation–weak reduction condition of lagoon and tidal flat (Shen et al., 2016) is the direct evidence of the closed and reductive sedimentary environment with normal seawater. However, these proxies do not reflect the alternate change of oxic and anoxic environment in the vertical direction of 958.30–883.60 m, indicating that a relatively deep water of lagoon and tidal flat environment. Although there are good preservation conditions, the terrestrial organic matter is far away, which may be one of the reasons for the lack of organic carbon.
In conclusion, the sedimentary environment of these Longtan shales is located in the anoxic tidal flat and lagoon facies in the marine–continental transitional environment, which provides good accumulation conditions for the organic matter.
Shale gas potential and reservoir quality
Kerogen type, thermal maturity and hydrocarbon potential of organic matter can be evaluated using their richness (TOC, wt%) and pyrolysis S2 yields (Peters and Cassa, 1994). The plot of TOC versus S2 for the study shales (Figure 11) shows that most of the Longtan shales fall in the fair to good zone of TOC and poor zone of S2 values. The falling zone of TOC and S2 values is inconsistent. Changes of TOC in the vertical direction (Table 6) indicate that the lithology of the Longtan Formation is significantly affected ty the sedimentary environment of the transitional facies. The interactive coal seam, shale, siltstone and silty shale provide high and low value interactions of TOC values. The thermal maturity is another important parameter for affecting these gas generation potential and gas sorption capacity. Empirically, the high values of maturity and low HI values of these Longtan shales (Table 6) suggest most of them are postmature kerogen stage with dry gas generation. Furthermore, from the RockEval™ data of the seven shale samples, Tmax values have a narrow range from 601°C to 604°C, implying a overmature evolution stage. These data are consistent with the RO values above. According to Peters (1986), Tmax>470°C marks the beginning of the wet-gas zone. It indicates that most of the Longtan shale samples fall in the gas window. S1+S2 is also an index used to evaluate hydrocarbon generation. The S1+S2 values for the shale samples vary from 0.09 to 0.21 mg HC/g rock, with an average of 0.13 mg HC/g rock (Table 6). It obviously reveals that the Longtan shale in well LC-1# has poor hydrocarbon generation potential at present. From the relationship of TOC and total hydrocarbon generation, the Longtan shale currently has very low hydrocarbon generation potential due to the postmaturity.
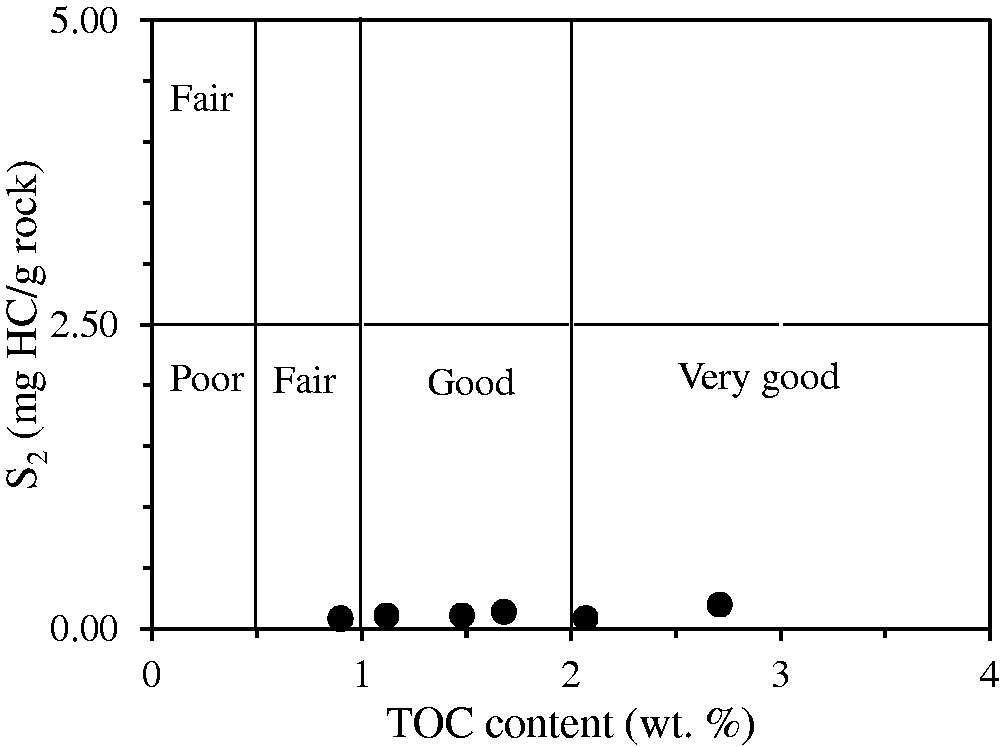
Plot of hydrogen index (HI) versus total organic carbon (TOC) showing generative source rock potential for the coal-bearing shales (from Peters and Cassa, 1994).
As previously mentioned, The Longtan mudstone deposited in a marine–continental transitional facies with a shallow water deposition, and their organic matter was derived from land and sea. The overall sediment system makes its facies and mineral composition relatively complex. The terrestrial plants were the main source of the organic matter of mudstone, and the low liptinite composition with obvious characteristics of rich carbon and poor hydrogen was the main reason of high organic content but low hydrocarbon potential. Moreover, sea-level change and turbulent seawater are all not conducive to the preservation of organic matter, resulting in a large amount of organic matter oxidation and decomposition, and poor hydrocarbon potential.
Shale reservoir quality, which is largely controlled by many parameters, is thus highly variable and inherently difficult to predict. Considering all mudstone samples collected from a single well, the mudstone potential may vary greatly, which has been shown in the neighboring study area (Juan et al., 2015; Luo et al., 2018; Yi et al., 2017). However, because the hydrocarbon potential of coal source rocks decreases with the increasing of thermal evolution, the evaluation criteria of hydrocarbon generation based on source rocks (or oil source rocks) may not be suitable for coal source rocks. According to the thermal simulation results (Qin et al., 2000), the S1+S2 values of coal rocks are generally below 20 mg HC/g in Shanxi formation, Qinshui Basin, China, but the hydrocarbon generation of these coals (RO=0.86% and 0.87%) that heated up to 500°C with anthracite stage (RO=4.45%) are as high as 226 m3/t and 160.3 m3/t. The primary hydrocarbon generation capacity of coal is very strong in the high thermal evolution stage. Therefore, in the case of high thermal evolution of coal-bearing source rocks, the decrease of hydrocarbon potential with the increasing of RO values does not indicate that the source rocks of the coal are inferior or weak source rocks (Dong et al., 2015). The classification standard based on TOC and HI (Peters and Cassa, 1994) are not applicable to coal-bearing source rocks with high or postthermal evolution stage, because of no correlation between the content of organic matter and pyrolysis hydrocarbon potential in high thermal evolution of coal-bearing source rocks (Chen et al., 1997). The new describing has been proposed by Dong et al. (2015). As shown in Figure 12, most source rocks have fair to good shale gas resource potential according to the new classification.
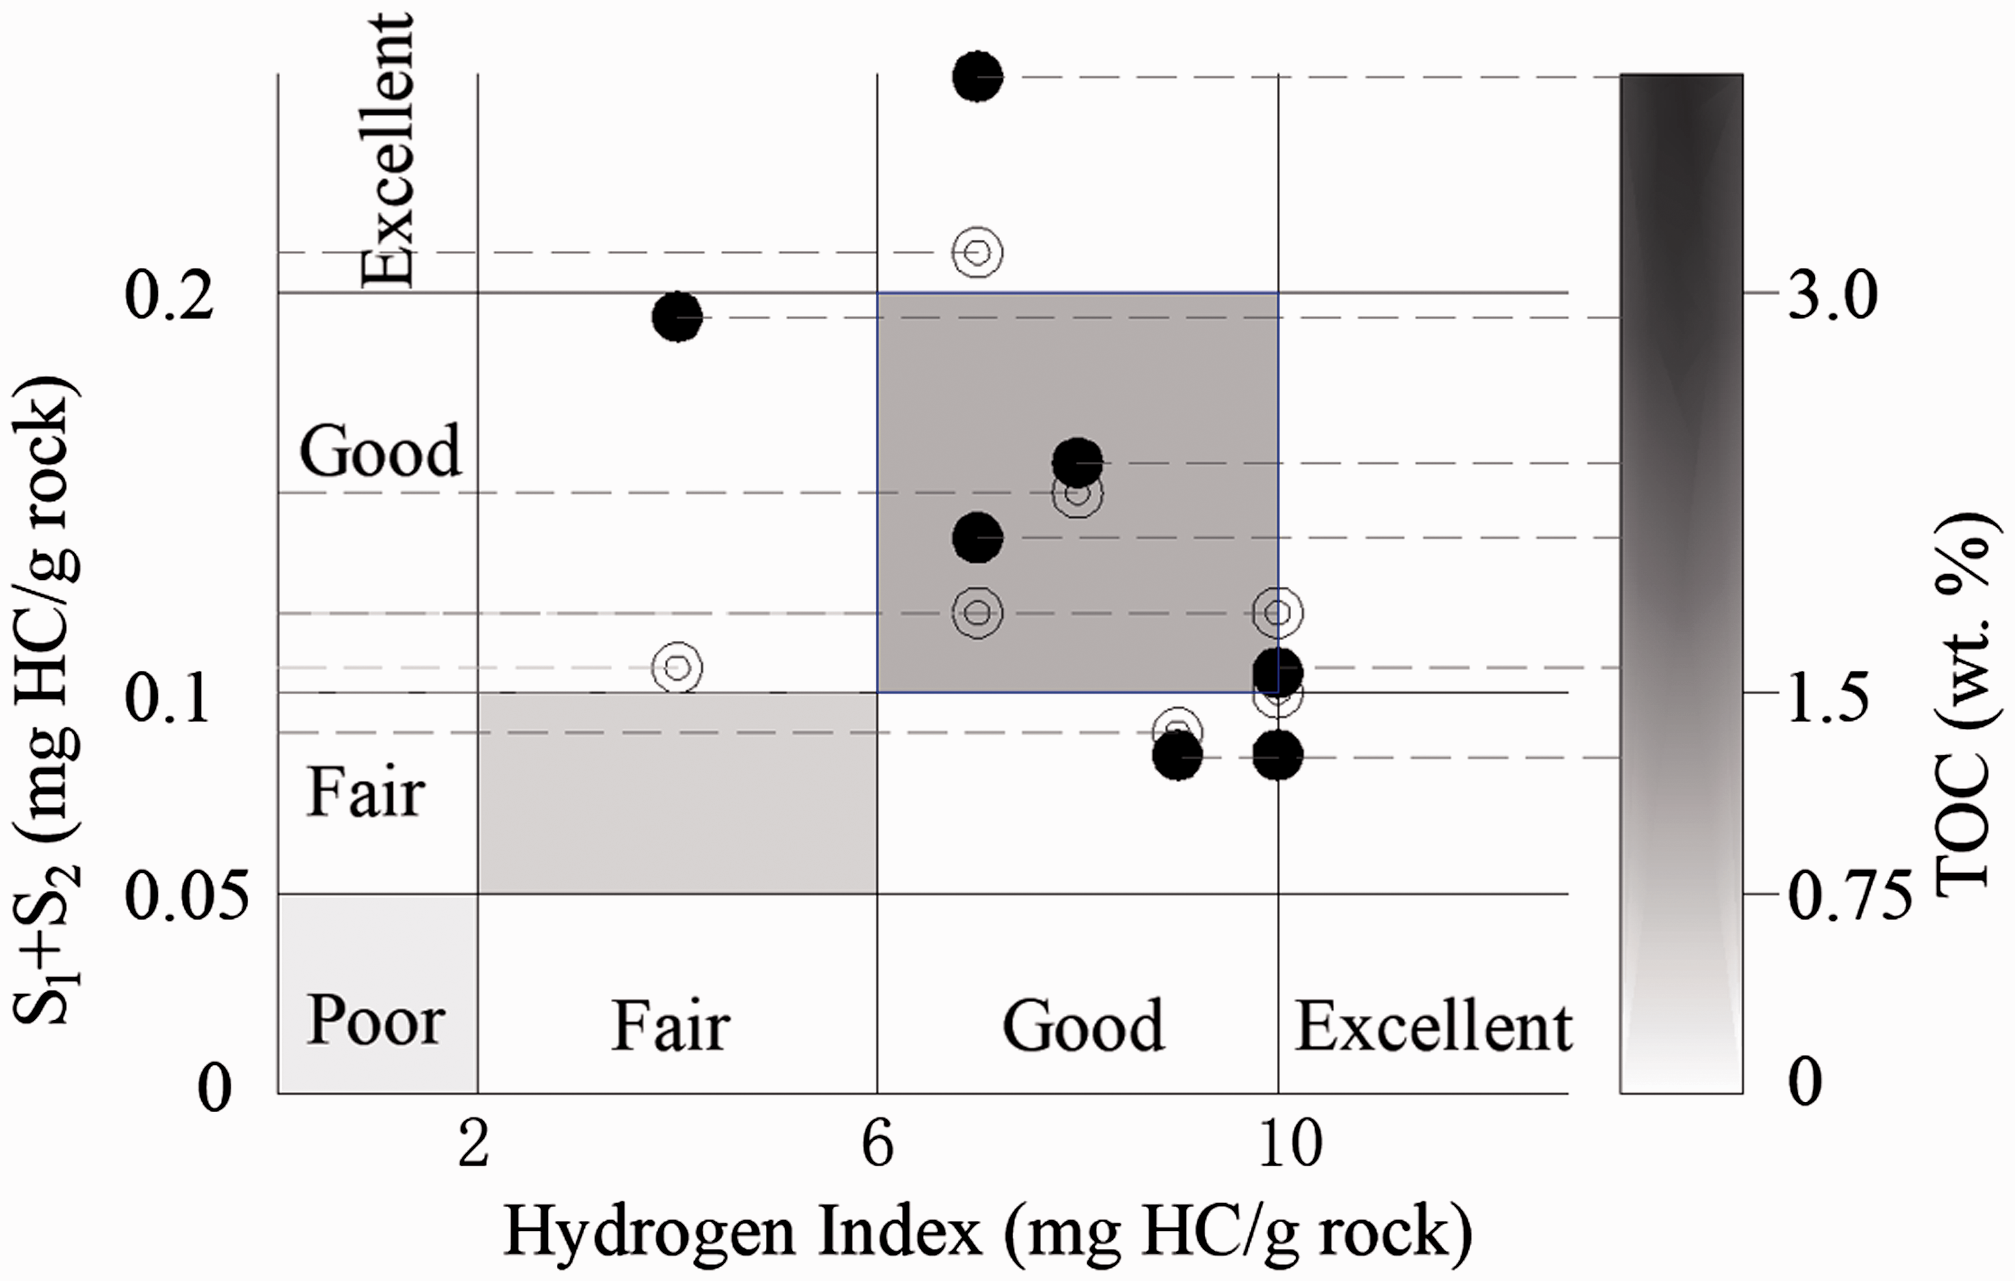
Plot of hydrogen index (HI) versus (S1+S2) and TOC showing generative source rock potential for the Longtan mudstones.
However, it is important to note that this is only a discussion for the postmature evolution stage of coal-bearing shale. In the absence of accurate and sufficient data support, it may be more reasonable and practical to evaluate the hydrocarbon potential using the original classical method.
Conclusions
(1) The superposed reservoirs of coal, mudstone or sandstone for unconventional natural gas are developed in coal-bearing formation under marine–continental transitional environment. The CBM content is at least 10 times greater than the shale gas content, suggesting that coal seams have more significant capacity to producing gas.
(2) Both coal and shale show high maturity and RO value, which reflects a postmature kerogen stage with dry gas generation. Low HI, S1+S2 and δ13C values of the shales imply terrestrial plant origin of organic matter and poor hydrocarbon generation potential, which may be related to its material source of terrestrial plant with composition of rich carbon and poor hydrogen, and overmature stage.
(3) The new describing has been proposed to show gas potential for high thermal evolution of source rocks according to the relationship of HI, S1+S2 and TOC values. Most source rock of shale samples fall in the fair–good source rock zone. Considering all shale samples collected from a single well, the shale potential may vary greatly as source rocks in coal-bearing strata. The main development unconventional natural gas in this area should be CBM, not shale gas, or mainly CBM with supplemented shale gas.
Footnotes
Acknowledgements
We would like to express our gratitude to the reviews for offering their constructive suggestions and comments which improved this manuscript in many aspects. We thank Guizhou Provincial Engineering and Technology Research Center of Coalbed Methane and Shale Gas providing the well test results.
Declaration of conflicting interests
The author(s) declared no potential conflicts of interest with respect to the research, authorship, and/or publication of this article.
Funding
The author(s) disclosed receipt of the following financial support for the research, authorship, and/or publication of this article: This work was supported by the National Natural Science Foundation of China (41330638 and 41727801).