
Abstract
The study of shale pore has always been an important aspect of nonconventional shale reservoir analysis. However, there are relatively few studies on shale that is deposited in transitional environment in the Qinshui Basin. X-ray diffraction, field-emission scanning electron microscopy, N2, and CO2 adsorption experiments were used for shale samples from the Taiyuan and Shanxi Formations. Sample pore characteristics based on field-emission scanning electron microscopic photographs were quantitatively characterized by pore fracture characteristics analysis software and fractal characteristics were discussed based on the nitrogen adsorption curve. Results show that sample pores were primarily composed of inter-granular and intra-granular pores. The proportion of micropores (<2 nm) is 25.84–91.65% of the total pore space, with an average of 58.65%. Micropores show three peaks, which occur near 0.38 nm, 0.5 nm, and 0.85 nm. Mesopores (2–50 nm) account for 6.74–56.11% of the total pore space, with an average of 31.20%. The ratio of macropores (>50 nm) less than 100 nm is 1.61–20.64% with an average of 9.17%. The volume of micropores increases with increase in the total organic carbon and clay mineral contents, decreases with the increase of carbonate and quartz mineral contents, and has weak correlation with other factors. The micropore volume per unit organic matter decreases with increase in maximum vitrinite reflectance (Ro,max) in a binomial relationship. The correlations between meso-macropore volume and each factor are rather weak. Form factor, fractal dimension, and probability entropy all correlate well with the depth. Pore structure complexity gradually increases with the increase in the burial depth. The deeper the rock layer increases with the pore size, the more slowly the pore complexity increases. The larger pore diameter, the more smooth the pore wall surface, and the rougher surface is more favorable for gas adsorption. The directionality of pore development increases first and then decreases with increase in the depth.
Keywords
Introduction
Shale gas is a kind of unconventional gas that is present in the organic-rich shale reservoirs or their interlayers. Shale reservoirs show low porosity and permeability. The pore structure not only controls the existence of gas in the pore but also greatly affects the interaction between pores and gas–liquid molecules (Curtis, 2002; Gensterblum et al., 2015; Javadpour et al., 2007). A correct understanding of the pore structure of shale is important for studying the porosity and seepage characteristics of shale reservoirs, which is an important basis for the evaluation of shale reservoirs.
With the development of technology, a variety of qualitative and quantitative techniques have been used to characterize the pore structures. Transmission electron microscopy (TEM), atomic force microscopy (AFM), field emission-scanning electron microscopy (FE-SEM), and focused ion beam–scanning electron microscopy (FIB–SEM) are used for qualitative or semi-quantitative pore characterization (Curtis et al., 2012; Loucks and Reed, 2014; Sun et al., 2016). High-pressure mercury intrusion (HPMI), N2 and CO2 adsorption, small-angle neutron scattering are used for pore quantitative description (Clarkson et al., 2013; Sun et al., 2016; Wang et al., 2015; Zhang et al., 2015). With the support of these techniques, some researchers have discussed the effects of total organic carbon (TOC), maximum vitrinite reflectance (Ro, max), and mineral composition on pore structure. Strąpoć et al. (2010) suggested that TOC has a positive correlation with the micropore volume, and it contributes to micropore volume with clay minerals when Ro > 1.15. With increasing maturity, the illite content and mesopore volume increased (Chalmers and Bustin, 2007). Ji et al. (2014) suggested that pore sizes in clay minerals are mostly in the range of 3–100 nm. Fractal theory is also widely used to describe the structural characteristics of pores. Fractal dimension correlates well with the pore volume and surface area (Bu et al., 2015; Sun et al., 2015, 2016; Wang et al., 2015; Yang et al., 2014, 2016).
The Longmaxi and Qiongzhusi are the extensively studied shale formations in southern China (Hu et al., 2016; Sun et al., 2016; Tian et al., 2015; Xue et al., 2016; Yan et al., 2016; Yang et al., 2016; Zeng et al., 2016; Zhang et al., 2015). The study of rich organic matter shale in the late Paleozoic marine-terrigenous facies in Qinshui Basin, northern China, is relatively new and there exists only few studies. The Carboniferous-Permian coal-bearing strata in Qinshui Basin are typical marine-terrigenous facies sediments with several sets of coal seams and organic-rich shale. Due to the small thickness and the large number of development layers of these shales, there is gas migration and accumulation in both the vertical and horizontal directions. This has led to coal-bearing gas exploration, theory, and technological research becoming a hot topic in recent years.
In this study, 12 shale samples from the Taiyuan formation and the Shanxi formation from DW-1 well in the Qinshui Basin were examined. The organic geochemistry and mineral composition of the samples were analyzed, and the pore morphology, pore size distribution, and adsorption characteristics were studied by means of FE-SEM, N2, and CO2 adsorption. The porosity in the SEM micrographs was quantitatively characterized by PCAS software. Based on this data, we discuss the influencing factors on various types of porosity. This research can provide a basis for the evaluation of the Taiyuan-Shanxi formation and exploration of coal-bearing unconventional gas.
Geological setting and samples
The Qinshui Basin belonging to the middle of the North China platform in the tectonic setting is located in the southeastern Shanxi Province (Figure 1(a)), eroded from the Silurian to the Mississippian period but subsided and received sediment from the late Carboniferous to the Triassic period, showing the marine-terrigenous facies in the late Paleozoic (Ge et al., 1985; Hu et al., 2013; Wang et al., 2015). The Tectonic characteristics are relatively simple and mainly controlled by a large syncline (Qin et al., 2008). Benxi period and Taiyuan period are mainly barrier–lagoon and carbonate rock shelf system, while Shanxi period and lower Shihezi period are mainly delta deposition (Hu et al., 2013; Wang et al., 2015). Lithologies include coal, limestone, shale, sandy mudstone, siltstone, and sandstone (Su et al., 2005; Shao et al., 2006; Wang et al., 2015). The total thickness of Taiyuan-Shanxi formation is 162.67 m, and 12 samples were collected across the thickness of the black shale (Figure 1(c)). DW-1 is located in the eastern margin of Qinshui Basin, Shanxi Province (Figure 1(b)).
The study area, location, columnar drilling, and sampling locations.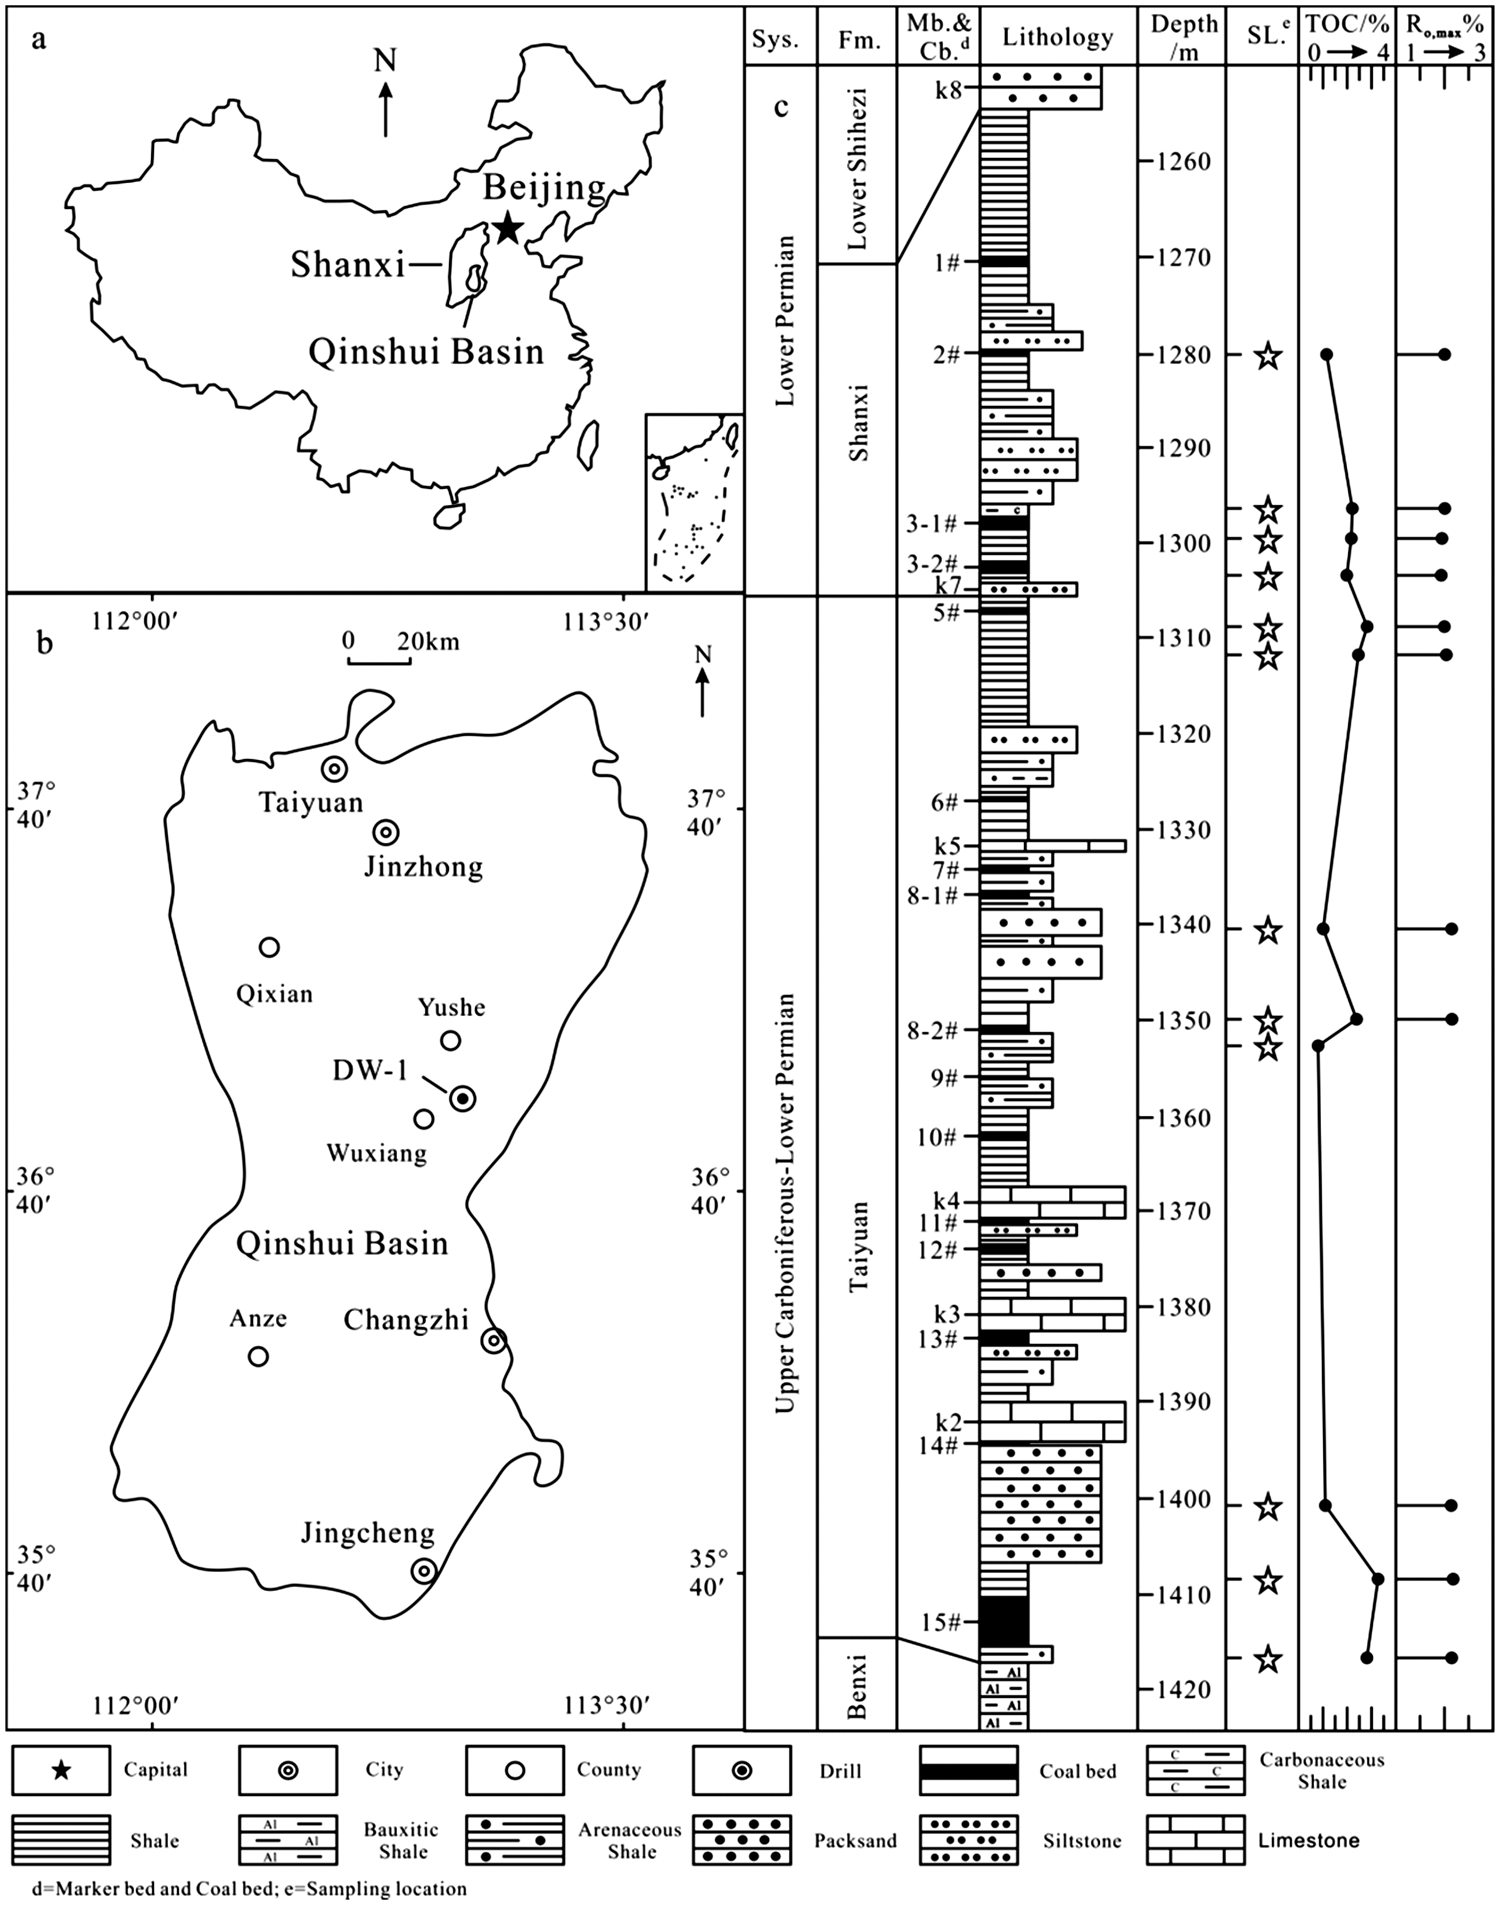
Experiment and results
Experiment
Mineralogy and organic petrography
TOC samples from the Taiyuan and Shanxi formations were handpicked and manually ground to <250 µm and weighed to 10 g. The test was carried out at the Jiangsu Design Institute of Geology for Mineral Resources according to the national standard (GB/T 19145-2003). X-ray diffraction (XRD) test clay samples were manually crushed to 180–250 µm and weighed 200 g. Whole rock test samples weighed 30 g and were ground to <75 µm to be completed using Ultima IV, according to the industry standard (SY/T 5163-2010) for testing at the test center of the East China branch, SINOPEC.
FE-SEM and PCAS
A small size sample was selected and analyzed by field-emission scanning electron microscopy (FE-SEM) with Quanta250 after argon ion polishing. FE-SEM analysis was completed at the China University of Petroleum (Beijing).
The porosity of the SEM photographs was quantitatively analyzed by PCAS (Liu et al., 2011). PCAS is based on the global threshold method. High-resolution images were firstly converted into binary images showing matrix and pore space. In order to reduce human error, the method where multiple independent parameters are averaged is used to analyze the porosity, which controls the recognition error of shale geometric factors to about 2% (Jiao et al., 2014). Then the number of pores as well as the area, perimeter, length, width, fractal dimension, form factor, and probability entropy of the pore can be obtained by this software. The pore length, width, and direction of extension are defined using the Feret diameter (Sezer et al., 2008). The actual area (St) and the actual perimeter (Ct) can be calculated from the pixel area (s) and the pixel perimeter (c) using the following equations


Form factor (ff) reflects the roughness of the edge of the pore with a maximum of 1 (circle), 0.785 (square). The smaller the value, the rougher the pore edges and the more complex will be the structure. The formula is as follows

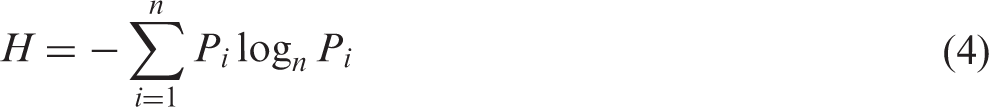
Probability entropy (H) quantifies the orientation of the pores, which is defined as
Fractal dimension is used to describe the degree of variation of parameters within a certain range (Liu et al., 2011). It is defined as

Combining equations (3) and (5) yields

Equation (6) can be transformed into

N2 and CO2 adsorption
In the N2 and CO2 adsorption experiments, samples were crushed to 250–420 µm and weighted 5–10 g. Samples were dried at 80℃ for 24 h, and were purged with nitrogen at 80℃ before nitrogen adsorption. The temperature of the nitrogen was 77 K. The experiment was performed using Tristar 3020 at the Key Laboratory of Ministry of Education, China University of Mining and Technology. The low temperature of N2 adsorption test lead to the difficulty of N2 entering the micropores, so it was used primarily to describe the mesopores (2–50 nm). While the CO2 adsorption temperature is higher (273 K) than nitrogen, with a stronger molecular activity, making the micropore analyses more accurate. In the N2 adsorption experiment, the specific surface area was obtained by the adsorption theory of multimolecular layers (BET) model, and the pore size distribution and pore volume were obtained according to the density functional theory (DFT) model. And CO2 adsorption is primarily based on DFT model.
Results
Mineralogy and organic petrography
Mineralogical composition and organic petrographic characteristics of shale samples.
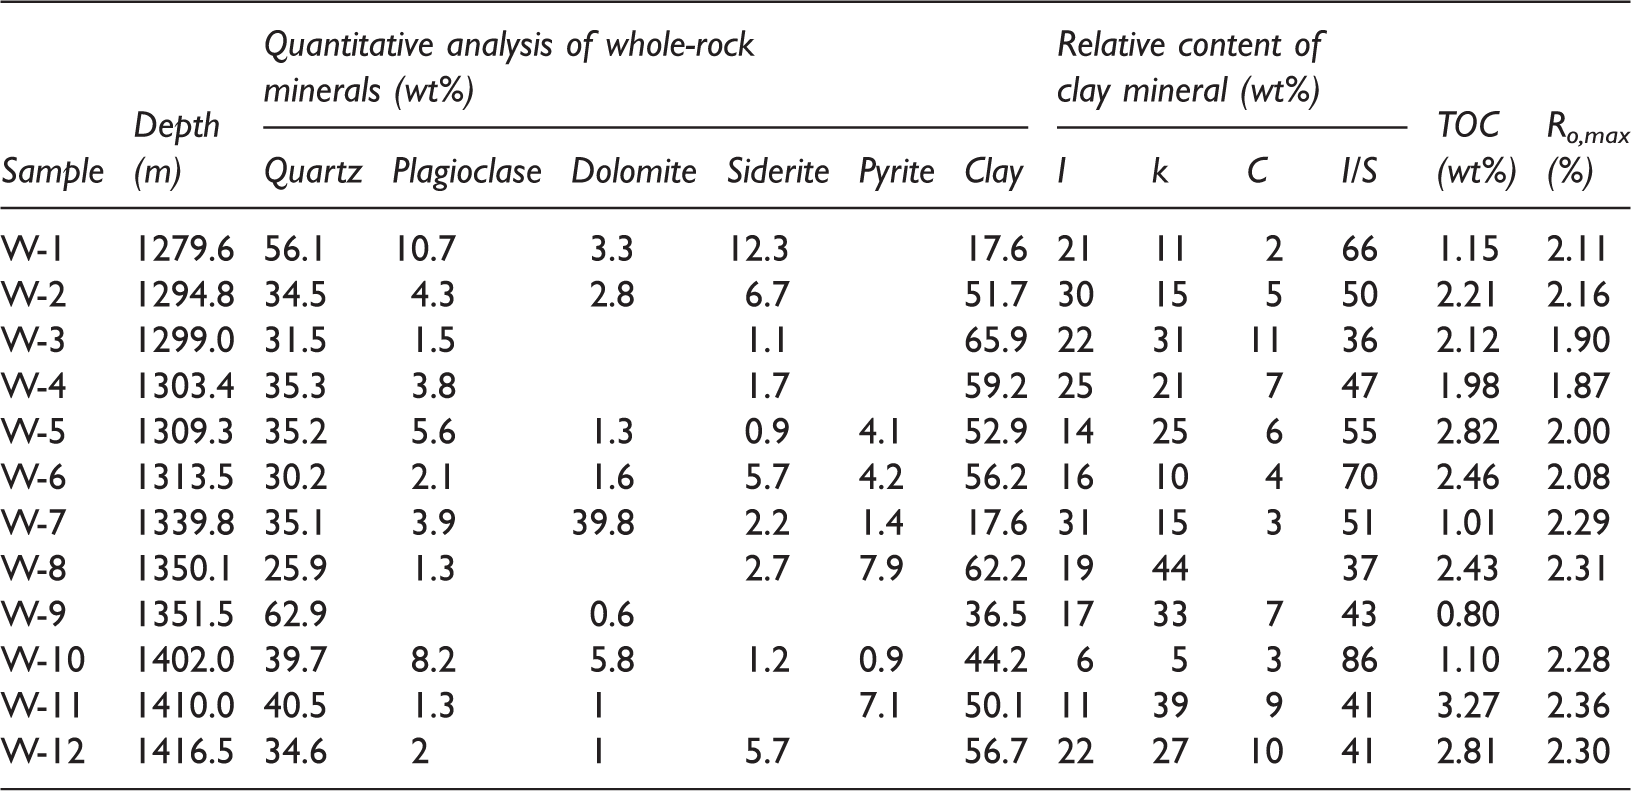
I: Illite; K: Kaolinite; C: Chlorite; I/S: Illite-smectite-mixed mineral.
Overall the content of clay minerals is the highest, followed by quartz. The clay mineral content is 17.6–65.9%, with an average of 47.6%. The quartz content is 25.9–62.9% with an average of 38.5%. Only W-1and W-9 contain more clay than quartz. In addition, there is also a small amount of plagioclase, dolomite, siderite, pyrite, and other minerals in the samples. The total content of brittle minerals (silica, carbonate, and pyrites) in the samples ranges from 34.1% to 82.4%, with an average of 52.4%, which is favorable to the development of pore fissure and fracturing.
Clay minerals in the illte-smectite mixed layer accounted for the largest proportion of samples ranging from 36% to 86% with an average of 51.9%. Illite and kaolinite content is considerably less with illite content ranging from 6% to 31% with an average of 20% and kaolinite content ranging from 5% to 44% with an average of 23%. Chlorite content is relatively small (0–11%) with an average of 6% (Table 1).
Qualitative description of pore morphology
Shale pores are divided into organic pores, inorganic pores, and microcracks. Inorganic pores are divided into inter-granular pores and intra-granular pores (Loucks et al., 2012). The shale samples considered in this study have a relatively developed porosity.
Organic matter pores and intergranular pores are the most developed (Figure 2(b) to (d), (g) to (j)), shaped round and elliptical (Figure 2(c), (g), (h), (k)), with diameters ranging from 0.04 µm to 1 µm; meanwhile some microcracks and intergranular pores are present (Figure 2(d) and (h)). The majority of pores are less than 1 µm in width with the largest pores about 10 µm wide (Figure 2(k) and (i)).
Pores and microfractures in black shales of the Shanxi and Taiyuan formation.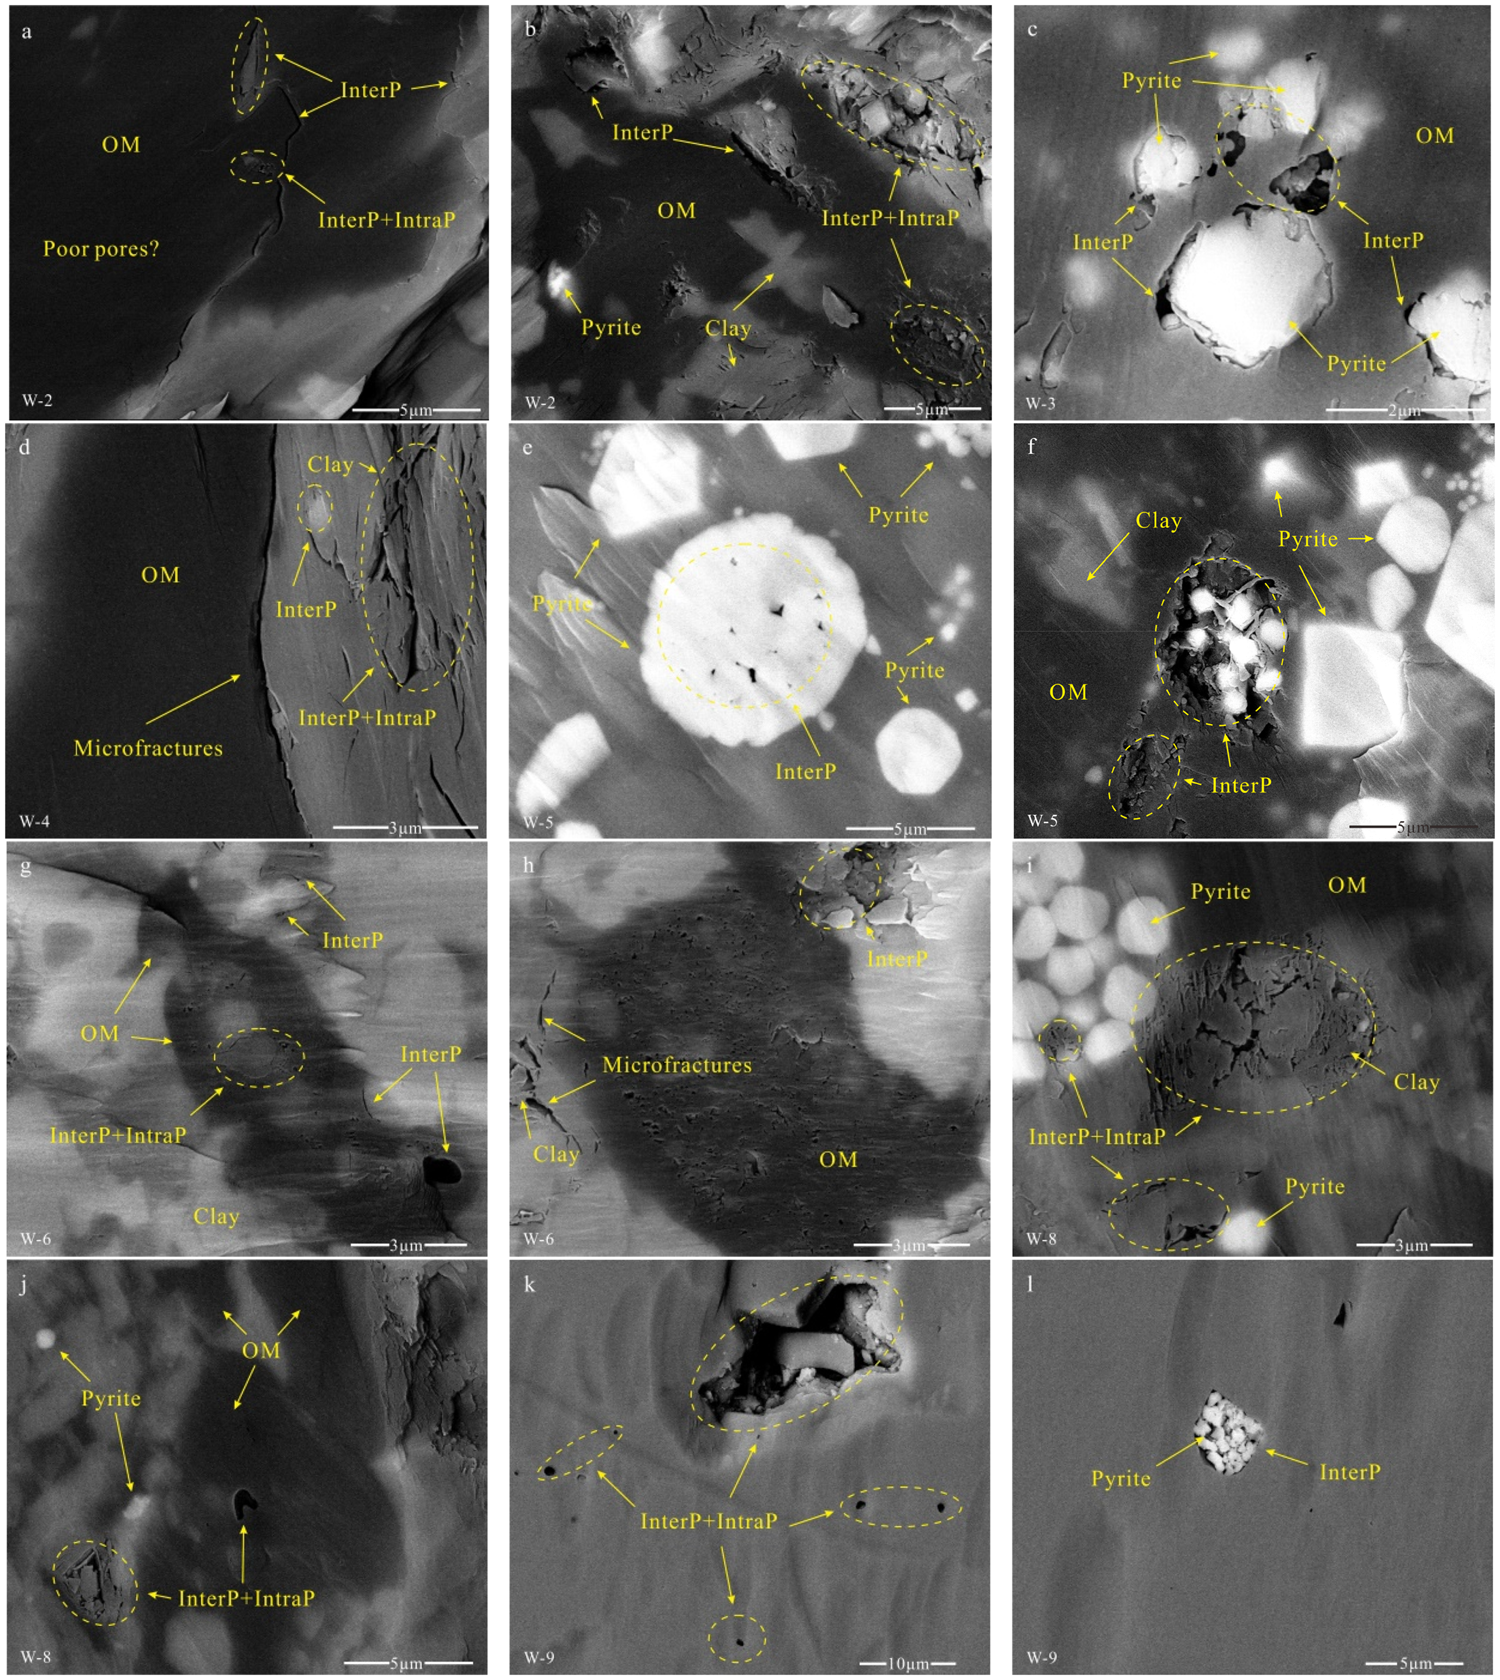
Inorganic pores mainly consist of intergranular pores in the shape of a flat plate, where the extension direction is parallel to the contact surface (Figure 2(a), (b), (d)). Intergranular pores may also be round or ovate (Figure 2(c)). They also contain a small number of intragranular pores (Figure 2(b) and (d)) and dissolution pores with relatively smooth pores wall (Figure 2(k)).
Microfractures are mostly developed in the contact surface between organic and inorganic matter (Figure 2(d)). The width of microfractures is less than 1 µm and can reach several tens of microns in length (Figure 2(h)). Pyrite when observed under the microscope, mostly forms grape-shaped nodules (Figure 2(e), (f), and (i)) and partly filling inorganic pores (Figure 2(l)).
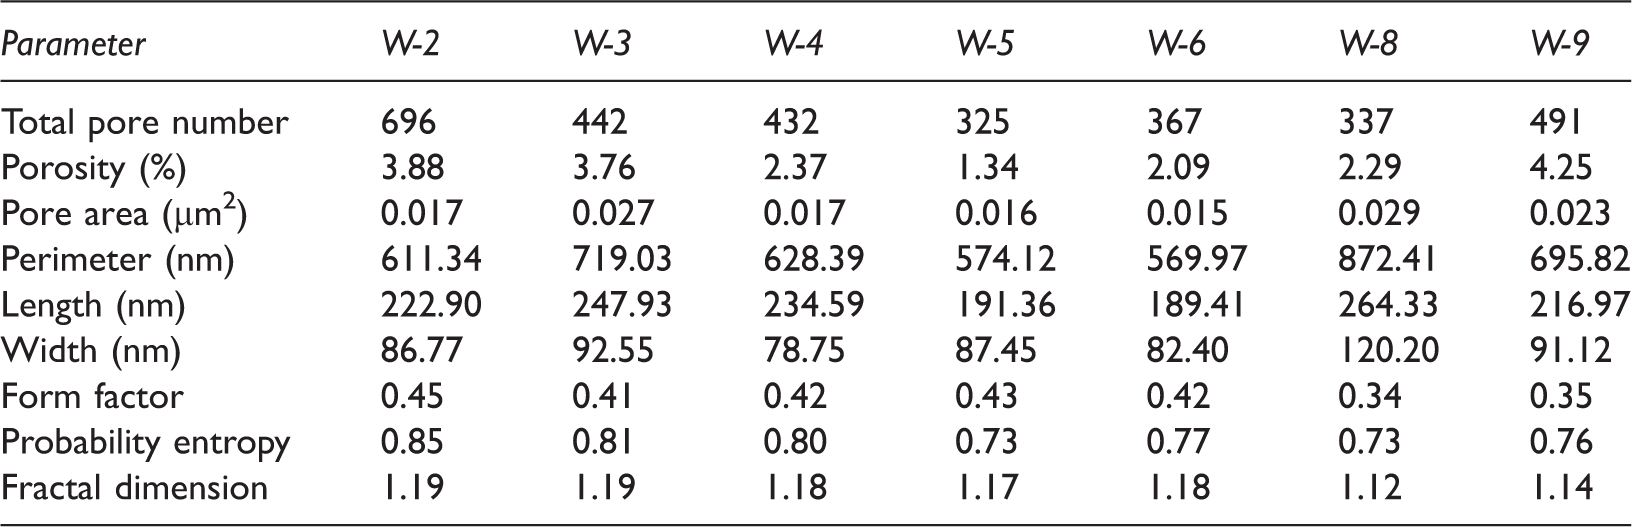
SEM images were analyzed using the PCAS software. Ten images sized at the same magnification of 50,000 times were selected from each sample. The size of each pixel was 5.83 nm. In the PCAS software, the minimum element recognition radius is 2 pixels. Thus, the smallest aperture that can be identified in this study is 23.32 nm (the colors are randomly generated and used to distinguish between different sized pores) (Figure 3). All observed pores have a relatively low form factor (ff) of 0.34–0.45 indicating that the edge of the pore structure is more complex. Probability entropy (H) is 0.73–0.85 indicating that the direction of pore development is disorganized. Fractal dimension (Df) is 1.12–1.19 indicating that the pore structure is complex (Table 2).
Results of pore analysis by using PCAS (the original SEM image is shown in Figure 2(c)). Parameters of pores obtained with PCAS. The total number of pores is the sum of 10 photos, the other parameters are average.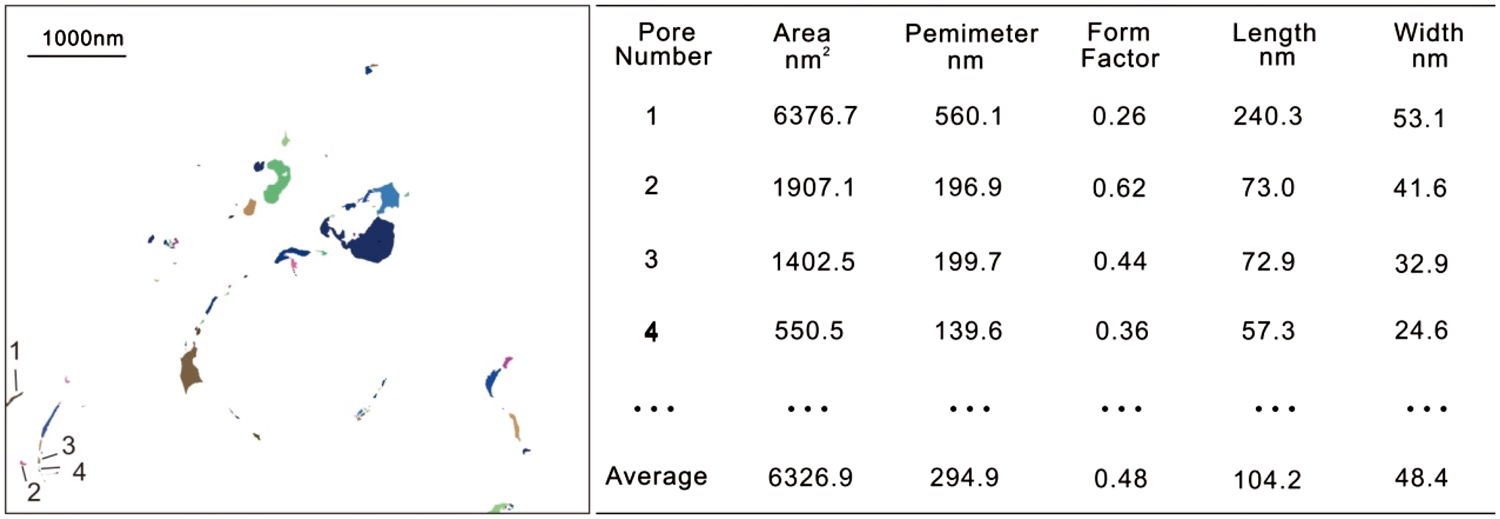
Quantitative analyses of pore volume and pore-size distribution
Shale pore structure is complex with individual pores ranging in size from 2 nm to higher than 50 nm. At present, there is no uniform standard for shale pore classification. According to the International Union of Pure and Applied Chemistry (IUPAC) method, the pores were divided into micropores (<2 nm), mesopores (2–50 nm), and macropores (>50 nm) (Rouquerol et al., 1994; Sing and Everett 1985; Wang et al., 2014a, 2014b).
The size and number of pores can be characterized by PCAS; however, because the analysis is based on a two-bit image, the impact of pixel and photo positioning may skew the pore distribution analyses; thus N2 and CO2 adsorption were used to provide a more accurate view of pore size distribution. In this study, the DFT model was used for N2 and CO2 adsorption pore size distribution.
As the CO2 adsorption test pore size is smaller than 1.5 nm, pore size larger than 1.5 nm using N2 adsorption data is used (Figure 4). The pores of shale samples are well developed. The proportion of micropores is the highest, ranging from 25.84% to 91.65%, averaging 58.65%, and pore diameter shows three peaks respectively, which appear near 0.38 nm, 0.5 nm, and 0.85 nm. The mesopores account for 6.74–56.11%, with an average of 31.20%. The developed mesopores can communicate with the micropores and macropores well, which is favorable for the migration of methane. The amount of macropores smaller than 100 nm ranges from 1.61% to 20.64%, with an average of 9.17%.
Pore-size distribution defined by differential pore volume using low-pressure N2 and CO2 adsorption.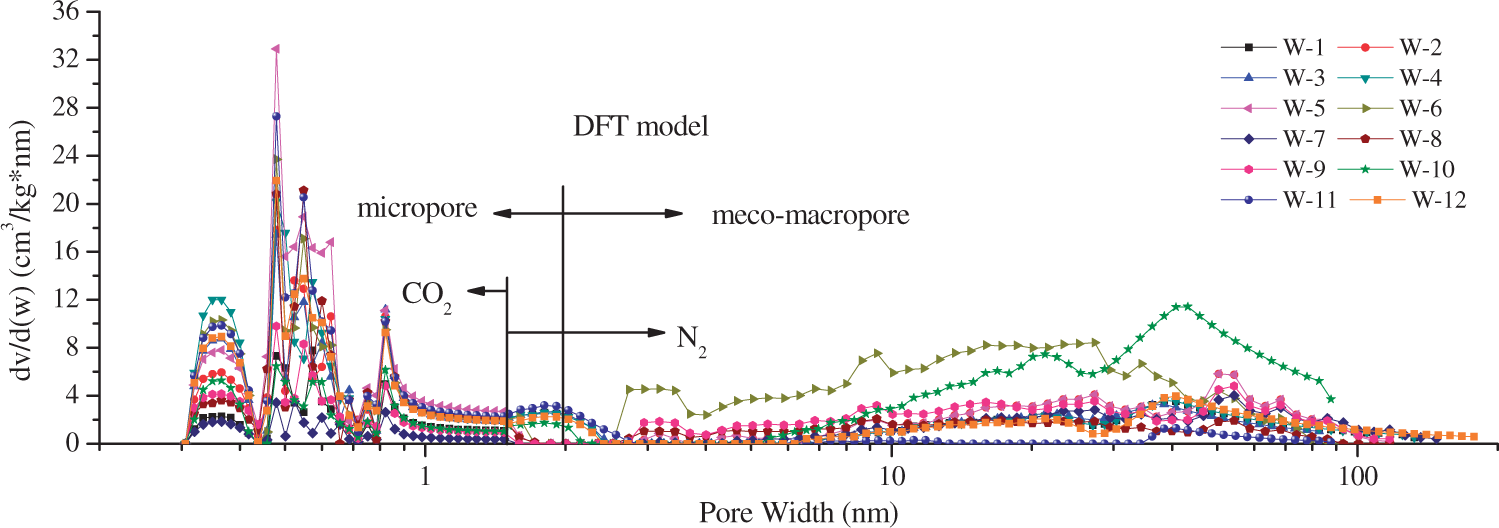
Pore volumes and surface area determined via gas adsorption.
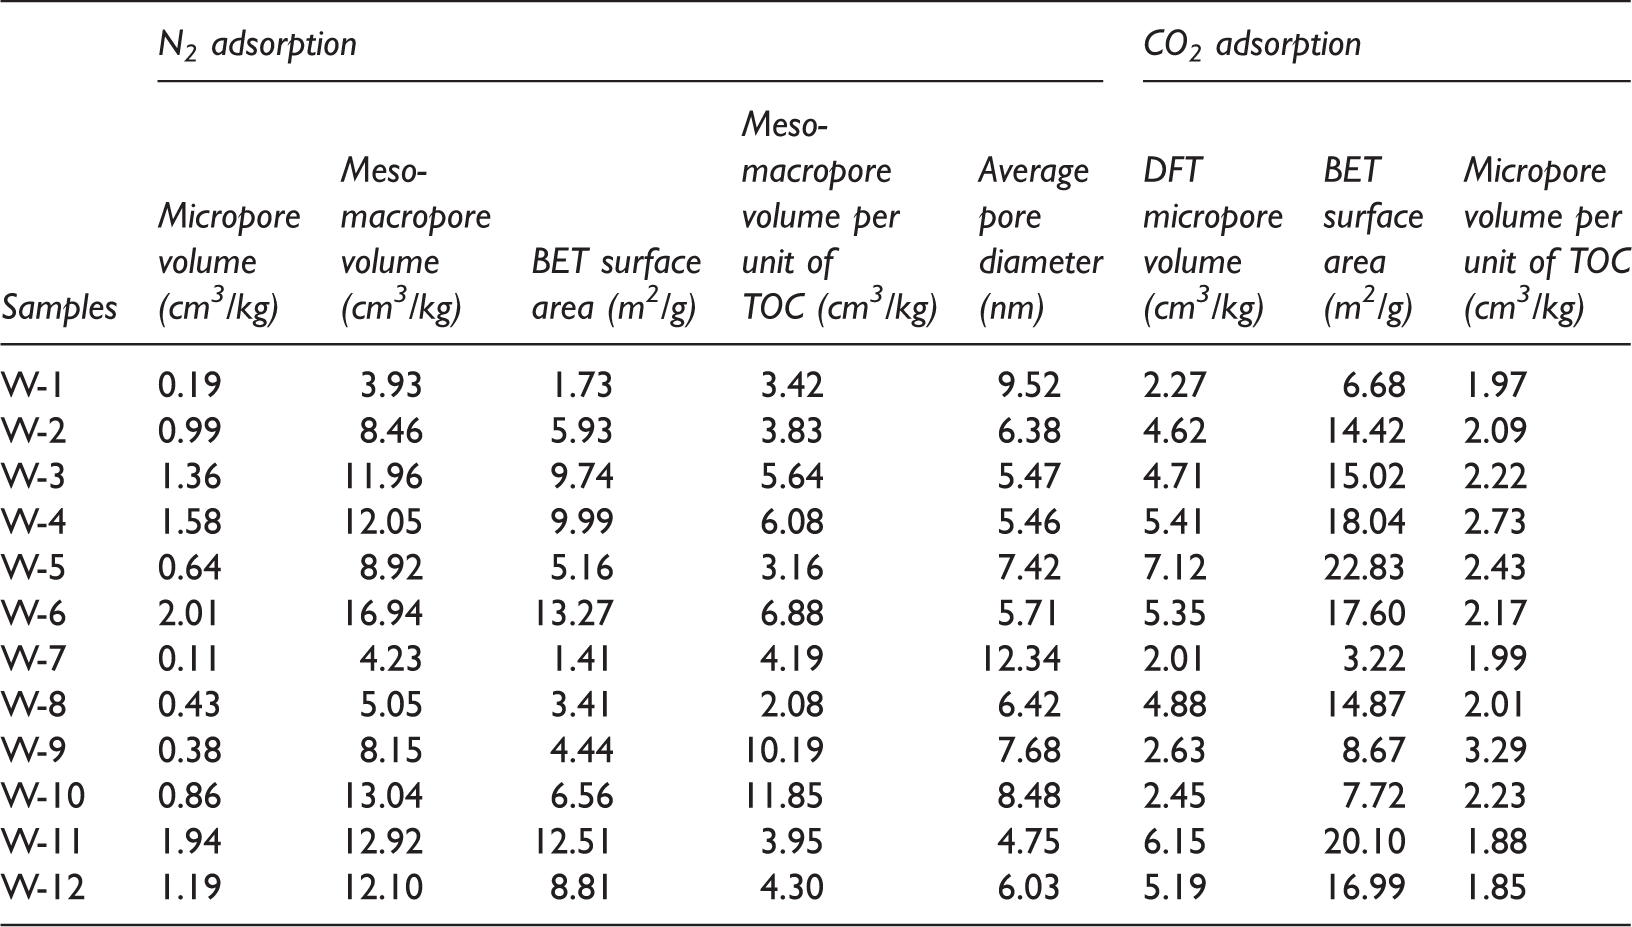
The N2 adsorption–desorption curve is similar to that proposed by IUPAC (1994). It has a relatively rapid growth at the beginning of adsorption, indicating that micropores are well developed (Figure 5(a)). The type of hysteresis loop is between H3 and H4. Results show that a certain amount of mesopore and macropores were developed, which had good connectivity. In the N2 adsorption process, N2 undergoes the physical processes of filling micropores, monolayer adsorption, multilayer adsorption, and capillary filling. When P/P0 (where P is the gas pressure and P0 is the saturated vapor pressure of the adsorbed mass at the experimental temperature) reaches its maximum, the adsorption quantity rises abruptly and does not reach saturation (Figure 5(a)) indicating some large pores remain unfilled. The CO2 adsorption curve is similar to the IUPAC (1985) type I (Figure 5(b)), indicating that there are many micropores in the sample. The maximum relative pressure is 0.03. The maximum adsorption capacity was 7.12 cm3/kg (W-5), and the minimum adsorption capacity was 2.01 cm3/kg (W-7), which may be influenced by the contents of TOC and mineral components.
N2 adsorption and desorption isotherms and CO2 adsorption isotherms for the 12 shale samples: (a) N2; (b) CO2.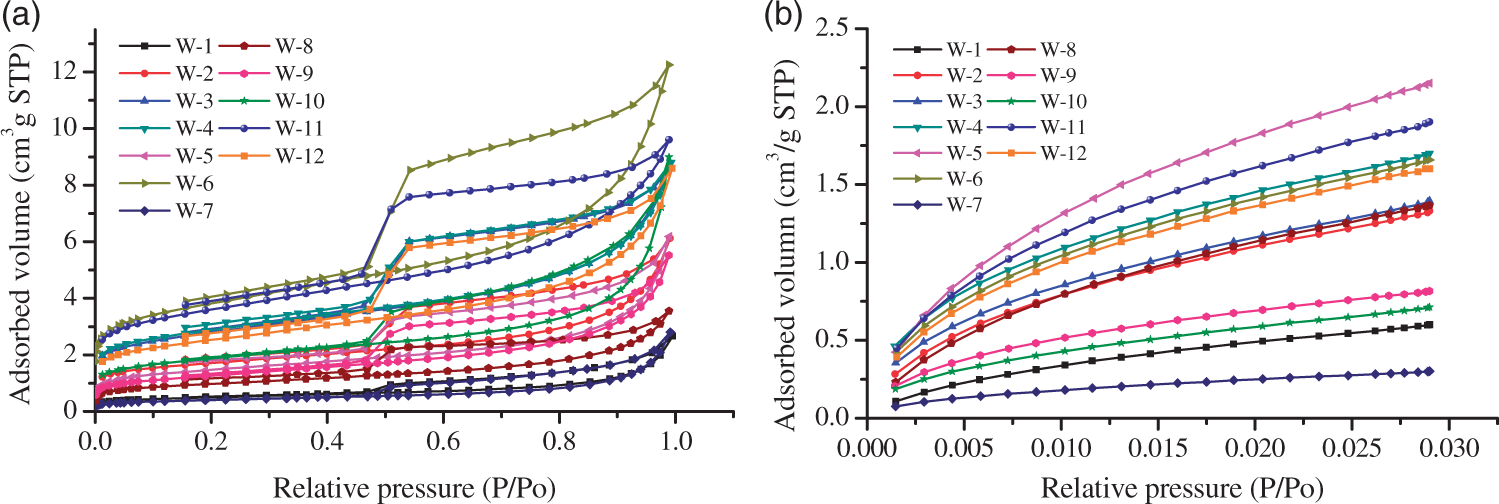
Fractal characteristics of pore structure
Fractal dimension D is used to describe the irregular structure and morphology of solid materials such as coal reservoirs and shale reservoirs (Bu et al., 2015; Cai et al., 2013; Jiao et al., 2014; Pfeifer and Avnir, 1983; Sun et al., 2015; Tang et al., 2003, 2015; Wang et al., 2015; Yang et al., 2014). Based on the Frenkel–Halsey–Hill (FHH) formula, Avnir and Jaroniec (1989) established a gas adsorption model for the capillary zone of the parting surface, which is currently considered to be the most effective and widely used model. The FHH model is as follows

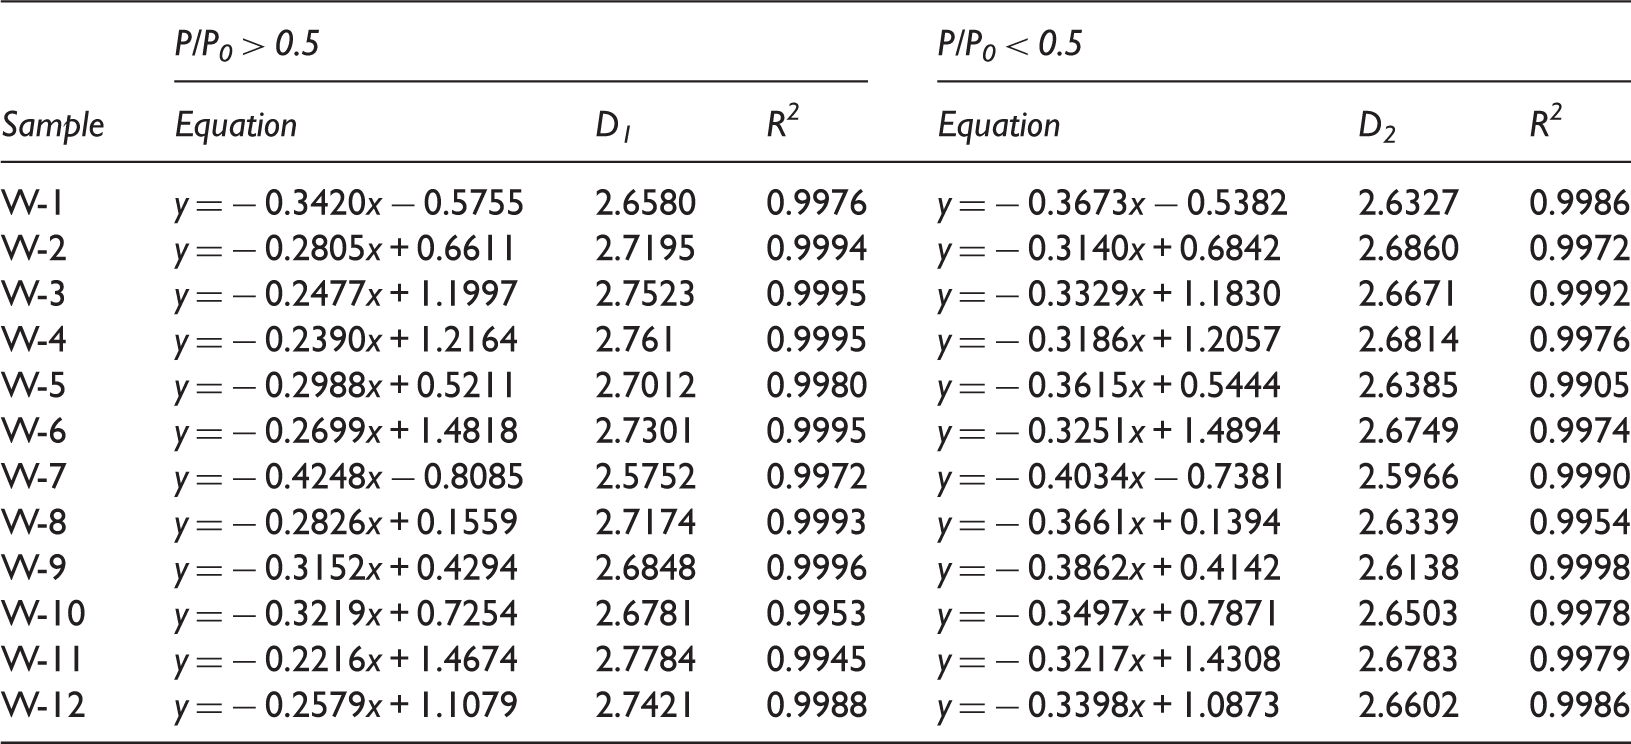
According to the characteristics of N2 adsorption, the adsorption and desorption curve can be divided into three stages (Figure 6). Stage “a” is the multilayer adsorption, mainly controlled by the van der Waals force; stage “b” is the thin film adsorption, by van der Waals force and capillary cohesion; stage “c” is the capillary condensation, mainly by surface tension control (Khalili et al., 2000; Qi et al., 2002; Pomonis and Tsaousi, 2009; Sing, 2004; Sun et al., 2015, 2016; Wang et al., 2015). The surface fractal dimension D2 is obtained from stage a, which reflects the roughness of the pore surface. The surface fractal dimension D1 is obtained from stage c, which reflects the contour of N2 molecule accumulation in pores (Sun et al., 2016; Tang et al., 2003; Wang et al., 2015) (Table 4). Phase “b” is affected by the van der Waals force and the capillary force. These data are not used. When P/P0 is close to 1, the adsorption isotherm becomes steeper and cannot reflect the adsorption of gas, thus these data are not used (Sun et al., 2016). From Figure 6 and Table 4, it can be seen that D1 is larger than D2, showing that when more molecules are adsorbed, more molecules accumulate and the larger the fractal dimension is, which is consistent with previous research (Pyun and Rhee, 2004; Sahouli et al., 1997; Sun et al., 2015, 2016; Tang et al., 2003; Wang et al., 2015).
Plots of lnV vs ln(ln P0/P) from N2 adsorption isotherm data. Fractal dimensions derived from fractal FHH model.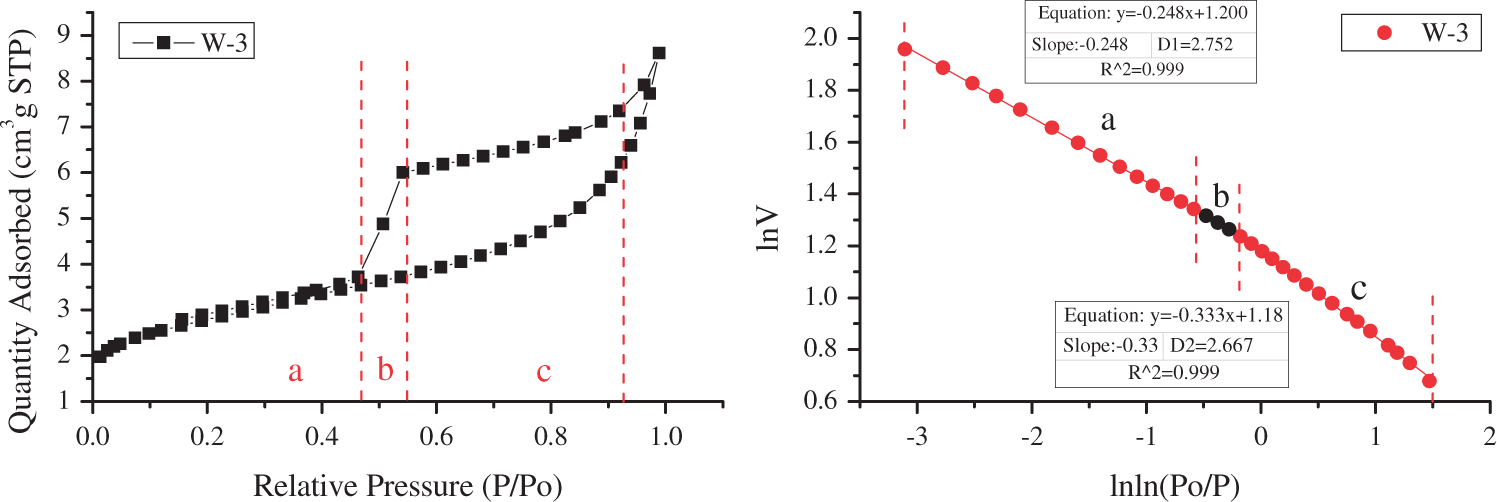
Discussion
Pore morphology analysis based on PCAS
Mesopores and macropores have the same proportions approximately (Figure 7(a)). It can be seen from Figure 7(b) that the proportion of mesopores decreases with the increase in the burial depth, while the proportion of macropores increases with the increase in the burial depth. This is counterintuitive. There are two possible reasons for this. Firstly, the randomness of photo-selection leads to an increased proportion of observed macropores; and the second is that the pores have only two kinds of classification, although the total pore volume of different samples varies greatly, the proportion of mesopore and macropore almost keeps the same.
Pore quantity statistics (a); relationship between pore percentage and depth (b); relationship between pore width and depth (c); relationship between form factor and depth (d); relationship between fractal dimension and depth (e); relationship between probability entropy and depth (f).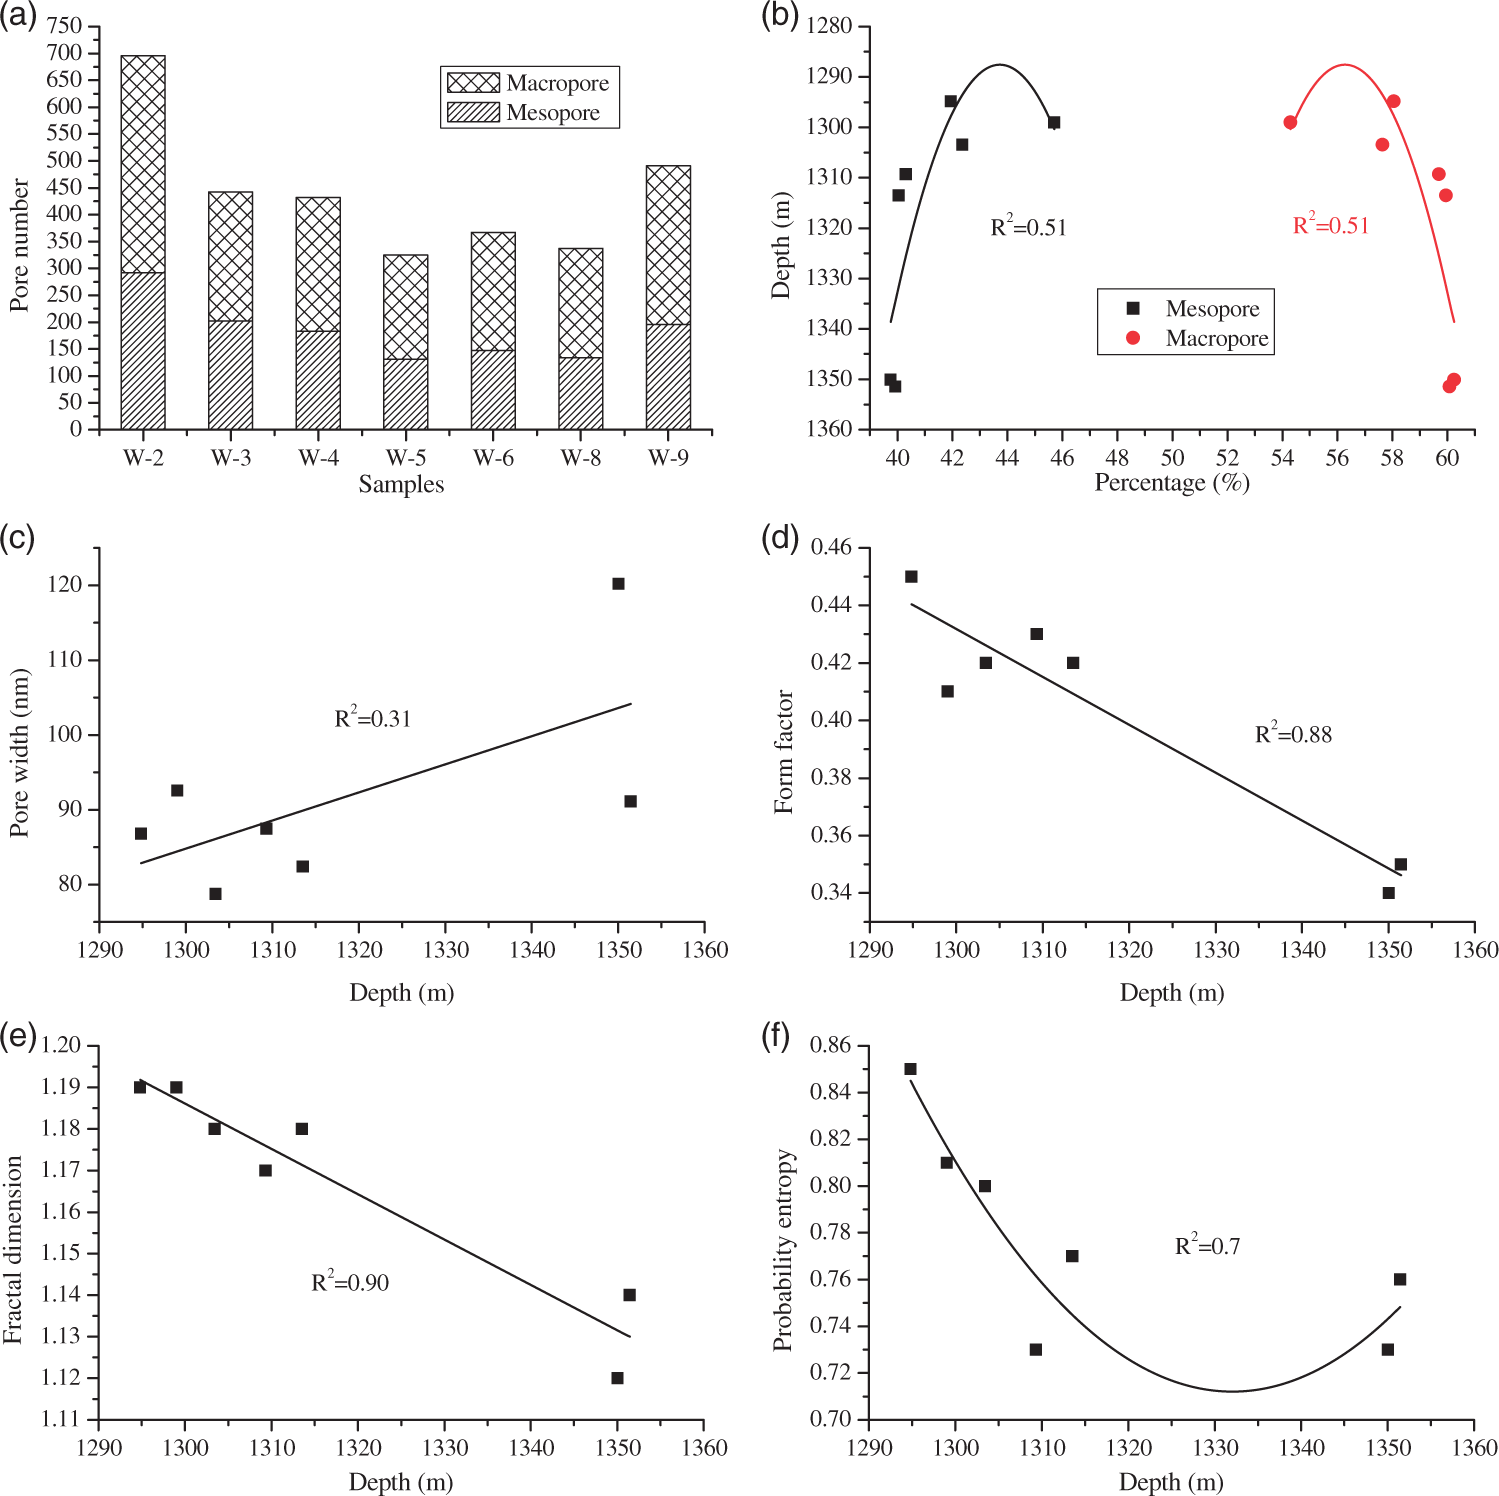
The correlation between pore width and burial depth is weak (Figure 7(c)). Form factor decreases with increasing depth (Figure 7(d)), indicating that the pore structure becomes more complex as depth increases. Fractal dimension also decreases with increasing depth (Figure 7(e)), indicating that pore heterogeneity decreases with increasing depth, and the pore structure parameters tend to converge. According to equation (7), deeper rock layers with increased pore size, reflect a relatively slow increase in the pore structure complexity. The probability entropy shows a good binomial relationship with the depth (Figure 7(e)), indicating that the directionality of the pore development is also related to depth. The directionality of pore development increases first and then decreases with the increase in depth.
The influencing factors of pore characteristics
TOC content has a strong correlation with micropores and mesopores (Clarkson et al., 2013; Milliken et al., 2013; Ross and Marc Bustin, 2009). It can be seen from Figure 4 that the pore volume of shale in the study area is mainly composed of micropores ranging from 0.38 to 0.9 nm and meso-macropores at 10 to 100 nm. Micropores have a positive correlation with TOC while meso-macropores negatively correlate with TOC (Figure 8(a)).
Relationships of the micropore and meso-macropore volume with TOC (a), Ro,max (b), quartz (c), carbonate (d), total clay (e), mineral content, and average pore diameter (f).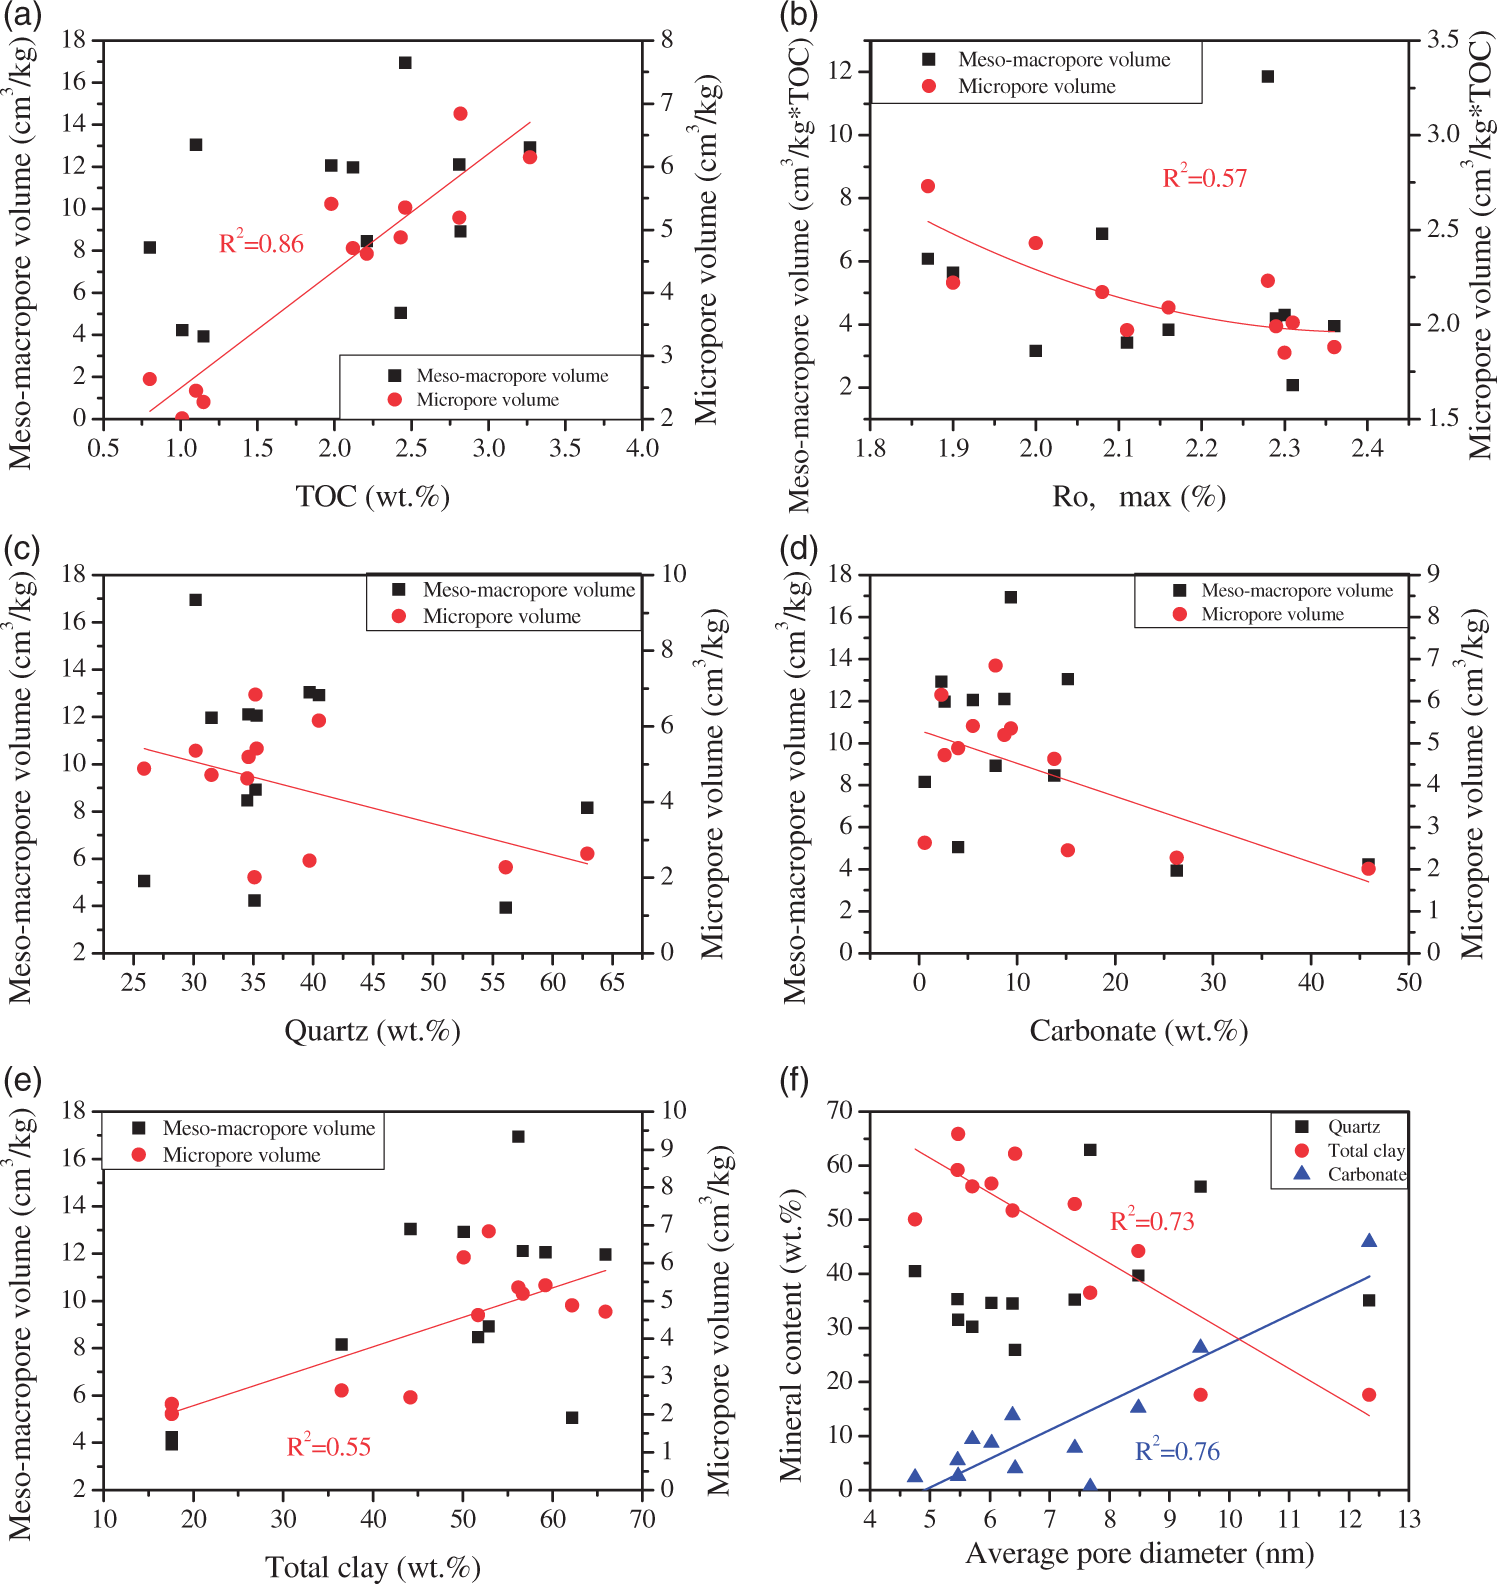
The maturity of organic matter plays an important role in the pore volume and distribution of organic matter pores (Curtis et al., 2012; Modica and Lapierre, 2012). A large number of studies have shown that organic pores are mostly caused by secondary hydrocarbon generation, and at low maturity (generally Ro, max < 0.9%), organic pores are not developed. Organic pores are abundant only at relatively high maturity (Bernard et al., 2012; Curtis et al., 2012; Loucks et al., 2009). Sun et al. (2016) studied the mature (Ro, max > 2.7%) shale known as the Niutitang formation in Chongqing. By analyzing the relationship between maturity and pore volume of organic matter, it was found that micropore volume increased first and then decreased with the increasing maturity. In this study, samples are in the mature and high mature stage (Ro, max 1.87–2.36%). We found that Ro, max has a polynomial relation with micropore volume per unit organic matter. With the increase of maturity, the volume of per unit organic matter in micropores gradually decreases. This means that Ro, max has little correlation with meso-macropore volume per unit organic matter (Figure 8(b)).
Mineral composition is another important factor affecting the pore characteristics. The effects of clay minerals, carbonate, and quartz on the development and distribution of pores have been studied (Chen et al., 2016; Sun et al., 2016; Wang et al., 2015; Yang et al., 2016; Zhang et al., 2015). The correlation between the macropore volume and mineral content is weak (Figure 8(c) to (e)). The micropore volume increases with increasing clay mineral content (Figure 8(e)) and decreases with increasing quartz and carbonate contents (Figure 8(c) and (d)). Furthermore, the effect of mineral content on the average pore size (N2 adsorption) was studied. It was found that the pore size decreased with the increase in clay content and increased with increasing carbonate content (Figure 8(f)).
Relationships between fractal dimensions and pore characteristics
Based on the N2 adsorption isotherm, the fractal dimension was obtained. P/P0 > 0.5 (stage c) and P/P0 < 0.5 (stage a) were divided into two segments (Figure 6) (Bu et al., 2015; Cai et al., 2013; Liu et al., 2015; Tang et al., 2015). Results show that D1 is proportional to micropore volume (N2 adsorption) and is inversely proportional to pore size (Figure 9(a) and (b)). According to the above analysis, D1 exhibits a greater adsorption of gas molecules, reflecting smaller pore sizes. This is consistent with the study of Sun et al. (2016). The difference with the study of Sun et al. (2016) is that a good correlation is found between D2 and pore width (Figure 9(d)), which decreases with increasing pore diameter, indicating that larger the pore diameter, more smoother the pore. D2 is also positively correlated with specific surface area (Figure 9(c)), indicating that a rougher surface is more favorable for gas adsorption.
Relationships between fractal dimension, pore width, micropore volume, and surface area.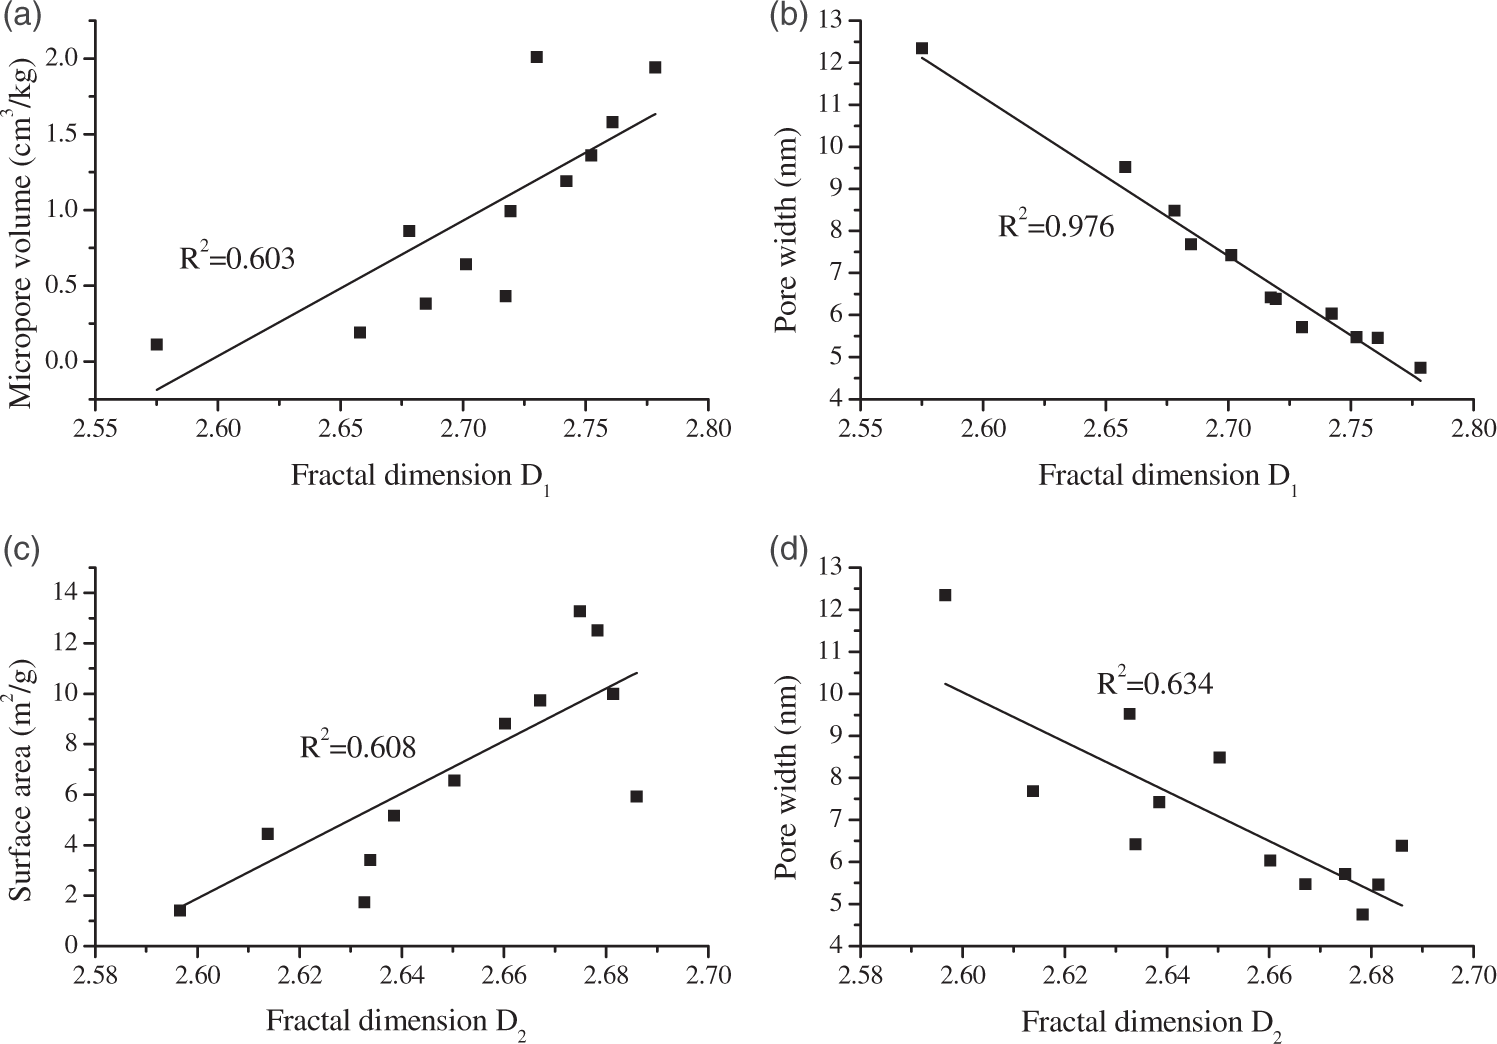
Conclusions
Based on the laboratory tests, data processing, and comprehensive analysis of the coal-bearing shale pore characteristics of the Carboniferous-Permian shale in Qinshui Basin, we draw the following conclusions.
Shale pores are mainly composed of organic pores, intergranular pores, and intragranular pores. The proportion of micropores is 25.84–91.65%, with an average of 58.65%. The micropores showed three peaks, which appeared near 0.38 nm, 0.5 nm, and 0.85 nm, respectively. The percentage of mesopores is 6.74–56.11%, with an average of 31.20%. The percentage of macropores less than 100 nm is 1.61–20.64%, with an average of 9.17%. Micropore volume increases with increasing organic matter and clay, but decreases with the increase of quartz and carbonate. Micropore volume per unit organic matter has a good binomial relationship with Ro, max. With increasing maturity, the micropore volume per unit organic matter gradually decreases. Ro, max has little correlation with meso-macropore volume per unit organic matter. Pore structure complexity gradually increases with the increase in the burial depth. The deeper the rock layer increases with the pore size, the more slowly the pore complexity increases. The larger the pore diameter, the more smoother will be the pore wall surface while the rougher surface is more favorable for gas adsorption. The directionality of pore development increases first and then decreases with the increase in depth.
Footnotes
Acknowledgment
We thank Associate Professor Chun Liu for providing PCAS.
Declaration of conflicting interests
The author(s) declared no potential conflicts of interest with respect to the research, authorship, and/or publication of this article.
Funding
The author(s) disclosed receipt of the following financial support for the research, authorship, and/or publication of this article: This work was supported by The 13th Five-year Plan for large-scale oil and gas fields and coal-bed methane development (Project No. 2016ZX05044002-003), the coal fundamental science and technology key projects in Shanxi of China (Project No. MQ 2014), and the plan of science and technology innovation of postgraduates in Jiangsu province (Project No. KYLX16_0551).