
Abstract
With the introduction of electric vehicles in the automobile market, limited information is available on how the battery’s energy consumption is distributed. This paper focuses on the energy consumption of the vehicle when the heating and cooling system is in operation. On average, 18 and 14% for the battery’s energy capacity is allocated to heating and cooling requirements, respectively. The conventional internal combustion engine vehicle uses waste heat from its engine to provide for passenger thermal requirements at no cost to the vehicle’s propulsion energy demands. However, the electric vehicle cannot avail of this luxury to recycle waste heat. In order to reduce the energy consumed by the climate control system, an analysis of the temperature profile of a vehicle’s cabin space under various weather conditions is required. The present study presents a temperature predicting algorithm to predict temperature under various weather conditions. Previous studies have limited consideration to the fluctuation of solar radiation space heating to a vehicle’s cabin space. This model predicts solar space heating with a mean bias error and root mean square error of 0.26 and 0.57°C, respectively. This temperature predicting model can potentially be developed with further research to predict the energy required by the vehicle’s primary lithium-ion battery to heat and cool the vehicle’s cabin space. Thus, this model may be used in a route planning application to reduce range anxiety when drivers undertake a journey under various ambient weather conditions while optimising the energy consumption of the electric vehicle.
Introduction
The thermal analysis of a cabin space can be used for various reasons. Chang et al. (2018) present a thermal analysis to determine the air quality of a cabin space and the level of exposure a driver has to CO2 as temperatures in the cabin increase. The aforementioned paper presents various ventilation solutions to reduce potential safety risks to road users. Additionally, a thermal analysis of the vehicle’s cabin space can be used for forensic purposes and the effect of various levels of temperature has on the human body (Dadour et al., 2011). Other thermal analyses investigate the use of glazing covering or glazing alterations to mitigate heat build-up in the vehicle’s cabin space to reduce cooling requirements (Al-Kayiem et al., 2010; Chakroun and Al-Fahed, 1997; Jasni and Nasir, 2012; Lahimer et al., 2018; Srisilpsophon et al., 2007).
The electric vehicle (EV) cannot avail of waste heat from a combustion engine to heat the cabin space similar to the conventional fossil-fuelled vehicle; thus, energy must be provided resulting in an increase in energy consumption. A thermal analysis of the cabin space can identify the properties that determine the energy required to heat or cool a cabin space. A vehicle’s cabin space has several factors that influence space temperature when compared to that of a building: exposure to solar radiation, poor insulation characteristics of the vehicle’s body, the thermal stratification of the cabin’s environment and a short period of time required to achieve thermal comfort are the deciding factors that determine the energy consumption of the vehicle’s built-in heat pump (Dance et al., 2016).
Energy consumption measurements have been a topical subject in recent years. The European Union has developed the Worldwide Harmonised Light Vehicle Test Procedure (WLTP) to accommodate for alternative propulsion powertrains, thus taking the place of the New European Driving Cycle (NEDC). The new WLTP is a holistic testing approach whereby the drive cycles replicate a realistic on-road drive cycle, with higher average speeds, longer distances, in addition to the CO2 performance of new vehicles registered in September 2018 onwards. Mansoura et al. (2018) recognise the discrepancies in the method used to measure energy consumption in comparison to actual values. The aforementioned study presents an assessment framework to consider the energy required to heat and cool the cabin space in addition to auxiliary electrical requirements under the new WLTP. It was found that energy consumption of a Series Hybrid EV increased by 43 and 59% when cooling and heating is required, respectively. However, it has been acknowledged by several studies that energy consumption as a result of thermal demands vary significantly depending on the ambient environment the cabin space is exposed to (Bradley and Frank, 2009; Chan, 2007; Kambly and Bradley, 2015). Tian et al. (2018) illustrates how thermal management systems can be implemented in EVs to improve the energy performance of the vehicle when the climate control system is operating to optimise vehicle range.
The focus of previous thermal models has been to predict temperature and physical parameters such as solar radiation, convective heat transfer and other cabin space parameters in order to predict the thermal comfort for an occupant (Alahmer et al., 2012; Fanger, 1967; Kaynakli and Kilic, 2005; Martinho et al., 2004). The conventional internal combustion engine vehicle (ICEV) recycles waste heat from the engine to heat the vehicle’s cabin space with no impact on vehicle’s range. The conventional ICEV consists of numerous moving parts. As a result, a significant amount of energy is lost to many mechanical processes in the ICEV’s technology. Holmberg et al. (2012) state that 33% of ICEV’s total fuel energy is lost to exhaust emissions, 29% is consumed by cooling requirements and the remaining 38% is used to mechanically power the vehicle. The letter study computes that 21.5% of the total fuel energy of an ICEV is used to move the vehicle. Previous studies report that when fuel is being consumed in the ICEV, approximately 85% of total fuel energy is converted to heat (Li et al., 2014; Tie and Tan, 2013). Thus, heating energy required for cabin thermal comfort is not represented in the energy consumption analysis of the ICEV. However, with an increase in EV penetration in the automobile market, energy that was previously ‘free’ now has an economic, energy and environmental consideration when an EV is recharged using the UK’s national electricity mix.
Radiation heat transfer contributes to space heating as a result of exposure to solar radiation. Previous studies on thermal comfort and thermal modelling have considered solar radiation contributions to space heating (Fanger, 1973; Marcos et al., 2014; Torregrosa-Jaime et al., 2015). However, these studies are limited in tracking the sun’s movement in relation to the vehicle and focus more on the development of convection heat gains and losses rather than expanding a thermal radiation model. A study by Torregrosa-Jaime et al. (2015) developed a transient thermal model, however, limited data availability for thermal properties of the vehicle. The aforementioned study adjusted parameters in the algorithm to minimise the deviation in error between measured and computed values. Thus, adjusting inputs to optimise results may result in inaccurate information on the performance of the developed algorithm. Additionally, Torregrosa-Jaime et al. (2015) are limited in calculating solar irradiance at various angles of incidence. Marcos et al. (2014) developed a thermal model to predict indoor temperature of a vehicle under various weather conditions. The model predicted the temperature of an unoccupied stationary vehicle exposed to ambient air temperatures with solar irradiance as the primary heat source. The model predicted temperature with an RMS error of 1.53°C. This paper will present the energy consumption of the EV and present a numerical temperature predicting algorithm that may be developed to be used in future route planning applications to aid users in optimising the energy consumption of EVs.
Energy consumption of the electric vehicles climate control system
To evaluate the energy consumption of the climate control system, an EV driver (Renault Zoe EV driver) recorded their drive cycles and noted when the heating and cooling system was in operation. The driver was asked not to alter their driving pattern or style, so that realistic data could be collected for further analysis. The driver recorded the journey start time, the temperature recorded by the vehicle’s display board (indicating outside ambient temperature) and the journey end time. At the end of the trip, the driver recorded the vehicle’s traction, the regenerative and climate control energy consumption obtained by the vehicle’s trip summary report displayed by the vehicle’s built-in algorithm. The data collected varied according to distance, journey time, route, climate and ambient temperature conditions.
Energy consumption: Heating mode
The data collected by the diary were divided into diurnal driving, as seen in Figure 1 and nocturnal driving, as seen in Figure 2 for climate conditions when heating was required. The desired inside cabin temperature was set at 24°C on the vehicle’s on-board control panel (represented as the maximum temperature setting, Ti). The lower the outside ambient temperature (To), the greater the temperature differences between the outside and desired temperature, and the greater the value for Ti – To. As illustrated in Figures 1 and 2, the value for the temperature difference is higher during nocturnal driving conditions. To ensure that data for various journey lengths were comparable, the energy consumed for the total trip journey per duration of the trip was compared (Wh/min).
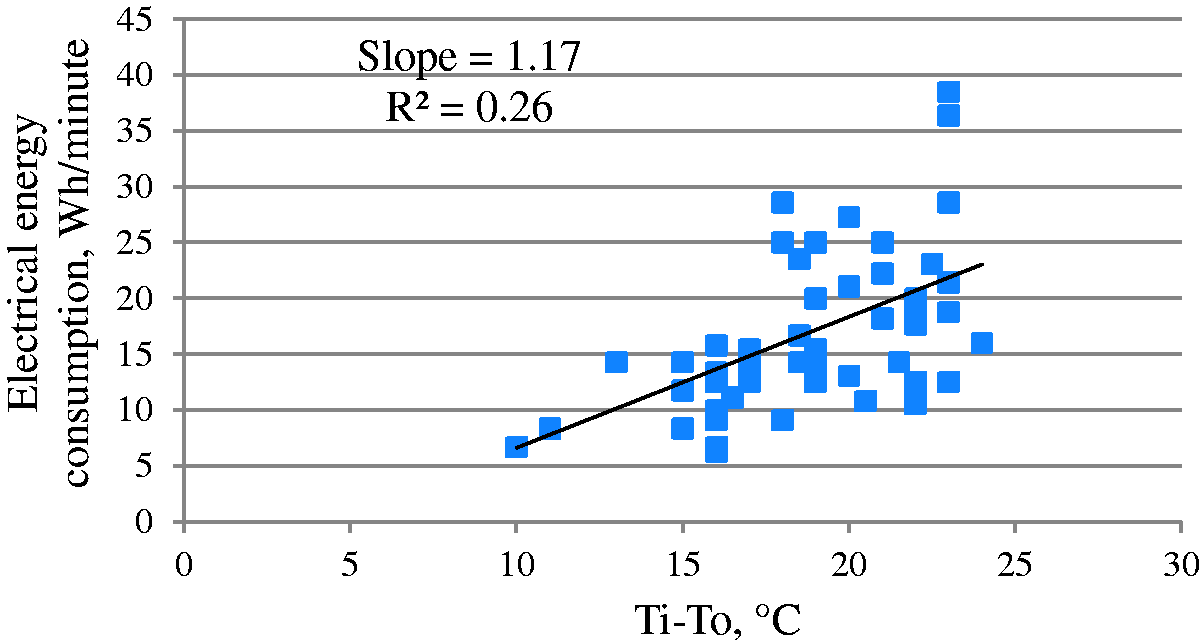
Energy used for various temperature differences between outdoor and indoor cabin air temperatures: diurnal driving. Note: Ti – To is the difference between indoor desired cabin temperature, Ti (24°C) and the outside ambient temperature, To.
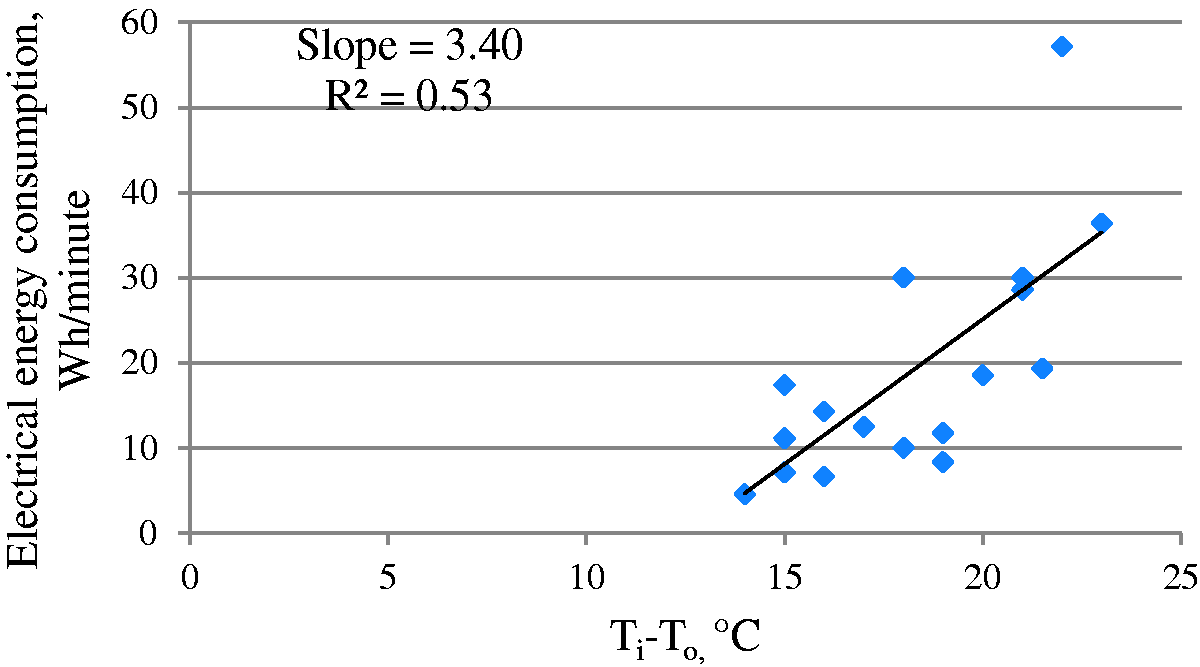
Energy consumed in relation to the difference between indoor cabin (Ti) and outdoor (To) air temperature: nocturnal periods. Note: Ti – To is the initial difference between the indoor desired cabin temperature (24°C) and the ambient temperature outside.
The dispersion of data indicates that the relationship between temperature and the electrical energy used by the vehicle’s battery is not clearly linear and may involve other influential factors when determining the energy consumption of the built-in climate control system. The maximum energy consumption recorded for diurnal drive cycles reached nearly 40 Wh/min. When compared to the energy consumption of nocturnal driving cycles, the energy consumption reached a maximum of over 55 Wh/min. At a temperature difference value of 24°C in Figure 1, energy consumption varies from 13 to 38 Wh/min. This wide range of energy consumption indicates that the addition variables other than outside temperature determine energy consumed by the inbuilt climate control system suggesting that solar irradiance and wind speed have an impact on cabin temperature.
When the vehicle is stationary, there is no consumption of traction energy. Thus, the journey time is not considered when computing traction energy consumption. However, if traction energy is nil, for example, at traffic management stop signal, the operating climate control system will continue to consume energy. Thus, the length of time travelled with the climate control system in operation will contribute to energy consumption, regardless of whether or not the vehicle is moving. The nocturnal drive cycle durations varied from 7 to 31 min. Figure 2 illustrates that at approximately 22°C of a temperature difference, a data point shows an energy consumption of more than 55 Wh/min, which indicates that although there is an absence of solar radiation, other properties may affect the energy consumption of the climate control system. This point represented a seven-minute commuter drive cycle – one of the shortest journey times in the data set. A cabin space initially requires a considerable amount of energy to increase or decrease temperature, and a smaller quantity of energy is required to maintain the space at the desired temperature (ASHRAE, 2013). The aforementioned data point with an energy consumption of 55 Wh/min experienced high climate control energy consumption, which may have been operating in this energy intensive period, suggesting that the cabin space did not reach thermal steady state. The data collected demonstrate that the percentage of energy used by the heating system is up to 30% of the overall energy consumption for a trip, as seen in Figure 3.
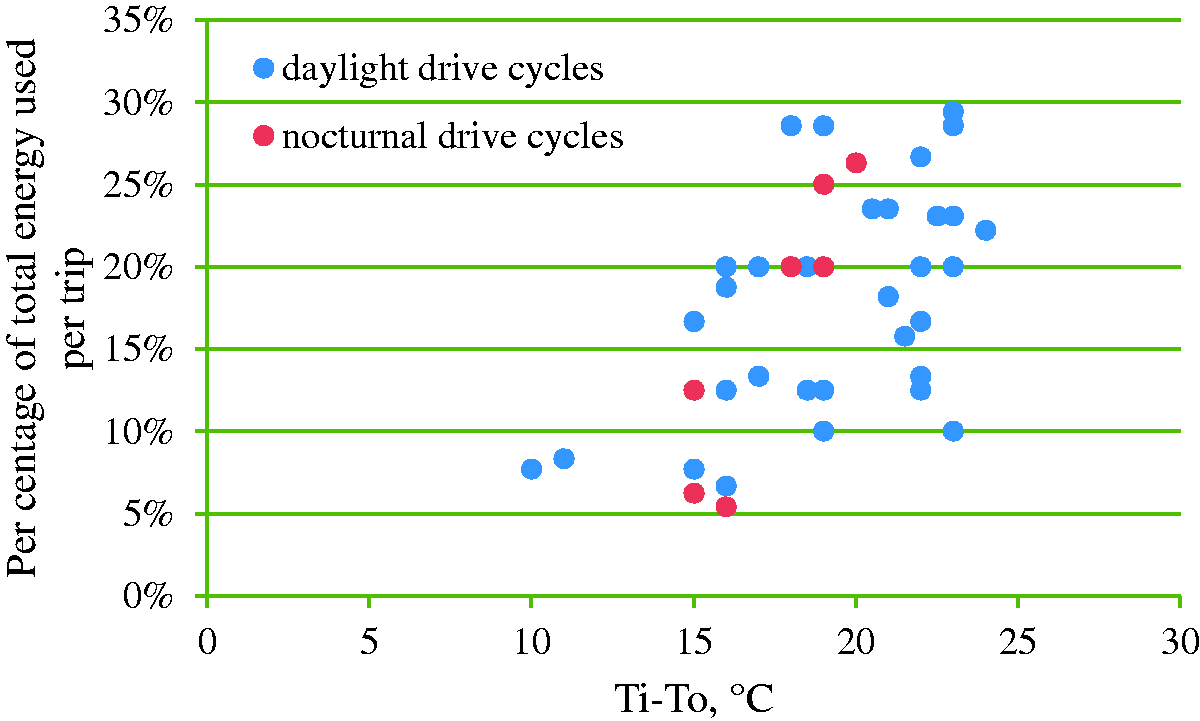
Energy consumption of the EV’s heating system in comparison to the vehicle’s total trip energy consumption recorded from October 2014 to December 2015.
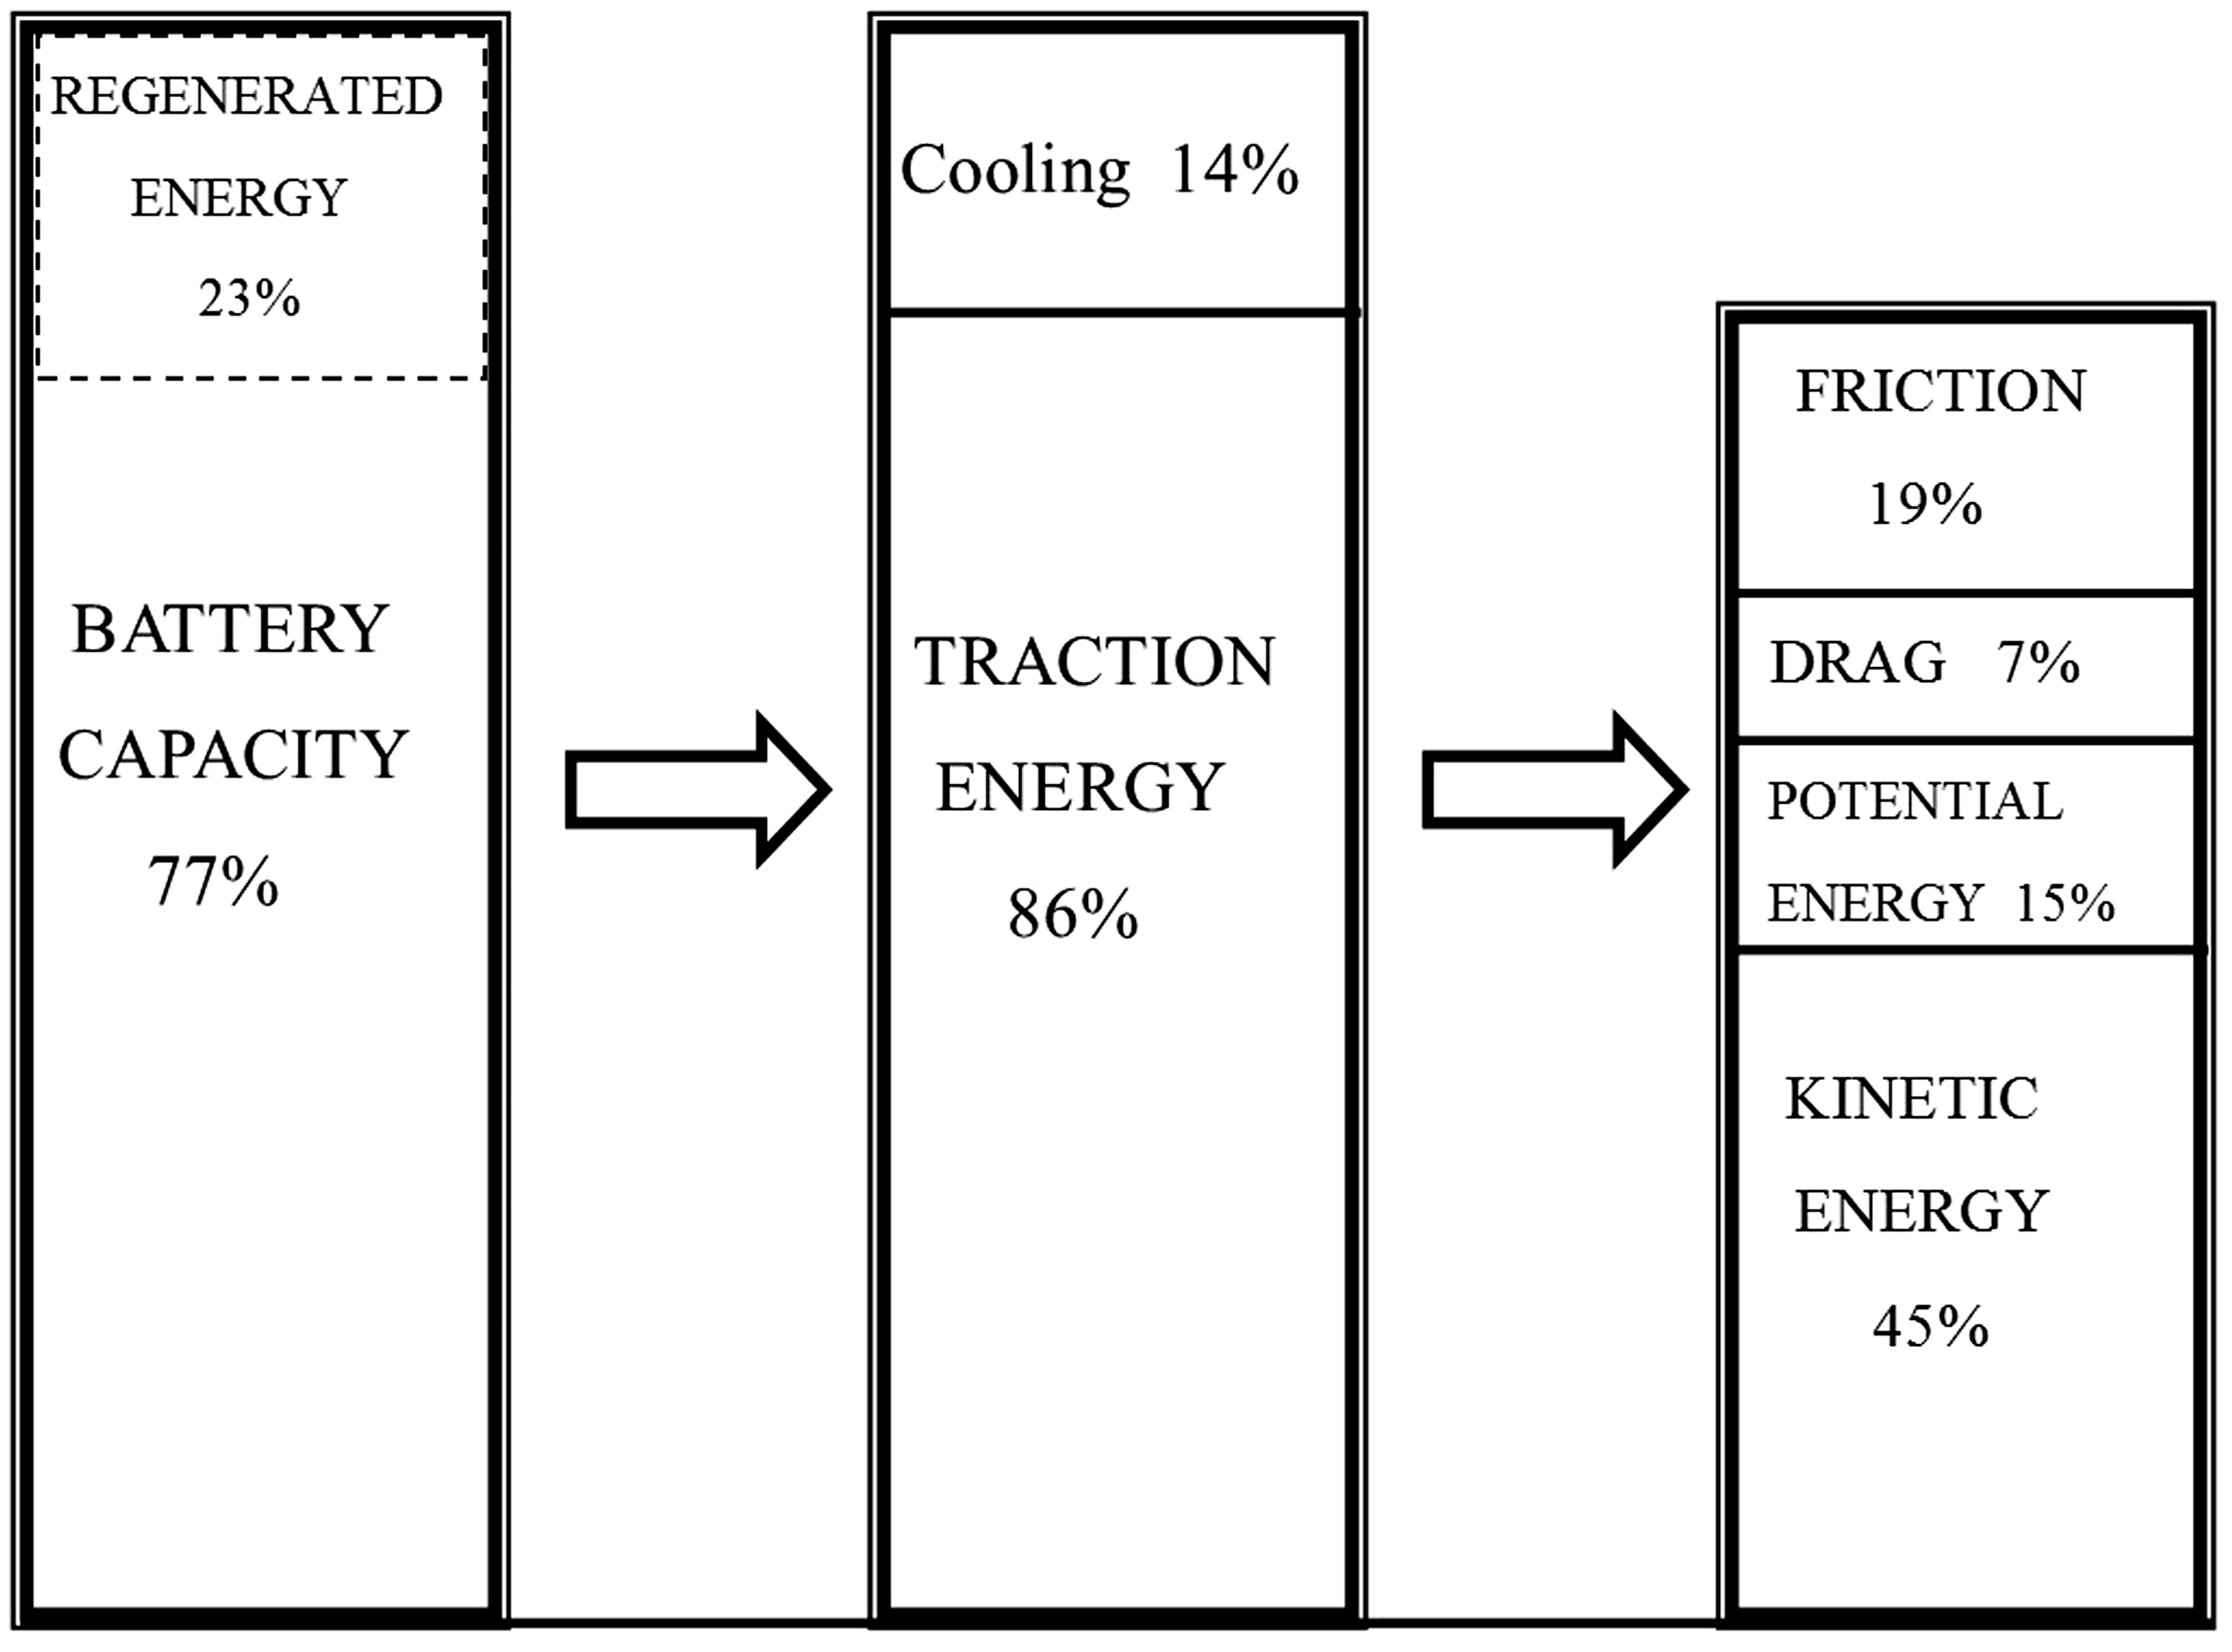
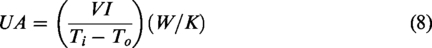
The data collected from the EV driver’s diary were used to determine the average energy consumption breakdown of the EV when the heating system is in operation. Figure 4 can be read alongside data presented by Holmberg et al. (2012) illustrating the energy consumption of the ICEV. The unique component that appears in the EVs energy consumption diagram is the use of regenerative braking technology, which provides the EVs battery with an additional 21% energy capacity. An average heating requirement of 18% appears on the EVs energy-consumption diagram, unlike the IECV, which uses ‘waste energy’ to heat the vehicle’s cabin space. Although heating requires energy in the EV, a larger proportion of the energy source is allocated to vehicle propulsion, in comparison to the ICEVs 21.5% of energy provided by the fuel source to propel the vehicle (Holmberg et al., 2012). Traction energy is further divided into friction, drag, potential energy and kinetic energy consumption. The latter energy figures are computed by analysing of 16 EV drive cycles presented by Muneer et al. (2015) who developed a numerical algorithm to predict traction and regenerative energy of the EV battery for 16 predetermined routes around Edinburgh using the following equation

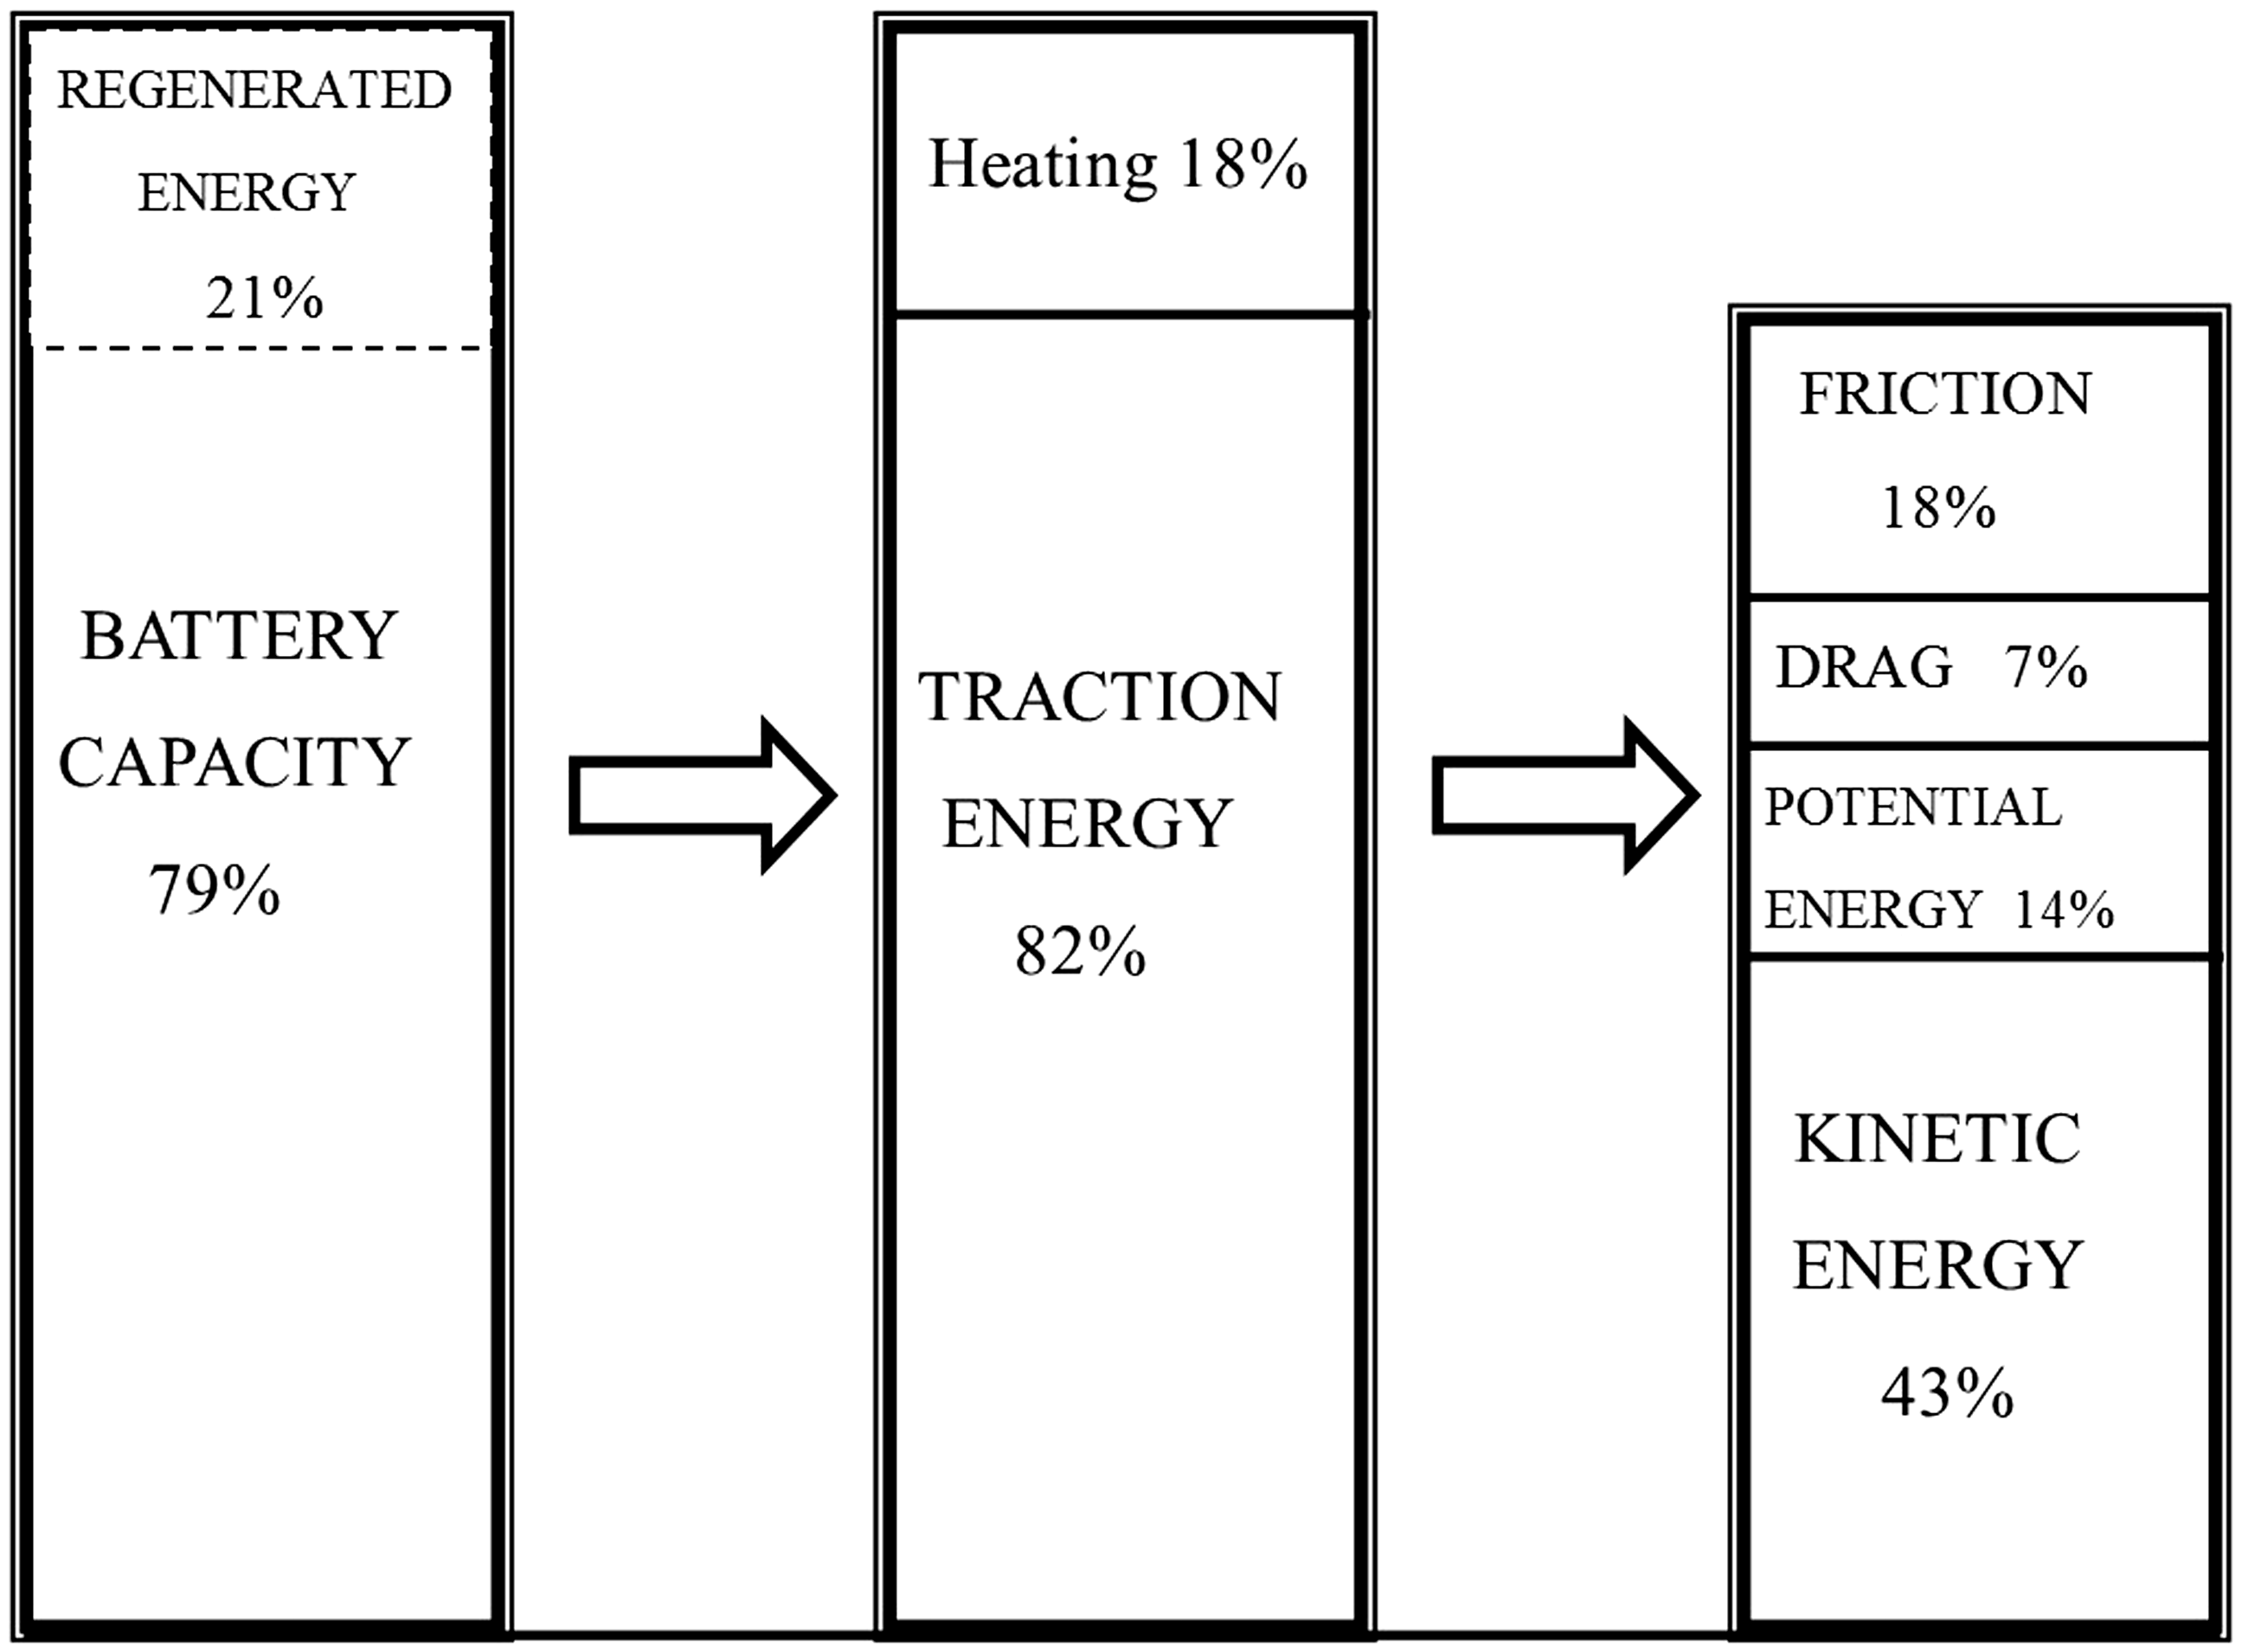
Energy consumption of an EV’s urban drive cycle in Edinburgh; heating mode in operation.
Energy consumption: Cooling mode
Similar to the ICEV, the EV requires energy to cool the vehicle’s cabin space. An EV driver noted the energy consumption of the EV when the built-in cooling system was operating and set to 17°C (the minimum on-board temperature setting). This temperature is near the lowest acceptable temperature range for an occupant in a naturally ventilated space in Edinburgh as stated by ASHRAE’s (2012) occupant thermal comfort range. Figure 5 shows the results of the driver’s collected data, presenting the energy consumed plotted against the temperature difference between the outside temperature (To) and the desired indoor cabin temperature (Tdes).
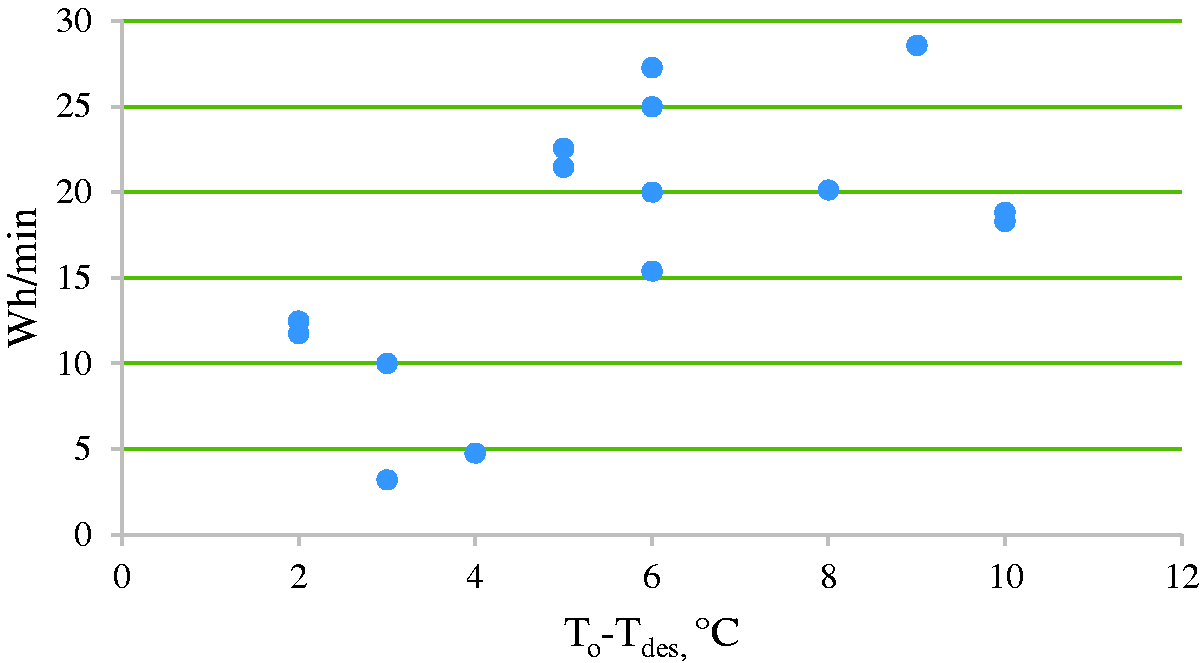
Energy consumption for various temperature differences between the outside temperature and the desired indoor cabin temperature (set at 17°C).
The coefficient of performance of the heat pump’s cooling system will always be less favourable compared to its heating system. This is because work is required to transfer heat from a cold to a high temperature body to be in agreement with the Second Law of Thermodynamics. Thus, it is expected that more energy is required for cooling in comparison to heating requirements. However, the present preliminary study observed maximum energy consumption by the cooling system at nearly 30 Wh/min, seen in Figure 5. Figures 1 and 2 illustrated that the maximum energy consumption for the heating system under diurnal and nocturnal drive cycle conditions was 40 and 55 Wh/min, respectively. Although the cooling system is operating in an ‘unnatural’ direction and has a lower coefficient of performance value, the difference in outside and ambient temperatures is considerably lower for the cooling system in Edinburgh when compared to the temperature difference experienced when heating is required. In Figure 5, the maximum temperature difference when analysing the energy consumption of the cooling system was observed as 10°C and the aforementioned heating observations recorded 10°C as the minimum temperature difference between the outside and desired internal temperature. Thus, despite the vehicle’s built-in cooling system having a lower coefficient of performance value to that of the heating system, the energy consumed by the vehicle’s cooling system is lower as a result of a lower temperature difference between the external and internal temperature.
Figure 6 illustrates the energy consumption of the EV when the cooling system is in operation as a percentage of the overall battery energy capacity. On average, the cooling system uses 14% of the total battery capacity – 4% less energy than that of the heating system. When comparing the latter to the energy consumption of the EV in heating mode (see Figure 4), the cooling system harnesses more regenerative energy. This is because less energy is required for cooling compared to the heating system, thus more energy is allocated to traction. Increasing traction energy allows for an increase in the opportunity to recapture kinetic energy.
Energy consumption of an EV’s urban drive cycle in Edinburgh; cooling mode in operation.
Model description
The temperature algorithm developed includes a solar and thermal model. The developed model assumes that the vehicle has flat external and internal surfaces. This transient thermal model predicts indoor cabin temperature under various ambient conditions. Additionally, the model is developed to predict temperature with the installation of an auxiliary heating and cooling system. Figure 7 presents the positioning of the recording equipment that was used to collect data for the purpose of validating the model. Six k-type thermocouples; two at feet, two at abdominal and two at head level were placed inside the vehicle and two thermocouples were positioned outside the vehicle and subject to the ‘wind effect’. A pyranometer was placed on the roof of the vehicle to record horizontal global radiation. Temperature and solar radiation measurements were collected at 10 s intervals. The present study predicts the temperature of a cabin space with an underlying aim to understand the energy consumption of an EV built-in climate control system and thus how energy consumption may be optimised.
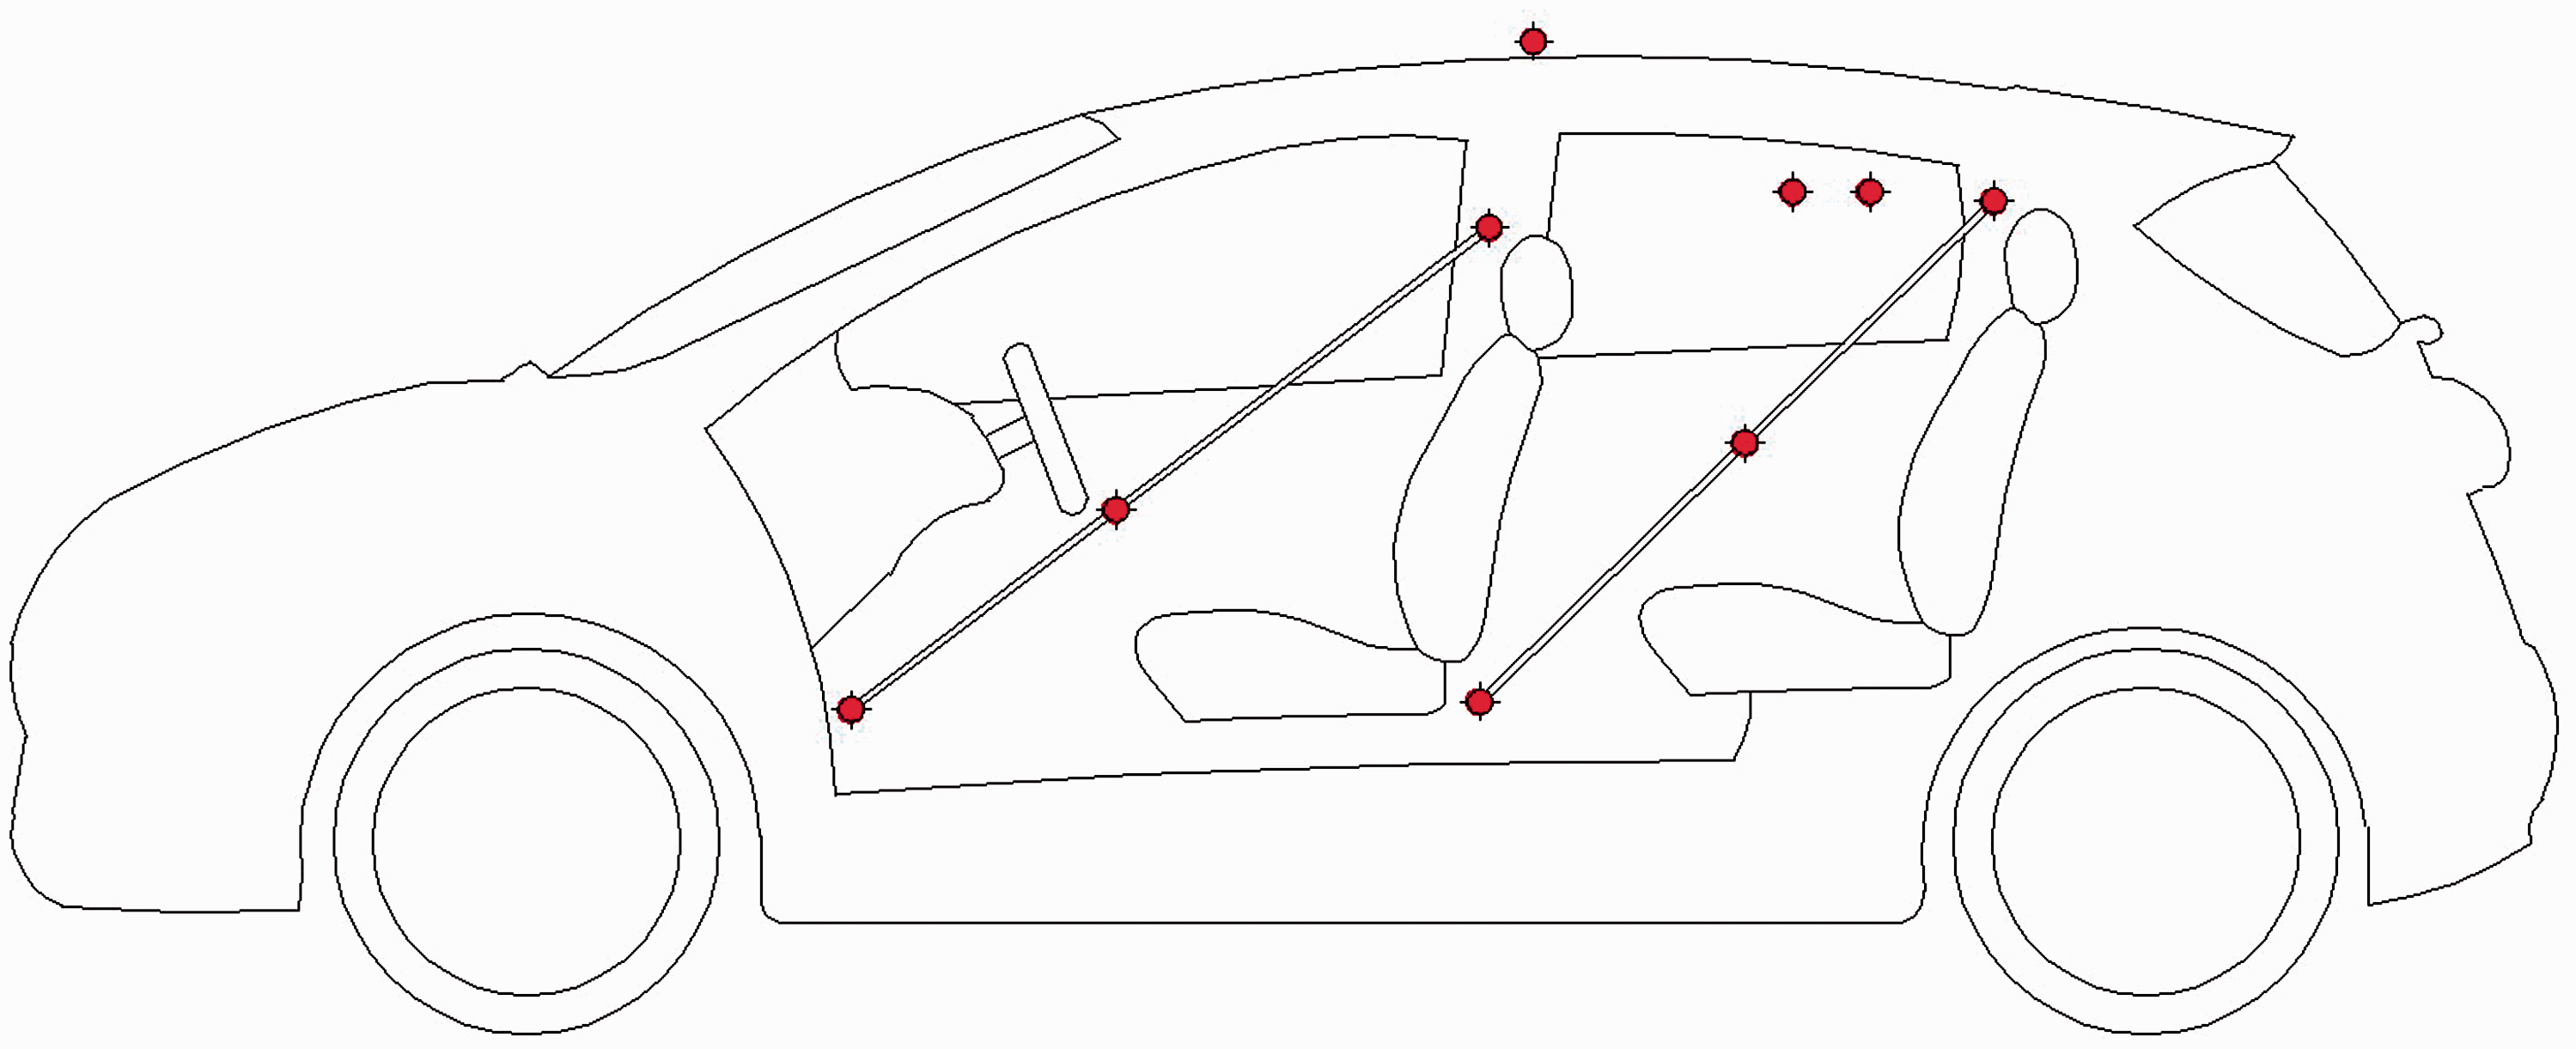
Positioning of thermocouples and pyranometer.
Solar model
To accurately predict radiation heat loads, the present research expands a previously developed solar model to locate the sun’s position in the sky in relation to the stationary vehicle to calculate the effect of solar irradiance on cabin space temperature. Muneer et al. (2000) developed a solar model to calculate the incident solar irradiance on a sloped surface. The present research extends this model to calculate the solar irradiation of a sloped surface with various sides, as seen in the case of a vehicle. Previously, the model has been used for a single sloped body. Table 1 and Figure 8 present the glazing’s dimensions, geographical position and label, where ASP is the aspect at which the windshield or driver is facing. A north facing vehicle is indicated as 0°, and south facing is represented as 180°.
Properties of vehicle for use in the present model.
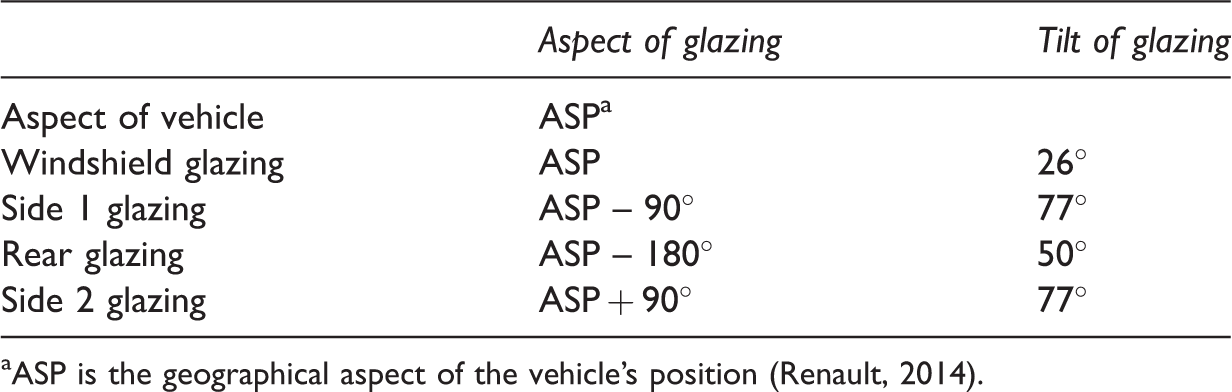
aASP is the geographical aspect of the vehicle’s position (Renault, 2014).
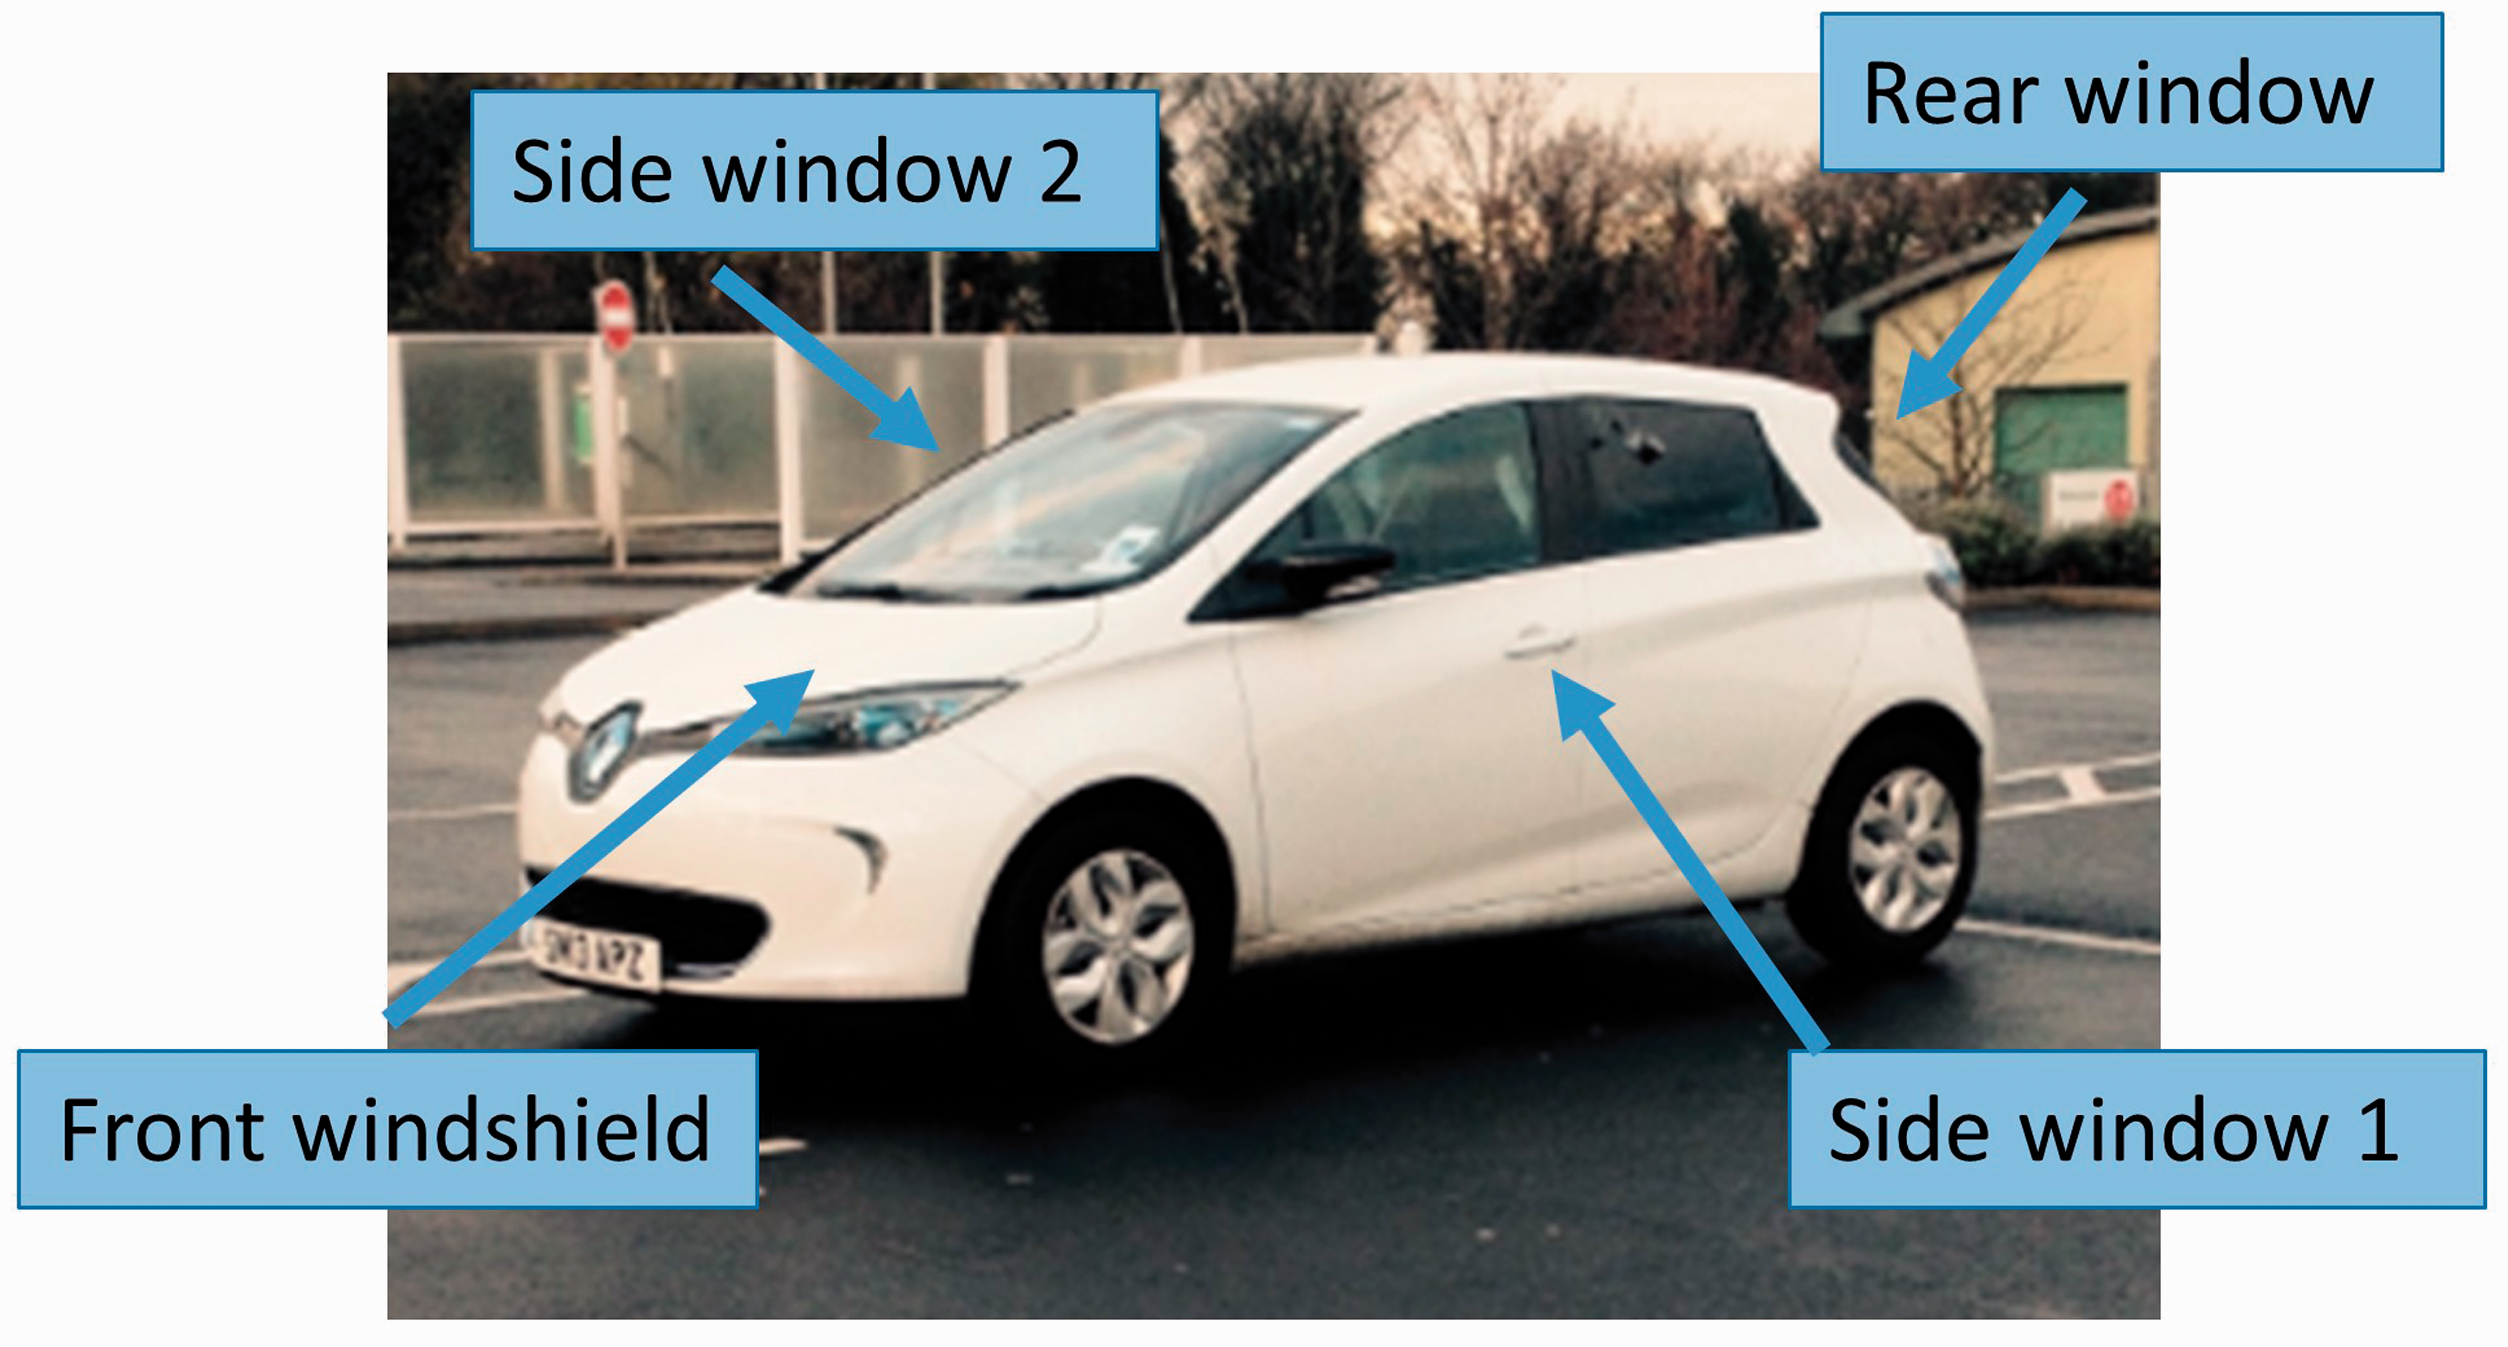
Vehicle sides labelled.
Inputs required for the developed model include
Time of day Horizontal solar radiation Outdoor ambient temperature Initial cabin temperature at beginning of analysis Aspect or geographical orientation of the vehicle Inclination angle of the vehicle’s glazing Vehicle dimensions Thermal properties of the vehicle, that is the thermal capacitance and the thermal time constant.
To calculate beam transmittance, the angle of incidence from the supporting solar model used equation (2) (Hopkinson et al., 1966)


Developing a temperature predicting algorithm
When developing a thermal model to accurately predict the indoor air temperature of a cabin space, it is important that the specific thermal properties of the vehicle or body in question are established. The presently developed thermal model is developed to consider convection, radiation, conduction, heating and ventilation loads. The algorithms are developed as follows:
Convection heating loads
The relationship between outdoor ambient and indoor cabin space temperatures is represented by convection heat transfer and is found by the following


Auxiliary heating loads
An auxiliary heating system was installed in the vehicle’s cabin space. This additional system was independent of the built-in EVs heating system and powered by a 12 V lead acid battery. The selected heating system was determined using the following equation

Auxiliary cooling loads
The ventilation energy associated with the transfer of warm air from the inside cabin to the outside environment (Qvent) is found by the following equation

Temperature predicting algorithm: Heating mode
The heating thermal model was applied under two experimental conditions: first, the model was applied when the test vehicle, Renault Zoe EV, was stationary and exposed to solar radiation and real world outside ambient conditions; and second, two-200 W auxiliary fan heaters were installed into the cabin space under nocturnal conditions. The following will present an algorithm to predict temperature when solar irradiance and an auxiliary heating system are considered as the cabin’s primary heat source.
Development of solar space heating model
It is assumed that the heat gain by solar irradiation is uniform throughout the cabin as it heats the interior material and an increase in cabin air temperature is subsequently observed. The developed algorithm calculates the indoor cabin temperature of the test vehicle considering outdoor ambient temperature and solar irradiance as the dependent variables of space heating. The predicted temperature (ti+1) is found by the following

The developed algorithm was validated using six sets of experimental data. Measured temperatures were recorded and compared with computed temperatures to validate the accuracy of the numerical algorithm.
Development of auxiliary heaters thermal nodal model
The second heating process considered in the present study was based on two-200 W fan heaters operating under nocturnal conditions. In comparison to the latter heating process where incident solar irradiation was considered as a uniform heat gain, the auxiliary heaters were introduced as point loads. Thus, it was expected that the thermal algorithm developed to predict cabin temperatures under auxiliary heating conditions will underperform in comparison to the solar irradiance algorithm due to the thermal stratification of the vehicle’s cabin space. The thermal stratification of the cabin space and non-uniform heat gain by the auxiliary heaters prompted the further exploration of a nodal model similar to Mezrhab and Bouzidi (2006). The present study explores the development of a 10-nodal model to evaluate how the embedded layers of the vehicle’s material influence cabin air temperatures. In the cabin space heating model, when auxiliary heaters are used as the primary energy source, it is important to consider how the heat is slowly absorbed by the materials’ embedded layers. These individual layers, or nodes, consider how the vehicle’s material contributes towards space heating through conduction heat transfer. Previous models (Marco et al., 2014; Torregrosa et al., 2015) have developed methods to predict temperature, but no studies have developed a nodal model that considers multiple layers of vehicle material. The vehicle’s cabin space was divided into two categories: seat and fascia (the fascia includes the door panels and dashboard area).
Figure 9 illustrates the thermal network of the proposed system and the nodal model. The network shows that the vehicle’s material divided into two sections: the seat and fascia and the connecting nodes that influence each other. The sections are divided into five nodes for analysis illustrating the 10-nodal thermal network of a vehicle. Additionally, the schematic network illustrates the nodes that are exposed to solar energy (Qsolar), auxiliary system heat transfer (Qaux) and convection heat gain from ambient conditions (Qamb). The thermal network shows that the thermal capacity of material is also considered in the presently developed model when calculating cabin space temperatures. The thermal model considers heat losses through the vehicle fabric (Qfab) and losses as a result of ventilation energy (Qvent). This network diagram illustrates the need to obtain fascia and seat parameters such as dimensions, material density, specific heat and thermal conductivity properties for the developed nodal analysis. The 10-nodal model considers conduction heat transfer throughout material layers and the influence the material’s interaction between one another has on cabin space temperature.
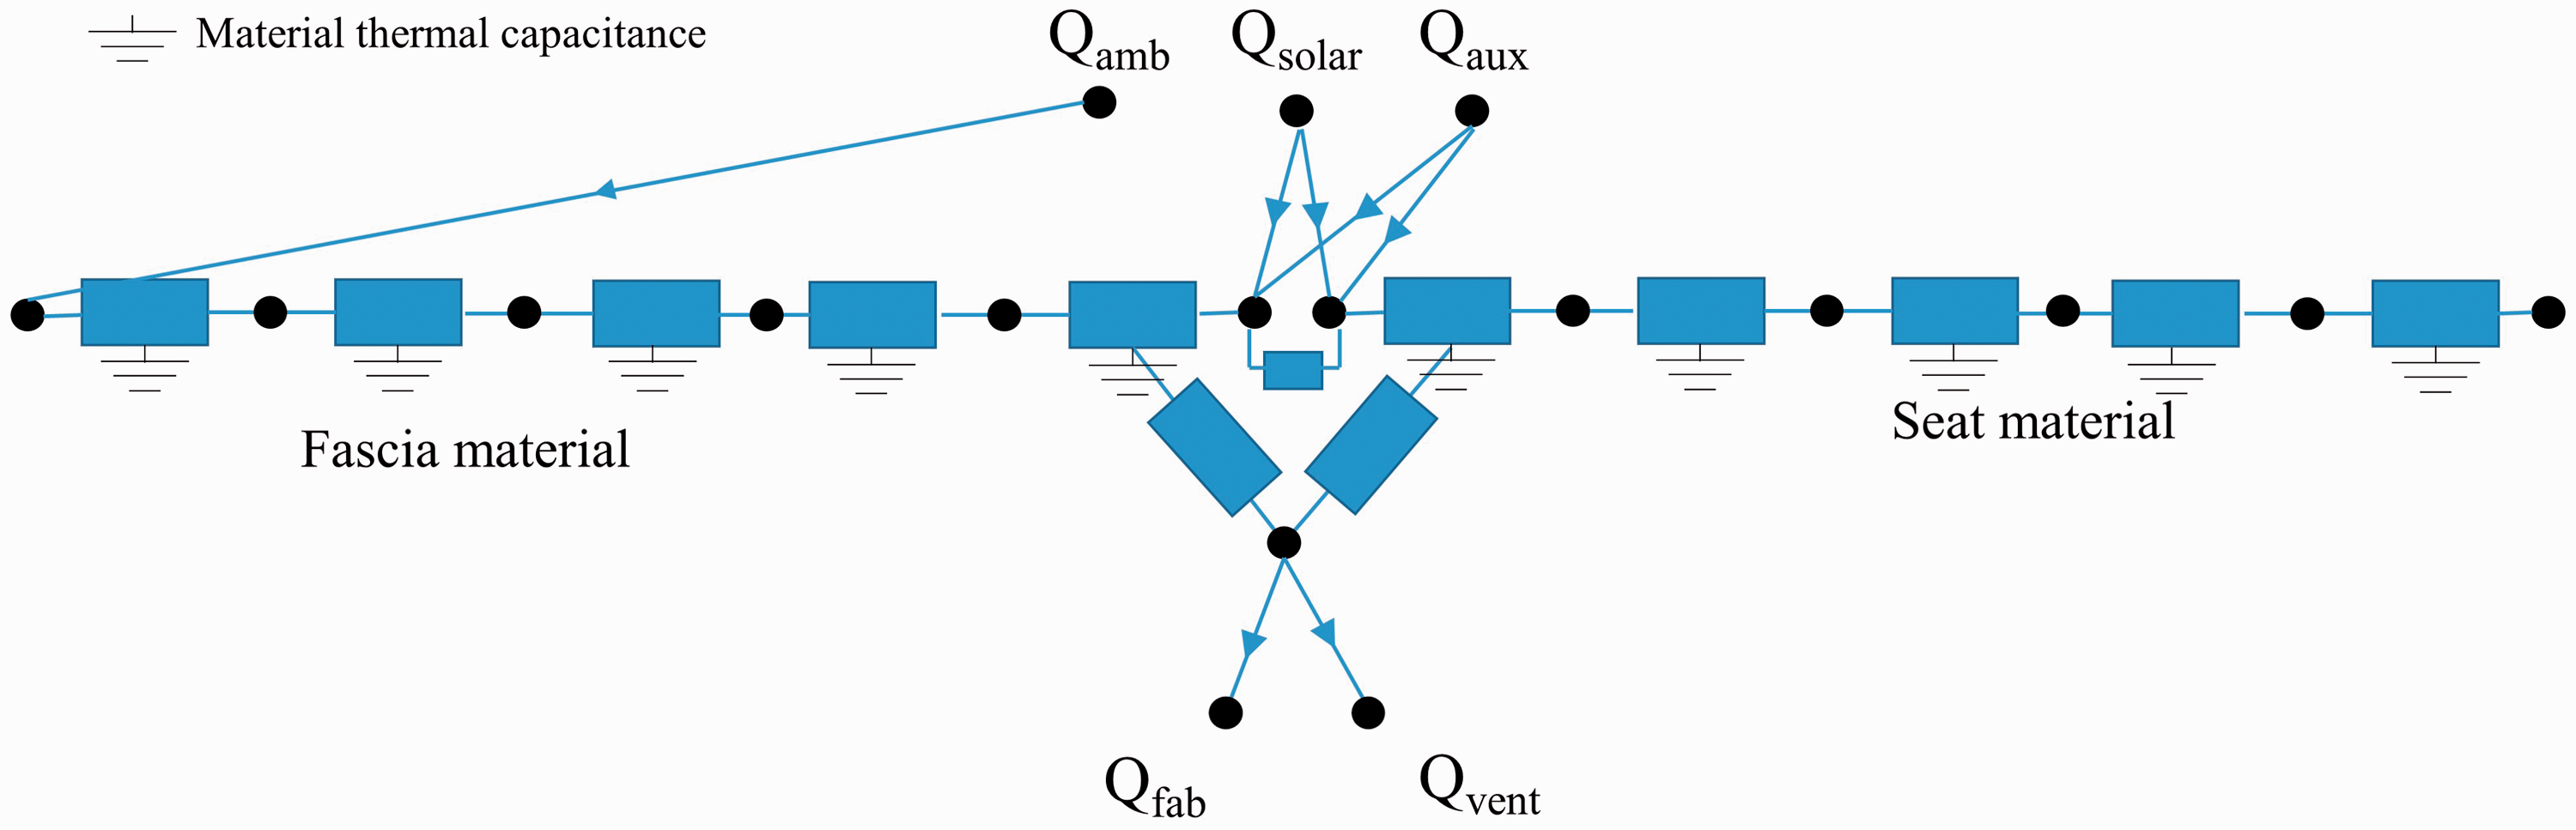
Thermal network of the system. Note: Determining solar energy contribution is complex as solar irradiance includes both point load energy gain and diffuse energy gain components. However, solar irradiance is assumed as a uniform or diffused heat gain contribution to exposed areas. Auxiliary heating and cooling are assumed as point loads.
For the purpose of nodal modelling, the thermal conductivity for the materials fascia and seat layers (mclayer) is determined by

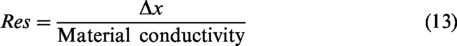
The thermal resistance (Res) of the seats and fascia material for each layer is required for a detailed nodal analysis as follows

The first temperature prediction in the analysis is dependent on measured outdoor ambient and indoor cabin temperatures. This temperature is interpolated throughout the layers of the material. This initial temperature assumed a linear relationship between temperature from the outside environment, throughout the layers, to the inside temperature of the vehicle’s cabin space. This is as a result of the cabin space following similar temperature trends to the environment the vehicle is exposed to. Predicted cabin air temperature was found by the following set of equations


This equation for an external node indicates that the external seat or fascia node is subject to the thermal energy available (Q) from the auxiliary heaters and heat transfer as a result of convectional loads. Figure 10 illustrates the layers and node distances for either the seat or fascia compartments.
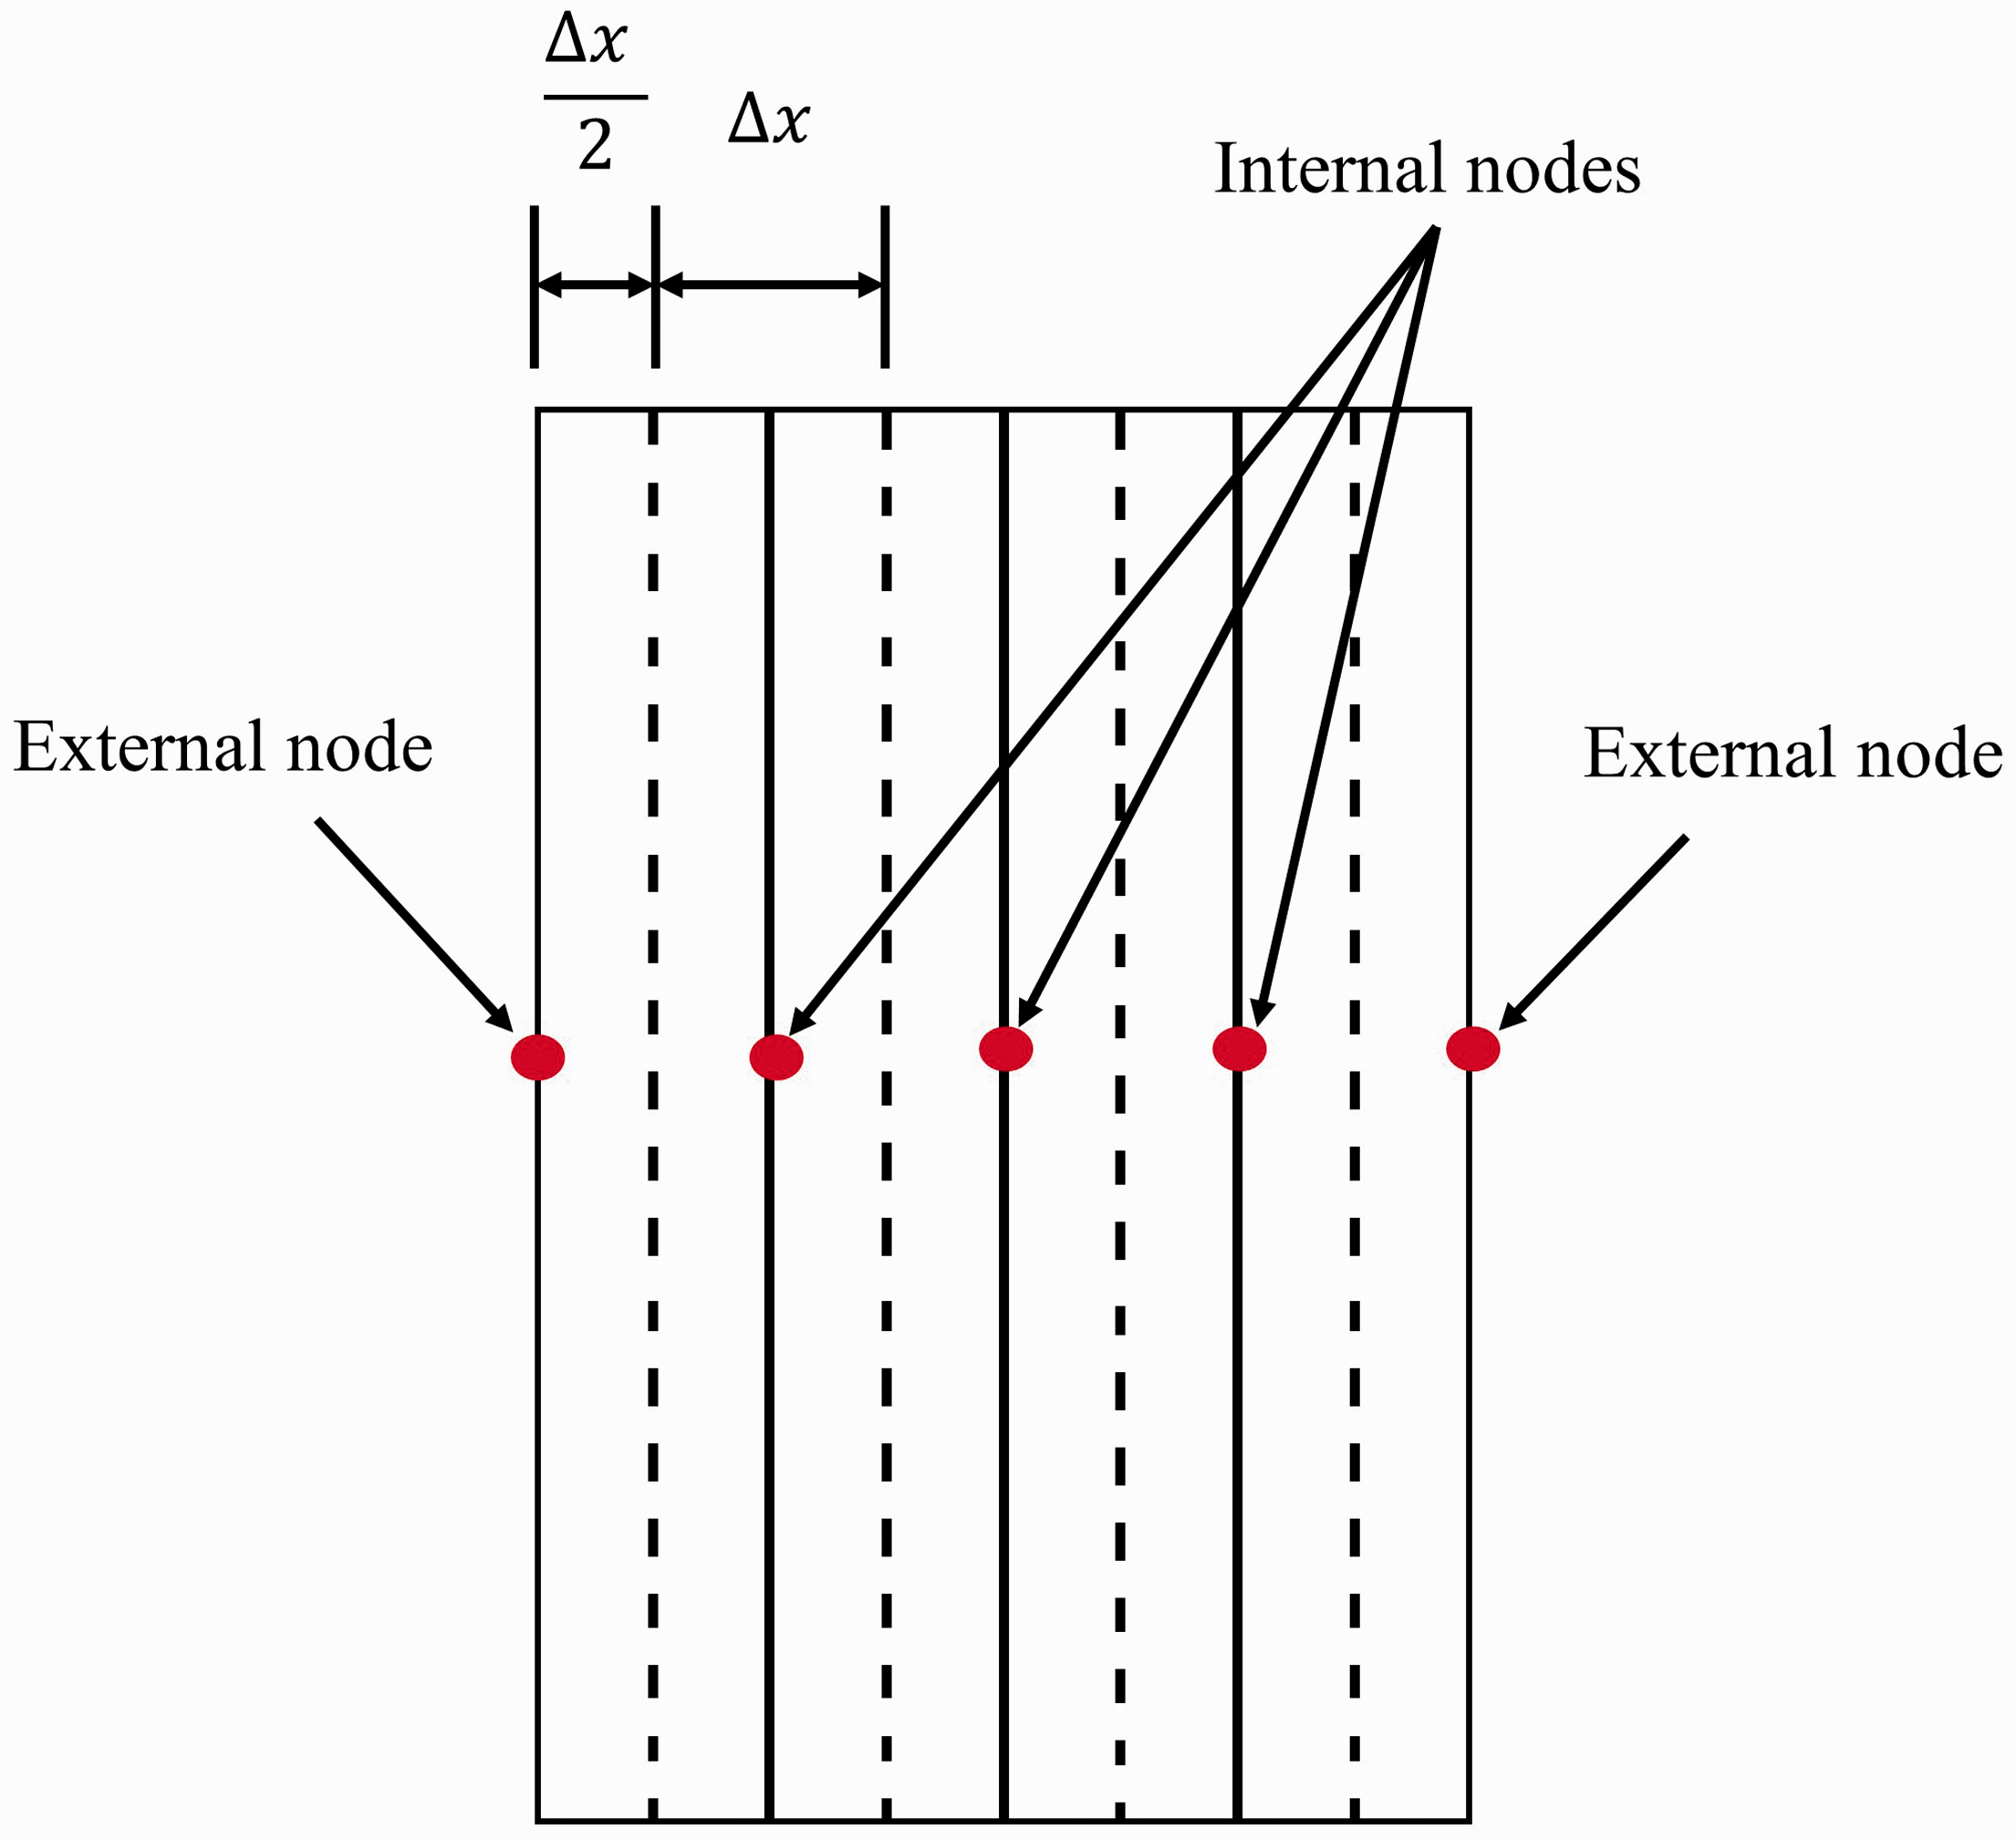
Nodal model layers and node distances.
The internal nodes as shown in Figure 10 consider the full nodal distance. Internal node temperatures are not influenced by auxiliary heaters, solar irradiance or convection heat loads and are only influenced by the surrounding layers. Thus, a value for Q does not appear in the internal node temperature computation as seen in the following equation
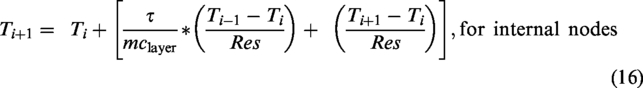
Figure 11 illustrates the positioning of the external and internal node network for the present study and the heat transfer sources each node is exposed to. The VBA program of the developed numerical algorithm is presented at www.dropbox.com/sh/4ujak52u7b1vrgo/AAACZm9hfbx5ZpxTcgAejSPea?dl=0
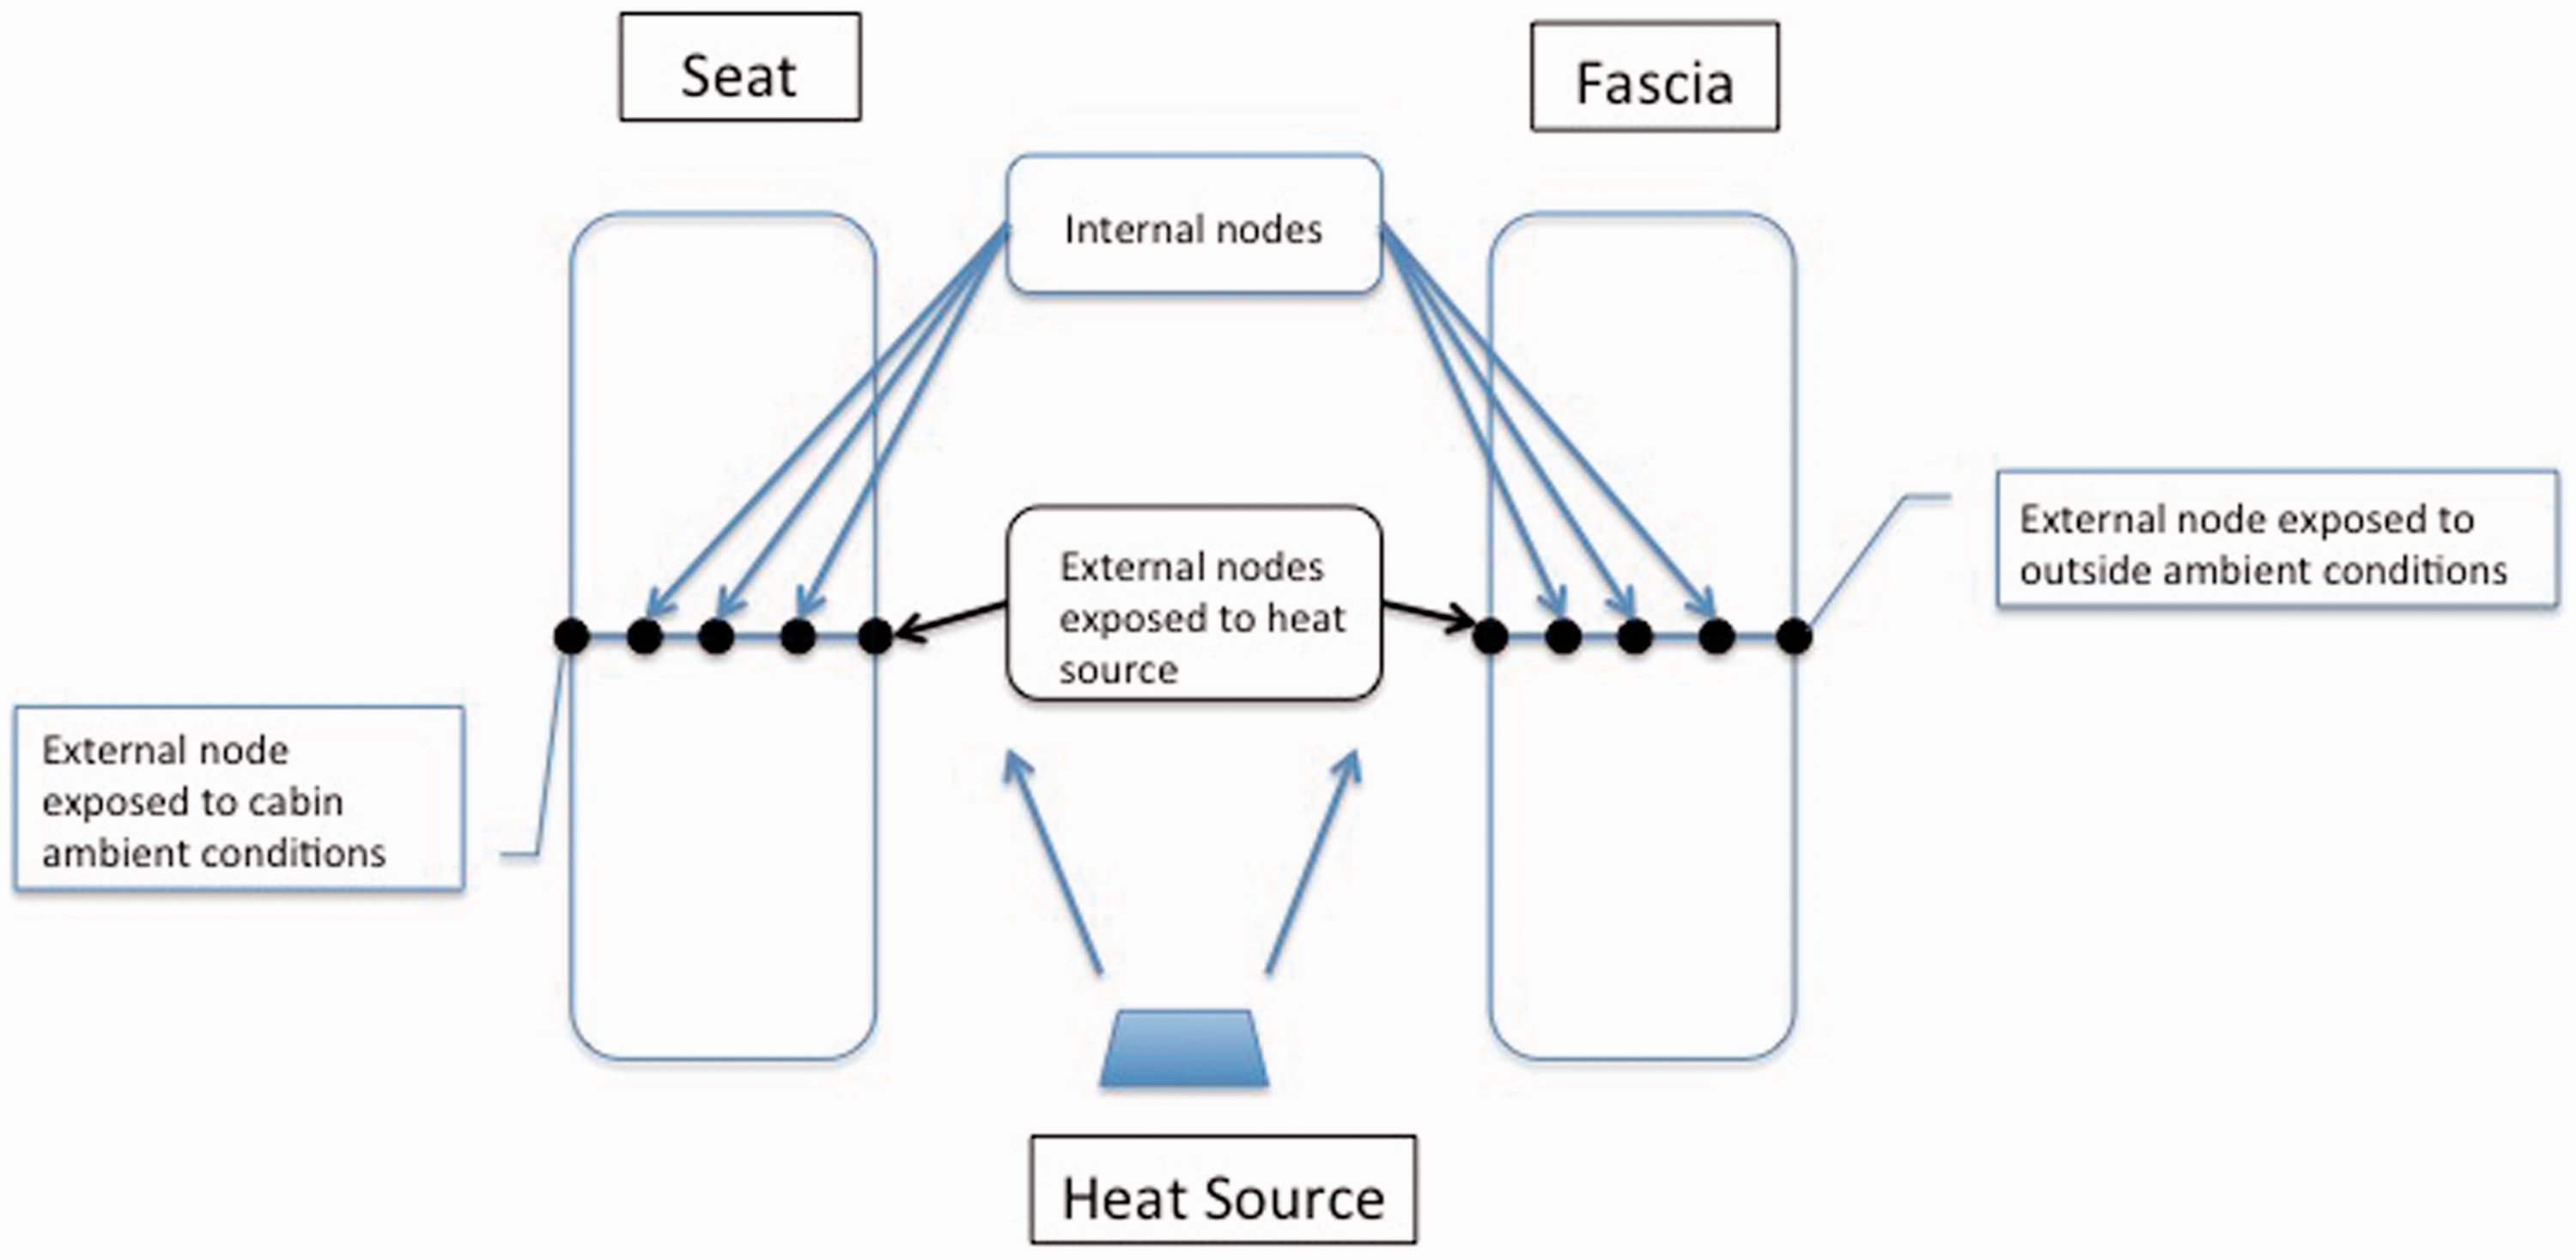
Positioning of internal and external nodes.
Temperature predicting algorithm: Cooling mode
The cabin space was allowed to heat up for a period of time. This period is commonly known as the soak period. When the interior material has reached thermal steady state, the excess heat is released into the cabin environment to ensure a thermal balance; thus, the cabin temperature increases and exceeds outside ambient temperature values. Four-5.3 W and two-21 W extractor fan systems were placed at the top of the vehicle glazing to remove the hottest air in the cabin space in exchange with outside ambient air. Similar to heat gain, as a result of incident solar irradiance, heat is assumed to be removed as a uniform value in the developed thermal algorithm.
Cooling thermal model with four-5.3 W fans
The rate at which air is removed from the cabin space will vary for the two auxiliary ventilation systems. An air pressure test determined that the rate at which air was extracted (ṁ5.3W) by the 5.3 W extractor fan system was 0.0382 kg/s. Ventilation energy can thus be calculated as follows

The numerical algorithm that is used to predict the indoor cabin temperature (ti+1) of a ventilated space using four-5.3 W extractor fans is shown as follows

Cooling thermal model with two-21 W fans
The air pressure test determined a two-21 W extractor fan system’s air removal rate (ṁ21W) as 0.0801 kg/s. Ventilation energy (Qvent(21W)) can thus be calculated as the following

The numerical algorithm used to determine the indoor cabin temperature of a ventilated space is shown as follows

Results
Results for temperature predicting algorithm: Heating mode
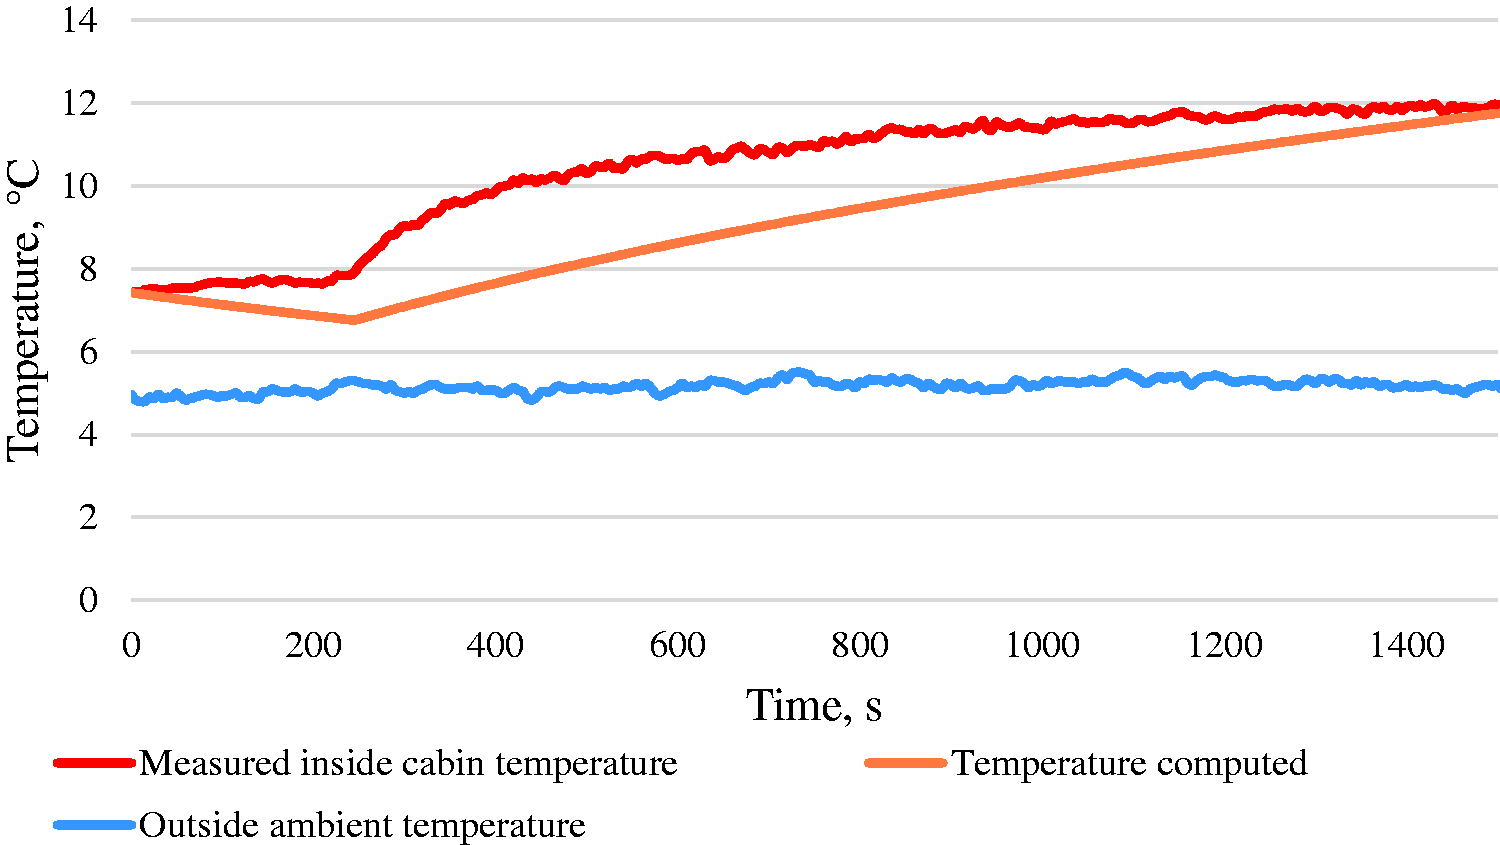
A result from the solar temperature predicting model is shown in Figure 12. The data collected in the aforementioned figure clearly display the impact that solar radiation has on cabin space heating. It can be seen that a gradual reduction in cabin temperature is a result of low solar irradiance intensities available in the cabin space. The temperature does not immediately drop, and this lag is a result of the vehicle’s thermal properties. This data set shows that computed temperature fluctuates in a similar trend to the measured temperature.
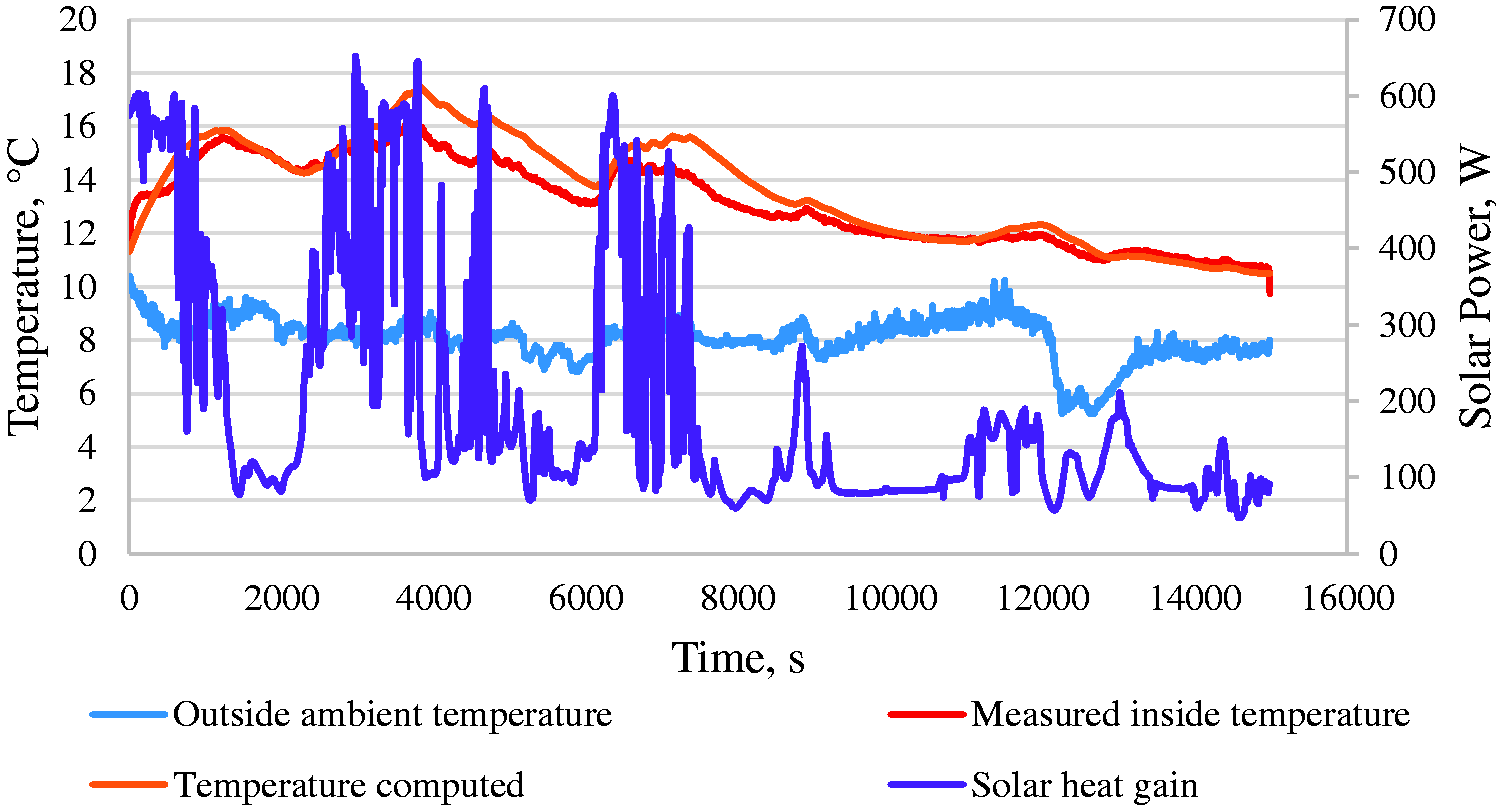
Solar space heating; 8 March 2015.
Figure 13 presents the results of the developed nodal model. The computed temperature follows a similar increasing trend as the measured temperature when the heating system was in operation. The computed temperature did not fluctuate similarly to the results seen in the previous heating model results when solar radiation was the primary heat source. The nodal model was tested under nocturnal conditions to mitigate the influence of solar irradiance’s contribution to space heating. Eliminating solar irradiance as a heat source resulted in a smooth increase and decrease of cabin temperature. Fluctuations in the measured temperature may be a result of the vehicle’s exposure to external climatic conditions, such as wind speed, that the developed model does not consider. The present analysis assumes one temperature to represent a thermally stratified cabin space. Measured temperature is represented by the average weighted temperature of the cabin, where the temperature recorded at abdomen level is the most heavily weighted value. The auxiliary heaters were placed in the cabin space near the abdomen and head level, thus influencing an increase in cabin space temperature when in operation. However, the nodal analysis assumes that the heat is distributed uniformly in the cabin space as opposed to two point loads; thus, a gradual increase in temperature is observed to explain the differences between computed and measured temperatures once the heaters are activated.
Measured and computed temperature using two-200 W auxiliary heating system; 10 December 2015.
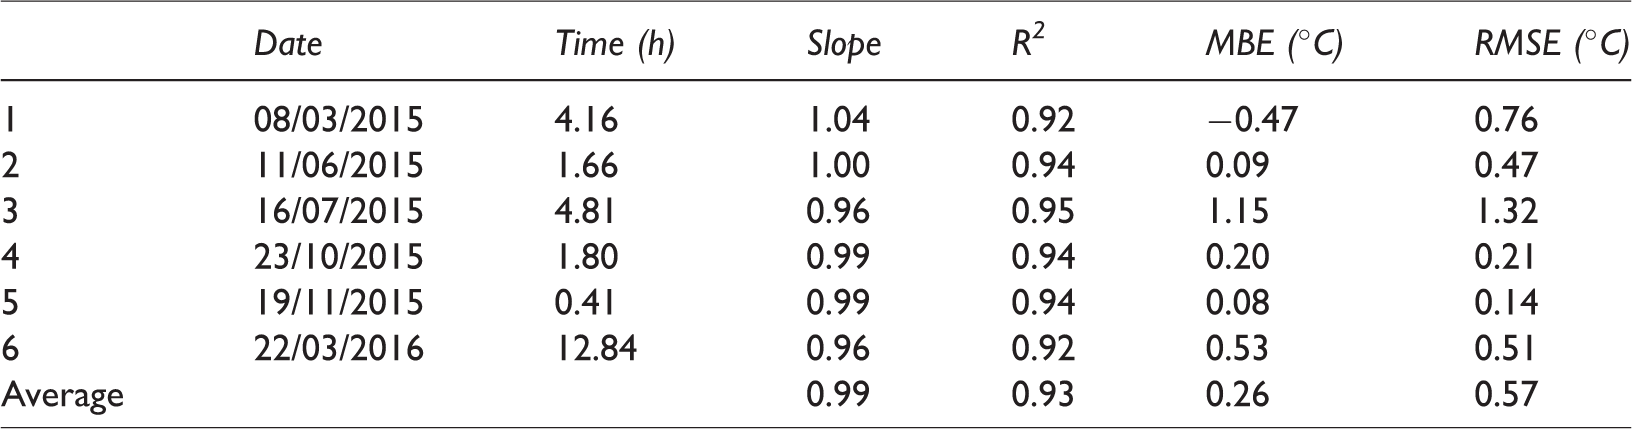
Tables 2 and 3 present the statistical indicators used to validate the solar space heating numerical algorithm and the nodal model, respectively. When comparing measured and computed temperatures, the slope of the best fit line gives an idea of whether the model is over or under predicting temperatures. Furthermore, the coefficient of determinations for multiple regression, R2, provides an assessment of unexplained variations in data sets. Statistically, when measured and computed temperature were compared, the solar space heating model obtained a value for the slope of best line fits and R2 as 0.99 and 0.93, respectively, on an average of a six-day data set (Table 2). A positive value for the mean bias error (MBE) indicates the under prediction of the computed temperature. Alternatively, a negative MBE indicates an over prediction of the cabin space temperature. These statistics illustrate the tendency of the latter model to slightly under predict temperature values and has few unexplained errors when predicting the indoor cabin temperature. Additionally, a low value of 0.57°C for the root mean square error (RMSE) suggests a good statistical confidence level for a low deviation in the algorithm’s computed data. Marcos et al. (2014) found that when the vehicle was exposed to solar irradiation, the developed thermal model preformed with an RMSE of 1.53°C. The present study shows that on 16 July 2015, the model obtained an RMSE of 1.32°C, representing the most inaccurate temperature prediction of all six experiments. However, the present algorithm’s results outperform the numerical algorithm developed by Marcos et al. (2014) by over 62% when comparing RMSE values. An improvement in the RMSE value may be attributed to the improved solar model developed in the present study. The previous study assumed a constant solar irradiance value in comparison to real-world solar irradiance data. Additionally, the present study measured thermal properties of the test vehicle whereas the previous study altered thermal properties in the model to obtain optimum results.
Statistical indicators for the solar space heating model.
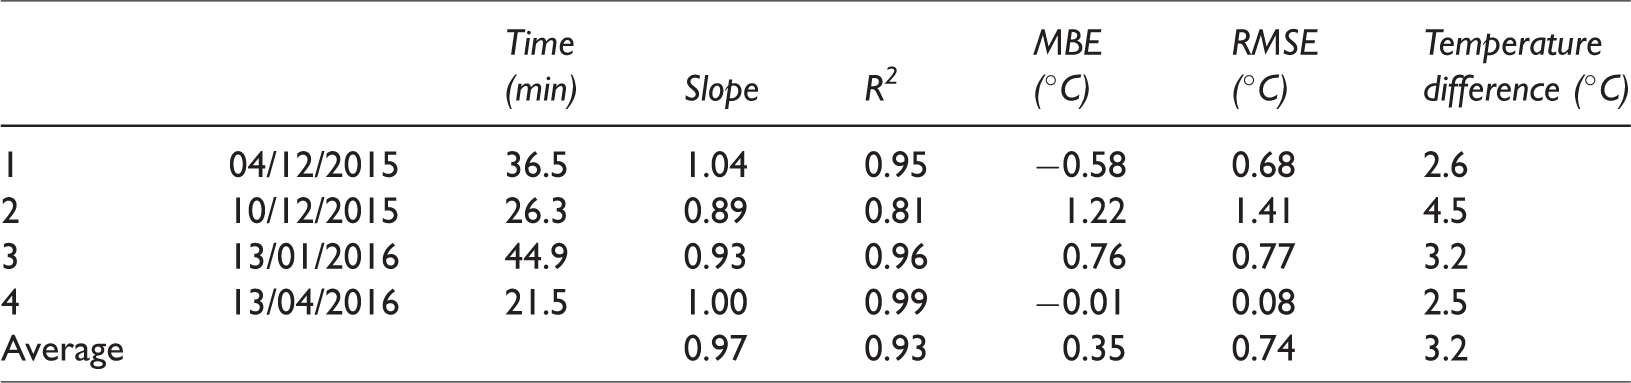
Values of 0.97 and 0.93 for slope and R2, respectively, were obtained, as seen in Table 3, thus validating the 10-node analysis. On average, the model shows an under prediction confirmed with a positive MBE value of 0.35°C. The algorithm was applied a second time to evaluate the temperature of the cabin space when no auxiliary heaters were installed. This analysis used outdoor ambient temperature as the only influential variable to indoor cabin temperature for nocturnal conditions. This analysis compared the data with the computed temperature when the heaters were in operation to evaluate the impact of the heaters on optimising the cabin space temperature. The heaters increased the cabin temperature by 3°C on average.
Statistical indicators for the nodal auxiliary heating system model.
Statistical indicators for the four-5.3 W extractor fans system.
Statistical indicators for the two-21 W extractor fans system.
Results for temperature predicting algorithm: Cooling mode
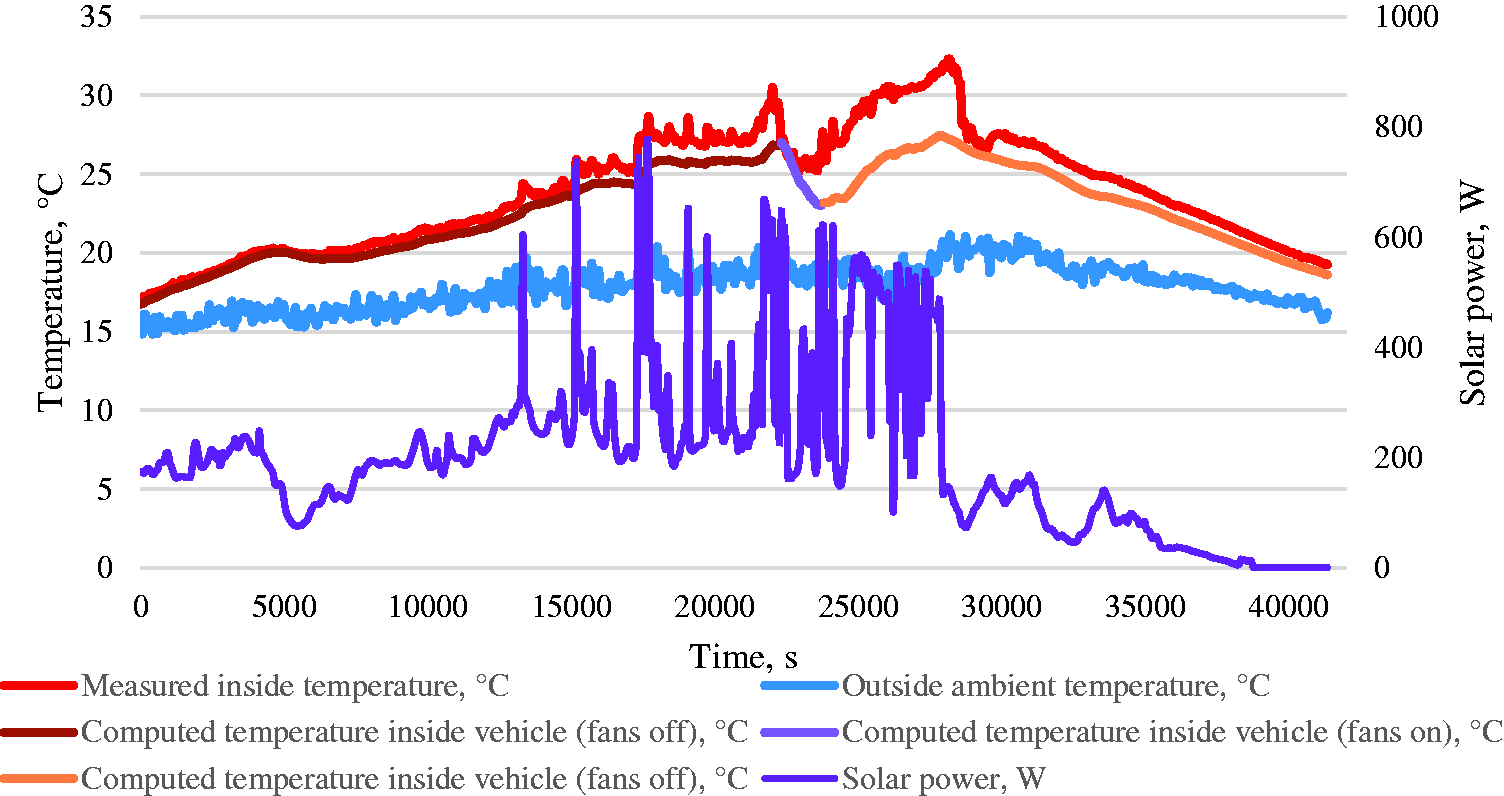
Figures 14 and 15 present results obtained for the developed cooling model using four-5.3 W and two-21 W extractor fans, respectively. The latter figure illustrates the temperature decreases when the ventilation system was in operation. A switch was added to the electrical circuit of the ventilation system, so that the auxiliary system could be activated externally to avoid opening the vehicle’s door, which would release heat and result in misleading information for determining the performance of the ventilation system. The computed temperature follows a similar decreasing trend, but the drop in temperature is not as significant as the measured temperature.
Four-5.3 W cooling system; 12 June 2016.
The error incurred in the model is reduced with a suppression of solar irradiation as a dependent variable to cabin temperature as seen at either end of the thermal profile presented in Figure 15.
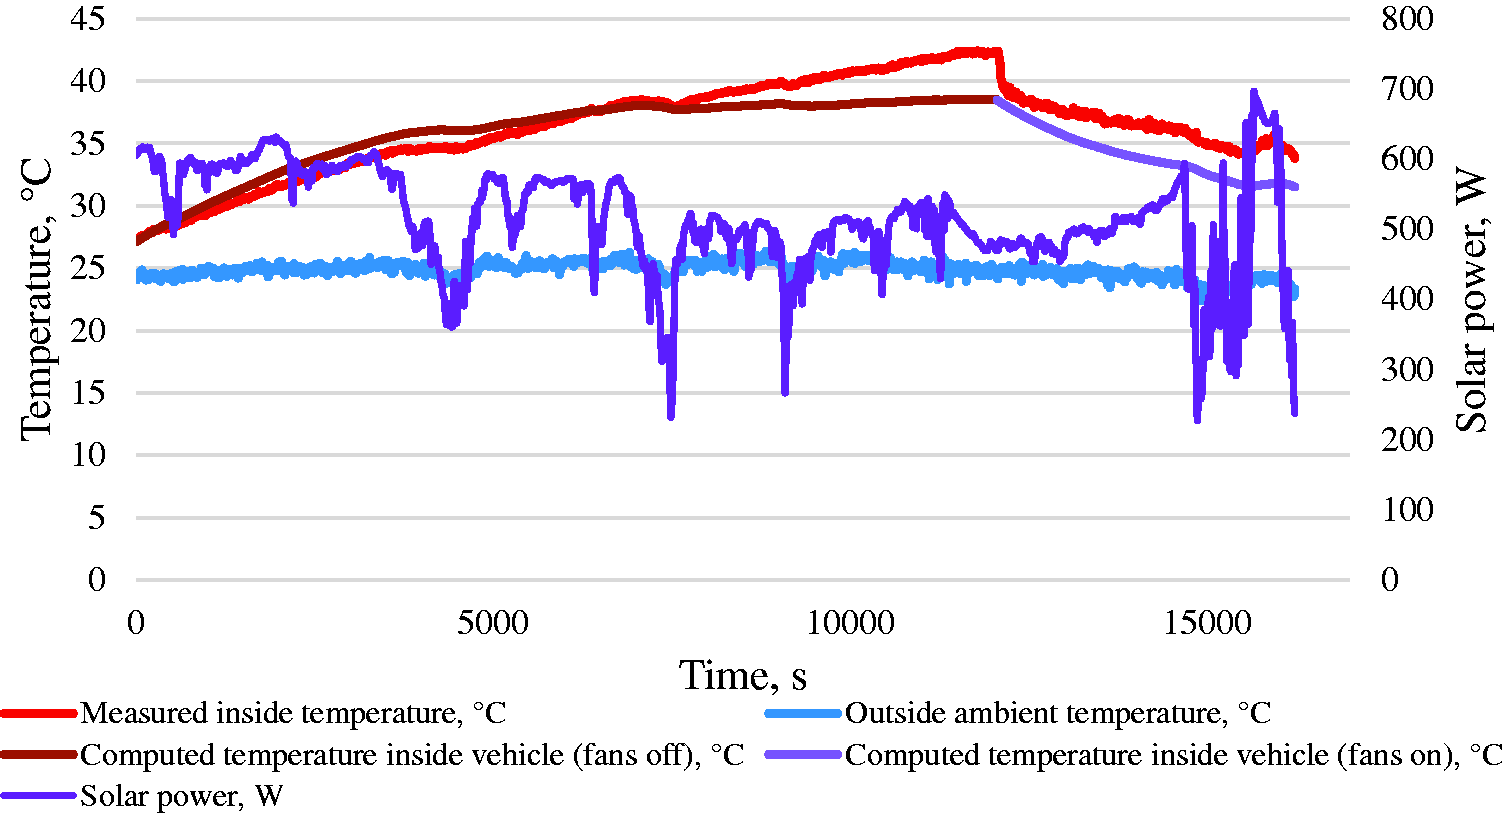
Two-21 W cooling system; 12 August 2016.
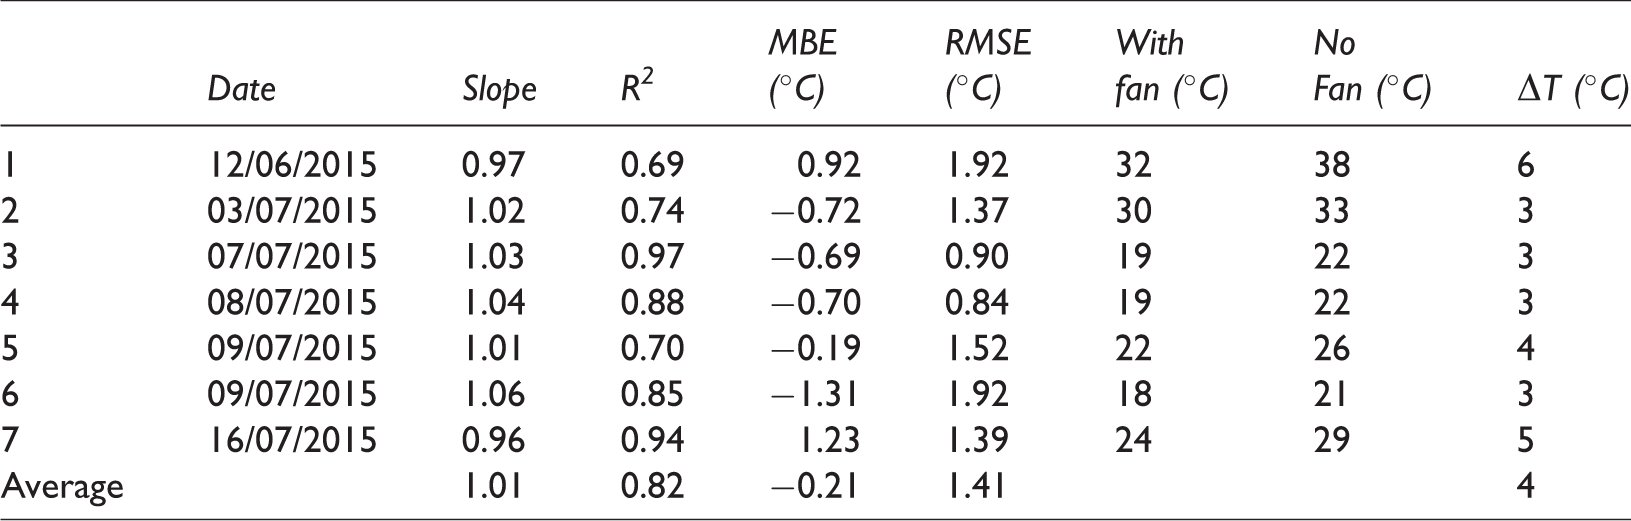
The four-5.3 W cooling algorithm showed statistical significance with a slope of 1.01 and an R2 value of 0.82 (see Table 4). A slope greater than +1 indicates that the developed thermal model tends to over predict the temperature. This observation is confirmed with a negative MBE value of 0.2°C, indicating that the developed model over predicts the temperature values by approximately 0.2°C on average. The R2 value indicated that the model explains 82% of the data analysed. The statistical analysis obtained an RMSE of 1.41°C showing the distance between measured and computed temperature values.
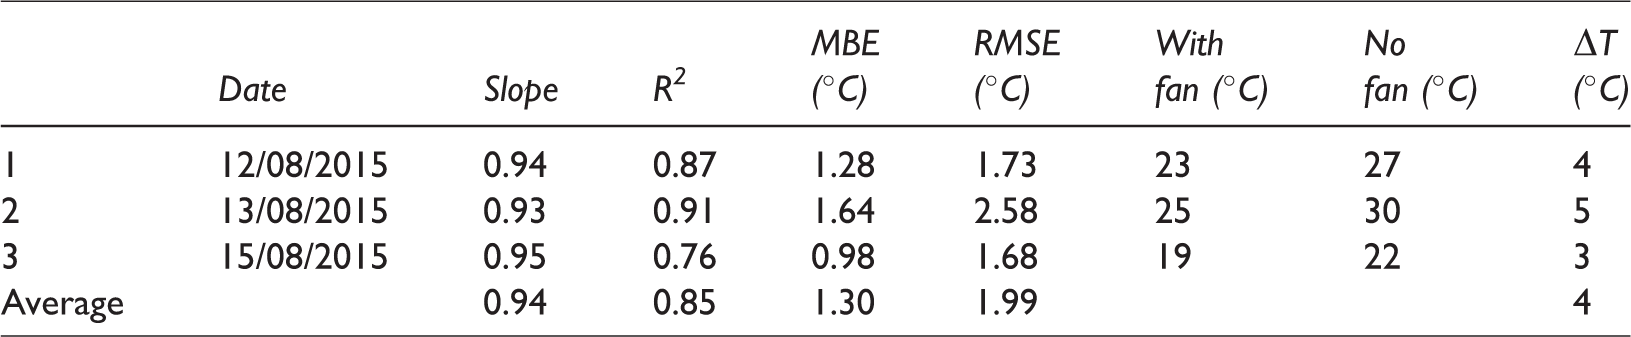
The statistical indicators obtained for the two-21 W cooling algorithm result in a slope value of 0.94 (see Table 5). This indicator shows that the model tends to under predict temperature values. This is confirmed with a positive MBE value of 1.3°C, indicating that the model under predicts temperature by 1.3°C on average. An R2 value of 0.85 indicates that the model can explain 85% of the analysed data. An RMSE of nearly 2°C indicates the distance between the measured and computed temperatures. The temperature recorded at the end of the fans’ operation period was compared with computed temperature if the fans were not in operation to determine if the fans can reduce the temperature independent of the vehicle’s built-in cooling system. Both systems have a reduction potential of 4°C.
When comparing the statistical results of the temperature predicting algorithm for the two fan systems, it is noted that the two-21 W fan experimental set-up under performs compared to the four fans. However, this is as a result of assuming that the air in the cabin space is thermally uniform, while the cabin space is thermally stratified in reality. Temperature is reduced uniformly in the front and rear of the cabin with four fans installed. This is not experienced when two extractor fans are installed in the rear of the cabin. Thus, assuming one temperature incurs an immediate error and is represented in the statistical indicators when the algorithms are compared.
Application of the developed temperature predicting algorithms
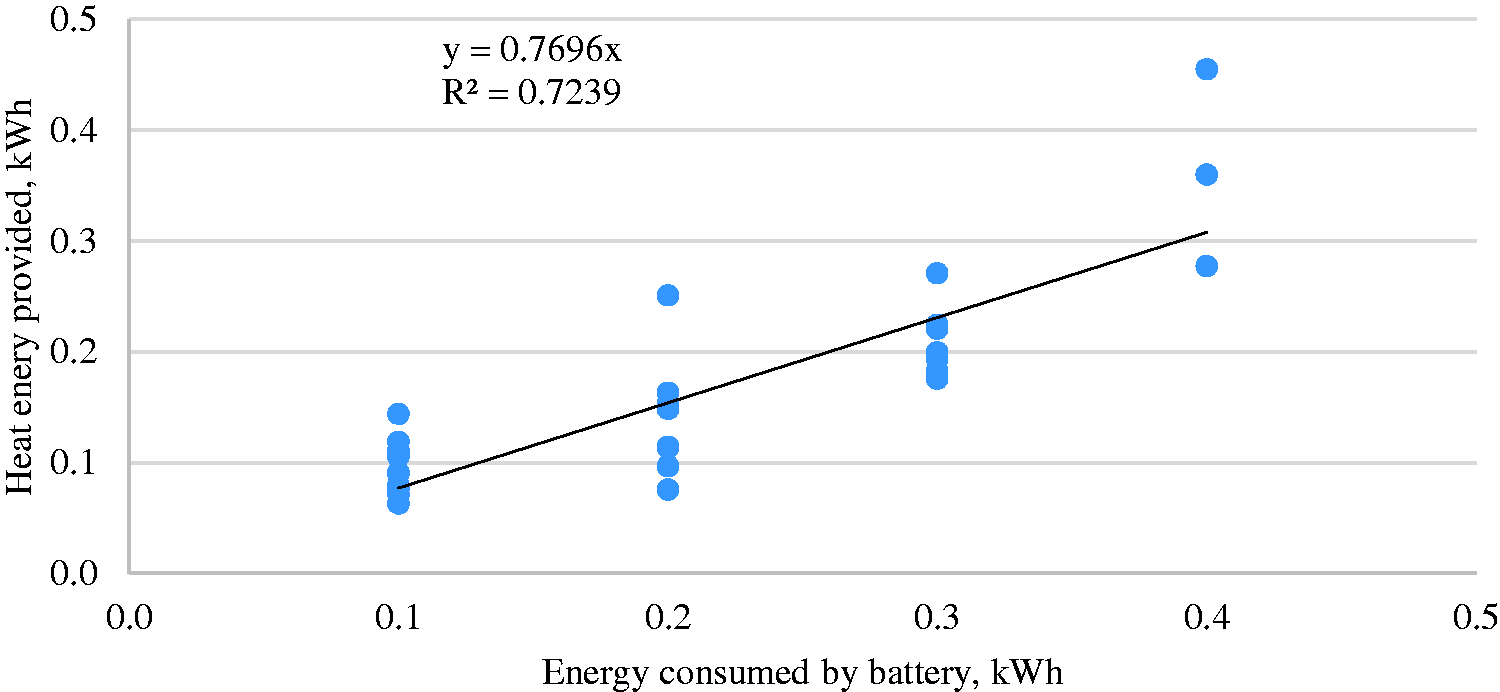
The data recorded by the driver’s diary entries previously presented in ‘Energy consumption of the electric vehicle’s climate control system ’section noted the temperature displayed by the on-board thermometer and the total energy used for the trip. With no additional equipment, the data available to the driver can be used to determine the energy consumption by the climate control system. Previous cooling profiles have shown that cabin space temperatures approach outside ambient temperatures during cooling periods when all heat sources are removed. During cooler periods when heating is required, it is assumed that the cabin space temperature is equal to the outside temperature displayed to the driver prior to the vehicle’s journey. The driver’s diary data are used to evaluate the quantity of energy the climate control system uses as a percentage of the overall vehicle trip. However, this data can also predict how much heat energy is supplied to the cabin space. Heat energy (Qheat) is computed using the equation as follows

Energy consumption of the climate control system.
Heat energy required to increase the cabin temperature for a specific trip duration may be assessed with the developed temperature predicting algorithms and the amount of electrical energy consumption from the primary lithium-ion battery can be obtained using Figure 16. This can then be incorporated into a route planning tool or mobile phone application for EV drivers undertaking longer route journeys to reduce ‘range anxiety’. For example, in cold driving conditions, the energy required to operate the climate control system will limit the propulsion energy available from the vehicle’s primary battery. Thus, a further charging stop may be required to reach the destination as indicated by the developed model, which previously has not been incorporated into previous energy consumption drive cycle analysis.
An auxiliary heating system is proposed by the present study to improve the thermal performance of the EV. The two-200 W fan heating system increases the cabin space temperature prior to vehicle use, thus reducing the electrical load on the battery as a result of reduced energy being utilised by the built-in heating system. On average, this auxiliary system increased the cabin temperature by over 3°C. Assuming if the cabin temperature is 5°C when entering the vehicle and the built-in heat pump system takes 15 min to achieve satisfactory thermal comfort levels (∼18°C, that is the lower range of the thermal comfort band as stated by ASHRAE, 2012), the heat pump requires 117 Wh of heat energy to achieve a cabin space temperature of 18°C. The heat energy required is reduced to 90 Wh (a 23% reduction) with the installation of an auxiliary heating system to increase the cabin air temperature by 3°C. Using the equation of the line presented in Figure 16, assuming a linear relationship between the heat energy produced and the electrical energy consumed by the battery, the electrical energy consumption by the climate control system can be estimated. Assuming a cabin space temperature of 5°C and 8°C at the point where the climate control system operates, the electrical energy consumed by the primary battery is estimated to be 0.15 and 0.12 kWh for each temperature, respectively.
The heating system consumes 18% of the battery’s total energy capacity (Figure 4). With the introduction of an auxiliary heating system reducing heat energy requirements by 23%, this figure has the potential to drop to 14% allowing for an extra 4% of the battery’s energy capacity to be allocated to propulsion energy. Manufacturer’s data state that the Renault Zoe’s 22 kWh battery has a NEDC range of 195 km (Renault, 2014). This will allow almost 8 km per battery charge to be allocated to propulsion energy.
Conclusion
In this paper, the breakdown of the energy consumption of the EV’s battery is presented in relation to the operation of the climate control system. The climate control system consumes on average 18 and 14% of the total trips energy when the heating and cooling system is in operation, respectively.
Additionally, in this paper, a temperature predicting thermal algorithm is proposed. The algorithm predicts temperature of a Renault Zoe’s cabin space in heating and cooling modes. In the former two modes, the algorithm is designed to consider natural heating as a result of exposure to solar irradiance as well as under nocturnal conditions with two-200 W auxiliary ceramic heaters. The latter mode develops algorithms to predict temperature when the four-5.3 W and two-21 W fan heaters are in operation. The transient thermal model is validated using measured temperature recordings and using statistical indicators as performance indicators. The developed thermal algorithm was applied to a Renault Zoe EV when solar irradiance is the primary heat source. The statistical indicators that were used to evaluate the performance of the model gave a slope for the best line of fit as 0.99 and a coefficient of determination (R2) of 0.93. The latter algorithm has a RMSE of 0.57°C, outperforming previous thermal algorithms by 62%. The developed nodal model analyses how interior material layers interact with one another. Two heat sources at two fixed points inside the cabin space influence the temperature differently when compared to the uniform heat distribution by solar radiation, resulting in higher discrepancies in cabin temperature. The statistical indicators obtained 0.97, 0.93 and 0.74 for the slope of the best line fit, the coefficient of determination and RMSE for the nodal model, respectively. Additionally, the paper presents how these algorithms may be used as a route planning and energy consumption application.
Footnotes
Declaration of conflicting interests
The author(s) declared no potential conflicts of interest with respect to the research, authorship, and/or publication of this article.
Funding
The author(s) received no financial support for the research, authorship, and/or publication of this article.