
Abstract
In this article, the grades of different kinds of energy sources are distinguished. Thus, we put forward an equivalent electric calculation method, which is compliant with the calculation of various energy resources that have different grades. Based on this aspect, we empirically analyzed the influence of industrial structure changing on energy consumption structure by analyzing panel data in 30 provinces of China from 2003 to 2013. Results showed that the calculated results of equivalent electric calculation method were more accurate because it considered the difference in grades between various energy sources. Industrial structure changing had a significant impact on energy consumption structure. The upgrading and rationalization of the industrial structure had a significant promotion on energy structure cleaning. In addition, technological progress was conducive to the clean development of energy structure, the decrease in energy price boosted energy structure cleaning, and the impact of economic level on energy consumption structure was not significant.
Keywords
Introduction
As the driving force of economic production activities, energy has been taken as an important productive factor of the economic manufacture system by many scholars (Song and Zhou, 2015; Zhang and Choi, 2013; Zhang et al., 2013). With the rapid development of the economy, the consumption of energy resources in China is increasing rapidly at the same time, and fossil fuels are still the main types of energy consumption in this country, which also caused serious environmental pollution (Zhou et al., 2013a, 2013b). Therefore, the environment has become an important constraint for the sustained economic development in China. At present, “actively developing clean energy and optimizing the structure of energy consumption” are not only an important approach which is concerned by different sectors of society and can solve the contradiction between economic development and environmental protection but also the main policy guidance which is initiated by the Chinese government to develop the green economy. Therefore, it is of great significance to analyze the evolution of China’s energy consumption structure from the perspective of industrial structure change.
Statistical calculation of energy consumption
At present, there are two main statistical calculation methods for energy consumption in China: one is coal equivalent calculation method, this method counts other energy sources’ consumption by converting the average coal-fired power consumption of the current year into standard coal consumption; the other is calorific value calculation method which converts other energy sources into standard coal consumption according to their electric power equivalents. There are huge differences between the two methods in the statistical calculation of new energy sources such as hydropower, nuclear power and so on. When calculating the Chinese regional final energy consumption and the carbon emission of energy consumption, Li and Hu (2012), Zhou et al. (2013a, 2013b), Sun et al. (2015), and Guo et al. (2016) used energy converting into standard coal as the reference coefficient, which came from “Chinese Statistical Yearbook”. These reference coefficients used coal equivalent calculation method and calorific value calculation method as the two energy conversion methods, respectively, resulting in the discrepancy of final statistical calculation of economic consumption. In addition, the two calculation methods only considered the “quantity” of economic consumption, but ignored the different “quality” between different kinds of energies (Jang et al., 2006). For example, if we use calorific value calculation method to convert the 1 MJ calorific power of natural gas and coal into standard consumption, the results are same. In practical production, however, the average generated energy of 1 MJ calorific power of the above two energies are 0.55 MJ and 0.34 MJ, respectively. Obviously, there are significant differences in the qualities of various energy sources. In this article, we called this difference as “energy grade”. Ignoring the difference in various “energy grades” may cause deviations in the statistical calculation of energy consumption, which is not conducive to the optimal allocation of energy resources.
Industrial structure changing and energy consumption structure
In the earlier research literature, the industrial structure changing only refers to the industrial structure upgrading, it refers to the changing process of the industrial structure in which the dominant industry shifts from the primary industry to the secondary industry and then continuous to turn to the tertiary industry. When selecting upgrading indicator of the industrial structure, Zhang and Zhang (2015) believe that the decreasing trend of the added value primary industries in gross domestic product (GDP) in the time series is an important indicator of the industrial structure upgrading. Therefore, they suggested selecting the ratio of the added value of the secondary and tertiary industries to the total GDP value of the current year as the measurement index. But on the other hand, Duarte and Restuccia (2010) and Gan et al. (2011) believe that the proportion of the added value of the tertiary industry represents the characteristics of the second stage of industrial structure changing, and this proportion is more suitable for calculating the upgrading of Chinese industrial structure. Nowadays, the academia has a unanimous conclusion about the influence of the industrial structure upgrading on energy consumption structure, which states that the industrial structure upgrading is an important factor which can influence the regional energy structure change (Liu et al., 2011). The greater the proportion of the added value of tertiary industry (service industry) in GDP of the year, the greater the proportion of clean energy consumption.
As research continued, some scholars believe that the industrial structure upgrading cannot represent the entire content of the industrial structure changing. Gan and Zheng (2009), Peng et al. (2013), and Jiao (2015) all believe that industrial structure changing can optimize resource allocation and promote the development of industrial structure rationalization, and then propelled the industrial structure changes from low grade to high grade. Thus, industrial structure changing includes two dimensions: the industrial structure upgrading and the industrial structure rationalization. Industrial structure upgrading means the degree of coordination between different industries and the coupling of production system input and output structure. Gan and Zheng (2009) use “Theil index” to measure industrial structure rationalization, and it is the prevailing method at present. There is little empirical research about the effect of industrial structure rationalization on energy consumption structure which is an important content that we study in this topic.
Nowadays, studies about this topic have two limitations at home and abroad. On the one hand, the statistical calculation of energy consumption which academia used at present ignores various energy grades, so it cannot accurately calculate the consumption of energy conversion, thereby causing a bias in the measurement of energy consumption structure. On the other hand, industrial structure changing includes two aspects: the industrial structure upgrading and the industrial structure rationalization. However, most of the previous research literature only considered industrial structure upgrading, but neglected the indicator of industrial structure rationalization. In view of this, based on the perspective of energy grade calculation, the equivalent electric calculation is used to calculate the conversion coefficients of various energy sources into equivalent electric; therefore, we can accurately obtain the regional energy consumption structure. Then, an empirical study will be used to analyze the effect of industrial structure changing (including industrial structure upgrading and industrial structure rationalization) on energy consumption structure by using the calculation results above. We hope our research can expand the study in this research area.
Study design
Equivalent electric calculation method
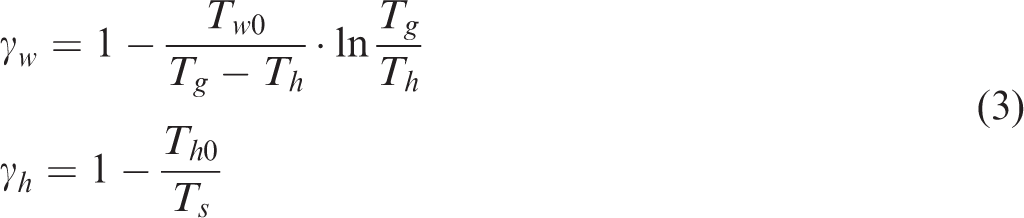
As discussed above, the existing statistical calculation of energy consumption ignored the different quality between different kinds of energy. Based on the perspective of energy grade calculation, this article proposed a new statistical calculation method of energy, which is equivalent electric calculation method (EECM). The foundations are as follows: in practical economic productive activities of the region, several main final consumption energies (including coal, natural gas, petroleum, hydropower, nuclear power, solar energy, wind energy, etc.) are all used to produce electricity. Therefore, electricity is used as a foundation to measure other energy grades. The conversion coefficient through which other energies are converted into electricity is defined as this energy’s grade, which is conversion coefficient of equivalent electricity. According to the definition of the equivalent electric calculation above, the grade of electricity is 1, the grade of other energy can be calculated by conversion of the coefficient of equivalent electricity, the calculation model is as follows


Index calculation of industrial structure changing
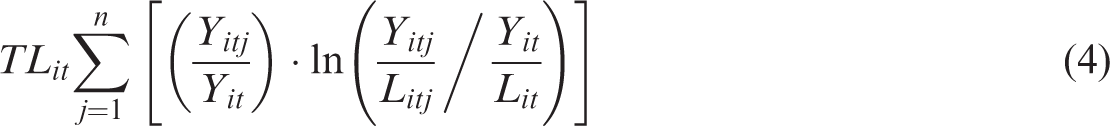
Industrial structure changing includes two aspects:the industrial structure upgrading and the industrial structure rationalization. When measuring the index of industrial structure upgrading, this article references the result of Jiao (2015) and use the ratio of the added value of the tertiary industry to the added value of the secondary industry for representation. The larger the ratio is, the better the industrial structure upgrading is. When measuring the index of industrial structure rationalization, this article references the method of Dono and Thompson (1994) and use the Theil index to represent. The model of Theil index is as follows
Econometric model and statistical interpretation of data
This article mainly studies the influence of industrial structure changing on energy structure consumption, so the econometric model is as follows
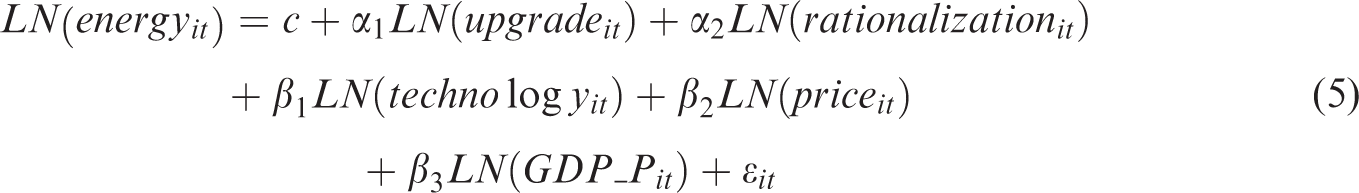
In this model,
The empirical results and analysis
Calculating results of conversion coefficient of equivalent electricity of partial energy
According to the statistical results of Chinese regional final energy consumption of physical quantity from the regional energy balance table in “China Energy Statistical Yearbook”, combined with the EECM, this study chooses the main 20 types of final energy consumption to measure its conversion coefficient of equivalent electricity. Taking Beijing in 2013 as an example, we choose the annual average outdoor temperature 12.36°C as the outdoor reference temperature. The calculating results of conversion coefficient of equivalent electricity of the main 20 types of final energy consumption are shown in Table 1.
The conversion coefficient of equivalent electricity of the 20 types of final energy consumption.
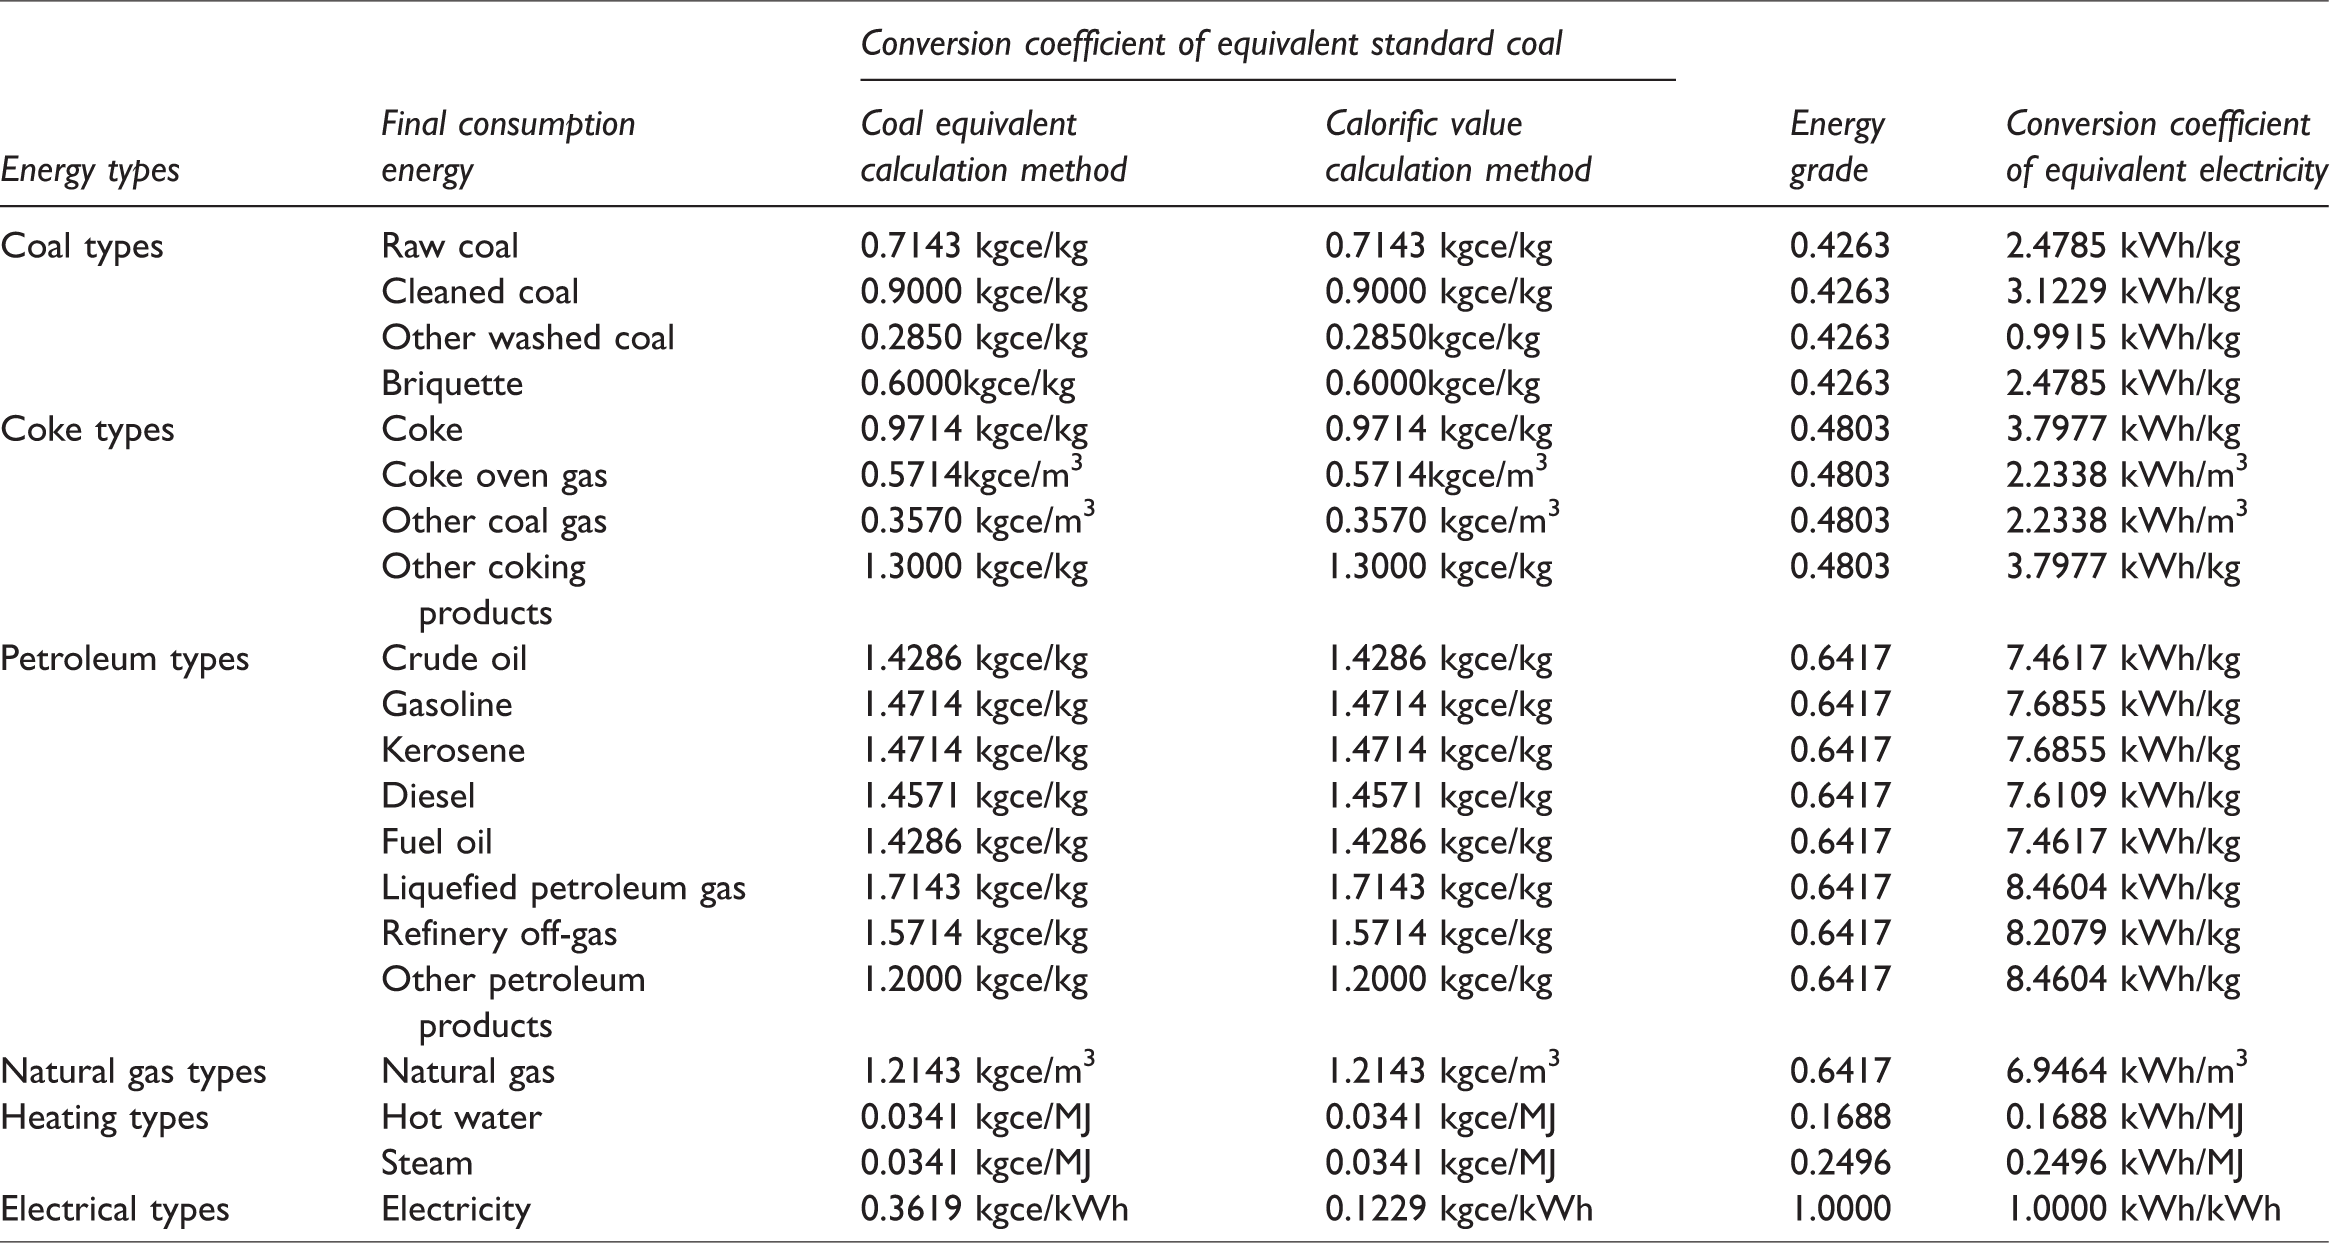
From Table 1, on the basis of EECM, we can see that the highest grade energy in the final energy consumption in Beijing in 2013 are electrical energies with a grade of 1.0000; the second is natural gas energies and petroleum energies, both reached the grade of 0.6417; the following are coke energies and coal energies, their grades are 0.1803 and 0.4263, respectively; the lowest grade energy is the thermal energy, the grades of municipal hot water heating and municipal steam heating are only 0.1688 and 0.2496, respectively. Comparing the measured results in the third, fourth, and fifth columns in Table 1, it can be seen that there is a big difference in calculation between the EECM and traditional energy statistical method. The EECM in this study has the following advantages: First, both the coal equivalent calculation method and calorific value calculation method ignore the difference between different types of energies, and it is easy to overestimate low-grade energy in the process of energy statistical calculation. But the EECM can unite two essential factors of “quality” and “quantity” of all kinds of energy, and hence the calculation is more exact. Second, for new types of energy such as solar, wind and so on, using EECM can not only avoid the complex accounting process of converting it into standard coal but also conform to the actual utilization process of new energies because the main utilization of these new energies is generated electricity.
Descriptive statistics
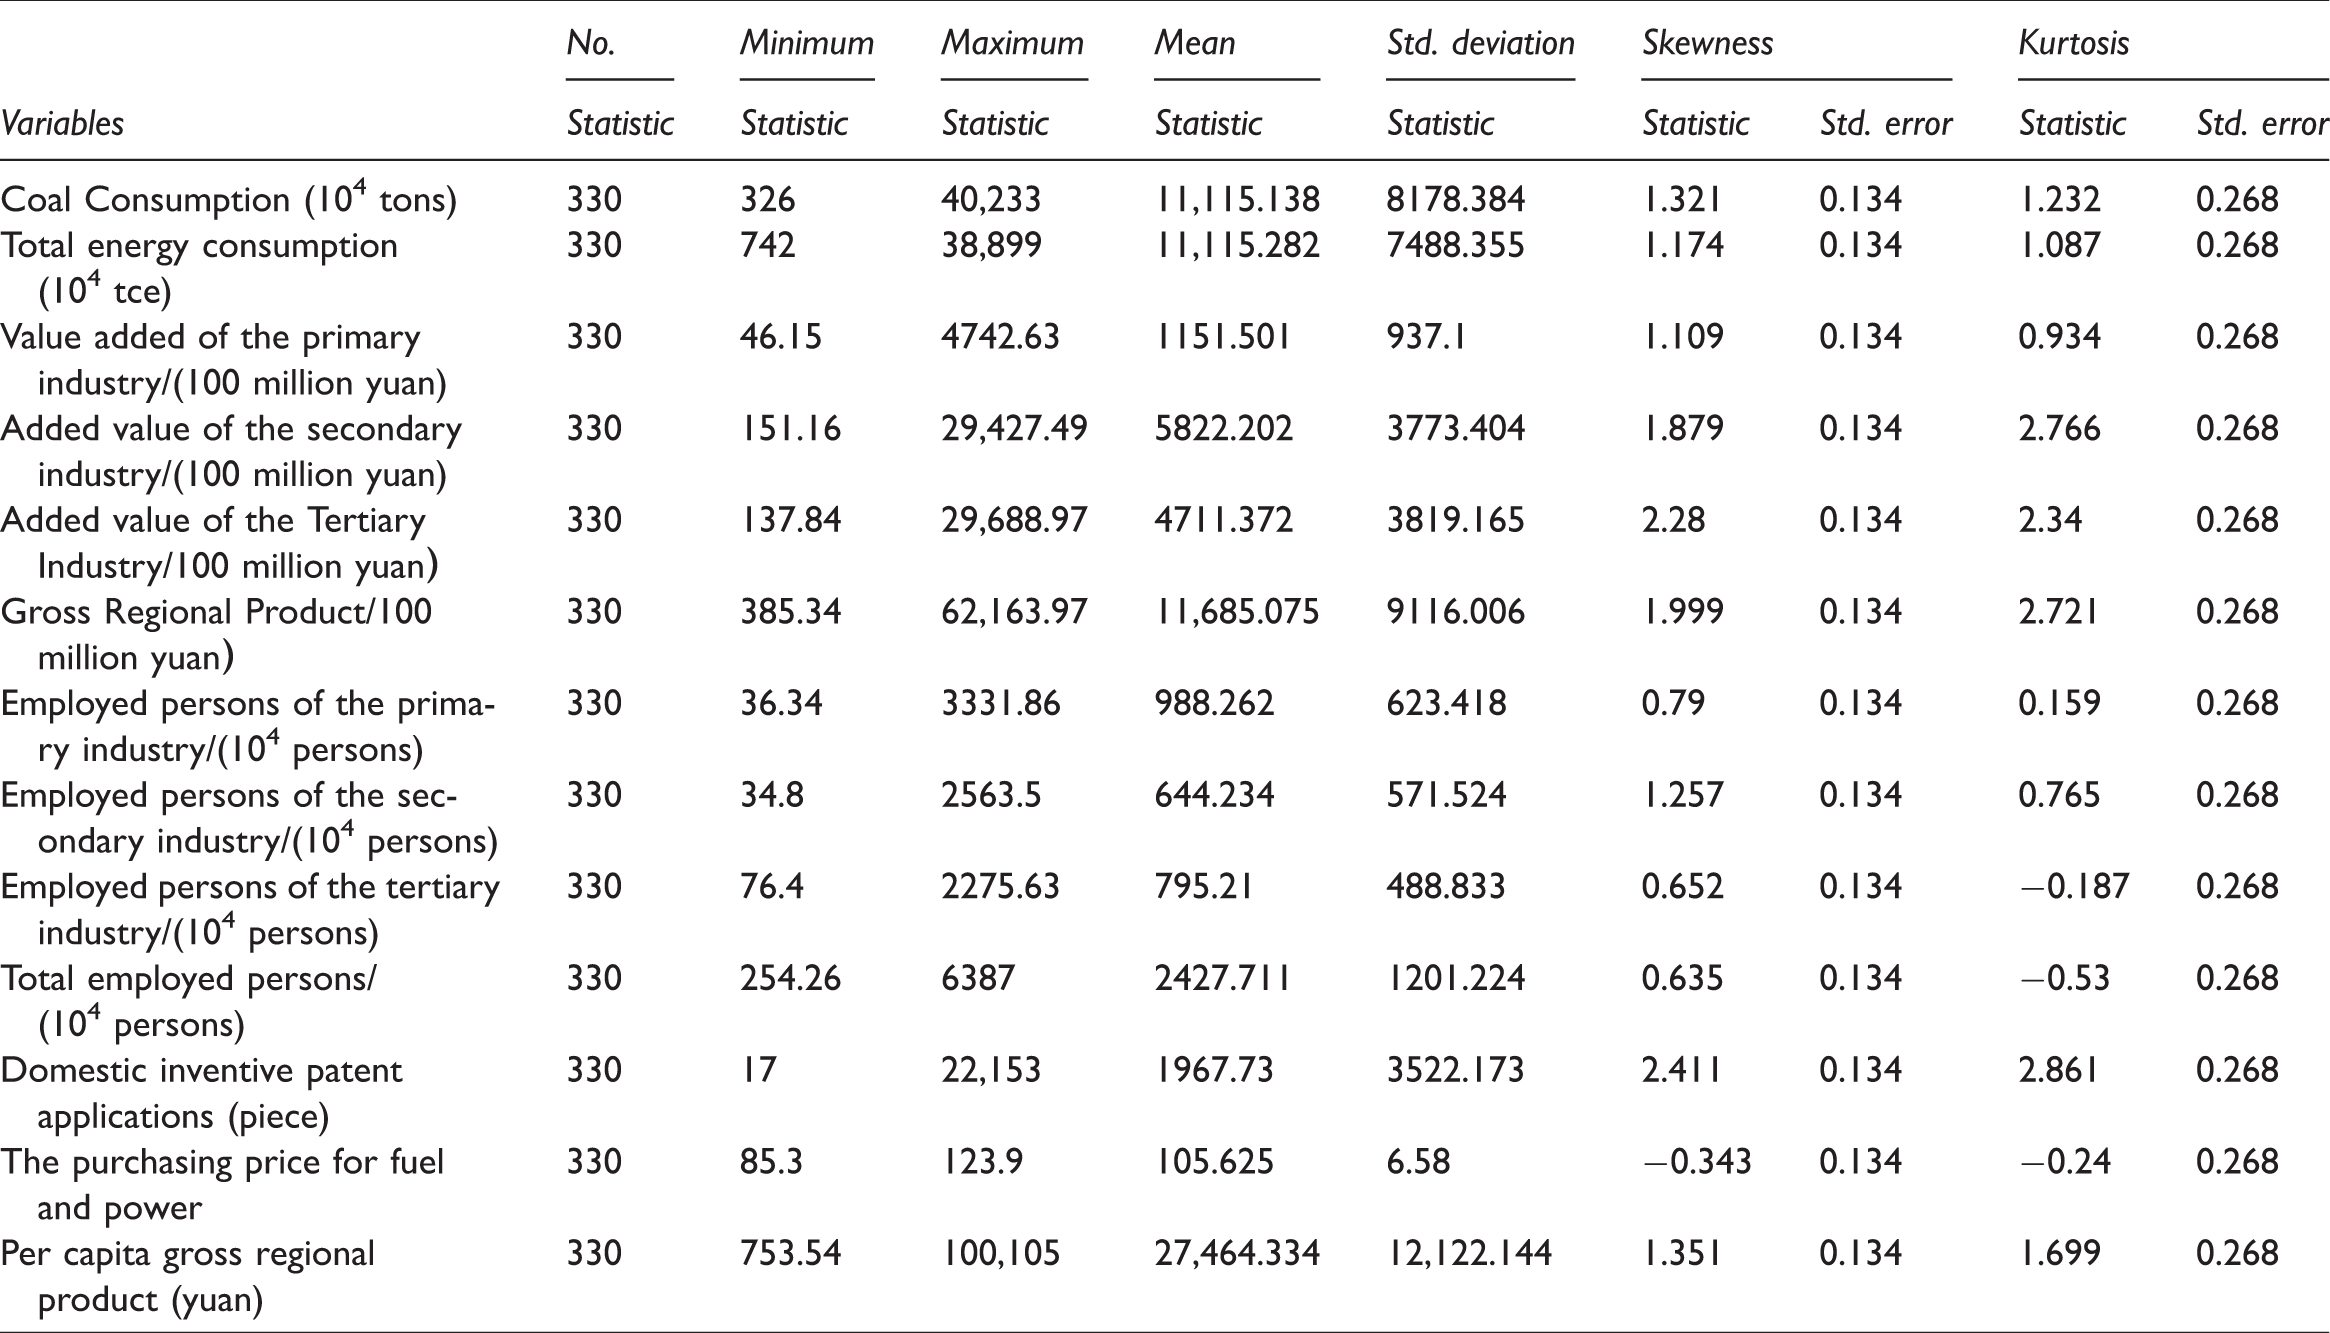
This study focuses on the effect of the regional industrial structure changing on the regional energy consumption structure. We take the regional energy consumption structure as the research object and choose panel data which are from 30 mainland Chinese province, autonomous regions, and municipalities between 2003 and 2013 as samples (due to the lack of statistical data on total energy consumption and fuel/power purchase price index over the years in Tibet, we only selected statistical data in 30 provinces as samples), there are about 330 group observations. The raw sample data are from “China Statistical Yearbook” between 2004 and 2015, “China Energy Statistical Yearbook” between 2004 and 2015, and “China’s Labor Statistical Yearbook” between 2004 and 2015, per capita GDP use this regional consumer price index in former years reducing to the level in 2003 as the standard values of base period.
The calculation results of the maximum/minimum/mean/standard deviation/skewness/kurtosis of each statistical indicator are shown in Table 2. It can be seen from this table that the absolute values of the skewness of each statistical indicator are less than 3. The absolute values of the kurtosis are all less than 10, which generally meet the criteria of normal distribution and can be used for subsequent data analysis.
Descriptive Statistics.
The regression analysis
In order to avoid spurious regression, this study firstly uses the Levin, Lin & Chut test, the Fisher-ADF test, and the Im, Pesaran and Shin test to test the unit root of each variable. The results show that the logarithmic index of energy structure cleaning is a zero-order unit integer, it is lower than the order of unit integer of all explanatory variables such as industrial structure upgrading, industrial structure rationalization and so on (due to space limitation, we will not present all the orders). This means that the sample is suitable for regression analysis.
Preliminary regression analysis
In Table 2, the explained variable is the index of regional energy structure cleaning, and the five indicators are: industrial structure upgrading, industrial structure rationalization, technological progress, energy price, and economic level as the explaining variable. The results of regression analysis are shown in Table 3.
An effect of industrial structure changing on energy consumption structure.
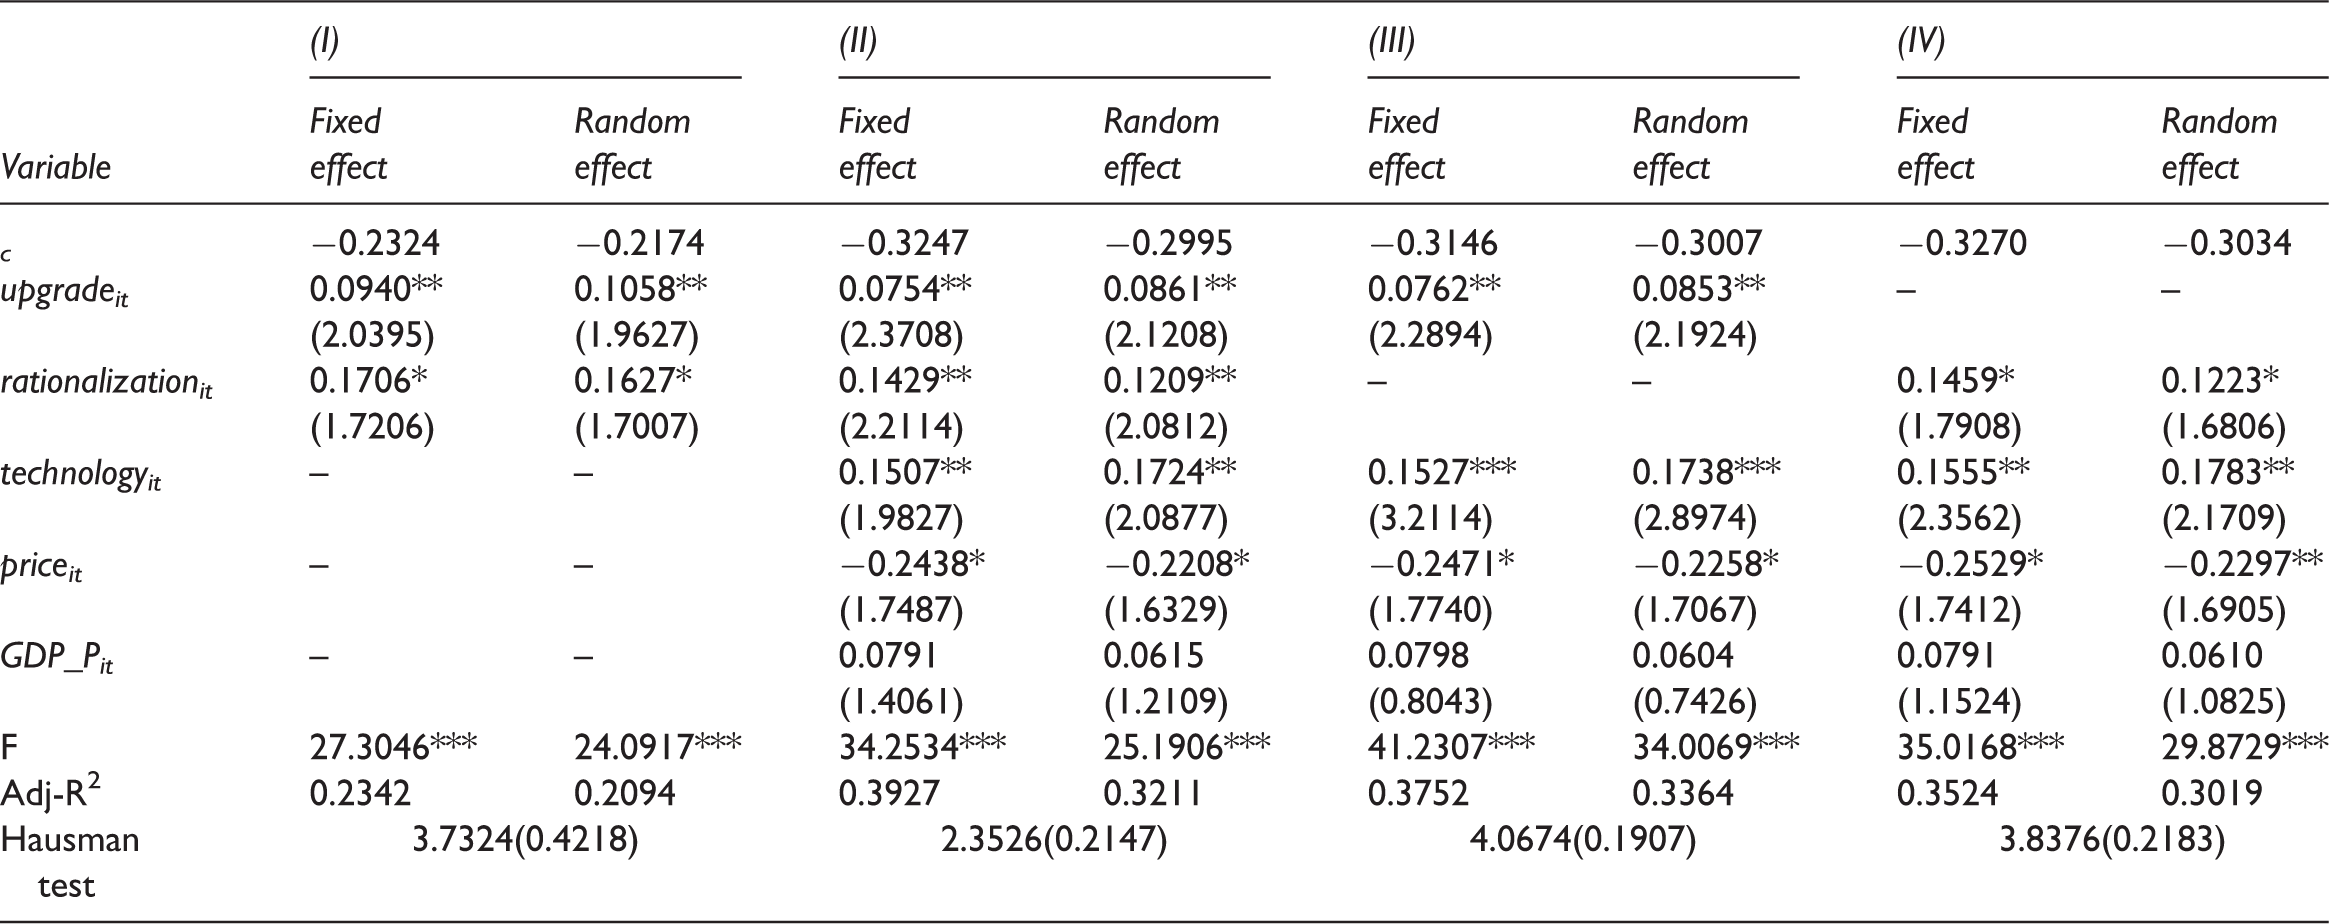
Note: Numbers in parentheses in the last line indicate adjoint probability, numbers in other parentheses indicate T-statistic of relevant variable; ***, **,* mean passing 1%, 5%, and 10% significance testing. Similarly hereinafter.
From the regression analysis, we can see that in models (I)–(IV), the regression coefficient of industrial structure upgrading and industrial structure rationalization shows a strong stability. This means that the regression results of this model are dependable strongly. The adjoint probability of Hausman’s test statistics in models (I)–(IV) is 0.4218, 0.2147, 0.1907, and 0.2183, respectively. Therefore, the regression results of random effect model are more suitable for this sample. The following analyses are based on the regression results of random effect model. Firstly, the industrial structure changing has a significant positive effect on the regional energy structure cleaning. The indicators of industrial structure upgrading and industrial structure rationalization all make a significant positive effect on energy structure cleaning. The model (II) shows that the regression coefficient of industrial structure upgrading is 0.0861 with a significance under 5% (sig). This means, when the regional industrial structure upgrading increases 1%, the regional energy structure cleaning will increase 0.0861%. The regression coefficient of industrial structure rationalization is 0.1209 with a significance under 5% (sig). This means, when the regional industrial structure rationalization increases 1%, the regional energy structure cleaning will increase 0.1209%. Meanwhile, we find that the influence coefficient of industrial structure rationalization is higher than that of industrial structure upgrading, this means the rational development of industrial structure and the optimized construction of industry chain play a greater role in the adjustment of the regional energy structure. Secondly, technological progress has a significant positive effect on regional energy structure cleaning. When the regional technological progress increases 1%, the regional energy structure cleaning will increase 0.1724%; Energy-price changing has a negative effect on the regional energy structure cleaning, its regression coefficient is −0.2208, and it passed a significant 10% test. The decline in energy price is conducive to the improvement of the energy structure cleaning. During the sample period, the level of economic development has no significant effect on the index of energy structure cleaning.
Robust regression analysis
In order to analyze the effect of industrial structure changing on the robustness of energy consumption structure, this study chose the proportion of generated energy of clean energies such as Chinese regional hydropower, nuclear power, wind power and so on in the total amount of regional electricity production as the index of energy structure cleaning to do regression analysis. The results are shown in Table 4.
Robust analysis of industrial structure changing affecting energy consumption structure.
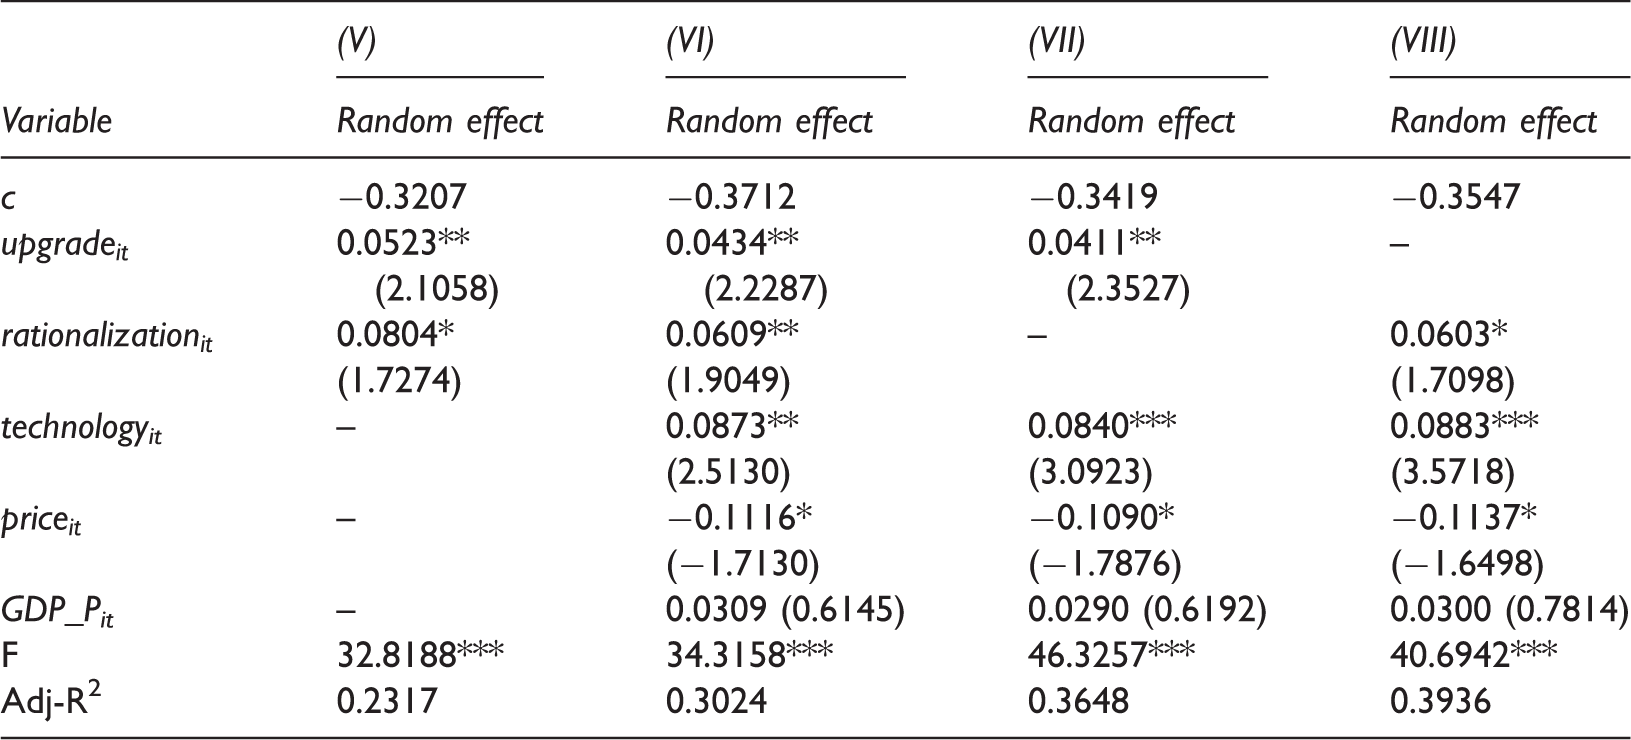
Note: The results of Hausman test indicate that random effects model is more suited to this sample. Due to space limitation, this study only lists the regression results of random effects model.
The results show the following: Firstly, the indicators of industrial construction upgrade, industrial construction rationalization and technological progress all have a significant positive effect on the generated energy ratio of clean energy. In model VI, the regression coefficients are 0.0434 and 0.0609, respectively, which mean when industrial structure upgrading, industrial structure rationalization and technological progress increase 1%, the generated energy ratio of clean energy will increase 0.0434 and 0.0609, respectively. Secondly, the regression coefficients of energy-price changing indicator are all negative and they passed a 10% significance test, which means the decline in energy prices during the sample period is conducive to increasing the proportion of clean energy use. Thirdly, the economic level indicator has no significant effect on the generated energy ratio of clean energy. Therefore, the significance test results and the sign of the regression coefficient in models (V)–(VIII) are consistent with the models (I)–(IV), which means the above empirical analysis results have good robustness.
Conclusion and enlightenment
Based on the perspective of energy grade, this paper firstly gave the EECM of energy statistical calculation, integrates the “quantity” and “quality” of various energies into energy statistical calculation. Then, by using the results of the energy consumption calculation above, the energy consumption structure is calculated. By combining with the data of actual economic production activities in 30 Chinese provinces between 2003 and 2013, the effect of the regional industrial structure changing on the energy consumption structure is empirically analyzed. Through the analysis above, the main conclusions are as follows:
Firstly, there is a significant difference in five different energy grades in final energy consumption in China, the five energies include coal, petroleum, natural gas, heating power, and electricity, and their energy grades from high to low is electricity, natural gas, petroleum, coal, heating power, respectively. Both the traditional coal equivalent calculation method and the calorific value calculation method ignore the difference of grade between different energies, and both the methods overestimate low-grade energies in the process of energy statistical calculation.
Secondly, both the industrial structure upgrading and the industrial structure rationalization have significant and steady positive effect on the regional energy structure cleaning, and the promotion of the regional industrial structure rationalization to the regional energy structure cleaning is greater, when its index increases 1%, the regional energy structure cleaning will increase 0.1209%. The industrial structure upgrading and the industrial structure rationalization can also promote the increase of the consumption proportion of the regional new energy (including hydropower, nuclear power, wind power, solar electrical energy generation and so on), when the index of the two indicators increase 1%, the regional consumption proportion of the new energy will increase 0.0434% and 0.0609%, respectively.
Thirdly, in controlling variables, the technological progress indicator has significant and steady positive effect on the regional energy structure cleaning and the consumption proportion of the regional new energy, but energy-price changing has a negative effect on the two measuring indicators of energy consumption structure, the decrease of energy price is conducive to the increase of the energy structure cleaning and the consumption proportion of new energy. Finally, during the sample period, the developing level of regional economy has no significant effect on energy consumption structure.
The enlightenment of this paper is as follows: the energy grades represent the “quality” of energy, it can reflect the function of different types of energies. Thus, we suggest that governments establish and practice a set of “equivalent electricity” methods to calculate the production, transportation, and consumption of all kinds of energies, and calculate all kinds of energy grades, so as to better connect energy suppliers and energy demanders, and can effectively avoid unreasonable use of “high-grade energy and low-grade energy use”. The significant positive effect of industrial structure rationalization on the development of the regional energy structure cleaning is higher than that of the industrial structure upgrading. Therefore, under the economic environment in which Chinese industrial structure upgrading is becoming more accelerated, the adjustment of the regional industrial structure should not blindly pursue industrial structure upgrading, it should pay more attention to the development of industrial structure rationalization and the supporting construction in the upstream and downstream industries in the industrial chain in order to achieve the sustainability of industrial structure upgrading. In addition, governments should increase investment in technological innovation and issue various preferential policies to encourage enterprises to develop green manufacturing technologies. At the same time, the government should actively adopt steps such as energy-price subsidies and other measures to reduce enterprise’s energy consumption price. Moreover, in the case of existing energy-price subsidies, the price subsidy policy should be biased toward the high-grade and cleaning energy prices to promote the development of energy structure cleaning.
Footnotes
Acknowledgments
This research is conducted through the Technological Economy and Innovation Management Institute in the College of Economics and Management, Nanjing University of Aeronautics and Astronautics.
Declaration of conflicting interests
The author(s) declared no potential conflicts of interest with respect to the research, authorship, and/or publication of this article.
Funding
The author(s) disclosed receipt of the following financial support for the research, authorship, and/or publication of this article: This work was supported by China Scholarship Council, the Funding of Jiangsu Innovation Program for Graduate Education and the Fundamental Research Funds for the Central Universities.