
Abstract
Plenty of marine crude oil generated by the Middle–Upper Ordovician source rocks has been discovered in the Tabei Uplift, Tarim Basin. Previous studies on the extensively distributed low organic matter source rock total organic carbon ≤ 0.5%) imply that this contributes to oil accumulation. Thus, the identification of present-day low-total organic carbon source rocks that experience hydrocarbon expulsion and evaluation of their contribution is of considerable significance to analyze marine oil accumulation and to assess the resources in the Tarim Basin. Using the mass balance approach, we identify and verify present-day low-total organic carbon carbonate source rocks and present a quantitative model using well-logging data to predict the present-day low-total organic carbon carbonate source rocks in order to evaluate their contribution in the Tarim Basin. Hydrocarbon expulsion has occurred in the Yijianfang formation, which has present-day low-total organic carbon, between 6452 and 6487 m in the Yangwu 2 well. In the horizons depicting carbonates with hydrocarbon expulsion, the porosity is relatively high and the daily oil production is 0.19 m3 according to the perforation tests. The extracts have similar biomarker signatures to that of the crude oils in the Tabei Uplift. In this study, a quick and cost-effective quantitative model is developed using double lateral resistivity and uranium/thorium well-logging data. By applying the prediction model, the contribution of present-day low-total organic carbon carbonate source rocks in the Middle–Upper Ordovician formation of the Tarim Basin is primarily evaluated to be 363.38 × 10⁹ bbl oil equivalent.
Keywords
Introduction
Using the improvements in the hydrocarbon exploration theory and technology, the exploration of the Tarim Basin in China has progressed. By 2013, new discoveries had been made in the Ordovician carbonate formations, with 3P reserves of 7.43 × 10⁹ bbl in the Tazhong Uplift and greater than 21.43 × 10⁹ bbl in the Tabei Uplift, and the area shows promising hydrocarbon exploration potential (Figure 1(a)). However, the origin of this oil remains controversial. According to the geochemical biomarker parameters and carbon isotope characteristics, the Upper–Middle Ordovician carbonate source rock is a major contributor to the marine hydrocarbon sources (Hanson et al., 2000). However, recent data from 246 wells (some located on the slope close to the Manjiaer Depression, e.g. SINOPEC’s well SB1 and PetroChina’s well GL2) suggest that the Middle–Upper Ordovician carbonates are commonly observed to be too low in organic matter (present-day TOC ≤ 0.5%) to contribute significantly to hydrocarbon accumulation in the carbonate platform successions of the basin (Figure 1). Thus, the high-quality Cambrian–Lower Ordovician source rocks (TOC > 0.5%) are assumed to be responsible for the extensively distributed oil and gas resources in the carbonate platform (Pang et al., 2016). However, from the third round of the national resource assessment based on the contribution of high organic matter Cambrian–Lower Ordovician source rocks, the predicted in-place resources of oil, gas, and oil equivalents in both the Tazhong and Tabei areas (the two richest hydrocarbon areas in the platform of Tarim Basin) are observed to be lower than the discovered reserves (Yang, 2012, personal communication), implying a contribution by the present-day low-TOC carbonates.
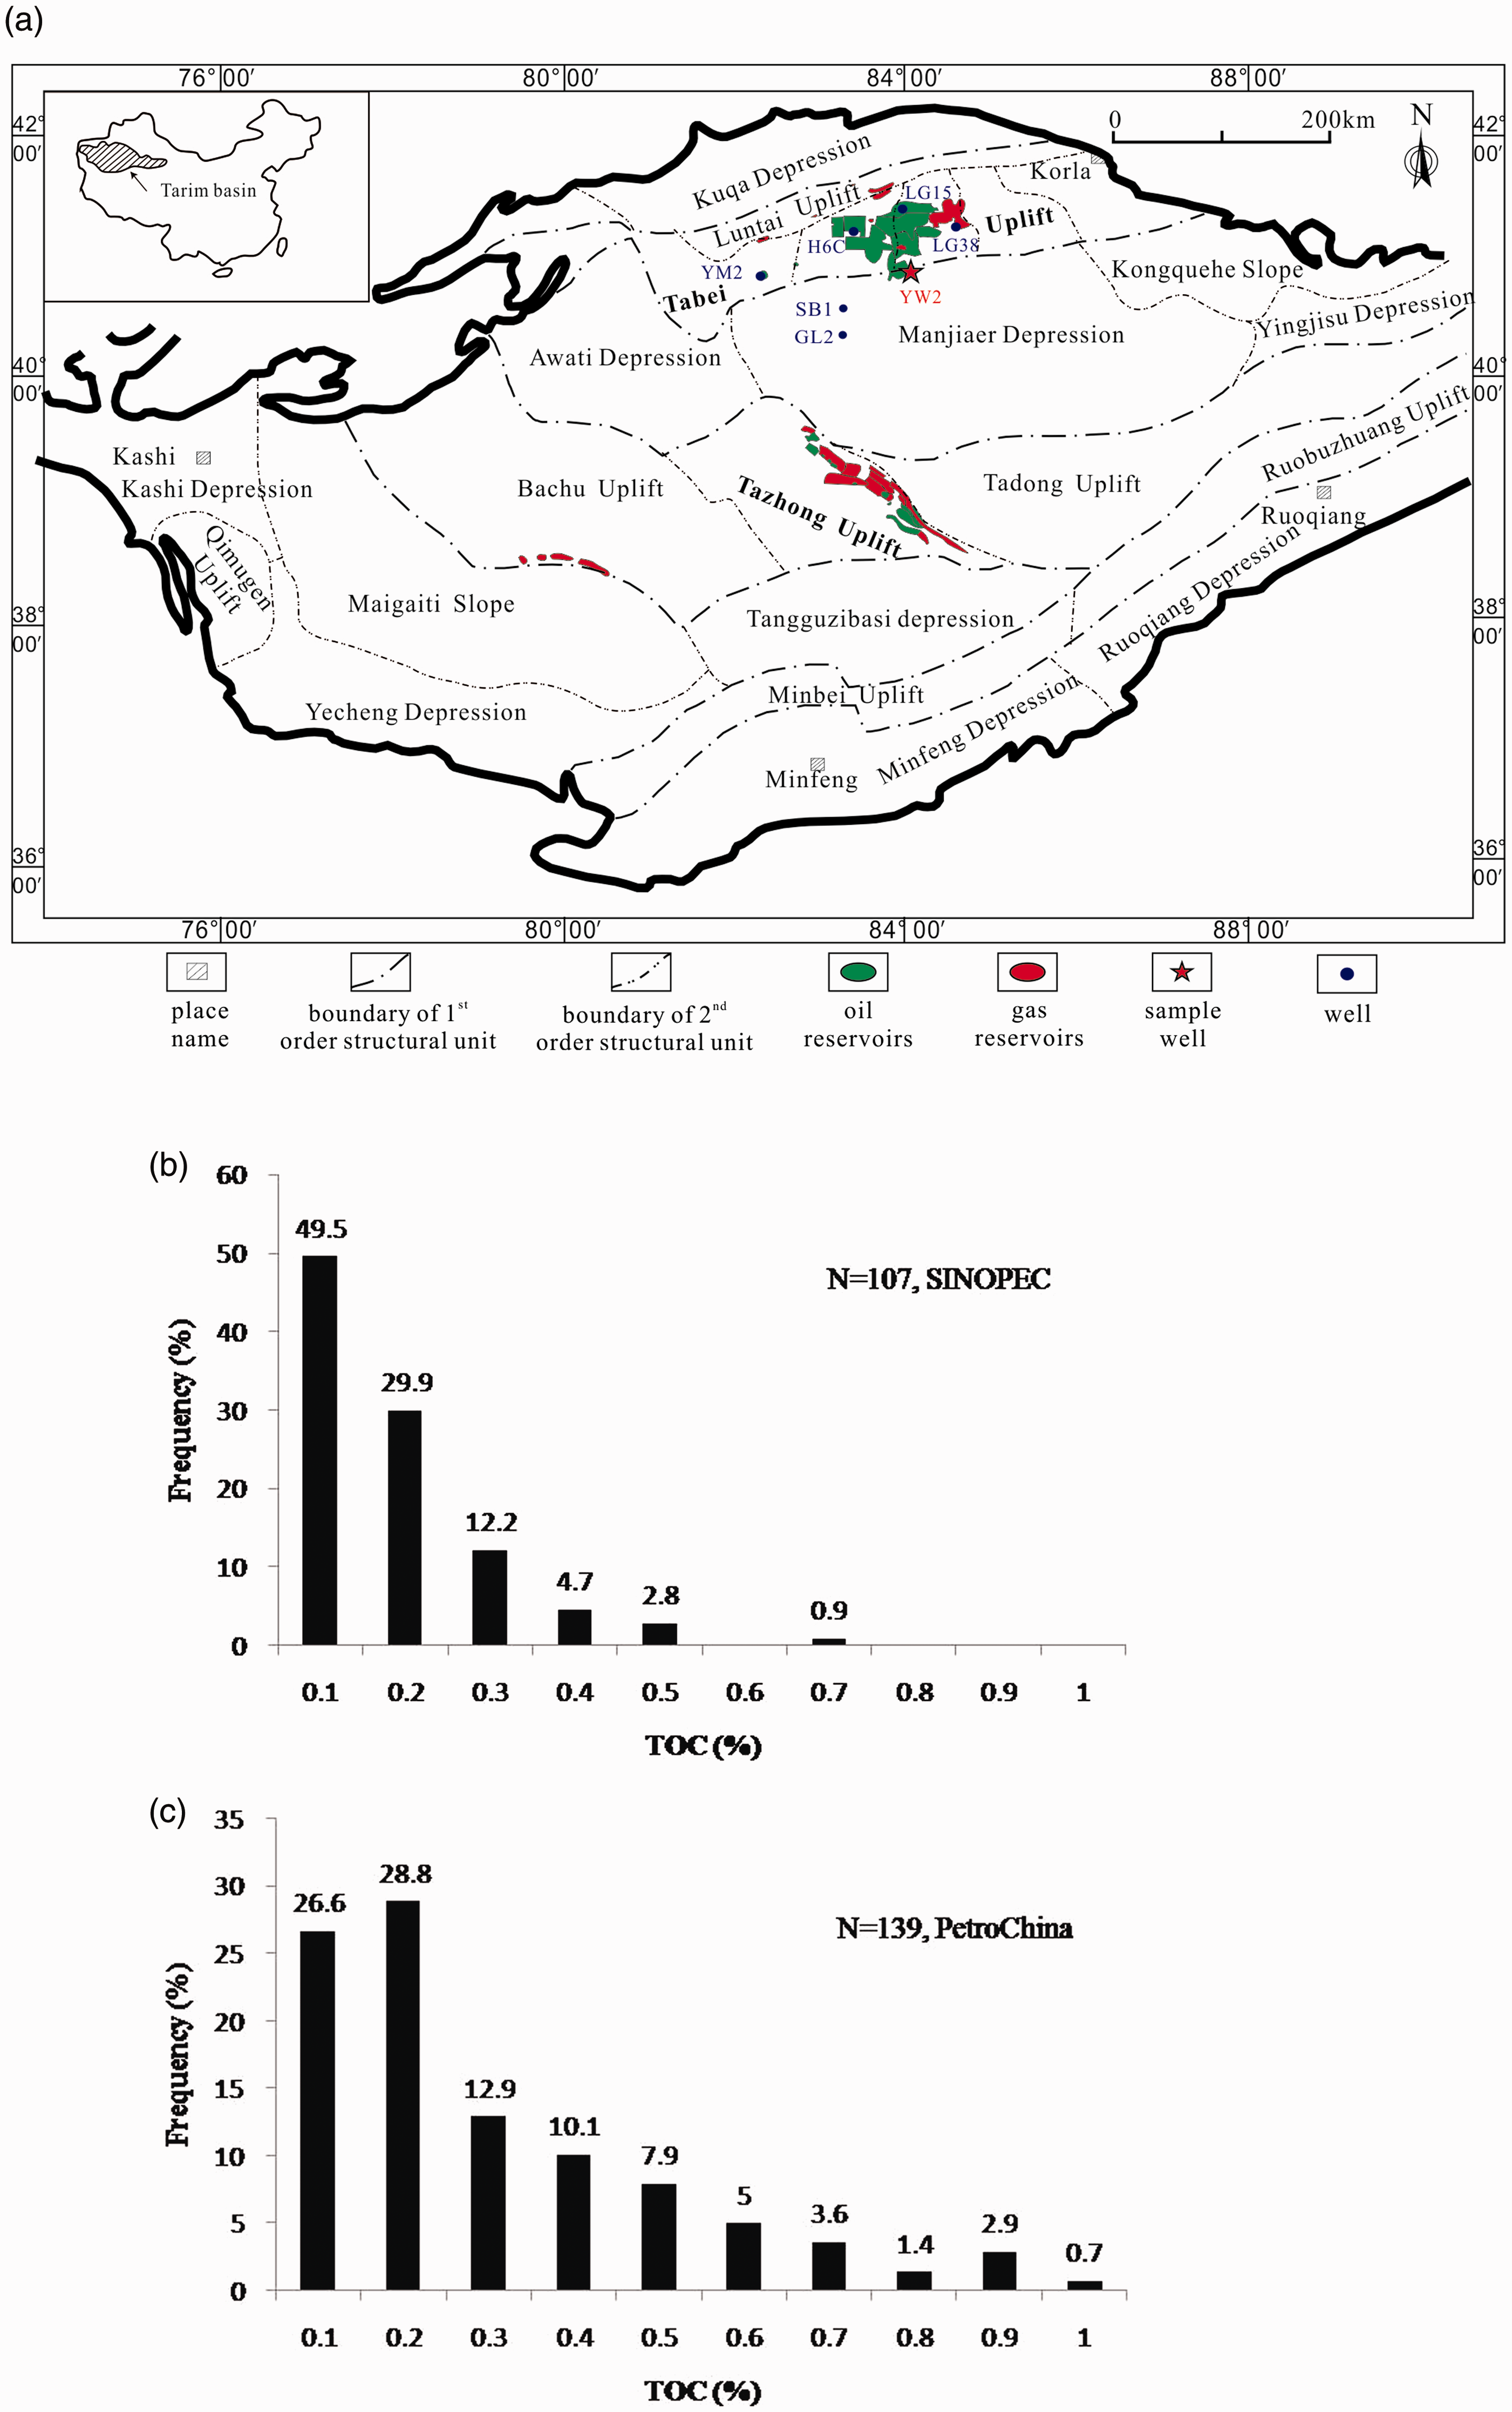
Distribution (a) discovered hydrocarbon, Tarim Basin. (b) Middle–Upper Ordovician source rocks from SINOPEC wells, Tarim Basin. (c) TOC distribution of Middle–Upper Ordovician source rocks from PetroChina wells, Tarim Basin. TOC: total organic carbon.
Tissot and Welte (1978) observed that the current organic matter content is only a part of the original amount, which may have been up to double of the present amount. Daly and Edman (1985) suggested guidelines for the extent of conversion of various kerogen types. They illustrated values of 80, 50, and 20% for the total amount of initial TOC that could be converted to kerogen types I, II, and III, respectively. Therefore, present-day low-TOC carbonates may have been high-TOC source rocks in the past (Pang et al., 2014). However, not all present-day low-TOC carbonate rocks exhibit hydrocarbon expulsion. According to our continuously sampled experiments, there are two types of present-day low-TOC carbonate source rocks: those that have generated and expelled hydrocarbons and those that have not. The former has high initial TOC, but the present-day TOC is the residue left after the hydrocarbon expulsion that contributed to hydrocarbon accumulation. The latter consists of relatively poor types of kerogen or reworked inactive carbon and contributes little or nothing to hydrocarbon expulsion, and thus, cannot be identified as a source rock. Thus, identification of source rocks that have generated and expelled hydrocarbons and evaluation of their contribution to the overall accumulation are significant for marine hydrocarbon exploration in the Tarim Basin.
To evaluate the amount of hydrocarbon expulsion from the Middle–Upper Ordovician source rocks in the Tarim Basin, we have to identify the present-day low-TOC source rock that expelled the hydrocarbons and contributed to the accumulation. Based on the principle of mass balance and the definition of hydrocarbon expulsion threshold, the amount of hydrocarbons that were generated has to satisfy the retention in the source rock prior to expulsion. We used the S1/TOC index to represent the retention capability of the rocks and to develop a quick and cost-effective model to predict S1/TOC using the extensively available well-logging data. By applying the model to the Tarim Basin, we identified the source rocks that had expelled hydrocarbons and evaluated the amount of expulsion based on their thickness, TOC content, spatial distribution, and other parameters.
Samples and experiments
Background and samples
The Tarim Basin is located in the west of China and has an exploration area of approximately 560 × 103 km2 (Figure 1(a)). The structural units of the platform include the Tabei, Bachu, Tazhong, and Tadong Uplifts, and the Awati and Manjiaer Depressions (Figure 1(a)). Identified hydrocarbons are mainly distributed throughout the Tabei and Tazhong Uplifts (Figure 1(a)). The Ordovician System in the Tabei Uplift includes the Lower Ordovician Yingshan formation, Middle Ordovician Yijianfang formation, and Upper Ordovician Tumuxiuke, Lianglitage, and Sangtamu formations (Figure 2); some formations wedge out in certain areas. The Yingshan and Yijianfang formations are the primary producers in the Tabei Uplift (Figure 2).
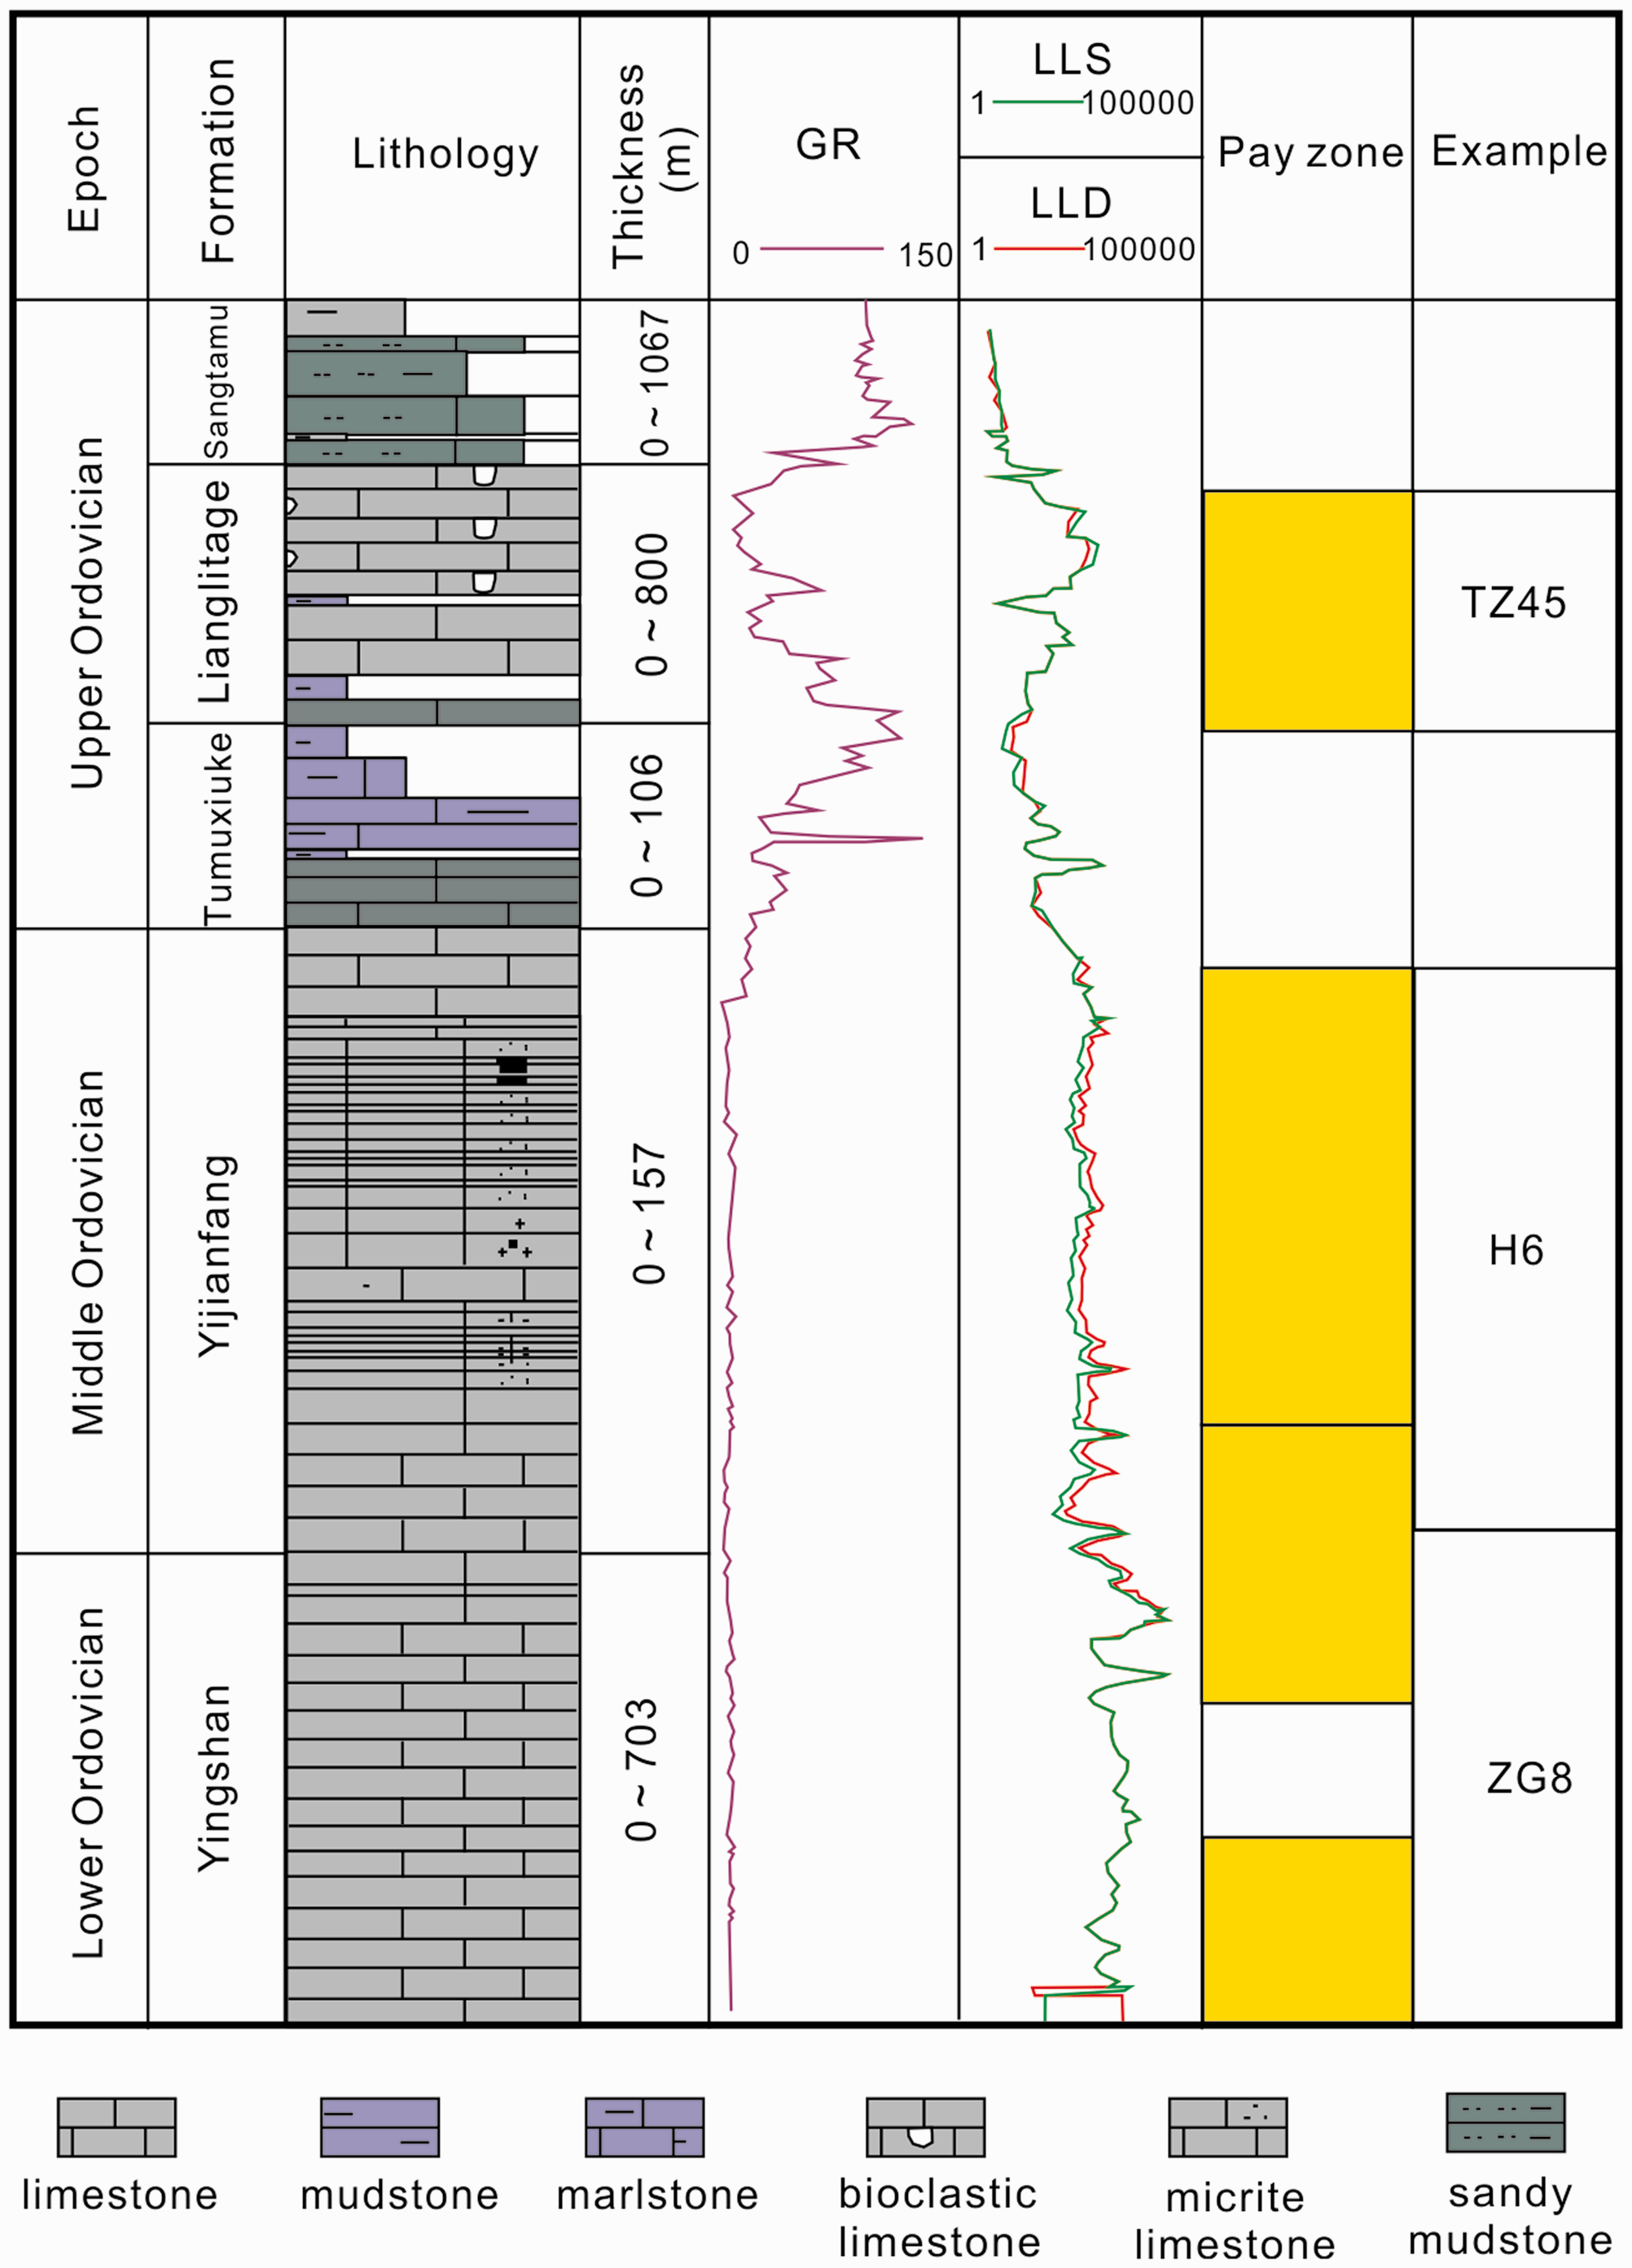
Stratigraphic framework of the Ordovician System in the Platform of the Tarim Basin. GR: natural gamma ray; LLD: deep lateral resistivity log; LLS: shallow lateral resistivity log.
Yangwu 2 (YW2) well, a typical well that has been recently used to investigate the Middle–Upper Ordovician source rocks, was chosen for the case study and was continuously sampled during corresponding intervals. The well is located in the west of the YW2 structure among the Manbei structural zones and to the north of the Manjiaer Depression (Figure 1(a)). Currently, the stratigraphy of YW2 includes the Upper, Middle, and Lower Ordovician. However, Lower Ordovician has not yet been penetrated (Figure 3). The penetration into the Ordovician is the deepest among the wells in the area, and it depicts a mostly varied lithology, which includes limestone, muddy limestone, lime mudstone, and mudstone. The limestone can be divided into micrite, siltite, and sparite limestone (Figure 3). The sampled Ordovician interval is 86 m from depth between 6411 and 6496 m of Middle–Upper Ordovician. With one cutting sample in each meter, 86 samples were taken.
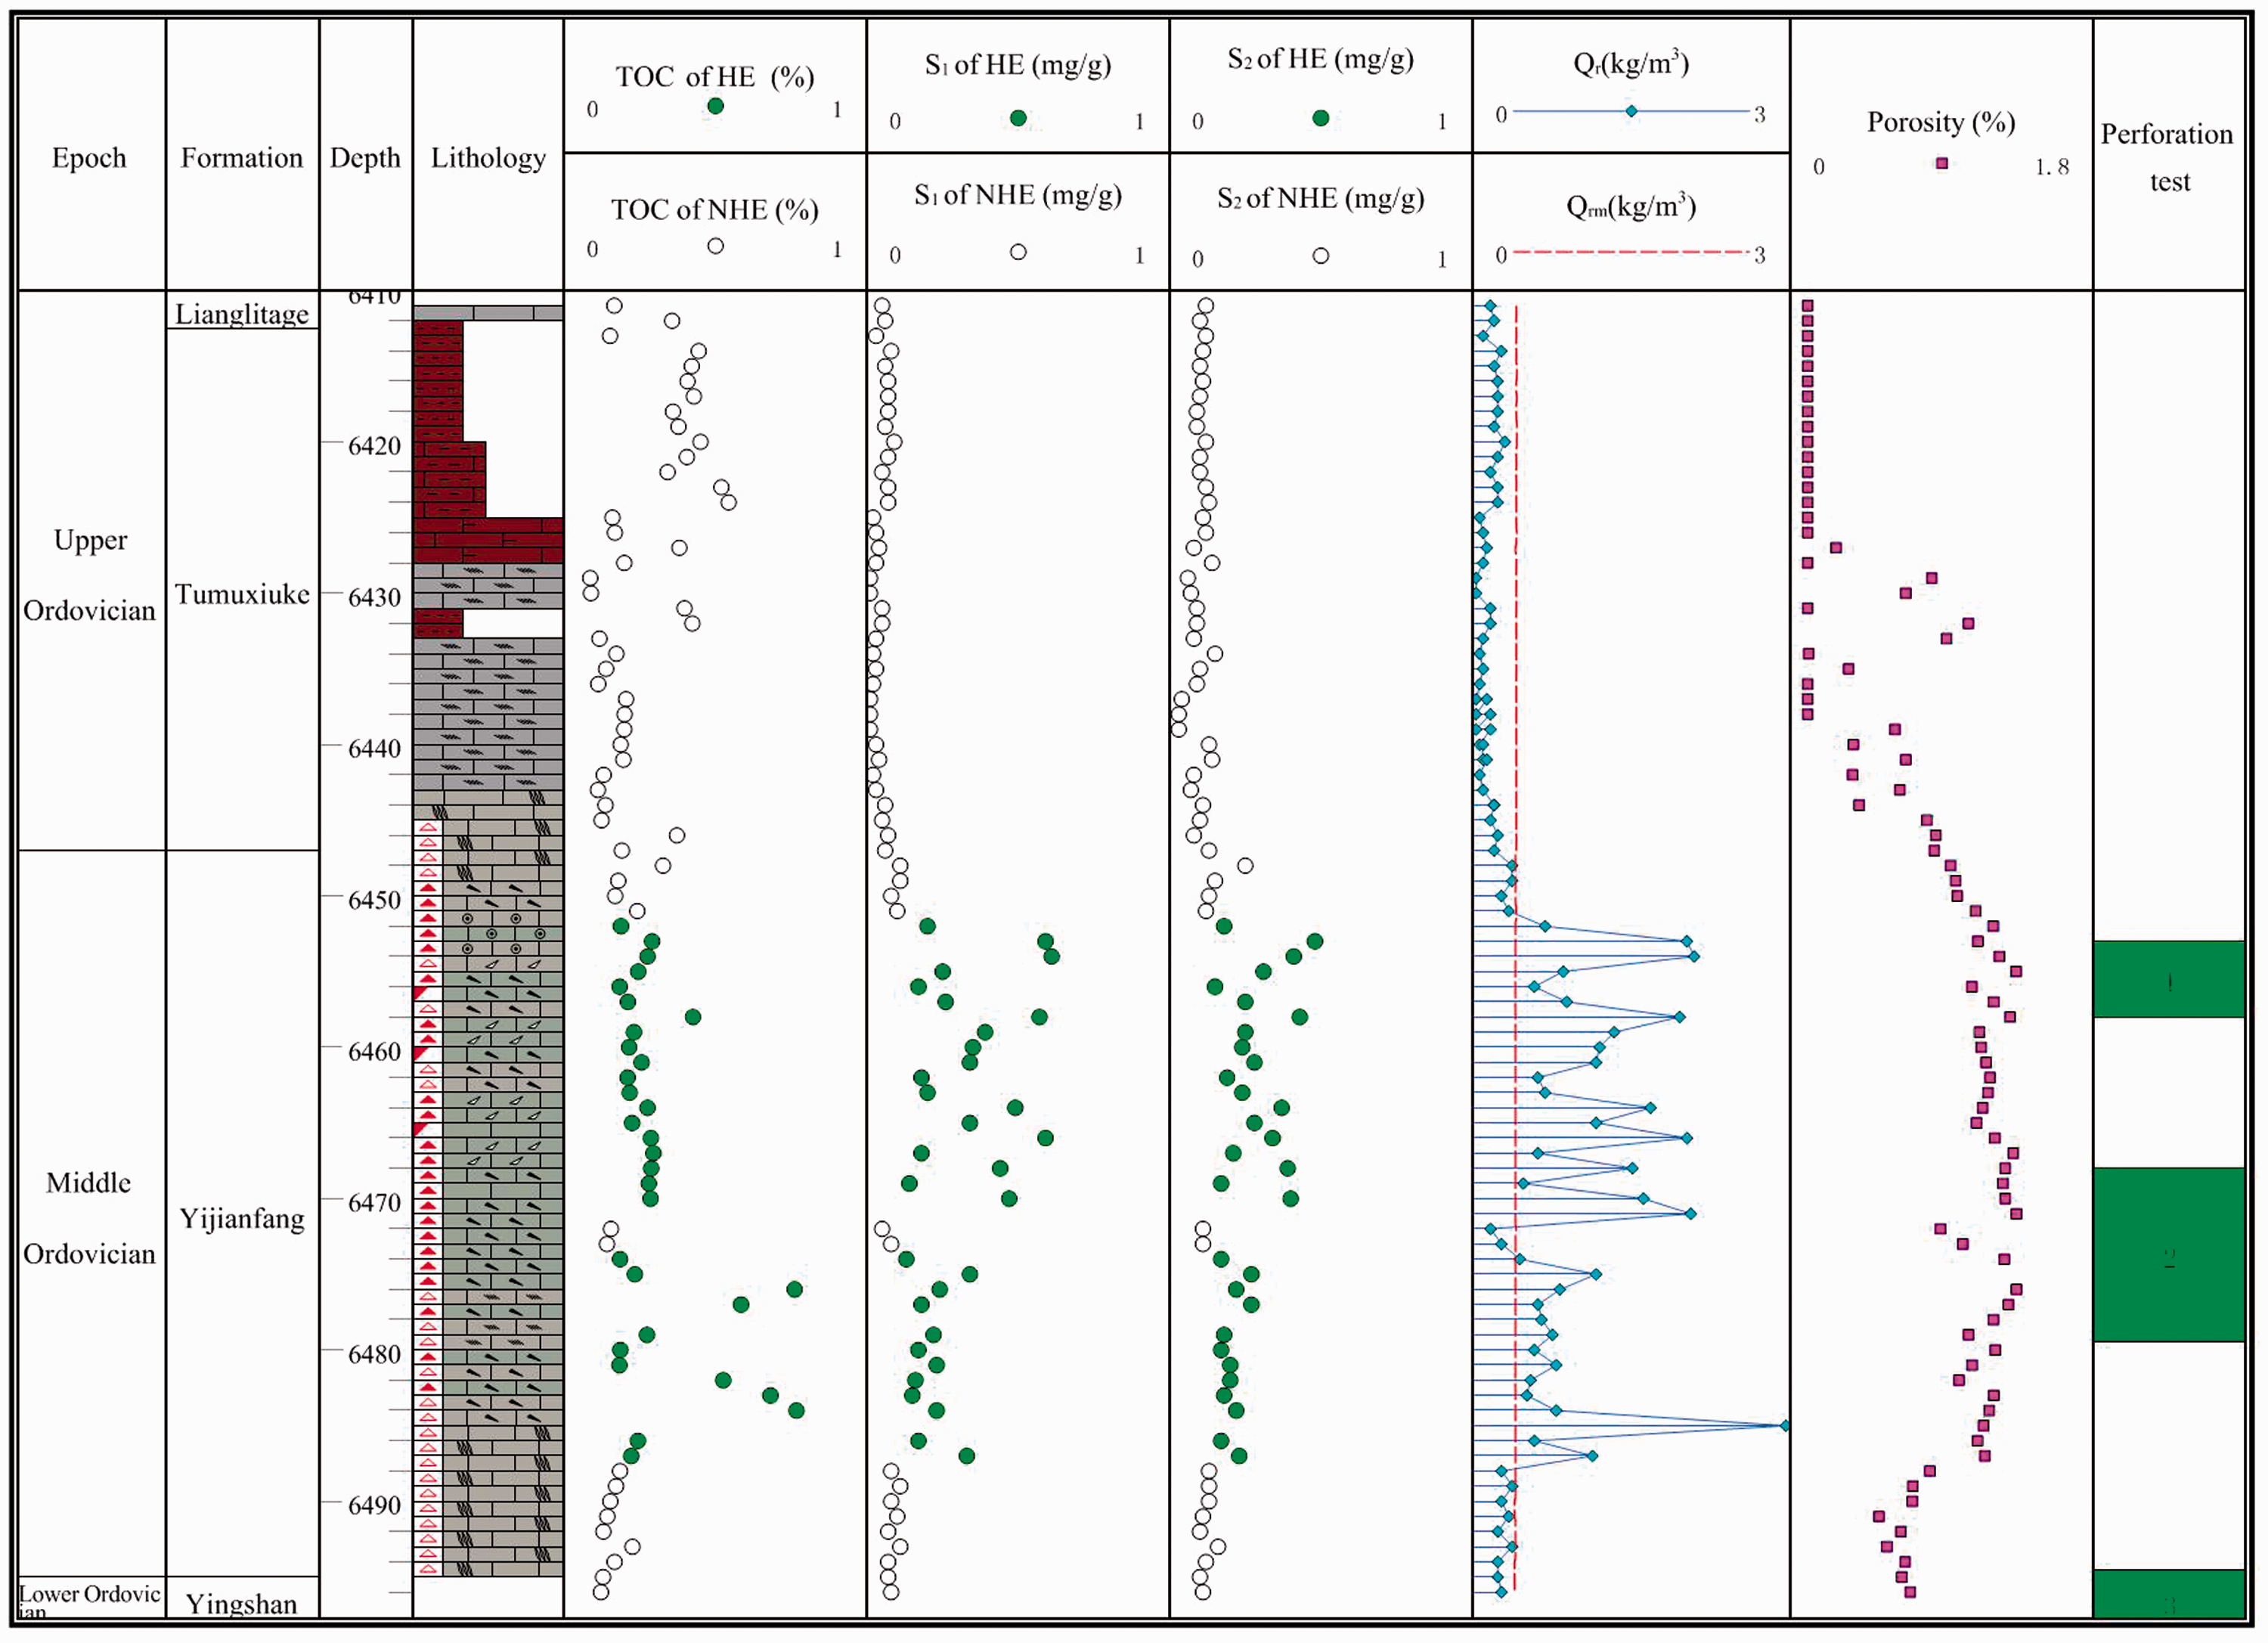
Identification results and characteristics of present-day low-TOC carbonate source rock in Middle–Upper Ordovician in YW2 well (location is shown in Figure 1(a)). In the figure, HE means carbonates having expelled hydrocarbons during history and NHE means carbonates not having expelled hydrocarbons. TOC: total organic carbon.
Prior to sample preparation, QA/QC eliminated any samples that may have been affected by weathering and/or potential contamination. The remaining samples were washed in distilled water to eliminate any additives from the drilling mud. These samples were further crushed and milled to 80 mesh after drying for 5 h at 55°C and were sealed in glass bottles before conducting the necessary experiments.
Experiments
Two experiments, TOC content analysis and Rock-Eval pyrolysis, were conducted during this study. A finely powdered GBW(E)070037a sample with 2% TOC, 8.2 ± 0.3 S2, and 439 ± 2°C Tmax was used as the standard rock sample for quality assurance of the experiments. To ensure the consistency of the experimental data over time, the standard sample was analyzed both at the beginning and end of each batch of samples as well as between every five samples within each batch.
For the TOC analysis, 300 mg of each sample was weighted and a duplicate was taken for every 10th sample. A CS-230HC machine manufactured by LECO from the USA was used to perform the analysis. Inorganic carbon was eliminated by dripping dilute hydrochloric acid onto the samples until all the bubbles were eliminated. The samples were neutralized by adding ultrapure water several times, and they were further precipitated, extracted, and filtered. Further, they were dried at a low temperature of approximately 40°C. Finally, the TOC content was converted to CO2 by incinerating the samples with oxygen at a high temperature. Further, the TOC content was measured using an infrared detector.
In the Rock-Eval pyrolysis experiment, a Rock-Eval 6 analyzer was used to obtain the amount of free S1 and pyrolyzed S2 hydrocarbons and the highest pyrolysis temperature (Tmax). The initial pyrolysis temperature was set to be 300°C and the reaction was maintained at this temperature for 5 min. The temperature was further increased to 650°C using an increase rate of 25°C/min. Finally, the temperature was allowed to fall naturally.
Results and discussions
QA/QC eliminated five samples depicting abnormal data with extremely high or low Tmax. Of the 79 remaining samples, 72 were low-TOC source rocks (accounting for 91% of the total). In these, S1 ranged from 0.01 to 0.61 mg/g, whereas S2 ranged from 0.06 to 0.48 mg/g (Figure 3).
Distinguishing
Pang et al. (2005) proposed the concept of an expulsion threshold to reveal the mass balance of hydrocarbon generation, retention, and expulsion along with the critical conditions required for a source rock to expel hydrocarbons. The expulsion threshold is defined as the critical balance point when the source rocks have generated enough hydrocarbons so as to be able to migrate against capillary sealing, expelling movable hydrocarbons (Figure 4).
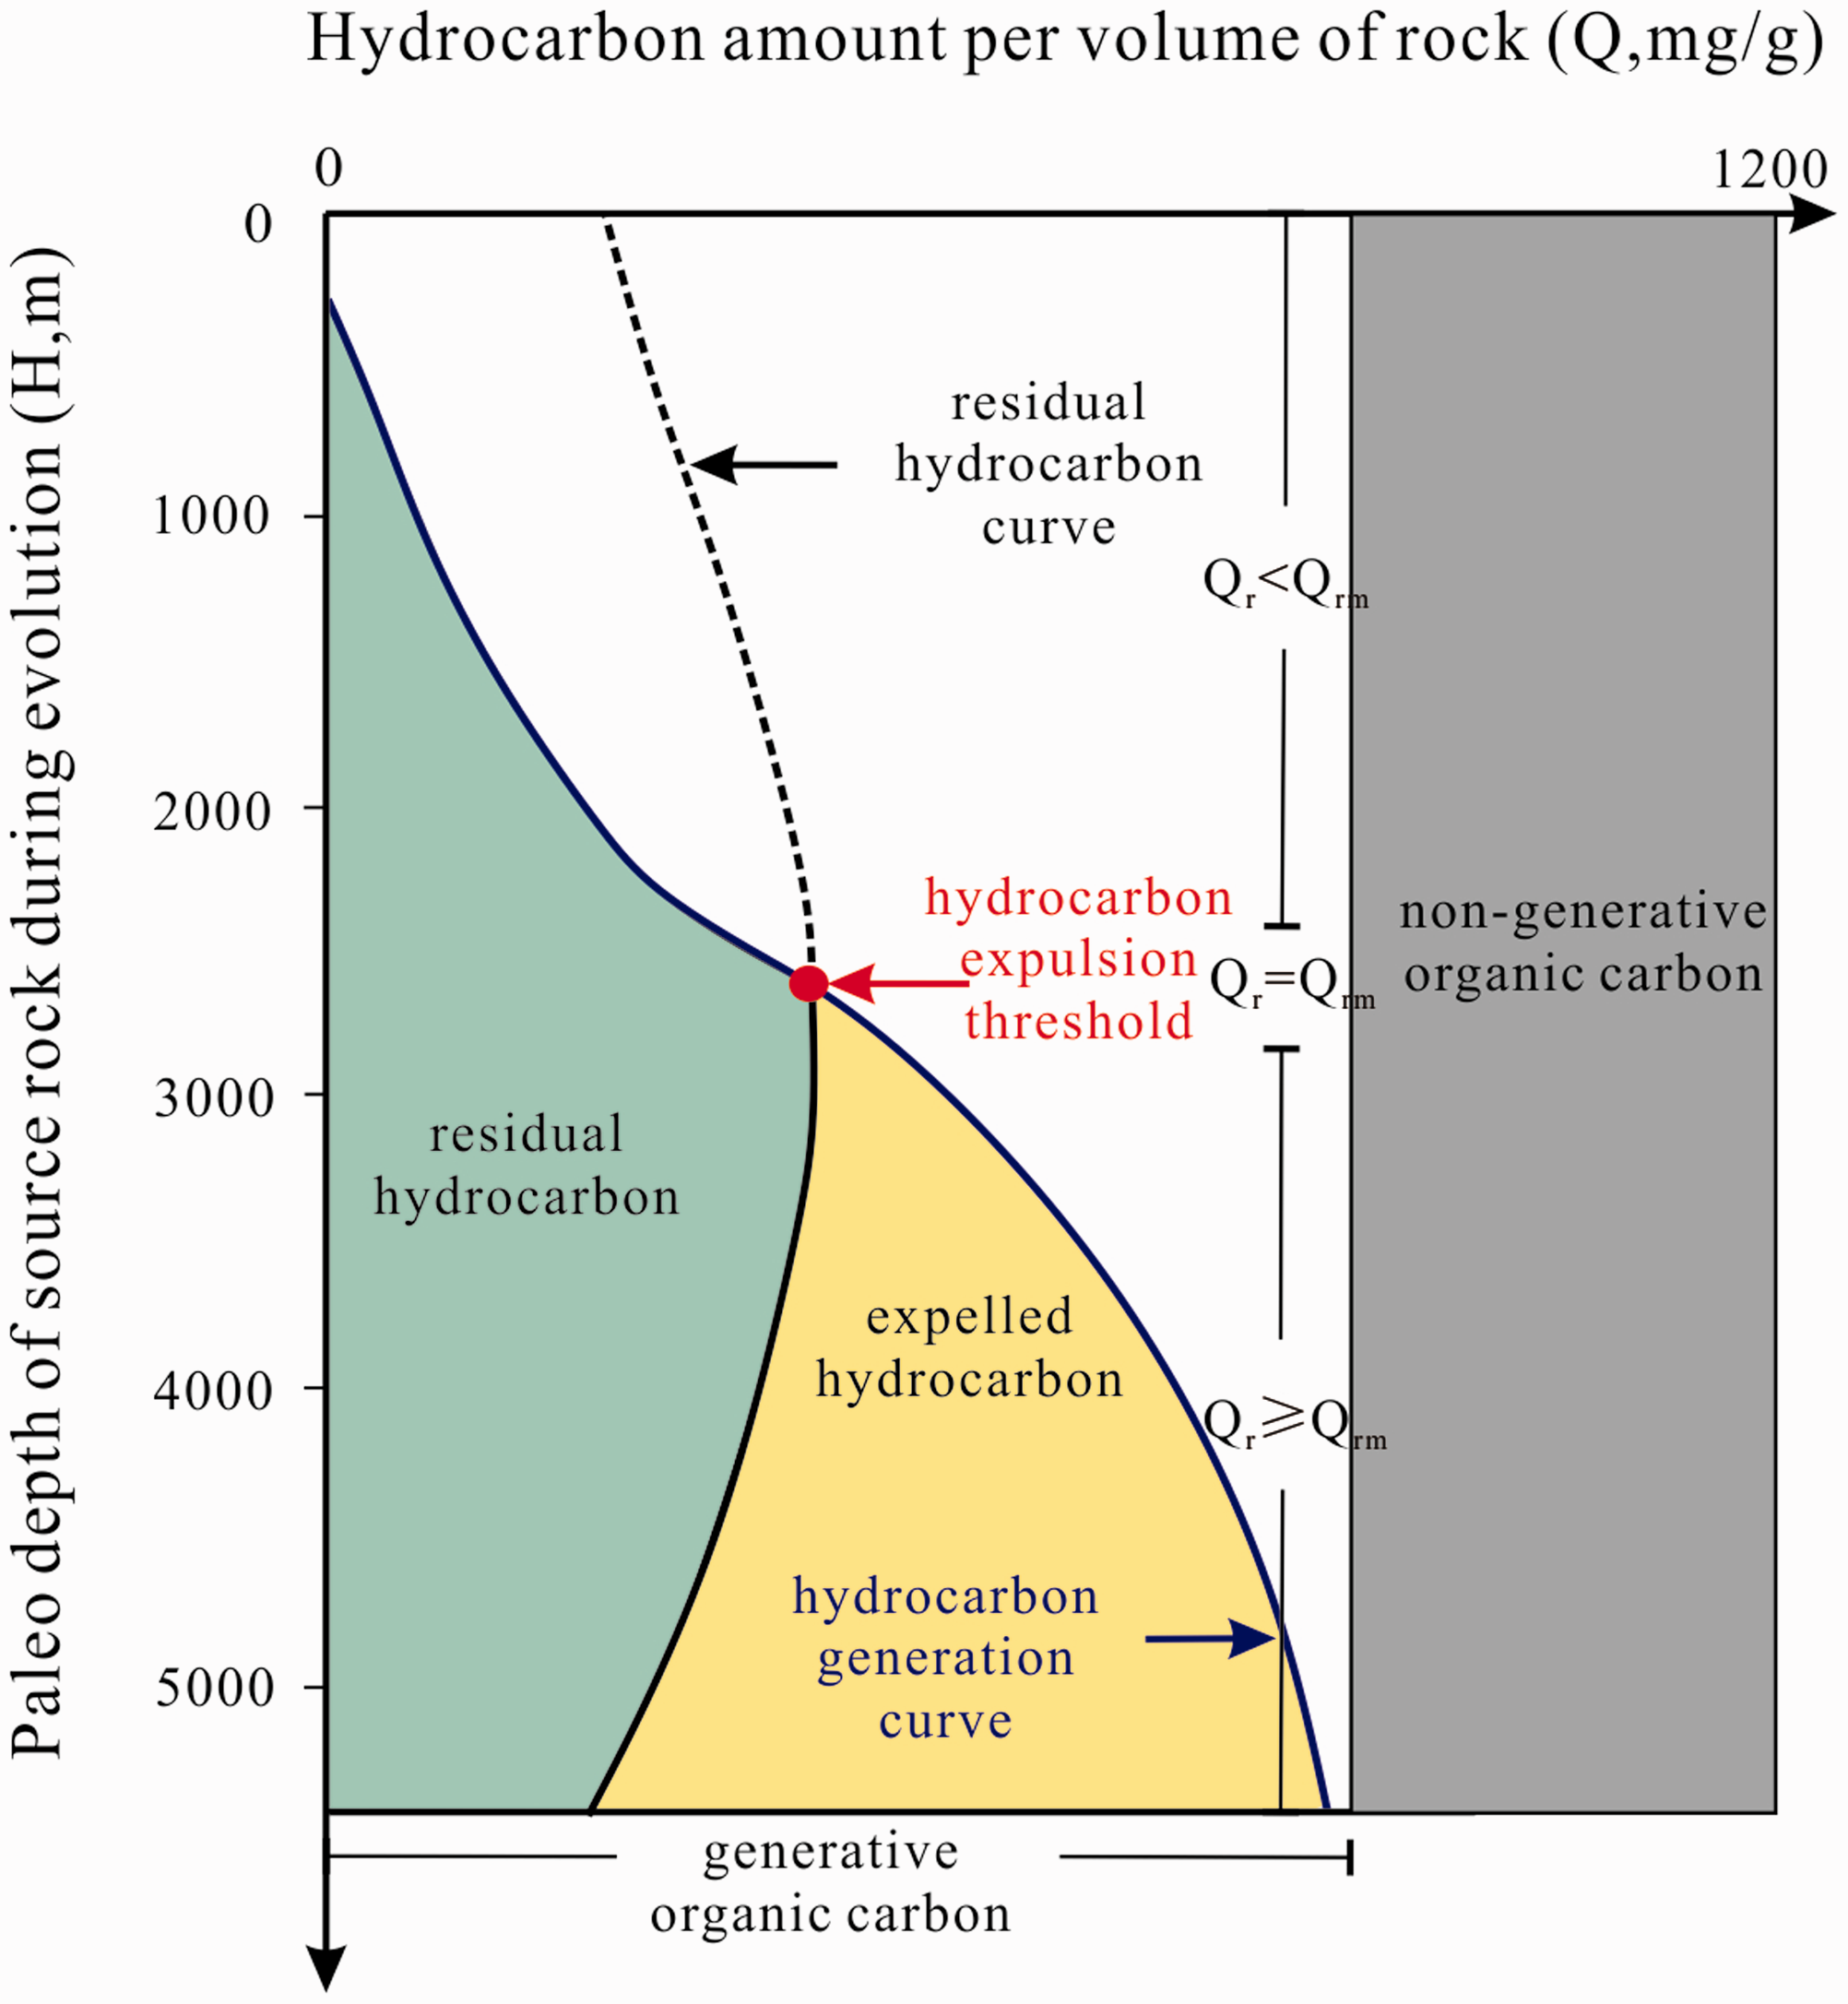
Mass balance model for hydrocarbon generation, residue, expulsion variation of source rock (modified after Pang et al. (2005)). The blue solid line is the hydrocarbon generation curve; the black dotted line before hydrocarbon expulsion threshold and the black solid line below the threshold are the hydrocarbon retention line; the yellow area is to show the hydrocarbon expulsion amount, and the light green area means the residual amount in the source rock; the sum of the two areas is to present the hydrocarbon generation amount.
We distinguish between the present-day low-TOC carbonate source rocks that have expelled hydrocarbons using the following steps: First, based on the mass balance approach and the definition of the expulsion threshold (Pang et al., 2005), the amount of residual hydrocarbon at the hydrocarbon expulsion threshold (Qrm) was calculated; this is the minimum theoretical amount of hydrocarbon generated that is necessary for a source rock to expel hydrocarbons (equation (1)). Second, based on the experimental results, the actual amount of residual hydrocarbons (Qr) was calculated and calibrated against indigenous oil (equations (2) to (4)) according to the amount of free hydrocarbons S1 after a compensation calibration was performed for light hydrocarbons (Pang et al., 1993). Therefore, present-day low-TOC source rocks that have expelled hydrocarbons can be identified using the above two values. Present-day low-TOC carbonates can be identified as not having expelled hydrocarbons expulsion when the actual residual hydrocarbon amount does not reach the minimum generation amount for expulsion; otherwise, the carbonates are identified to be making a contribution as they have reached the expulsion threshold, indicating that they have expelled hydrocarbons during their history (Figure 4).
Previous results indicate that the controlling factors for Qrm include source rock features (lithology, mineral constituency, and specific surface area), hydrocarbon generation capability (organic type, organic maturity, and TOC), compaction effect (residual porosity), pressure and temperature conditions, and others (Pang et al., 1993, 2005; Robert and Zoback, 2014). Pang et al. (1993) developed a quantitative simulation model that can be simplified as depicted in equation (1)

In this study, Qr was calculated according to “S1” based on the results of Rock-Eval pyrolysis for typical samples (equation (2)). The light hydrocarbon compensation calibration in “S1” was conducted initially (equations (3) and (4)) (Pang et al., 1993), and the amounts of actual residual hydrocarbons were calculated using the calibrated residual amount (S1+) in accordance with the model that is given below


TOC and S1 data used in this study were obtained during the experiments that were conducted after continuous sampling of typical, present-day, low-TOC source rocks in the Middle–Upper Ordovician formation. Other data that were used, such as porosity, vitrinite reflectance equivalent, formation pressure, formation temperature, oil saturation, formation water salinity, chloroform bitumen “A,” and the amount of absorbed gas, were collected from the Tarim Oilfield Company, PetroChina.
The results depict that hydrocarbon expulsion occurred in the present-day low-TOC carbonate source rocks in a range of 6452–6487 m in the Yijianfang formation (Figure 3). Additionally, statistical analysis illustrates that the amount of residual hydrocarbons at the expulsion threshold in the sampled interval is approximately 0.41 kg/m3 (Figure 3). Due to similar geological conditions over the 86 m sampled interval, all the aforementioned controlling factors could make considerable differences to Qrm. Further, the corresponding S1 values of present-day low-TOC carbonates with hydrocarbon expulsion can be larger than 0.12 mg/g (Figure 3).
Verification
We validated the results of the geological and geochemical analysis. Results depict that the estimated porosity using the well-logging data over the studied interval is poor, with a maximum of 1.34%, minimum of 0.10%, and an average of 0.80% (Figure 3). The porosity of carbonates depicting hydrocarbon expulsion is relatively higher than that was observed in case of nonsource rock intervals (Figure 3). This phenomenon is caused due to hydrocarbon generation and expulsion over time. Evidence suggested that organic porosity exists in source rocks as a result of kerogen decomposition (Chen and Jiang, 2016; Modica and Lapierre, 2012). Plenty of acidic materials are expelled during hydrocarbon generation and expulsion, which can result in the formation of secondary pores through carbonate dissolution (Eseme et al., 2012; Jarvie, 2014; Surdam et al., 1984).
Charging of tight oil is hindered by the capillary pressure as well as the viscous and inertial forces (Zou et al., 2013). Effective reservoirs depict a lower porosity limit within which the oils have to be accumulated (Jiang et al., 2017). The porosity of the effective carbonate reservoir rocks in the Tarim Basin is generally greater than 1.8% (Pang et al., 2013). The YW2 well is located in slope that is located close to a depression (Figure 1(a)). Further, we observe that faults are not developed and that the porosity and permeability are low in the aforementioned slope (Figure 3). Therefore, we can reasonably conclude that the possibility of charging oil to the carbonate reservoir of the YW2 well is quite small. Previous researchers have conducted perforation tests in intervals of 6453–6458, 6468–6479.5, and 6494.5–6499 m, and their results depict a daily oil production of 0.19 m3. This depicts that the Yijianfang formation carbonates, with present-day low-TOC values, generated a sufficient amount of hydrocarbons and expelled them (Figure 3). Additionally, the hydrocarbon statistics from a core description report (data from Tarim Oilfield Company, PetroChina) were investigated, and the results are observed to match well with the identification. As depicted in Figure 3, fluorescence, oil stains, and oil shows are common in the Yijianfang formation, depicting that hydrocarbon generation and expulsion have occurred; however, there are almost no hydrocarbon show in the Tumuxiuke formation, hinting that hydrocarbon generation is not enough.
Additionally, an oil–source correlation study was conducted based on the biomarker characteristics between the crude oil samples from discovered oil accumulations and the present-day low carbonates with hydrocarbon expulsion in the YW2 well. Results suggest that crude oils in the Yingmaili, Halahatang, and Lungu oilfields in the Tabei Uplift have similar biomarker signatures as compared with those of present-day low-TOC carbonates extracts in YW2 well with respect to sterane distribution. This distribution of C27, C28, and C29 regular steranes depicts a “V”-shaped trend (Figures 5 and 6), which suggests that crude oils accumulated in the Tabei Uplift may be contributed by the expulsion of the present-day low-TOC carbonates from Upper–Middle Ordovician in the Tarim Basin.
Regular sterane characteristics of present-day low-TOC Middle–Upper Ordovician source rock extracts in YW2 well, Tarim Basin (m/z = 217). (a) Sample 1, (b) Sample 2, (c) Sample 3, and (a) Sample 4.
Regular sterane characteristics of discovered oil (a) Yingmaili; (b) Halahatang; (c) Lungu oilfields, Tarim Basin (m/z = 217) (well locations are shown in Figure 1). (a) YM2,6049–6062 m,O1–2y1, (b) H6C,6773–6830 m,O, and (c) LG15,5726.7–5750 m,O1–2y1.
Quantitative prediction model
In basins that underwent a high level of exploration, carbonate source rock can be identified directly using the mass balance approach when the dataset was consummate and pyrolysis data were extensively available. However, the approach has two deficiencies: (a) the analysis requires many parameters, is quite complicated, and requires a lot of time to apply to large areas; and (b) the pyrolysis data are not continuous at all instances and are limited to renowned good source rock beds. This constrains the availability and spatial representation of present-day low-TOC source rocks, making it difficult to perform a quantitative resource evaluation and to identify any petroliferous production zones that were contributed to by them. However, a quick and reliable evaluation method is essential to obtain a competitive advantage as well as success because hydrocarbon resource exploration and development are capital intensive. In several situations, information requirements regarding the characteristics of source rock hydrocarbon generation are time sensitive in order to make business decisions.
Here, we present a quantitative prediction model using well-logging data to identify the present-day low-TOC carbonate source rocks. If a capability to directly evaluate the contribution of target source rocks can be achieved using archived well-logging data, businesses would gain competitive advantage because such data are available and are observed to be continuous for almost any source rock system in the sedimentary basins.
Data from Pepper (1992) and Sandvik et al. (1992) suggest that organic matter retains a portion of the generated petroleum; this is observed by both the authors to be approximately10 g of liquid sorbed per 100 g of organic matter, i.e. 100 mg HC/g TOC. Thus, there is a resistance to oil expulsion until the sorption threshold is exceeded, i.e. until the value of the oil saturation index (OSI = 100×S1/TOC) is greater than 100 mg hydrocarbons per g of TOC. During our study, characteristic analysis depicts that all the samples have experienced hydrocarbon expulsion when OSI ≥ 100 (Figure 7). Although an OSI value of less than 100 mg HC per g of TOC does not rule out the possibility of having expelled oil, the contribution is significantly less than that of OSI ≥ 100, which makes it less important while making quick decisions. Based on the above results, we tried to determine a convenient and continuous method to predict the present-day low-TOC carbonate source rocks by predicting the “S1/TOC” index using well-logging data.
Cross plots of S1 versus TOC of the Middle–Upper Ordovician formation in YW2 well, Tarim Basin. In the figure, HE means carbonates have hydrocarbon expulsion during history and NHE means carbonates have no hydrocarbon expulsion. OSI: oil saturation index; TOC: total organic carbon.
First, we determined the logging response curves using factor analysis; second, we build a quantitative prediction model of S1/TOC using multivariate nonlinear regression; further, we compared the calculated results with the actual S1/TOC to verify the reliability of the model; and finally, we identified the distribution of present-day low-TOC carbonates depicting hydrocarbon expulsion and compared the results with that of the previous ones that were achieved using the mass balance approach in order to verify the feasibility of the method.
Many logging curves respond to OSI and each single well log has its comprehensive results affected and interfered with by many factors. For example, the density logging curve (DEN) responds to both the lithology and porosity of the target strata. Therefore, we need to verify that the parameters depict an appropriate response and show least interference. Thus, we collected eight conventional well-logging curves from the YW2 well. These comprised natural gamma ray (GR), neutron (CN), density (DEN), acoustic (DT), uranium (U), thorium (TH), potassium (K), and double lateral resistivity (RD) logs, and each was observed for its effect on S1/TOC. Using multifactor analysis, we selected the factors that showed a maximum correlation with S1/TOC according to the rule, which states that parameters having a general factor should be clustered together (Figure 8). To ensure that the general factor was S1/TOC, we added TOC, porosity, and lithology (shale content) as well as the data from the eight well-logging curves. Considering that “U/TH” plays an important role in the identification of good quality of source rock, we also add “U/TH” to investigate its controlling effect (Teng et al., 2004). The multifactor analysis results depict that the well-logging responses can be divided into two stacks due to the general factor: the well-log responses of RD and U/TH are clustered together and correlated to S1/TOC, S1, and porosity; and the well-log responses of CN, DT, K, GR, and TH are clustered together and mostly correlated to the shale content in carbonates with low TOC and porosity (Figure 8).
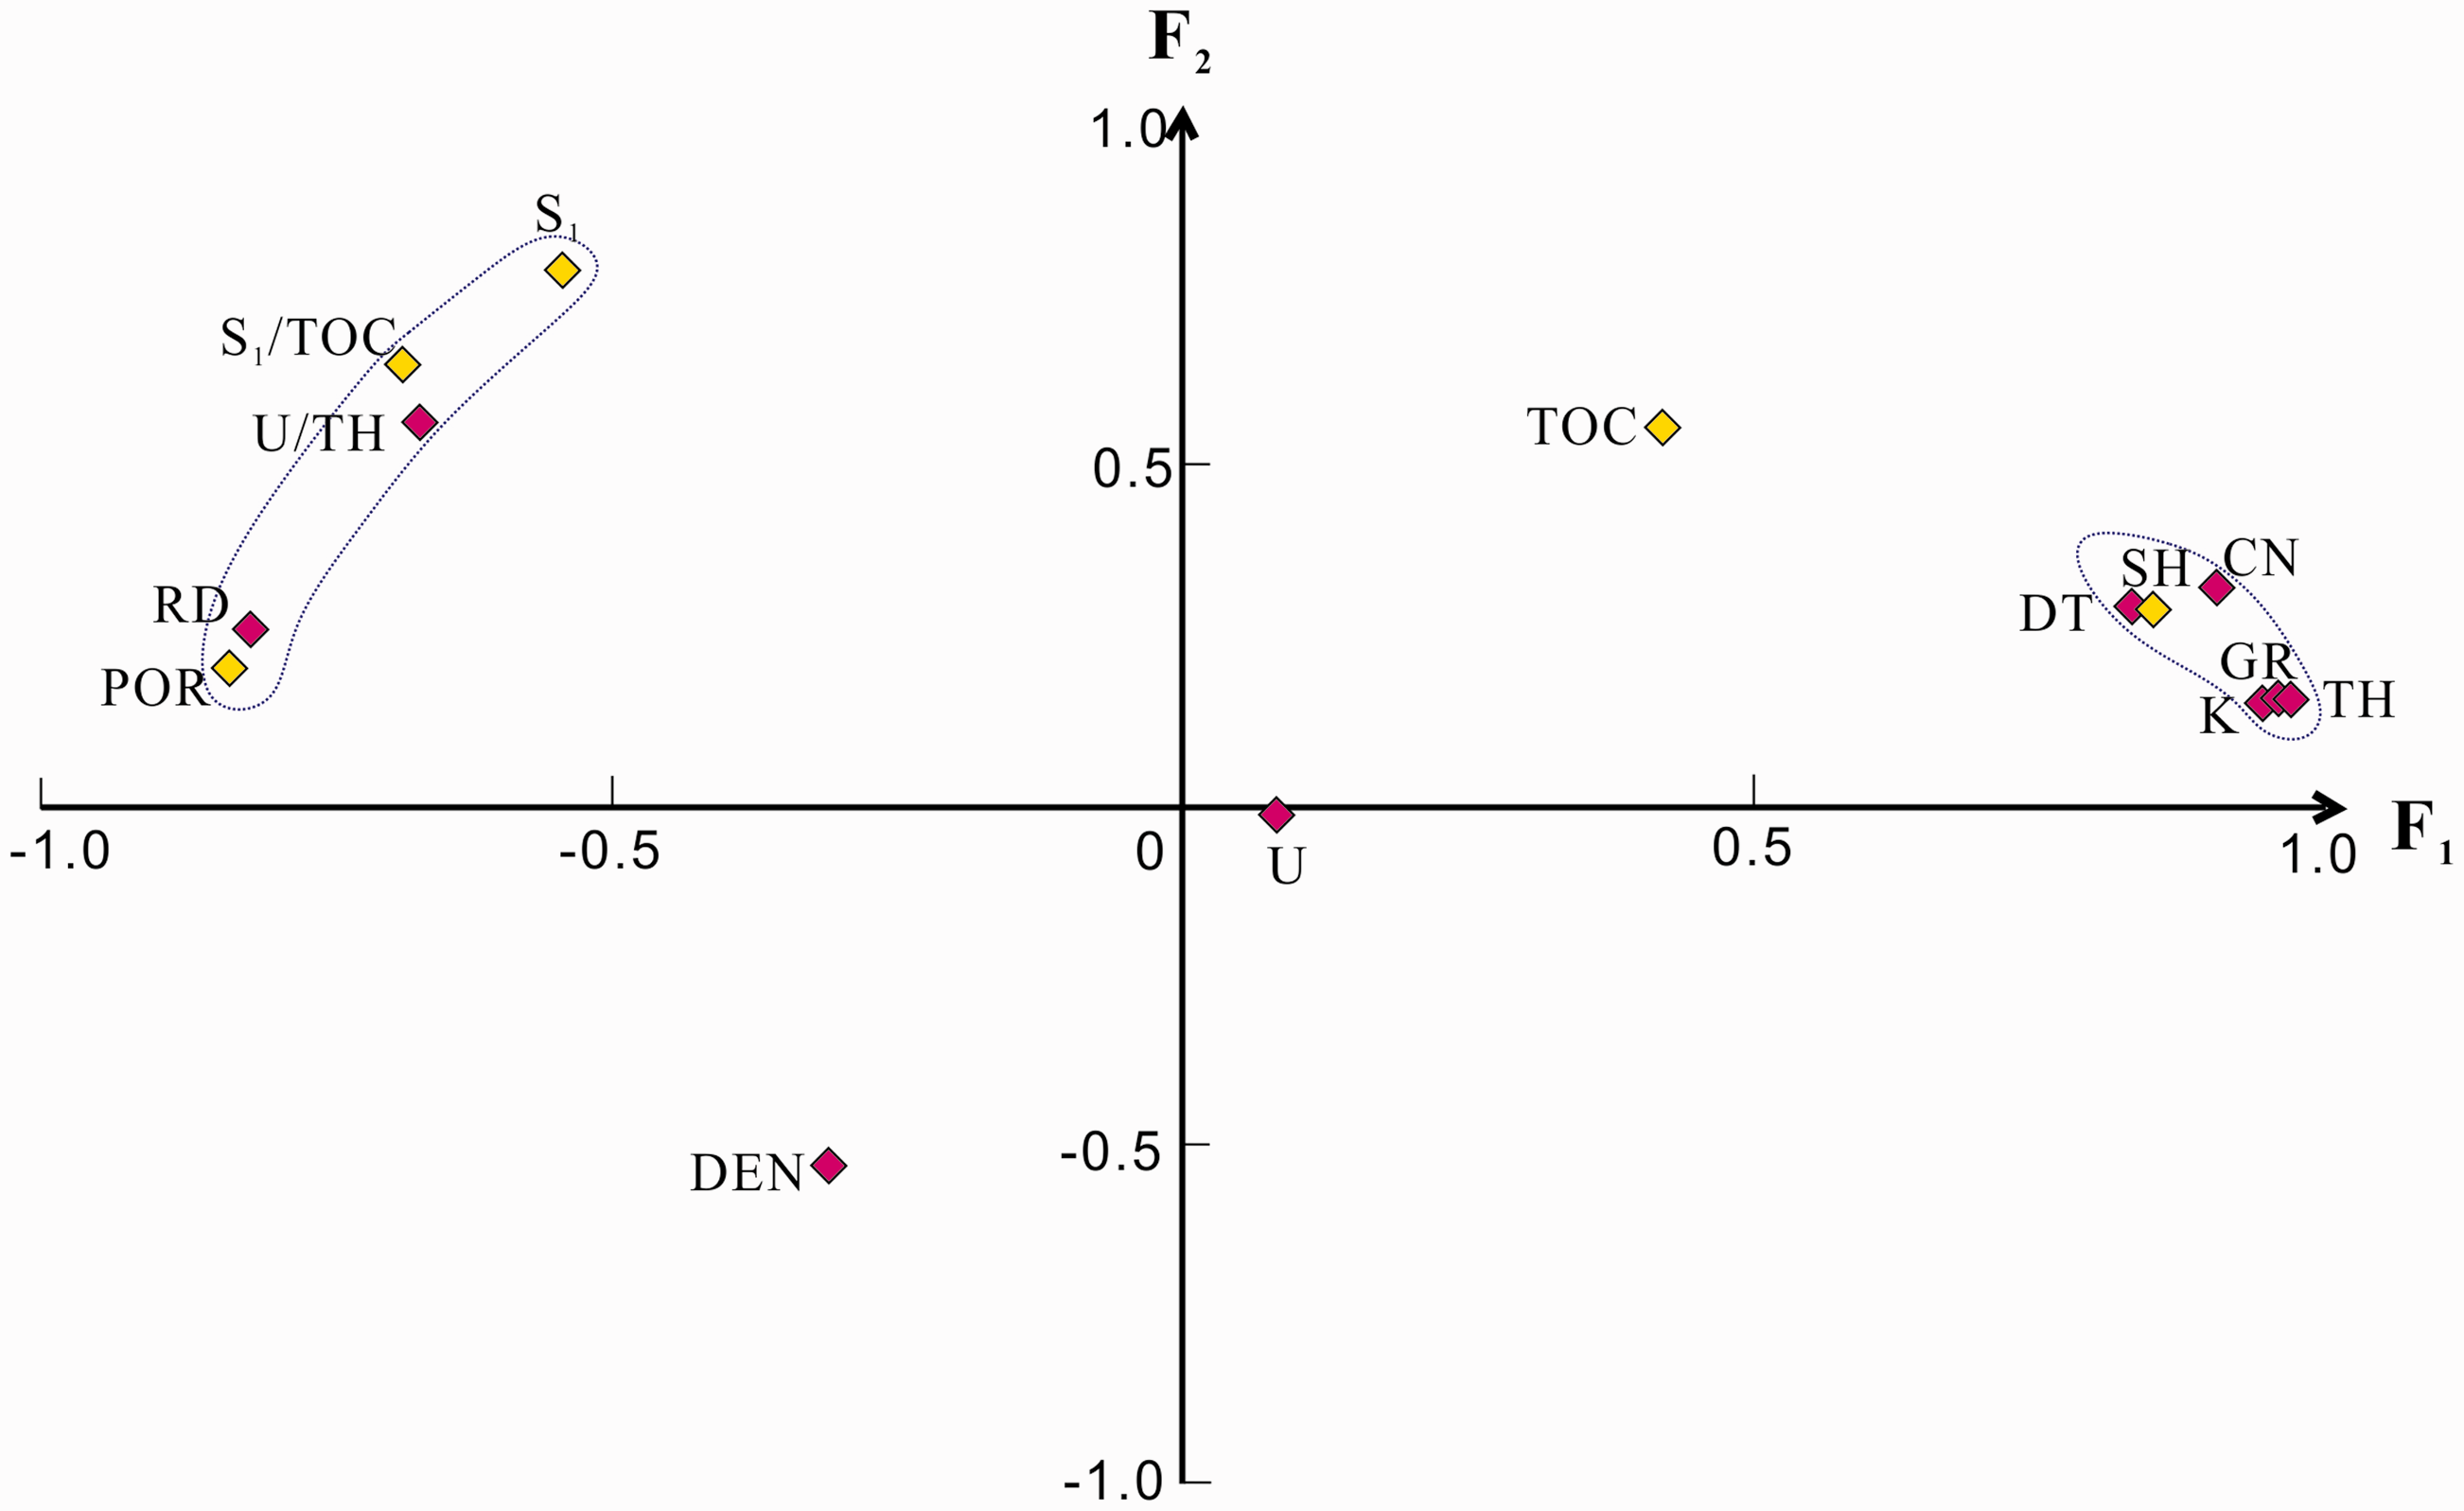
Cross plots showing multifactor analysis of well-logging curves. CN: neutron; DEN: density; DT: acoustic; GR: gamma ray; K: potassium; POR: porosity determined from well logging data; RD: double lateral resistivity; TH: thorium; TOC: total organic carbon; U: uranium.
The resistivity of rocks is closely related to their lithology, reservoir properties, and oil-bearing properties. Rocks with different lithology, minerals, and fluids have different resistivities. Generally, in sedimentary rocks, the resistivity of limestone is larger than that of sandstone, followed by mudstone; the resistivity of oil and gas is larger than that of water. Thus, the higher porosity in rocks that are saturated with water relates to lower formation water resistivity, which leads to lower resistivity. However, the resistivity of the rock increases with an increase in oil saturation if the formation water resistivity and porosity are fixed. When the source rock reaches a mature stage, liquid hydrocarbons are formed in the pore fluids and, as these can be easily conducted, this is observed to be highly abnormal on the resistivity curve (Yan et al., 2009). The present-day low-TOC source rocks that expelled hydrocarbons in the Tarim Basin are mature, and their resistivity values are higher than that of the rocks that do not experience any expulsion. For example, in the Tumuxiuke formation that did not experience hydrocarbon expulsion, the argilliferous rocks have relatively low resistivity, whereas limestone shows relatively high resistivity as the clay content decreases (Table 1). In the Yijianfang formation, limestone expelled hydrocarbons between a depth of 6452 and 6487 m. Further, due to the existence of residual hydrocarbons, limestone exhibits an even higher resistivity than that of the limestone that did not experience expulsion (Table 1).
Data used in the study of YW2 well to obtain measured S1/TOC and calculated S1/TOC, including TOC, Rock-Eval pyrolysis, and well logging. The TOC and Rock-Eval data are from the experiments, and the well-logging data are collected from the Tarim Oilfield Company, PetroChina.
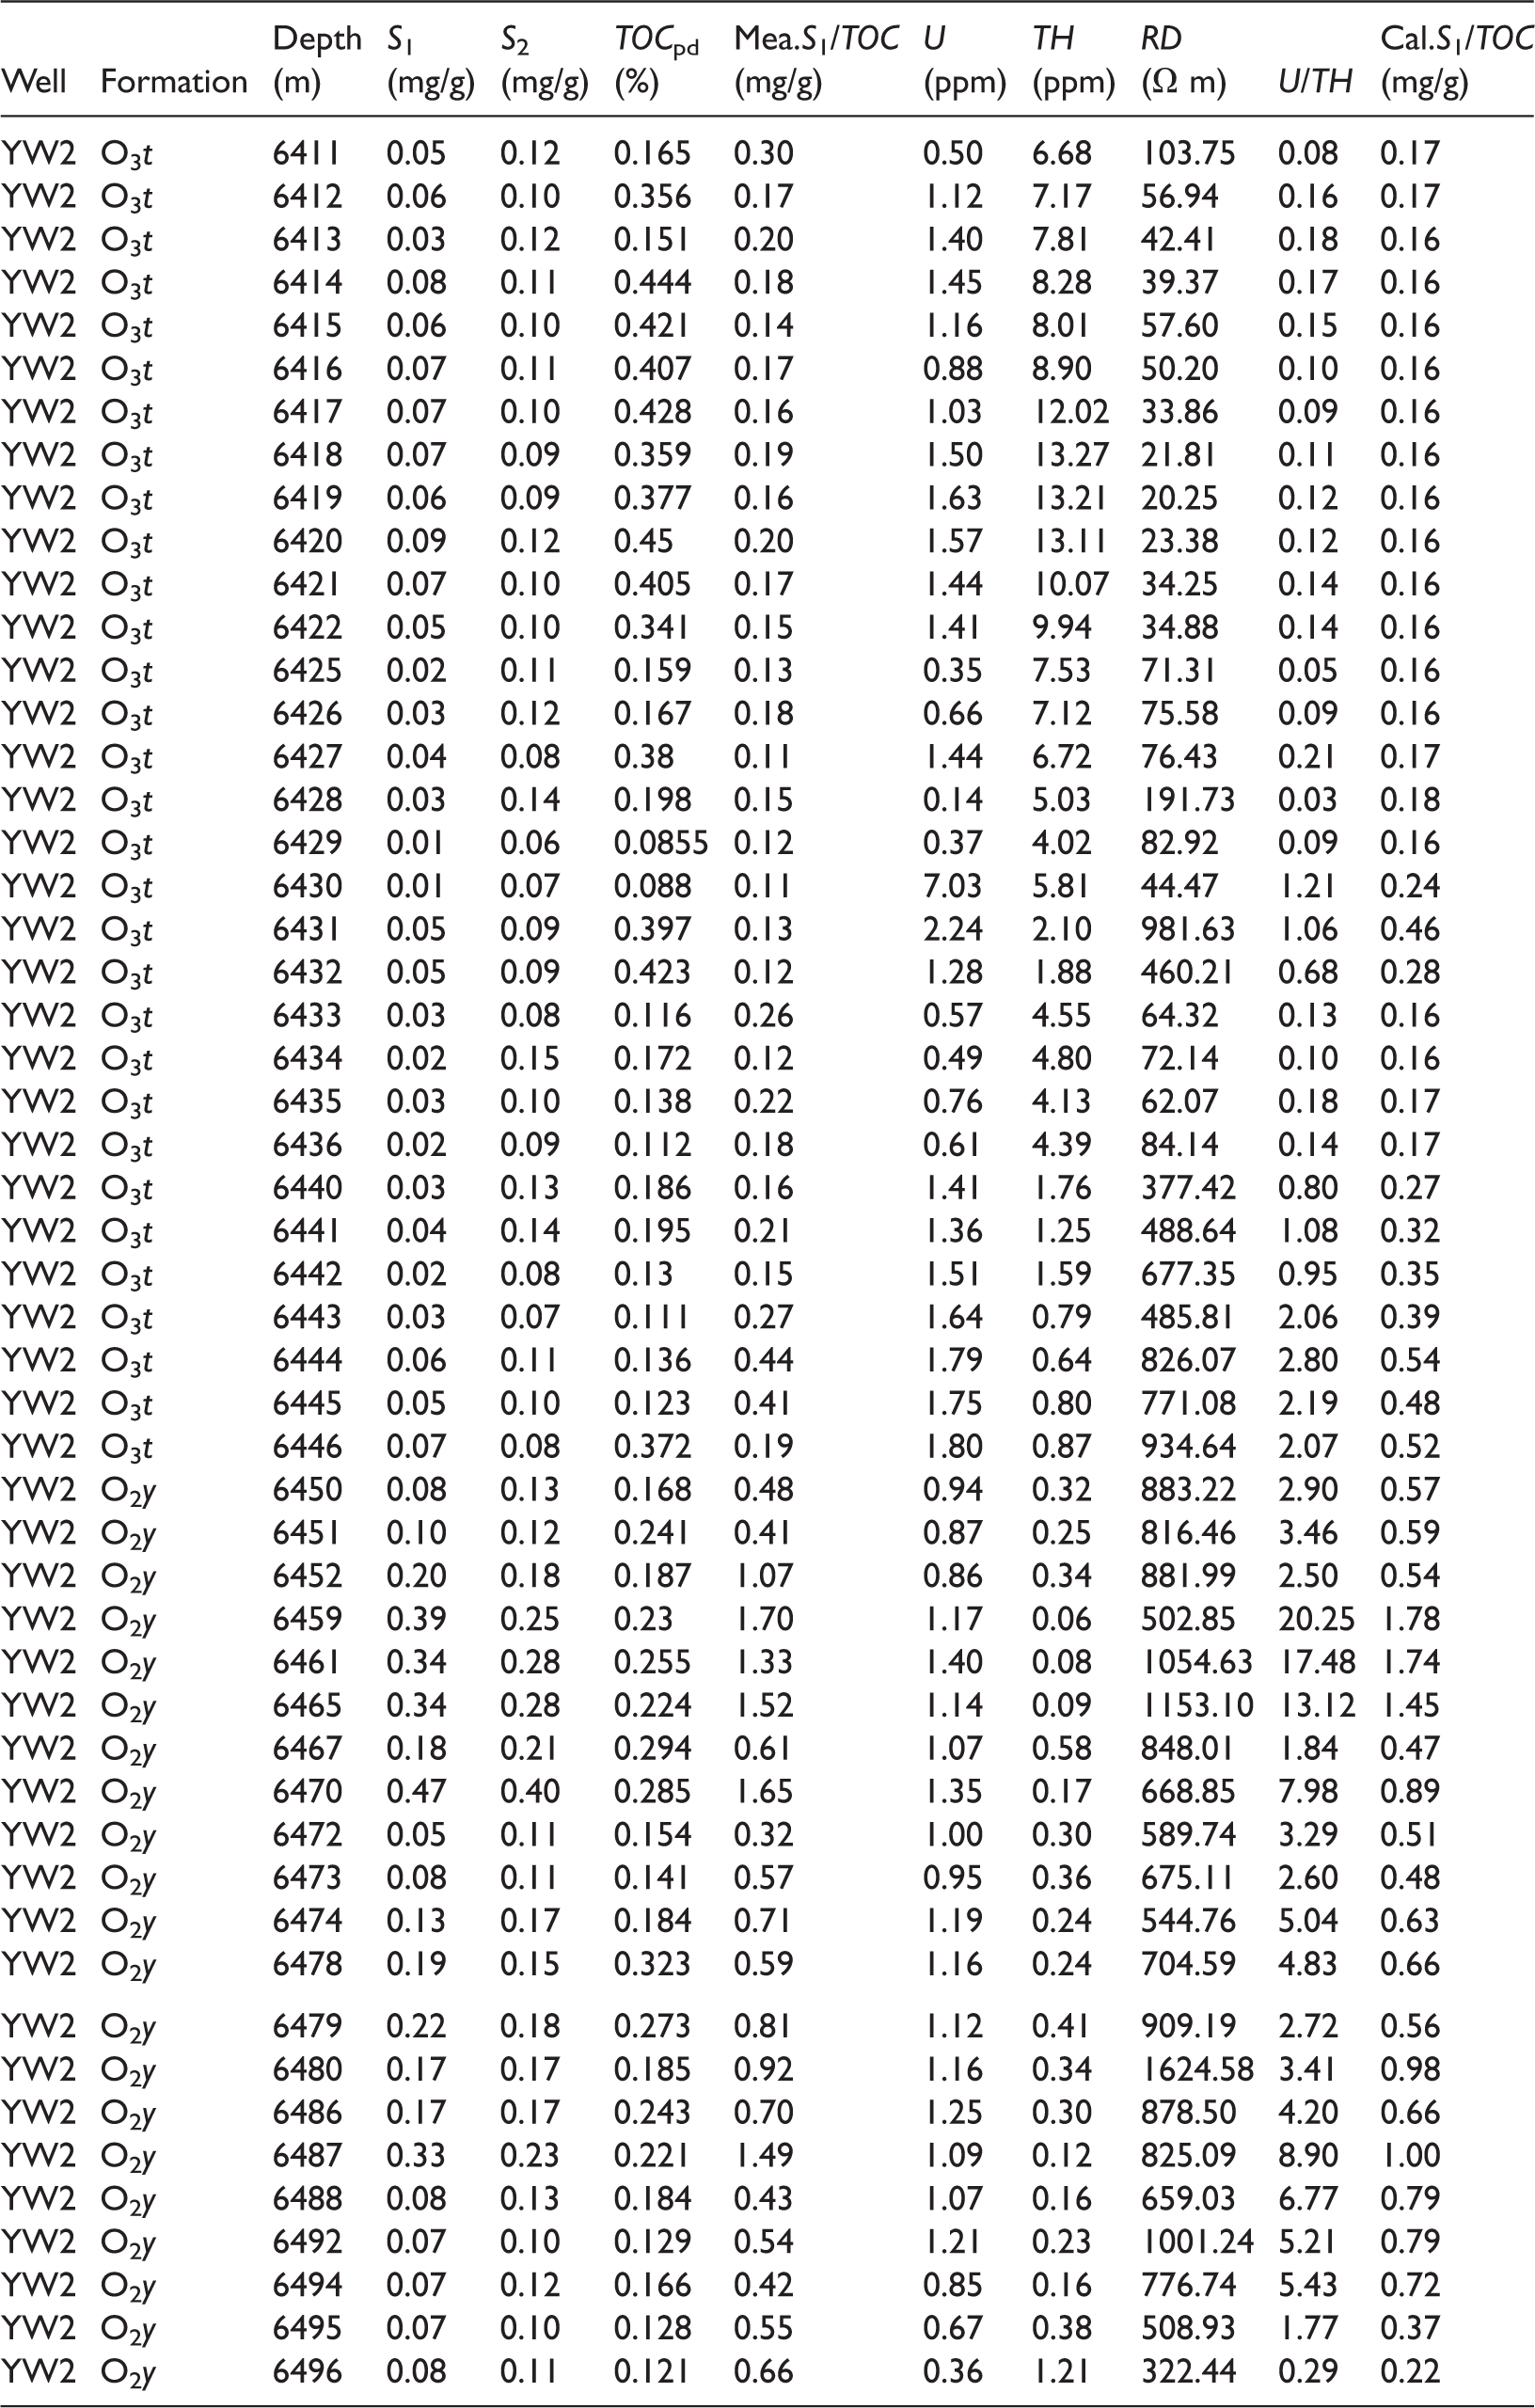
RD: double lateral resistivity; TH: thorium; TOC: total organic carbon; U: uranium; YW2: Yangwu 2.
Natural GR spectrometry logging (U, TH, and K) can be used to identify the sedimentary environments (Chen et al., 2004). In marine sedimentary basins, U/TH < 0.75 denotes rocks as being deposited in an oxidizing environment; while U/TH > 0.75 indicates deposition in a reducing environment (Teng et al., 2004). In addition, natural GR spectrometry logging can be used to calculate the mud content and to help identify the source rocks. Generally, the TH- and K-content in ordinary mudstone is high, while the U-content is low. If mudstone is rich enough in organic matter in order to be a source rock, the reducing environment and enrichment of organic matter will play important roles in the enrichment of U, which causes an increase in the content of U. In sandstone and carbonate, the U-, TH-, and K-content increases as the mud content increases. The present-day low-TOC source rocks that expelled hydrocarbons are controlled by lithology and depict relatively low U-, TH-, and K-contents. For example, the lithology contains mudstone, argilliferous limestone, and calcareous mudstone in the Tumuxiuke formation without hydrocarbon expulsion (Figure 3). Due to their high clay content, these rocks depict relatively high contents of TH and K, and as they were deposited in an oxidizing environment and contain little organic matter, the content of U is relatively low, resulting in relatively low ratios of U/TH (Table 1). In the Yijianfang formation, limestone between a depth of 6452 and 6487 m, having expelled hydrocarbons and being controlled by lithology, exhibits relatively low U, TH, and K; however, it has relatively high U/TH due to the reducing environment (Table 1).
Therefore, it is easy to understand the distribution of source rocks that have retained and expelled oil, leading RD toward large values (Yan et al., 2009) (Figure 9(a)); these were limestone source rocks primarily developed under a reducing environment with a large U/TH (Teng et al., 2004) (Figure 9(b)). Additionally, S1/TOC is more sensitive to the changes in S1 than to the changes in TOC since the TOC distribution range in the samples is narrow.
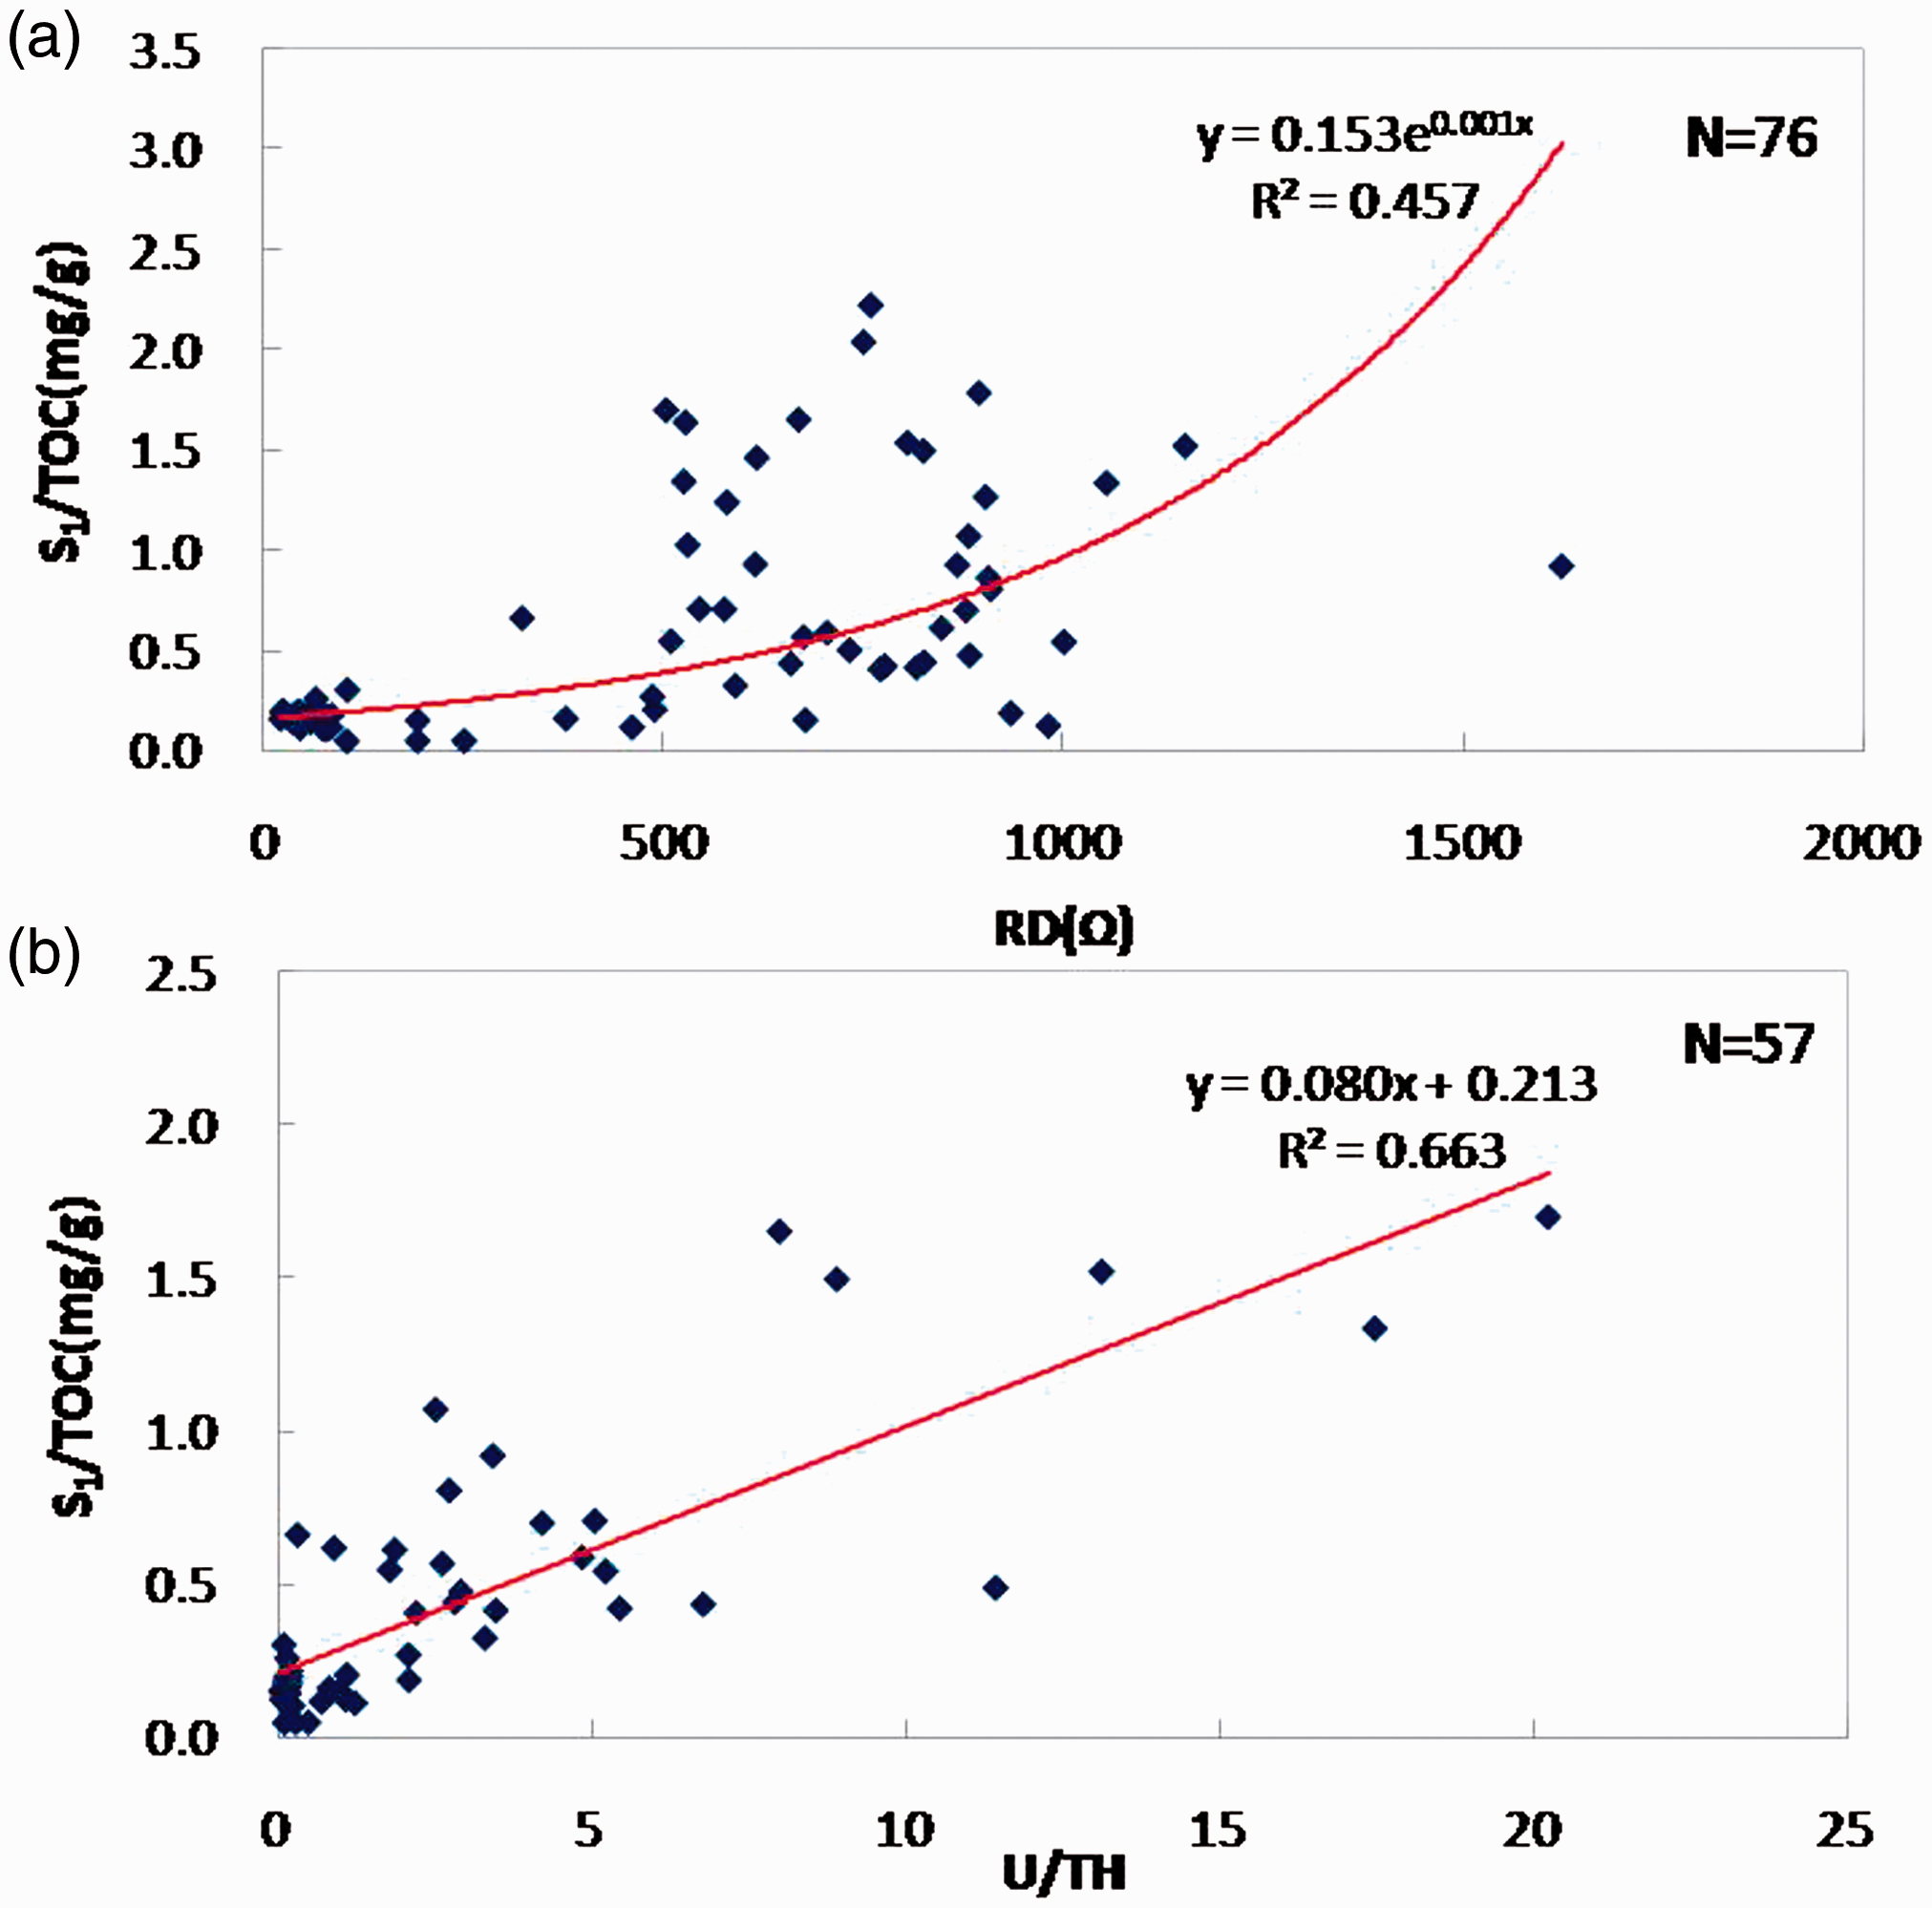
Cross plots showing relationship of the measured S1/TOC values versus (a) RD and (b) U/TH of the Middle–Upper Ordovician YW2 well, Tarim Basin. TH: thorium; TOC: total organic carbon; U: uranium.
Based on factor analysis, two variants of data from the three well-logging curves, i.e. RD, U, and TH (in the form of U/TH), were selected to build quantitative model to predict the continuous S1/TOC. The S1/TOC is exponential positive correlated with RD and linearly positive correlated with U/TH (Figure 9). The concept model can be expressed as

By applying multivariate nonlinear regression using SPSS software, we determined the coefficients of the samples from the Middle–Upper Ordovician of the YW2 well. QA/QC eliminated 22 abnormal points of well-logging data with negative numbers. We set initial input (a, b, c, and d) values to be 0.153, 0.001, 0.080, and 0.213 (Figure 9), respectively, and applied the multivariate nonlinear model that is depicted in equation (5). The optimization program package in the SPSS software performed stepwise regression using our dataset. Thus, the coefficients were determined to be a = 0.142, b = 0.001, c = 0.076, d = 0.003, and R2 = 0.754 based on the 57 remaining data samples. The quantitative prediction model can be displayed as follows

To verify the reliability of the quantitative model, we compared the calculated values of S1/TOC with those that were obtained from our experiments using pyrolysis Rock-Eval and TOC in the YW2 well and those that were conducted in another well, LG38 (Tables 1 and 2). The LG38 well, which is also located in the Tabei Uplift (Figure 1), shows similar VRE and have hydrocarbon shows in the Yijianfang limestone (Figure 12). The correlation coefficients (R2) between the calculated S1/TOC and the measured S1/TOC in the YW2 and LG38 wells were 0.747 and 0.753, respectively, depicting a good correlation (Figure 10(a) and (b)). Thus, it is feasible to use a fitting equation to calculate the S1/TOC values in the Middle–Upper Ordovician formation in the Tarim Basin.
Data used in the study of LG38 well to obtain measured S1/TOC and calculated S1/TOC, including TOCpd, S1, and well logging. All the data are collected from the Tarim Oilfield Company, PetroChina.
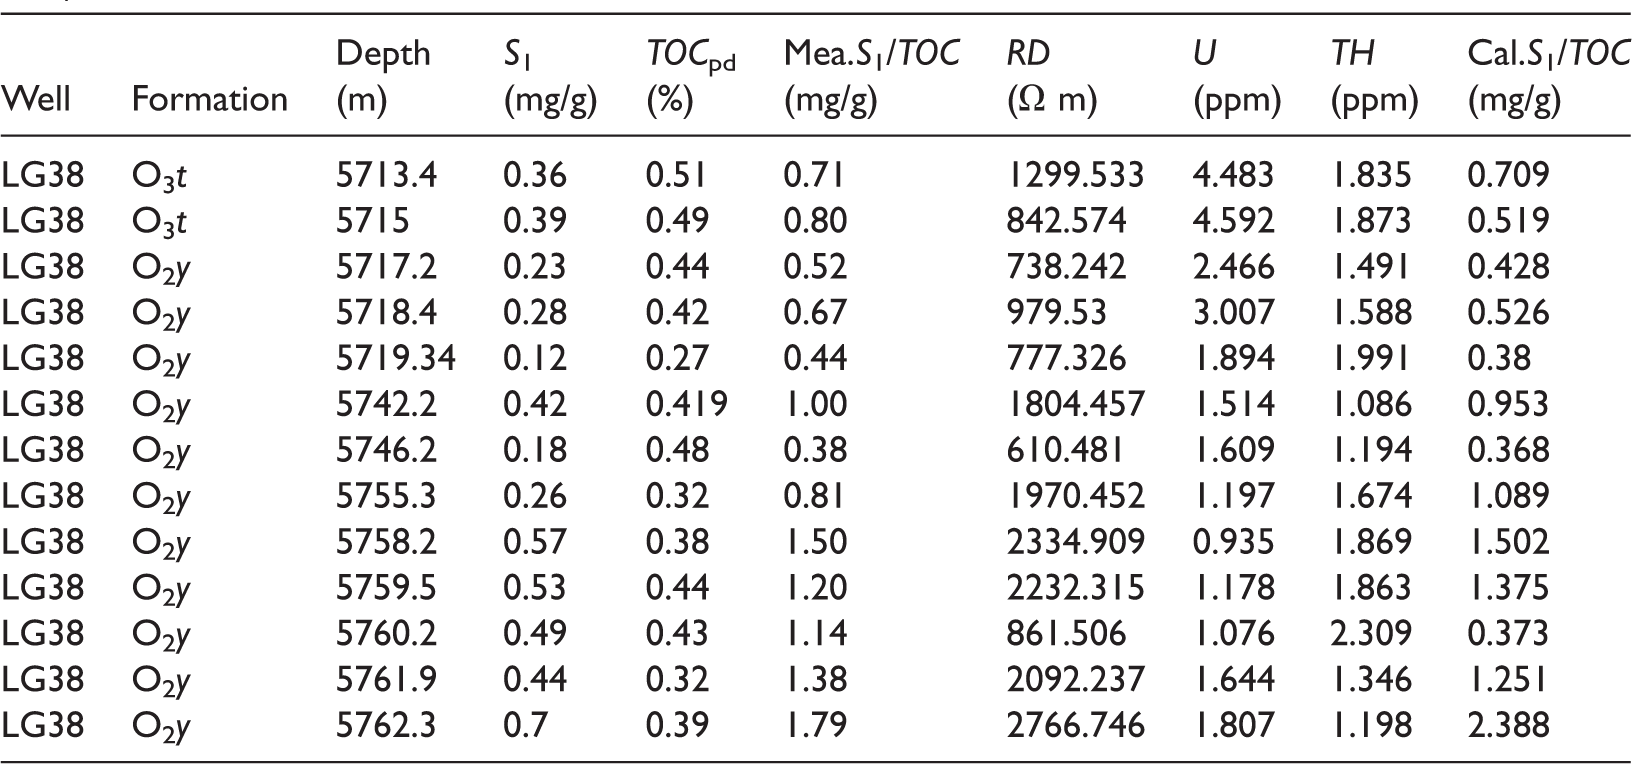
RD: double lateral resistivity; TH: thorium; TOC: total organic carbon; U: uranium.
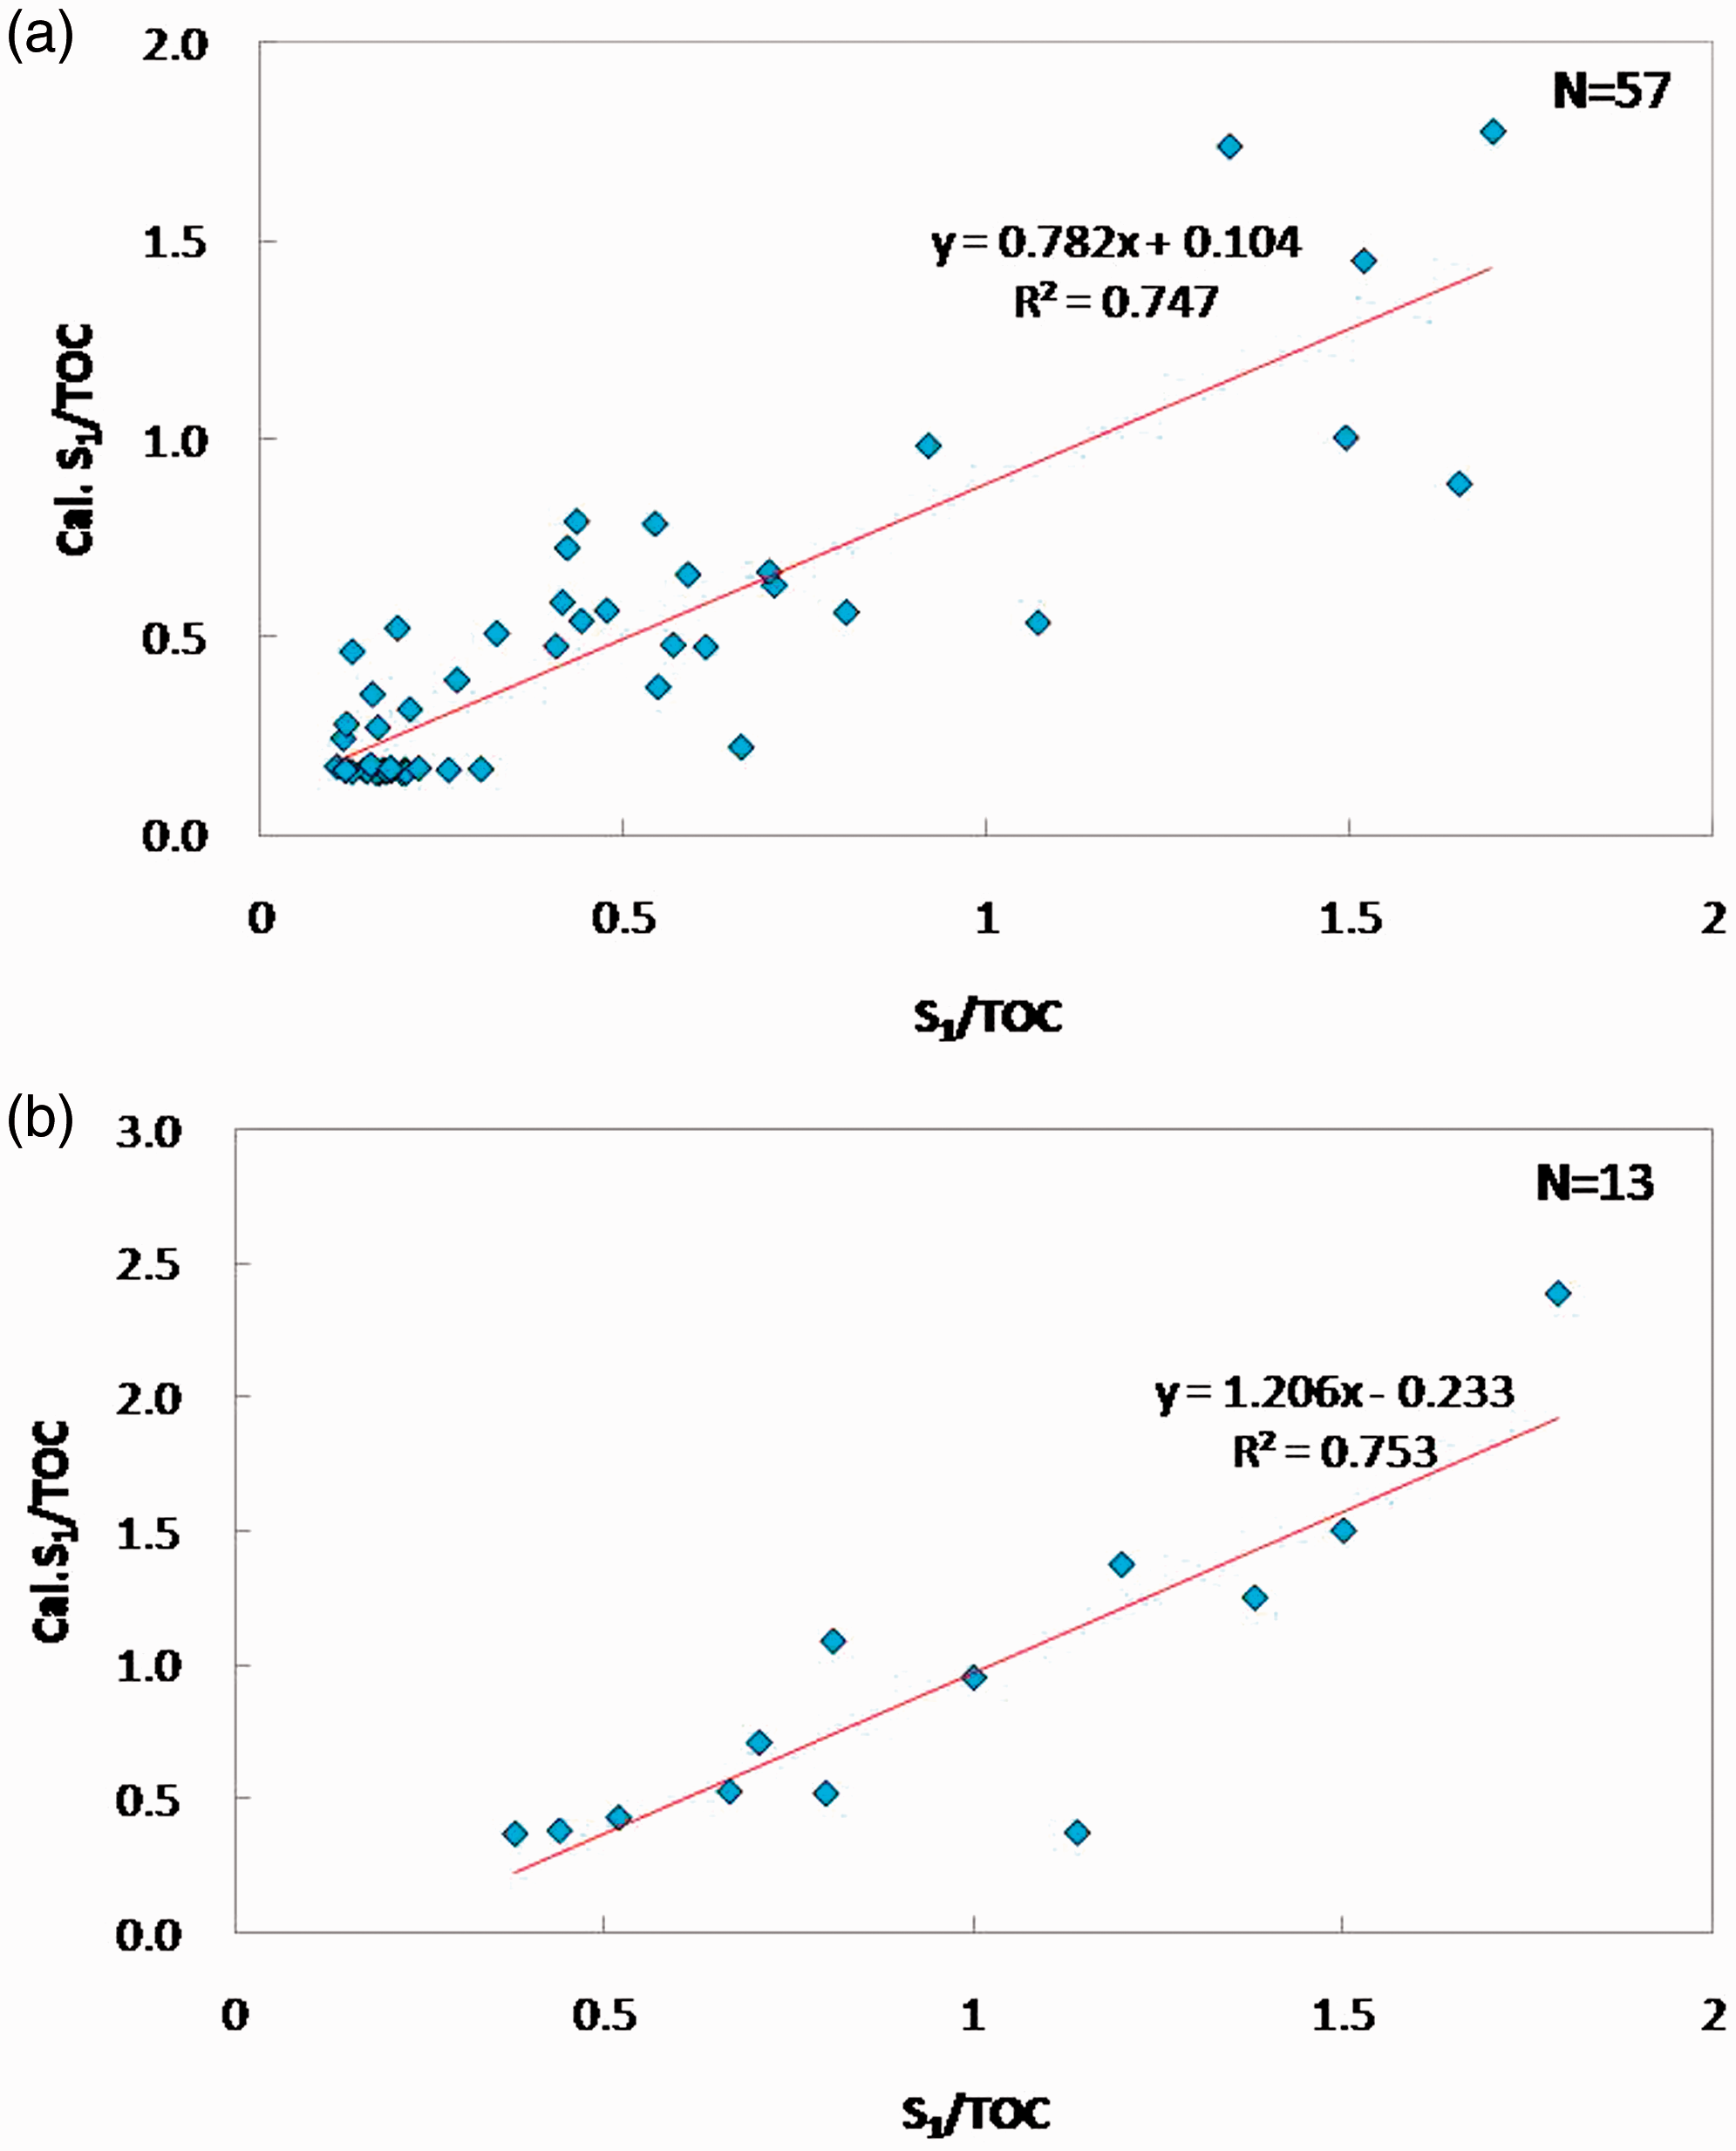
Cross plot showing relationship of the measured S1/TOC values versus calculated S1/TOC of the Middle–Upper Ordovician (a) YW2 well and (b) LG38 well, Tarim Basin. TOC: total organic carbon.
We distinguished between the present-day low-TOC carbonate source rocks with hydrocarbon expulsion using the mass balance approach, whereby source rocks have to generate enough hydrocarbons in order to satisfy the retention amount. Further, the source rocks must allow migration against capillary sealing to expel the movable hydrocarbons. Pepper (1992) and Sandvik et al. (1992) observed that the organic matter retains a portion of the generated petroleum at a level of about 10 g of liquid sorbed per 100 g of organic matter, i.e. 100 mg HC per g of TOC. Thus, the resistance to oil expulsion can be overcome by exceeding the sorption threshold and can be approximately defined as OSI ≥ 100 mg HC per g of TOC. Additionally, all our samples had an OSI greater than 100 mg HC per g of TOC (Figure 7) according to our identification of source rocks based on the mass balance approach (Qr ≥ Qrm). Based on this, we tried to quickly identify the source rocks that have expelled hydrocarbons by predicting the S1/TOC values using the well-logging data.
We predicted the present-day low-TOC carbonate source rocks according to S1/TOC ≥ 1 (OSI ≥ 100), depicting a thickness of 25.3 m in the YW2 well (Figure 11) and 17.6 m in the LG38 well (Figure 12). This compares with the source rock thickness of 34.5 m in the YW2 well, which was identified using the mass balance approach. Another reason for the smaller thickness during the prediction could be that the samples were selected from one cutting in each meter. Therefore, the identification represents a 1 m scale result; however, the continuous well-logging data are denser and can more accurately describe the heterogeneity of carbonate rocks (Figure 11).
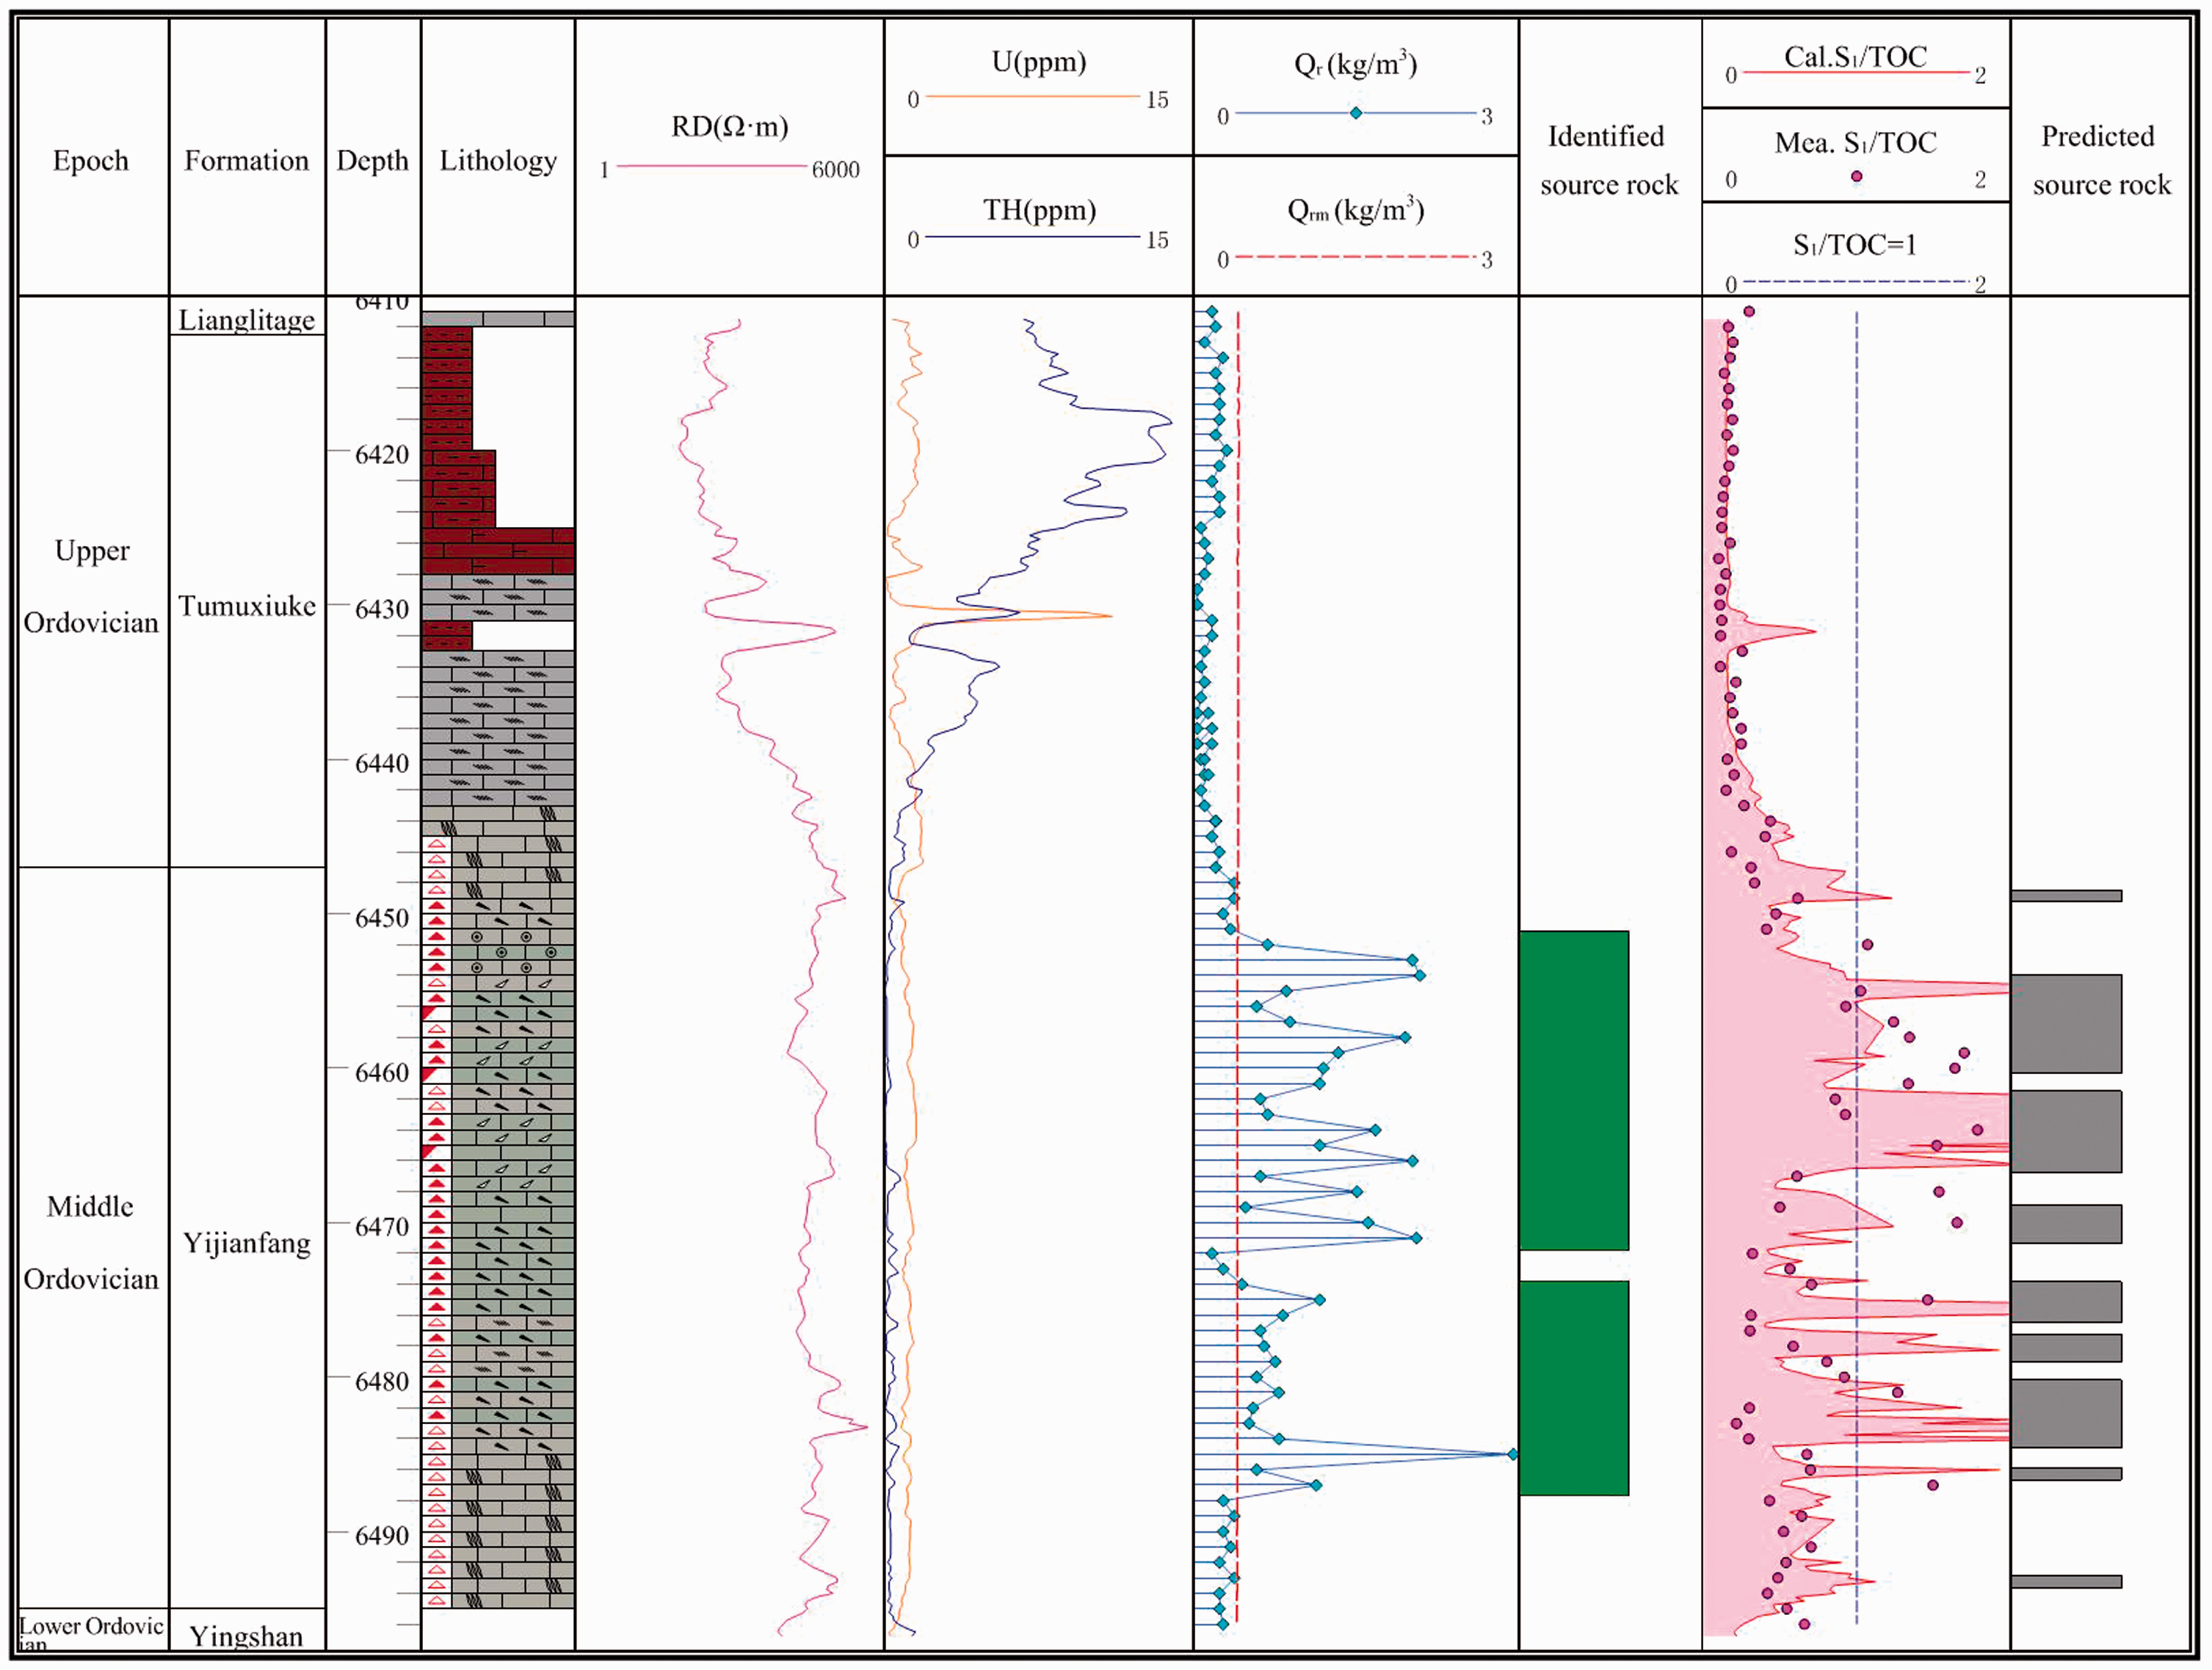
Prediction of present-day low-TOC carbonate source rock according to the quantitative model of the Middle–Upper Ordovician in the YW2 well, Tarim Basin. RD: double lateral resistivity; TH: thorium; TOC: total organic carbon; U: uranium.
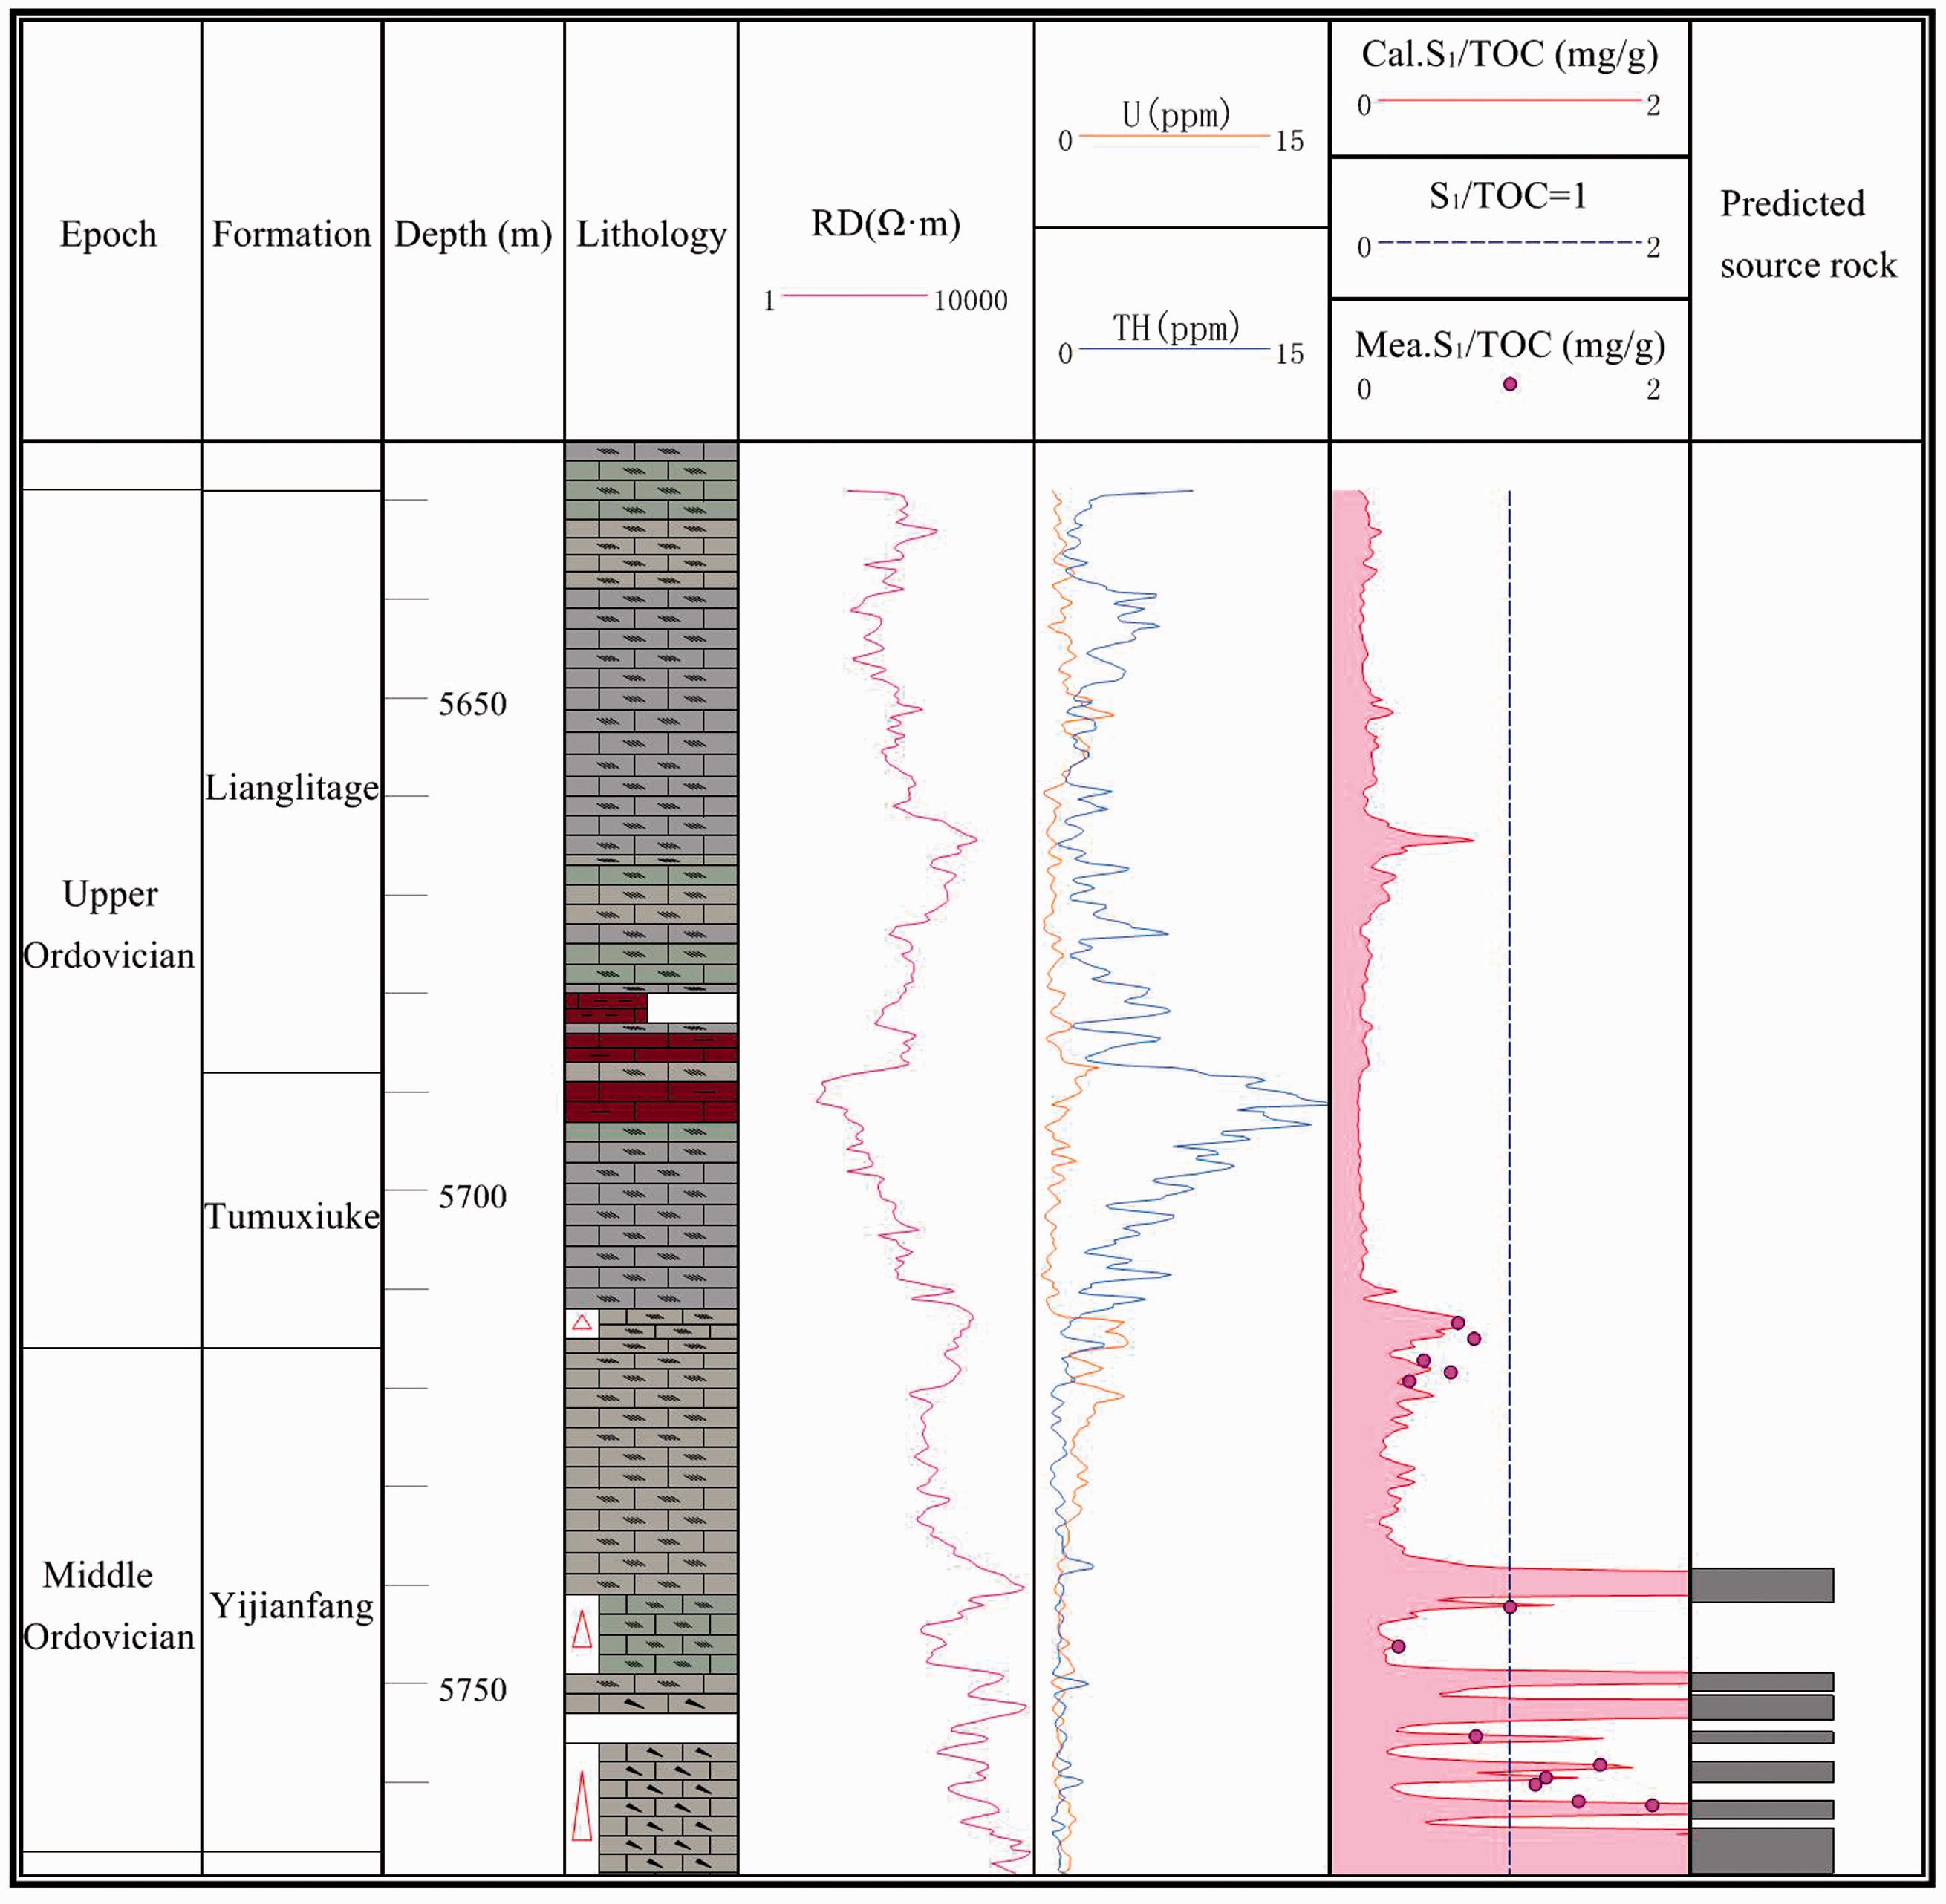
Prediction of present-day low-TOC carbonate source rock according to the quantitative model of the Middle–Upper Ordovician in the LG38 well, Tarim Basin. RD: double lateral resistivity; TH: thorium; TOC: total organic carbon; U: uranium.
The drilled present-day low-TOC Ordovician source rocks, having expelled the hydrocarbons, are mainly located in the slopes and depict a similar Ro (from 1.2 to 1.5%). When the model is applied to the regions with variable source rock maturity, the maturity itself may have an impact on the prediction model, and calibration is necessary according to the actual data.
Evaluation
By applying the prediction model to the 50 wells that have penetrated the Middle–Upper Ordovician formation in the Tarim Basin, China, we obtained the thickness distribution of present-day low-TOC carbonates with hydrocarbon expulsion that contributed to oil accumulation (Figure 13). Results depict that the ratio of minimum present-day low-TOC carbonate source rock thickness to the whole strata thickness reaches a maximum value of 48% and an average of 30.1%. Present-day low-TOC carbonate source rock is extensively distributed throughout the platform of the Tarim Basin, with the maximum thickness being 275 m (Figure 13). Additionally, large thicknesses of the present-day low-TOC carbonate source rocks are distributed in the south slope of the Tabei Uplift, the north slope of the Tazhong Uplift, and to the east of the Tazhong Uplift (Figure 13).
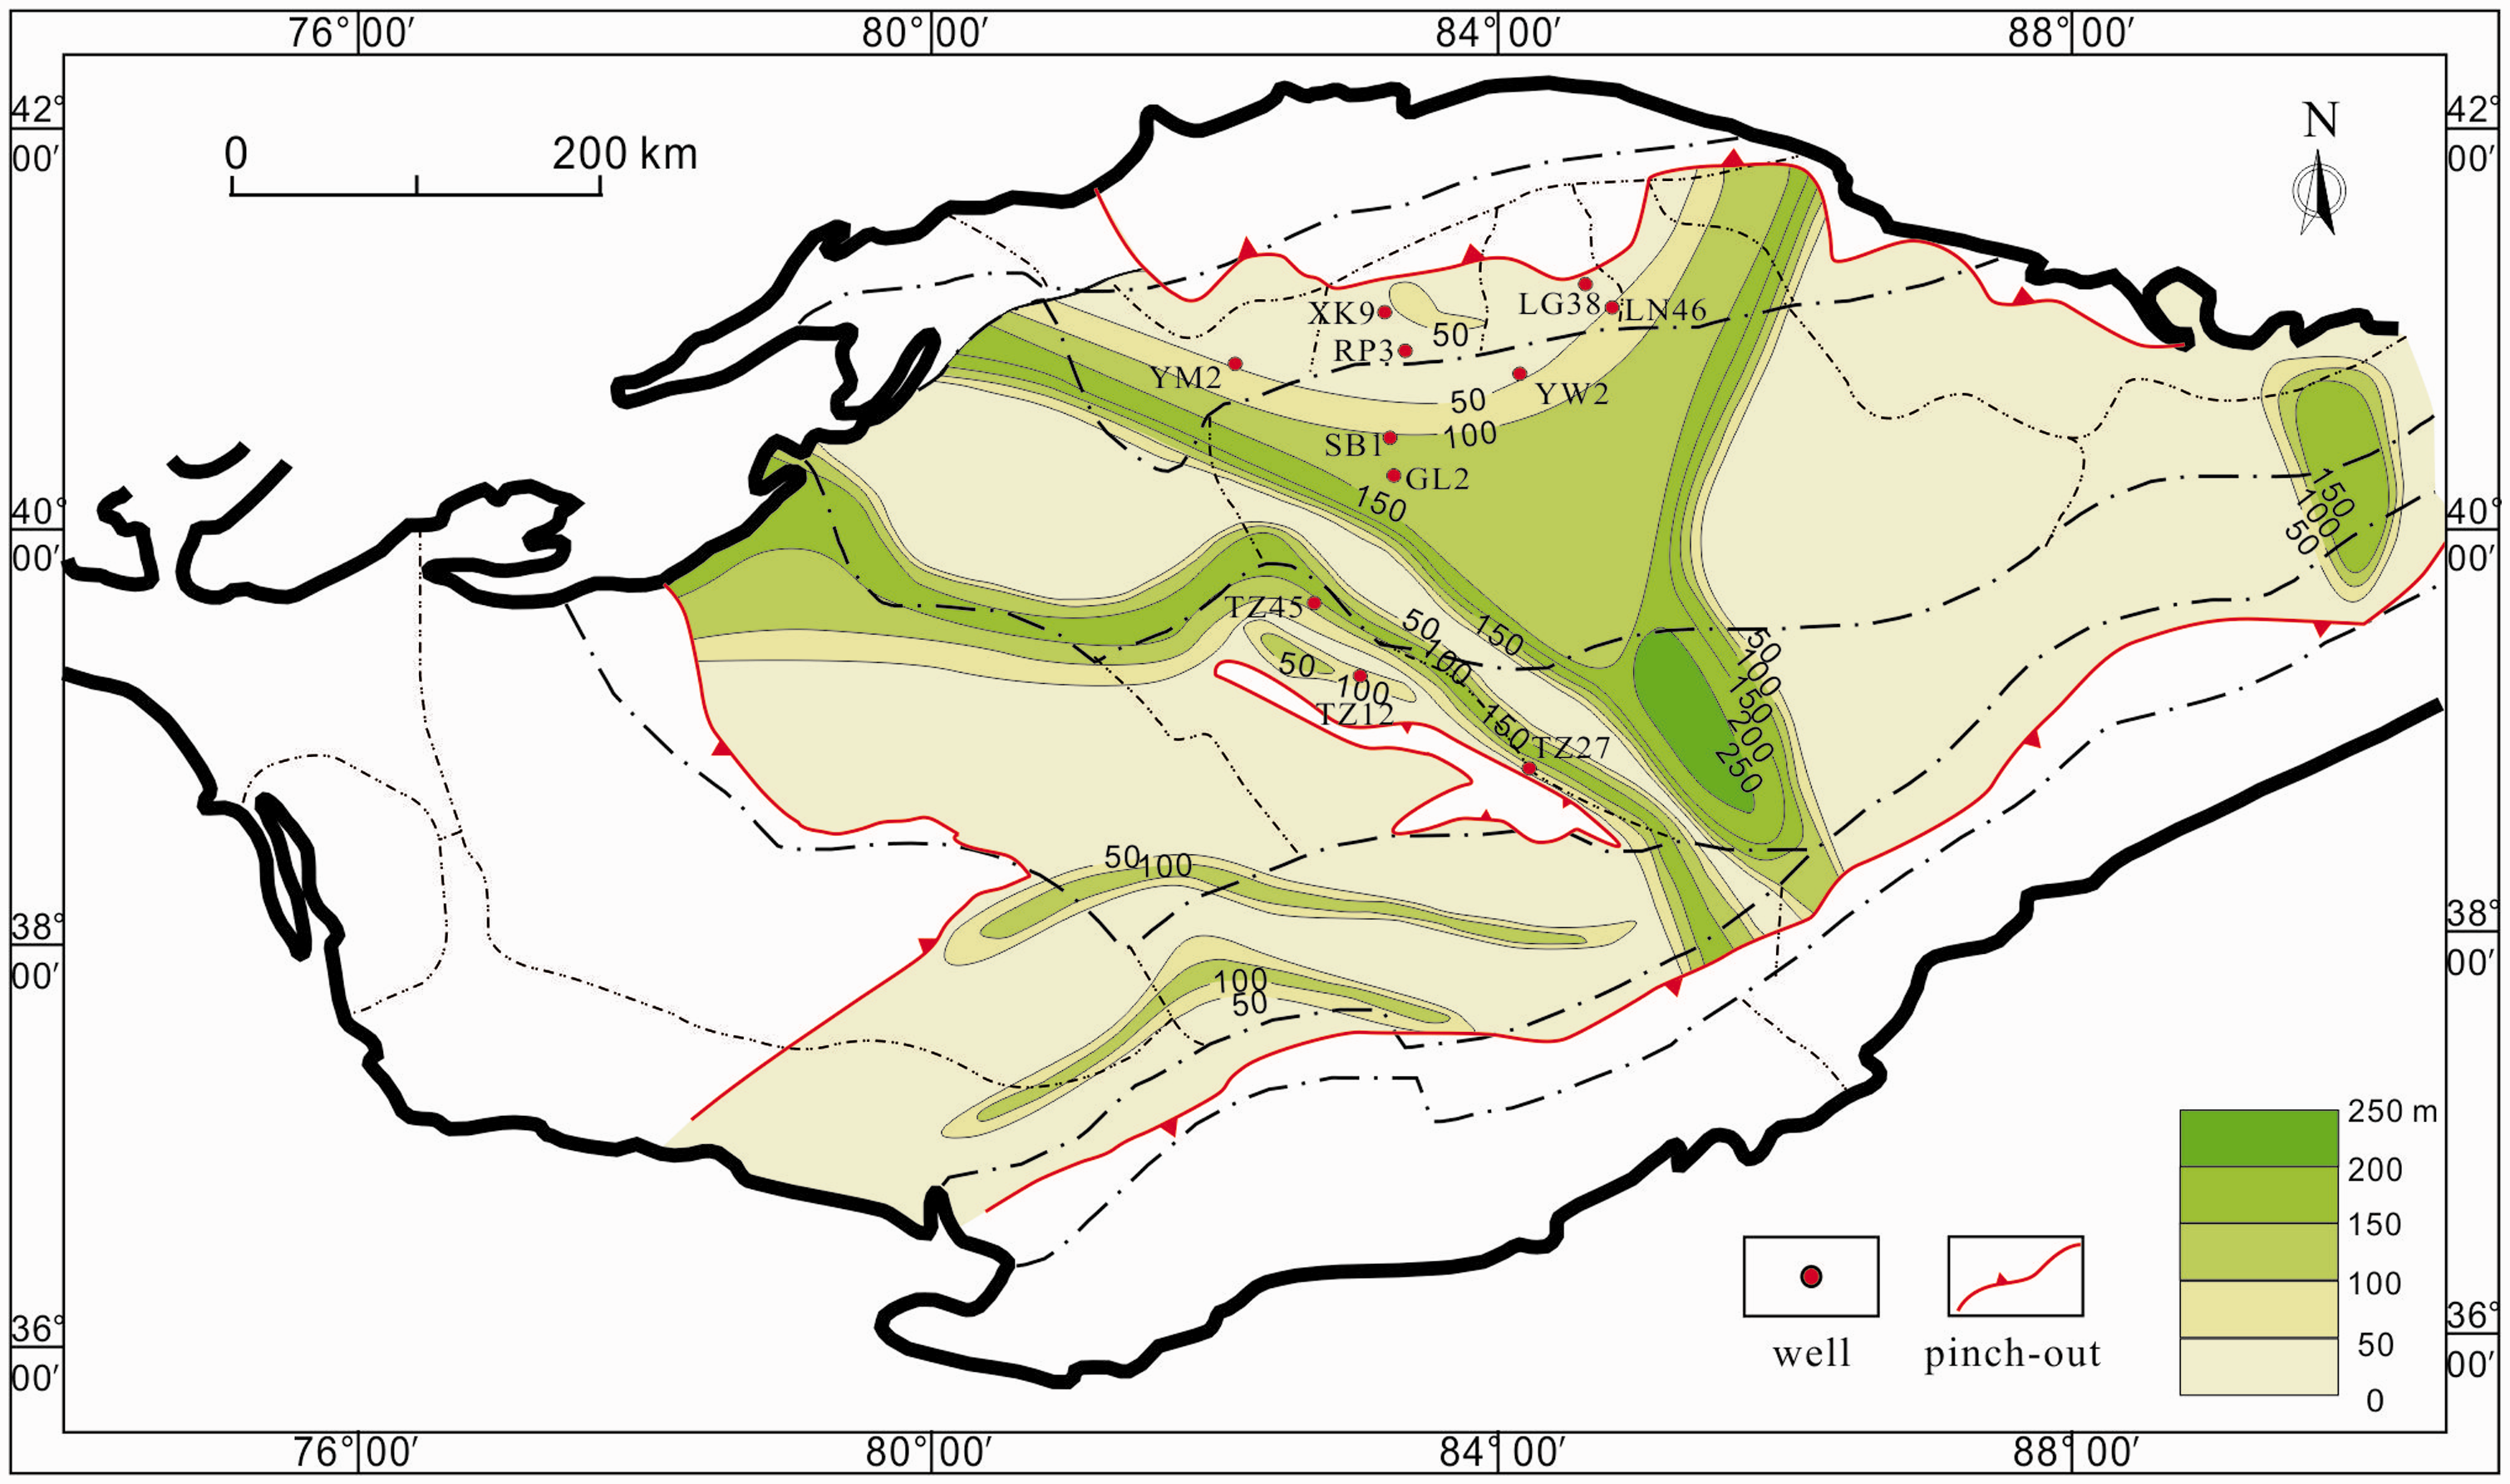
Thickness distribution of present-day low-TOC carbonate source rock of the Middle–Upper Ordovician in the platform, Tarim Basin. YW2: Yangwu 2.
Using the third round of national resource assessments that were based on the contribution of high abundance Cambrian source rocks, the predicted in-place oil equivalent resource in the Tarim Basin is observed to be 27.89×10⁹ bbl, whereas the current 3P oil reserves are greater than 29.70×10⁹ bbl (Yang, 2012, personal communication). Employing an extensively used method for evaluating the hydrocarbon generation and amount of expulsion (Pang et al., 2005), we primarily estimated the quantity of hydrocarbon expulsion from the Upper–Middle Ordovician present-day low-TOC carbonate source rocks in the Tarim Basin to be 363.38×10⁹ bbl oil equivalent. If 10% of all the expelled hydrocarbons were trapped and combined with the resources from the high-TOC carbonate source rocks estimated in the third round of national resource assessment, the total resource potential can explain the occurrence of higher 3P oil reserves by considering the high-TOC Cambrian source rocks (TOC > 0.5%) alone. This provides an insight in to the long-term controversy among geologists and geochemists regarding the major source rocks that contribute to the hydrocarbon resources in the carbonate platform of the Tarim Basin. This further means that the contribution to hydrocarbon accumulation from the present-day low-TOC source rocks in the Upper–Middle Ordovician succession is significant.
Conclusion
Present-day low-TOC carbonate source rocks were identified using the mass balance approach. Hydrocarbon expulsion took place in the Yijianfang formation between depths of 6452 and 6487 m in the YW2 well, where the actual free hydrocarbons that were retained in the source rock surpassed the threshold value. The identification was validated using porosity characteristics, perforation tests, and oil–source correlation. A quantitative model was developed to predict the present-day low-TOC carbonate source rocks. The model is quick and cost effective and is based on the index “S1/TOC” using RD and U/TH well-logging data. The thickness of the present-day low-TOC carbonate source rocks predicted by the model is observed to be the minimum value. By applying the prediction model to the Middle–Upper Ordovician formation, the contribution of present-day low-TOC carbonate source rocks to the hydrocarbon accumulation in the Tarim Basin is primarily evaluated to be 363.38×10⁹ bbl oil equivalent.
Footnotes
Acknowledgements
We appreciate the Tarim Oilfield Company, PetroChina, especially the Research Institute of Exploration and Development, for providing background geologic data and permission to publish the results. We also thank the reviewers for their constructive comments and suggestions that improved the manuscript.
Declaration of conflicting interests
The author(s) declared no potential conflicts of interest with respect to the research, authorship, and/or publication of this article.
Funding
The author(s) disclosed receipt of the following financial support for the research, authorship, and/or publication of this article: This work was supported by “The China Postdoctoral Science Foundation” (2017M611108), “The National Natural Science Foundation of China” (41402107), “The National Basic Research Program of China” (2011CB2011–02). The authors thank for these financial supports.